a tale of two perspectives: old or new challenges for ... · bis papers no 19 1 a tale of two...
TRANSCRIPT

BIS Papers No 19 1
A tale of two perspectives: old or new challenges for monetary policy?
Claudio Borio, William English and Andrew Filardo
Introduction1
Over the past decade much of the world has entered a phase of low and comparatively stable inflation. No doubt several factors have contributed to this development. Even so, it is generally agreed that central banks’ strong anti-inflation commitment and increased credibility have played a critical role. The turning point is typically identified with the late 1970s or early 1980s. It was then that, underpinned by the necessary political and intellectual consensus, monetary authorities intensified their efforts to bring inflation under control.
This drawn-out battle has yielded great benefits. Low and stable inflation has laid the basis for better long-run economic performance. High and variable inflation had been a key factor inducing misallocation of resources. With economies less inflation-prone, central banks have not had to abort economic expansions prematurely in order to fight rapidly emerging inflationary pressures. And with economies seemingly less vulnerable to second-round price effects following unfavourable supply side shocks, central banks have been under less pressure to tighten aggressively to forestall inflationary developments, thereby avoiding the concomitant costs for economic activity.
At the same time, the 1990s and the initial years of the new century have not been free of challenges for central banks. Paradoxically, one challenge has been learning to deal with potential supply side improvements and the uncertainty surrounding them. Financial and real side deregulation, both within and across national borders, and, more recently, the introduction of new IT technologies are obvious examples. A second, and perhaps not unrelated, challenge has been how to factor into the monetary policy framework more virulent boom and bust cycles in asset prices, typically occurring alongside similar fluctuations in credit. Financial and banking crises have sometimes accompanied such developments. In the wake of one such episode, Japan has experienced deflation and policymakers there have struggled to reflate the economy, with policy rates reaching the zero lower bound. More recently, central banks have had to contend with an unexpected and in some cases sharp slowdown in economic activity - a slowdown that, in addition, appeared to be unusually synchronised across countries. Contrary to the prevailing experience in the postwar period, the slowdown was not triggered by a tightening of policy designed to quell rising inflationary pressures but by the unwinding of an investment boom, associated with a boom-and-bust movement in equity prices.
This paper seeks to draw some possible lessons from this set of experiences with a view to identifying the challenges that central banks might face going forward. In order to highlight the genuine uncertainty that surrounds the lessons to be drawn, the paper examines recent experience through two alternative, intentionally polarised, lenses. While agreeing in several respects, the corresponding perspectives lead to somewhat different conclusions in terms of the balance of risks faced by central banks in the current environment and the appropriate policy responses.
The first view, call it the “continuity” view, sees the current economic environment as a natural extension of that which prevailed during much of the previous inflationary period. Accordingly, the lessons drawn from that period apply with little, if any, modification to present conditions. The dynamics of the economic system have not significantly changed. The risks faced by central banks
1 This is a revised version of the background paper for the Autumn 2002 Central Bank Economists’ Meeting on “Monetary
policy in a changing environment” which took place at the BIS on 14-16 October 2002. We would like to thank Jeff Amato, Palle Andersen, Joe Bisignano, Gabriele Galati, Charles Goodhart, David Laidler, Philip Lowe, Hyun Shin and Bill White for helpful comments, Henri Bernard and Les Skoczylas for their excellent research assistance and Janet Plancherel for impeccable and tireless help in putting the whole document together. Any remaining errors are our sole responsibility. The views expressed are those of the authors and do not necessarily reflect those of the BIS.
2 BIS Papers No 19
and the set of strategic and tactical policy benchmarks developed during the fight against inflation are still reliable yardsticks. This view tends to regard some of the new challenges faced during the more recent period, and the corresponding unexpected economic developments, as essentially the result of unusual “shocks”. Accordingly, there is no particular reason to expect these shocks to recur. In other words, the economic environment has not fundamentally changed.
The alternative view, call it the “new-environment” view, sees the new challenges faced as inherent in the current landscape, characterised by liberalised financial markets, low inflation - underpinned by apparently high credibility of central banks’ anti-inflation commitment - and uncertainty about the degree of structural supply side improvements. The challenges, that is, are in part the footprints of the gradual emergence of a new environment. A key characteristic of this new environment is that during unsustainable booms overt inflationary pressures may take longer to emerge. This can make it harder for monetary policy to be sufficiently pre-emptive. Monetary policy may thus unwittingly accommodate the build-up of financial imbalances and associated distortions in the real economy, notably excessive capital accumulation. Moreover, with inflation initially at a low level, the risk that the process may unwind in a disruptive manner could result in a subtle shift in the balance of risks, away from higher inflation and towards economic weakness and, possibly, even deflation. This view highlights the role of financial imbalances in the dynamics of the economy and suggests that central banks may need to respond in a more purposeful way to the imbalances as they build up.
The plan of the rest of the paper is as follows. Section I lays out some key facts about the unfolding economic environment since the late 1980s. Section II reviews the challenges faced by central banks during this period. Section III lays out the continuity and new-environment views, briefly interpreting economic developments through these two perspectives. Section IV explores in more detail the implications of the two views for the way in which financial imbalances should be factored into policy, as this is perhaps the key feature distinguishing between the two perspectives. Section V draws some broader implications of the new-environment view for the policy framework. The Conclusion highlights the main points of the paper.
Before plunging into the subject matter, it may be worth stressing a number of points regarding the precise objective, approach and scope of the paper.
First, the objective of the paper is not to provide a thorough characterisation, assessment and empirical test of the two views. Rather, it is simply to show that recent experience could reasonably be viewed through two quite different perspectives, or indeed combinations thereof, and that the view taken can potentially have significant implications for monetary policy. By so doing, the paper hopes to encourage further analytical and empirical work on the issues raised by the comparison of the two paradigms. Indeed, we recognise that, at least for some aspects of the new-environment view, it may simply be too early to carry out rigorous statistical tests that could command a sufficient degree of confidence. Thus, the paper does not really provide new empirical evidence, but draws on existing work and organises facts in a way intended to highlight the perspectives under consideration. In the process, however, it also points to a number of informed hypotheses that could be researched further.
Second, the polarisation of the two perspectives is simply a rhetorical device to highlight those aspects of the paradigms that deserve further attention and those convictions that may be taken too easily for granted. Focusing on the two ends of a spectrum can help us better understand and gain awareness of what we know and do not know. In practice, views within the academic and policy communities inevitably combine elements of the two perspectives to varying degrees. For much the same reasons, as shown by some recent policy statements, one could adopt some of the refinements to policy frameworks suggested by the new-environment view without accepting its most controversial elements. That view simply serves to add further support to the refinements.
Finally, the new-environment view also has important implications for prudential policies and their relationship to monetary policy. After all, the risk of financial distress with macroeconomic consequences plays a prominent role in the story. Except tangentially, however, this paper discusses only monetary policy. Other work has already extensively examined the prudential dimension.2
2 See, in particular, Borio et al (2001) and Borio (2003).

BIS Papers No 19 3
I. Changes in the macroeconomic environment
Over the past two decades, the economic environment has been changing in fundamental ways. Inflation rates have generally fallen and subsequently inflation has remained low and more stable in much of the world. In many countries, the virulence of the business cycle has receded, with longer expansions and relatively brief and shallow recessions. However, at the same time asset price, credit and investment booms and busts have become a more important source of macroeconomic instability, in both developing and developed countries. In particular, financial crises with macroeconomic costs have become more frequent and severe.
These changes have taken place alongside a number of structural shifts, underpinned by modifications in institutions. One prominent shift has been central banks’ stronger focus on price stability. A second has been greater fiscal discipline and reforms aimed at improving the growth potential of the economy. A third, fundamental one has been financial market liberalisation and the related deepening of the globalisation of finance and economic activity more generally.
Salient economic developments
Lower and more stable inflation
A striking feature of the economic environment over the last 20 years or so has been the dramatic change in the inflation picture. Since at least the early 1990s, much of the world appears to have entered a period of relatively low and more stable inflation. This has naturally gone hand in hand with a decline in nominal interest rates.
The disinflation process has been a global phenomenon (Table I.1 and Graph I.1). Admittedly, some cross-country differences are apparent. In the industrialised countries, inflation rates have declined fairly steadily since 1980, and are now extremely low compared to the experience of the 1970s. In
Table I.1
Inflation and deflation Annual rates, in percentages
1980-84 1985-89 1990-94 1995-99 2000-01
Large industrialised1 Headline 7.8 3.3 3.5 1.9 2.2 Core 7.5 3.7 3.7 2.0 1.7 Wholesale 6.9 1.4 1.5 0.9 2.4 Services 5.8 3.9 4.6 2.4 2.6
Other industrialised2 Headline 8.5 6.0 3.8 1.5 3.0 Core 7.6 6.1 4.1 1.6 2.6 Wholesale 8.4 4.6 2.0 0.9 3.5 Services 8.8 7.2 3.9 2.2 3.5
East Asian3 Headline 10.9 4.7 6.8 11.1 4.4 Core 4.2 1.9 Wholesale 12.1 4.3 4.1 13.9 6.5 Services 4.7 8.3
Latin American4 Headline 95.5 303.5 1,180.5 31.2 7.0 Core 84.0 17.3 24.6 8.6 Wholesale 106.0 306.9 1,202.9 32.5 10.5 Services 92.1 23.5 9.9 4.8
1 United States, euro area, Japan, United Kingdom and Canada. 2 Australia, Sweden, Norway and Switzerland. 3 Thailand, Malaysia, Indonesia and Korea. 4 Brazil and Mexico.

4 BIS Papers No 19
1 Prior to 1996, left-hand scale; in thousand per cent. Source: National data.
0
4
8
12
16
20
– 2.5
0
2.5
5.0
7.5
10.0
– 5
0
5
10
15
20
25
– 6
0
6
12
18
24
– 3
0
3
6
9
12
0
50
100
150
200
1980 1985 1990 1995 2000
0
3
6
9
12
15
0
5
10
15
20
25
– 5
0
5
10
15
20
25
– 5
0
5
10
15
20
0
10
20
30
40
50
0
5
10
15
20
25
0
8
16
24
32
1980 1985 1990 1995 2000
Core inflation and short-term interest rates
United States Euro area
Japan United Kingdom
Canada Australia
Sweden Norway
Switzerland Brazil1
Mexico Korea
In percentages
Graph I.1
Core inflation Short-term interest rate

BIS Papers No 19 5
developing countries, the progress has been somewhat more difficult and uneven and has generally lagged that in the industrialised world. While some regions, such as Asia, have a history of comparatively low inflation, others, notably Latin America, had to contend with very high inflation rates in the 1970s and 1980s. Moreover, even more recently, bursts of inflation have not been entirely absent, typically in the wake of collapses in exchange rate regimes. But by the end of the period, inflation rates were generally quite low, rarely exceeding 10% even in developing economies, and the cross-country dispersion had fallen dramatically.
In fact, the disinflation process has been so strong that a number of countries are actually experiencing declines in the overall price level. In Asia, prices have been declining for some time in Japan, China and Hong Kong. Inflation rates are barely positive in other parts of East Asia. Elsewhere in the industrial world, while the overall price level has been rising, it has not been uncommon for sectoral price indices to be falling, especially in manufacturing (Table I.2).
Table I.2
Deflation frequency1
As a percentage of country-years
1960-69 1970-79 1980-89 1990-99 1999-2001
Headline inflation 4.12 0.73 1.0 3.3 8.3
Core inflation 0.04 0.05 0.36 4.4 10.4
Services less housing inflation 0.07 1.18 1.39 5.110 13.5
Wholesale inflation 12.411 5.312 12.313 20.0 23.9
Note: Simple average of the following countries: Australia, Canada, Brazil, euro area, Indonesia, Japan, Korea, Malaysia, Mexico, Norway, Sweden, Switzerland, Thailand, United Kingdom and United States. 1 Defined as a percentage of negative changes in all annual changes of the price index. 2 For the euro area, 1966-69; for Thailand and Korea, 1965-69; for Indonesia, 1968-69. 3 For Brazil, 1975-79. 4 Includes only Canada, Switzerland and the United States. 5 For the euro area, 1976-79; for the United Kingdom, 1975-79; for Australia, 1976-79; for Norway, 1974-79; Sweden, Malaysia, Indonesia, Thailand, Korea, Mexico and Brazil are not included. 6 Thailand and Korea are not included. 7 For Canada, 1962-69; for Norway 1969 only; for Japan, 1961-69; the rest of the countries are not included. 8 Includes only Canada, Norway, Japan, Australia (for 1975-79) and Switzerland (for 1971-79). 9 For the United States, 1983-89; for the United Kingdom, 1988-89; for Mexico, 1982-89; the euro area, Indonesia, Korea and Brazil are not included. 10 For the euro area and Korea, 1991-99; for Indonesia, 1997-99; for Brazil, 1992-99. 11 Malaysia, Indonesia and the euro area are not included; for Brazil, 1961-69. 12 Malaysia and the euro area are not included; for Indonesia, 1970-79. 13 For Malaysia, 1984-89.
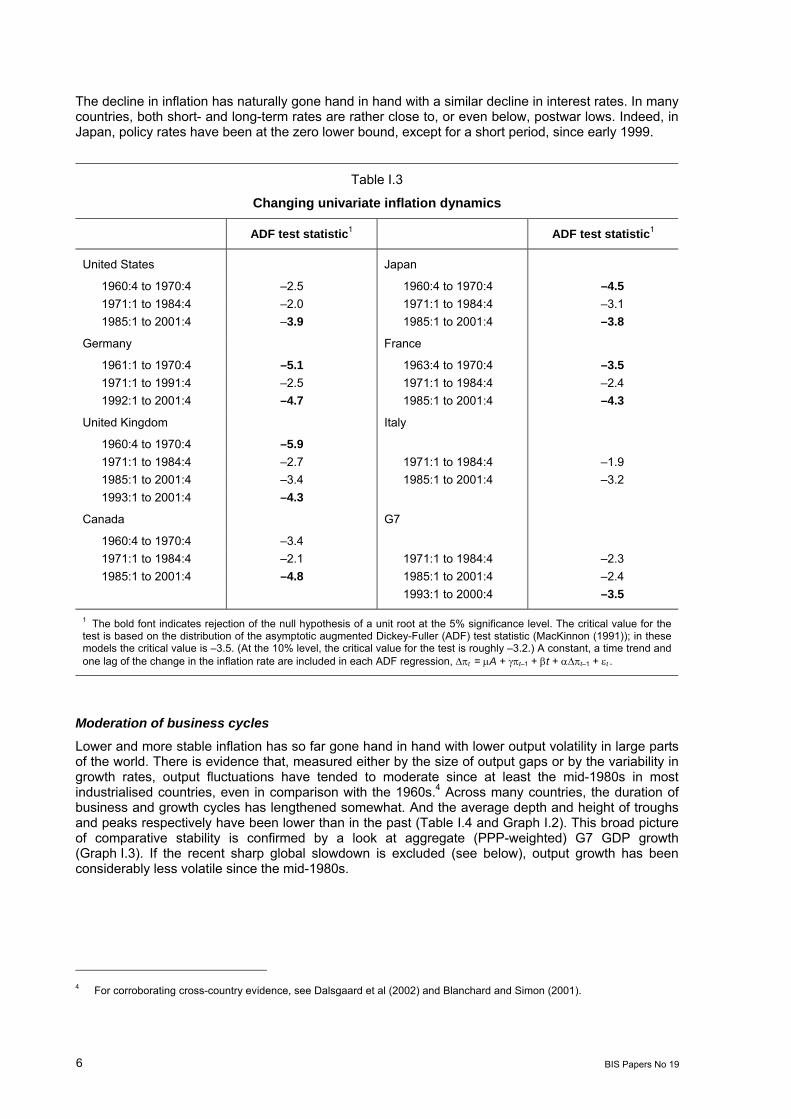
Lower inflation has also meant more stable inflation in at least two respects. First, the volatility of the inflation rate has declined. This has confirmed the well known positive relationship between the level and variance (or standard deviation) of inflation. In addition, and more subtly, there is some evidence that inflation has become “stickier” or, in technical terms, changes in inflation have become less persistent. Specifically, the univariate dynamics of inflation in the United States, Europe and Japan appear to be very different before and after 1985 (Table I.3). Before that year, inflation appeared to have a unit root in all three regions, implying that an increase in inflation in a given year led to a permanent rise. This lack of mean reversion indicates that shocks to inflation tended to persist indefinitely over time. By contrast, the data suggest that inflation was mean reverting after 1985, with increases in inflation being reversed over subsequent quarters. It is as if the inflation rate had become better anchored than in the past (see below).3
3 The view that expectations are now better anchored, notably around inflation objectives, is commonly found in central bank
reports and public statements. The view is typically based on survey evidence or on the information derived from yield curves. See eg Vickers (1999a) and Perrier and Amano (2000).
6 BIS Papers No 19
The decline in inflation has naturally gone hand in hand with a similar decline in interest rates. In many countries, both short- and long-term rates are rather close to, or even below, postwar lows. Indeed, in Japan, policy rates have been at the zero lower bound, except for a short period, since early 1999.
Table I.3
Changing univariate inflation dynamics
ADF test statistic1 ADF test statistic1
United States Japan
1960:4 to 1970:4 –2.5 1960:4 to 1970:4 –4.5 1971:1 to 1984:4 –2.0 1971:1 to 1984:4 –3.1 1985:1 to 2001:4 –3.9 1985:1 to 2001:4 –3.8
Germany France
1961:1 to 1970:4 –5.1 1963:4 to 1970:4 –3.5 1971:1 to 1991:4 –2.5 1971:1 to 1984:4 –2.4 1992:1 to 2001:4 –4.7 1985:1 to 2001:4 –4.3
United Kingdom Italy
1960:4 to 1970:4 –5.9 1971:1 to 1984:4 –2.7 1971:1 to 1984:4 –1.9 1985:1 to 2001:4 –3.4 1985:1 to 2001:4 –3.2 1993:1 to 2001:4 –4.3
Canada G7
1960:4 to 1970:4 –3.4 1971:1 to 1984:4 –2.1 1971:1 to 1984:4 –2.3 1985:1 to 2001:4 –4.8 1985:1 to 2001:4 –2.4
1993:1 to 2000:4 –3.5
1 The bold font indicates rejection of the null hypothesis of a unit root at the 5% significance level. The critical value for the test is based on the distribution of the asymptotic augmented Dickey-Fuller (ADF) test statistic (MacKinnon (1991)); in these models the critical value is –3.5. (At the 10% level, the critical value for the test is roughly –3.2.) A constant, a time trend and one lag of the change in the inflation rate are included in each ADF regression, ∆πt = µA + γπt–1 + βt + α∆πt–1 + εt .
Moderation of business cycles
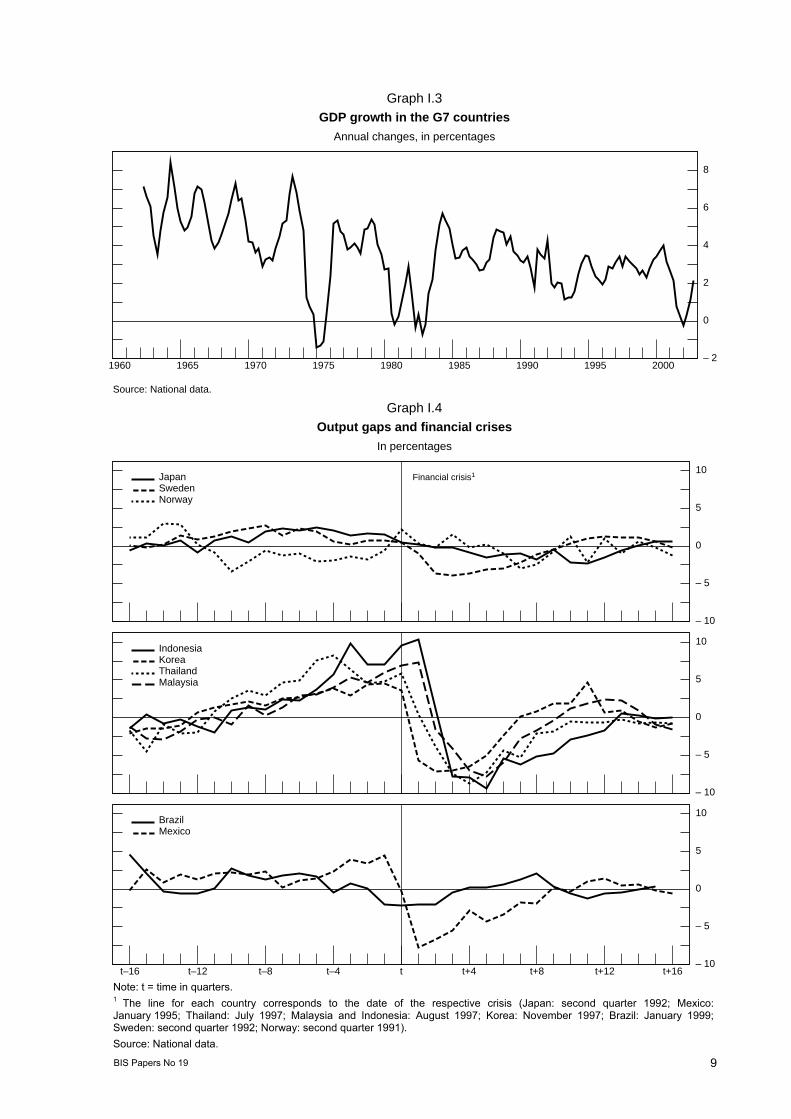
Lower and more stable inflation has so far gone hand in hand with lower output volatility in large parts of the world. There is evidence that, measured either by the size of output gaps or by the variability in growth rates, output fluctuations have tended to moderate since at least the mid-1980s in most industrialised countries, even in comparison with the 1960s.4 Across many countries, the duration of business and growth cycles has lengthened somewhat. And the average depth and height of troughs and peaks respectively have been lower than in the past (Table I.4 and Graph I.2). This broad picture of comparative stability is confirmed by a look at aggregate (PPP-weighted) G7 GDP growth (Graph I.3). If the recent sharp global slowdown is excluded (see below), output growth has been considerably less volatile since the mid-1980s.
4 For corroborating cross-country evidence, see Dalsgaard et al (2002) and Blanchard and Simon (2001).

BIS Papers No 19 7
Table I.4
Salient features of business cycles
Average duration (months)
Average height of GDP gap (%)
Average depth of GDP gap (%)
Standard deviation of GDP
gap
Pre-1983
Post- 1982
Pre-1983
Post- 1982
Pre-1983
Post- 1982
Pre-1983
Post- 1982
United States 16 21 2.98 1.74 –3.24 –1.38 2.02 1.25 Euro area 2.30 2.00 –3.08 –1.44 1.61 1.02 Japan 18 19 3.08 2.39 –2.13 –1.91 1.88 1.21 United Kingdom 20 26 3.33 1.91 –2.41 –1.74 1.68 1.23 Canada 14 22 2.50 2.08 –2.94 –1.67 1.33 1.57 Australia 18 33 3.00 1.95 –3.58 –1.51 1.66 1.40 Sweden 33 18 2.69 1.79 –2.47 –1.94 1.47 1.39 Norway 3.81 3.75 –4.50 –2.94 1.85 1.63 Switzerland 41 27 4.75 1.79 –4.18 –1.56 2.71 1.11 Brazil 3.94 –3.86 2.75 Mexico 18 4.05 –4.34 2.35 Korea 12 19 5.88 4.33 –7.23 –4.12 3.31 2.46
Note: The average duration of each country’s growth rate cycle is indicated. An alternative definition of the cycle is based on expansions and contractions. Because of the strong growth in nearly all these countries in the pre-1980 period, such cross-country comparisons are not meaningful. However, using the NBER business cycle dates for the United States, the average duration of business cycle expansions has more than doubled from 47 months in the pre-1983 period to 107 months afterwards.
This moderation has been particularly apparent in the United States, which experienced the longest expansion on record in the 1990s, following another comparatively long upswing in the 1980s and a comparatively mild recession in 1990-91. So far, the most recent recession has also been rather shallow by historical standards.
Not all countries, however, have shared this positive experience. In particular, output volatility appears to have been greater in several economies that have gone through serious episodes of widespread financial distress. In the industrial world, the most notable example has been Japan.5 And the same has been true for several countries in East Asia. In all of these cases, the crises had been preceded by a long period of rapid and rather steady growth (Graph I.4), and hence comparatively low volatility.
Greater prominence of financial booms and busts
The negative experiences in these countries point to a more generalised feature of the economic environment since the mid-1980s: the greater size and amplitude of medium-term fluctuations in asset prices, often accompanied by rapid credit expansion.6
Given data availability, this phenomenon is best illustrated for industrial countries. Graph I.5 summarises the evidence for a sample of countries for which data on commercial and residential property prices were available. The behaviour of asset prices is captured by an aggregate asset price index, which weighs property and equity prices by rough estimates of their shares in private sector
5 This is missed in Table I.4 because of the common date chosen for the break. See Dalsgaard et al (2002) and Blanchard
and Simon (2001). 6 These are amply documented in Borio et al (1994, 2001) as well as in Borio and Lowe (2002a).

8 BIS Papers No 19
– 5.0
– 2.5
0
2.5
5.0
– 5.0
– 2.5
0
2.5
5.0
– 5.0
– 2.5
0
2.5
5.0
– 5.0
– 2.5
0
2.5
5.0
– 6
– 3
0
3
6
– 10
– 5
0
5
10
1960 1970 1980 1990 2000
– 5.0
– 2.5
0
2.5
5.0
– 5.0
– 2.5
0
2.5
5.0
– 5.0
– 2.5
0
2.5
5.0
– 8
– 4
0
4
8
– 10
– 5
0
5
10
– 10
– 5
0
5
10
1960 1970 1980 1990 2000
Output gaps
United States Euro area
Japan United Kingdom
Canada Australia
Sweden Norway
Switzerland Brazil
Mexico Korea
In percentages
Graph I.2
Sources: National data; BIS calculations.
BIS Papers No 19 9
Note: t = time in quarters. 1 The line for each country corresponds to the date of the respective crisis (Japan: second quarter 1992; Mexico: January 1995; Thailand: July 1997; Malaysia and Indonesia: August 1997; Korea: November 1997; Brazil: January 1999; Sweden: second quarter 1992; Norway: second quarter 1991). Source: National data.
– 2
0
2
4
6
8
1960 1965 1970 1975 1980 1985 1990 1995 2000
GDP growth in the G7 countries
Annual changes, in percentages
Graph I.3
Source: National data.
– 10
– 5
0
5
10
– 10
– 5
0
5
10
– 10
– 5
0
5
10
t–16 t–12 t–8 t–4 t t+4 t+8 t+12 t+16
Output gaps and financial crises
In percentages
Graph I.4
Japan SwedenNorway
IndonesiaKorea Thailand Malaysia
BrazilMexico
Financial crisis1

10 BIS Papers No 19
75
100
125
150
175
200
225
80
100
120
140
160
80
100
120
140
160
180
200
70
80
90
100
110
120
50
100
150
200
250
20
40
60
80
100
120
70
80
90
100
110
120
130
80
100
120
140
160
60
80
100
120
140
20
40
60
80
100
120
80
90
100
110
120
130
140
40
60
80
100
120
140
80
100
120
140
160
50
60
70
80
90
100
70 75 80 85 90 95 0080
100
120
140
160
180
50
60
70
80
90
100
70 75 80 85 90 95 00
Real aggregate asset prices and credit
United States Japan
United Kingdom Canada
Australia Germany
France Italy
Graph I.5
Real aggregate asset prices(1980 = 100; lhs)Total private credit/GDP (ratio; rhs)
Sources: Private real estate associations; national data; BIS calculations.

BIS Papers No 19 11
60
80
100
120
140
160
40
50
60
70
80
90
50
75
100
125
150
175
200
25
50
75
100
125
150
50
100
150
200
250
300
60
70
80
90
100
110
50
100
150
200
250
300
60
80
100
120
140
160
0
100
200
300
400
20
40
60
80
100
75
100
125
150
175
200
225
60
80
100
120
140
75
100
125
150
175
200
90
100
110
120
130
140
150
70 75 80 85 90 95 0080
100
120
140
160
80
100
120
140
160
180
70 75 80 85 90 95 00
Real aggregate asset prices and credit
Belgium Netherlands
Spain Sweden
Finland Norway
Denmark Switzerland
Graph I.5 (cont)
Real aggregate asset prices(1980 = 100; lhs)Total private credit/GDP (ratio; rhs)
Sources: Private real estate associations; national data; BIS calculations.

12 BIS Papers No 19
wealth. Country differences aside, the pictures illustrate that since the 1970s two major cycles have taken place and a third is under way, in sympathy with real economic activity. They correspond to the early to mid-1970s, the mid-1980s to the early or mid-1990s, and the second half of the 1990s to the present. Japan did not take part in the latest upswing following the bust in asset prices at the turn of the 1990s and the subsequent “lost decade”. The data indicate that, if anything, the size and amplitude of the cycles is growing. A generally positive correlation between asset prices and credit expansion is also evident.
Booms and busts in credit and asset prices have been a common factor underlying another key development in the changing economic environment: the increased frequency and severity of episodes of widespread financial distress.7 The disorderly unwinding of financial imbalances has contributed to economic downturns or economic weakness in both industrialised and emerging market countries. Starting in the late 1980s, examples include the Nordic countries, Japan, some Latin American countries and East Asia.8 The resulting costs to the real economy have been especially high when such banking crises have coincided with currency crises.9 Moreover, even when actual failures of financial institutions have been limited or non-existent, in some cases the unwinding of the imbalances has contributed to strains on the financial system and the real economy. The experiences of the United States, the United Kingdom and Australia in the early 1990s stand out in this respect.
Background structural changes
The rise of a focus on price stability and supporting reforms
The lower and more stable inflation performance of recent years reflects, in part, a sea change in thinking at central banks. The high inflation of the 1970s led central banks to focus policy to a much greater degree on inflation performance over the medium term.10 Over time, this focus was underpinned by changes in the operational and institutional framework.
Operationally, initially among countries with a history of comparatively high inflation, the authorities gradually adopted structured inflation targeting regimes, including specific numerical objectives for inflation. Starting with countries such as New Zealand, Canada, the United Kingdom and Sweden, the trend subsequently extended much more widely, including several emerging market economies.11 Among these, the adoption of the new framework not infrequently took place in the aftermath of the collapse of regimes characterised by tighter exchange rate commitments.12 The experiences of Brazil and several East Asian countries following financial crises are obvious examples.
Institutionally, the stronger intellectual, political and social consensus to fight inflation crystallised in the trend towards endowing central banks with a greater degree of autonomy or “independence” to pursue mandates more clearly focused on price stability. The aim was to make central banks less vulnerable to possible external pressures to test the limits of monetary policy in pursuit of transient employment or
7 The incidence and severity of banking crises is documented in a historical perspective in Bordo et al (2001). 8 See Kaminsky and Reinhart (1999) for a more systematic approach documenting the pattern of financial imbalances leading
to currency and banking crises in 20 countries in Europe, Asia and Latin America since 1980. Note that there is still some controversy over whether these crises, most notably those in East Asia, reflected primarily a deterioration in fundamentals (eg Corsetti et al (1999)) or were predominantly driven by self-fulfilling creditor runs (eg Radelet and Sachs (1998)). These issues are discussed in more detail in eg Corsetti (1998) and Borio (2003). The alternative hypotheses would have implications for predictability, an issue discussed below.
9 For the costs of financial crises in terms of output forgone, see eg Hoggarth and Saporta (2001). 10 For a broad-sweep cross-country examination of the evolution of monetary policy in the postwar period, see BIS (1997) and
Cottarelli and Giannini (1997). For a discussion of the reasons for the failure of policy to control inflation in the United States, see Orphanides (2000), De Long (2000) and Romer and Romer (2002).
11 See, for instance, Bernanke et al (1999a) and Schaechter et al (2000). Bernanke et al (1999a) also provide evidence that these explicit inflation targets have been followed by sustained disinflations in a number of cases. While inflation targets do not appear to have reduced the costs of such disinflations, they may help to bolster low inflation expectations once the disinflation has been achieved.
12 See Ho and McCauley (2003) for a discussion of the shift to inflation targeting in emerging market countries, with particular attention paid to the role played by the exchange rate in such frameworks.

BIS Papers No 19 13
output gains. The shift was also based on the fact that political pressures found fertile ground in a context where the short-run costs of a policy tightening were all too obvious but the long-term gains less apparent.13 The intellectual basis for the shift was the recognition, reinforced in the high-inflation period, of the absence of a long-run trade off between inflation and unemployment.14
The strengthened focus on price stability by central banks was subsequently supported by broader changes in government policy. These changes, consistent with the same philosophy underlying the shift in central bank thinking, included, in particular, a trend towards greater fiscal discipline and efforts to improve the supply side of the economy, notably the functioning of labour markets.
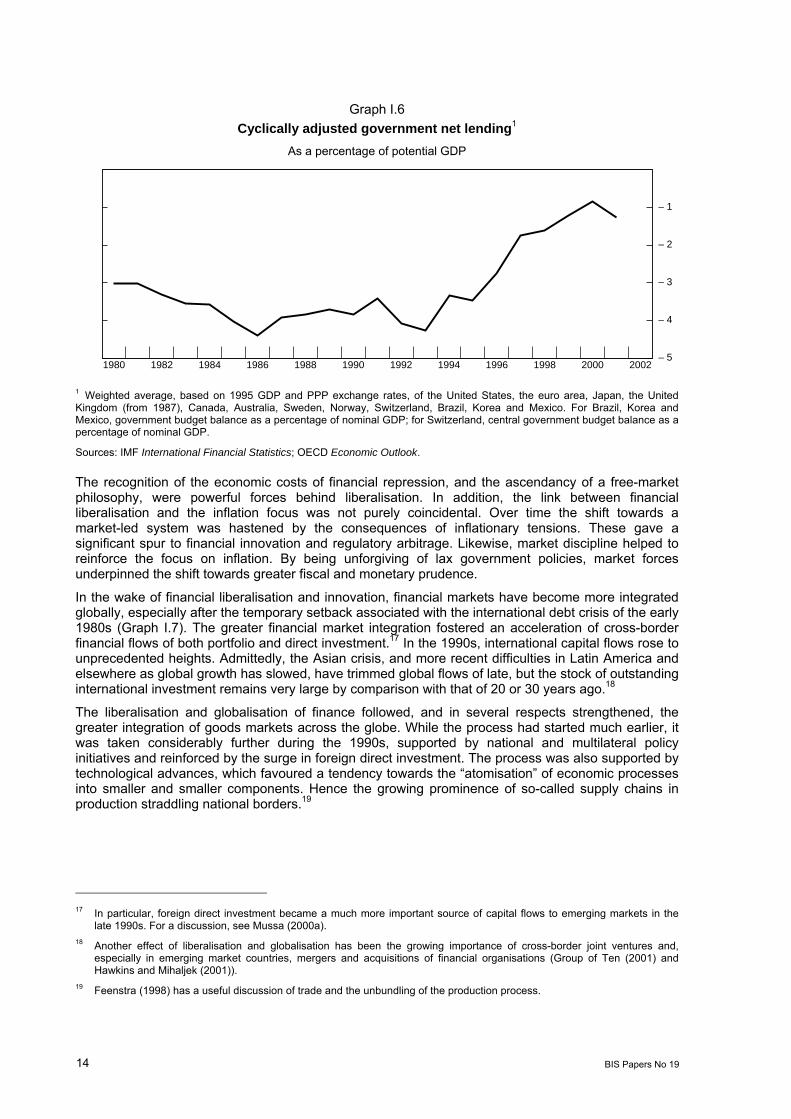
The shift towards a medium-term and less ambitious orientation in fiscal policy was in part the offspring of disillusionment with the perceived effects of activism and growing fiscal deficits on economic growth and inflation. It was reflected in a generalised trend towards tighter fiscal positions, most clearly apparent during the 1990s, sometimes supported by binding rules (Graph I.6). In Europe, for instance, fiscal constraints were seen as instrumental in the establishment of economic and monetary union (EMU) and, subsequently, in its smooth running, as reflected in the Stability and Growth Pact. More generally, fiscal discipline arguably helped to buttress the central banks’ efforts to ensure price stability, by providing a greater degree of operational freedom in, and lowering the political costs of, pursuing their primary objective.15 And prohibitions on central bank lending to the government became a common feature of institutional frameworks securing central bank independence.
During the 1990s in particular, governments redoubled efforts to improve the supply side of the economy. Goods markets and, above all, labour markets were the preferred targets. Privatisation and labour market reforms that aimed at increasing labour market flexibility were the primary tools. These efforts were intended to raise the long-run potential growth of the economy and promote employment growth. They were seen as supporting price stability not only through the higher long-term growth potential but also by reducing the likelihood of untoward shocks in wages and prices. Such supply side efforts were regarded as especially important in economies where structural rigidities were viewed as most severe, notably in Europe and emerging market countries. Many emerging markets embarked on major reform efforts, with the added incentive of attracting badly needed foreign capital.
Financial liberalisation and globalisation
Over a somewhat longer period, there has been a widespread move towards financial liberalisation, both within and across national borders. The G7 countries typically began partial liberalisations in the mid-1970s, and then pushed such reforms considerably further in the 1980s and 1990s. By the early 1990s, their liberalisation efforts were virtually complete. Developing countries generally followed somewhat later, but made substantial progress in freeing their relatively repressed financial systems in the 1990s.16
13 A literature has developed showing, empirically and analytically, a link between central bank independence and inflation
performance; see Cukierman (1992) and Berger et al (2001) for surveys. In fact, work on the inflationary bias of monetary policy under “discretion”, starting with Barro and Gordon (1983), can also probably best be seen in this light. It may be more reasonable to view the bias as reflecting political pressure in the absence of clear mandates than as a deliberate attempt by the central bank to pursue overly ambitious employment or output objectives.
14 This view was initially articulated by Friedman (1968) and Phelps (1968). It became much better accepted after the high-inflation period that followed (Friedman (1977)).
15 In the theoretical economic literature, the link between fiscal policy and inflation has a long tradition. It was put most starkly by Sargent and Wallace (1981), and has recently been revisited by the so-called fiscal theory of the price level (eg Woodford (2001)). Operationally, recognition of the importance of fiscal discipline for de facto central bank independence has an equally long history (eg Toniolo (1988)). Especially in the 1990s, the concept of “fiscal dominance”, used to denote a situation in which monetary policy could not effectively operate in the presence of large fiscal deficits, was extensively used as background to policy prescriptions in emerging market countries.
16 The process of financial liberalisation in industrial countries is overviewed concisely in BIS (1992) and, in much more detail, in OECD (1994). Kaminsky and Schmukler (2001), inter alia, document an uneven, but ultimately substantial, trend towards deregulation of financial institutions and markets in developing countries as well. At the global level, Padoa-Schioppa and Saccomanni (1994) describe and analyse this shift, from what they call a government-led to a market-led international financial system.
14 BIS Papers No 19
Graph I.6 Cyclically adjusted government net lending1
As a percentage of potential GDP
– 5
– 4
– 3
– 2
– 1
1980 1982 1984 1986 1988 1990 1992 1994 1996 1998 2000 2002 1 Weighted average, based on 1995 GDP and PPP exchange rates, of the United States, the euro area, Japan, the United Kingdom (from 1987), Canada, Australia, Sweden, Norway, Switzerland, Brazil, Korea and Mexico. For Brazil, Korea and Mexico, government budget balance as a percentage of nominal GDP; for Switzerland, central government budget balance as a percentage of nominal GDP.
Sources: IMF International Financial Statistics; OECD Economic Outlook.
The recognition of the economic costs of financial repression, and the ascendancy of a free-market philosophy, were powerful forces behind liberalisation. In addition, the link between financial liberalisation and the inflation focus was not purely coincidental. Over time the shift towards a market-led system was hastened by the consequences of inflationary tensions. These gave a significant spur to financial innovation and regulatory arbitrage. Likewise, market discipline helped to reinforce the focus on inflation. By being unforgiving of lax government policies, market forces underpinned the shift towards greater fiscal and monetary prudence.
In the wake of financial liberalisation and innovation, financial markets have become more integrated globally, especially after the temporary setback associated with the international debt crisis of the early 1980s (Graph I.7). The greater financial market integration fostered an acceleration of cross-border financial flows of both portfolio and direct investment.17 In the 1990s, international capital flows rose to unprecedented heights. Admittedly, the Asian crisis, and more recent difficulties in Latin America and elsewhere as global growth has slowed, have trimmed global flows of late, but the stock of outstanding international investment remains very large by comparison with that of 20 or 30 years ago.18
The liberalisation and globalisation of finance followed, and in several respects strengthened, the greater integration of goods markets across the globe. While the process had started much earlier, it was taken considerably further during the 1990s, supported by national and multilateral policy initiatives and reinforced by the surge in foreign direct investment. The process was also supported by technological advances, which favoured a tendency towards the “atomisation” of economic processes into smaller and smaller components. Hence the growing prominence of so-called supply chains in production straddling national borders.19
17 In particular, foreign direct investment became a much more important source of capital flows to emerging markets in the
late 1990s. For a discussion, see Mussa (2000a). 18 Another effect of liberalisation and globalisation has been the growing importance of cross-border joint ventures and,
especially in emerging market countries, mergers and acquisitions of financial organisations (Group of Ten (2001) and Hawkins and Mihaljek (2001)).
19 Feenstra (1998) has a useful discussion of trade and the unbundling of the production process.

BIS Papers No 19 15
1 Total gross capital flows relative to net capital flows, left-hand side. 2 Right-hand side, in billions of US dollars, deflated by the US GDP deflator.
Sources: IMF; World Bank.
A return to the past?
As a result of these structural changes in the economic environment, notably in financial markets and monetary institutions, the configuration of global economic arrangements has come to resemble in some significant respects that prevailing in the pre-World War I period. This was the last time that liberalised financial markets coincided with a monetary regime seen as guaranteeing monetary stability. In the early decades of the 20th century, this was the gold standard; nowadays, it is a monetary framework that, while based on fiat money, is structured so as to secure the control of inflation.20
In fact, in some respects the resemblance may be closer with the first phase of the interwar period. This phase had either seen successful efforts to re-establish monetary stability by returning to the gold standard, as in a number of central European economies, or experimentation in how to conduct monetary policy in a context of price stability but weakened exogenous constraints on credit expansion.21 In particular, this was the situation in the United States in the 1920s, given the abundance of its gold reserves.22
20 For an elaboration on this point, see Crockett (2000a), Borio and Crockett (2000) and Borio and Lowe (2002a), who also
consider obvious differences. For a detailed comparison of the degree of financial liberalisation and integration, see, for example, Bordo et al (1999), Eichengreen (1996) and Obstfeld and Taylor (1998). These contributions also discuss monetary arrangements.
21 For a discussion of this period, see, in particular, James (2001). 22 See, for example, Laidler (1999) for a review of the rich monetary debates at the time in the United States.
0
100
200
300
400
500
600
700
800
0
50
100
150
200
250
300
350
400
1960 1965 1970 1975 1980 1985 1990 1995 2000
Cross-border financial flows
Graph I.7
Total gross capital flows (in percentages)1 Private flows to developing countries2 Bank lending to developing countries2 Equity flows to developing countries2 Foreign direct investment to developing countries2

16 BIS Papers No 19
II. Challenges for monetary policy
Despite the low level of inflation and the generally less virulent output fluctuations experienced over the past decade or so in many countries, central banks have faced considerable challenges. These challenges have included possible changes in the behaviour of inflation and inflation indicators, increased uncertainty in some economies about the pace of underlying productivity growth, and difficulties caused by large asset price booms and busts and the financial crises that ensued in some cases. The nature of the recent economic slowdown, and the relatively weak and uneven recovery, also pose questions for monetary authorities.
Changes in the inflation process
One challenge facing central banks over the past decade, albeit one that reflects good news, is that inflation rates have generally fallen by more than would have been expected given the observed path of output and other inflation indicators. Real-time forecasts of inflation for a number of industrialised economies were consistently too high in the second half of the 1990s. The reasons for this development have been amply debated, although no clear conclusions have as yet emerged.23
A common set of interpretations has stressed changes in businesses’ pricing practices. These explanations draw strength from the observation that forecasts of wage inflation were closer to the mark than those for price inflation. They are also consistent with clear evidence that the pass-through from exchange rates to prices generally declined in the second half of the 1990s.24 While it is difficult to assess the importance of different factors, and their relative significance has probably varied across countries, a number of possibilities have been suggested.
The first possibility includes factors that could put downward pressure on firms’ pricing power, inducing them to settle for smaller markups of prices over marginal costs. The demand curve for products may have become more elastic, either as a result of greater price transparency (eg the increased use of the internet and reduced information costs more generally) or of increased competition in goods markets, not least as a result of deregulation and globalisation.25 In addition, the fact that production now straddles national borders much more than in the past would tend to make prices less sensitive to purely domestic costs.
A second possibility includes supply side developments that may have reduced firms’ marginal costs, thereby leading them to trim prices.26 A likely candidate in some countries, most notably the United States, is that more robust underlying productivity growth, reflecting both hefty investment and faster total factor productivity (TFP) growth, may have allowed firms to limit price increases for a given rise in wages while still boosting margins and profits. So long as the faster productivity growth took time to flow through to wage setting behaviour, as seems to have been the case, this would put temporary downward pressure on prices for a given level of unemployment (ie reduce the level of the NAIRU).27 Another possible source of downward price pressure could be labour market reforms. For instance, efforts in some European countries to improve the matching of workers and firms or to reduce the attractiveness of unemployment compensation would be expected to lead to lower inflation for a given level of unemployment.28
23 See, for example, Andersen and Wascher (2001), references therein and the other papers in BIS (2001a) and BIS (2001b). 24 See Andersen and Wascher (2001) and BIS (2001a). For evidence of a general decline in exchange rate pass-through in
industrial countries, see also Gagnon and Ihrig (2001). For Mexico, Baqueiro et al in this volume find that the level of exchange rate pass-through has fallen with the decline in the average rate of inflation, while Minella et al in this volume find less convincing evidence for Brazil and emphasise the importance of administered prices in measuring pass-through.
25 In this volume, Amano and Hendry emphasise the role of market share considerations to help to understand the inertial behaviour of inflation.
26 This possibility is consistent with the findings of Amato and Gerlach (2000), who argue that, conditional on unit labour costs, there is no compelling evidence that the inflation process has changed in a number of leading industrial countries.
27 See Braun (1984) and Ball and Moffitt (2001). 28 Lower oil prices may also have contributed to the lower than expected inflation performance in the late 1990s, but on
balance oil prices have risen over the last 15 years.

BIS Papers No 19 17
A final possibility focuses more on the dynamics of expectations and price setting at low levels of inflation. In particular, with expectations better anchored around low and stable inflation levels, possibly underpinned by stronger central bank anti-inflation credentials,29 one-off unexpected increases in costs are less likely to feed through into prices, as they are less likely to be considered permanent.30 For example, an increase in wages, if not accommodated by the authorities, would tend to be unwound in future through lower employment levels. Likewise, with smaller inflation differentials, changes in exchange rates might be expected to have less of a predictable drift, thereby slowing down the pass-through.31 The presence of “menu” costs can generally contribute to this stickiness in prices.32
While the lower than expected inflation of recent years is surely good news, the fact that models of inflation performed relatively poorly suggests that our understanding of the inflation process is not as good as might have been thought. This realisation raises risks for central banks. On the one hand, given that policy takes time to have its effects on the economy, central banks would wish to act pre-emptively to combat expected pressures on prices or output. On the other hand, pre-emptive action is only possible if the central bank is confident of its ability to forecast such pressures. Thus, the difficulties in forecasting inflation in recent years have arguably made it more difficult to take pre-emptive actions. Other things equal, this suggests that central banks may have to wait longer before being confident enough to take action.
Uncertainty about productivity growth
A second challenge facing policymakers has been coming to grips with the uncertainty surrounding potential increases in productivity growth. By its very nature, reaching firm judgments about the sustainable pace of productivity growth is extremely difficult. Disentangling the sources of an increase - potentially including capital deepening, shifts in the sectoral distribution of output, cyclical effects on labour and capital utilisation, and faster TFP growth - is very hard. Importantly, judgments depend crucially on the sustainability of the capital deepening process. And experience suggests that it is the resilience of the pace of productivity growth during a recession that is critical in assessing long-run tendencies. These difficulties in reaching a firm judgment raise delicate issues for central banks, not least the risk of failing to be sufficiently pre-emptive.
Most recently, the difficulties in forming a solid view have been evident in the United States, where the underlying pace of productivity growth stepped up over the second half of the 1990s. It was not until the end of the decade that a consensus emerged on the extent and likely sources of the acceleration, and considerable disagreement remains on the likely sustainability of the pickup.33 As the US economy has slowed, productivity has continued to post robust, if somewhat downward-revised, gains, suggesting that the faster pace of advance in the late 1990s was not simply the result of the
29 The view that greater credibility of the central bank anti-inflation commitment, backed by changes in the operational
framework, may have helped to better anchor expectations is rather common. This is found in central bank statements (eg Vickers (1999a), Dodge (2003)) and also academic work (eg Bernanke et al (1999a) and Cukierman (2002)). See also Johnson (2002) and Neumann and von Hagen (2002) for a comparison of inflation targeting and non-inflation targeting regimes in this respect.
30 Taylor (2000), for instance, discusses how perceived lower persistence of cost changes implies a lower pass-through. 31 By contrast, Campa and Goldberg (2002) attribute the smaller pass-through to changes in the composition of trade. 32 See the seminal article by Mankiw (1985) and, in this volume, Aucremanne et al (2003) and Assarsson (2003). Calpin and
Spulber (1987), however, note that menu costs at the level of individual prices need not result in sticky adjustments in the overall price index.
33 For example, Jorgenson (2001), Gordon (2000) and Oliner and Sichel (2002) all suggest an acceleration in productivity growth of nearly a percentage point, reflecting both faster TFP growth and capital deepening. All three also suggest that production of, and investment in, IT products can account for much of this pickup. However, while the projections presented by Oliner and Sichel suggest that faster underlying productivity growth is likely to be sustained, Gordon argues that decreasing returns to scale in the use of computing power are likely to limit productivity rises going forward. For an international perspective on productivity growth, see Scarpetta et al (2000). The time series evidence of a structural productivity break was suggestive but not statistically significant until the late 1990s; see Filardo (1995), Filardo and Cooper (1996) and Kahn and Rich (2003).
18 BIS Papers No 19
high-tech boom. At the same time, a larger proportion of the gains has recently been attributed to capital deepening rather than total factor productivity growth.34
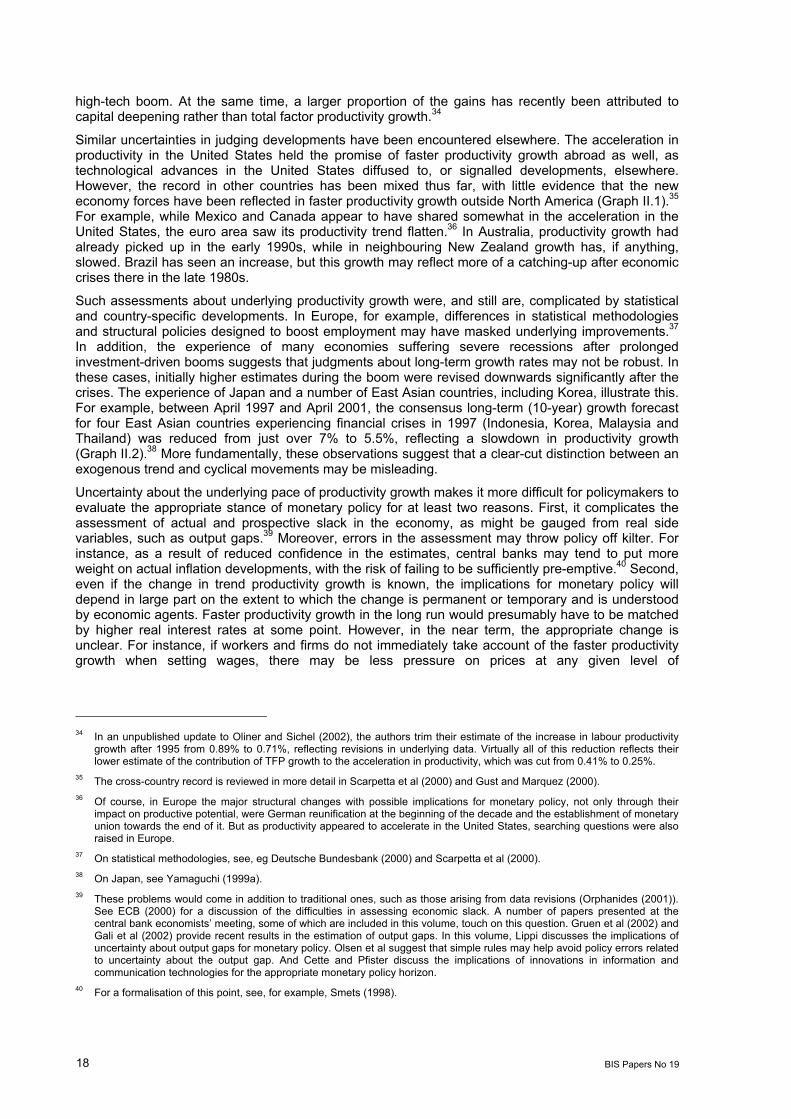
Similar uncertainties in judging developments have been encountered elsewhere. The acceleration in productivity in the United States held the promise of faster productivity growth abroad as well, as technological advances in the United States diffused to, or signalled developments, elsewhere. However, the record in other countries has been mixed thus far, with little evidence that the new economy forces have been reflected in faster productivity growth outside North America (Graph II.1).35 For example, while Mexico and Canada appear to have shared somewhat in the acceleration in the United States, the euro area saw its productivity trend flatten.36 In Australia, productivity growth had already picked up in the early 1990s, while in neighbouring New Zealand growth has, if anything, slowed. Brazil has seen an increase, but this growth may reflect more of a catching-up after economic crises there in the late 1980s.
Such assessments about underlying productivity growth were, and still are, complicated by statistical and country-specific developments. In Europe, for example, differences in statistical methodologies and structural policies designed to boost employment may have masked underlying improvements.37 In addition, the experience of many economies suffering severe recessions after prolonged investment-driven booms suggests that judgments about long-term growth rates may not be robust. In these cases, initially higher estimates during the boom were revised downwards significantly after the crises. The experience of Japan and a number of East Asian countries, including Korea, illustrate this. For example, between April 1997 and April 2001, the consensus long-term (10-year) growth forecast for four East Asian countries experiencing financial crises in 1997 (Indonesia, Korea, Malaysia and Thailand) was reduced from just over 7% to 5.5%, reflecting a slowdown in productivity growth (Graph II.2).38 More fundamentally, these observations suggest that a clear-cut distinction between an exogenous trend and cyclical movements may be misleading.
Uncertainty about the underlying pace of productivity growth makes it more difficult for policymakers to evaluate the appropriate stance of monetary policy for at least two reasons. First, it complicates the assessment of actual and prospective slack in the economy, as might be gauged from real side variables, such as output gaps.39 Moreover, errors in the assessment may throw policy off kilter. For instance, as a result of reduced confidence in the estimates, central banks may tend to put more weight on actual inflation developments, with the risk of failing to be sufficiently pre-emptive.40 Second, even if the change in trend productivity growth is known, the implications for monetary policy will depend in large part on the extent to which the change is permanent or temporary and is understood by economic agents. Faster productivity growth in the long run would presumably have to be matched by higher real interest rates at some point. However, in the near term, the appropriate change is unclear. For instance, if workers and firms do not immediately take account of the faster productivity growth when setting wages, there may be less pressure on prices at any given level of
34 In an unpublished update to Oliner and Sichel (2002), the authors trim their estimate of the increase in labour productivity
growth after 1995 from 0.89% to 0.71%, reflecting revisions in underlying data. Virtually all of this reduction reflects their lower estimate of the contribution of TFP growth to the acceleration in productivity, which was cut from 0.41% to 0.25%.
35 The cross-country record is reviewed in more detail in Scarpetta et al (2000) and Gust and Marquez (2000). 36 Of course, in Europe the major structural changes with possible implications for monetary policy, not only through their
impact on productive potential, were German reunification at the beginning of the decade and the establishment of monetary union towards the end of it. But as productivity appeared to accelerate in the United States, searching questions were also raised in Europe.
37 On statistical methodologies, see, eg Deutsche Bundesbank (2000) and Scarpetta et al (2000). 38 On Japan, see Yamaguchi (1999a). 39 These problems would come in addition to traditional ones, such as those arising from data revisions (Orphanides (2001)).
See ECB (2000) for a discussion of the difficulties in assessing economic slack. A number of papers presented at the central bank economists’ meeting, some of which are included in this volume, touch on this question. Gruen et al (2002) and Gali et al (2002) provide recent results in the estimation of output gaps. In this volume, Lippi discusses the implications of uncertainty about output gaps for monetary policy. Olsen et al suggest that simple rules may help avoid policy errors related to uncertainty about the output gap. And Cette and Pfister discuss the implications of innovations in information and communication technologies for the appropriate monetary policy horizon.
40 For a formalisation of this point, see, for example, Smets (1998).
BIS Papers No 19 19
Graph II.1
Productivity trends1
1 Defined as GDP/employment and expressed in logs. 2 BIS estimate.
Source: National data.
4.5
4.6
4.7
4.8
4.9
5.0
◆
Growth before break:2 1.2Growth after break:2 2.2
4.5
4.6
4.7
4.8
4.9
5.0
◆
Growth before break:2 3.9Growth after break:2 1.1
4.5
4.6
4.7
4.8
4.9
5.0
◆
Growth before break:2 0.5Growth after break:2 1.6
4.5
4.6
4.7
4.8
4.9
5.0
◆
Growth before break:2 1.3Growth after break:2 2.4
4.5
4.6
4.7
4.8
4.9
5.0
◆
Growth before break:2 0.1Growth after break:2 1.1
4.50
4.75
5.00
5.25
5.50
1986 1988 1990 1992 1994 1996 1998 2000 2002
◆
Growth before break:2 5.3Growth after break:2 3.1
4.5
4.6
4.7
4.8
4.9
5.0
◆
Growth before break:2 2.3Growth after break:2 0.8
4.5
4.6
4.7
4.8
4.9
5.0
◆
Growth before break:2 0.9Growth after break:2 2
4.5
4.6
4.7
4.8
4.9
5.0
◆
Growth before break:2 0.7Growth after break:2 2
4.5
4.6
4.7
4.8
4.9
5.0
◆Growth before break:2 3.1Growth after break:2 1.2
4.5
4.6
4.7
4.8
4.9
5.0
◆
Growth before break:2 – 0.8Growth after break:2 3.3
4.50
4.75
5.00
5.25
5.50
1986 1988 1990 1992 1994 1996 1998 2000 2002
◆
Growth before break:2 4.9Growth after break:2 3.6
United States Euro area
Japan United Kingdom
Canada Australia
Sweden Norway
Switzerland Brazil
Mexico Korea

20 BIS Papers No 19
Graph II.2
Productivity growth and financial crises1
– 5
0
5
10
– 5
0
5
10
t–24 t–16 t–8 t t+8 t+16– 20
– 15
– 10
– 5
0
5
10
t–24 t–16 t–8 t t+8 t+16
Japan
BrazilMexico
IndonesiaKorea Thailand Malaysia
Financial crisis2 Financial crisis2
Note: t = time in quarters. 1 Defined as GDP/employment. 2 The line for each country corresponds to the date of the respective crisis (Japan: second quarter 1992; Mexico: January 1995; Thailand: July 1997; Malaysia and Indonesia: August 1997; Korea: fourth quarter 1997; Brazil: January 1999).
Source: National data.
employment, allowing the central bank to tighten policy less than would otherwise be the case. By contrast, quick recognition of the change, and hence perceptions of higher lifetime income and future profitability, could have such an expansionary impact on demand as to call for a sharper tightening in the short run than in the long run. This would be needed to keep aggregate demand in line with aggregate supply.41
Addressing financial booms and busts
A third challenge faced by several central banks has been to come to grips with the increased frequency and severity of financial booms and busts, many of which have led to widespread financial dislocations. Specifically, central banks have had to consider how monetary policy can best respond to the build-up and unwinding of such imbalances.
Arguably, the more natural first line of defence against financial imbalances is prudential regulation and supervision, an instrument that is likely to be less blunt than monetary policy. For example, if during the upswing of a boom there appears to be excessive lending to a particular sector, perhaps to fund outsized investment spending, then the lenders may well be taking on considerable credit risk. In such a case, supervisors could, perhaps through the review process, induce the lenders to limit their exposures, thereby limiting the extent of the imbalances. Even so, if excessive optimism and biases in risk assessment are widespread, supervisors may find it difficult to establish with sufficient clarity that the lending is inappropriate. In addition, in some cases, as with stock price misalignments, there is no obvious supervisory authority that can intervene. More generally, at present the use of prudential
41 See Viñals (2000) for a useful discussion of the possible implications of supply shocks for monetary policy.

BIS Papers No 19 21
instruments to address what may be perceived as financial imbalances with an essentially macroeconomic origin remains problematic.42
The challenges faced by central banks in recent years have depended in part on the monetary regime in place. The room for manoeuvre was especially limited for central banks pursuing relatively tight exchange rate objectives. In such cases, faced with sizeable capital inflows, there was relatively little that monetary authorities could do, short of abandoning the objectives or reversing capital account liberalisation processes. This dilemma, for instance, was especially acute for emerging market countries, notably in East Asia. For those central banks with greater freedom with the interest rate lever, the problems were somewhat different. These related to difficulties in identifying the imbalances and in deciding on the extent to which it was appropriate to respond to them by tightening policy. Given the uncertainties involved, policymakers generally appeared to respond to the growing imbalances fairly gradually, as illustrated by experience in Japan and the United States.43 Even here, however, external influences could act as a significant constraint. In the case of Japan in the second half of the 1980s, for instance, interest rates were arguably kept lower than would otherwise have been the case in order to prevent an unwelcome appreciation of the yen. This, in turn, may have contributed to the build-up of the imbalances.44
Once financial imbalances begin to unwind, policy should probably be eased to cushion the effects of that unwinding on the real economy, but questions remain about the appropriate pace of the easing, its intensity and effectiveness. In some cases, as in the United States and United Kingdom in the early 1990s, financial “headwinds” caused by problems at deposit-taking institutions and/or private sector balance sheets led to a somewhat greater easing than would normally have been expected given the levels of output and inflation. Similarly, the Federal Reserve eased rates considerably in the first half of 2001, following the collapse of equity prices in the technology sector, in order to offset the resulting negative wealth effects and the impact on investment of capital overhangs in some parts of the economy. More dramatically, the Bank of Japan ultimately cut its policy rate essentially to zero in response to the economic and banking sector problems that followed the bust in equity and property prices and the emergence of widespread financial distress.
The current economic situation
Policymakers face considerable challenges at the current juncture. These reflect a number of developments, some of which have taken central banks by surprise.
The first development has been unexpected weakness in the global economy, starting with the abrupt slowdown in the United States in the autumn of 2001. Admittedly, it is not unusual for recessions to take authorities by surprise. But by postwar standards the current slowdown has been atypical in several respects. Most notably, the slowdown was not triggered by a tightening of monetary policy designed to quell inflationary pressures. In fact, inflation remained uncharacteristically quiescent. Rather, the upswing appeared to be brought to an end by a spontaneous unwinding of an investment boom, partly in the wake of what, in retrospect at least, turned out to be a remarkably sharp medium-term swing in equity prices. Although the recession in the United States has been comparatively mild thus far, the global slowdown has been rather strong by past standards. If output is measured in PPP terms, the slowdown among the G7 ranks close to those associated with the oil price shocks of the 1970s (Graph I.3, in previous section). The marked deceleration has resulted from the unusual synchronisation of the downturn across countries. While the slowdown in Japan and emerging market countries, dependent on exports to the United States, was to be expected, the intensity of the one in Europe came largely as a surprise. The global economy has continued to be weaker than expected, and forecasts of when growth in the largest economies will return to estimates of potential have been pushed back.
42 These issues are discussed in detail in Borio et al (2001), BIS (2001c), Lowe (2002), Segoviano and Lowe (2002) and, in
particular, Borio (2003). 43 For a discussion of the policy response in Japan see eg Yamaguchi (1999a), Bernanke and Gertler (1999), Cecchetti et al
(2000), Okina et al (2001), Okina and Shiratsuka (2001) and Ahearne et al (2002); for a comparison of the United States and Japan, see BIS (2002a).
44 This point is stressed in eg Bernard and Bisignano (2002). See also Yamaguchi (1999a).

22 BIS Papers No 19
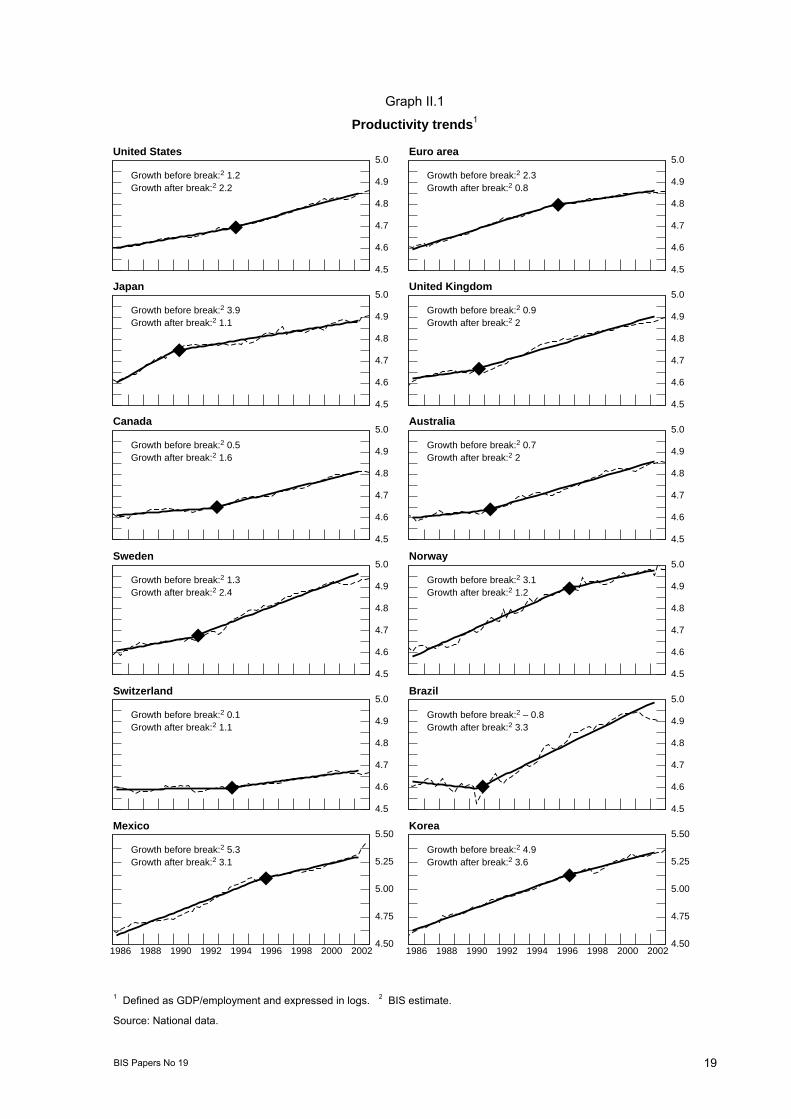
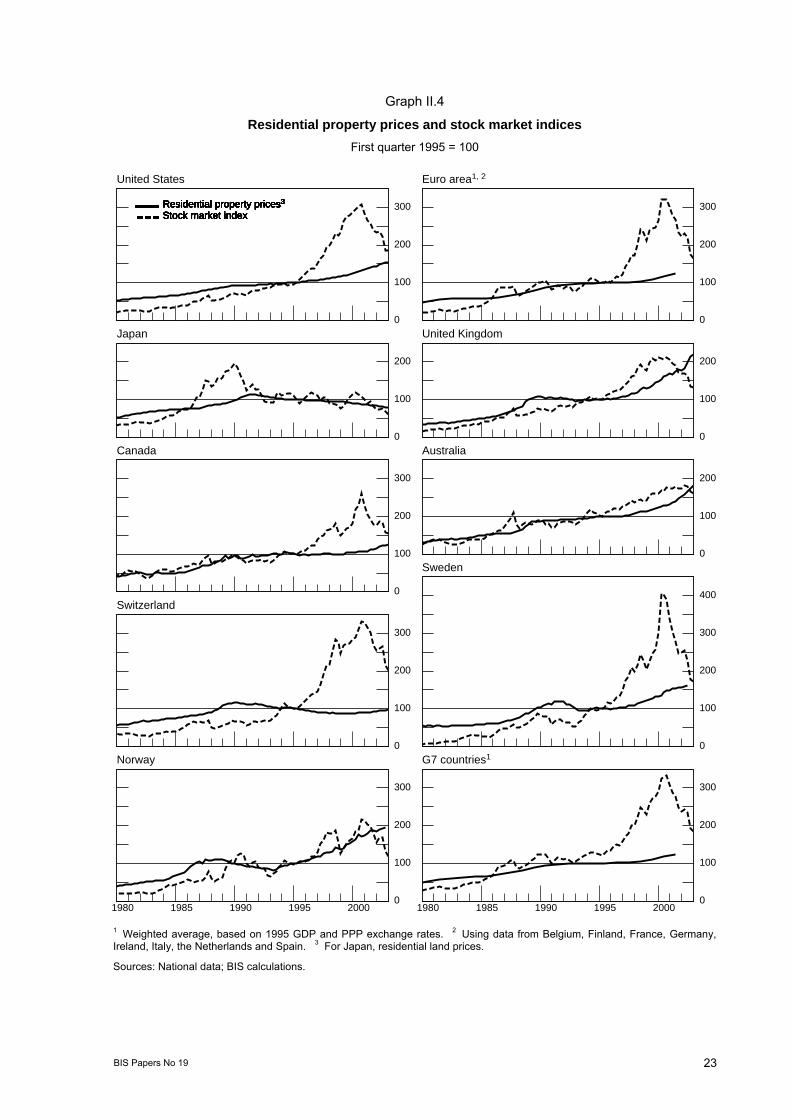
The second development has been the unusual behaviour of key components of aggregate demand against the background of a rather uncharacteristic configuration of levels of indebtedness and asset prices. In particular, while investment spending has plummeted, household expenditure has held up remarkably well by past standards (Graph II.3). Household spending on consumption and housing has been sustained by the prompt easing of monetary policies and a continued rise in residential property prices.45 In the light of the historically high levels of household indebtedness and comparatively high residential property prices in several countries (Graphs II.4 and II.5), questions have been raised about the sustainability of the recovery and the effectiveness of monetary policy when faced with such an unbalanced composition of spending.
Finally, generally subdued inflation rates, with prices actually falling in some sectors, and low interest rates have raised the prospect of the zero lower bound constraint becoming more of a consideration in the setting of policy. The synchronised weakness in the global economy has complicated matters further. Under these conditions, there is less scope for monetary policy to stimulate growth through the exchange rate channel, since the instrument is less effective at the global level. The reason is that a lower exchange rate for one country means a higher one for another, only reallocating demand rather than increasing it, unless it induces expansionary policies in those countries experiencing the appreciation.
Graph II.3
The latest G7 business cycle in perspective1
100
105
110
100
105
110
115
100
105
110
115
120
t–12 t–8 t–4 t t+4 t+880
85
90
95
100
105
t–12 t–8 t–4 t t+4 t+8
GDP Private consumption
Business fixed investment
Residential investment
Trough date: fourth quarter 2001Average of the past2
Note: t = time in quarters. 1 Value of series 12 quarters prior to the trough date is rebased to 100. 2 Using third quarter 1982 and fourth quarter 1974 as the trough dates.
Source: National data.
45 These issues are discussed in more detail in BIS (2002b) and, more recently, in Sutton (2002), Deep and Domanski (2002),
Canner et al (2002) and Zhu (2002).
BIS Papers No 19 23
Graph II.4
Residential property prices and stock market indices First quarter 1995 = 100
0
100
200
300Residential property prices3
Stock market index
0
100
200
300Residential property prices3
Stock market index
0
100
200
Residential property prices3
Stock market index
0
100
200
Residential property prices3
Stock market index
0
100
200
300
Residential property prices3
Stock market index
0
100
200
Residential property prices3
Stock market index
0
100
200
300
Residential property prices3
Stock market index
0
100
200
300
400
Residential property prices3
Stock market index
0
100
200
300
1980 1985 1990 1995 2000
Residential property prices3
Stock market index
0
100
200
300
1980 1985 1990 1995 2000
Residential property prices3
Stock market index
United States Euro area1, 2
Japan United Kingdom
Canada Australia
Switzerland
Sweden
Norway G7 countries1
1 Weighted average, based on 1995 GDP and PPP exchange rates. 2 Using data from Belgium, Finland, France, Germany, Ireland, Italy, the Netherlands and Spain. 3 For Japan, residential land prices.
Sources: National data; BIS calculations.
24 BIS Papers No 19
III. Two alternative views
Central banks can differ in their evaluation of recent economic developments, structural changes and their policy implications. In order to highlight possible alternative assessments, in this section we outline two very different, intentionally polarised, views.
The first is the “continuity” view, in which the central bank, while acknowledging the changes that have occurred of late, interprets them essentially as unusual “shocks” in the context of a fairly stable macroeconomic environment or “model of the economy”. Such a traditional view implies that the central bank is likely to set policy in the future rather as it has in the past, with little change in either strategic or tactical policy approaches as a result of the recent history.
By contrast, in the second, or “new-environment”, view, the central bank sees recent economic developments as related to and reinforcing one another. Taken jointly, they would reflect a qualitative change in the macroeconomic environment. Such a change is not so easily captured by benchmark economic models and can point to a more significant modification to traditional policy guides. Such a central bank is more likely to adjust its beliefs regarding the operation of the economy and to make corresponding changes to its policy approach.
The continuity view
In the continuity view, the recent experience of longer expansions, more volatile financial markets and possible increases in the growth rate of underlying productivity are seen, for the most part, as simply
40
60
80
100United StatesEuro area1 Japan
60
80
100
120United KingdomCanada Australia
0
20
40
60
80
100
120
1980 1985 1990 1995 2000
GermanyItaly Belgium
60
80
100
120
140
160
180
1980 1985 1990 1995 2000
NetherlandsSweden Norway
Graph II.5
Household indebtedness As a percentage of disposable personal income
1 Weighted average, based on 1995 GDP and PPP exchange rates.
Sources: National data; BIS calculations.

BIS Papers No 19 25
reflecting the specific configuration of exogenous “shocks” hitting economies against the background of a broadly invariant set of structural relationships. Shocks vary in terms of their nature and the persistence of their effects. But, by and large, there is no major reason why they are likely to recur in future.46
In this view, the basic model of the economy through which developments are interpreted need not be changed much. In particular, growth in aggregate demand outpacing that of supply, and so a wider output gap, is seen as generating heightened upward pressure on prices. Price increases would tend to materialise with lags that, by and large, have not significantly changed. Analytically, this type of view tends to rely heavily on models where there is a close correlation between output gaps and inflation and where the inflation rate itself is a key (in some cases sufficient) statistic reflecting “distortions” in the economy.47
The task of the central bank in this world is well known. Simplifying somewhat, in order to keep inflation under control, around a formal or informal target level, the central bank keeps demand growing in line with potential while being mindful of possible untoward cost-push pressures. In turn, and crucially, the failure of inflation to rise or fall can be seen as a useful cross-check of estimates of excess demand and supply.48
In such a view, the role of financial developments in policy decisions is fairly modest. It reflects primarily the marginal contributions that such variables make to forecasts of output and inflation over a policy horizon of one to two years. For example, rapid growth of money or credit aggregates might be read as suggesting possible incipient inflation pressures, but because such indicators have been less useful in recent years as aides to forecasting, they might well be discounted. Similarly, possible financial imbalances, including rising household or business debt burdens, might be seen as suggesting downside risks to the outlook, but they would not generally be expected to play a central role. Indeed, in a period of rapid non-inflationary growth, high investment and strengthening productivity gains, faster debt growth might be seen as justified by more rapid anticipated growth in incomes and higher returns on investment.
Looking back at developments in recent years, a central bank with this view might well consider the financial booms and busts, including financial distress, and associated fluctuations in credit and investment to have been largely the result of idiosyncratic factors, specific to the countries affected. Examples include deficiencies in the economic and financial infrastructure and/or inevitably slow learning in the wake of financial liberalisation. In other words, it would probably tend to regard these developments as episodic or exceptional rather than as tied to the general characteristics of the environment.
The continuity view also has implications for the type of questions to which answers would be sought. For example, policymakers with this perspective might more naturally focus on understanding the reasons for the low output volatility in many industrialised countries in recent years than those for the increased volatility in economies experiencing severe financial strains.49 Likewise, they might devote
46 This very common view of the business cycle, which emphasises the size and persistence of exogenous shocks, harks back
to Frisch (1933). 47 Here “distortions” should be interpreted as departures from economic efficiency, normally measured as departures from an
equilibrium in which prices are fully flexible. The most popular example is the family of so-called New Keynesian models; see eg Woodford (2002) and Clarida et al (1999).
48 Given the basic model of the economy adopted, it is not surprising that central bank behaviour has often been summarised through simple rules where the policy rate responds to output gaps and inflation. In the literature, rules drawn from this family have also frequently been employed to assess the optimality of policy, as in eg Taylor (1999). Of course, even their reasonable success in approximating policy by no means implies that this is the strategy that central banks follow ex ante. The analysis of inflationary pressures goes well beyond what can be captured by such simple relationships. On these, see, in particular, ECB (2001), which addresses the role of simple rules, and ECB (2000) more specifically on the issues concerning the measurement and usefulness of the concept of the output gap.
49 There is, in fact, a considerable amount of research trying to understand the factors behind the comparatively low volatility of output in some of the industrialised countries over the last decade or so, mostly dealing with the US experience. Answers so far have focused primarily on a more favourable environment, in the form of positive or smaller exogenous shocks (eg Stock and Watson (2002) and Ahmed et al (2002)), structural changes such as better inventory management (eg Kahn et al (2002) and Edge and Laubach (2002)), better monetary policy (eg Clarida et al (2000)) and lower inflation (Blanchard and Simon (2001)). Lower inflation and better monetary policy have been stressed especially in the context of cross-country studies.

26 BIS Papers No 19
considerable attention to developing better estimates of output gaps, especially in the context of uncertainty surrounding productivity shocks.50
The new-environment view51
By contrast, the “new-environment” view sees many of the recent developments as interrelated and potentially forming a novel backdrop for policy. This view emphasises endogenous forces in the system rather than external shocks. And it stresses the conjunction of three factors taking shape over the last decade or so: liberalised financial markets, low and stable inflation - underpinned by higher credibility of central banks’ anti-inflation commitment - and positive supply side developments.
According to this view, financial liberalisation has meant that the financial system can more easily accommodate, and reinforce, fluctuations in economic activity. The financial system can act as an amplifying factor as a result of powerful procyclical forces. In the wake of liberalisation, this view sees access to external finance as more plentiful and more intimately driven by perceptions of, and appetite for, risk. And these can move strongly in sympathy with economic activity. Hence the highly procyclical nature of credit, asset prices and market indicators of risk, such as credit spreads. Thus, during booms, virtuous circles can develop, consisting of higher asset prices, muted risk perceptions, weakening external financing constraints, possibly an appreciating currency, greater capital deepening, rising productivity and higher profits. These processes then go into reverse during contractions.
While such processes are a natural element of all business fluctuations, they can also go too far, if the system lacks sufficient built-in mechanisms to prevent it from becoming overstretched. In these instances, masked by benign economic conditions, financial imbalances and associated distortions in the real economy build up and the economy grows at an unsustainable pace. Unless sufficient defences are put in place during the upswing, the subsequent unwinding of such imbalances, and associated distortions in the real economy, can raise the risk of a substantial economic downturn, typically reinforced by financial strains. Ironically, this may be more likely to occur in the wake of positive developments on the supply side. These can justify the belief in permanently higher growth prospects and go hand in hand with heavy capital accumulation and hence endogenous improvements in productivity, profits and more attenuated upward pressure on prices.
In this view, the success in attaining and maintaining low inflation, and the resulting increase in the perceived credibility of central banks, play a subtle role. On the one hand, this success has eliminated an important source of misallocation of resources and of financial instability. Obvious examples include real estate booms driven by attempts to hedge inflation risk, incentives to increase debt because of the interaction of inflation with the tax code, sharp increases in interest rates aimed at quelling inflation and broader inflation-induced distortions in the economy. On the other hand, it has contributed significantly to the attenuation of the inflation process. Under these conditions, excess aggregate demand may tend to be reflected in higher inflation more gradually than in the past.52 Not least, prices and wages may be less likely to rise if economic agents feel that the authorities will not accommodate the increases. And in the absence of overt inflation, policy rates may fail to rise
50 For the importance of output gaps and changes in productivity trends for monetary policy, see Orphanides (2000). 51 Various elements of this view have been articulated more fully in Borio and Lowe (2002a, 2003) and Borio et al (2001). In
fact, this view has very old roots, although some of its aspects have been formalised only recently. For example, the Austrian school, with its emphasis on the role of credit in generating or supporting unsustainable booms, through their interaction with capital formation, is relevant here (eg von Mises (1912) and Hayek (1933)). In Schumpeter (1939) innovations played a much more integral role in business fluctuations. Pigou (1929) emphasised misperceptions of risk, while Kindleberger (1996) and Minsky (1982) took the potential destabilising role of finance much further. Fisher (1932) stressed the debt deflation dynamics following booms. More recent work has formalised the amplifying role of financial factors, seen as a mechanism that increases the persistence of financial shocks, drawing on the asymmetric information literature (eg Bernanke et al (1999b) and Kiyotaki and Moore (1997)). In contrast to the Frischian view of business cycles, which focuses on exogenous shocks, the emphasis of the new-environment perspective on endogenous processes is more in line with the Burns and Mitchell (1946) NBER tradition, which highlights the interaction of profits, investment and credit (see, in particular, Zarnowitz (1992, 1999)). See also Stock and Watson (1991), Hamilton (1989) and Filardo and Gordon (1999) for empirical attempts to distinguish between these two types of business cycle using modern econometric methods.
52 In an otherwise standard macro model, Amato and Shin (2003) show how inflation may actually provide a distorted signal of underlying developments in the economy in the presence of differential information (lack of “common knowledge”).
BIS Papers No 19 27
sufficiently promptly to restrain the growth of imbalances in the economy. Moreover, there may be a risk that the very belief in the stability of the inflation process adds credence to the sustainability of the boom, by removing the most typical cause of the end of expansions.53,54
At least five distinguishing characteristics of this view stand out.
First, the role it assigns to financial imbalances is potentially much greater than in the continuity view, and the risks that they are seen as raising may be very different. In the new-environment view, developing financial imbalances, if they appear to be fairly large, provide critical additional, and hence complementary, information about the likely future pressures on the economy. This information would not be available from traditional indicators of inflation pressures, since those indicators generally focus on the current and near-term degree of pressure on resources rather than on the pressures that might develop further out in the future, as financial imbalances unwind. Indeed, because such an unwinding could have a substantial negative impact on spending by trimming asset prices and adversely affecting intermediaries and funding markets, the real risk to which large financial imbalances may point is economic weakness and, with inflation initially low, possibly deflation.
Second, monetary policy can play an important enabling role in the process. If the monetary reaction function of the authorities does not respond to financial imbalances as they build up unless excess demand pressures are seen as raising significant inflation risks, then the central bank may unwittingly accommodate an unsustainable boom in the economy. In this sense, monetary policy may fail to be sufficiently pre-emptive.
Third, from this perspective the credibility of the central bank’s anti-inflation commitment can be a double-edged sword. On the one hand, the credibility reinforces other structural factors that may put a lid on inflationary pressures. On the other, with longer-term inflation expectations better anchored around the central banks’ inflation objectives, unsustainable booms may take longer to show up in overt inflation. This “paradox of credibility” means that the central bank can be a victim of its own success.55 Conquering inflation can contribute to changes in the dynamics of the system that can mask the risks facing the economy.
Fourth, evidence of low short-term output volatility is not necessarily inconsistent with the new-environment view. Indeed, fluctuations where financial imbalances play a larger role would typically be characterised by a prolonged and sustained upswing, which would allow and encourage the build-up of imbalances. If the data are predominantly drawn from such periods, short-term output volatility can easily be lower compared with a sequence of more traditional cycles.
Finally, in the context of business fluctuations the two views stress different sources of “distortions” in the functioning of the economy and hence of welfare costs. The continuity view emphasises those from misalignments in relative prices of goods and services at a point in time, arising, for instance, from sticky prices. These distortions would disappear if inflation was zero. In this sense, and as a first
53 Note that this argument is quite different from the traditional one stressing the role of money illusion during the shift from an
inflationary to a low-inflation environment. That argument emphasises the notion that agents may mistake nominal for real returns, and hence overestimate earnings and underestimate real debt burdens, thereby fuelling a credit-asset price boom - in effect, the mirror-image of the hypothesis used by Modigliani and Cohn (1979) to explain “excessively” low equity returns in the 1970s. This mechanism, though, may well have played a significant role during the disinflation phase and its aftermath. On this, see also McCauley et al (1999).
54 It is worth stressing that, just as the continuity view would not rule out financial imbalances altogether, so the new-environment view would by no means contend that all cycles exhibit the same characteristics. Moreover, as the historical evidence amply demonstrates, and for very good reasons, high inflation can promote financial instability, especially in the wake of financial liberalisation. Rather, the point here is that the conjunction of liberalised financial markets and low and stable inflation can make the system more vulnerable to booms and busts of the kind described unless monetary policy is somehow capable of taking into account the altered balance of risks in the new environment. Moreover, as noted, prudential policy also has an important role to play as a first line of defence, and could relieve the burden on monetary policy, but this aspect is not discussed here.
55 This paradox is discussed in Borio and Lowe (2002a, 2003), but elements can also be found elsewhere, notably in Goodfriend (2000a). See also Amato and Shin (2003), who show that in a model without common knowledge the public signal (assumed credible) provided by the central bank about the state of the economy (eg inflation outlook) could excessively condition private beliefs, thereby distorting the information that actual inflation would convey about the true underlying state of the economy (eg excess demand).

28 BIS Papers No 19
approximation, inflation could even be said to a sufficient statistic for them.56 By contrast, the new-environment view emphasises those distortions impinging on intertemporal consumption/investment decisions, which would manifest themselves in financial imbalances.57 These are seen as having larger costs in terms of consumption/output over time over the region of likely inflation rates in the current policy regime.58
Looking back at the experience in recent years, the new-environment view would detect the symptoms of a gradual change in the dynamics of the economy. The experiences in Japan, some countries in East Asia and, in several respects, recent developments in the United States and hence in the global economy share a common characteristic: investment-led booms that were reinforced by financial developments and that did not end up with rapidly rising inflation. In those cases where financial imbalances grew sufficiently large and unwound in a disruptive way, financial strains emerged, helping to put downward pressure on prices.59
The new-environment view sees the parallel with the economic environment under the gold standard mentioned earlier as far from purely coincidental or of little relevance for today. As noted, at that time, too, inflation was generally low and expected to remain low while financial markets were lightly regulated and globally integrated. And occasionally, new technologies (eg railways, the electric motor) offered large but difficult-to-estimate returns to investors.60 In that environment, financial imbalances were a prominent feature of the economic landscape, and often led both to international and to domestic crises with significant macroeconomic effects.61 For instance, the US stock market and real estate booms of the late 1920s - like the more recent Japanese experience - were followed by a period of protracted economic weakness and deflation.
IV. Policy implications
As can be seen, the two views of recent events and the dynamics of the economy suggest somewhat different policy prescriptions with regard to the identification of inflationary and deflationary pressures and the appropriate monetary policy response. These differences revolve largely around the role played by financial imbalances in the policy framework. They are arguably sharper, or more controversial, in the phase when financial imbalances are building up than when they are unwinding.
56 This is, of course, an oversimplification, which holds only in certain models. For instance, movements in output or the output
gap are, to some extent, presumed to reflect distortions independently of inflation. Furthermore, wage inflation more directly can represent distortions related to incomplete nominal wage adjustment. However, to a first approximation, the absence of low and stable inflation is largely indicative of the main welfare losses in a common class of models with microeconomic foundations designed to shed light on the proper role of monetary policy.
57 In other words, investment is put in place to meet future demand that subsequently fails to materialise. These distortions could be mainly sectoral (eg a construction boom) or more generalised. In an essay in its Annual Report, the Federal Reserve Bank of Cleveland (1998), drawing on work by Robertson (1926), also cautions against the risk of giving excessive weight to low and stable inflation as a signal that the economy is expanding at a sustainable pace in the presence of signs of financial imbalances. The corresponding historical debate on the value of “productivity norms” is reviewed in Selgin (1997).
58 As a result, capturing these costs rigorously would arguably require going beyond mainstream models, where distortions in intertemporal saving/investment decisions are ruled out by the joint assumptions of a representative agent and rational expectations. Such alternative models may well be capable of representing the economic processes consistent with the new-environment view without necessarily appealing to elements of bounded rationality or even to transitional learning. For example, research indicates that rational departures of asset values from fundamentals can be sustained in the context of short horizons (linked to principal/agent problems) and lack of common knowledge (eg Allen and Gale (2000), Allen et al (2003) and Abreu and Brunnermeier (2003)). At the same time, the asymmetric nature of the boom-bust fluctuations could be grounded on features of financial markets and the economy. For example, short selling constraints (which might be justified on the basis of asymmetric information and concerns with counterparty/credit risk) may make positive departures from fundamentals more likely than negative ones (eg Carey (1990)). Similarly, the natural non-linearities linked to balance sheet constraints, the zero lower bound on interest rates and capital overhangs could explain specific characteristics of the busts. Needless to say, incorporating all of these features in a macro model represents a major challenge.
59 This excludes the comparatively short bursts of inflation following some currency crises. 60 For instance, see David (1990) on the importance of the adoption of the electric dynamo. 61 Goodhart (2003) and Goodhart and De Largy (1999), among others, have stressed this point.

BIS Papers No 19 29
While the imbalances are still building, the new-environment view might well suggest a more purposeful response with a view to restraining the cumulative process. Once imbalances begin to unwind, and particularly if they do so in an abrupt and disorderly manner, the new-environment view may lead to a somewhat prompter and more intense policy easing in order to blunt the effects of the unwinding on the aggregate economy.
Policy while imbalances are developing
In the continuity view, a boom in financial markets would be seen as likely to contribute to stronger aggregate demand, leading in turn to pressures on resources that would need to be countered by monetary policy to avoid a build-up of inflation pressures.62 The size of the appropriate policy tightening would depend on the perceived effects of the financial market imbalances on aggregate demand, primarily through cost of capital effects on investment spending and wealth effects on household expenditures.
In practice, however, the effects of the cost of capital on investment are difficult to pin down,63 and wealth effects on household spending have also proved difficult to estimate, especially in the case of residential real estate.64 As a result, policymakers might wish to wait until measures of resource use or actual price rises suggest increased inflation pressures. If in a particular period of rapid expansion and high resource use inflation pressures remained in check, perhaps because of well anchored inflation expectations and robust investment and underlying productivity growth, then the perceived need for policy tightening would be diminished, and policy might well remain on hold for a considerable period. Even if financial imbalances were increasing, policymakers would be unlikely to change policy so long as growth and inflation were well behaved.
If the imbalances eventually became large enough to be seen as a risk to the outlook, policymakers might wish to take actions to help support the resiliency of the financial system in the event of a rapid unwinding. Such actions might include public statements warning of the potential risks, as well as efforts to ensure the quality of prudential supervision. In addition, the central bank would be ready to ease policy if needed and to provide liquidity in the event of financial market turbulence.
At least three factors explain the central bank’s reluctance to respond to the imbalances by tightening policy with a view to containing them.65
First, as noted, according to the continuity view it is very difficult to identify financial imbalances with a sufficient degree of confidence. The fundamental problem is that financial market participants have access to roughly the same information as policymakers and are presumably investing their funds rationally. Thus, in concluding that there were significant imbalances, policymakers would have to believe that their judgment was better than that of millions of investors who have their own money on the line. Presumably such a judgment would require a high level of proof.66 Moreover, this view would
62 To varying degrees, elements of this view can be found, for instance, in Bernanke and Gertler (1999), Vickers (1999b),
Meltzer (2003), Mishkin (2003), Goodfriend (2003), Svensson (2002), Greenspan (1999, 2002) and Bernanke (2002a). Not infrequently, the question is put in terms of the appropriate response to asset price “bubbles”.
63 See Clark (1979, 1993). 64 For recent analyses of the effects of household wealth on consumer spending, see Davis and Palumbo (2001) and Dynan
and Maki (2001). The effects of residential real estate are more complicated because higher house prices both raise wealth and boost the cost of housing. The effects are not necessarily offsetting, however, because some households expect to sell their houses and move to smaller ones in the future, so that they can begin to spend more now. See Lehnart (2002) and Case et al (2002) for recent estimates. Housing wealth may also affect consumption through its use as collateral (Lustig and Van Nieuwerburgh (2002)).
65 In this volume, Lim discusses the difficulties of identifying asset price bubbles and responding to them through monetary policy in Korea.
66 One possible exception would include cases in which the incentives of investors were distorted by government interventions or other factors. For example, mispriced deposit insurance or implicit government backing may lead some investors to provide funds to intermediaries at rates that do not reflect the risks taken by those intermediaries. As a result, intermediaries may take on excessive risk, trimming spreads on riskier credits and potentially distorting the pattern of investment. Both the intermediaries and their customers may thus be more likely to fail than would be the case without the government intervention, potentially increasing the risks of a financial crisis with adverse effects on the real economy. However, in such cases, rather than using monetary policy in an attempt to limit the growth of imbalances, a policymaker would be inclined to

30 BIS Papers No 19
stress that not all financial imbalances need be disruptive: some could unwind in a gradual and benign way if action is not taken, making the expected costs of waiting relatively small. Finally, for much the same reasons, even if the imbalances were identifiable in principle, a sufficiently firm judgment would be unlikely to be reached early enough to justify a policy tightening. Indeed, by the time this judgment was formed, the risk of a spontaneous unwinding, coupled with the lags associated with monetary policy, might make a tightening counterproductive.
A second factor militating against a response is a concern about its effects, specifically about the risk of causing more volatility in the economy, rather than mitigating it. The financial imbalance may be rather unresponsive to policy actions: speculative pressures could be too strong and expected returns too high. As a result, attempts to restrain them could derail other, more expenditure-sensitive, sectors, causing the very recession that policy was designed to avert.
This type of concern has been formalised recently in a fairly standard empirical model of the US economy, where a close relationship exists between output gaps and inflation, augmented by exogenous “near rational” bubbles in stock prices.67 The results suggest that central bankers who stabilise expected inflation may be better off responding only to the anticipated effects of stock prices on expected future inflation than they would be if they respond to the size of the bubble as well.68
A final consideration is the very difficult political economy issues raised by a tighter monetary policy. If the central bank is successful in constraining financial imbalances, it will, by definition, disappoint the expectations of many investors, and it may be blamed for that disappointment. Indeed, given the likely effects of a tightening on output and earnings, the central bank may not be able to demonstrate convincingly, even ex post, that the action was necessary. Moreover, the decision to tighten when output growth is robust but inflation appears to remain in check would be difficult to justify to the public.69 The conventional argument, that tighter policy is necessary to combat inflationary pressures and permit a longer expansion, might well seem inappropriate if the intent of the policy, at least in the near term, is to slow the economy and initiate the unwinding of the financial imbalances. And if the central bank indicates that it is attempting to slow the economy in order to lower asset prices, the public might well wonder why doing so is desirable given that consumer prices remain stable.
In contrast, policymakers following the new-environment view would be more likely to see growing financial imbalances as a threat to economic stability and to believe that monetary policy can be used to lean against them. Moreover, while recognising the serious political economy constraints, they would not see them as necessarily insurmountable over time.70
As regards identification, the new-environment view would find some support in recent research71 indicating that focusing on the question of whether an asset price bubble is in the making - the most common approach - may not be the best way of posing the problem. According to this research, more mileage can be gained by trying to identify the configuration of symptoms that may foreshadow future generalised financial distress, with significant macroeconomic costs. This work suggests that
address the distortions directly, for example by changing the faulty regulations, or to use prudential supervision to limit their effects on the behaviour of individual institutions.
67 See Bernanke and Gertler (1999, 2001). In addition, the model assumes that, conditional on the cost of capital, investment decisions are based on fundamental value considerations only.
68 Of course, even in this model, strictly speaking, fully optimal policy would include a response to the bubble, in so far as this is a state variable (Filardo (1999, 2001)). Bernanke and Gertler’s conclusions are based on the evaluation of a set of “reasonable” simple policy rules. In fact, Cecchetti et al (2000), based on more general policy rules, find that better outcomes can be obtained if monetary policy responds more to stock prices than would be justified by anticipated effects on inflation alone. Bernanke and Gertler (2001), however, question the generality of the results.
69 See, in particular, Yamaguchi (1999a). 70 There is a rather separate literature, not discussed here, also suggesting that it might be appropriate to place a greater
weight on asset prices. This, however, is couched in terms of a redefinition of the inflation index, going beyond an index of the price of currently produced/consumed goods and services. See Alchian and Klein (1973), Goodhart (1995) and, for a short review, Filardo (1999). And even if it is taken as given that the correct measure refers to current services and goods, Goodhart (2001a) has stressed that, in practice, the way housing prices are treated may deviate considerably from the conceptually correct measure, with first order effects on the corresponding price index. While not examined here, this issue deserves greater attention.
71 See, in particular, Borio and Lowe (2002a,b), building on previous work by Kaminsky and Reinhart (1999).
BIS Papers No 19 31
cumulative deviations of asset prices and aggregate private credit from historical trends, especially if also accompanied by cumulative real exchange rate appreciation, can yield reasonably reliable signals of pending financial crises (Box).72 In turn, the financial crises considered are episodes that have been shown to be associated with large output losses.73 In other words, this research suggests that such variables may contain useful information about the sustainability of the expansion and risks to the outlook. These findings also suggest that policymakers might be able to respond to developing imbalances with monetary policy before they reach a stage where a spontaneous unwinding is imminent. To be sure, more work needs to be done in order to make such judgments fully operational. Even so, given that this line of research is in its infancy, considerable scope for improvement would appear to exist.74
Moreover, from the perspective of the new-environment view, the level of proof would not need to be as high as for the continuity view. Even if it was granted that the authorities had information similar to that of market participants, they have different responsibilities and incentives. For one, market participants would not internalise the macroeconomic effects of their collective actions.75 By contrast, the central bank would be expected to weigh the risks to the macroeconomic outlook before taking decisions. And a new-environment perspective would tend to tilt the risks towards action, rather than inaction, given that the occurrence of potentially destabilising financial imbalances is seen as an inherent feature of the economic landscape.
As regards the effects of policy action, since the new-environment view sees a role for monetary policy in accommodating the build-up of financial imbalances, it also more naturally perceives a potential for policy to contain them. The lack of evidence of rising inflation pressures, if it causes policymakers to stay their hand, can contribute to market participants’ beliefs that financial market trends are sustainable. Conversely, by tightening policy pre-emptively, policymakers may be able to limit the build-up of imbalances, and so avoid later volatility. Indeed, by being seen as unwilling to accommodate them, policymakers may help to make such imbalances less likely to emerge in the first place.76 Following a policy tightening, a slowdown in the economy would indeed be envisaged in order to restrain what would be perceived as an unsustainable expansion, much like when the central bank raises interest rates in response to rising inflation. And as in the case of inflation, the induced slowdown today would be seen as a way of avoiding a bigger slowdown in the future.
72 One might also think of using the level of investment or of the capital stock to identify the imbalances. Quite apart from
information lags, however, as described in Borio and Lowe (2002a,b) financial variables appear to outperform investment. Moreover, difficulties in measuring the capital stock make it much harder to rely on this variable, which, at least conceptually, would be superior to the investment flow. The fact that the imbalances may sometimes be concentrated in particular sectors (eg real estate) can complicate matters further. See also Annex 1 on the potential complementary use of measures of the natural rate of interest, possibly to cross-check developments.
73 See, in particular, the work by Hoggarth and Saporta (2001) and Bordo et al (2001). 74 A concern with these types of studies is that the “predictions” of crises are actually made ex post. There is a risk that while
one can develop such indicator models after the fact, it may be much harder to do so in advance. For example, indicators of coming financial crises identified before the Asian crisis were not very helpful in anticipating it (Furman and Stiglitz (1998) and Corsetti et al (1999)). One possible reason for this difficulty is that to the degree that policymakers and market participants learn from past experiences of market excess, they would presumably be less likely to make the same mistakes again. But they may well make new ones. As a result, indicators of past crises may well not be of as much use when employed to forecast future crises. Thus, policymakers cannot focus solely on the sources of past imbalances, but also need be on the lookout for new and unexpected sources of vulnerability. Such a broader focus complicates further the identification of excesses to which policy should respond.
75 Partly because of these different incentives and constraints, a new-environment perspective would also more naturally highlight those forces in financial markets that would tend to generate destabilising behaviour and prevent the correction of overvaluations, even if perceived. The possible factors range widely, including biases in the assessment of risk, wedges between individual and “collective” rationality and constraints on arbitrage. These mechanisms may result in excessive procyclicality of the financial system. For an elaboration, see eg Borio et al (2001).
76 See eg Blanchard (2000).
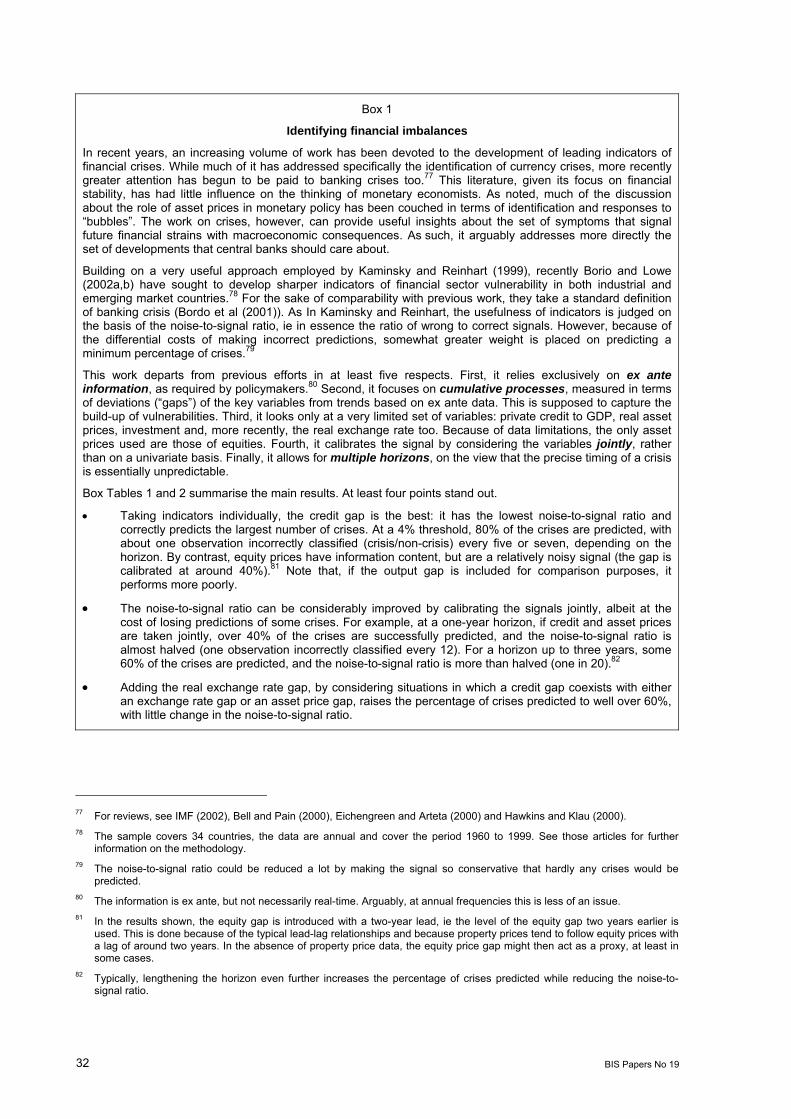
32 BIS Papers No 19
Box 1
Identifying financial imbalances
In recent years, an increasing volume of work has been devoted to the development of leading indicators of financial crises. While much of it has addressed specifically the identification of currency crises, more recently greater attention has begun to be paid to banking crises too.77 This literature, given its focus on financial stability, has had little influence on the thinking of monetary economists. As noted, much of the discussion about the role of asset prices in monetary policy has been couched in terms of identification and responses to “bubbles”. The work on crises, however, can provide useful insights about the set of symptoms that signal future financial strains with macroeconomic consequences. As such, it arguably addresses more directly the set of developments that central banks should care about.
Building on a very useful approach employed by Kaminsky and Reinhart (1999), recently Borio and Lowe (2002a,b) have sought to develop sharper indicators of financial sector vulnerability in both industrial and emerging market countries.78 For the sake of comparability with previous work, they take a standard definition of banking crisis (Bordo et al (2001)). As In Kaminsky and Reinhart, the usefulness of indicators is judged on the basis of the noise-to-signal ratio, ie in essence the ratio of wrong to correct signals. However, because of the differential costs of making incorrect predictions, somewhat greater weight is placed on predicting a minimum percentage of crises.79
This work departs from previous efforts in at least five respects. First, it relies exclusively on ex ante information, as required by policymakers.80 Second, it focuses on cumulative processes, measured in terms of deviations (“gaps”) of the key variables from trends based on ex ante data. This is supposed to capture the build-up of vulnerabilities. Third, it looks only at a very limited set of variables: private credit to GDP, real asset prices, investment and, more recently, the real exchange rate too. Because of data limitations, the only asset prices used are those of equities. Fourth, it calibrates the signal by considering the variables jointly, rather than on a univariate basis. Finally, it allows for multiple horizons, on the view that the precise timing of a crisis is essentially unpredictable.
Box Tables 1 and 2 summarise the main results. At least four points stand out.
• Taking indicators individually, the credit gap is the best: it has the lowest noise-to-signal ratio and correctly predicts the largest number of crises. At a 4% threshold, 80% of the crises are predicted, with about one observation incorrectly classified (crisis/non-crisis) every five or seven, depending on the horizon. By contrast, equity prices have information content, but are a relatively noisy signal (the gap is calibrated at around 40%).81 Note that, if the output gap is included for comparison purposes, it performs more poorly.
• The noise-to-signal ratio can be considerably improved by calibrating the signals jointly, albeit at the cost of losing predictions of some crises. For example, at a one-year horizon, if credit and asset prices are taken jointly, over 40% of the crises are successfully predicted, and the noise-to-signal ratio is almost halved (one observation incorrectly classified every 12). For a horizon up to three years, some 60% of the crises are predicted, and the noise-to-signal ratio is more than halved (one in 20).82
• Adding the real exchange rate gap, by considering situations in which a credit gap coexists with either an exchange rate gap or an asset price gap, raises the percentage of crises predicted to well over 60%, with little change in the noise-to-signal ratio.
77 For reviews, see IMF (2002), Bell and Pain (2000), Eichengreen and Arteta (2000) and Hawkins and Klau (2000). 78 The sample covers 34 countries, the data are annual and cover the period 1960 to 1999. See those articles for further
information on the methodology. 79 The noise-to-signal ratio could be reduced a lot by making the signal so conservative that hardly any crises would be
predicted. 80 The information is ex ante, but not necessarily real-time. Arguably, at annual frequencies this is less of an issue. 81 In the results shown, the equity gap is introduced with a two-year lead, ie the level of the equity gap two years earlier is
used. This is done because of the typical lead-lag relationships and because property prices tend to follow equity prices with a lag of around two years. In the absence of property price data, the equity price gap might then act as a proxy, at least in some cases.
82 Typically, lengthening the horizon even further increases the percentage of crises predicted while reducing the noise-to-signal ratio.

BIS Papers No 19 33
• The size of the optimum thresholds and the predictive performance are broadly similar across the group of industrial and emerging market countries. However, equity prices appear to perform relatively better for industrial countries, and the exchange rate for emerging market countries, at least over short horizons. This is consistent with the greater importance that the exchange rate tends to play in the latter group. In fact, for industrial countries, once the equity price is included, the exchange rate does not appear to add any useful information.
These set of results suggest a number of conclusions. First, focusing on asset prices per se and the question of whether a “bubble” is in train may not be the most useful way of phrasing the question. A combination of symptoms does a better job of assessing the risk of subsequent strains. Second, at least at annual frequencies, the output gap is a poor indicator of unsustainable booms and future financial distress. Since this distress tends to accompany severe economic weakness, information that may be useful to frame monetary policy decisions could be missed. Indicators of financial imbalances appear to contain such additional information. Finally, the findings could be interpreted as saying that it should be possible to form judgments about the build-up of vulnerabilities with a reasonable degree of confidence. However, obviously more work needs to be done in order to provide a sounder and operational basis for policy decisions.
Box Table 1
Indicators of banking crises: all countries
Single indicators (gaps)1 Joint indicators (gaps)1
Credit3 (4) Asset price4 (40) Exchange rate5 (7) Output (2) Credit (4) and
asset price (40)
Credit (4) and (asset price (40) or exchange rate
(9))
Horizon (years)2
Noise/ signal
% crises predicted
Noise/ signal
% crises predicted
Noise/ signal
% crises predicted
Noise/ signal
% crises predicted
Noise/ signal
% crises predicted
Noise/ signal
% crises predicted
1 0.23 80 0.35 50 0.31 0.55 0.57 28 0.14 43 0.13 63
2 0.20 80 0.24 65 0.28 0.55 0.39 38 0.08 55 0.10 68
3 0.18 80 0.19 73 0.26 0.58 0.34 40 0.06 60 0.08 70
1 A gap is measured as a percentage point or percentage deviation from an ex ante, recursively calculated Hodrick-Prescott trend; the size of the threshold is shown in brackets. 2 A signal is correct if a crisis takes place in any one of the years included in the horizon ahead. Noise is identified as mistaken predictions within the same horizon. Given the data frequency and difficulties in assigning crises to a specific date, year one includes, in addition, the current year. 3 Credit is measured as the ratio of private sector credit to GDP. 4 Real equity price index. 5 Real effective exchange rate.
Source: Borio and Lowe (2002a,b).
Box Table 2
Indicators of banking crises: industrial and emerging market countries
Industrial Emerging market
Credit (4) and asset price (40)
Credit (4) and exchange rate
(4)
Credit (4) and (asset price (40) or exchange rate
(20)1)
Credit (4) and asset price (40)
Credit (4) and exchange rate
(5)
Credit (4) and (asset price (40) or exchange rate
(13))
Horizon (years)
Noise/ signal
% crises predicted
Noise/ signal
% crises predicted
Noise/ signal
% crises predicted
Noise/ signal
% crises predicted
Noise/ signal
% crises predicted
Noise/ signal
% crises predicted
1 0.09 50 0.11 44 0.09 50 0.23 38 0.15 58 0.16 67
2 0.06 56 0.10 44 0.06 56 0.12 54 0.11 58 0.12 71
3 0.04 63 0.10 44 0.04 63 0.08 58 0.10 58 0.09 75
1 Or higher.
Source: Borio and Lowe (2002a,b).

34 BIS Papers No 19
Some of these points have been formalised in models that, contrary to the more standard ones, allow monetary policy to have an impact on the course of the financial imbalances.83 In these models, the cost of acting pre-emptively is that tighter policy and the unwinding of the current degree of imbalances may cause deviations of output and inflation from the central bank’s goals in the near term. The advantage of doing so is that by ending the imbalances sooner, policymakers can reduce the expected volatility of output and inflation later on, when the by-then larger imbalances ultimately do unwind. Clearly, if the central bank has sufficient confidence in its assessments, both of the existence of the imbalances and of its ability to use policy to influence them, tighter policy could be seen as appropriate.84,85
Technical and operational issues aside, powerful political economy constraints on a more pre-emptive monetary policy stance vis-à-vis financial imbalances remain. From a new-environment perspective, however, these are not seen as exogenous. Rather, they are regarded as reflecting to a considerable extent current thinking about the dynamics of the economy, which determines perceptions of the balance of risks and the likely costs of alternative policy responses. These perceptions would be seen as excessively coloured by the inflationary phase of the postwar period - a phase which, in fact, may be regarded as rather exceptional from a longer-term historical standpoint.86
Policy once imbalances start to unwind
Assuming that imbalances unwind in a costly manner for the economy, the broad contours of the policy response are not all that different across the two views.
Under the continuity view, declines in asset prices and tightening of credit conditions would be interpreted as adverse shocks, and easier policy presumably would be deployed to offset their effects on aggregate demand. The size of the appropriate easing would depend on movements in asset prices and an assessment of the corresponding effects on spending. Any knock-on effects, such as difficulties at some financial institutions or in some financial markets, could be addressed with additional policy action or emergency liquidity provision as seems appropriate.
While the new-environment view sees insufficiently tight policy as partly responsible for the development of imbalances, once those imbalances begin to unwind it may well justify a more rapid and substantial easing of policy in response to the perceived future evolution of the economy and the associated downside risks. Rather than regarding the unwinding of imbalances as one or more isolated shocks, a new-environment central bank would perceive them as part of a sequence of closely linked events. It would see them as reflecting, and potentially leading to, a broad set of related adjustments to financial markets and spending patterns. As a result, it might be more sensitive to a number of possible downside risks to the economic outlook and to the headwinds that could numb the
83 See Kent and Lowe (1997) or (1998). Bordo and Jeanne (2002) reach similar conclusions about the appropriateness of a
policy tightening during the boom in a simple model without an asset price bubble but allowing for the possibility of collateral-induced credit crunches and for the endogeneity of credit and asset prices with respect to monetary policy. Blanchard (2000), too, argues that a monetary response may be appropriate, stressing the compositional aggregate demand effects of the bubble and, in particular, the risk of over-investment; see also eg Chirinko and Schaller (2001) for evidence of the impact of the stock market bubble on investment in Japan. Dupor (2002) and Gilchrist and Leahy (2002) show that in microfounded models with distortions of the type discussed here inflation is not a sufficient statistic for departures from economic efficiency, so that stabilising inflation would not be optimal. Depending on the specific distortion assumed, a response to asset prices over and above their implications for inflation stabilisation may thus be appropriate. In contrast to Dupor, however, Gilchrist and Leahy tend to play down the role of asset prices, noting that other variables would contain the relevant information. Within the central banking community, more recently King (2002), Bean (2002) and Bäckstrom (2002) have not ruled out the possibility of a monetary policy response to the build-up of imbalances. See also Mussa (2003) for a similar position.
84 Ultimately, therefore, the appropriateness of a response depends on beliefs about the “model” describing the behaviour of the economy (including the imbalances) and the degree of uncertainty surrounding those beliefs. This point is clearly illustrated in Filardo (2001).
85 As discussed in more detail in the next section, it is important to note that using policy to respond to financial imbalances does not reflect a desire by the central bank to target financial markets or asset prices per se. Rather, these imbalances are used as important information variables in the context of the overall policy strategy. They are seen as reflecting, and contributing to, distortions in the real economy and, as such, as containing critical additional information about the future behaviour of output and inflation.
86 See Borio and Lowe (2002a) or (2003) for an elaboration of this point.
BIS Papers No 19 35
effects of policy. These could include the reversal of risk perceptions among economic agents, and hence higher risk premia and a more general withdrawal from risk-taking; a deterioration in the balance sheets of borrowers and intermediaries, possibly including serious strains; and sharp declines in (some types of) investment, owing to the overhang of previous capital accumulation.
At the same time, this stronger response by the new-environment central bank would need to be predicated on the belief that the unwinding of imbalances could not be reversed but simply be cushioned by its policy actions. Otherwise, the risk of prolonging imbalances further could restrain its hand.
In fact, a possible implication of the new-environment view is that spending during the recessions and recoveries that follow unsustainable booms may well be unbalanced. To the extent that the preceding boom was investment-driven, the resulting capital overhang would weigh on investment spending once the boom came to an end. Thus, for a time spending would be very dependent on consumption. More generally, the imbalances seen during the boom could be reflected in the sectoral distribution of spending afterwards. As a result, central banks may find that the easing of policy undertaken in response to unwinding imbalances may contribute to the building of new imbalances in other sectors. For example, the rapid easing in a number of countries in past years as imbalances in the technology sector were reversed may have contributed to a run-up in house prices and so to imbalances in that sector that may need to be unwound at some stage. Such unbalanced spending patterns may significantly complicate the calibration of a policy response.
The possible importance of the zero bound
An added concern for policymakers once financial imbalances begin to unwind is that monetary policy may not be sufficiently effective to return the economy to potential because it is constrained by the zero bound on nominal interest rates. This possibility looms larger in the current environment because of the substantial decline in inflation over the past two decades. With actual and expected inflation of 5 or even 10%, as was common 20 years or so ago, the central bank could respond to adverse shocks by cutting the nominal policy rate to a low level, thereby easily generating negative real policy interest rates if (temporarily) needed. By contrast, with actual and expected inflation of only 1 or 2%, if a substantial adverse shock damps output by enough to push inflation to zero or below, and inflation expectations follow, then the central bank might not be able to engineer the required reduction in ex ante real rates even by cutting the policy rate to zero.
Such an adverse outcome would appear more likely in the new-environment view. In the continuity view, hitting the zero bound would require a series of adverse shocks that might seem improbable. By contrast, according to the new-environment view the forces generated by the unwinding of widespread financial imbalances would be expected to reinforce one another, causing a sharper decline in output and inflation. As a result, policymakers would wish to lower the real policy rate further, but with lower actual inflation weighing on inflation expectations, they might not be able to do so.
How important the zero bound constraint is judged to be depends on two assessments by policymakers. First, are very low or even negative real policy rates likely to be necessary to stabilise the economy? And second, is the zero lower bound on nominal interest rates likely to keep policymakers from achieving sufficiently low real rates, if they are called for? The actual behaviour of real and nominal interest rates during past periods of economic weakness may shed light on these two issues.
The behaviour of the real federal funds rate over the postwar period suggests that periods of negative real rates are not exceptional. Graph IV.1 shows two estimates of the real federal funds rate from the mid-1950s to the present.87 By either measure, the real policy rate appears to have been negative during some periods of economic weakness, most notably in the 1970s. While these periods may have reflected in part a sluggish policy response to inflation pressures and, arguably, an undesirably easy
87 One measure uses the actual lagged four-quarter change in the chain-type price index for personal consumption
expenditure as a proxy for expected inflation, while the other uses mean inflation expectations from the Michigan survey. This graph and the next are from English (2000). King (1999) uses the Livingstone survey and the one-year Treasury yield. He finds fewer quarters of negative real rates over a comparable period. However, the one-year rate would fall to zero only if the real funds rate was expected to remain at zero for a year, and the term premium on the one-year bill was zero.

36 BIS Papers No 19
policy stance, they also suggest that policymakers may value the option of generating negative real rates at certain times.
Moreover, with actual and expected inflation well contained, policymakers’ actions may be more likely to be constrained by the zero bound on nominal interest rates. Evidence on the possible role of the zero bound in a low-inflation environment can be gleaned from the behaviour of interest rates during the gold standard era in the United States (1879-1933). As noted earlier, this period was marked by very low average inflation, and expected inflation was probably very low as well.88 Unfortunately, there are no data on short-term Treasury yields before 1920. As a result, Graph IV.2 shows the short-term Treasury rate from 1920 on, and the call money rate over the entire period.89 When the Treasury bill rate was near zero in the 1930s, the call money rate was about 1%, suggesting that the risk premium demanded by those providing call money was about 1%. Over the period from 1879 to 1914, the call money rate fell to about 1% on a number of occasions, generally near NBER business cycle troughs (eg 1885 and 1894). These low call money rates suggest that the zero bound on the short-term risk-free rate may well have been binding in those periods. Of course, there was no central bank in the United States at that time, and it is possible that policymakers could have avoided the zero bound. Therefore, making any inferences about the current environment is hazardous. Nonetheless, these observations might be taken to suggest that the zero bound could constrain central banks that have built solid anti-inflation credentials.
Admittedly, even if policymakers are temporarily constrained by the zero bound, the real policy rate may be low enough to allow the economy gradually to return to potential. However, there is a risk that if the effects of the unwinding of financial imbalances are sufficiently large, the economy could get stuck in a deflationary trap, with output below potential, prices falling and the policy rate at zero.90 To be sure, such an outcome may be unlikely: despite the relevance of the zero bound in the late 19th century, the US economy did not get caught in this way until the 1930s, when policy is thought to have been poor. Nevertheless, the recent Japanese experience suggests that a deflationary trap is more than a theoretical possibility. Such an outcome would presumably be a greater concern from the perspective of the new-environment view.
88 For a discussion of inflation expectations during the gold standard period, see Barsky and DeLong (1991). 89 The call money rate was the rate charged on short-term liquid loans backed by securities. 90 Reifschneider and Williams (2000) have a useful discussion of what is required to tip an economy into a deflationary trap.
– 4
0
4
8
1955 1960 1965 1970 1975 1980 1985 1990 1995 2000
Measures of the real federal funds rate, 1955 Q1-2002 Q2
In percentages
Graph IV.1
Real federal funds rate (PCE Prices) Real federal funds rate (Michigan Survey)
Sources: National data; University of Michigan.
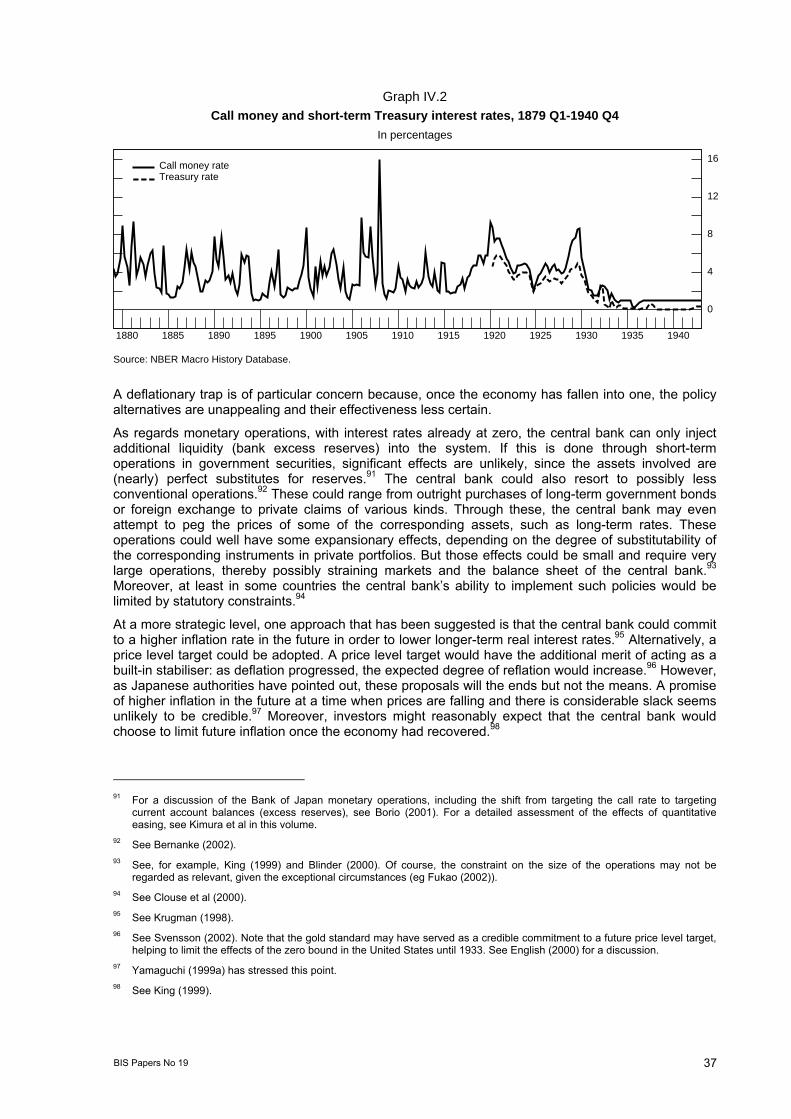
BIS Papers No 19 37
A deflationary trap is of particular concern because, once the economy has fallen into one, the policy alternatives are unappealing and their effectiveness less certain.
As regards monetary operations, with interest rates already at zero, the central bank can only inject additional liquidity (bank excess reserves) into the system. If this is done through short-term operations in government securities, significant effects are unlikely, since the assets involved are (nearly) perfect substitutes for reserves.91 The central bank could also resort to possibly less conventional operations.92 These could range from outright purchases of long-term government bonds or foreign exchange to private claims of various kinds. Through these, the central bank may even attempt to peg the prices of some of the corresponding assets, such as long-term rates. These operations could well have some expansionary effects, depending on the degree of substitutability of the corresponding instruments in private portfolios. But those effects could be small and require very large operations, thereby possibly straining markets and the balance sheet of the central bank.93 Moreover, at least in some countries the central bank’s ability to implement such policies would be limited by statutory constraints.94
At a more strategic level, one approach that has been suggested is that the central bank could commit to a higher inflation rate in the future in order to lower longer-term real interest rates.95 Alternatively, a price level target could be adopted. A price level target would have the additional merit of acting as a built-in stabiliser: as deflation progressed, the expected degree of reflation would increase.96 However, as Japanese authorities have pointed out, these proposals will the ends but not the means. A promise of higher inflation in the future at a time when prices are falling and there is considerable slack seems unlikely to be credible.97 Moreover, investors might reasonably expect that the central bank would choose to limit future inflation once the economy had recovered.98
91 For a discussion of the Bank of Japan monetary operations, including the shift from targeting the call rate to targeting
current account balances (excess reserves), see Borio (2001). For a detailed assessment of the effects of quantitative easing, see Kimura et al in this volume.
92 See Bernanke (2002). 93 See, for example, King (1999) and Blinder (2000). Of course, the constraint on the size of the operations may not be
regarded as relevant, given the exceptional circumstances (eg Fukao (2002)). 94 See Clouse et al (2000). 95 See Krugman (1998). 96 See Svensson (2002). Note that the gold standard may have served as a credible commitment to a future price level target,
helping to limit the effects of the zero bound in the United States until 1933. See English (2000) for a discussion. 97 Yamaguchi (1999a) has stressed this point. 98 See King (1999).
0
4
8
12
16
1880 1885 1890 1895 1900 1905 1910 1915 1920 1925 1930 1935 1940
Call money and short-term Treasury interest rates, 1879 Q1-1940 Q4
In percentages
Graph IV.2
Call money rateTreasury rate
Source: NBER Macro History Database.
38 BIS Papers No 19
Another, possibly complementary, approach would be to push down the exchange rate, or peg it at a depreciated level.99 While the presence of financial sector strains could reduce its effectiveness by dampening the supply response, this strategy could at least boost demand for the tradable sector and improve its profitability. This strategy, however, could be perceived as of the “beggar-thy-neighbour” kind. This could cause frictions with trading partners, especially if undertaken by a large economy and in a context of more generalised economic weakness. Thus, the degree to which the business cycles in various countries are synchronised may influence the ability of a particular country to employ devaluation to combat the zero bound. And to the extent that the globalisation of financial markets has increased the likelihood that financial imbalances affect multiple countries at more or less the same time, there may be less latitude for unilateral exchange rate policy than in the past.
Other, even more extreme, policies have been suggested to escape from a deflationary trap. For example, it has been argued that a tax on the monetary base could, by pushing the bound on nominal interest rates below zero, provide policymakers with greater latitude for policy easing.100 But taxes on currency holdings could adversely affect sentiment, and could also risk damage to the role of currency as the means of payment.101
Such desperate-sounding proposals highlight the potential difficulties the zero bound in the context of a deflationary trap can pose for monetary policymakers. These difficulties, in turn, suggest that other, complementary and mutually reinforcing policies may be appropriate to generate the necessary increase in aggregate demand while relieving supply side constraints.
Fiscal policy is a prime candidate. However, expansionary fiscal policy may not always be feasible or sufficient to bring about a recovery. For example, a country’s ability to employ expansionary fiscal policy as well as its effectiveness would be constrained in the presence of large existing debts. In such cases, further large deficits could even raise concerns about the country’s solvency, in which case the central bank might come under pressure to tighten monetary policy in order to avert a currency crisis and consequent financial market difficulties.102 Any such policy would call for a delicate balancing act between short-run expansionary measures combined with a credible medium-term plan to ensure sustainability of the burden.
A second candidate would be the restructuring of the banking, corporate and possibly household sectors, which are likely to be in distress. Distress can severely impair the intermediation process. By the same token, it can also blunt the effectiveness of other measures to boost aggregate demand.103 Any such restructuring would have to balance the need to redress balance sheets in the short run - calling for some form of direct or indirect recapitalisation - with that of putting in place the conditions for effective and profitable operation in the longer term. This would include, for instance, eliminating excess capacity and establishing incentives for the extension of credit at prices and terms that reflect the underlying creditworthiness of borrowers. As the experience of several countries that have faced widespread financial distress indicates, policies such as these are not easy to decide upon and implement. Quite apart from technical difficulties and the delicate economic trade-offs involved, the necessary political consensus may be lacking.
Given that the zero bound could be a significant problem, how should monetary policymakers take it into account in their behaviour? First, they may wish to set a higher target inflation rate than would otherwise be the case, to provide a buffer relative to the zero bound. Indeed, countries with numerical inflation objectives generally select targets that are above the estimated bias in measures of inflation,
99 Drawing on the experience of the Great Depression, a number of studies have pointed to the effectiveness of exchange rate
devaluations in a similar context, eg Choudhri and Kochin (1980), Eichengreen and Sachs (1985) and Campa (1990). Svensson (2000) has suggested complementing a strategy of exchange rate devaluation with a price level target.
100 See Goodfriend (2000b). The tax could be extended to all government-backed financial assets (Fukao (2002)). 101 On these points, see Mussa (2000b) and Freedman (2000), respectively. 102 In some countries, fiscal policy may also be constrained by institutional mechanisms designed to ensure a degree of fiscal
discipline. The Stability and Growth Pact in Europe has been cited in this context. It should be noted, however, that the Stability and Growth Pact does allow deficits above the 3% of GDP ceiling in exceptional circumstances.
103 Moreover, from this perspective keeping interest rates at zero may even hinder the required restructuring, by reducing incentives to foreclose on insolvent borrowers. On the relationship between monetary policy and structural policies, see Shirakawa (2000) and Yamaguchi (1999b).
BIS Papers No 19 39
thereby providing such a buffer.104 Second, they could try to ensure that the inflation target is seen as symmetrical; in other words they could try as hard to keep inflation from falling below the target as they do to keep it from rising above it. Such a symmetric strategy could help prevent inflation expectations from rapidly falling below the target in the event of an undershooting of actual inflation. To the extent that this effort is successful, inflation expectations may become more symmetrically anchored at the target value, allowing the central bank to reduce real policy rates considerably even following large adverse shocks. Third, policymakers might consider adopting a price level target. However, a significant potential drawback of this strategy is that it could force countries to have negative inflation following inflationary shocks, which could be destabilising.105
Finally, if adverse shocks drive inflation and the policy rate to levels low enough to make the zero bound a more immediate issue, the central bank may wish to react more aggressively to any further negative shocks.106 Given the possibility that the economy could reach and get stuck at the zero bound, the costs of downside surprises to the outlook in such cases are likely to be considerably larger than those of similarly sized upside surprises, suggesting that a non-linear response might be warranted. Moreover, in the new-environment view the unwinding of financial imbalances would be seen as likely to impair the operation of financial institutions and markets, perhaps generating headwinds that would reduce the effectiveness of monetary policy in stimulating the economy. As a result, policymakers, taking account of these possibilities, might well choose to ease policy further than might otherwise have been expected in order to balance the risks to the outlook. Some might argue that it could be better to hold back on policy easing when rates reach low levels in order to “keep the powder dry”. This would allow the central bank to ease policy following any additional adverse shocks that might arise. Presumably the benefit such an approach might offer is that if a new shock were to emerge the announcement of a policy easing would provide support for consumer and business confidence at a critical juncture, thereby making it more effective and valuable. After all, the alternative of easing policy sooner would provide greater support for aggregate demand through the usual transmission mechanism. Even if it were thought likely that policy announcements could play such a useful role, however, holding in reserve an easing of policy that would otherwise be appropriate because of proximity to the zero bound could prove very costly if it allowed the economy to fall into a liquidity trap.107
V. Refining the policy framework?
What are the implications of the above analysis for the adequacy of current policy frameworks? Not surprisingly, they depend in large part on which perspective is taken when assessing the challenges faced by central banks in recent years.
According to the continuity view, no adjustments are really necessary. To the extent that economic developments have resulted from a series of specific shocks to an otherwise stable environment, previous policy benchmarks and guidelines are still reliable. To be sure, central banks may have been confronted with rather large swings in asset prices by past standards. But there is no reason to believe that these are particularly likely to recur in future. Likewise, in those countries most severely affected, the recent series of negative shocks to economic activity could bring the prospect of reaching the zero lower bound for interest rates closer to the radar screen. But even then the risk might be perceived as
104 However, the inclusion of such a buffer probably reflects, at least in part, concerns about downward wage rigidities. For an
analysis, see Akerlof et al (1996). 105 Blinder (2000) notes that the price level target could be an upward-sloping trajectory for the price level. Such a target could
obviate the need to engineer a deflation in most circumstances. 106 This possibility is discussed by Blinder (2000), Freedman (2000) and Viñals (2000). 107 An alternative justification for staying one’s hand might be for “fear of misfiring”. In this case, the central bank might be
concerned about the possibility that reducing interest rates to a level close to the zero bound could actually undermine confidence. This could occur if the public became worried that the central bank was running out of ammunition or interpreted the action as a sign that the situation was worse than anticipated. This justification, while quite distinct, might be observationally difficult to distinguish from the one outlined in the text.
40 BIS Papers No 19
relatively small. After all, historical experience might suggest that, at least given the past history of economic shocks in the postwar period, the probability of reaching the bound is rather low.
The picture looks rather different from the perspective of the new-environment view. According to this, large swings in asset prices and credit are likely to be less rare than in the past, given the conjunction of a liberalised financial environment and low and stable inflation and assuming monetary policy strategies that do not respond explicitly to the build-up of financial imbalances. This environment can make it less likely that unsustainable booms show up in overt inflation, allowing them to expand further, potentially even tilting the balance of risks from inflation towards deflation. As a result, other things equal, financial instability is a more serious concern.
According to this view, it may be important for the monetary framework to allow for a pre-emptive tightening of policy to limit the build-up of financial imbalances even in the absence of obvious inflationary pressures. Could current frameworks accommodate this? In particular, would this require a redefinition of policy goals or just a change in the way present goals are pursued?
It may be natural to think that such a policy would call for the addition of an explicit financial stability objective alongside more traditional macroeconomic ones. Financial imbalances are the harbinger of financial distress down the road. Therefore, a central bank with explicit responsibility for financial stability would have a clearer mandate to respond to their build-up even if monetary stability did not appear to be under threat.
No doubt an explicit financial stability objective would tighten and make more obvious the link between the policy action and the goal. This is because it is easy to see an immediate relationship between financial excesses and financial strains. At the same time, such a redefinition of objectives is not necessary and might not even be desirable for at least three reasons.
The first reason why such a redefinition is not necessary is that central banks have a long-standing legitimate interest in financial stability, which in fact predates their concerns with price stability. As a result, the basis for monetary policy actions to address financial stability concerns already exists. Historically the concern with financial instability loomed large in the early evolution of central banks, if not in their establishment. It was not until the interwar period, with the gradual emergence of fiat-money standards, that price stability assumed an importance of its own. And with the Great Inflation of the postwar era, price stability became an overriding objective. More recently, with financial stability clawing its way back to the top of the policy agenda, central banks have inevitably been playing a leading role in efforts to promote it.108
Indeed, a consensus has emerged over some of the activities that central banks can undertake to support financial stability. Most basically, central banks should promote the establishment and operation of a safe and sound financial infrastructure. Important elements of this infrastructure include the framework of prudential regulation and supervision as well as payment and settlement systems. In addition, central banks can play a critical role in crisis management. A common instrument here is the provision of emergency liquidity assistance. Finally, from a macro perspective, price stability is seen as conducive to financial stability, as it lays the foundation for long-term sustainable growth and, in practice, is associated with lower volatility of inflation.109
The second reason why a redefinition of objectives may not be necessary is that traditional macroeconomic objectives can accommodate the required policy response. Arguably, financial
108 See Goodhart (1988) for a description of the early evolution of central banking and De Kock (1974) for an explanation of the
shift from financial stability to price stability objectives in central bank statutes. Laidler (2001) explains the history of the thinking on the link between monetary and financial stability until World War II; Crockett (2000a), Borio and Crockett (2000) and Borio and Lowe (2002a) provide a stylised perspective on the nexus between monetary and financial stability to the present day. BIS (1997) describes the parallel evolution of central bank involvement in the pursuit of monetary and financial stability since Bretton Woods. See also Padoa-Schioppa (2002).
109 Admittedly, how these general principles translate into practice can differ considerably across countries. One reason is differences in the allocation of specific responsibilities in the various areas impinging on financial stability, including prudential regulation and supervision, payment and settlement systems, market infrastructure and surveillance, and crisis management. Another reason is differences in policymakers’ beliefs about the effectiveness of the various policy options, which are, in turn, strongly influenced by historical experience. For example, there is no agreement on the merits of transparency in emergency liquidity arrangements. Nor, indeed, is there any on the trade-offs between financial and monetary stability responsibilities. As a result, differences in the way the responsibility for financial stability is allocated across institutions in the legal framework can appear bewilderingly large.
BIS Papers No 19 41
instability can best be factored into decisions through its implications for traditional central bank objectives, such as inflation and output.110 Correspondingly, at least from a macroeconomic perspective, financial instability could be best defined as the set of disruptive financial events that could generate macroeconomic costs in terms of those objectives.111 For example, distress among financial institutions would not matter per se, but only if it was associated with output losses and the risk of deflation. In assessing the implications of financial strains, the risk of loss of effectiveness of monetary policy should obviously also be taken into account. As noted earlier, financial distress can generate “headwinds” and, especially if interest rates reach the zero lower bound, the efficacy of the monetary policy levers can be badly impaired, if not crippled. From a new-environment perspective, this definition of financial instability would be sufficient to accommodate a pre-emptive tightening, since financial imbalances would be seen as containing critical information about the balance of risks facing the economy in terms of inflation and output.
Finally, a redefinition of objectives may not be desirable because it could risk placing the central bank under pressure to deviate too much from its macroeconomic goals in order to avoid the possibility of causing financial strains. In particular, central banks could come under unwarranted pressure to ease (or to delay a tightening) in order to address financial strains that would have only limited implications for the macroeconomy. This could in turn raise the risk of encouraging excessively imprudent behaviour - the so-called moral hazard problem. Indeed, as argued elsewhere, and partly for similar reasons, there may be merit in prudential authorities shifting further in the same direction too, away from the pursuit of narrowly interpreted depositor or investor protection objectives.112
While broadly consistent with current central bank mandates, operationally the shift in perspective implied by the new-environment view has somewhat different implications for specific monetary frameworks. The reconciliation is more immediate where the central bank is not pinned down to any numerical objective for inflation over an explicit short-term horizon. At least for communication purposes, in strict inflation targeting regimes with up to two-year horizons the justification of policy actions in response to imbalances may not be straightforward.113 To be sure, it should be well understood by now that as long as inflation is on target the central bank has leeway to pursue other objectives, not least smoothing output fluctuations. But it may be hard to rationalise a tightening in the absence of obvious inflation pressures, especially if the outcome is likely to be inflation below target over the usual horizon.
Arguably, at least two modifications would be called for in this case.114 First, policy decisions should be articulated on the basis of a somewhat longer horizon.115 While the precise timing of the unwinding of imbalances is rather unpredictable, the processes involved tend to be drawn-out ones. For example, the notion of ensuring price stability on a “sustainable” basis might be useful in capturing the prospect of future downward pressure on prices linked with the unwinding.116 The second modification would be to place greater weight on the balance of risks in the outlook, as opposed to central scenarios or most likely outcomes.117 This would highlight the role of monetary policy actions in providing insurance
110 While possibly giving rise to some complications in communicating with the public at large, it is clear that even for inflation
targeting central banks output fluctuations are a consideration - so called “flexible inflation targeting”. These affect the gradualism with which targets are pursued (eg width of the band, length of the horizon, etc). On this, see eg Svensson (1999) and King (1996).
111 This is broadly consistent with Ferguson (2002). 112 See, in particular, Crockett (2000b) and Borio (2003), who contrast such a “macroprudential” perspective with a
“microprudential” perspective of financial stability. Various aspects of this issue are also discussed in BIS (2001c) and Borio et al (2001). Crockett (2001) summarises concisely the implied shift in perspective on the part of both monetary and prudential authorities.
113 For a useful discussion of communication issues in the context of an inflation targeting regime, see Friedman (2002). 114 See also Borio and Lowe (2002a) or (2003) on this. 115 Note that this rationale for lengthening the horizon is quite different from the one normally associated with the inflation
targeting literature, namely, introducing gradualism into policy because of concerns with output fluctuations (eg Svensson (1999)). Rather, it reflects the view that the phenomena in question cannot be adequately captured over short horizons.
116 This notion is put forward in Shiratsuka (2001). 117 Decisions of this kind are formalised, for instance, in Svensson (1999). Less information-intensive decision rules, based on
the notion of minimising the costs of worst case scenarios, have been discussed by, for instance, Courakis (1981), Hansen and Sargent (2001) and Onatski and Stock (2000), typically in the context of model uncertainty.
42 BIS Papers No 19
against costly outcomes. Central banks are already used to thinking in these terms. But the nature of the problem would put a premium on considerations of this kind.118
A related issue is whether policy frameworks in which monetary aggregates still play a prominent role can more naturally accommodate policies aimed at addressing the build-up of financial imbalances. The two-pillar policy of the ECB is a clear case in point. No doubt, such frameworks can make it easier to justify interest rate increases even in the absence of near-term inflationary pressures as long as the corresponding monetary aggregates are growing fast. After all, underpinning a more pre-emptive use of the monetary policy levers was an important analytical reason for the adoption of monetary targets in the first place.119 Pillar I in the ECB strategy is rationalised precisely in terms of providing better signals about inflationary pressures beyond short horizons, complementing the assessment of more near-term inflation pressures based largely on real side indicators under Pillar II.120 Even so, the long-standing justification for responding to rapid monetary growth is that it foreshadows inflationary pressures. As emphasised here, however, financial imbalances also can herald recessionary, and so potentially deflationary, pressures down the road. This could raise delicate issues of communication and transparency unless a broader set of potential outcomes was explicitly considered.
Conclusion
Old or new challenges for central banks in the years ahead? In this paper we have argued that the answer depends to a considerable extent on the interpretation of economic developments over the last two decades and, more subtly perhaps, on how far back we are prepared to cast our gaze in search of comparisons. In order to highlight the importance of the interpretation, we have told two alternative stories, corresponding to two intentionally polarised perspectives.
According to the so-called “continuity” view, the economic environment facing central banks has not fundamentally changed relative to that prevailing during much of the inflationary period. To be sure, largely thanks to central banks’ determined efforts, inflation has been brought under control, and is now lower and more stable than at any time since at least the 1960s. But the lessons drawn from the great inflation period about the functioning of the economy and the inflation process remain fully valid. As a result, there is little need to adjust the trusted policy benchmarks honed during this historical phase.
By contrast, according to the “new-environment” view, the incremental changes that have occurred in the environment cannot so easily be accommodated within traditional paradigms. Financial liberalisation, in conjunction with the greater anti-inflation credibility of the institutional framework, may have resulted in a subtle change in the dynamics of the economy. As a result of financial liberalisation, financial markets can more easily accommodate booms and busts. And with expectations better anchored around inflation objectives, it is possible that underlying excess demand pressures may take somewhat longer to show up in overt inflation, especially during investment-driven booms, possibly triggered by supply side improvements. Thus, if the monetary authorities wait for clear evidence of near-term inflation pressures before tightening policy, they may unwittingly accommodate the build-up of financial imbalances. Booms of this kind can result in an equally subtle change in the balance of risks, away from higher inflation and towards economic weakness, financial strains and,
118 We do not elaborate here on how this could actually be implemented. Various possibilities could be considered. One might
be the use of reference ranges for the variables of key interest; methodologically, this would be similar to the analysis in Christiano and Rostagno (2001). Recently, King (2002) and Bean (2002) have discussed how a response to financial imbalances could be accommodated within an inflation targeting framework along lines similar to those outlined in the text here.
119 To be sure, the information content of credit may dominate that of monetary aggregates. Conceptually, the link between credit and asset prices is arguably stronger than that between monetary aggregates and prices. Empirically, there is some evidence supporting this conclusion (Borio et al (1994)). For instance, it is not uncommon for financial imbalances to be sustained through borrowing in the international interbank market. This financing would not show up in monetary aggregates. Nevertheless, especially for broad definitions, there would tend to be a positive correlation between money and credit expansion. The Japanese experience during the build-up of the bubble is an obvious example.
120 In particular, Issing (2002a,b) discusses how Pillar I could take into account financial imbalances of the type described here. More generally, Masuch et al in this volume consider the usefulness of money in monetary policymaking.

BIS Papers No 19 43
given the starting low level of inflation, possibly even deflation, linked to a disruptive unwinding of the imbalances. In other words, this new environment may make it harder for monetary policy to be sufficiently pre-emptive. It may be necessary to go back to the gold standard period to find economic conditions that, in some significant respects, resemble those prevailing today.
While the two perspectives look quite at odds, the operational differences in their policy implications can easily be overstated. We have argued that accommodating the new perspective would not require a change in the basic objectives of monetary policy but, rather, some modification in the way those objectives are pursued. It would call for somewhat longer policy horizons than the standard of one to two years commonly used at present and greater attention to the balance of risks in the outlook. Above all, it would call for greater weight being given to signs of the build-up of financial imbalances in deciding when and how far to tighten policy, as these imbalances would be seen as containing critical additional information about the sustainability of the economic expansion and hence the risks to the outlook.
Translating these general considerations into operational and politically acceptable guidelines for policy would obviously require considerably more work. Some empirical research has been done with a view to identifying the contours of financial imbalances. While the results may suggest that the basis for judgments about the existence of financial imbalances is there, more work would be needed to provide a sounder basis for such judgments. Likewise, as it stands, the new-environment view offers a broad outline of the economic processes at play. But more analytical work would be needed into the relationship between financial imbalances, the business cycle and monetary policy to provide the confidence in our understanding necessary to underpin policy actions. Moreover, these efforts would be indispensable to allay the political economy pressures that, at present, would in all probability make it impossible to adopt the more pre-emptive policy consistent with the new-environment view. Arguably, it was an analogous change in the climate of intellectual opinion with regard to inflation in the 1970s that provided the basis for the subsequent successful fight against it.
While not explicitly discussed in this paper, the new-environment view also has significant implications for the relationship between monetary and prudential policy. To the extent that financial imbalances are a more significant factor behind business fluctuations, the risk of financial crises with an origin in the nexus between overall financial developments and the macroeconomy increases. The difficulty in using monetary policy to address the imbalances puts a premium on prudential policy, perhaps calling for a shift in perspective among prudential authorities too. It is not uncommon for them to argue that if financial problems arise from a generalised financial cycle, then they have essentially a macroeconomic origin, and as such are best addressed through monetary policy. The new-environment view would naturally point to the need for greater cooperation between the two types of authority. Analytically, it would also highlight the desirability for greater cross-fertilisation between two intellectual traditions that have tended to develop separately over time.
Two perspectives, two paradigms, two sets of policy prescriptions, but a shared goal. Which view approximates reality more closely could have implications for the future evolution of the world economy and the art of central banking. Exploring further their relative merits is a task that would seem to deserve further attention.

44 BIS Papers No 19
Annex: The natural rate of interest
In the past several years, central banks have become increasingly interested in the natural rate of interest as an indicator for monetary policy. Three factors explain this revival of interest. One is a greater emphasis on targeting interest rates rather than money growth or the exchange rate. In an interest rate targeting regime, the natural rate can act as a policy benchmark that provides information with which to judge the stance of monetary policy, ie to judge whether the policy rate is relatively high or low. A second reason is increased uncertainty about more traditional guides for policy, such as the output gap and the NAIRU and monetary aggregates themselves. Finally, the success of the Taylor-rule approach in monetary policy research has led to a more intensive theoretical and empirical focus on the link between the real interest rate and inflation. This has cast new light on the pioneering research of Knut Wicksell.
Conceptual issues
Wicksell (1907) described the natural rate of interest as the value of the real rate consistent with price stability in the long run. The key relationship here is the gap between the natural rate of interest and market real interest rates. If a central bank tries to maintain market real interest rates above the natural rate of interest, then asset prices will fall and consumption slow. In addition, the relatively high market interest rate will reduce the attractiveness of new capital spending, thereby reducing investment. In addition, in a flexible exchange rate regime, it would put upward pressure on the exchange rate, which would depress net exports. In sum, according to the theory, a higher market interest rate leads to lower aggregate demand and thereby reduces pressure on prices. The effects would be reversed if a central bank were to maintain the market real interest rate below the natural rate of interest, thereby putting upward pressure on prices.121
Friedman (1968) drew a parallel between the concept of the natural rate of unemployment that he was developing at the time and that of the natural rate of interest. By analogy with the natural rate of unemployment, a version of the natural rate of interest - which might be labelled the steady state real interest rate - could be thought of as the steady state real rate of interest that would keep inflation stable over time.
In recent years, Woodford (2002) has offered another interpretation of the Wicksellian natural rate within the context of a modern (dynamic stochastic general equilibrium) monetary policy model. In the flexible price version of the model, the natural rate is defined as the real interest rate that would keep inflation constant from one period to the next. In contrast to the notions of Wicksell and Friedman, this neo-Wicksellian rate of interest would generally be strongly time-varying, reflecting various demand and supply shocks, including fiscal and commodity price shocks. These would cause inflationary pressure to rise or fall in the absence of an offsetting change in the real interest rate.
Practical issues
The natural rate of interest may be easy to define conceptually but is difficult to implement in practice because it is not directly observable. A major problem is that the Wicksellian natural rate is conceptually linked to the risk-free real interest rate. In most bond markets, this risk-free rate must be inferred by adjusting the nominal interest rate for estimates of expected inflation, time-varying risk premia and the effect of certain market restrictions, such as impediments to capital flows.122 More
121 Wicksell (1907) succinctly summed up the implications of the natural rate of interest: “If, other things remaining the same,
the leading banks of the world were to lower their rate of interest, say 1% below its ordinary level, and keep it so for some years, then the prices of all commodities would rise and rise and rise without any limit whatever; on the contrary, if the leading banks were to raise their rate of interest, say 1% above its normal level, and keep it there for some years, then all prices would fall and fall and fall without any limit except Zero.”
122 In this volume, Upper and Worms argue that survey data on inflation expectations can be used to construct accurate estimates of ex ante real interest rates.
BIS Papers No 19 45
fundamentally, the natural rate is that hypothetical real interest rate that is consistent with stable inflation - over the long run in the case of Wicksell’s version of the natural rate or over the short run in the case of Woodford’s version. As a result, estimates of the equilibrium real rate are generally based on a specific model of the economy, making the results dependent on the explicit and implicit assumptions embedded in it.
While none of these problems is easy to resolve, the potential value of the natural rate framework for monetary policymaking can be assessed by looking at the correlation between a proxy for the real interest rate gap - ie the difference between the actual real rate and the equilibrium real rate - and subsequent changes in inflation. As Blinder (1998) suggests, a reasonable empirical proxy of the real rate gap can be estimated as the ex post real interest rate less its average value over a period sufficiently long to average out most of the effects from transitory economic shocks.123 This approach is used in Graph A1. Two empirical estimates of the natural rate for each country are plotted - the mean of the ex post real rate (horizontal dotted line) and a time-varying measure of the trend level of the ex post real rate based on a Hodrick-Prescott filter (dashed line).124
The results of using these specific approximations point to at least two observations. First, it is clear that the gap between the actual ex post real interest rate and either of the proxies for the natural rate can be quite large and is variable. The time-varying estimate of the natural rate also appears to change by several percentage points over periods as short as five years. Second, consistent with the theory, there is prima facie evidence that a positive real rate gap indicates a relatively tight monetary policy that puts downward pressure on inflation, while a negative gap indicates a relatively easy monetary policy (Graph A2, using the time-varying estimates of the natural rate). Despite the small sample size and low t-statistics, the negative relationship across countries is evident.125 This suggests that the real rate gap may contain useful information about inflation dynamics and the stance of monetary policy, as also confirmed by other recent empirical studies.126
Thus, the natural rate of interest might be a useful additional tool in the formulation of monetary policy, if only to cross-validate information contained in other policy indicators.127 The natural rate could be used on its own or as an input into other policy guides, such as into a Taylor-like rule.
Goodhart (2001b) considers the strategic use of a short-run version of Wicksell’s natural rate in policy deliberations, arguing that the natural rate, if informative and used appropriately, can help underpin a pre-emptive policy stance. He draws this conclusion, in part, from the actual practices of the Monetary Policy Committee (MPC) at the Bank of England. The MPC asks its staff to prepare a forecast model-based estimate of the constant interest rate consistent with achieving the inflation target over a horizon of two years. This constant interest rate path - equivalent to a short-term natural rate - then sets the
123 One complication is that the natural rate may vary over time owing to structural changes in the economy. For example, in
recent years, policymakers have been concerned about the effect of faster economic growth on the natural rate. Theoretically, a faster trend growth rate (eg because of more rapid technological progress) would drive up the natural interest rate in a neoclassical growth model. The extent of the increase would depend on the willingness of consumers to forgo consumption in order to save and invest in the new technologies (Goodfriend and King (1997)). But other structural changes can also affect the natural rate. For instance, a structural shift in the natural rate can occur if consumers and firms change the rate at which they discount future outcomes, if there are structural changes in fiscal policy, or if there are changes in the economy’s degree of openness. As a consequence, empirical estimates of the natural rate as a long-run concept would need to be calculated over a period long enough to reduce the transitory effects of shocks but not so long that the effects of structural shifts are blurred.
124 The tuning parameter in the Hodrick-Prescott filter was set at a very high level (λ = 30000) in order to smooth the trend series. No attempt was made to adjust the nominal interest rates for risk premia. Amato (2002) uses an alternative approach based on the Kalman filter to obtain estimates of the low frequency component of the short-term real interest rate, which can be interpreted as the long-run natural rate of interest. He finds evidence of significant variation in long-run real rates in Germany, United Kingdom and United States using data on both consumption growth and ex post real rates.
125 The sample was restricted to exclude periods of extreme financial market stress, such as currency and financial crises. 126 See Laubach and Williams (2001) for the United States, Archibald and Hunter (2001) for New Zealand, Calderón and
Gallego (2002) for Chile, Neiss and Nelson (2001) for the United Kingdom and Christensen (2002) for Denmark. These studies also find that the information content and empirical reliability of estimates of the natural rate are likely to vary with the time horizon - ie the short run, the medium run or the long run - as well as across economic regions or countries. The relative usefulness of the natural rate at different horizons deserves further research.
127 See also Issing (2002a) and Christiano and Rostagno (2001).

46 BIS Papers No 19
Graph A.1
Natural rate of interest and real interest rate Nominal rate minus 12-month inflation1
United States
– 2
0
2
4
Euro area
– 2
0
2
4
Real rate HP trend of real rate 1986-2002 mean of real rate
Japan
– 2
0
2
4
United Kingdom
0
2.5
5.0
7.5
Canada
0
5
10
Australia
0
5
10
Sweden
– 10
0
10
Norway
0
5
10
Switzerland
– 5
0
5
Brazil2
– 50
0
50
100
0
10
20
30
Mexico3
– 150
– 100
– 50
0
– 20
0
20
40
1985 1990 1995 2000
Korea
0
5
10
1985 1990 1995 2000 1 United States: core PCE deflator; other countries: headline CPI. 2 Prior to 1996, left-hand scale; in thousand per cent. 3 Prior to 1990, left-hand scale.
Sources: IMF International Financial Statistics; national data.
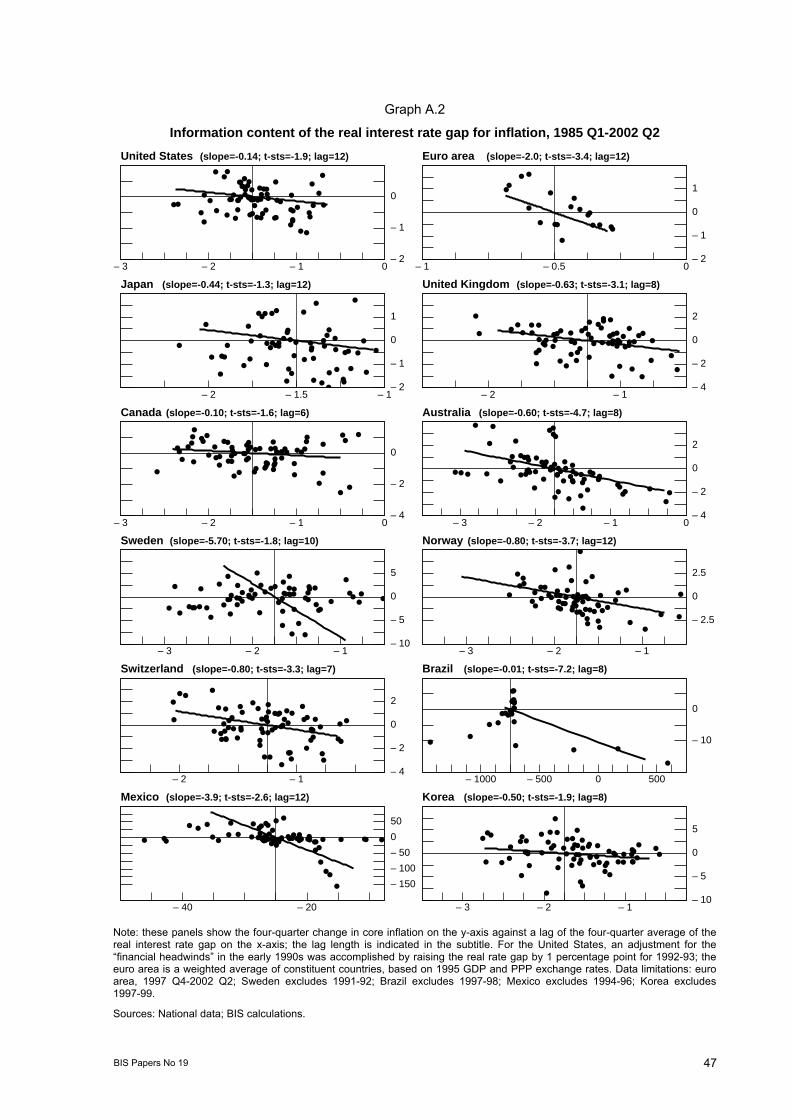
BIS Papers No 19 47
Graph A.2
Information content of the real interest rate gap for inflation, 1985 Q1-2002 Q2
– 2
– 1
0
– 3 – 2 – 1 0
●
●
●●●
●●● ●
●
●●●
●●
●
●
●
●
●●
●
●●
●●
●●
●●
●●
● ●●●
● ●
●●
●
●●●
●
●●
●
●
●
●●
●
●
●
●● ●
●
●●
●
●
●●●
●
●
● ●
– 2
– 1
0
1
– 1 – 0.5 0
●
●
●●
●
●
●
●●
●●
●
●
●
●●
●
●●
– 2
– 1
0
1
– 2 – 1.5 – 1
●
●●
●●●
●
●
●●
●
●
●
●
●
●
●
●
●●
●
●
●●
●
●
●
●
●
●
●
●
●
●
●
●
●
●
●
●
●
●
●
●
●●
●●
●●
●
●
●●
●
●
●
●
●
●
●
– 4
– 2
0
2
– 2 – 1
●
●●● ●
● ●
●●●●
●●●●● ● ● ● ●
●●●
●●●●●
●●
●
●
●●●
●
●
● ●●
●●
●
●●
●
●
●●
● ●●
●
●
●●
●●● ●●
●●●
●
●●
●●
– 4
– 2
0
– 3 – 2 – 1 0
●●
●
●●● ●
●●
●●
●●
●
●
●
●
●●
●●●●
●●
●●
●●
●●●
●●●
●
● ●
●
●●
●
●
●
●●
●●●
●
●
●●
●●
● ● ●
●
●●
● ● ●●
●●
●●
●
– 4
– 2
0
2
– 3 – 2 – 1 0
●
●●
●
●●●
●
●●●
● ● ●
●●
●●
●●●●
●●
●
● ● ●●
●●● ●● ●●
●● ●
●●
●
●
●●
●
●●● ●
●●
●● ●
●
●●●
●●
●
●
●
●
●●
●
●
●
– 10
– 5
0
5
– 3 – 2 – 1
●
● ● ● ●●
●●● ●● ●
●●
●●
●●
●●●
●●●●●
●●●
●●
● ●● ●
● ●
●●
●●
●●
●●
●●
●●●
● ● ●
●
●●●
●●
●●
●●
●●
●●
– 2.5
0
2.5
– 3 – 2 – 1
●●
●●
●●
●
●●
● ●●
●●● ●●●
●●
●●
●●
● ●
●●
●●
●●●
●
●●●●
●●●●
●
●●●
●●
●
●
●
● ●●
●●●
●
●●
●
●
●●
●●
●
– 4
– 2
0
2
– 2 – 1
●
●
●●
●●
●●
●●
●●
●●
●●●●●● ● ●
●●●●
●● ●
●
●
●●●
●
●
●●●
●●
●
●●
●●
●
●
●●
●
●●
●●
●●
●
●
●●
●
●● ● ●
●●●●
– 10
0
– 1000 – 500 0 500
●
●
●
●●
●
●
●●●
●
●
●●
●●●
●●
●●
●● ●
●
– 150
– 100
– 50
0
50
– 40 – 20
●●●●●●●●●●●●● ● ● ● ●●●●●●●●●
●●●●
●●● ● ● ● ● ● ● ●●●●●● ● ● ● ● ● ●
●
●
●
●
●
●
●
●●●●●●● ●
● ● ● ●●
– 10
– 5
0
5
– 3 – 2 – 1
●●
●●
● ●●
●●●
●
●●
●
●
●●
●
●
●●
●●●●
●●
● ●●●
●●●●
●●●
●●
●
●
●●●
●●●
●●
●
●●
●
●●
●
●
●
●
●
● ●
● ●●
●
●
●●
United States (slope=-0.14; t-sts=-1.9; lag=12) Euro area (slope=-2.0; t-sts=-3.4; lag=12)
Japan (slope=-0.44; t-sts=-1.3; lag=12) United Kingdom (slope=-0.63; t-sts=-3.1; lag=8)
Canada (slope=-0.10; t-sts=-1.6; lag=6) Australia (slope=-0.60; t-sts=-4.7; lag=8)
Sweden (slope=-5.70; t-sts=-1.8; lag=10) Norway (slope=-0.80; t-sts=-3.7; lag=12)
Switzerland (slope=-0.80; t-sts=-3.3; lag=7) Brazil (slope=-0.01; t-sts=-7.2; lag=8)
Mexico (slope=-3.9; t-sts=-2.6; lag=12) Korea (slope=-0.50; t-sts=-1.9; lag=8)
Note: these panels show the four-quarter change in core inflation on the y-axis against a lag of the four-quarter average of the real interest rate gap on the x-axis; the lag length is indicated in the subtitle. For the United States, an adjustment for the “financial headwinds” in the early 1990s was accomplished by raising the real rate gap by 1 percentage point for 1992-93; the euro area is a weighted average of constituent countries, based on 1995 GDP and PPP exchange rates. Data limitations: euro area, 1997 Q4-2002 Q2; Sweden excludes 1991-92; Brazil excludes 1997-98; Mexico excludes 1994-96; Korea excludes 1997-99.
Sources: National data; BIS calculations.
48 BIS Papers No 19
stage for the MPC’s monetary policy deliberations. Goodhart observes that focusing the discussion on the reasons for deviations between this rate and the current policy rate naturally fosters a pre-emptive approach to monetary policy. Specifically, if the policy rate is inconsistent with the short-term natural rate, then the policy rate should presumably be changed unless there are compelling reasons for not doing so.128
Implications under the two views
In the continuity view, the natural rate of interest can serve as an additional tool in a monetary policymaker’s toolbox, augmenting standard tools such as the output gap and the NAIRU.129 In theory, all these concepts are largely substitutable as indicators of deviations from the economy’s steady state.130 The relative attractiveness of any one tool depends on whether it can be accurately and reliably measured, for both research studies and policymaking.
A preliminary statistical exercise on US data provides mixed evidence about the marginal predictive power of the natural rate of interest over the output gap as a predictor of future core inflation (Table A1).131 The results depend in part on the “vintage” of data used. Those based on the latest vintage, which includes possible revisions after the fact, show that inflation forecasts based on the real rate gap statistically encompass the forecasts based on the output gap alone.132 However, it appears that the relative superiority of the real rate gap (using the three-month Treasury bill rate) arises from the way the HP filter estimates the output gap during the recent expansion and the subsequent recession. The recession at the end of the sample period has the effect of pulling down the estimates of potential in the late 1990s, thereby causing the estimated output gap to be quite high during the expansion despite the fact that core CPI inflation was edging downward during the period. By contrast, the forecast encompassing tests using forecasts based on real-time estimates put the output gap in a more favourable light, as they largely abstract from the influence of the 2001 recession. Using the 10-year bond yield instead of the three-month T-bill rate does not change the basic conclusion: there may be an empirical role for using the natural rate gap, but that role needs to be more fully investigated.
In theory, however, estimates of the natural rate may be a comparatively more useful monetary policy tool in an economy where forces associated with the new-environment view may be present. Specifically, given the possibility of unsustainable asset price and investment booms and busts some measures of the real rate gap may provide less ambiguous implications for the direction of monetary policy than more traditional indicators. In the case of a boom, whether sustainable or not, the natural rate framework would be likely to prompt the monetary authority to raise the policy rate because measures of the natural rate based either on market interest rates or on the marginal rate of
128 There are, of course, many interest rate paths consistent with bringing inflation on target over the relevant horizon. Thus,
Goodhart also offers a possible refinement of the MPC’s current procedure, conjecturing that monetary policy deliberations could benefit from a comparison of a constant short-term natural rate with two other related paths. One such path would initially lie above the natural rate and then decline over the policy horizon, while the other would begin below and then rise. Policymakers could then more easily focus on the implications of alternative paths for output and other important policy variables such as asset prices.
129 Indeed, a number of central banks use the natural rate in this way. 130 To some extent, the real rate gap may be somewhat more valuable in a policy setting for several reasons. First, the
monetary authority has more control over this gap than over the output gap or that between the unemployment rate and the NAIRU. Second, interest rate data are available in a more timely fashion than the unemployment rate or output statistics. Finally, as noted below, the natural rate of interest may be a more robust and informative estimator of economic conditions than the other real side measures because it can potentially be measured in (at least) three different markets. It can be inferred from consumers’ intertemporal rate of substitution, from firms’ marginal product of capital and from the real rates of return in the bond and equity markets. To be sure, it may be difficult to obtain reliable empirical estimates of the natural rate of interest from the marginal return on capital. But, as described below, the significance of forces associated with the new-environment view may warrant further research in this area, along the lines of Mulligan (2001) and McGrattan and Prescott (2001).
131 The analysis is limited to the United States because of the availability of real-time output gap data, which is important for monetary policy analyses (eg Orphanides (2001), Nelson and Nikolov (2001) and Gruen et al (2002)).
132 The output gap forecast of inflation is based on real GDP less potential output estimated by an HP filter with a sensitivity parameter of 1600. The real interest rate gap forecast of inflation is based on the ex post real interest rate less the natural rate of interest estimated with an HP filter.

BIS Papers No 19 49
substitution would presumably increase. On the one hand, if the boom was sustainable because, say, TFP had in fact accelerated, then the monetary authority would have to raise market interest rates over time to restore non-inflationary growth.133 On the other hand, if the boom was unsustainable because, in fact, TFP had not accelerated, then a higher policy rate might be desirable to contain the build-up of imbalances in the economy, for the reasons already discussed in the main text. Similarly, once the imbalances began to unwind, measures of the natural rate would be likely to decline, leading policymakers to cut rates.
Moreover, the central bank could obtain potentially useful information about the sustainability of asset price and investment booms by comparing estimates of the prevailing return on physical capital with those of the natural rate. If the boom was not sustainable, then the increase in investment spending would be expected to drive down the risk-adjusted real return on physical capital (ie the marginal product of capital net of depreciation and taxes) relative to the natural rate of interest, which might be measured based on the long-run average of the marginal product of capital itself, on market interest rates or on estimates of the marginal rate of substitution.134 This gap would be expected to widen so long as excessive investment continued.
In addition, a new-environment central bank might be able to use the information concerning the gap between the return on physical capital and the natural rate to corroborate measures of financial imbalances, just as a continuity-view central bank might be inclined to use the behaviour of inflation to cross-check estimates of economic slack.135 From a new-environment perspective, this second procedure could be misleading when an unsustainable boom took place in the context of low and stable inflation, or indeed disinflation. The reason is that it would tend to lead to upward adjustments in output potential, thereby masking the signs of excessive expansion.
Table A1
Forecast encompassing tests: 1990 Q1-2001 Q2
Data vintage Real rate gap (using the three-month T-bill rate) Output gap
1α̂ 1: 10 =αH 2α̂ 1: 20 =αH
Latest 1.2 0.74 –0.2 0.05
Real-time 0.0 0.00 1.0 0.84
(using the 10-year T-bond yield)
Latest 0.0 0.30 1.0 0.96
Real-time 0.1 0.00 0.9 0.25
The forecasting encompassing equation is ,ˆˆ 214, tYgapRgaptt ε+πα+πα=π + where the dependent variable is the four-quarter
ahead core PCE inflation rate for the United States. The forecasts are those based on the real rate gap and the output gap, respectively. All variables were de-meaned. The equation was estimated by imposing the constraint that the forecasts are unbiased, ie the coefficients are constrained to sum to 1. P-values of the hypothesis tests are reported.
133 In the short run, however, the natural rate might not rise initially if high capital adjustment costs are present, as pointed out
by Neiss and Nelson (2001). 134 Mulligan (2001) finds that the implied risk-adjusted rate of return on capital may deviate significantly from the benchmark
risk-free return on certain financial assets, such as Treasury interest rates, in an economy with state-dependent utility. The risk-adjusted rate of return on capital in this type of environment is the appropriate measure of the intertemporal elasticity of substitution and, hence, the appropriate basis for estimates of the natural rate. While the financial return on the market portfolio for all assets such as property, human capital and business capital would also be appropriate, the return on a subset of assets in general would not.
135 Formally, this is done by imposing the cross-checking restrictions derived from theory so as to obtain more precise statistical estimates of the output gaps (eg Kuttner (1994), Gerlach and Smets (1999) and Gruen et al (2002)).
50 BIS Papers No 19
References
Abreu, D and M K Brunnermeier (2003): “Bubbles and crashes”, Econometrica, 71 (1), pp 173-204.
Ahearne, A, J Gagnon, J Haltmaier and S Kamin and C Erceg, J Faust, L Guerrieri, C Hemphill, L Kole, J Roush, J Rogers, N Sheets and J Wright (2002): “Preventing deflation: lessons from Japan’s experience in the 1990s”, Board of Governors of the Federal Reserve System, International Finance Discussion Papers, No 729, June.
Ahmed, S, A Levin and B Wilson (2002): “Recent US macroeconomic stability: good policies, good practices or good luck?”, Board of Governors of the Federal Reserve System International Finance Discussion Papers, No 730, July.
Akerlof, G, W Dickens and G Perry (1996): “The macroeconomics of low inflation”, Brookings Papers on Economic Activity, 1, pp 1-76.
Alchian, A A and B Klein (1973): “On a correct measure of inflation”, Journal of Money, Credit and Banking, 5(1), pp 173-99.
Allen, F and D Gale (2000): “Bubbles and crises”, The Economic Journal, 110, pp 236-56.
Allen, F, S Morris and H Shin (2003): “Beauty contests, bubbles and iterated expectations in asset markets”, mimeo.
Amato, J (2002): “Consumption growth and real interest rates in the long run”, BIS Working Papers, forthcoming.
Amato, J and S Gerlach (2000): “Comparative estimates of New Keynesian Philips curves”, BIS Working Papers, forthcoming.
Amato, J and H Shin (2003): “Imperfect common knowledge and economic stability”, BIS Working Papers, forthcoming.
Andersen, P and W Wascher (2001): “Understanding the recent behaviour of inflation: an empirical study of wage and price developments in eight countries”, BIS Papers, No 3, August, pp 267-302.
Archibald, J and L Hunter (2001): “What is the neutral real interest rate and how can we use it?”, Reserve Bank of New Zealand Bulletin, 64(3).
Bäckstrom, U (2002): “Financial cycles”, Speech given at the Philadelphia and Fed Policy Forum on Crises, Contagion and Coordination: Issues for Policymakers in the Global Economy, Philadelphia, 22 November.
Ball, L and R Moffitt (2001): Productivity growth and the Phillips curve, in A Krueger and R Solow, eds, The Roaring Nineties, New York: Russell Sage Foundation.
Bank for International Settlements (1992): “Structural aspects of financial markets and prudential supervision”, BIS 62nd Annual Report, Chapter VIII, June, pp 191-212.
——— (1997): “The evolution of central banking”, BIS 71st Annual Report, Chapter VIII, June, pp 140-60.
——— (2001a): “Empirical studies of structural changes and inflation”, BIS Papers, No 3, August.
——— (2001b): “Modelling aspects of the inflation process and the monetary transmission mechanism in emerging market countries”, BIS Papers, No 8, November.
——— (2001c): “Cycles and the financial system”, BIS 71st Annual Report, Chapter VII, June, pp 123-41.
——— (2002a): “Monetary policy in the advanced industrial economies”, BIS 72nd Annual Report, Chapter IV, June, pp 59-78.
——— (2002b): BIS 72nd Annual Report, June.
Barro, R and D B Gordon (1983): “Rules, discretion and reputation in a model of monetary policy”, Journal of Monetary Economics, July.
Barsky, R and B De Long (1991): “Forecasting Pre-World War I Inflation: The Fisher Effect and the Gold Standard”, Quarterly Journal of Economics, 106 (3), pp 815-36.
BIS Papers No 19 51
Bean, C (2002): “The MPC and the UK economy: should we fear the D-words?”, speech before the Emanuel Society, London, UK, 25 November.
Bell, J and D Pain (2000): “Leading indicator models of banking crises – a critical review”, Financial Stability Review, Bank of England, Issue 9, Article 3, December, pp 113-29.
Berger, H, J de Haan and S Eijffinger (2001): “Central bank independence: an update of theory and evidence”, Journal of Economic Surveys, Vol 15, No 1, pp 3-40.
Bernanke, B (2002a): Asset-price “bubbles” and monetary policy, speech before the New York Chapter of the National Association for Business Economics, 15 October.
——— (2002b): Deflation: making sure “It” doesn’t happen here, speech before the National Economists Club, Washington DC, 21 November.
Bernanke, B and M Gertler (1999): “Monetary policy and asset price volatility”, in New Challenges for Monetary Policy, A symposium sponsored by the Federal Reserve Bank of Kansas City, Jackson Hole, Wyoming, 26-29 August.
——— (2001): “Should central banks respond to movements in asset prices?”, American Economic Review, Vol 91, No 2, May, pp 253-57.
Bernanke, B, T Laubach, F Mishkin, and A Posen (1999a): Inflation targeting: lessons from the international experience, Princeton, NJ, Princeton University Press.
Bernanke, B, M Gertler and S Gilchrist (1999b): “The financial accelerator in a quantitative business cycle framework”, in J Taylor and M Woodford (eds), Handbook of Macroeconomics, Amsterdam.
Bernard, H and J Bisignano (2002): “Rereading the classics: deflation, money and financial intermediation in historical perspective”, December, mimeo.
Blanchard, O (2000): “Bubbles, liquidity traps and monetary policy. Comments on Jinushi et al and on Bernanke” in A S Posen and R Mikitani (eds), Japan’s financial crisis and its parallels to US experience, Institute for International Economics Special Report 13, September.
Blanchard, O and J Simon (2001): “The long and large decline in US output volatility”, MIT Department of Economics Working Paper, No 01-29, April.
Blinder, A (1998): Central Banking in Theory and Practice, Cambridge: The MIT Press.
——— (2000): “Monetary policy at the zero lower bound: balancing the risks”, Journal of Money, Credit and Banking, 32(4), Part 2, November, pp 1093-99.
Bordo, M, B Eichengreen, D Klingebiel and M S Martinez-Peria (2001): “Financial crises: lessons from the last 120 years”, Economic Policy, April.
Bordo, M, B Eichengreen and D Irwin (1999): “Is globalization today really different than globalization a hundred years ago?”, NBER Working Paper, No 7195, June.
Bordo, M and O Jeanne (2002): “Boom-busts in asset prices, economic instability, and monetary policy”, NBER Working Paper, No 8966, May.
Borio, C (2001): “A hundred ways to skin a cat: comparing monetary policy operating procedures in the United States, Japan and the euro area”, BIS Papers, No 9, December, pp 1-22.
——— (2003): “Towards a macro-prudential framework for financial supervision and regulation?”, Lecture presented at the CESifo Summer Institute 2002 Workshop on “Banking regulation and financial stability”, Venice, 17-18 July, BIS Working Paper, No 128, Basel, February.
Borio, C and A Crockett (2000): “In search of anchors for financial and monetary stability”, Greek Economic Review, 20(20), Autumn, pp 1-14.
Borio, C, C Furfine and P Lowe (2001): “Procyclicality of the financial system and financial stability: issues and policy options” in Marrying the macro- and micro-prudential dimensions of financial stability, BIS Papers, No 1, March, pp 1-57.
Borio, C, N Kennedy and S Prowse (1994): “Exploring aggregate asset price fluctuations across countries: measurement, determinants and monetary policy implications”, BIS Economic Paper, No 40, Basel, April.

52 BIS Papers No 19
Borio, C and P Lowe (2002a): “Asset prices, financial and monetary stability: exploring the nexus”, Paper presented at the BIS Conference on “Changes in risk through time: measurement and policy options”, BIS Working Papers, No 114, Basel, July.
——— (2002b): “Assessing the risk of banking crises”, BIS Quarterly Review, Basel, December, pp 43-54.
——— (2003): “Imbalances or “bubbles”? Implications for monetary and financial stability”, in W Hunter, G Kaufman and M Pomerleano (eds) Asset Price Bubbles: The Implications for Monetary, Regulatory, and International Policies, MIT press, January, Chapter 17, pp 247-70.
Brainard, W (1967): “Uncertainty and the effectiveness of policy”, American Economic Review, Papers and Proceedings, May.
Braun, S (1984): “Productivity and the NAIRU (and other Phillips Curve Issues)”, Federal Reserve Board, National Income, Wages, Prices, and Productivity Working Papers, No 34, June.
Burns, A and W Mitchell (1946): Measuring business cycles, NBER, New York.
Calderón, C and F Gallego (2002): “The neutral real interest rate in Chile”, Economía Chilena, August.
Campa, J (1990): “Exchange rates and economic recovery in the 1930s: an extension to Latin America”, Journal of Economic History, 50, September, pp 677-82.
Campa, J and L Goldberg (2002): “Exchange rate pass-through into import prices: a macro or micro phenomenon?”, NBER Working Paper, No 8943, May.
Caplin, A and D Spulber (1987): “Menu costs and the neutrality of money”, Quarterly Journal of Economics, 102 (4), pp 703-26.
Canner, G, K Dynan and W Passmore (2002): “Mortgage refinancing in 2001 and early 2002”, Federal Reserve Bulletin, December.
Carey, M (1990): “Feeding the Fad: The Federal Land Banks, Land Market Efficiency and the Farm Credit Crisis”, Dissertation, University of California, Berkeley.
Case, K, J Quigley and R Shiller (2002): “Comparing wealth effects: the stock market versus the housing market”, mimeo, Wellesley College, December.
Cecchetti, S, H Genberg, J Lipsky, and S Wadhwani (2000): “Asset prices and monetary policy”, Report prepared for the conference Central banks and asset prices, organised by the International Centre for Monetary and Banking Studies, Geneva, May.
Chirinko, R and H Schaller (2001): “Business fixed investment and “bubbles”: the Japanese case”, American Economic Review, 91 (3), pp 663-80.
Choudhri, E and L Kochin (1980): “The exchange rate and the international transmission of business cycle disturbances: some evidence from the Great Depression”, Journal of Money, Credit and Banking, 12, pp 565-74.
Christensen, A M (2002): “The real interest rate gap: measurement and application”, Danmarks Nationalbank Working Papers, 6/2002, October.
Christiano, L and M Rostagno (2001): “Money growth monitoring and the Taylor rule”, NBER Working Paper, No 8539, October.
Clarida, R, J Gali and M Gertler (1999): “The science of monetary policy: a new Keynesian perspective”, Journal of Economic Literature, Vol 37, No 4, December, pp 1661-707.
——— (2000): “Monetary policy rules and macroeconomic stability: evidence and some theory”, Quarterly Journal of Economics, Vol CXV, Issue 1, February, pp 147-80.
Clark, P (1979): “Investment in the 1970’s: theory, performance, prediction”, Brookings Papers on Economic Activity, pp 73-113.
——— (1993): “Tax incentives and equipment investment”, Brookings Papers on Economic Activity, pp 317-47.
Clouse, J, D Henderson, A Orphanides, D Small and P Tinsley (2000): “Monetary policy when the nominal short-term interest rate is zero”, Board of Governors of the Federal Reserve System, Finance and Economics Discussion Series, No 2000-51, November.

BIS Papers No 19 53
Corsetti, G (1998): “Interpreting the Asian financial crises: open issues in theory and policy”, Asian Development Review, Vol 16, No 2, pp 18-63.
Corsetti, G, P Pesenti and N Roubini (1999): “What caused the Asian currency and financial crisis?”, Japan and the World Economy, Vol 11(3), pp 305-73, October.
Cottarelli, C and C Giannini (1997): “Credibility without rules? Monetary frameworks in the post-Bretton Woods era”, IMF Occasional Papers, No 154, December, Washington DC.
Courakis, A (1981): “Monetary targets: conceptual antecedents and recent policies in the US, UK and West Germany”, in A Courakis (ed), Inflation, depression and economic policy in the West, London: Mansell.
Crockett, A (2000a): “In search of anchors for financial and monetary stability”, BIS Speeches, 27 April.
——— (2000b): “Marrying the micro- and macro-prudential dimensions of financial stability”, BIS Speeches, 21 September.
——— (2001): “Monetary policy and financial stability”, BIS Speeches, 13 February.
Cukierman, A (1992): Central bank strategy, credibility and independence: theory and evidence, The MIT Press, Cambridge, MA.
——— (2002): “Are contemporary central banks transparent about economic models and objectives and what difference does it make?”, Federal Reserve Bank of St Louis Review, 84 (4), pp 15-36.
Dalsgaard, T, J Elmeskov and C-Y Park (2002): “Ongoing changes in the business cycle - evidence and causes”, OECD Economic Department Working Papers, No 315, January.
David, P (1990): “The dynamo and the computer: an historical perspective on the modern productivity paradox”, American Economic Review (Papers and Proceedings), 80(2), May, pp 355-61.
Davis, M and M Palumbo (2001): “A primer on the economics and the time series econometrics of wealth effects”, Federal Reserve Board, Finance and Economics Discussion Paper No 2001-9, January.
Deep, A and D Domanski (2002): “Housing markets and economic growth: lessons from the US refinancing boom”, BIS Quarterly Review, September, pp 37-45.
De Kock, M (1974): Central banking, 4th edition, St Martin’s Press, New York.
De Long, J B (2000): “America’s historical experience with low inflation”, Journal of Money, Credit and Banking, 32 (4), Part 2, November, pp 979-93.
Deutsche Bundesbank (2000): “Problems of international comparisons of growth caused by dissimilar methods of deflation - with IT equipment in Germany and the United States as a case in point, Monthly Report, August, p 8.
Dodge, D (2003): “Canada’s experience with inflation targets and a flexible exchange rate: lessons learned”, Remarks to the Canadian Society of New York, 20 February.
Dupor, B (2002): “Nominal price versus asset price stabilisation”, Wharton School, August, mimeo.
Dynan, K and D Maki (2001): “Does stock market wealth matter for consumption?”, Federal Reserve Board, Finance and Economics Discussion Paper, No 2001-23, May.
Edge, R and T Laubach (2002): “Evidence for structural change and its implications for US monetary policy”, paper presented at the BIS Autumn 2002 Central Bank Economists’ Meeting, 14-15 October.
Eichengreen, B (1996): Globalizing capital, Princeton University Press, Princeton, New Jersey.
Eichengreen, B and C Arteta (2000): “Banking crises in emerging markets: presumptions and evidence”, Center for International and Development Economics Research Working Paper, C00-115, August.
Eichengreen, B and J Sachs (1985): “Exchange rates and economic recovery in the 1930s”, Journal of Economic History, 45, pp 925-46.
English, W (2000): “Comment on: America’s historical experience with low inflation”, Journal of Money, Credit and Banking, 32(4), Part 2, November, pp 998-1006.

54 BIS Papers No 19
European Central Bank (2000): “Potential output growth and output gaps: concepts, uses and estimates”, Monthly Bulletin, October.
——— (2001): “Issues related to monetary policy rules”, Monthly Bulletin, October.
Feenstra, R C (1998): “Integration of trade and disintegration of production in the global economy”, Journal of Economic Prospectives, Vol 12, No 4, Fall, pp 31-50.
Federal Reserve Bank of Cleveland (1998): “Beyond price stability: a reconsideration of monetary policy in a period of low inflation”, Annual Report, pp 5-12.
Ferguson, R (2002): “Should financial stability be an explicit central bank objective?”, Presentation at the IMF Central Banking Conference on Challenges to Central Banking from Globalized Financial Markets, 16 October.
Filardo, A (1995): “Has the productivity trend steepened in the 1990s?”, Federal Reserve Bank of Kansas City Economic Review, Fourth Quarter.
——— (1999): “Asset prices and monetary policy”, Federal Reserve Bank of Kansas City Economic Review, 3rd Quarter.
——— (2001): “Should monetary policy respond to asset price bubbles? Some experimental results”, in G Kaufman, ed, Asset Price Bubbles: Implications for Monetary and Regulatory Policies, Amsterdam: Elsevier Science.
Filardo, A and P Cooper (1996): “Cyclically-adjusted measures of structural trend breaks: an application to productivity trends in the 1990s”, Federal Reserve Bank of Kansas City Working Paper, 96-14, December.
Filardo, A and S Gordon (1999): “Business cycle turning point: two empirical business cycle model approaches”, in Philip Rothman (ed), Nonlinear Time Series Analysis of Economic and Financial Data, Kluwer Academic Publishers, Boston.
Fisher, I (1932): Booms and depressions, New York, Adelphi Co.
Freedman, C (2000): “Comment on: overcoming the zero bound on interest rate policy”, Journal of Money Credit and Banking, 32(4), Part 2, November, pp 1051-57.
Friedman, B (2002): “The use and meaning of words in central banking: inflation targeting, credibility, and transparency”, NBER Working Paper, No 8972, June.
Friedman, M (1968): “The role of monetary policy”, American Economic Review, Vol 57, No 1, March, pp 1-17.
——— (1977): “Nobel Lecture: Inflation and unemployment”, Journal of Political Economy, Vol 85, No 3, pp 451-72.
Frisch, R (1933): “Propagation problems and impulse problems in dynamic economies”, Economic Essays in Honor of Gustav Cassel, George Allen and Unwin, London.
Fukao, M (2002) “Inflation targeting and negative interest rate policy”, in Glocom Platform from Japan, Debate on Fiscal/Monetary Policy, No 4, 9 April.
Furman, J and J Stiglitz (1998): “Economic crises: evidence and insights from East Asia”, Brookings Papers on Economic Activity, 2, pp 1-114.
Gagnon, J and J Ihrig (2001): “Monetary policy and exchange rate pass-through”, International Finance Discussion Papers, No 2001-704, Board of Governors of the Federal Reserve System, Washington DC.
Gali, J, M Gertler and J Lopez-Salido (2002): “The Euro area inefficiency gap”, paper presented at the BIS Autumn 2002 Central Bank Economists’ Meeting, 14-15 October.
Gerlach, S and F Smets (1999): “Output gaps and monetary policy in the EMU area”, European Economic Review, Vol 43, pp 801-12.
Gilchrist, S and J Leahy (2002): “Monetary policy and asset prices”, Journal of Monetary Economics, 49 (1), pp 75-97.
Goodfriend, M (2000a): “Financial stability, deflation and monetary policy”, Paper presented at the Ninth International Conference at the Institute of Economic Studies, Bank of Japan, July.
BIS Papers No 19 55
——— (2000b): “Overcoming the zero bound on interest rate policy”, Journal of Money, Credit and Banking, 32(4), Part 2, November, pp 1005-35.
——— (2003): “Interest rate policy should not react directly to asset prices”, in W Hunter, G Kaufman and M Pomerleano (eds) Asset Price Bubbles: The Implications for Monetary, Regulatory, and International Policies, MIT press, January, Chapter 31, pp 445-58.
Goodfriend, M and R King (1997): “The new neoclassical synthesis and the role of monetary policy”, NBER Macroeconomic Annual, Cambridge, Mass: MIT Press.
Goodhart, C (1988): The evolution of central banking, MIT Press, Cambridge.
——— (1995): “Price stability and financial fragility”, in K Kawamoto, Z Nakajima and H Taguchi (eds), Financial Stability in a Changing Environment, Chapter 10, pp 439-510, Macmillan, London.
——— (2001a): “What weight should be given to asset prices in the measurement of inflation?”, The Economic Journal, 111, June, pp 335-56.
——— (2001b): “Monetary transmission lags and the formulation of the policy decision on interest rates”, Federal Reserve Bank of St. Louis Review, July/August.
——— (2003): “The historical pattern of economic cycles and their interaction with asset prices and financial regulation”, in W Hunter, G Kaufman and M Pomerleano (eds) Asset Price Bubbles: The Implications for Monetary, Regulatory, and International Policies, MIT press, January, Chapter 33, pp 467-80.
Goodhart, C and P De Largy (1999): “Financial crises: plus ça change, plus c’est la meme chose”, LSE Financial Markets Group Special Paper, No 108.
Gordon, R, (2000): “Does the “New Economy” measure up to the great inventions of the past?”, Journal of Economic Perspectives, 14(4), Fall, pp 49-74.
Greenspan, A (1999): “The Federal Reserve’s Semiannual Report on Monetary Policy”, Testimony before the Committee on Banking and Financial Services, United States House of Representatives, July.
——— (2002): “Economic volatility”, in Rethinking Stabilization Policy, A symposium sponsored by the Federal Reserve Bank of Kansas City, Jackson Hole, Wyoming, 29-31 August.
Group of Ten (2001): Consolidation in the financial sector, Report by a Group of Ten Working Party on Financial Sector Consolidation, January.
Gruen, D, T Robinson and A Stone (2002): “Output gaps in real time: are they reliable enough to use for monetary policy?”, paper presented at the BIS Autumn 2002 Central Bank Economists’ Meeting, 14-15 October.
Gust, C and J Marquez (2000): “Productivity developments abroad”, Federal Reserve Bulletin, October, pp 665-81.
Hamilton, J D (1989): “A new approach to the economic analysis of nonstationary time series and the business cycle”, Econometrica, March.
Hansen, L and T Sargent (2001): “Acknowledging misspecification in macroeconomic theory”, Bank of Japan, Monetary and Economic Studies, February.
Hawkins, J and M Klau (2000): “Measuring potential vulnerabilities in emerging market economies”, BIS Working Papers, No 91, October.
Hawkins, J and D Mihaljek (2001): “The banking industry in the emerging market economies: competition, consolidation and systemic stability: an overview”, in The banking industry in the emerging market economies, competition, consolidation and systemic stability, BIS Papers, No 4, August.
Hayek, F A (1933): Monetary theory and the trade cycle, Clifton, New Jersey: Augustus M Kelly reprint 1966.
Ho, C and R McCauley (2003): “Living with flexible exchange rates: issues and recent experience in inflation targeting emerging market economies”, BIS Working Papers, No 130, February.

56 BIS Papers No 19
Hoggarth, G and V Saporta (2001): “Costs of banking system instability: some empirical evidence”, Bank of England Financial Stability Review, Issue 10, Article 5, June.
International Monetary Fund (2002): Global Financial Stability Report, 13 March.
Issing, O (2002a): “Monetary policy in a changing economic environment”, in Rethinking Stabilization Policy, A symposium sponsored by the Federal Reserve Bank of Kansas City, Jackson Hole, Wyoming, 29-31 August.
——— (2002b): “The euro after four years: is there a risk of deflation?”, 16th European Financial Convention, London, 2 December.
James, H (2001): The end of globalization, Harvard University Press, Cambridge, Massachusetts.
Johnson, D R (2002): “The effect of inflation targeting on the behavior of expected inflation: evidence from an 11 country panel”, Journal of Monetary Economics, 49, pp 1521-38.
Jorgenson, D (2001): “Information technology and the US economy”, American Economic Review, 91(1), March, pp 1-32.
Kahn, J, M McConnell, and G Perez-Quirós (2002): “On the causes of the increased stability of the US economy”, Federal Reserve Bank of New York Economic Policy Review, May, pp 183-202.
Kaminsky, G and C Reinhart (1999): “The twin crises: the causes of banking and balance-of-payments problems”, American Economic Review, Vol 89, No 3, June, pp 473-500.
Kaminsky, G and S Schmukler (2001): “On booms and crashes: financial liberalization and stock market cycles”, George Washington University working paper, mimeo, October.
Kent, C and P Lowe (1997): “Asset-price bubbles and monetary policy”, Reserve Bank of Australia Research Discussion Paper, No 9709.
——— (1998): “Property-price cycles and monetary policy”, BIS Conference Papers, Vol 5, March, pp 239-63.
Kindleberger, C (1996): Manias, panics and crashes, Cambridge University Press, Cambridge, 3rd edition.
King, M (1996): “How should central banks reduce inflation? - Conceptual issues”, A symposium by the Federal Reserve Bank of Kansas City in Achieving Price Stability, Jackson Hole, Wyoming, 29-31 August.
——— (1999): “Challenges for monetary policy: new and old”, in New Challenges for Monetary Policy, A symposium sponsored by the Federal Reserve Bank of Kansas City, Jackson Hole, Wyoming, 26-29 August.
——— (2002): “The inflation target ten years on”, speech presented at the London School of Economics, 19 November.
Kiyotaki, N and J Moore (1997): “Credit cycles”, Journal of Political Economy, 105(2), pp 211-48.
Krugman, P (1998): “It’s back! Japan’s slump and the return of the liquidity trap”, Brookings Papers on Economic Activity, 2.
Kuttner, K N (1994): “Estimating potential output as a latent variable”, Journal of Business and Economic Statistics, Vol 12(3), July, pp 361-68.
Laidler, D (1999): Fabricating the Keynesian revolution, University of St. Gallen, Cambridge University Press.
——— (2001): “Rules, discretion and financial crises in classical and neoclassical monetary economics”, Paper presented at the History of Economic Thought Conference, Manchester Metropolitan University, September.
Laubach, T and J Williams (2001): “Measuring the natural rate of interest,” Board of Governors of the Federal Reserve System, Finance and Economics Working Papers, No 2001-56. December.
Lehnart, A (2002): “The marginal propensity to consume out of housing wealth”, mimeo, Federal Reserve Board, December

BIS Papers No 19 57
Lowe, P (2002): “Credit risk measurement and procyclicality”, BIS Working Papers, No 116, Basel, September.
Lustig, H and S Van Nieuwerburgh (2002): “Housing collateral, consumption insurance and risk premia”, mimeo, University of Chicago, November.
MacKinnon, J G (1991): “Critical values for cointegration tests”, Chapter 13 in R F Engle and C W J Granger (eds), Long-run Economic Relationships: Readings in Cointegration, Oxford University Press.
Mankiw, G (1985): “Small menu costs and large business cycles: a macroeconomic model of monopoly”, Quarterly Journal of Economics, 100 (2), pp 529-39.
McCauley, R, J S Ruud and F Iacono (1999): Dodging Bullets: Changing US Corporate Capital Structures in the 1980s and 1990s, MIT Press, Cambridge, Massachusetts.
McGrattan, E and E Prescott (2001): “The stock market crash of 1929: Irving Fisher was right!”, NBER Working Paper, No 8622, December.
Meltzer, A H (2003): “Rational and nonrational bubbles”, in W Hunter, G Kaufman and M Pomerleano (eds) Asset Price Bubbles: The Implications for Monetary, Regulatory, and International Policies, MIT press, January, Chapter 3, pp 23-34.
Minsky, H (1982): “Can “it” happen again?”, Essays on Instability and Finance, Armonk: M E Sharpe.
Mises, L v (1912): The theory of money and credit, Foundation for Economic Education 1971, reprint, New York.
Mishkin, F S (2003): “U.S. stock market crashes and their aftermath: implications for monetary policy”, in W Hunter, G Kaufman and M Pomerleano (eds) Asset Price Bubbles: The Implications for Monetary, Regulatory, and International Policies, MIT press, January, Chapter 6, pp 53-80.
Modigliani, F and R A Cohn (1979): “Inflation, rational valuation and the market”, Financial Analysts Journal, 35, pp 24-44.
Mulligan, C (2001): “Capital, interest, and aggregate intertemporal substitution during the 20th century”, University of Chicago working paper, August.
Mussa, M (2000a): “Factors driving global economic integration”, in Global Economic Integration: Opportunities and Challenges, A symposium sponsored by the Federal Reserve Bank of Kansas City, Jackson Hole, Wyoming, 24-26 August.
——— (2000b): “Reflections on monetary policy at low inflation”, Journal of Money, Credit and Banking, 32 (4), Part 2, November, pp 1100-06.
——— (2003): “Asset prices and monetary policy”, in W Hunter, G Kaufman and M Pomerleano (eds) Asset Price Bubbles: The Implications for Monetary, Regulatory, and International Policies, MIT press, January, Chapter 5, pp 41-52.
Neiss, K and E Nelson (2001): “The real interest rate gap as an inflation indicator,” Bank of England Working Paper, No 130.
Nelson, E and K Nikolov (2001): “UK Inflation in the 1970s and the 1980s: the role of output gap mismeasurement”, Bank of England Working Paper, No 148, December.
Neumann, M J M and J von Hagen (2002): “Does inflation targeting matter?”, Federal Reserve Bank of St Louis Review, 84 (4), pp 127-48.
Obstfeld, M and A M Taylor (1998): “The great depression as a watershed: international capital mobility over the long run”, In Bordo, M D, C D Goldin and E N White, eds, The defining moment: the great depression and the American economy in the twentieth century, Chicago: University of Chicago Press, pp 353-402.
Okina, K, M Shirakawa and S Shiratsuka (2001): “The asset price bubble and monetary policy: Japan’s experience in the late 1980s and the lessons”, Monetary and Economic Studies (Special Edition), February, pp 395-450.
Okina, K and S Shiratsuka (2001): “Asset price bubbles, price stability and monetary policy: Japan’s experience”, IMES Discuss Paper Series, No 2001-E-16, Japan.

58 BIS Papers No 19
Oliner, S and D Sichel (2002): “Information technology and productivity: where are we now and where are we going?”, Federal Reserve Board, Finance and Economics Discussion Papers, No 2002-29, May.
Onatski, A and J H Stock (2000): “Robust monetary policy under model uncertainty in a small model of the US economy”, NBER Working Paper, No w7490, January.
Organisation for Economic Co-operation and Development (1994): Banks under stress, Paris.
Orphanides, A (2000): “The quest of prosperity without inflation”, European Central Bank Working Paper, No 15, March.
——— (2001): “Monetary policy rules based on real-time data”, American Economic Review, September.
Padoa-Schioppa, T (2002): “Central banks and financial stability”, paper presented at the second biennial ECB conference The Transformation of the European Financial System, Frankfurt, 24-25 October.
Padoa-Schioppa, T and F Saccomanni (1994): “Managing a market-led global financial system”, in Managing the World Economy: Fifty Years After Bretton Woods, Washington, IIE, p 235-68.
Perrier, P and R Amano (2000): “Credibility and monetary policy”, Bank of Canada Review, Spring, pp 11-17.
Phelps, E (1968): “Money, wage dynamics and unemployment equilibrium”, Journal of Political Economy, 76 (4), Part 2, pp 678-711.
Pigou, A (1929): Industrial fluctuations, 2nd rev, ed, London: Macmillan.
Radelet, S and J Sachs (1998): “The East Asian financial crisis: diagnosis, remedies, prospects”, Brookings Papers on Economic Activity, 28 (1), pp 1-74.
Reifschneider, D and J Williams (2000): “Three lessons for monetary policy in a low-inflation era”, Journal of Money, Credit and Banking, 32(4), Part 2, November, pp 936-66.
Robertson, D H (1926): Banking policy and the price level, P S King, London.
Romer, C and D Romer (2002): “The evolution of economic understanding and postwar stabilization policy” in Rethinking Stablisation Policy, A symposium sponsored by the Federal Reserve Bank of Kansas City, Jackson Hole, Wyoming, 29-31 August.
Sargent, T and N Wallace (1981): “Some unpleasant monetarist arithmetic”, Federal Reserve Bank of Minneapolis Quarterly Review, Fall, Vol 5, No 3.
Scarpetta, S, A Bassanini, D Pilat and P Schreyer (2000): “Economic growth in the OECD area: recent trends at the aggregate and sectoral level”, OECD Economics Department Working Papers, No 248, June.
Schaechter, A, M Stone and M Zelmer (2000): “Adopting inflation targeting: practical issues for emerging market countries”, IMF Occasional Paper, No 202, December, Washington DC.
Schumpeter, J (1939): Business cycles: a theoretical, historical and statistical analysis of the capitalist process, 2 vols, McGraw-Hill Book Co, Inc.
Segoviano, M and P Lowe (2002): “Internal ratings, the business cycle and capital requirements: some evidence from an emerging market economy”, BIS Working Papers, No 117, September.
Selgin, G (1997): “Less than zero: the case for a falling price level in a growing economy”, IEA Hobart Paper, No 132, The Institute of Economic Affairs, April, London.
Shirakawa, M (2000): “Monetary policy cannot substitute for structural policy”, Financial Markets Department Working Paper, No 00-E-1, Financial Markets Department, Bank of Japan.
Shiratsuka, S (2001): “Asset prices, financial stability, and monetary policy: based on Japan’s experience of the asset price bubble”, BIS Papers, No 1, March, pp 261-84.
Smets, F (1998): “Output gap uncertainty: does it matter for the Taylor rule?”, BIS Working Papers, No 60, November.

BIS Papers No 19 59
Stock, J and M Watson (1991): “A procedure for predicting recessions with leading indicators: econometric issues and recent experience”, in James H Stock and Mark W Watson (eds), Business Cycles, Indicators and Forecasting, The University of Chicago Press, Chicago.
——— (2002): “Has the business cycle changed and why?”, forthcoming NBER Macroeconomics Annual, April, mimeo.
Sutton, G (2002): “Explaining changes in house prices”, BIS Quarterly Review, September, pp 46-55.
Svensson, L (1999): “Price stability as a target for monetary policy: defining and maintaining price stability”, NBER Working Paper, No 7276, August.
——— (2000): “The zero bound in an open economy: a foolproof way of escaping from a liquidity trap”, Bank of Japan, Institute for Monetary and Economic Studies Discussion Paper Series, No 2000-E-23, August.
——— (2002): “Monetary policy and real stabilization”, in Rethinking Stablisation Policy, A symposium sponsored by the Federal Reserve Bank of Kansas City, Jackson Hole, Wyoming, 29-31 August.
Taylor, J B (1999): Monetary policy rules, The University of Chicago press, Chicago and London.
——— (2000): “Low inflation, pass-through, and the pricing power of firms”, European Economic Review, Vol 44, Issue 7, June, pp 1389-408.
Toniolo, G (1988): Central banks’ independence in historical perspective, De Gruyter, ed, Berlin, 1988.
Vickers, J (1999a): “Price stability in the UK”, Glasgow Trades House Lecture, Strathclyde University, 26 May.
——— (1999b): “Asset prices and monetary policy”, Bank of England Quarterly Bulletin, 34, November, pp 478-35.
Viñals, J (2000): “Monetary policy issues in a low inflation environment”, Paper prepared for the conference “Why Price Stability?” organised by the European Central Bank, Frankfurt, Germany, November.
Wicksell, K (1907): “The influence of the rate of interest on prices,” The Economic Journal, June.
Woodford, M (2001): “Fiscal requirements for price stability”, Journal of Money, Credit and Banking, Vol 33, pp 669-728.
——— (2002): “Inflation stabilization and welfare”, Contributions to Macroeconomics, 2 (1), Article 1.
Yamaguchi, Y (1999a): “Asset prices and monetary policy: Japan’s experience”, in New Challenges for Monetary Policy, A symposium sponsored by the Federal Reserve Bank of Kansas City, Jackson Hole, Wyoming, 26-29 August.
——— (1999b): “Monetary policy and structural policy: a Japanese perspective”, Remarks prepared for Colloque Monétaire Internationale at Banque de France, 8-9 October.
Zarnowitz, V (1992): Business cycles: theory, history, indicators and forecasting, University of Chicago Press, Chicago.
——— (1999): “Theory and history behind business cycles: are the 1990s the onset of a golden age?”, NBER Working Paper, 7010, March.
Zhu, H (2002): “The case of the missing commercial real estate cycle”, BIS Quarterly Review, September, pp 56-66.