a systematic review of reese’s evaluation portfolio · · 2013-12-24our review of reese’s...
TRANSCRIPT
A Systematic Review of REESE’s Evaluation
Portfolio Final Report
Conducted For:
National Science Foundation Education and Human Resources Directorate
Division of Research on Learning in Formal and Informal Contexts (DRL)
By: Kwang Suk Yoon
& Mengli Song
American Institutes for Research
July 2009

Review of REESE’s Evaluation Portfolio
TABLE OF CONTENTS
INTRODUCTION ......................................................................................................................3 METHODS ..................................................................................................................................5 RESULTS ....................................................................................................................................8
I. Results of Screening and Selection Processes 8 II. Basic Project Information, Publications, and New Products 11 III. Review of Awards with an Emphasis on Evaluative R&D 14 V. Review of Awards with an Emphasis on Evaluation Capacity Building 16 VI. Review of Awards with an Emphasis on Evaluation of Intervention 16 VII. Effects of Interventions 23 Analyses of Domain-specific Effects 25 Analyses of Effects Aggregated at the Level of Award 31
CONCLUSION .........................................................................................................................33 RECOMMENDATIONS ..........................................................................................................34 REFERENCES ..........................................................................................................................35 APPENDICES ...........................................................................................................................37
A. Descriptions about REESE, EREC, IERI, and ROLE 37 B. REESE Evaluation Portfolio Review Matrix 40 C. Conceptions about the Cycle of Innovation and Learning 50
2
Review of REESE’s Evaluation Portfolio
INTRODUCTION In efforts to improve America’s global competitiveness, many educators and policymakers have sought to reform education in science, technology, engineering, and mathematics (STEM) as strategic fields of teaching and learning. However, it has been keenly realized that STEM education is lacking the essential knowledge base for how to help students learn the critical subject matters (e.g., Hiebert & Grouws, 2007; National Mathematics Advisory Panel, 2008; U.S. Department of Education, 2007). The Academic Competitiveness Council (ACC), for example, reviewed the effectiveness of 105 federally funded education programs aimed at improving America’s competitiveness in STEM fields.1 Of the 115 evaluations reviewed by ACC, only 10 impact evaluations were considered scientifically rigorous, and only 4 found a meaningful positive program impact. ACC concluded that despite decades of significant federal investment, there is a general dearth of evidence of effective practices and activities in STEM education (U.S. Department of Education, 2007).2 ACC also found that many agencies have judged program performance on the basis of inputs (such as number of teachers participating in professional development) or surveys of attitudinal changes. However, as ACC suggested, a more appropriate method to measure program impacts is to assess outcomes, the most direct indicators of effectiveness, and programs should adopt consistent high standards for determining and comparing their impact. ACC recommended that agencies and the federal government at large should foster knowledge of effective practices through improved evaluation. In response to ACC’s call for improving evaluations, NSF has charged the American Institutes for Research (AIR) with the task of providing technical assistance to its Division of Research on Learning in Formal and Informal Settings (DRL) in the Directorate for Education and Human Resources (EHR) (NSFDACS-06D1419). In particular, AIR’s technical assistance was targeted to the Research and Evaluation on Education in Science and Engineering (REESE) program, which draws from three programs previously included in the formal Research, Evaluation, and Communication (REC) portfolio: Research on Learning and Education (ROLE), Evaluation Research and Evaluation Capacity Building (EREC), and Interagency Education Research Initiative (IERI).3 The primary purpose of the REESE program is to advance research at the frontiers of STEM learning, education, and evaluation and to provide the foundation with the knowledge necessary to improve STEM teaching and learning at all educational levels and in all settings. As a signature program of DRL, the REESE portfolio contains a great deal of information about evaluation theories, processes, tools, products, and outcomes. Over the past decade, REESE has
1 ACC catalogued 105 STEM education programs funded in FY 2006 at a total of $3.12 billion. Each agency submitted its best evaluations for the review. Further, ACC identified a total of 24 STEM programs primarily focused on elementary and secondary education outcomes, administered by eight federal agencies, with a total fiscal year 2006 funding of approximately $574 million. NSF administers the largest number of programs and provides the largest amount of funding, with 6 programs and $242 million. 2 Similarly, the RAND Mathematics Study Panel (2003) also reported that efforts to improve students’ proficiency in mathematics have been hampered by “limited and uneven research and research-based development” in such areas as teachers’ mathematical knowledge in ways that are useful for teaching. 3 See Appendix A for brief descriptions about REESE, EREC, IERI, and ROLE.
3

Review of REESE’s Evaluation Portfolio
supported efforts to develop complementary approaches for advancing research, development, and improvement in field-based practices. Further, it has funded projects that have developed new tools, measures, and evaluation methodologies that could move EHR’s evaluation efforts forward at both the program and project levels. However, the evaluation projects funded by REESE and their findings have never been systematically reviewed or brought under scrutiny. In addition, many of the findings and products generated by these projects have not been used by others, and their potential values are yet to be realized. It was time for the DRL to take stock of the nature, outcomes, and impacts of their investments in evaluation portfolios in the field of STEM education. To that end, our research team at AIR conducted a comprehensive and systematic review of REESE’s evaluation portfolio.4 Our review was designed to answer questions about the nature, level, and outcomes of the DRL’s investment in specific thematic areas (i.e., evaluation) and to provide a basis for DRL’s critical decision-making and resource-allocation strategies (NSF, 2005). Specifically, our thematic portfolio review was intended to achieve the following objectives:
o Inform future NSF/EHR decisions and investments; o Establish a new knowledge base for evidence-based practices in STEM education; o Help clarify the appropriate role of NSF/EHR in improving STEM education; and o Ensure diversity as well as coherence across the DRL investment portfolio.
Our REESE portfolio review was focused on awards that were granted over the last 10 years by the three programs (EREC, IERI, and ROLE) that form the foundation of REESE’s evaluation portfolio.5 We examined the three programs to identify all the projects that contained a strong emphasis on evaluative research, design, approach, or capacity building. We analyzed each relevant project within the REESE’s evaluation portfolio in terms of its nature (e.g., purpose, cycle of innovation), methodology (e.g., study design, data collection instruments, outcome measures), and outcomes (e.g., effects, products, publications). In the remainder of this report, we first describe the methods of our portfolio review and then present the results of our review and analysis, highlighting both the strengths and the gaps in REESE’s evaluation portfolio. Finally, we make several recommendations for future directions of REESE’s evaluation portfolio.
4 The concept of “portfolio reviews” was introduced by Judith Ramaley, then Assistant Director of NSF’s Directorate for Education and Human Resources (NSF, 2005). Over the last few years, the thematic portfolio review approach has been demonstrated to be a viable method for synthesizing findings from a large portfolio of programs (NSF, 2005; Roberts, 2008; Sherwood & Hanson, 2008; Sztajn, Suter, & Yoon, in preparation; Yoon & Song, 2009). 5 Award’s starting year should be between 1998 and 2007.
4

Review of REESE’s Evaluation Portfolio
METHODS Our review of REESE’s evaluation portfolio is based on a systematic review approach. According to Campbell Collaboration’s guideline (2009), the purpose of a systematic review is to sum up the best available research on a specific question by synthesizing the results of multiple studies. A systematic review uses transparent procedures to find, evaluate, and synthesize findings from relevant research. Procedures are explicitly defined in advance to minimize bias and to ensure that the exercise is transparent and can be replicated. The key elements of a systematic review include:
• Clear inclusion/exclusion criteria; • An explicit search strategy; • Systematic coding and analysis of included studies; and • Meta-analysis (where possible).
The systematic review approach has been used widely for research synthesis. The What Works Clearinghouse of the U.S. Department of Education, for example, uses the approach to conduct reviews in various topic areas. We also employed the systematic review approach to examine the research-based evidence on the effects of teacher professional development on student academic achievement in reading, mathematics, and science (Yoon, Duncan, Lee, Scarloss, & Shapley, 2007). The specific tasks that we performed as part of our systematic review of REESE’s evaluation portfolio are listed below in the order that they were completed:
1. We used NSF’s e-Jacket system to extract relevant information about the awards that were supported by the three REESE programs. This information was collected in the form of abstracts, proposals, and project progress reports (both annual reports and final reports).
2. We developed an elaborate and comprehensive review protocol—Portfolio Review Matrix—that specifies the scope of the review, criteria for selecting projects (or studies) for review, explicit instructions for coding various items in the Portfolio Review Matrix, and definitions of key terms used in the review protocol (e.g., “efficacy” and “effectiveness” as the labels for two intervention study stages; see Appendix B).
3. To facilitate the systematic review process, we developed a Microsoft ACCESS-based program, the Portfolio Review Tool (PRT), which is a computerized product that guides reviewers through a sequence of decision rules and questions to record the following information:
• Project information: PI, organization, duration, amount of award, program elements
• Within-scope versus out-of-scope status
5

Review of REESE’s Evaluation Portfolio
• Program strand (or focus): For example, evaluative research and development (R&D), evaluation capacity building, evaluation of intervention, basic or applied research in areas other than evaluation, professional development
• Degree of emphasis on evaluation • Subject or disciplinary areas • Target groups or grade levels • Cycle of innovation and learning (as defined by DRL) • Publications in peer-reviewed journals • New products • Research designs employed in intervention evaluations • Outcome variables assessed • Data collection instruments used • Effect sizes, if applicable • Evidence of effectiveness
The PRT was built on and completely aligned with the Portfolio Review Matrix. It helps manage and integrate the portfolio review processes, including screening projects, coding project documents, reconciling coding decisions, and synthesizing coding results. The PRT provides an efficient, centralized system of data entry, storage, retrieval, and management as well as a customized query and reporting system. For example, it provides an easy hyperlink access to all the relevant full-text documents (e.g., proposals, annual progress reports) as well as to coding and reconciliation forms for each award under review.
4. We trained four doctoral-level coders in the use of Portfolio Review Matrix and PRT.
5. The trained coders screened out the awards that were out of the scope of this review. The list of reasons for being out of scope can be found in the Portfolio Review Matrix presented in Appendix B. Feasibility studies, for example, were considered out of scope for this review.
6. Using a set of criteria that assess project emphasis on evaluation, we selected a subset of projects within three evaluation-relevant program strands for in-depth analysis. Both steps 5 and 6 were implemented through a double-coding with reconciliation process. In other words, two coders did the screening and coding independently. If there was disagreement in coding decisions between the two coders, a third coder participated in the reconciliation process. Coders met weekly to discuss and resolve issues relevant to coding decisions. A relatively high level of inter-rater agreement (81%) was reached through intensive coder training.
7. We systematically coded each selected award in terms of its nature, methodology, quality and rigor of evaluation design, and outcomes as appropriate. A single-coding with reconciliation-upon-request strategy was employed during this coding stage.
8. Finally, we focused on a subset of awards that assessed the effects of interventions by using rigorous evaluation methods (e.g., randomized controlled trials, quasi-experimental
6

Review of REESE’s Evaluation Portfolio
designs with equating). We computed effect sizes, if applicable and feasible, and determined an effect rating for an intervention’s effect within each relevant outcome domain based on an effect rating scheme developed specifically for this review. Throughout this last stage of review, we used the same single-coding with reconciliation-upon-request strategy.
In the following pages, we present the results of our review and analysis of the REESE evaluation portfolio, starting from the screening process and the selection of awards by program focus on evaluation to the descriptions of selected awards and to in-depth analyses of outcomes of programs.
7

Review of REESE’s Evaluation Portfolio
RESULTS I. Results of Screening and Selection Processes Initially, 585 awards were extracted from e-Jacket for this systematic review of the REESE evaluation portfolio. ROLE made up a little over a half of the total awards (318 awards or 54%). Table 1 shows the distribution of the awards by program and the scope of review. Of the 585 awards, however, 171 were determined to be out of scope of this review. Table 1. Number and percentage of awards in and out of scope, by program
Program Total No. of awards within scope (%)
No. of awards out of scope (%)
EREC 193 (33%) 106 (55%) 87 (45%)
IERI 74 (13%) 44 (59%) 30 (41%)
ROLE 318 (54%) 264 (83%) 54 (17%)
Total 585 (100%) 414 (71%) 171 (29%)
Table 2 shows different dispositions for out of scope of review. Of the 171 projects, about a third were either planning grants or Small Grants for Exploratory Research (SGER). Another third were disposed because they were either contract or technical support work. Twenty-nine projects (17%) were determined to be too old to be included in this portfolio review because they started in1997 or earlier. The remaining 414 awards were subject to the subsequent selection process. Table 2. Number and percentage of out-of-scope awards, by disposition
Disposition No. of awards (%)
Contract or technical support 56 (33%)
Feasibility study 10 (6%)
Lack of document 2 (1%)
Non-STEM and no emphasis on evaluation 12 (7%)
Planning grant or SGER 58 (34%)
Out of timeframe* 29 (17%)
Workshop 4 (2%)
Total 171 (100%)
Note: * The starting year of the awards that were determined to be out of timeframe was between 1988 and 1997. During the selection process, we classified these 414 within-scope projects by their program strand or focus: (1) evaluative R&D, (2) evaluation capacity building, (3) conducting of evaluation of interventions, (4) surveys or data collection, (5) basic or applied R&D in areas other than evaluation, (6) instructional material development, (7) professional development in STEM education, (8) STEM education and capacity building, (9) STEM workforce development, and (10) other (see the Matrix in Appendix B). In this review, we limited our selection of awards
8

Review of REESE’s Evaluation Portfolio
to the first three program strands, which were deemed most relevant to the REESE evaluation portfolio. First, as was specified in the Portfolio Review Matrix, the evaluative R&D program strand is intended to advance the state of the art in evaluation through R&D in evaluation theory, methodology, and practice (e.g., evaluation model, approach or tool, conceptual framework, logic model, data collection, data analysis, statistics, instrumentation, measurement and assessment). Second, the evaluation capacity building program strand is meant to enhance evaluation capacity and infrastructure through education and training, the development of evaluation knowledge and skills, and the creation of evaluation resources useful for the field in general (e.g., degree program, learning community, partnership, organization, database system, resources). As to the third program strand, interventions were broadly defined to include program, product, or policy. Examples of the evaluation of interventions include implementation evaluation, impact study, assessment of the efficacy or effectiveness of an intervention, or analysis of cost and benefits.6 As a result, of the 414 awards that fell within the scope of review, 228 met the selection criteria (see Table 3). Across all three programs, over half the projects (55%) fell into the three program strands that have a strong emphasis on evaluation, which is the main theme of this portfolio review. Table 3. Number and percentage of selected awards and not-selected awards, by program
Program Total no. of awards within scope
No. of awards selected (%)
No. of awards not selected (%)
EREC 106 63 (59%) 43 (41%)
IERI 44 26 (59%) 18 (41%)
ROLE 264 139 (53%) 125 (47%)
Total 414 228 (55%) 186 (45%)
Table 4 shows the number of other awards that did not have an emphasis on evaluation and therefore were not selected for this review. However, these projects with little or no emphasis on evaluation may be subject to a different set of portfolio reviews. For example, 98 awards were focused on basic or applied research and development in areas outside evaluation. They may form a reasonably large pool of projects for a review of basic/applied STEM education research portfolio supported by DRL. Similarly, 36 projects that were focused on instructional material development may be a good candidate for another portfolio review for such a theme.
6 We will use the terms “evaluation of intervention,” “intervention study,” and “intervention evaluation project” interchangeably.
9

Review of REESE’s Evaluation Portfolio
Table 4. Number of awards that were not selected for review, by program strand (N=186)
Program Strand No. of awards
Surveys (e.g., collection or compilation of data) 2
Basic or applied research and development in areas other than evaluation (e.g., formulation of a theory of STEM education) 98
Instructional material development (e.g., model, curriculum, tool, resources, technology) in STEM education 36
Professional development in STEM education for K–12 teachers or college faculty 8
STEM education and capacity building 20
STEM workforce development (e.g., fellowship, internship, recruitment, retention) 9
Other 13
Table 5 shows the number and percentage of the selected awards, broken down by program (as funding source) and by program strand with a focus on evaluation. All 228 awards were to be submitted for further analysis. However, at the time of this writing, further analysis of 139 ROLE awards has not been completed. Instead, we have completed a systematic review of 63 EREC and 27 IERI awards (a total of 89 awards, highlighted in blue). Hence, the remainder of the presentation of this report focuses on the results of our further analysis of these 89 selected awards. As Table 5 indicates, more awards came from EREC than from IERI. Within each program, awards were unevenly distributed across the three evaluation-related program strands. For example, projects involving the evaluation of intervention were disproportionately concentrated in IERI: 73% compared with 35% in EREC. It is not surprising that all evaluation capacity building projects were supported by EREC.
Table 5. Number and percentage of selected awards with three different evaluation strands, by program
Program Evaluative R&D Evaluation capacity building
Evaluation of intervention Total
EREC 23 (37%) 18 (29%) 22 (35%) 63 (100%)
IERI 7 (27%) 0 (0%) 19 (73%) 26 (100%)
ROLE 41 (29%) 1 (0%) 97 (70%) 139 (100%)
Total 71 (31%) 19 (8%) 138 (56%) 228 (100%)
In the next section, we describe these 89 selected awards in terms of basic project characteristics (i.e., target grade level, subject area covered, project period, and funding level), publications, and new products.
10

Review of REESE’s Evaluation Portfolio
II. Basic Project Information, Publications, and New Products Of the 89 projects, 70 were targeted to specific grade levels. As Table 6 shows, all 41 intervention studies (i.e., evaluation of intervention) had specified target grade levels. The great majority of projects that involved evaluation capacity building (13 of 18) were not targeted to specific grade levels. Overall, K–12 levels were the primary focus of the REESE’s evaluation portfolio. Table 6. Number of awards focusing on different target grade levels, by evaluation strand (N=89)
Target grade level Overall Evaluative R&D
Evaluation capacity building
Evaluation of
intervention Total 89 30 18 41
• Target grade levels specified 70 24 5 41
• Target grade levels unspecified or undetermined
19 6 13 0
Target grade levels (check all that apply)
• K–12 Elementary 43 17 4 22
• K–12 Middle 32 17 2 13
• K–12 High 28 11 3 14
• Postsecondary 3 0 1 2
• Undergraduate 10 4 0 6
• Graduate 3 1 1 1
• Other 4 1 1 2
Note: Examples of other target groups or grade levels included college faculty (professoriate) and preschool. Table 7 shows that overall, almost all projects (86) specified the subject areas of their evaluation-related endeavors. Of 86 projects, 69 were solely focused on STEM areas, while 11 were devoted to non-STEM areas (mostly reading). The remaining 6 projects were interested in both STEM and non-STEM areas. As the third panel of Table 7 indicates, among various combinations of STEM areas, mathematics and general science were two major fields that were most often covered by the selected projects. In short, the REESE evaluation portfolio reached beyond STEM education.
11

Review of REESE’s Evaluation Portfolio
Table 7. Number of awards focusing on different subject areas, by evaluation strand (N=89)
Subject area Overall Evaluative R&D
Evaluation capacity building
Evaluation of
intervention Total 89 30 18 41
• Subject areas specified 86 29 16 41
• Subject areas unspecified 3 1 2 0
If subject areas specified: • STEM 69 27 14 28
• Non-STEM 11 1 1 9
• Both STEM and non-STEM 6 1 1 4
Subject areas (check all that apply)
• STEM: science-general 50 17 15 18
• STEM: science-specific 10 5 0 5
• STEM: mathematics 52 22 13 15
• STEM: technology 24 7 11 6
• STEM: engineering 18 6 7 5
• Non-STEM: reading/ English/language arts 14 1 0 13
• Non-STEM: other 2 1 1 0
Note: Two awards did not fall under STEM or reading. These other subjects were accounting and agriculture/natural resource management. We also examined the level of the REESE’s investment in evaluation portfolio in terms of project duration and funding amount. Project duration ranged from 1 to 7 years, with the mean of 3.8 years. The total amount of funding across all 89 awards was $113.5 million. Project-level funding over the entire project period varied substantially from $0.04 to $6.0 million, with the mean of $1.3 million. The average amount of yearly funding was about $0.3 million. Table 8. Overall mean, standard deviation, minimum and maximum of project duration and award amount (N=89) N Mean SD Minimum Maximum
Duration (in year) 89 3.8 1.4 1.0 7.0
Awarded amount (in millions) 89 $1.3 $1.4 $0.04 $6.0
Funding per year (in millions) 89 $0.3 $0.3 $0.0 $1.1
12

Review of REESE’s Evaluation Portfolio
One may ask whether information about the project’s outcomes (e.g., new products, potentially effective interventions) reached the field through publications. Further, the National Research Council (2002) encourages principal investigators (PIs) to disclose their research to professional scrutiny and critique. In that respect, publications in peer-reviewed journals may be used as a proxy of quality and rigor standards in scientific inquiry into educational evaluation. We coded all 89 projects in terms of publications in peer-reviewed journals as well as new products. For the count of publications, we combined three categories of journal articles: (1) already been published, (2) in press, and (3) accepted for publication at the time of submission of a final report. Only 39 of the 89 selected awards have published at least one peer-reviewed journal article over the entire project period. Across all 89 awards, a total of 240 articles made their way into the peer-reviewed journals. The number of publications varied quite widely, from zero to as many as 32 over their entire project periods, with the mean of 2.7 journal articles. The number of publications per year ranged from zero to 6.4, with the mean of 0.6. Note, however, that some PIs seem to have reported publications that may be marginally related to the current project. Note also that some PIs may have published additional articles relevant to the funded projects after they submitted their final report. Table 9. Overall mean, standard deviation, minimum, and maximum of number of publications and new products (N=89) N Mean SD Minimum Maximum
Number of publications 89 2.7 5.4 0.0 32.0
Publications per year 89 0.6 1.1 0.0 6.4
Number of new products 89 1.4 1.4 0.0 8.0
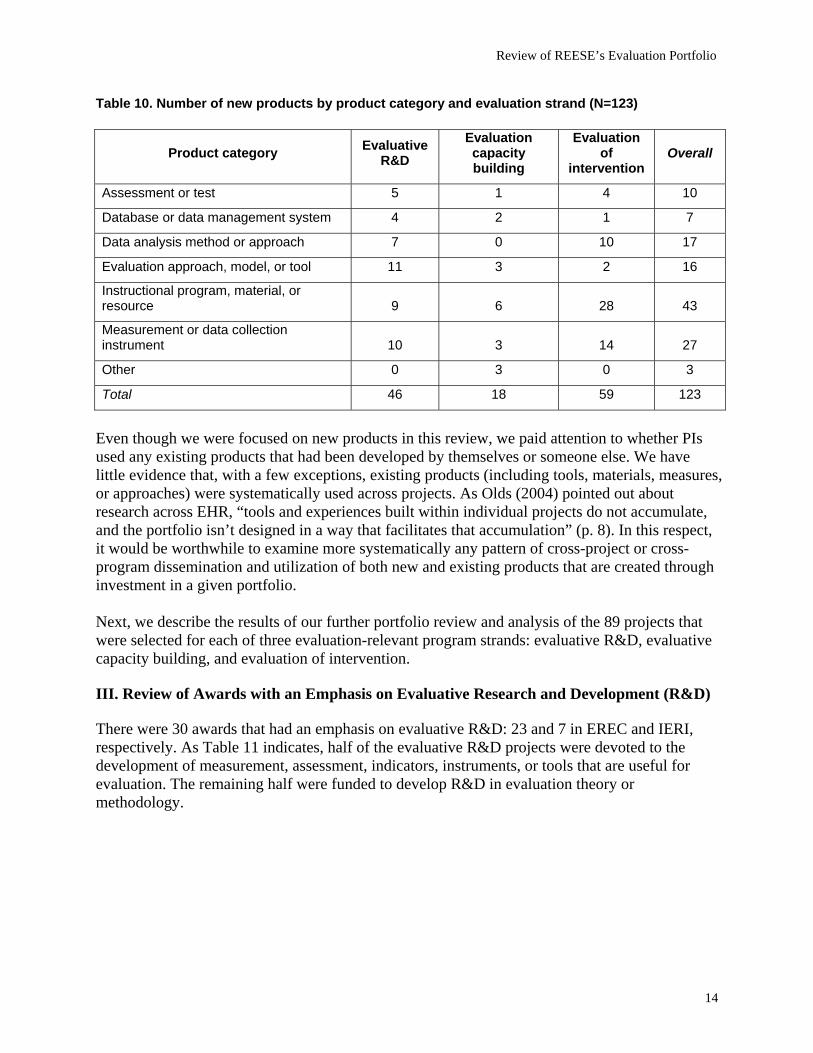
On average, IERI-supported projects produced more peer-reviewed journal articles than EREC-supported counterparts (6.8 compared with 1.0). Intervention evaluation projects published more than the others: 4.2 compared with 2.0 and 0.4 for evaluative R&D and evaluation capacity building projects, respectively. Note that the total number of publications was correlated with both the total amount of funding and the project duration. Further, the number of publications per year was correlated with the amount of funding per year: r = 0.40 (p < .001) among the 89 awards. Across all 89 awards, 123 new products have been developed. Sixty-seven of the 89 awards produced at least one new product over their entire project period. The number of new products reported per project ranged from zero to 8, with the mean of 1.4. Overall, instructional program, material, or resource was the most favorite new product category, followed by new measures or data collection instruments (e.g., surveys). For obvious reason, the type of products produced by the awarded projects varied by their program strand. For example, while evaluative R&D projects generated a few new evaluation approaches, models, or tools, intervention studies created a substantial number of new instructional programs, materials, or resources.
13
Review of REESE’s Evaluation Portfolio
Table 10. Number of new products by product category and evaluation strand (N=123)
Product category Evaluative R&D
Evaluation capacity building
Evaluation of
intervention Overall
Assessment or test 5 1 4 10
Database or data management system 4 2 1 7
Data analysis method or approach 7 0 10 17
Evaluation approach, model, or tool 11 3 2 16
Instructional program, material, or resource 9 6 28 43
Measurement or data collection instrument 10 3 14 27
Other 0 3 0 3
Total 46 18 59 123
Even though we were focused on new products in this review, we paid attention to whether PIs used any existing products that had been developed by themselves or someone else. We have little evidence that, with a few exceptions, existing products (including tools, materials, measures, or approaches) were systematically used across projects. As Olds (2004) pointed out about research across EHR, “tools and experiences built within individual projects do not accumulate, and the portfolio isn’t designed in a way that facilitates that accumulation” (p. 8). In this respect, it would be worthwhile to examine more systematically any pattern of cross-project or cross-program dissemination and utilization of both new and existing products that are created through investment in a given portfolio. Next, we describe the results of our further portfolio review and analysis of the 89 projects that were selected for each of three evaluation-relevant program strands: evaluative R&D, evaluative capacity building, and evaluation of intervention. III. Review of Awards with an Emphasis on Evaluative Research and Development (R&D)
There were 30 awards that had an emphasis on evaluative R&D: 23 and 7 in EREC and IERI, respectively. As Table 11 indicates, half of the evaluative R&D projects were devoted to the development of measurement, assessment, indicators, instruments, or tools that are useful for evaluation. The remaining half were funded to develop R&D in evaluation theory or methodology.
14

Review of REESE’s Evaluation Portfolio
Table 11. Number of awards with an emphasis on evaluative R&D, by type of R&D (N=30)
Type of R&D No. of awards
R&D in evaluation theory, conceptual framework, or evaluation models 6
R&D in evaluation methodology (e.g., study design, data collection, data analysis methods) 9
Development of measurement, assessment, indicators, instruments, or tools that are useful for evaluation 15
Development of new models or approaches for disseminating evaluation findings 0
Synthesis of existing evaluation and research results from multidisciplinary perspectives, meta-analysis, or organization of conference to seek clarity and consensus on evaluations methods
0
Other 0
We catalogued the selected projects in terms of DRL’s cycle of innovation and learning to determine how well REESE’s evaluation portfolio mapped to the cycle. This cycle was adapted from the RAND Mathematics Study Panel’s cycle of discovery, innovation, and application and then subsequently revised to the current conception of the cycle of innovation and learning, which spans from the “synthesize and theorize” part to the “scale-up and study effectiveness” part.7 Table 12 shows that the great majority of evaluative R&D projects were primarily mapped to the “design, develop, and test” part (19) or to the “hypothesize and clarify” part (10) of the cycle. Consistent with the finding from another thematic portfolio review undertaken with regard to mathematics education (NSF, 2005), the REESE’s evaluation portfolio is relatively short-changed on the “synthesize and theorize” part, which may cause some concern about its potentially weak research foundation. Table 12. Number of awards with an emphasis on evaluative R&D that maps to different parts of the cycle of innovation and learning (N=30)
Cycle of innovation and learning No. of awards No. of awards with
a primary cycle Synthesize and theorize 2 1
Hypothesize and clarify 15 10
Design, develop, and test 22 19
Implement, study efficacy, and improve 1 0
Scale-up and study effectiveness 1 0
7 See Appendix C for a note on different versions of the cycle of innovation and learning.
15

Review of REESE’s Evaluation Portfolio
IV. Review of Awards with an Emphasis on Evaluation Capacity Building There were 18 awards with the program emphasis on evaluation capacity building. Consistent with its program goal, all 18 came from EREC, which stands for Evaluative Research and Evaluation Capacity Building; none were from IERI. As Table 13 shows, the majority of evaluation capacity building projects was concentrated in the area of education and training. Eleven projects were designed to create such training opportunities for the development of evaluation knowledge and skills as part of building evaluation capacity in the field. Table 13. Number of awards with an emphasis on evaluative capacity building, by the nature of capacity building (N=18)
Nature of capacity building No. of awards
Creating education or training opportunities for the development of evaluation knowledge and skills 11
Establishing professional communities, groups, networks, or partnerships to support evaluation practices 3
Compilation and dissemination of resources useful for evaluation such as data center or database system 3
Other 1
Note: The “other” category includes developing a model of evaluation capacity building. V. Review of Awards with an Emphasis on Evaluation of Intervention There were 41 awards with an emphasis on evaluation of intervention: 22 and 19 in EREC and IERI, respectively. In this review, interventions were broadly defined to include programs, products, or policies. Examples of intervention evaluation projects include implementation evaluation, impact study, assessment of effectiveness, and analysis of cost and benefits. Because these 41 awards conducted actual evaluations of interventions by using different study designs, collecting empirical data, measuring variables, and assessing the effects of their interventions, we coded them in terms of key methodological elements as well as effectiveness. As Table 14 indicates, two types of interventions were most commonly studied in REESE projects emphasizing intervention evaluation: (1) instructional programs, materials, or resources and (2) large-scale educational reform programs such as Urban Systemic Initiatives (USI) or Success for All (14 projects for each type). Fewer projects focused on teacher professional development programs or pedagogical approaches.
16

Review of REESE’s Evaluation Portfolio
Table 14. Number of awards with an emphasis on evaluation of intervention, by type of intervention (N=41)
Type of intervention No. of awards
Instructional programs/curriculum, materials, or resources (e.g., Connected Math) 14
Pedagogical approach or teaching practice (e.g., ability grouping, peer-assisted learning) 5
Professional development programs or models 6
Educational reform/improvement initiative or program (e.g., USI, Women in Engineering) 14
Other 2
Note: Examples of other intervention type include undergraduate scholarship program and university based science and engineering research centers. Based on DRL’s definition of the cycle of innovation and learning, the majority of intervention evaluation projects were primarily mapped to the “implement, study efficacy, and improve” part (14 projects) or to the “scale-up and study effectiveness” part (24 projects) of the cycle.8 But several projects may encompass multiple parts of the cycle. Some projects may stretch from the “hypothesize and clarify” to “design, develop, and test” an intervention and to either “implement, study efficacy, and improve” or “scale-up and study effectiveness” (see Table 15). Table 15. Number of selected awards with an emphasis on evaluation of intervention that maps to different parts of the cycle of innovation and learning (N=41)
Cycle of innovation and learning No. of awards No. of awards with a primary cycle
Synthesize and theorize 1 0
Hypothesize and clarify 9 0
Design, develop, and test 24 1
Implement, study efficacy, and improve 20 14
Scale-up and study effectiveness 25 24
All 41 intervention projects involved outcome evaluation; none was solely focused on implementation evaluation. Nine projects were focused on both the implementation and the outcomes of a given intervention.
8 Note that this distinction is based on somewhat loose definition of efficacy and effectiveness.
17
Review of REESE’s Evaluation Portfolio
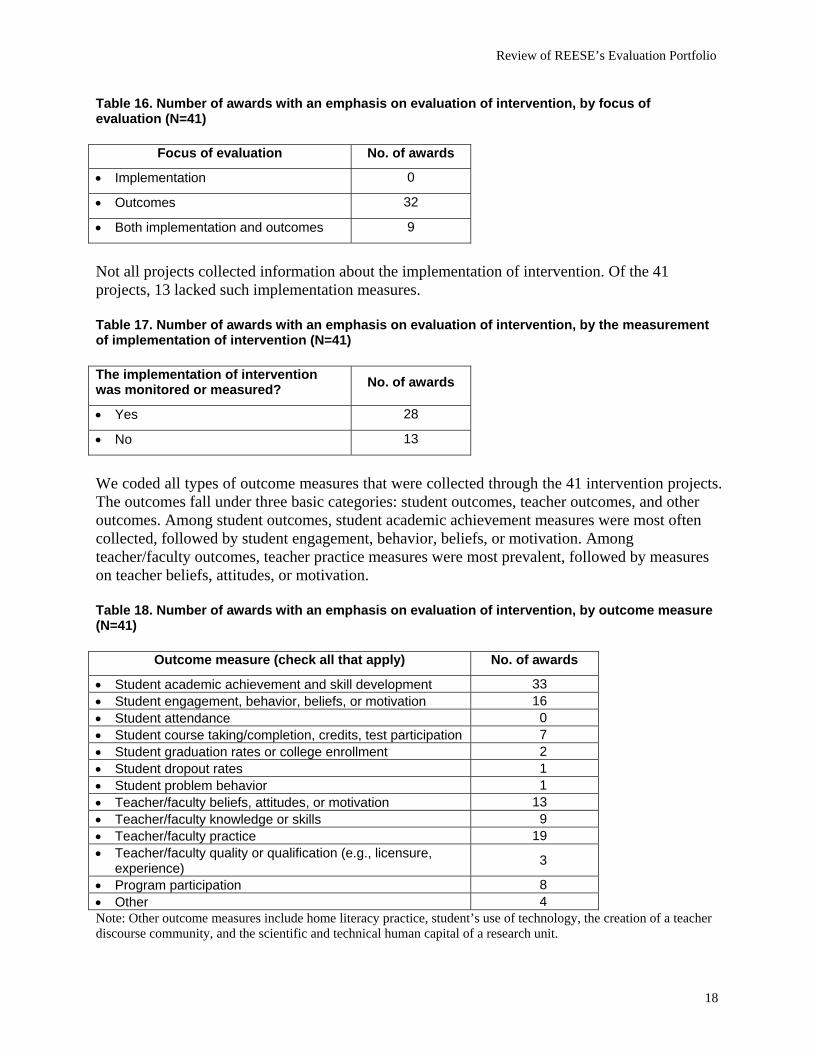
Table 16. Number of awards with an emphasis on evaluation of intervention, by focus of evaluation (N=41)
Focus of evaluation No. of awards
• Implementation 0
• Outcomes 32
• Both implementation and outcomes 9
Not all projects collected information about the implementation of intervention. Of the 41 projects, 13 lacked such implementation measures. Table 17. Number of awards with an emphasis on evaluation of intervention, by the measurement of implementation of intervention (N=41) The implementation of intervention was monitored or measured? No. of awards
• Yes 28
• No 13
We coded all types of outcome measures that were collected through the 41 intervention projects. The outcomes fall under three basic categories: student outcomes, teacher outcomes, and other outcomes. Among student outcomes, student academic achievement measures were most often collected, followed by student engagement, behavior, beliefs, or motivation. Among teacher/faculty outcomes, teacher practice measures were most prevalent, followed by measures on teacher beliefs, attitudes, or motivation. Table 18. Number of awards with an emphasis on evaluation of intervention, by outcome measure (N=41)
Outcome measure (check all that apply) No. of awards
• Student academic achievement and skill development 33 • Student engagement, behavior, beliefs, or motivation 16 • Student attendance 0 • Student course taking/completion, credits, test participation 7 • Student graduation rates or college enrollment 2 • Student dropout rates 1 • Student problem behavior 1 • Teacher/faculty beliefs, attitudes, or motivation 13 • Teacher/faculty knowledge or skills 9 • Teacher/faculty practice 19 • Teacher/faculty quality or qualification (e.g., licensure,
experience) 3
• Program participation 8 • Other 4 Note: Other outcome measures include home literacy practice, student’s use of technology, the creation of a teacher discourse community, and the scientific and technical human capital of a research unit.
18
Review of REESE’s Evaluation Portfolio
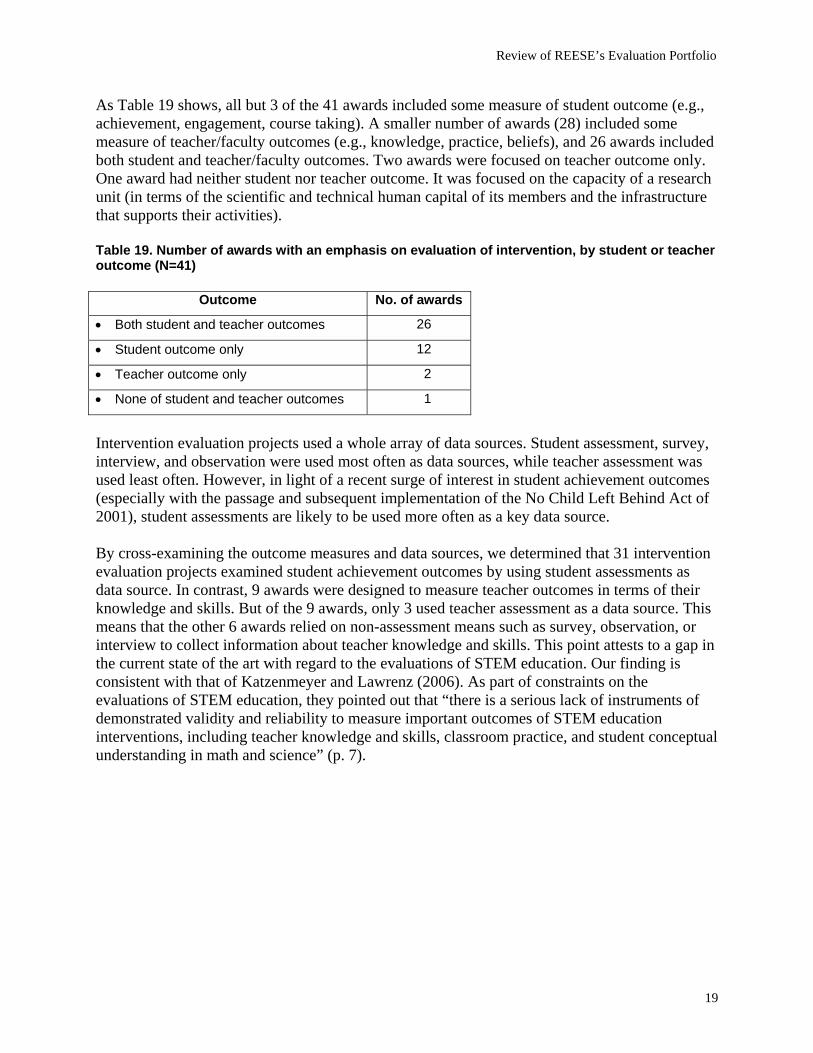
As Table 19 shows, all but 3 of the 41 awards included some measure of student outcome (e.g., achievement, engagement, course taking). A smaller number of awards (28) included some measure of teacher/faculty outcomes (e.g., knowledge, practice, beliefs), and 26 awards included both student and teacher/faculty outcomes. Two awards were focused on teacher outcome only. One award had neither student nor teacher outcome. It was focused on the capacity of a research unit (in terms of the scientific and technical human capital of its members and the infrastructure that supports their activities). Table 19. Number of awards with an emphasis on evaluation of intervention, by student or teacher outcome (N=41)
Outcome No. of awards
• Both student and teacher outcomes 26
• Student outcome only 12
• Teacher outcome only 2
• None of student and teacher outcomes 1
Intervention evaluation projects used a whole array of data sources. Student assessment, survey, interview, and observation were used most often as data sources, while teacher assessment was used least often. However, in light of a recent surge of interest in student achievement outcomes (especially with the passage and subsequent implementation of the No Child Left Behind Act of 2001), student assessments are likely to be used more often as a key data source. By cross-examining the outcome measures and data sources, we determined that 31 intervention evaluation projects examined student achievement outcomes by using student assessments as data source. In contrast, 9 awards were designed to measure teacher outcomes in terms of their knowledge and skills. But of the 9 awards, only 3 used teacher assessment as a data source. This means that the other 6 awards relied on non-assessment means such as survey, observation, or interview to collect information about teacher knowledge and skills. This point attests to a gap in the current state of the art with regard to the evaluations of STEM education. Our finding is consistent with that of Katzenmeyer and Lawrenz (2006). As part of constraints on the evaluations of STEM education, they pointed out that “there is a serious lack of instruments of demonstrated validity and reliability to measure important outcomes of STEM education interventions, including teacher knowledge and skills, classroom practice, and student conceptual understanding in math and science” (p. 7).
19
Review of REESE’s Evaluation Portfolio
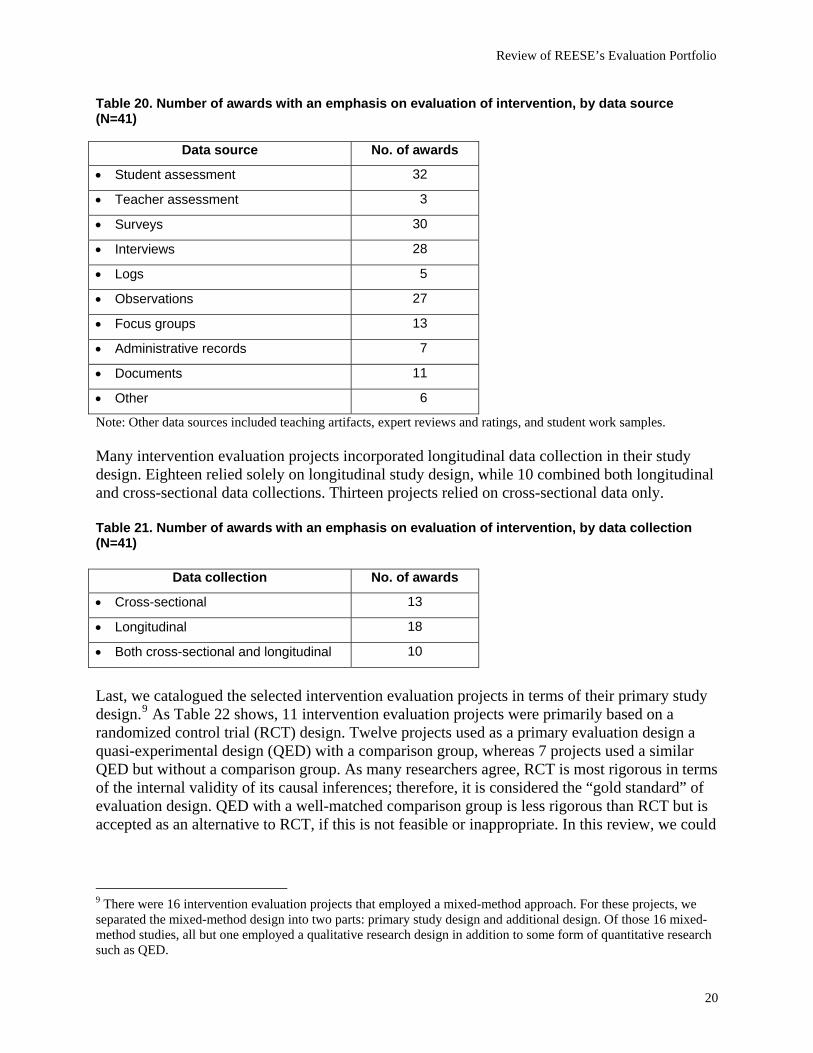
Table 20. Number of awards with an emphasis on evaluation of intervention, by data source (N=41)
Data source No. of awards
• Student assessment 32
• Teacher assessment 3
• Surveys 30
• Interviews 28
• Logs 5
• Observations 27
• Focus groups 13
• Administrative records 7
• Documents 11
• Other 6
Note: Other data sources included teaching artifacts, expert reviews and ratings, and student work samples. Many intervention evaluation projects incorporated longitudinal data collection in their study design. Eighteen relied solely on longitudinal study design, while 10 combined both longitudinal and cross-sectional data collections. Thirteen projects relied on cross-sectional data only. Table 21. Number of awards with an emphasis on evaluation of intervention, by data collection (N=41)
Data collection No. of awards
• Cross-sectional 13
• Longitudinal 18
• Both cross-sectional and longitudinal 10
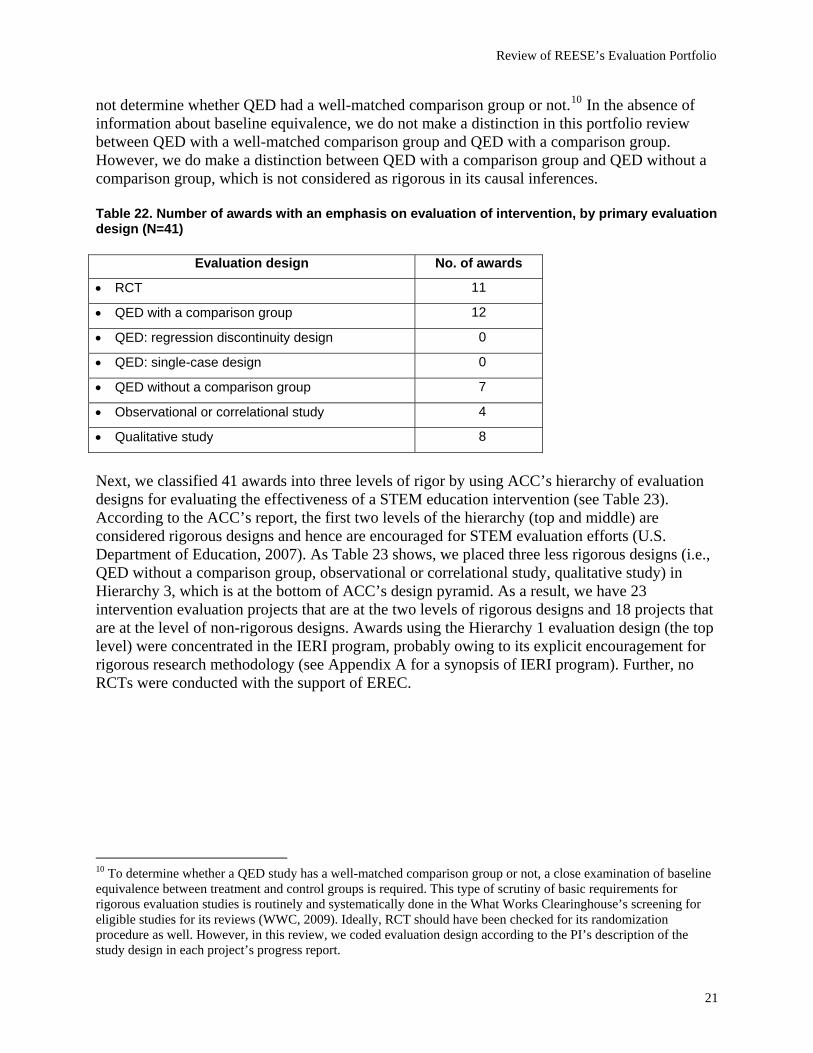
Last, we catalogued the selected intervention evaluation projects in terms of their primary study design.9 As Table 22 shows, 11 intervention evaluation projects were primarily based on a randomized control trial (RCT) design. Twelve projects used as a primary evaluation design a quasi-experimental design (QED) with a comparison group, whereas 7 projects used a similar QED but without a comparison group. As many researchers agree, RCT is most rigorous in terms of the internal validity of its causal inferences; therefore, it is considered the “gold standard” of evaluation design. QED with a well-matched comparison group is less rigorous than RCT but is accepted as an alternative to RCT, if this is not feasible or inappropriate. In this review, we could
9 There were 16 intervention evaluation projects that employed a mixed-method approach. For these projects, we separated the mixed-method design into two parts: primary study design and additional design. Of those 16 mixed-method studies, all but one employed a qualitative research design in addition to some form of quantitative research such as QED.
20
Review of REESE’s Evaluation Portfolio
not determine whether QED had a well-matched comparison group or not.10 In the absence of information about baseline equivalence, we do not make a distinction in this portfolio review between QED with a well-matched comparison group and QED with a comparison group. However, we do make a distinction between QED with a comparison group and QED without a comparison group, which is not considered as rigorous in its causal inferences. Table 22. Number of awards with an emphasis on evaluation of intervention, by primary evaluation design (N=41)
Evaluation design No. of awards
• RCT 11
• QED with a comparison group 12
• QED: regression discontinuity design 0
• QED: single-case design 0
• QED without a comparison group 7
• Observational or correlational study 4
• Qualitative study 8
Next, we classified 41 awards into three levels of rigor by using ACC’s hierarchy of evaluation designs for evaluating the effectiveness of a STEM education intervention (see Table 23). According to the ACC’s report, the first two levels of the hierarchy (top and middle) are considered rigorous designs and hence are encouraged for STEM evaluation efforts (U.S. Department of Education, 2007). As Table 23 shows, we placed three less rigorous designs (i.e., QED without a comparison group, observational or correlational study, qualitative study) in Hierarchy 3, which is at the bottom of ACC’s design pyramid. As a result, we have 23 intervention evaluation projects that are at the two levels of rigorous designs and 18 projects that are at the level of non-rigorous designs. Awards using the Hierarchy 1 evaluation design (the top level) were concentrated in the IERI program, probably owing to its explicit encouragement for rigorous research methodology (see Appendix A for a synopsis of IERI program). Further, no RCTs were conducted with the support of EREC.
10 To determine whether a QED study has a well-matched comparison group or not, a close examination of baseline equivalence between treatment and control groups is required. This type of scrutiny of basic requirements for rigorous evaluation studies is routinely and systematically done in the What Works Clearinghouse’s screening for eligible studies for its reviews (WWC, 2009). Ideally, RCT should have been checked for its randomization procedure as well. However, in this review, we coded evaluation design according to the PI’s description of the study design in each project’s progress report.
21

Review of REESE’s Evaluation Portfolio
Table 23. Number of awards with an emphasis on evaluation of intervention, by the ACC’s hierarchy of evaluation design and by program (N=41)
Hierarchy of evaluation design Overall EREC IERI
• Hierarchy 1 (the top level): RCT 11 0 11
• Hierarchy 2 (the middle level): QED with a comparison group 12 7 5
• Hierarchy 3 (the bottom level): QED without a comparison group or other designs 18 15 3
As Table 24 shows, different types of interventions were evaluated with different study designs that varied in rigor. For example, most of the intervention evaluation projects involving instructional programs or materials were done with two rigorous designs (six in Hierarchy 1, and five in Hierarchy 2). However, none of projects on the effects of large-scale school reform programs was undertaken with the use of RCT (i.e., Hierarchy 1 design). Table 24. Number of awards with an emphasis on evaluation of intervention, by type of intervention and by the ACC’s hierarchy of evaluation design (N=41)
Type of intervention Total no. of awards
Hierarchy 1 (top level)
Hierarchy 2 (middle level)
Hierarchy 3 (bottom level)
Instructional programs/curriculum, materials, or resources 14 6 5 3
Pedagogical approach or teaching practice 5 3 1 1
Professional development programs or models 6 2 2 2
Educational reform/improvement initiative or program 14 0 3 11
Other 2 0 1 1
We recognize that RCT is the most rigorous and appropriate evaluation method to substantiate the effectiveness of interventions (Boruch, 1997; Campbell & Stanley, 1963; Raudenbush, 2005). However, we also acknowledge that a multimethod approach is appropriate in some evaluation contexts (Confrey, 2006; NRC, 2004). Raudenbush (2005) stated that “well-designed randomized experiments are … necessary but not sufficient for determining what works” (p. 29). However, he also stressed the importance of methodological diversity by saying that other complementary studies and appropriate research methods are needed, for example, to identify promising interventions or to define relevant outcomes. However, given the ACC’s strong emphasis on the use of rigorous evaluation designs, we decided to limit our further review of the effectiveness of interventions to those 23 studies that are based on either RCT or QED with a comparison group (as highlighted in blue in Table 23). The remainder of this report is devoted to findings from our analysis of intervention effects.
22
Review of REESE’s Evaluation Portfolio
VII. Effects of Interventions In this section, we address one of the most compelling questions about REESE’s evaluation portfolio; that is, to what extent were the interventions that were tested under the REESE evaluation portfolio effective? Upon ACC’s recommendation, during this review process, we attempted to use high standards for determining and comparing intervention effects consistently across projects. We examined the effectiveness of the interventions in terms of the following seven dimensions:
1. Program as a main source of funding: EREC versus IERI 2. Intervention type: Instructional-pedagogical models, programs, and materials versus
professional development (other type was excluded from this analysis) 3. Intervention maturity: New versus existing 4. Subject: STEM versus reading/language arts (other subject was excluded from this
analysis) 5. Student outcome: Achievement outcome versus non-achievement outcomes (e.g.,
motivation, engagement) 6. Study design: RCT versus QED 7. Developer of measures: PI-developed measures versus standardized measures
It should be noted that this analysis of the effectiveness of interventions is restricted to those 23 awards that employed rigorous evaluation designs that ensure some confidence in the internal validity of causal inferences. Of the 23 awards, 20 focused on a single intervention, and 3 involved multiple interventions. For the purpose of our analyses, each intervention was treated as if it were a separate study. Further, each intervention may have examined outcomes in multiple domains. For example, a study of instructional intervention called “Global Learning and Observations to Benefit the Environment (GLOBE)” had examined across six disparate domains of student science learning outcomes: (1) conceptual understanding of science and environmental awareness, (3) inquiry skills, (4) problem-solving skills, (5) attitudes toward science, and (6) intention to pursue science career. Except for the first domain, which was assessed with three different measures, all were assessed with a single measure. In other words, when a number of related measures (e.g., scales score from different tests) are used to assess a similar learning outcome in a given domain (e.g., reading comprehension), they are combined to determine the overall effect of a given intervention within the specific domain. Each domain represents a construct that is distinct from the constructs represented by other domains. In short, we assessed the effects of GLOBE on each of the six domains of outcome in science education, resulting in six separate domain-specific effects. Owing to multiple interventions within awards, we have a total of 27 interventions that had been implemented and evaluated across 23 awards. In addition, owing to multiple outcome domains (e.g., fluency, problem solving, fractions) within interventions and awards, we have 82 separate domain-specific effects across 27 interventions (and 23 awards). Note that the number of outcome domains per award varied from 1 to as many as 11. We first examined this set of 82 estimated effects as a basic unit of our further analysis. Then, at the end, we looked at 23 average effects that are aggregated at the award level.
23

Review of REESE’s Evaluation Portfolio
To synthesize and compare effects across a number of awards and interventions, we calculated effect size, whenever applicable and possible, as a standardized measure (or indicator) of effectiveness. Effect-size measures play an important role in meta-analysis studies or systematic reviews that summarize findings from a specific area of research. In practical situations, effect sizes are helpful for making decisions, because a highly significant relationship between a set of variables may be uninteresting if its effect size is small. Ideally, effects should be examined and compared within specific domains such as measurement, fractions, or reading comprehension. However, there were so many disparate—often idiosyncratic—domains across the REESE portfolio that we would have had only a limited number of effects within the same domains (e.g., student’s engagement in constructivist practice, science inquiry skills, reading fluency). For that reason, in this review, we examined effect measures across all domains to estimate the global effectiveness at the portfolio level. Only 8 awards reported any effect size (ES) in their progress reports. A total of 20 sets of ESs were provided by the 8 awards.11 We attempted to compute ES independently from what PIs provided in their reports. But many intervention studies failed to provide the basic information, such as mean, standard deviation, or sample size, that is necessary to compute ES. In one study, for example, means were plotted in the figures of the progress report, but the actual values of the means were not reported in the document. We were able to compute any ES for only 5 awards. A total of 10 sets of ES were computed for the 5 awards. However, in only two studies did ESs provided by PIs overlap with those computed by us. In one study, the results of ES were identical; in the other study, they were substantially different. In this case, a set of ESs we computed supersedes that provided by PIs when we determine the effectiveness of intervention. Table 25. Overall mean, standard deviation, minimum and maximum of effect sizes
No. of effect
size set Mean SD Minimum Maximum
ES PI provided 20 0.6 0.4 –0.14 1.1
ES we computed 10 0.3 0.4 –0.31 0.96
Because information about ES was available for so limited number of awards, we could not use it to estimate the effectiveness of all 27 interventions (supported by 23 awards). To handle this situation, we created an alternative standardized index of effectiveness, which we called effect rating. This effect rating was based on all available information about 82 domain-specific effects. They include ES (whether provided by PI or computed by us) and narratives about study findings that PIs documented in their progress reports. Many times, PIs provided narratives about their domain-specific findings even if they failed to report ES.12
11 In cases with multiple measures within a domain, ES was calculated for each of the multiple measures. Then an average was computed across the multiple ESs within the domain. Hence, we call a set of estimated ESs per each study. 12 The following is an example of a PI-provided narrative on a finding in a specific domain. Children in the Wide Reading intervention outperformed control children, t (39) = 1.76, p = .087, whereas the FORI children did not, t (39) = .74, p = .466.
24

Review of REESE’s Evaluation Portfolio
We used the following rule to determine a rating for each of the 82 domain-specific effects; each effect rating is based on a categorical variable whose value ranges from 1 (significantly positive effect) to 7 (effect undetermined):
1. Significantly positive effect: all effect estimates are significant and positive 2. Potentially positive effect: (1) effect estimates include both significant positive effect(s)
and non-significant effect(s) OR (2) all effect estimates are significantly positive, but with reservations (e.g., lack of correction, low outcome reliability)
3. No effect: all effect estimates are non-significant 4. Mixed effects: effect estimates include both significant positive effect(s) AND significant
negative effect(s) 5. Potentially negative effect: (1) effect estimates include both significant negative effect(s)
and non-significant effect(s) OR (2) all effect estimates are significantly negative, but with reservations (e.g., lack of correction, low outcome reliability)
6. Significantly negative effect: all effect estimates are significant and negative 7. Effect undetermined: insufficient evidence for determining the intervention’s effects (e.g.,
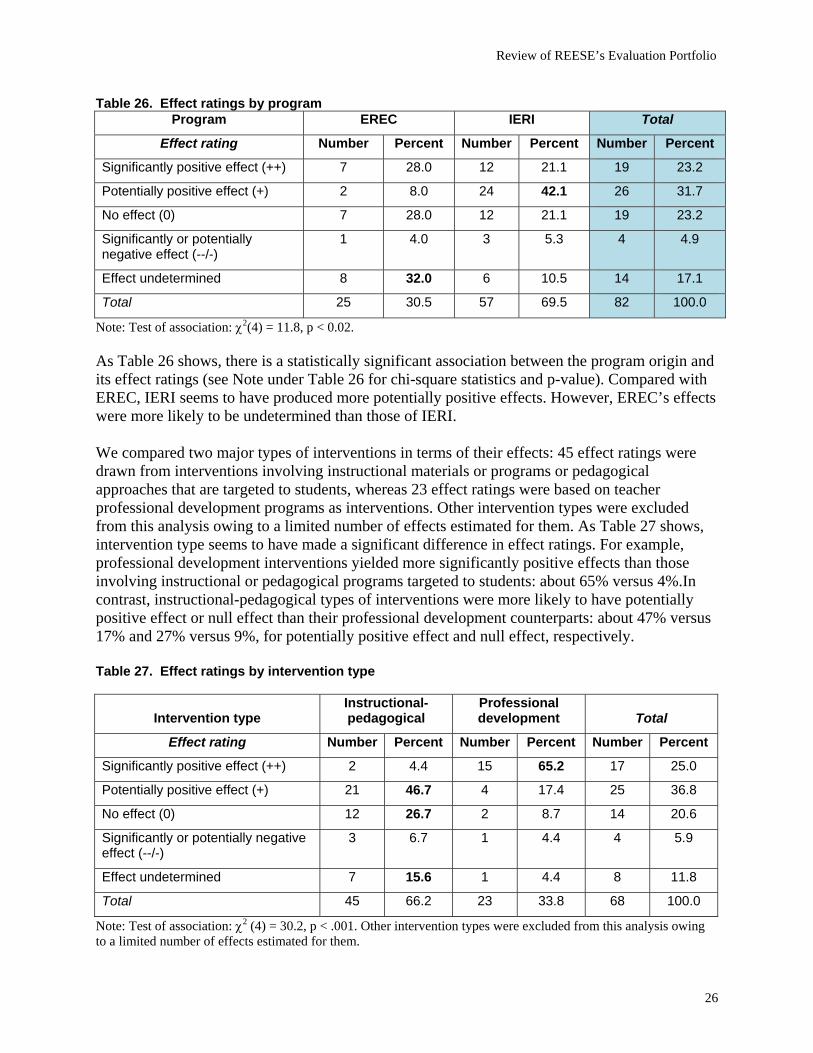
there is no information about the significance of a given estimated effect) In the remainder of this report, we present the results of the analysis of effect ratings in terms of the seven intervention dimensions (e.g., study design, maturity of intervention). First, we describe the results of analyses of 82 domain-specific effects. Then, we report on the results of analyses of effects that were aggregated at the level of award. See the Portfolio Review Matrix in Appendix B for the specific information that we systematically coded and analyzed to summarize the effects of interventions. Analyses of domain-specific effects Because effect ratings are categorical measures, we used a cross-tabulation procedure to examine whether they are associated with each of the seven intervention dimensions. In addition, we computed χ2 (chi-square) statistics to determine the significance of the association. As Table 26 shows, of 82 domain-specific effects, 19 (or 23%) were significantly positive. The largest number (26) of effects was potentially positive. However, 19 domain-specific findings were determined to have no effect. We found 4 significantly or potentially negative effects. The remaining 14 findings could not be determined for their effectiveness owing to the lack of necessary information such as the statistical significance level of means or coefficients. Note that we found no case of mixed effects, where effect estimates included both significant positive effect(s) and significant negative effect(s). In sum, close to 55% of domain-specific findings were in the direction of positive effects—significantly or potentially.
25
Review of REESE’s Evaluation Portfolio
Table 26. Effect ratings by program Program EREC IERI Total
Effect rating Number Percent Number Percent Number Percent
Significantly positive effect (++) 7 28.0 12 21.1 19 23.2
Potentially positive effect (+) 2 8.0 24 42.1 26 31.7
No effect (0) 7 28.0 12 21.1 19 23.2
Significantly or potentially negative effect (--/-)
1 4.0 3 5.3 4 4.9
Effect undetermined 8 32.0 6 10.5 14 17.1
Total 25 30.5 57 69.5 82 100.0
Note: Test of association: χ2(4) = 11.8, p < 0.02. As Table 26 shows, there is a statistically significant association between the program origin and its effect ratings (see Note under Table 26 for chi-square statistics and p-value). Compared with EREC, IERI seems to have produced more potentially positive effects. However, EREC’s effects were more likely to be undetermined than those of IERI. We compared two major types of interventions in terms of their effects: 45 effect ratings were drawn from interventions involving instructional materials or programs or pedagogical approaches that are targeted to students, whereas 23 effect ratings were based on teacher professional development programs as interventions. Other intervention types were excluded from this analysis owing to a limited number of effects estimated for them. As Table 27 shows, intervention type seems to have made a significant difference in effect ratings. For example, professional development interventions yielded more significantly positive effects than those involving instructional or pedagogical programs targeted to students: about 65% versus 4%.In contrast, instructional-pedagogical types of interventions were more likely to have potentially positive effect or null effect than their professional development counterparts: about 47% versus 17% and 27% versus 9%, for potentially positive effect and null effect, respectively. Table 27. Effect ratings by intervention type
Intervention type Instructional-pedagogical
Professional development Total
Effect rating Number Percent Number Percent Number Percent
Significantly positive effect (++) 2 4.4 15 65.2 17 25.0
Potentially positive effect (+) 21 46.7 4 17.4 25 36.8
No effect (0) 12 26.7 2 8.7 14 20.6
Significantly or potentially negative effect (--/-)
3 6.7 1 4.4 4 5.9
Effect undetermined 7 15.6 1 4.4 8 11.8
Total 45 66.2 23 33.8 68 100.0
Note: Test of association: χ2 (4) = 30.2, p < .001. Other intervention types were excluded from this analysis owing to a limited number of effects estimated for them.
26

Review of REESE’s Evaluation Portfolio
Contrary to our expectations, existing interventions were no more effective than new ones. As Table 28 indicates, both were about equally effective, considering the non-significant result of a test of association between the intervention maturity variable and effect ratings. Table 28. Effect ratings by intervention maturity
Intervention maturity New Existing Total
Effect rating Number Percent Number Percent Number Percent
Significantly positive effect (++) 10 22.7 9 23.7 19 23.2
Potentially positive effect (+) 12 27.3 14 36.8 26 31.7
No effect (0) 10 22.7 9 23.7 19 23.2
Significantly or potentially negative effect (--/-)
3 6.8 1 2.6 4 4.9
Effect undetermined 9 20.5 5 13.2 14 17.1
Total 44 53.7 38 46.3 82 100.0
Note: Test of association: χ2 (4) = 2.0, p = 0.74. The subject area of intervention was significantly related to effect ratings. Compared with reading, STEM-related subjects were more likely to produce potentially positive effects: 44% versus 16%. However, there were more undetermined effects with reading than with STEM subjects: 25% versus 7%. Table 29. Effect ratings by subject
Subject STEM Reading Total
Effect rating Number Percent Number Percent Number Percent
Significantly positive effect (++) 9 20.0 9 28.1 18 23.4
Potentially positive effect (+) 20 44.4 5 15.6 25 32.5
No effect (0) 10 22.2 9 28.1 19 24.7
Significantly or potentially negative effect (--/-)
3 6.7 1 3.1 4 5.2
Effect undetermined 3 6.7 8 25.0 11 14.3
Total 45 58.4 32 41.6 77 100.0
Note: Test of association: χ2 (4) = 10.4, p = 0.03. Other subjects were excluded from this analysis owing to a limited number of effects estimated for them. We grouped a number of student outcomes into academic outcomes (e.g., fractions, conceptual understanding of science, phonemic awareness) and non-academic outcomes (e.g., attitudes toward science, satisfaction with undergraduate education). Other outcomes, such as teacher knowledge and skills, were excluded from this analysis owing to a limited number of effects estimated for them.
27

Review of REESE’s Evaluation Portfolio
We expected that interventions aimed at non-achievement outcomes were more likely to produce significantly positive effects than those aimed at achievement outcomes. The result seems to be consistent with our expectation but was not statistically significant: 40% and 16% for non-achievement-related effects and achievement-related effects, respectively. Table 30. Effect ratings by student outcome
Student outcome Achievement outcome
Non-achievement outcome Total
Effect rating Number Percent Number Percent Number Percent
Significantly positive effect (++) 9 16.1 6 40.0 15 21.1
Potentially positive effect (+) 22 39.3 2 13.3 24 33.8
No effect (0) 14 25.0 4 26.7 18 25.4
Significantly or potentially negative effect (--/-)
3 5.4 0 0.0 3 4.2
Effect undetermined 8 14.3 3 20.0 11 15.5
Total 56 78.9 15 21.1 71 100.0
Note: Test of association: χ2 (4) = 6.6, p = 0.16. Other outcomes were excluded from this analysis owing to a limited number of effects estimated for them. Effect ratings did not significantly differ by study design. However, there is a sign of greater significantly positive effect of QEDs compared with RCTs. RCTs were more likely to produce no effect or potentially positive effect compared with QEDs. None of the results above reached a statistical significance level, though. Table 31. Effect ratings by study design
Study design QED RCT Total
Effect rating Number Percent Number Percent Number Percent
Significantly positive effect (++) 16 31.4 3 9.7 19 23.2
Potentially positive effect (+) 14 27.5 12 38.7 26 31.7
No effect (0) 9 17.7 10 32.3 19 23.2
Significantly or potentially negative effect (--/-)
2 3.9 2 6.5 4 4.9
Effect undetermined 10 19.6 4 12.9 14 17.1
Total 51 62.2 31 37.8 82 100.0
Note: Test of association: χ2 (4) = 7.2, p = 0.12. Last, we examined whether interventions produced more significant effects if these effects were assessed by measures that were developed by PIs. We assumed that, compared with standardized measures (developed by other than PIs), many PI-developed outcome measures were more likely to be aligned with the interventions that were delivered.
28

Review of REESE’s Evaluation Portfolio
The result was somewhat consistent with our expectation and was marginally significant. Effect estimates that were based on PI-developed measures were slightly more likely to be significantly positive than those based on standardized measures: about 33% versus 10%. The chance of producing a null effect with standardized measures was about twice as high as that of PI-developed measures: 33% versus 16%. Table 32. Effect ratings by the developer of measures
Developer of measures PI-developed Standardized Total
Effect rating Number Percent Number Percent Number Percent
Significantly positive effect (++) 16 32.7 3 10.0 19 24.1
Potentially positive effect (+) 16 32.7 10 33.3 26 32.9
No effect (0) 8 16.3 10 33.3 18 22.8
Significantly or potentially negative effect (--/-)
1 2.0 3 10.0 4 5.1
Effect undetermined 8 16.3 4 13.3 12 15.2
Total 49 62.0 30 38.0 79 100.0
Note: Test of association: χ2 (4) = 8.7, p = 0.07. Other measurement types were excluded from this analysis owing to a limited number of effects estimated for them. In addition to the categorical measure of effect ratings that we used above, we created two alternative, numerically based measures of effectiveness to quantify the global effectiveness of REESE-supported interventions. The first one is the numeric effect rating scale. We translated the original categorical measure of effect ratings to a numeric scale by using a conversion table (see Table 33). We treated the effect rating scale as if it were measured on an ordinal scale. The second one is an indicator of any positive effect, which we call the positive effect indicator. We constructed a new dummy variable, in which a presence of any positive effect—significant or not—was coded to the value of 1, while all the other categories (including the undetermined effect category) were given a value of zero. Table 33 shows basic statistics of these two new numerically based measures of effectiveness. Table 33. Conversion table
Categorical effect rating Numeric effect rating scale
Positive effect indicator
Significantly positive effect (++) 2 1
Potentially positive effect (+) 1 1
No effect (0) 0 0
Potentially negative effect (-) –1 0
Significantly negative effect (--) –2 0
Effect undetermined Missing data 0
29

Review of REESE’s Evaluation Portfolio
On the one hand, as Table 33 shows, the mean of the numeric effect rating scale is 0.8, which is slightly lower than the value of 1 on the scale of –2 to +2. This means that the overall effectiveness across all 68 domain-specific findings (excluding those cases where effects were undetermined) was slightly less than potentially positive. On the other hand, the mean of positive effect indicator is 0.5, which means that half of all 82 domain-specific findings were somewhat positive regardless of their significance level. Table 33. Overall mean, standard deviation, minimum, and maximum of numerically based measures of effectiveness at the domain-specific level
Variable N Mean SD Minimum Maximum
Numeric effect rating scale 68 0.8 1.0 –2 2
Positive effect indicator 82 0.5 0.5 0 1
We examined the relationships between these two numerically based effectiveness measures and the seven dimensions of interventions. As Table 34 shows, the result based on the numeric effect rating scale is somewhat different from that based on the positive effect indicator, as was the case in Table 33. In all intervention dimensions but subject, differences in means were all in the same direction. Mostly, the statistical significance of the differences of means differed by the effectiveness measure. For example, compared with EREC, IERI had a significantly higher mean in the positive effect indicator, but not in the effect rating scale. Exceptionally, the mean effects of professional development interventions were found to be significantly higher than those of instructional or pedagogical interventions regardless of the effectiveness measure that was examined. This finding is consistent with our earlier finding from the cross-tabulation on the same intervention dimension (see Table 27). In addition, it is interesting to note that compared with standardized measures, PI-developed measures were more likely to produce a significant effect when this was measured by the effect rating scale: 1.06 versus 0.48. Recall that the result was marginally significant with the use of the categorical effect rating measure.
30

Review of REESE’s Evaluation Portfolio
Table 34. Analysis of numerically based measures of effectiveness, by various intervention dimensions
Predictors
Numeric effect rating scale Positive effect indicator
N Mean SD F p N Mean SD F p
Program 0.05 0.82 4.65 0.04 EREC 9 0.78 0.97 11 0.36 0.50 IERI 43 0.84 1.02 46 0.70 0.47 Intervention type 24.65 <.0001 5.35 0.03
Instructional-pedagogical 37 0.51 0.93 42 0.55 0.50
Professional development 15 1.60 0.74 15 0.87 0.35
Intervention maturity 3.05 0.09 0.95 0.34 New 26 1.00 0.94 29 0.69 0.47 Existing 26 0.65 1.06 28 0.57 0.50 Subject 0.55 0.46 0.72 0.40 Reading 16 0.94 0.85 18 0.56 0.51 STEM 36 0.78 1.07 39 0.67 0.48 Student outcome 1.72 0.20 0.06 0.80
Student achievement 43 0.77 1.02 48 0.63 0.49
Non-achievement 9 1.11 0.93 9 0.67 0.50 Study design 7.97 0.01 2.63 0.11 QED 30 1.07 0.94 32 0.72 0.46 RCT 22 0.50 1.01 25 0.52 0.51 Developer of measures 8.48 0.01 1.59 0.21 PI developed 31 1.06 0.77 33 0.70 0.47 Standardized 21 0.48 1.21 24 0.54 0.51
Analyses of effects aggregated at the level of award Last, we estimated the effectiveness of interventions at the award level as well as at the portfolio level. To this end, we used the two effectiveness measures that are numerically based. All 82 domain-specific effects were aggregated to the level of award, which produced two sets of effects for each of the 23 awards: one based on the numeric effect rating scale and the other on the positive effect indicator. On the one hand, as Table 35 shows, the overall mean of effect rating scale is 0.79, which is slightly lower than the value of 1 on the scale of –2 to +2. This means that the overall effectiveness across all 23 awards was slightly less than potentially positive. On the other hand, the mean of positive effect indicator is 0.58, which means that 58% of 23 awards were somewhat positive regardless of their significance level. Whether we examine the global effectiveness of interventions supported by REESE at the domain-specific level or at the award level, we reach similar conclusions.
31

Review of REESE’s Evaluation Portfolio
Table 35. Overall mean, standard deviation, minimum, and maximum of numerically based measures of effectiveness at the award level
Variable N Mean SD Minimum Maximum
Numeric effect rating scale 22 0.79 0.67 –0.25 2.00
Positive effect indicator 23 0.58 0.42 0.00 1.00
Note: One study had an undetermined effect for both domains that were examined within the study. One study had missing data in the numeric effect rating scale because two of its domain-specific findings could not be determined for their effects. Therefore, total N for the effect rating scale is 22 instead of 23. We examined the relationships between these two numerically based effectiveness measures and program as a main source of funding (i.e., EREC or IERI). As Table 36 shows, the result of analysis at the award level is somewhat similar to the result at the domain-specific level (see Table 34). For example, 70% of IERI-supported awards showed some positive effects (regardless of their significance level), while 31% of EREC-supported awards did so. Table 36. Analysis of numerically based measures of effectiveness at the award level, by program
Predictor Numeric effect rating scale Positive effect indicator
N Mean (SD) F p N Mean (SD) F p Program 0.03 0.87 4.64 0.04
EREC 6 0.83 0.82 7 0.31 0.39
IERI 16 0.78 0.63 16 0.70 0.39
32

Review of REESE’s Evaluation Portfolio
CONCLUSION We have successfully applied a systematic review approach, as a rigorous scientific method of research synthesis, to this comprehensive review of REESE’s evaluation portfolio. It proved to be fruitful to make a distinction during the project selection process among three related program strands that have a strong focus on evaluation: that is, evaluative R&D, evaluation capacity building, and evaluation of intervention. Our portfolio analyses moved beyond the basic project descriptions to the examination of new products, publications, and intervention effects as part of project outcomes. When we focused on in-depth analyses of intervention effects, we constructed a few new effectiveness measures as alternatives to the effect size measure, which was very limited in its availability. The results of analyses of these effectiveness measures seemed quite consistent when we examined them both at the level of domain-specific effects and at the level of award. Overall, we have found some evidence of positive effects of a number of interventions that were tested by the REESE evaluation projects. A few dimensions of intervention, such as intervention type, were quite useful in accounting for some of the variance in effects. As result of this review, we have gained new insights into REESE’s evaluation portfolio. In addition, we have addressed the following key questions: To what extent are REESE-funded projects distributed across various program strands that have an emphasis on evaluation? Does REESE have a truly balanced portfolio? To what extent are interventions supported by REESE’s evaluation portfolio effective? During the review process, we attempted to use consistent high standards for determining and comparing intervention effects. We hope that this type of portfolio review contributes to the accumulation of the knowledge base in improving evaluation practices. We also hope that DRL extends this type of systematic review approach to other themes or related portfolios.
33
Review of REESE’s Evaluation Portfolio
RECOMMENDATIONS
Based on our systematic review of REESE’s evaluation portfolio, we make the following recommendations for future directions of REESE’s evaluation portfolio:
• DRL increases the level of specificity of the cycle of innovation and learning in such a way to better map out the terrain of research, development, and evaluation in STEM education as well as overall evaluation of DRL portfolio.
• DRL clarifies distinctions between research and evaluation and reaches a common understanding among program officers and PIs.
• DRL makes a clear distinction between efficacy and effectiveness in such a way to make them comparable with other definitions common in research communities (e.g., IES, prevention sciences).
• DRL reviews its portfolio in terms of broader impacts, one of two proposal merit criteria (e.g., broadening the participation of traditionally underrepresented populations, benefits to society).
• DRL undertakes further follow-up analysis of this portfolio review by linking each intervention’s effectiveness ratings with information relevant to award or PI. They may include the following: External reviewers’ proposal summary ratings, external review panels’ proposal ratings, program officer’s recommendations, total amount of grant awarded, project period, PI’s history (track record), and PI’s background characteristics such as young investigator status or underrepresented group status.
• DRL updates its portfolio review periodically. • DRL reflects the results of this portfolio review in solicitations. • In line with ACC’s recommendations, DRL encourages programs to adopt consistent
high standards for determining and comparing their impact. • DRL seeks a balanced portfolio that is aligned and mapped to the cycle of innovation and
learning. • PIs use structured abstracts. • PIs improve the quality of progress reports. • PIs report all information that is necessary to compute effect sizes (e.g., mean, SD, N), if
applicable, or report ESs as appropriate. • PIs report all new, significant products that they developed with the support of grants and
specify the nature of such products (e.g., target population, platform, how they are to be used).
• Along with their progress reports, PIs submit via Fastlane to NSF any publications—especially peer-reviewed journal articles—that are related to and supported by their awards. Further, they update their publications in timely manner.
34

Review of REESE’s Evaluation Portfolio
REFERENCES American Statistical Association, (2007). Using statistics effectively in mathematics education
research. Retrieved July 9, 2007 from http://www.amstat.org/research_grants/pdfs/SMERReport.pdf.
Boruch, R. F. (1997). Randomized experiments for planning and evaluation: A practical guide. Applied Social Research Methods Series, 44. Thousand Oaks, CA: Sage Publications.
Campbell Collaboration. (2009). What is a systematic review? Retrieved July 17, 2009, from http://www.campbellcollaboration.org/what_is_a_systematic_review/index.php.
Campbell, D. T. & Stanley, J. C. (1963). Experimental and quasi-experimental designs for research. Dallas, TX: Houghton Mifflin.
Confrey, J. (2006). Comparing and contrasting the National Research Council report on Evaluating Curricular Effectiveness with the What Works Clearing approach. Educational Evaluation and Policy Analysis, 28(3), 195–213.
Hiebert, J., & Grouws, D. A. (2007). The effects of classroom mathematics teaching on students’ learning. In F. K. Lester (Ed.), The second handbook of research in mathematics education. Reston, VA: New Age and National Council of Teachers of Mathematics.
Katzenmeyer, C., & Lawrenz, F. (2006). National Science Foundation perspectives on the nature of STEM program evaluation. New Directions for Evaluation, No. 109, 7–18.
National Mathematics Advisory Panel. (2008). Foundations for success: The final report of the National Mathematics Advisory Panel. Washington, DC: U.S. Department of Education.
National Research Council. (2004). On evaluating curricular effectiveness: Judging the quality of K–12 mathematics evaluations. Washington, DC: The National Academies Press.
National Science Foundation. (2005). The mathematics education portfolio brief (NSF 05-03). Retrieved July 6, 2009, from www.nsf.gov/pubs/2005/nsf0503/nsf0503.pdf.
Olds, B. M. (2004). Research across EHR. NSF K–12 Math, Science, and Technology Curriculum Developers Conference. Retrieved July 17, 2009, from http://www.agiweb.org/education/nsf2004/presentation/olds.ppt.
RAND Mathematics Study Panel. (2003). Mathematical proficiency for all students: Toward a strategic research and development program in mathematics education (MR-1643.0-OERI). Santa Monica, CA: RAND.
Raudenbush, S. W. (2005). Learning from attempts to improve schooling: The contribution of methodological diversity. Educational Researcher, 34 (5), 25–31.
Roberts, M. (2008). A study of NSF’s broader impacts merit review criterion. A technical manuscript submitted to the National Science Foundation.
35

Review of REESE’s Evaluation Portfolio
Shadish, W., Cook, T., & Campbell, D. (2002). Experimental and quasi-experimental designs for generalized causal inference. Boston: Houghton Mifflin.
Sherwood, R. D., & Hanson, D. L. (2008). A review and analysis of the NSF portfolio in regard to research on science teacher education. Electronic Journal of Science Education, 12(1), 1–19.
Sztajn, P., Suter, L. E., & Yoon, K.S. (in preparation). Promoting scientific research in mathematics education: An analysis of NSF peer reviews.
U.S. Department of Education. (2007). Report of the Academic Competitiveness Council. Washington, DC: Author.
What Works Clearinghouse. (2009). WWC procedures and standards handbook. Retrieved July 20, 2009, from http://ies.ed.gov/ncee/wwc/references/idocviewer/Doc.aspx?docId=19&tocId=4.
Yoon, K. S., Duncan, T., Lee, S. W.-Y., Scarloss, B., & Shapley, K. (2007). Reviewing the evidence on how teacher professional development affects student achievement. (Issues & Answers Report, REL 2007-No. 033). Washington, DC: U.S. Department of Education, Institute of Education Sciences, National Center for Education Evaluation and Regional Assistance, Regional Laboratory Southwest. Retrieved July 10, 2009, from http://ies.ed.gov/ncee/edlabs/regions/southwest/pdf/REL_2007033.pdf.
Yoon, K. S., & Song, M. (2009). A review of the Division of Chemistry’s program portfolio regarding broader impacts: Results from a pilot study. Technical report submitted to National Science Foundation. Washington, DC: American Institutes for Research.
36

Review of REESE’s Evaluation Portfolio
APPENDICES
Appendix A. Descriptions about REESE, EREC, IERI, and ROLE
The following section describes the programs that were included in this review.
Research and Evaluation on Education in Science and Engineering (REESE)
The Division of Research on Learning in Formal and Informal Settings (DRL) in the Directorate for Education and Human Resources (EHR) of the National Science Foundation (NSF) supports basic and applied research and evaluation that enhances science, technology, engineering, and mathematics (STEM) learning and teaching. The Research and Evaluation on Education in Science and Engineering (REESE) program aims at advancing research at the frontiers of STEM learning, education, and evaluation and at providing the foundation knowledge necessary to improve STEM teaching and learning at all educational levels and in all settings. REESE draws from three programs previously in the formal Research, Evaluation, and Communication (REC) portfolio: Research on Learning and Education (ROLE), Evaluation Research and Evaluation Capacity Building (EREC), and Interagency Education Research Initiative (IERI). The goals of the REESE program are (1) to catalyze discovery and innovation at the frontiers of STEM learning, education, and evaluation; (2) to stimulate the field to produce high-quality and robust research results through the progress of theory, method, and human resources; and (3) to help coordinate and transform advances in education, learning research, and evaluation. REESE pursues its mission by developing an interdisciplinary research portfolio focusing on core scientific questions about STEM learning in current and emerging learning contexts, both formal and informal, from childhood through adulthood, and from before school through to graduate school and beyond into the workforce. In addition, research questions related to educational research methodology and evaluation are central to the REESE activity. The REESE solicitation calls for three types of proposals: knowledge diffusion, empirical, and large empirical. All REESE proposals, regardless of their type, must be responsive to one of two broad topical strands, Emerging Research or Contextual Research.
The Emerging Research proposals are limited to one or more of the following four areas of inquiry
1. Neural basis of STEM learning 2. Cognitive processes underlying STEM learning and teaching 3. Measurement, modeling, and methods for research and evaluation 4. Cyber-learning and teaching
The Contextual Research strand may include one of three broad areas for transformative solutions to persistent problems:
37

Review of REESE’s Evaluation Portfolio
1. STEM teaching and learning in formal and informal settings 2. Education policy and systems studies 3. Evaluation studies
Research design and methodology: REESE expects investigators to propose rigorous and replicable research methods that are well justified, are suited to the particular research questions being studied, and have the likelihood of yielding significant knowledge in pursuit of core problems in STEM education and learning. Each supported project must meet the following basic requirements:
1. The proposed topics, questions, methodologies, and research settings must be consistent with the overall goals of the REESE program. Investigators should pose research problems of compelling national importance deeply rooted in one or more STEM fields. Research questions must be clear and specific and must be answerable through the means proposed.
2. The investigators must demonstrate how the proposed research program builds upon existing evidence obtained from relevant prior research. All proposals must draw on the existing educational and learning literatures and on the education-related literature in one or more other domains such as the physical and biological sciences, engineering, cognitive science, neuroscience, statistics, mathematics, and information science.
3. The investigators must explicitly describe the research design including the methods, sample selected for study, instruments, and all means of data collection. A range of research designs appropriately matched to the nature of the research problem and questions are encouraged in REESE. Information must also be provided on the reliability, validity, and appropriateness of proposed measures and instruments. If the reliability and validity of the instruments are initially unknown, the applicant must include specific plans for establishing these measurement properties.
4. The investigators must provide a specific data analysis plan, including procedures to code and (if necessary) reduce qualitative data, details on how potential threats to internal and external validity will be addressed, power analyses (when appropriate) demonstrating the adequacy of proposed cell sizes, and plans for estimating effect sizes as appropriate.
Evaluative Research and Capacity Building (EREC)
The EREC program seeks proposals that offer unique approaches to evaluation practice in the generation of knowledge for the science, technology, engineering, and mathematics (STEM) education community and for broad policymaking within the research and education enterprise. Successful proposals may focus on one or more STEM education programs or projects in order to examine major issues in STEM education and/or may focus on the development of capacity within the education evaluation field.
Interagency Education Research Initiative (IERI)
The Interagency Education Research Initiative (IERI) is a collaborative effort jointly sponsored by the National Science Foundation, the Institute of Education Sciences in the U.S. Department of Education, and the National Institute of Child Health and Human Development in the National
38

Review of REESE’s Evaluation Portfolio
Institutes of Health. In FY 2004 the IERI grant competition will be managed separately by each agency. The National Science Foundation invites proposals for research projects that will investigate the effectiveness of interventions designed to improve student learning and achievement in preK–12 science and/or preK–12 mathematics with an emphasis on middle and high school. Technology should be a part of the intervention or used in an essential manner in the analysis of the intervention.
The goal of IERI—supported jointly by the Institute of Education Sciences, the National Science Foundation (represented by REC), and the National Institute of Child Health and Human Development—is to support scientific research that investigates the effectiveness of educational interventions in reading, mathematics, and the sciences as they are implemented in varied school settings with diverse student populations.
IERI will fund two types of projects—contextual projects and scaling projects.
• Contextual projects are smaller projects that aim to develop components of a potential scaling project. Examples include feasibility studies, instrument development, and replication studies. Contextual projects can be funded for up to 5 years for up to a total of $2,000,000.
• Scaling projects are larger projects that aim to demonstrate that an intervention can scale in either size of affected population or in the variety of contexts in which the intervention is successful. Scaling projects can be funded for up to 5 years for up to a total of $6,000,000. Scaling projects must have a strong evidentiary base and demonstrate, through rigorous, well-controlled, large-scale empirical studies, which proposed education approaches are in fact most effective in practice. The interventions may be school-based or based outside of school and should use technology either in the intervention or in its analysis.
Research on Learning and Education (ROLE)
The ROLE program seeks to capitalize on important developments across a wide range of fields related to human learning and to STEM education. It supports research across a continuum that includes (1) the biological basis of human learning; (2) behavioral, cognitive, affective, and social aspects of human learning; (3) STEM learning in formal and informal educational settings; and (4) changing educational systems to improve STEM learning. The ROLE Program aims to advance the knowledge base within and across the intersections of these multidisciplinary areas. It encourages projects that reconcile and integrate basic research and educational practice and generate hypotheses from one disciplinary area that can be tested and refined in another.
39

Review of REESE’s Evaluation Portfolio
Appendix B. REESE Evaluation Portfolio Review Matrix I. Basic award information
a. PI, co-PI(s), organization, funding amount, project duration, source program (EREC, IERI, or ROLE), program elements, program manager, etc.
II. Screening Process
A. Is the award within the scope of this review?
a. Within scope proceed with screening b. Out-of-scope stop screening
1. Contract or technical support 2. Planning grant or Small Grant for Exploratory Research (SGER) 3. Feasibility study 4. No emphasis on evaluation AND non-STEM focus 5. Lack of document 6. Out of timeframe (1997 or earlier)
B. Screening awards for program strands (Does this award have direct relevance to evaluation? – Check all that apply)
a. Evaluative research and development (R&D): To advance the state of the art in evaluation through R&D in evaluation theory, methodology, and practice (e.g., evaluation model, approach, or tool, conceptual framework, logic model, data collection, data analysis, statistics, instrumentation, measurement and assessment). Illustrative examples may include:
1. The synthesis of existing evaluation and research results from multidisciplinary perspectives, the development of meta-analyses, and the organization of conferences to seek clarity and consensus among disparate bodies of literature on methods for evaluating STEM education activities;
2. The development of effective new mixed, quantitative-qualitative methodologies derived from multiple disciplinary traditions;
3. The development of methods that might increase the validity and reliability of measures, address issues of complex causality, and/or enhance the ability of evaluators to make causal or attributional statements;
4. The development or refinement of conceptual or theoretical frameworks for innovative evaluation designs of STEM education programs;
5. The development of cost-effective approaches to evaluation or approaches that reduce the time required to obtain credible and reliable preliminary results;
6. The creation of new models and approaches for disseminating STEM evaluation findings and methods to various stakeholder audiences; and
7. The development of new methods for evaluating complex programs in STEM, including the use of mathematical models, qualitative or multidisciplinary methods, and measurement techniques.
b. Evaluation capacity building: Enhancing evaluation capacity and infrastructure through education and training, the development of evaluation knowledge and skills,
40

Review of REESE’s Evaluation Portfolio
and through the creation of evaluation resources useful for the field in general (e.g., degree program, learning community, partnership, organization, database system, or resources). Illustrative examples may include:
1. The development of professional communities focused on specific innovative evaluation approaches and practices via workshops, electronic networks, or other means;
2. The pre-service and in-service education and training of evaluators, with special emphasis on preparation of those groups underrepresented in science, technology, engineering, and mathematics;
3. The provision of training in evaluation to appropriate audiences such as STEM education program administrators, instructors, policymakers, and others.
4. The planning, organization, and initiation of high-quality undergraduate, graduate, and professional STEM education evaluation experiences, degree and certificate programs, and degree concentrations;
5. The provision of education and training to researchers from other disciplines who wish to refocus their professional careers on STEM evaluation through such means as postdoctoral or mid-career fellowships and specialized programs;
6. The creation or enhancement of infrastructures to support the practice of evaluation, such as regional professional groups or education and training consortia; and
7. The compilation, critique, and dissemination of resources useful for evaluation practice.
c. Conducting evaluation of interventions—program, product, or policy (e.g., implementation evaluation, impact study, assessment of effectiveness, analysis of cost and benefits)
d. Surveys or reports (e.g., collection or compilation of data) e. Basic or applied research and development in areas other than evaluation (e.g.,
formulate of a theory of STEM education) f. Instructional material development (e.g., model, curriculum, tool, resources,
technology) in STEM education g. Professional development in STEM education for K–12 teachers or college faculty h. STEM education and capacity building i. STEM workforce development (e.g., fellowship, internship, recruitment, retention) j. Other, please specify: _________________________________________________
C. Emphasis on evaluative R&D, evaluation capacity building, or evaluation of intervention
a. Degree of emphasis (Check one) 1. None Not selected for review 2. Somewhat Can be selected 3. Great extent Selected
b. Select for evaluation portfolio review? (Check one) 1. Yes 2. No
41

Review of REESE’s Evaluation Portfolio
3. Unsure to be revisited upon reading additional information; or set aside if consensus is not reached
III. Evaluation Portfolio Review (for all awards selected through screening)
A. Basic descriptive information a. Subject or disciplinary areas:
• STEM field(s) (Check all that apply) 1. Science-general 2. Science-specific, specify the subject(s): (e.g., biology, chemistry, physics) 3. Mathematics 4. Technology 5. Engineering
• II. Non-STEM field(s) (Check all that apply) 1. Reading/English/language arts 2. Other, specify: ________________
b. Target Group(s) (Check all that apply): 1. K–12: Elementary 2. K–12: Middle 3. K–12: High 4. Postsecondary (e.g., 2-year college, community college, vocational school) 5. Undergraduate 6. Graduate 7. Other, specify: _________________
B. If evaluative research and development, what is its nature?
a. Type of research (Check one) 1. R&D in evaluation theory, conceptual framework, or evaluation models 2. R&D in evaluation methodology (e.g., study design, data collection, data
analysis method) 3. Development of measurement, assessment, indicators, instruments, or tools
that are useful for evaluation 4. Development of new models or approaches for disseminating evaluation
findings 5. Synthesis of existing evaluation and research results; meta-analysis
TEXT BOX: Enter appropriate text about the Nature of Evaluative R and D that you selected:
b. Cycle of innovation (Check all that apply)
1. Synthesize and theorize 2. Hypothesize and clarify 3. Design, develop, and test 4. Implement, study efficacy, and improve 5. Scale-up and study effectiveness
42
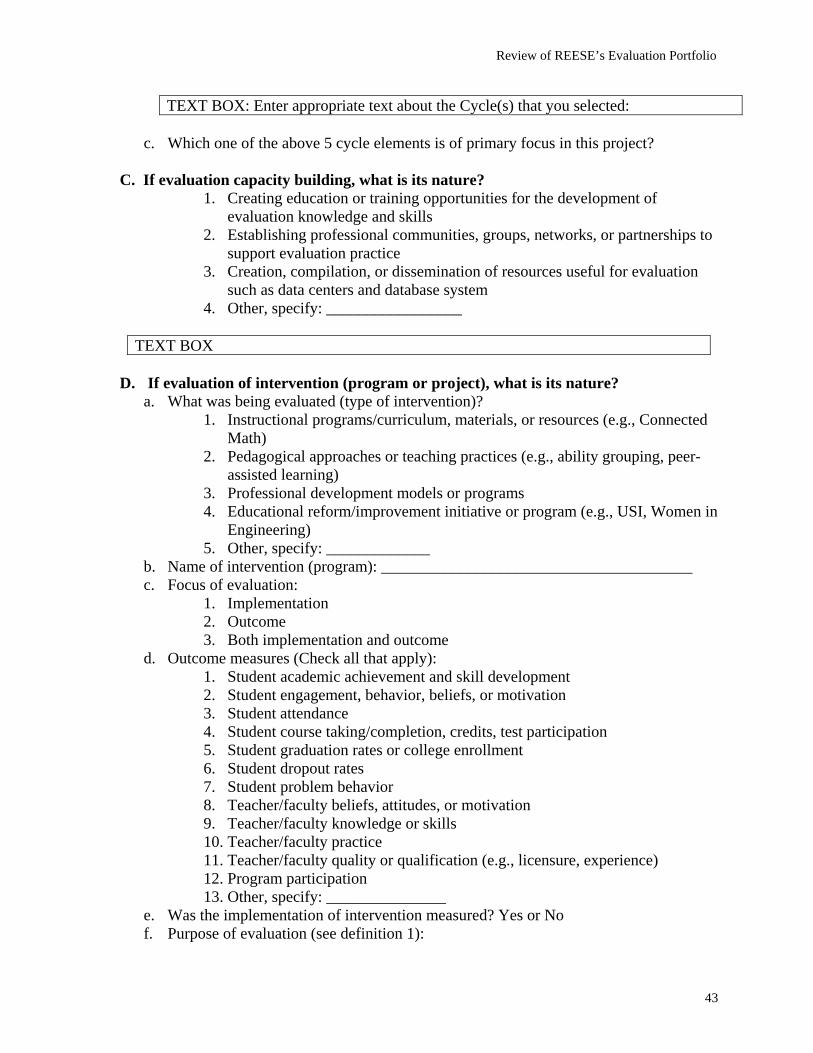
Review of REESE’s Evaluation Portfolio
TEXT BOX: Enter appropriate text about the Cycle(s) that you selected:
c. Which one of the above 5 cycle elements is of primary focus in this project?
C. If evaluation capacity building, what is its nature? 1. Creating education or training opportunities for the development of
evaluation knowledge and skills 2. Establishing professional communities, groups, networks, or partnerships to
support evaluation practice 3. Creation, compilation, or dissemination of resources useful for evaluation
such as data centers and database system 4. Other, specify: _________________
TEXT BOX
D. If evaluation of intervention (program or project), what is its nature?
a. What was being evaluated (type of intervention)? 1. Instructional programs/curriculum, materials, or resources (e.g., Connected
Math) 2. Pedagogical approaches or teaching practices (e.g., ability grouping, peer-
assisted learning) 3. Professional development models or programs 4. Educational reform/improvement initiative or program (e.g., USI, Women in
Engineering) 5. Other, specify: _____________
b. Name of intervention (program): _______________________________________ c. Focus of evaluation:
1. Implementation 2. Outcome 3. Both implementation and outcome
d. Outcome measures (Check all that apply): 1. Student academic achievement and skill development 2. Student engagement, behavior, beliefs, or motivation 3. Student attendance 4. Student course taking/completion, credits, test participation 5. Student graduation rates or college enrollment 6. Student dropout rates 7. Student problem behavior 8. Teacher/faculty beliefs, attitudes, or motivation 9. Teacher/faculty knowledge or skills 10. Teacher/faculty practice 11. Teacher/faculty quality or qualification (e.g., licensure, experience) 12. Program participation 13. Other, specify: _______________
e. Was the implementation of intervention measured? Yes or No f. Purpose of evaluation (see definition 1):
43

Review of REESE’s Evaluation Portfolio
1. Formative 2. Summative 3. Both formative and summative
g. Stage of intervention study (see definition 2): 1. Pre-efficacy 2. Efficacy 3. Effectiveness 4. Scale-up 5. Sustainability
h. Evaluation design (see definition 3): (Check all that apply—For primary and additional designs):
1. RCT 2. QED with equating (through matching and/or covariate adjustment) 3. QED: regression discontinuity design 4. QED: single-case design 5. QED without a comparison group (e.g., single-group pre-posttest design) 6. Observational or correlational study 7. Qualitative study (e.g., case study)
i. Evaluation setting: 1. Single-site 2. Multisite
(Note: In a multisite study, the evaluation is carried out within each individual site and the program impact is estimated within each site and then pooled across sites. The overall study can be viewed as consisting of a series of mini-studies.)
j. Data collection: 1. Cross-sectional 2. Longitudinal (i.e., repeated measures are taken from the same cohort of
subjects over time) 3. Both cross-sectional and longitudinal
k. Data sources (Check all that apply): 1. Student assessment 2. Teacher assessment 3. Surveys 4. Interviews 5. Logs 6. Observations 7. Focus groups 8. Administrative records (excluding assessment data) 9. Documents 10. Other, specify: _________________
l. Cycle of innovation (Check all that apply): 1. Synthesize and theorize 2. Hypothesize and clarify 3. Design, develop, and test 4. Implement, study efficacy, and improve
44

Review of REESE’s Evaluation Portfolio
5. Scale-up and study effectiveness
TEXT BOX: Enter appropriate text about the Cycle(s) that you selected:
m. Which one of the above 5 cycle elements is of primary focus in this project?
IV. Products
A. Number of publication in peer-reviewed journals a. published b. in press c. accepted d. total
B. New products
Per NSF’s instructions, we coded major new products only. If there are multiple products listed under a similar heading (e.g., data base), collapse them into a single product and provide a description of the various components included.
a. Number of new products b. Product category
1. Assessment or test 2. Data analysis method or approach 3. Data collection method or approach 4. Data management system 5. Database or data system 6. Educational reform/improvement initiative or program 7. Evaluation methodology 8. Evaluation model or conceptual framework 9. Instructional material, resource or tool 10. Instructional program or model 11. Instructional/pedagogical practice 12. Measurements or indicators 13. Professional community, network or partnership 14. Professional development program or model 15. Survey instrument or questionnaire 16. Other ()
c. Product content d. Description of product e. Is the new product web-based? f. Is the new product a computer program or software?
45
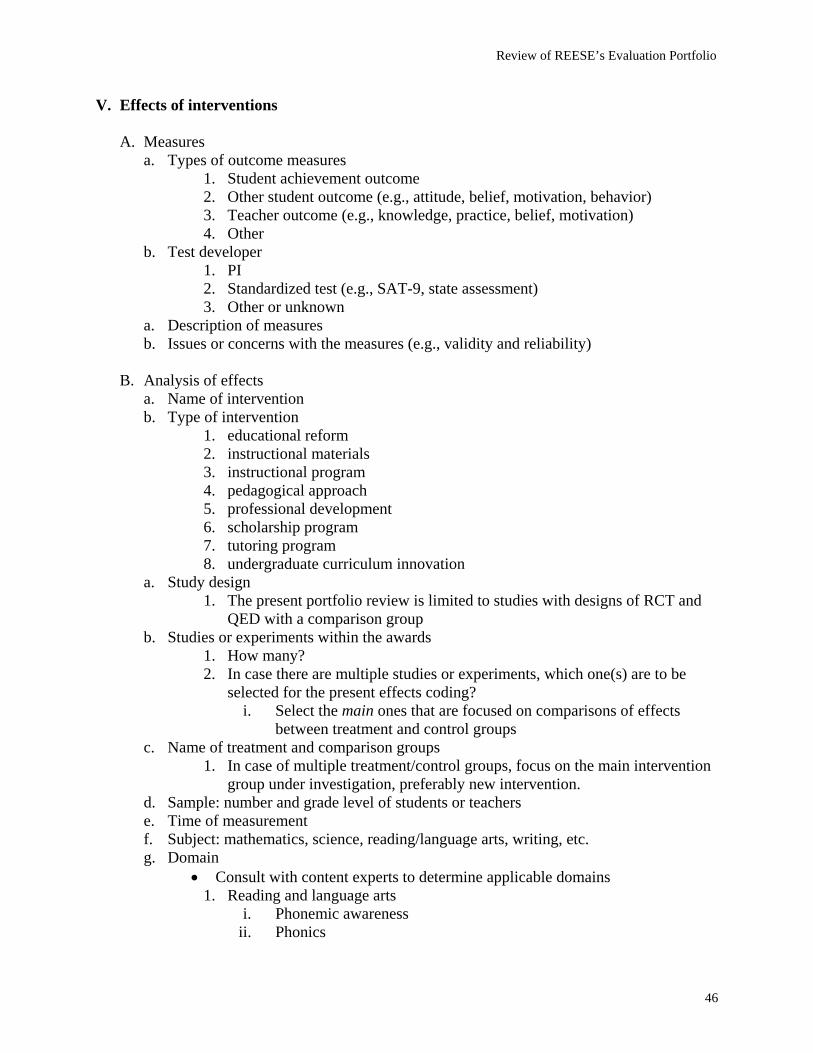
Review of REESE’s Evaluation Portfolio
V. Effects of interventions
A. Measures a. Types of outcome measures
1. Student achievement outcome 2. Other student outcome (e.g., attitude, belief, motivation, behavior) 3. Teacher outcome (e.g., knowledge, practice, belief, motivation) 4. Other
b. Test developer 1. PI 2. Standardized test (e.g., SAT-9, state assessment) 3. Other or unknown
a. Description of measures b. Issues or concerns with the measures (e.g., validity and reliability)
B. Analysis of effects
a. Name of intervention b. Type of intervention
1. educational reform 2. instructional materials 3. instructional program 4. pedagogical approach 5. professional development 6. scholarship program 7. tutoring program 8. undergraduate curriculum innovation
a. Study design 1. The present portfolio review is limited to studies with designs of RCT and
QED with a comparison group b. Studies or experiments within the awards
1. How many? 2. In case there are multiple studies or experiments, which one(s) are to be
selected for the present effects coding? i. Select the main ones that are focused on comparisons of effects
between treatment and control groups c. Name of treatment and comparison groups
1. In case of multiple treatment/control groups, focus on the main intervention group under investigation, preferably new intervention.
d. Sample: number and grade level of students or teachers e. Time of measurement f. Subject: mathematics, science, reading/language arts, writing, etc. g. Domain
• Consult with content experts to determine applicable domains 1. Reading and language arts
i. Phonemic awareness ii. Phonics
46

Review of REESE’s Evaluation Portfolio
iii. Fluency iv. Vocabulary v. Comprehension
vi. Writing 2. Mathematics
i. Number sense/properties/relationships ii. Operations
iii. Measurement iv. Algebraic concepts v. Geometric concepts
vi. Data analysis/probability/statistics 3. Science
i. Nature of science ii. Measurement and calculation in science
iii. Components of Living Systems iv. Properties of matter v. Earth system
vi. Animal biology vii. Human biology
viii. Etc. 4. Domains of other content area
h. Specific outcome measures i. ES data categories
1 = unadjusted means & unadjusted SDs 2 = adjusted means & unadjusted SDs 3 = independent t-test 4 = ANOVA F-stat 5 = ANCOVA F & pre-post correlation 6 = proportions for dichotomous outcome 7 = adjusted mean difference & unadjusted SDs
j. Information that is lacking to compute ESs: Mean, SD, N k. Bias corrected ESs (g) computed by reviewers, if PI provides sufficient data such as
mean, SD, and N l. Narratives on ESs or findings reported by PI If PI included in the final report
publications for which ESs might be available, make hyperlinks to them. m. Summary of PI-reported effects n. ESs reported by PI, if available o. Statistical significance of ESs reported by PI, if applicable p. If applicable, were corrections for clustering made? Computing statistical
significance for domain mean ES corrected for clustering q. If applicable, were corrections for multiple comparisons made? Benjamin-
Hochberg correction for multiple comparisons for domains with multiple outcomes r. Note or reservation about evidence of effects
47
Review of REESE’s Evaluation Portfolio
s. Effect rating 1. Significantly positive effect: all effect estimates are significant and positive 2. Potentially positive effect: (1) effect estimates include both significant
positive effect(s) and non-significant effect(s) OR (2) all effect estimates are significantly positive, but with reservations (e.g., lack of correction, low outcome reliability)
3. No effect: all effect estimates are non-significant 4. Mixed effects: effect estimates include both significant positive effect(s)
AND significant negative effect(s) 5. Potentially negative effect: (1) effect estimates include both significant
negative effect(s) and non-significant effect(s) OR (2) all effect estimates are significantly negative, but with reservations (e.g., lack of correction, low outcome reliability)
6. Significantly negative effect: all effect estimates are significant and negative 7. Effect undetermined: insufficient evidence for determining the intervention’s
effects Note: For outcome domains that include both a total score and subscores, only the total score is considered in the effectiveness ratings.
VI. Definitions 1. Purpose of Evaluation
• Formative evaluation: An evaluation conducted to provide program staff evaluation information useful in improving the program
• Summative evaluation: An evaluation conducted and made public to provide program decision makers and potential consumers with judgments about that program worth or merit in relation to important criteria
Source: Worthen, B. R., Sanders, J. R., & Fitzpatrick, J. L. (1997). Program evaluation: Alternative approaches and practical guidelines. New York: Longman.
2. Stages of Intervention Study
• Pre-efficacy: A non-experimental study (e.g., a case study or correlational study) that is exploratory in nature and that is intended to identify potential components or underlying mechanisms that may make an intervention work or gather preliminary evidence for an intervention’s potential effects
• Efficacy: A study of how well an intervention works when implemented under ideal conditions
• Effectiveness: A study of how well in intervention works when implemented under real-world conditions
• Scale-up: A study of how well an intervention works when implemented at scale • Sustainability
48

Review of REESE’s Evaluation Portfolio
3. Evaluation Design Classification (adapted from Shadish, Cook, & Campbell, 2002) • Experiment: A study in which an intervention is deliberately introduced or manipulated to
observe its effects o Randomized controlled trial (RCT): An experiment in which units are randomly
assigned to the intervention (treatment) or the comparison (control) conditions o Quasi-experimental design (QED): An experiment in which units are not randomly
assigned to conditions QED with equating: The most common type of QED, which includes a comparison
group and attempts to establish group equivalence through matching and/or covariate adjustment
Regression discontinuity design: A special type of QED in which participants are assigned to the intervention and the comparison conditions based on a cutoff score on a pre-intervention measure that typically assesses need or merit and has a known functional relationship with the outcome of interest
Single-case design: A special type of QED that involves repeated measurement of a single subject (e.g., a student or a classroom) in different conditions or phases over time
QED without a comparison group: An experiment based on a study sample that consists exclusively of units that receive the intervention (e.g., single-group pre-posttest design)
• Observational or correlational study: “In observational research, units are observed
without any active intervention.” (American Statistical Association, 2007) • Qualitative study: A non-experimental study that relies primarily on qualitative data
49

Review of REESE’s Evaluation Portfolio
50
Appendix C. Conceptions about the Cycle of Innovation and Learning Table C-1. Translating the previous version of the cycle of innovation and learning to the current version
Previous version Additional criterion for
translation (stage of intervention study)
Current version
Synthesize lines of work; identify new insights and questions to inform new research and development; set research and development agendas
Synthesize and theorize
Study and clarify phenomena of interest; frame issues; operationalize goals and constructs; develop and propose a new theory; conduct basic research
Hypothesize and clarify
Design, develop, test, validate, and refine materials, measurement tools, and methods in specific contexts
Design, develop, and test
Implement innovations (e.g., intervention, curriculum or instructional materials)
Implement, study efficacy, and improve Evaluate effectiveness; study why interventions
have the impacts they have, with particular groups; generalize
Efficacy
Effectiveness Scale-up and study effectiveness
Note: It was not possible to find an exact match between the previous and current versions of the cycle, even if additional criteria were used for the translation. For example, theory building is located in the second part of the cycle in the old version, but it falls under the first part of the cycle in the current version. Table C-2. Comparison between NSF’s cycle of innovation and learning and IES’s research goals
NSF's Cycle of Innovation and Learning IES’s Research Goals
Synthesize and theorize Identify/explore malleable factors, programs, practices, and policies associated with better student outcomes Hypothesize and clarify
Design, develop, and test Develop new education interventions
Develop and validate measurement tools
Implement, study efficacy, and improve Evaluate the efficacy of interventions
Scale-up and study effectiveness Evaluate the impact of interventions implemented at scale