a systematic framework for assessing the implementation...
TRANSCRIPT

ISSN 1744-1986
T e c h n i c a l R e p o r t N O 2012/ 06
A SYSTEMATIC FRAMEWORK FORASSESSING THE IMPLEMENTATIONPHASE OF ENTERPRISE RESOURCE
PLANNING SYSTEMS
Pierre A. Akiki and Arosha K. Bandara and Hoda W. Maalouf and
Yijun Yu
, 2012
Department of ComputingFaculty of Mathematics, Computing and TechnologyThe Open University
Walton Hall, Milton Keynes, MK7 6AAUnited Kingdom
http://computing.open.ac.uk

A SYSTEMATIC FRAMEWORK FOR ASSESSING THE
IMPLEMENTATION PHASE OF
ENTERPRISE RESOURCE PLANNING SYSTEMS
Pierre A. Akiki1, Arosha K. Bandara
1, Hoda W. Maalouf
2, and Yijun Yu
1
1Computing Department, The Open University, Walton Hall, Milton Keynes, United Kingdom 2Computer Science Department, Notre Dame University - Louaize, Zouk Mosbeh, Lebanon
{ pierre.akiki, a.k.bandara, y.yu }@open.ac.uk, [email protected]
Keywords: Enterprise Resource Planning: ERP Implementation: Critical Success Factors: Forecasting:
Management Information Systems
Abstract: Enterprise Resource Planning (ERP) systems are a major pillar in the management of evolving modern
businesses. With the continuous change of technology and increase of business process complexity, ERP
systems had to evolve drastically to accommodate the needs of modern businesses. This makes the
implementation of such systems very complex hence increasing the risk of failure. Aiming to reducing such
risks and protecting businesses as well as ERP vendors from financial losses, this paper proposes a set of
categorized critical success factors (CSFs) for assessing ERP implementations. A support tool is also
presented to visualize the assessments of the current and past implementation states to help in monitoring
the implementation’s evolution history.
1 INTRODUCTION
Enterprise Resource Planning (ERP) systems
have become a vital element in the success of
numerous modern businesses. ERP systems differ
from other information systems in their higher
complexity and impact on an enterprise’s operations.
Prior research has shown that the ERP system
lifecycle consists of six phases, generally identified
as adoption decision, acquisition, implementation,
use and maintenance, evolution, and retirement
(Esteves & Pastor 1999). Our research focuses on
the implementation phase, which deals with the
actual system deployment and includes customizing
the ERP for business needs, data migration, user
training, etc.
An ERP implementation strategy determines
how the ERP system will be made operational in an
enterprise. Different companies may implement the
same ERP software using a totally different process
and the same company may deploy different ERP
software through the same approach (Leon 2008).
This definition points to the varying needs between
different industries, and even businesses within the
same industry, adding a layer of complexity to the
implementation of ERP systems.
Although ERP systems are technically complex
to develop, one can notice that the problems facing
ERP implementations are produced from various
sources such as business process, technological and
human factors.
The complexity of ERP implementations creates
a high risk of failure. Since implementing an ERP
system is generally expensive, such a failure could
mean a great financial loss for enterprises. This issue
creates a real need for a method capable of
predicting implementation outcome beforehand in
order to avoid financial losses. Also, the method
should allow a constant assessment throughout the
implementation for reaching the optimal outcome.
The purpose of this paper is to study the ERP
implementation phase in more details, in order to
find the factors that determine the success and
failure of the implementation. In particular, our main
objective is to create a framework for characterizing
the success of ERP implementations. The proposed
framework could help in reducing the risk of ERP
implementation failure and hence protect enterprises
from possible financial losses.

2 CHARACTERISTICS OF AN
EFFECTIVE FRAMEWORK
In order to be effective, a framework for forecasting
the outcome of ERP implementations must have a
number of features. In addition to being general
purpose, reusable and capturing international
diversity, these features include the use of
quantitative measures of success and scientific
forecasting methods. We elaborate these features as
follows.
A general purpose framework is not restricted
to a specific industry or a particular enterprise scale.
This aspect is maintained by including Critical
Success Factors (CSFs) from different literature
sources in addition to identifying and testing new
factors.
Ngai et al. (2008) covered a broad literature
review, yet their work is limited to observation and
does not result in a general purpose framework.
A scientific forecasting method and software
tool are essential in a framework devised for the
assessment of ERP implementations. A model
containing numeric figures could be obtained by
using a scientific forecasting method. Additionally,
the software tool, which is a practical reflection of
the model, would provide a simple yet clearly
defined method of assessment.
Some researchers aimed towards a common
framework (Magnusson et al. 2004). They generally
illustrate factors such as: Change, process,
technology, users, etc. Although the researchers
emphasize the usage of a well defined methodology
and the creation of a software tool, the paper does
not provide a clear elaboration in that direction.
Quantifying the Critical Success Factors is
important for assessing the risks associated with
ERP implementations. The quantification will help
the assessment model to be embodied within a tool
capable of visualizing the implementation state.
Somers & Nelson (2001) used means to classify
the importance of each CSF and its impact on a
particular implementation.
Adding an International dimension would
make the framework more comprehensive. This
dimension would encompass factors related to
international diversity and might vary between
countries even if we are considering different
branches of the same organization. This
“International” dimension is especially important
for multi-national corporations operating in multiple
countries with different regulations and enterprises,
which employ or conduct business with people from
different cultural backgrounds.
Although different researchers based their work
on implementations done in China, North America,
and Europe but they did not specifically identify the
factors pertaining to the international diversity
within corporations. Other researchers compare
implementations in different countries, yet they
merely consider particular cases (Motwani et al.
2005).
Providing a reusable outcome should be the aim
of a framework designed for forecasting ERP
implementations. This reusability is characterized by
a general purpose, comprehensive, and quantified
model in addition to a simple enough support tool.
3 RESEARCH OVERVIEW
As illustrated in Figure 1 the procedure and
outcome of this research describes how we have
integrated the features presented above into our
forecasting framework. The steps are numbered 1 to
6 for descriptive convenience. Additionally, the part
encircled with blue is the primary research whereas
that encircled with red is the reusable outcome.
Figure 1: Research Overview
In order to ensure the generality of the
famework, a comprehensive list of CSFs, including
international factors, was compliled and a
questionnaire was formulated (1) and filled by
enterprises from multiple industries with existing
ERP systems (2).
The outcome was analyzed through a statistical
package using a scientific forecasting method,
namely Artificial Neural Networks (ANN) (3). The
analysis provided a quantified model composed of
weighted CSFs (4).
Finally, to promote the model’s reusability a
software tool was created (5) to help enterprises
wishing to implement an ERP system in evaluating
their implementation by answering a minimal set of
questions (6).

4 CRITICAL SUCCESS FACTORS
Initially we collected a vast number of critical
success factors (CSFs) mostly based on a wide range
of secondary data due to several considerations. In
order to compile a comprehensive list of CSFs,
which would span across multiple industries,
companies, countries, and cultures, we would have
to conduct dozens of case studies and field works.
Since this would take years to accomplish it would
be more appropriate to rely on the existing research
from which we can collect secondary data. Hence
we resorted to multiple resources to identify, study,
and establish a comprehensive list of CSFs.
Afterwards, the CSFs are categorized to establish
the foundation for our framework. Additionally, the
dependent and independent variables are identified.
4.1 Identifying the CSFs
We conducted a vast and comprehensive literature
review in order to identify a more comprehensive
list of CSFs. Including the whole literature review
would be out of the scope of this paper hence we
will provide a short summary instead.
We classified the secondary sources into the
following four categories (Case Studies, Secondary
Data, Surverys and Interviews, and Field Studies).
Case studies conducted in particular enterprises are
discussed in the following paragraphs.
Rajapakse & Seddon (2005) conducted a case
study of 6 organizations. They relied on Hofstede’s
cultural dimensions to study the impact of adopting
western ERP systems in developing Asian countries.
The preliminary results of a case study
conducted in two organizations in addition to a
literature review, allowed Brown & Vessey (1999)
to build a basic framework based on the CSFs
including: “Top Management Support”, “Leadership
in the ERP Implementation Team”, “Change
Management”, “Employing Outside Consultants”,
and “Managing Complexity”.
Holland & Light (1999) relied on a case study
conducted in 8 organizations. Their CSFs were
classified under two categories, namely strategic
(i.e., “Legacy Systems”, “ERP Implementation
Strategy”, etc.) and tactical (i.e., “Configuration and
Customization”, “Monitoring and Feedback”, etc.).
Secondary data such as practical implementation
data or literature reviews form the basis of the
following studies.
Gargeya & Brady (2005) base their research on
secondary data related to 44 different
implementations of the SAP ERP system. Their
research identified six factors, which could indicate
the success or failure of SAP implementations.
Klaus et al. (2000) relied on a literature review in
order to identify their success factors, which were
split into technical factors (i.e., “Modeling
Methodology, Language, and Tools”, “Modeler
Expertise”, “Modeling Team Orientation”) and
business factors (i.e., “Managerial Approach”,
“Employee Participation in Implementation”, “Top
Management Support”).
O’Kane & Roeber (2004) rely on a case study
and a survey done in one Korean organization. They
studied the impact of natural culture based on other
research (Davison 2002), and (Martinsons 2004).
Surveys and interviews conducted in multiple
organizations were the basis of the following
research works.
Tsai et al. (2005) relied on a survey conducted in
multiple organizations for suggesting a list of factors
that could increase the success rate of ERP
implementations.
Somers & Nelson (2001) conducted a survey
across 116 organizations. Their research helped in
identifying the key players and activities across the
ERP lifecycle that affect the success of ERP
projects. The identified factors were categorized into
key players (i.e., “Top Management”,
“Implementation Committee”, “Vendor/Customer
Partnerships”, etc.) and key activities (i.e.,
“Employee Training”, “Business Process Re-
engineering”, “Change Management”, etc.).
Liang et al. (2004) conducted interviews in 5
organizations, which made unsuccessful ERP
implementation attempts.
Field studies conducted on particular commercial
ERP systems are the basis of the following research.
An elaboration was made on how ERP users
evaluate the impact of such applications on their
businesses (Keystone Strategy 2007). This field
study compares two ERP systems: Microsoft
Dynamics and SAP. Based on their research results
we are able to deduce several factors which could
impact the success of ERP implementations. These
factors are: “Usability”, “Familiarity”,
“Transactional Efficiency”, “Flexibility”, “Business
Insight”, and “Collaboration”.

4.2 Dependent and Independent Variables
The variables in our research are the CSFs, which
influence the outcome of ERP implementations. We
have compiled a list of 63 variables, which are
classified under categories, subcategories, and
classes as shown in Table 2 (Appendix). Each
variable was given a reference such as
“EPECCM01” and a name such as “External
Consultants Dedication”. Additionally, the variables
were classified as either scale or ordinal. This would
simplify their usage in the software application.
Table 1 illustrates the general CSF categories,
which are based on (Leon 2008) where 3 categories
(“People”, “Process”, and “Technology”) are used.
In our classification the “People” category is split
into “Internal People” (Employees, management,
etc…) and “External People” (Vendor, external
consultants, etc.). This provides a more exact
identification of what affects the implementation.
Table 1: Number of CSFs Classified by Category
Category Abbreviation Number of CSFs
Internal People intP
19
External People extP
12
Process Pr 16
Technology Tech 16
We define the major dependent variable, the
ERP Implementation Success ( ERPS ), as follows:
), ,,( int TechPrPPfS extERP (1)
In turn intP , extP , Pr and Tech are functions of
a set of factors, which are included under each of the
sub-categories.
We allow a project at the implementation phase
to be a partial failure and a partial success. This
provides a more accurate judgement of the ERP
implementation than merely adopting two strict
states failure or success.
Hence we allocated the following states for an
ERP implementation:
“Full Success” if 18.0 ERPS
“High Success” if 8.06.0 ERPS
“Moderate Success” if 6.04.0 ERPS
“Partial Failure” if 4.02.0 ERPS
“Complete Failure” if 2.00 ERPS
5 PRIMARY DATA COLLECTION
AND ANALYSIS
After gathering the secondary data and performing a
classification of the CSFs, a methodology is required
for gathering the primary data. The results collected
from the primary data are then compared to those
collected from the secondary data in order to be
more accurate in forecasting the outcome of ERP
implementations.
5.1 Preparing the Questionnaire
We setup a questionnaire based on the list of CSFs
we accumulated and organized. This questionnaire is
composed of 65 questions and is used to collect
primary data, which will allow us to compare our
results to those of other researchers. The result
comparison is based on the effect of each of the
CSFs on the outcome of the implementation.
The prepared questionnaire incorporates a few
general information questions, in addition to a
question for each of the CSFs included in our
framework. We based the questionnaire on a 5 point
scale, which is also used by other researchers such
as Somers & Nelson (2001) and could achieve
accurate results without driving participants away.
The following are an example of a scale and an
ordinal question from our questionnaire:
How would you rate the overall management
involvement in the ERP implementation? □ (Very High) □ (High) □ (Moderate) □ (Low) □ (Very Low)
Which management style would you say was
the most dominant during the implementation? □ (People Oriented (Missionary, Compromiser)) □ (Task Oriented (Bureaucrat, Benevolent Developer))
□ (People Oriented (Developer, Executive))
□ (Task Oriented (Deserter, Autocrat)) □ (Other)
5.2 Selecting the Sample
Since our study aims at a generic approach towards
ERP implementations, the selected sample was
chosen to be varied in terms of company size,
industry and number of ERP users. The selected
industries included: Retail, Banking, Manufacturing
(Various Products), Healthcare, Food & Beverage
(Sales and Restaurants), Books, Insurance, and
Computer Hardware & Accessories. The
questionnaire was distributed for a period of two
months on various enterprises allocated under the
abovementioned industries. The collected primary
data was combined with the secondary data in order
to rank the selected CSFs.
5.3 Forecasting using ANN
Many forecasting techniques currently exist and
could be used for forecasting ERP implementations.
In particular, Artificial Neural Network (ANN)
models were proposed by several researchers for
business decision making applications such as
bankruptcy, customer churning, and stock price
forecasting (Palocsay 2004), and (Yang 1999).
Also, ANN was proposed as an efficient method
for forecasting ERP implementations since it
outperforms other techniques (Case Based
Reasoning and Multivariable Discriminate Analysis)
in terms of accuracy and defining the relationship
between independent and dependent variables (Lim
& Nam 2006).
Based on the abovementioned reasons we
decided to use ANNs in this research. ANNs are
composed of multiple layers, which include an input
layer, a hidden layer, and an output layer. An ANN’s
processing element is modeled on a neuron function.
The performance of an ANN depends on the levels
of hidden layer numbers, hidden node numbers,
learning rate, and momentum.
To configure ANN in the statistical software
package “SPSS” we set the dependent variable to be
“ERP Implementation Success” and the covariates to
be the CSFs. The rescaling of the covariates was set
to “standardized”. Batch training was used to train
the neural network because it directly minimizes the
total error (SPSS Inc. 2007).
6 INTERPRETATION
The data collected through the questionnaire was fed
into a statistical software package “SPSS” to rank
the CSFs in terms of impact on the implementation
outcome using ANN. Each CSF is allocated a weight
indicating its importance as an independent variable
impacting the dependent variable namely the “ERP
Implementation Success”. The summation of the
weights listed in Table 2 (Appendix) will add up to 1
(100%), which is the total impact on the
implementation.
Next, we will demonstrate the weights of each
category of CSFs and attempt to interpret the results.
Due to the existence of a large number of CSFs we
included in the coming sub-sections an interpretation
for some of the highest ranking factors.
The results are displayed on radar charts with
CSFs (Table 2, Appendix) on the edges. The further
the CSF value is from the chart’s center, the more
impact it has on the implementation outcome.
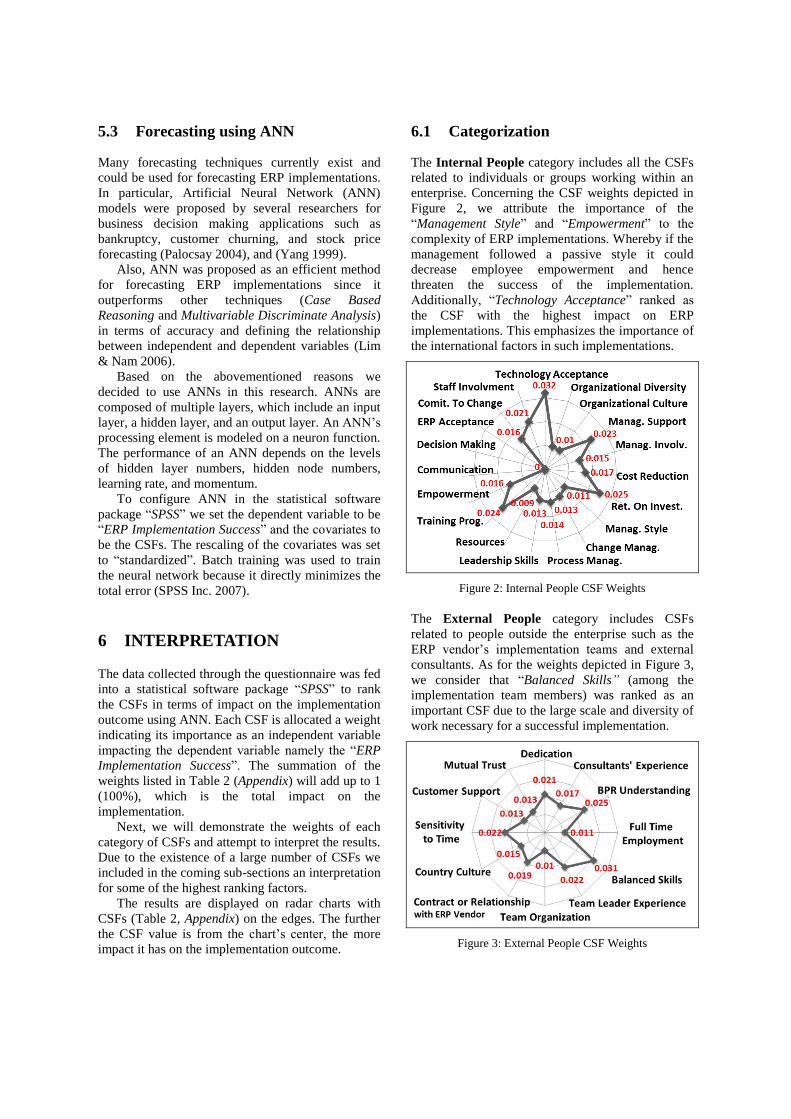
6.1 Categorization
The Internal People category includes all the CSFs
related to individuals or groups working within an
enterprise. Concerning the CSF weights depicted in
Figure 2, we attribute the importance of the
“Management Style” and “Empowerment” to the
complexity of ERP implementations. Whereby if the
management followed a passive style it could
decrease employee empowerment and hence
threaten the success of the implementation.
Additionally, “Technology Acceptance” ranked as
the CSF with the highest impact on ERP
implementations. This emphasizes the importance of
the international factors in such implementations.
Figure 2: Internal People CSF Weights
The External People category includes CSFs
related to people outside the enterprise such as the
ERP vendor’s implementation teams and external
consultants. As for the weights depicted in Figure 3,
we consider that “Balanced Skills” (among the
implementation team members) was ranked as an
important CSF due to the large scale and diversity of
work necessary for a successful implementation.
Figure 3: External People CSF Weights

The Process category includes the factors that are
related to both the implementation and business
processes adopted by the enterprise implementing
the ERP system. We can notice that the factors with
the highest importance are “Customization” and
“Troubleshooting”. We attribute that to the
implementation complexity with regards to the
variability in the needs of enterprises.
Figure 4: Process CSF Weights
The factors included under the Technology category
are either related to the ERP system itself or to
technology within the organization implementing the
ERP. We can attribute the importance of “Multi-
Company” support to the necessity of dividing
businesses into several strategic business units
(SBU). These SBUs would require the ERP to
support multiple companies using the same data
such as vendors, customers, employees, items, etc.
but separating daily activities such as sales,
accounting information, etc.
Additionally, the general “Flexibility” of the
ERP system has the highest weight and affects both
adoption and implementation.
Figure 5: Technology CSF Weights
6.2 Comparative Analysis
In order to determine the accuracy of our results we
have to benchmark them against those found by
other researchers. Two types of benchmarking are
conducted both by global category weights and by
individual critical success factors.
The CSF Global Category Weights are
illustrated in Figure 6. The results are close to those
discussed by Leon (2008), whereby the “People”
category maintains the highest impact of 51%,
whereas “Process” and “Technology” maintain a
lower impact 22% and 27% respectively.
Figure 6: CSF Weights by Category
Individual Critical Success Factors were also
benchmarked against the results of other researchers.
We benchmarked our top 25 CSFs against those
of Somers & Nelson (2001) and found the following
twelve common critical success factors:
1. External Consultants’ Experience
2. Cost Reduction (Cost of running the business)
3. Contract or Relationship (Short term contract
or long term cooperation with the vendor)
4. External Consultants’ Dedication
5. Team Leader Experience
6. Management Support
7. Business Process Re-Engineering (The level
of necessary business process re-engineering
for the ERP to fit properly within the
enterprise)
8. Training Programs
9. External Consultants’ BPR Understanding
(How well the external consultants understand
the business process)
10. Return on Investment (The management’s
expected ROI from the implemented ERP)
11. Customization (The level of necessary
customization for the ERP to work properly
with the business at hand)
12. Balanced Skills between the implementation
team members (Right work load distribution)

The same benchmarking was done against the
results of the Standish Group (1995) and several
CSFs were in common: “Formal Schedule and
Plan”, “Management Support”, “Staff Involvement”,
“Implementation Pace”, “Technology Acceptance”,
“Balanced Skills”, “Return on Investment”, etc.
Although our CSFs might not be ranked in the
same position as their counterparts, yet they fall
within the top 25 factors. This fact plays an
important role in supporting our results’ accuracy.
Also, by comparing our results to those of Plant
& Willcocks (2007) one can find several common
CSFs including: “Management Support”, “Team
Leader Experience”, “Balanced Skills”, “Cost
Reduction”, “Contract or Relationship”, etc.
7 MODEL AND TOOL SUPPORT
In order for our research to produce a reusable
outcome, we have to codify our results into a model
that can be used by users interested in the ERP
implementation phase. This requires the model to be
supported by the appropriate software tools.
7.1 Assessment Model
Based on our research for the assessment of the ERP
implementation phase we devised a hierarchical
model for depicting the categories and
subcategories, which impact ERP implementations
(Figure 9, Appendix). The purpose of this model is to
provide a simplified overview of the different ERP
implementation CSF categories.
Each of the categories includes a set of CSFs
with a certain impact weight on the final ERP
implementation outcome (Table 2, Appendix).
Additionally, the correlation between the different
CSFs is also considered (Table 3, Appendix).
A set of external agents (Staff, Management,
ERP Vendor, etc.) are also illustrated with their
corresponding impact on the implementation.
7.2 Software Tool Characteristics
An important characteristic of the devised software
tool is the simplification of the assessment model.
Initially in order to assess the weights of the
different CSFs, we used a questionnaire composed
out of 65 questions. Since ERP implementations
could span for a period of several months, and due to
the need to continuously assess the implementation
state, we aimed towards minimizing the number of
questions in the software tool.
The CSFs were classified into 3 categories according
to the frequency by which their values change
throughout the implementation (Appendix). This
would minimize the overall number of questions.
Factors marked with a star (*) have a fixed
impact hence do not continuously change with every
iteration. For example factors classified under the
“Adoption” class, in the “Technology” category will
only be assessed when the ERP system is adopted.
These factors would not require further assessment
during the implementation. This is due to the fact
that the major ERP system features are not likely to
pass through dramatic changes in the period between
the adoption phase and the implementation phase.
Factors that rarely vary are marked with two
stars (**). These factors might change less
frequently throughout the implementation procedure.
The remaining CSFs are not marked, indicating
that their values will most likely vary continuously.
The software was written in C#, and the
Windows Presentation Foundation (WPF) was used
for the GUI. Additionally, SQL Server 2008 was
used for managing the assessment information.
7.3 Questions Asked by Software
The devised software tool is a wizard, which
allows the user to answer the necessary questions in
order to interpret the current implementation state.
The wizard prompts the user to evaluate each of
the factors through a user friendly interface. The
user will have to perform a onetime entry for the
information related to the factors with a fixed
impact. The information related to the factors with a
variant impact will be mandatory first and optional
later. On the other hand the questions related to the
remaining factors will be mandatory.
Figure 7 illustrates one screen of the wizard, in
which the user can answer a series of questions.
Questions that are not mandatory may be skipped or
substituted by the answer from the last execution.
Figure 7: Assessment Tool - Question Wizard

The following are sample questions, which could
be asked by the software:
How would you rate the overall technology
acceptance in the organization at the current
implementation stage?
□ (Very High) □ (High) □ (Moderate) □ (Low) □ (Very Low)
How would you rate the speed in which the
implementation team is able to configure the
ERP at the current implementation stage?
□ (Very High) □ (High) □ (Moderate) □ (Low) □ (Very Low)
By combining answers to similar questions and
the CSF weights (Table 2, Appendix) the software is
able to calculate the effect of each CSF. The user
could either view detailed reports or a global state
(Figure 8).
7.4 Results Provided by the Software
Upon processing the information the software will
use the weights and correlations listed in the
Appendix, in order to provide a numerical
assessment of the current implementation state. The
various evaluation results will be stored inside a
database. The user will have the option to view the
average of all the assessments conducted throughout
the ERP implementation. Additionally, the user has
an option to view how the state evolved throughout
the entire implementation period. The software will
also provide the user with key figures indicating the
weaknesses of the implementation in terms of the
predefined CSFs.
Figure 8 depicts a sample of the software’s
visualization, which helps in interpreting the ERP
implementation state in a user friendly manner.
Figure 8: Assessment Tool - Result Visualization
In addition to assessing the implementation at
each stage, the software will allow the user to review
the historical assessment information in order to be
able to monitor the state’s evolution over time.
8 RECOMMENDATIONS
The following is a small subset of our list of
recommendations based on both the quantitative
results (Section 6 and Table 2, Appendix) in addition
to qualitative information obtained through side
discussions conducted alongside the questionnaire.
These recommendations could help in minimizing
the risks associated with ERP implementations.
1. Enterprises (General)
To adopt an ERP that suits the business
process, and try to minimize the
sacrifices related to software features
Adapting to the idea that ERP systems
are the responsibility of everyone in the
enterprise including the different levels
of management and all the employees
2. Enterprises (Multi-National)
A careful evaluation of the international
features (Multicurrency, Multilingual, etc.)
of the adopted ERP is vital
Upon adopting an internationally known
ERP systems check if the local reseller can
live up to the reputation of the international
vendor
3. ERP Vendors (General)
Helping an enterprise in accelerating and
getting more business value from the
ERP rather than just mere transaction
management, emphasizes long term
cooperation rather than short term
contracts
To provide a sufficient number of people
for supporting the enterprises’ needs
during and after the implementation
4. ERP Vendors (Multi-National)
Informing the international clients of the
ERP’s limitations for their industry and
region establishes a relationship based on
trust
Adapting an ERP to markets that would
require a complete re-engineering of the
system would increase the risk of failure

9 CONCLUSIONS
ERP systems have advanced significantly since their
first appearance on the market and are now a major
pillar in the management and optimization of
modern businesses.
In this paper we have developed a model for
assessing the ERP implementation phase. The model
consists of critical success factors classified under
logical categories and subcategories. The aim of this
model is to provide a simple yet systematic
technique for continuous assessment of an ERP
implementation. Additionally, we have developed a
supporting software tool that allows a more
simplified assessment of the ERP implementation to
be carried out by stakeholders interested in
evaluating the success of this phase of the lifecycle.
In the future we can consider extending our
model by adding a new dimension related to the co-
existence of multiple ERP systems in the same
company, whether due to mergers and acquisitions
or to diverse business needs. Our tool could also be
extended to provide more elaborate visualizations.
REFERENCES
Brown, Carol and Vessey, Iris (1999) ‘ERP
Implementation Approaches: Toward a Contingency
Framework’, In Proceedings of the 20th international
conference on Information Systems, ICIS ’99, Atlanta,
GA, USA, Association for Information Systems, pp.
411–416.
Davison, Robert (2002) ‘Cultural Complications of ERP’,
Communications of the ACM, 45(7).
Esteves, Jose M. and Pastor, Joan A. (1999) ‘An ERP
Life-cycle-based Research Agenda’, In EMRPS’99,
Venice, Italy, pp. 359-371.
Gargeya, Vidyaranya B. and Brady, Cydnee (2005)
‘Success and Failure Factors of Adopting SAP in ERP
System Implementation’, Business Process
Management Journal, 11(5), pp. 501-516.
Holland, C.R. and Light, B. (1999) ‘A Critical Success
Factors Model for ERP Implementation’, IEEE
Software, 16(3), pp. 30-36.
Keystone Strategy (2007) ‘ERP End-User Business
Productivity: A Field Study Of SAP & Microsoft’,.
Klaus, Helmut, Rosemann, Michael and Gable, Guy G.
(2000) ‘What is ERP?’, Information Systems
Frontiers, 2(2), pp. 141–162.
Leon, Alexis (2008) ERP Demystified, 2nd ed. New Delhi,
Tata McGraw-Hill.
Liang, Huigang, Xue, Yajiong, Boulton, William R. and
Byrd, Terry Anthony (2004) ‘Why Western Vendors
Don’t Dominate China’s ERP market’,
Communications of the ACM, 47(7), pp. 69-72.
Lim, Se Hun and Nam, Kyungdoo (2006) ‘Artificial
Neural Network Modeling in Forecasting Successful
Implementation of ERP Systems’, International
Journal of Computational Intelligence Research, 2,
pp. 110-114.
Magnusson, Johan, Nilsson, Andreas and Carlsson,
Fredrik (2004) ‘Forecasting ERP Implementation
Success - Towards a Grounded Framework’, In
Proceedings of the 13th European Conference on
Information Systems, ECIS 2004, Turku, Finland, pp.
1125-1133.
Martinsons, Maris G. (2004) ‘ERP in China: One Package,
Two Profiles’, Communications of the ACM, 47(7),
pp. 65-68.
Motwani, Jaideep, Akbulut, Asli Yagmur and Nidumolu,
Vijay (2005) ‘Successful Implementation of ERP
Systems: A Case Study of an International Automotive
Manufacturer’, International Journal of Automotive
Technology and Management, 5(4), p. 375.
Ngai, E, Law, C and Wat, F (2008) ‘Examining the
Critical Success Factors in the Adoption of Enterprise
Resource Planning’, Computers in Industry, 59(6), pp.
548-564.
O’Kane, James and Roeber, Marco (2004) ‘ERP
Implementations and Cultural Influences: A Case
Study’, In 2nd World Conference on POM, Cancun,
Mexico.
Palocsay, S. W. (2004) ‘Neural Network Modeling in
Cross-Cultural Research: A Comparison with Multiple
Regression’, Organizational Research Methods, 7(4),
pp. 389-399.
Plant, Robert and Willcocks, Leslie (2007) ‘Critical
Success Factors in International ERP
Implementations: A Case Research Approach’,
Journal of Computer Information Systems, 47(3), pp.
60–70.
Rajapakse, Jayantha and Seddon, Peter (2005) ‘ERP
Adoption in Developing Countries in Asia : A Cultural
Misfit’, Information Systems Journal, pp. 1-18.
Somers, Toni M. and Nelson, Klara (2001) ‘The Impact of
Critical Success Factors Across the Stages of
Enterprise Resource Planning Implementations’, In
Proceedings of the 34th Hawaii International
Conference on System Sciences, HICSS ’01, pp. 1–10.
SPSS Inc. (2007) SPSS Neural NetworksTM 17.0, Chicago,
SPSS Inc.
Standish Group (1995) CHAOS Report,
http://www.projectsmart.co.uk/docs/chaos-report.pdf.
Tsai, Wen-Hsien, Chien, Shih-Wen, Hsu, Ping-Yu and
Leu, Jun-Der (2005) ‘Identification of Critical Failure
Factors in the Implementation of Enterprise Resource
Planning (ERP) System in Taiwan’s Industries’,
International Journal of Management and Enterprise
Development, 2(2), pp. 219-239.
Yang, Z (1999) ‘Probabilistic Neural Networks in
Bankruptcy Prediction’, Journal of Business Research,
44(2), pp. 67-74.

APPENDIX
Table 2: Compiled List of Critical Success Factors
Reference Name Class Weight
Internal People (19 CSFs)
>> International (3 CSFs)
IPIFC01 Technology Acceptance Commitment 0.032
IPIFM02 *Org. Diversity Management 0.01
IPIFM01 *Org. Culture Management 0.01
>> Management (8 CSFs)
IPMC01 **Manag. Support Commitment 0.023
IPMC02 Manag. Involvement Commitment 0.015
IPME02 **Cost Reduction Expectations 0.017
IPME01 **Return On Invest. Expectations 0.025
IPMM03 Management Style Management 0.011
IPMM01 Change Management Management 0.013
IPMM02 Process Management Management 0.014
IPMM04 **Leadership Skills Management 0.013
>> Organization (5 CSFs)
IPOC03 Resources Commitment 0.009
IPOC02 Training Programs Commitment 0.024
IPOC01 Empowerment Commitment 0.016
IPOM02 Communication Management -
IPOM01 Decision Making Management -
>> Staff (3 CSFs)
IPSC03 ERP Acceptance Commitment -
IPSC02 Commitment to Change Commitment 0.016
IPSC01 Staff Involvement Commitment 0.021
External People (12 CSFs)
>> External Consultants (3 CSFs)
EPECCM01 **Dedication Commitment 0.021
EPECCP02 **Experience Competence 0.017
EPECCP01 **BPR Understanding Competence 0.025
>> Implementation Team (4 CSFs)
EPITCM01 **Full Time Empl. Commitment 0.011
EPITCP02 **Balanced Skills Competence 0.031
EPITCP01 **Team Leader Exp. Competence 0.022
EPTOCU01 **Team Organization Culture 0.01
>> International (3 CSFs)
EPIFCM01 **Contract or Rel. Commitment 0.019
EPIFCU01 *Country Culture Culture 0.015
EPIFCU02 **Sensitivity to Time Culture 0.022
>> Vendor (2 CSFs)
EPVECM01 **Customer Support Commitment 0.013
EPVECM02 **Mutual Trust Commitment 0.013
Process (16 CSFs)
>> Business Process (4 CSFs)
PRBP04 *Re-Engineering Adoption 0.023
PRBP01 *Innovation Adoption 0.015
PRBP03 Customization Adaptation 0.026
PRBP02 Configuration Adaptation 0.015
>> International (4 CSFs)
PRIF01 **Strategic Planning External 0.012
PRIF02 **Legal System External 0.015
PRIF03 **Gov. Regulations External 0.008
PRIF04 **Political Aspects External -
>> Quality Control (4 CSFs)
PRQC04 Performance Measures QC 0.013
PRQC01 Monit. and Feedback QC 0.023
PRQC03 Accountability QC 0.016
PRQC02 Troubleshooting QC 0.026
>> Transition (4 CSFs)
PRTR01 *Transition Strategy Transition 0.013
PRTR03 **Realistic Deadlines Schedule 0.01
PRTR04 * Schedule and Plan Schedule 0.018
PRTR02 * Implement. Pace Schedule 0.021
Technology (16 CSFs)
>> ERP System Aspects (2 CSFs)
TGESAA01 *Legacy Sys. Comp. Adoption 0.01
TGESAA02 *Realistic Costs Adoption 0.017
>> ERP System Productivity (6 CSFs)
TGESPA03 *Transac. Efficiency Adoption 0.017
TGESPA04 *Flexibility Adoption 0.028
TGESPA05 *Business Insight Adoption -
TGESPA02 *Familiarity Adoption 0.02
TGESPA01 *Usability Adoption 0.022
TGESPA06 *Collaboration Adoption 0.012
>> International (5 CSFs)
TGIFA05 *High Configurability Adoption 0.016
TGIFA01 *Multilingual Adoption 0.016
TGIFA02 *Multi-Currency Adoption 0.027
TGIFA03 *Multi-Company Adoption 0.024
TGIFA04 *Multi-Site Adoption 0.016
>> Organization I.T. (3 CSFs)
TGOITI01 *I.T. Maturity Implementation 0.016
TGOITI02 *Tech. Infrastruct. Implementation 0.009
TGOITI03 * Info. Sharing Implementation 0.008
Legend: Scale Ordinal * One Time Input ** Rarely Changes
Table 3: Top 10 Correlated Critical Success Factors
CSF 1 CSF 2 Correlation
IPMC01 IPMC02 0.832
IPMM01 PRQC04 0.836
IPMM01 PRQC03 0.817
IPME01 PRQC01 0.742
IPME02 EPITCP01 0.722
IPOC01 PRBP01 0.746
IPSC02 IPIFC01 0.768
IPIFM02 EPVECM01 -0.803
EPECCM01 EPECCP01 0.949
EPECCM01 EPECCP02 0.959
The questionnaire could be accessed from the
following URL (a generic hosting service was used
for the purpose of the double-blind review):
http://bit.ly/ERP_Implementation_Questionnaire
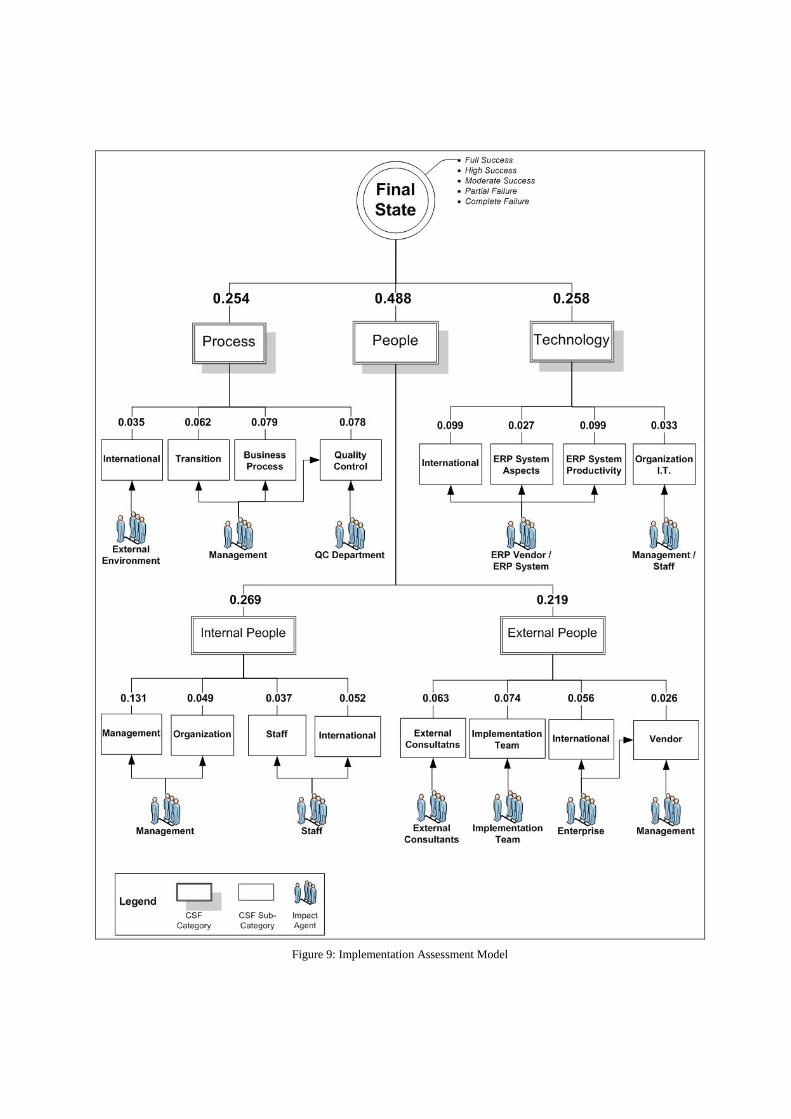
Figure 9: Implementation Assessment Model