a synthetic biological engineering approach to secretion
TRANSCRIPT
Utah State UniversityDigitalCommons@USU
All Graduate Theses and Dissertations Graduate Studies
5-2010
A Synthetic Biological Engineering Approach toSecretion- Based Recovery ofPolyhydroxyalkanoates and Other CellularProductsElisabeth LintonUtah State University
Follow this and additional works at: https://digitalcommons.usu.edu/etd
Part of the Analytical Chemistry Commons, Biomedical Engineering and BioengineeringCommons, and the Molecular Biology Commons
This Thesis is brought to you for free and open access by the GraduateStudies at DigitalCommons@USU. It has been accepted for inclusion in AllGraduate Theses and Dissertations by an authorized administrator ofDigitalCommons@USU. For more information, please [email protected].
Recommended CitationLinton, Elisabeth, "A Synthetic Biological Engineering Approach to Secretion- Based Recovery of Polyhydroxyalkanoates and OtherCellular Products" (2010). All Graduate Theses and Dissertations. 678.https://digitalcommons.usu.edu/etd/678

A SYNTHETIC BIOLOGICAL ENGINEERING APPROACH TO SECRETION-
BASED RECOVERY OF POLYHYDROXYALKANOATES AND
OTHER CELLULAR PRODUCTS
by
Elisabeth Linton
A thesis submitted in partial fulfillment
of the requirements for the degree
of
MASTER OF SCIENCE
in
Biological Engineering
Approved:
Charles D. Miller Ronald C. Sims
Co-Major Professor Co-Major Professor
Daryll B. DeWald Byron R. Burnham
Committee Member Dean of Graduate Studies
UTAH STATE UNIVERSITY
Logan, Utah
2010

ii
Copyright © Elisabeth Linton 2010
All Rights Reserved
iii
ABSTRACT
A Synthetic Biological Engineering Approach to Secretion-
Based Recovery of Polyhydroxyalkanoates
and Other Cellular Products
by
Elisabeth Linton, Master of Science
Utah State University, 2010
Major Professors: Dr. Charles D. Miller and Dr. Ronald C. Sims
Department: Biological Engineering
The costs associated with cellular product recovery commonly account for as
much as 80% of the total production expense. As a specific example, significant
recovery costs limit commercial use of polyhydroxyalkanoates (PHA), which comprise a
class of microbially-accumulated polyesters. PHAs are biodegradable compounds that are
of interest as a sustainable alternative to petrochemically-derived plastics. Secretion-
based recovery of PHAs was studied to decrease PHA production costs. Type I and II
secretory pathways are commonly used for the translocation of recombinant proteins out
of the cytoplasm of E. coli. Proteins were targeted for translocation using four signal
peptides (HlyA, TorA, GeneIII, and PelB) that operate via type I and II secretory
machinery. GFP translocation was investigated in parallel due to its relative ease of
monitoring to gather information about the functionality of signal peptide sequences.
The translocation of phasin was investigated because of its physical binding interaction
iv
with the PHA granule surface. Genetic fusion of phasin with targeting signal peptides
creates a PHA-phasin-signal peptide complex that can then be potentially used for
cellular export. An important design aspect of this investigation is that synthetic
biological engineering principles and standardized technical formats BBF RFC 10 and
BBF RFC 23 were applied for more efficient construction of genetic devices. As an
additional part of this study, an 1H NMR-based PHA quantification method was
developed to facilitate analysis of intracellular PHAs. Overall, this study demonstrated
that the BioBrick model can be used to construct functional devices that promote
secretion of cellular compounds. The information gathered from this work can be further
optimized and applied to more complex cellular manufacturing systems.
(160 pages)
v
ACKNOWLEDGMENTS
This research would not have been possible without the help of a number of
individuals. First, I am thankful to my husband, JD, for his continued support, patience,
and encouragement. I am grateful to my parents and family for their support. I would
like to sincerely thank Dr. Charles Miller for his enormous involvement throughout the
course of this work. His dedication to his students has made this process very rewarding.
I am also grateful to Dr. Ronald C. Sims not only for his research guidance, but also for
the opportunities that he has afforded during my time as a Biological Engineering student
at Utah State University. This research is also a result of contributions made by Dr.
Sridhar Viamajala, Dr. Daryll B. DeWald, Dr. Marie K. Walsh, Dr. Jon Takemoto, Dean
H. Scott Hinton, and the Synthetic Bio-Manufacturing Center. Lastly, I would like to
thank my fellow students who kept me company during all of the many hours studying
and in the lab. This entire process was made substantially more enjoyable because of
their friendship.
Elisabeth Linton
vi
CONTENTS
Page
ABSTRACT ..................................................................................................................... iii
ACKNOWLEDGMENTS ................................................................................................ v
LIST OF TABLES ........................................................................................................... ix
LIST OF FIGURES .......................................................................................................... x
LIST OF SYMBOLS, NOTATIONS, AND DEFINITIONS ........................................ xiii
CHAPTER
1. INTRODUCTION .................................................................................... 1
Hypothesis........................................................................................... 3
Objectives ........................................................................................... 4
Thesis Outline ..................................................................................... 5
References ........................................................................................... 5
2. LITERATURE REVIEW ......................................................................... 8
PHA Biosynthesis ............................................................................... 8
Current Methods for PHA Recovery ................................................ 10
Recombinant Proteins ....................................................................... 12
Phasin .......................................................................................... 12
Green Fluorescent Protein........................................................... 14
Principles of Secretion in Gram-Negative Organisms ...................... 15
Secretion Pathways ..................................................................... 16
Cytoplasmic Membrane Translocation ....................................... 18
Signal Peptides ............................................................................ 21
Synthetic Biological Engineering ..................................................... 22
The BioBrick Standard ............................................................... 22
The BioFusion Standard ............................................................. 24
References ......................................................................................... 25
vii
3. TRANSLOCATION OF GREEN FLUORESCENT PROTEIN
USING A SYNTHETIC BIOLOGY APPROACH WITH MULTIPLE
SIGNAL PEPTIDES ............................................................................... 33
Abstract ............................................................................................. 33
Background ....................................................................................... 34
Materials and Methods ...................................................................... 38
BioBrick Construction, Primers, and Vectors............................. 38
Strains and Growth Conditions ................................................... 40
Cellular Fractionation ................................................................. 41
SDS-PAGE and Western Blotting .............................................. 42
Flourometry and Fluorescence Microscopy ................................ 42
Results ............................................................................................... 43
Construction of GFP BioFusion Devices .................................... 43
Analysis of GFP Translocation ................................................... 44
Fluorescence Analysis ................................................................ 48
Discussion ......................................................................................... 51
Conclusions ....................................................................................... 54
References ......................................................................................... 55
4. COMPARISON OF SINGLE-STEP EXTRACTION FOR 1H NMR
ANALYSIS WITH GC AND FLUORESCENCE TECHNIQUES
FOR POLYHYDROXYALKANOATE QUANTIFICATION .............. 62
Abstract ............................................................................................. 62
Introduction ....................................................................................... 63
Materials and Methods ...................................................................... 68
Chemicals .................................................................................... 68
Experimental Design ................................................................... 68
Microorganisms and Culture Methods for
Pure Strains ............................................................................. 69
Environmental Samples .............................................................. 70
Sample Preparation ..................................................................... 70
Analytical Methods ..................................................................... 72
1H NMR ................................................................................ 72
Gas Chromatography ............................................................ 72
Fluorometry........................................................................... 73
viii
Results ............................................................................................... 74
PHB and PHBV Standards.......................................................... 74 1H NMR Correlation with GC and
Fluorescence Measurements ................................................... 77
PHA Analysis in Environmental Samples .................................. 81
Discussion ......................................................................................... 82
Conclusions ....................................................................................... 85
References ......................................................................................... 86
5. AN INVESTIGATION OF PHASIN TRANSLOCATION AND PHA
PRODUCTION IN ESCHERICHIA COLI ............................................. 92
Abstract ............................................................................................. 92
Background ....................................................................................... 93
Materials and Methods ...................................................................... 97
Strains and Plasmids ................................................................... 97
BioBrick Design and Assembly .................................................. 98
PHA Production in E. coli .......................................................... 99
Cellular Fractionation and Western Blotting ............................ 101
Results ............................................................................................. 101
BioBrick Construction .............................................................. 101
PHA Production in E. coli ........................................................ 106
Analysis of Phasin Translocation.............................................. 109
Discussion ....................................................................................... 112
Conclusions ..................................................................................... 114
References ....................................................................................... 115
6. GENERAL CONCLUSIONS ............................................................... 120
7. FUTURE DIRECTIONS ...................................................................... 122
APPENDICES .............................................................................................................. 125
A. BIOBRICK PARTS AND SEQUENCES ............................................ 126
B. PROTOCOLS, REAGENTS, AND MISCELLANEOUS ................... 134
ix
LIST OF TABLES
Table Page
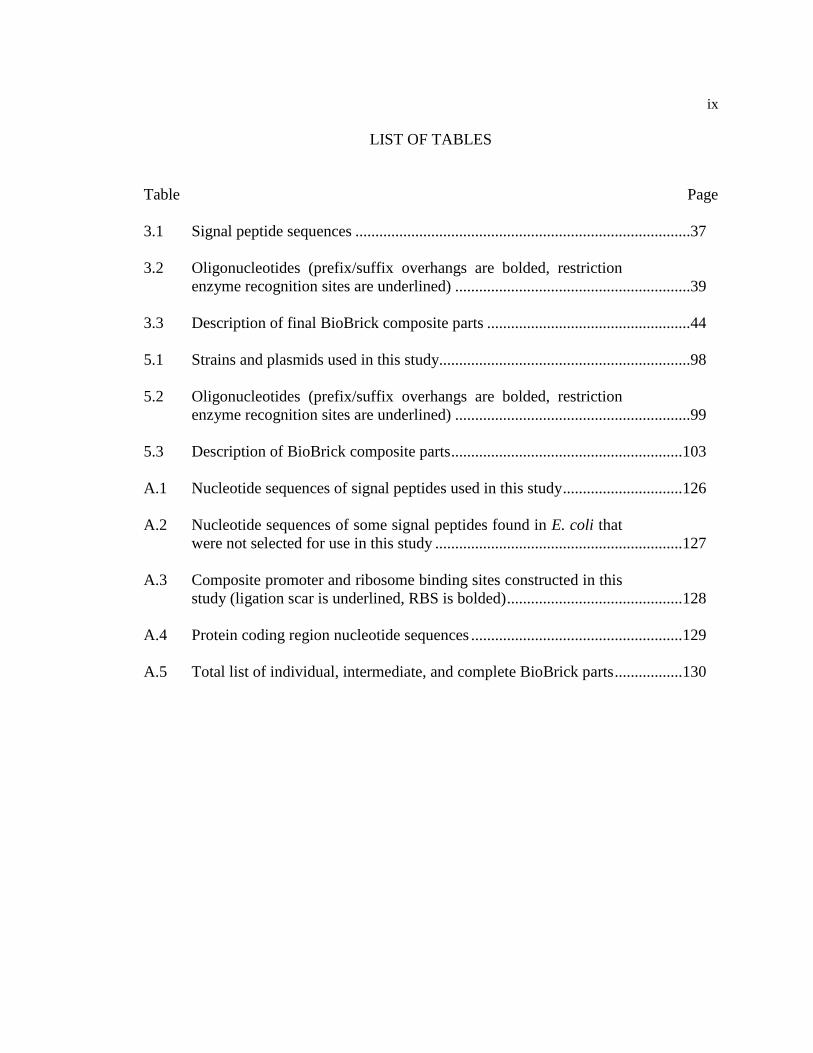
3.1 Signal peptide sequences ....................................................................................37
3.2 Oligonucleotides (prefix/suffix overhangs are bolded, restriction
enzyme recognition sites are underlined) ...........................................................39
3.3 Description of final BioBrick composite parts ...................................................44
5.1 Strains and plasmids used in this study...............................................................98
5.2 Oligonucleotides (prefix/suffix overhangs are bolded, restriction
enzyme recognition sites are underlined) ...........................................................99
5.3 Description of BioBrick composite parts ..........................................................103
A.1 Nucleotide sequences of signal peptides used in this study ..............................126
A.2 Nucleotide sequences of some signal peptides found in E. coli that
were not selected for use in this study ..............................................................127
A.3 Composite promoter and ribosome binding sites constructed in this
study (ligation scar is underlined, RBS is bolded) ............................................128
A.4 Protein coding region nucleotide sequences .....................................................129
A.5 Total list of individual, intermediate, and complete BioBrick parts .................130
x
LIST OF FIGURES
Figure Page
2.1 The metabolic pathway for PHA biosynthesis in C. necator from
propionic acid and glucose carbon sources ...........................................................9
2.2 The effect of PhaR and PhaP on granule size. The bar represents
0.5 µm .................................................................................................................14
2.3 The type I hemolysin secretion system ...............................................................17
2.4 Methods for recovering proteins from the periplasm .........................................18
2.5 Protein translocation via type II Sec- and TAT-dependent secretion .................20
2.6 BioFusion prefix and suffix and the mixed site when XbaI and
SpeI are combined. The scar formed upon religation is compatible
for genetic fusion ................................................................................................24
3.1 Composite structure of an N-terminal signal peptide protein fusion
device ..................................................................................................................40
3.2 Immunoblotting and corresponding SDS polyacrylamide gels of
subcellular fractions for (A) GFPuv:HlyA, (B) TorA:GFPuv, (C)
GeneIII:GFPuv, and (D) PelB:GFPuv. C – cytoplasmic fraction, P
– periplasmic fraction, M – membrane fraction, S – concentrated
supernatant (media) fraction. The position of GFPuv bands varies
from roughly 27-30 kDa, and this size discrepancy between bands
is a result of fusion with signal peptides .............................................................46
3.3 Difference in BL21-Gold (DE3) GFPuv fluorescence activity as a
result of signal peptide fusions (A) Observational difference in
fluorescence activity for cells grown on LB-ampicillin plates (B)
Whole cell relative fluorescence .........................................................................49
3.4 Fluorescence microscopy imaging for (A) GFPuv (B) TorA:GFPuv
C) GFPuv:HlyA and (D) GeneIII:GFPuv. All of the above images
were obtained using a 100 X objective lens........................................................50
3.5 Measurement of fluorescence in concentrated extracellular media ....................51
4.1 1H NMR spectra recorded using standard samples of (A) PHB
polymer and (B) P(HB-co-HV) copolymer ........................................................75
xi
4.2 Standard 1H NMR
calibration curves established using standard
samples of (A) PHB and (B) P(HB-co-HV). The standard deviation
for each measurement was determined, but error bars are not
visible because the standard deviation is smaller than the point
markers on the graph. All linear regression calibration lines had R2
>0.995 .................................................................................................................76
4.3 Sample growth curves for C. necator and A. vinelandii cells .............................77
4.4 (A) 1H NMR spectrum of PHB polymer obtained from C. necator
cells. (B) 1H NMR spectrum of PHB polymer obtained from A.
vinelandii cells ....................................................................................................78
4.5 Correlation of 1H NMR and GC quantification data of PHB content
for C. necator and A. vinelandii for all replications. A trendline
was used to determine the regression coefficient as 0.992 (R2 =
0.991) ..................................................................................................................79
4.6 PHB fraction as determined by GC and 1H NMR compared with
the fluorescence intensity by Nile blue staining for (A) C. necator
and (B) A. vinelandii cultures. For C. necator, the respective R2
values for 1H NMR and GC methods were determined as 0.979 and
0.983. Respective 1H NMR and GC R
2 values of 0.772 and 0.799
were obtained in A. vinelandii samples...............................................................80
4.7 1H NMR spectrum for anaerobic digester sample. Peak overlap is
observed at the 1.28 ppm doublet peak. This does not affect PHA
quantification because the peaks at 2.4 ppm and 5.26 ppm can each
be integrated to determine PHA content .............................................................82
5.1 Schematic for PHA cellular export. Phasin with attached signal
peptide binds to the PHA granule surface and the PHA-phasin-
signal peptide complex is targeted for secretion via either the type I
or II secretory mechanisms .................................................................................95
5.2 (A) Gel electrophoresis depicting PhaP1 gene isolation from R.
eutropha by PCR; MW – Molecular Weight Marker (MassRuler™
DNA Ladder Mix, Fermentas, Glen Burnie, MD). (B) Example gel
showing the difference in size between a control band of the PCR
product prior to ligation and bands from colonies containing
ligation products of phasin and double terminator; C – Control ......................102
5.3 Diagram depicting the construction process of
pBHR68:PhaP1:HlyA plasmid .........................................................................105

xii
5.4 An illustration of E. coli harboring pLG575 for HlyBD protein
expression and pBHR68:PhaP1:HlyA for PHA production and
PhaP1:HlyA BioFusion expression...................................................................106
5.5 Nile blue staining of (A) Top10 E. coli without pBHR68 plasmid,
(B) Top10 E. coli with pBHR68, (C) XL1-Blue E. coli with
pBHR68 and (D) BL21 (DE3) Gold E. coli with pBHR68 ..............................107
5.6 1H NMR spectra for XL1-Blue cells. The three characteristic peaks
of PHB are shown as magnified insets .............................................................108
5.7 Immunoblotting results with different dilutions of phasin primary
antibody. The secondary antibody concentration was held constant
at 1:2500 v/v. Phasin is visible as a 22 kDa band, and some
nonspecific binding is observed at about 71 kDa and at 7.6 kDa .....................109
5.8 SDS polyacrylamide gels and corresponding immunoblots of
subcellular fractions for (A) PhaP1:HlyA, (B) TorA:PhaP1, (C)
GeneIII:PhaP1, and (D) PelB:PhaP1. C – cytoplasmic fraction, P –
periplasmic fraction, M – membrane fraction, S – concentrated
supernatant (media) fraction. The position of GFPuv bands varies
from roughly 22-27 kDa, and this size discrepancy between bands
is a result of fusion with signal peptides ...........................................................110
B.1 BioBrick assembly process. Samples are cut with restriction
enzymes. Fragments are purified using gel electrophoresis and gel
extraction. Isolated DNA is mixed and ligated together. This
process is repeated for each added part.............................................................143
B.2 Map of pK184-HlyBD plasmid ........................................................................143
B.3 PHA extraction: (A) Separation of dispersion layers (B) Extracted
PHA...................................................................................................................144
B.4 Color formation during assays of β-galactosidase and alkaline
phosphatase .......................................................................................................144
B.5 Membrane fraction pellet after ultracentrifugation ...........................................145
B.6 Setup for transfer of protein to PVDF membrane .............................................145

xiii
LIST OF SYMBOLS, NOTATIONS, AND DEFINITIONS
Abbreviation Key
A410 absorbance at 410 nm
CDCl3 deuterated chloroform
EBPR enhanced biological phosphorus removal
EDTA ethylenediaminetetraacetic acid
FID flame ionization detector
GC gas chromatography
GFP green fluorescent protein
GFPuv green fluorescent protein, cycle 3 mutant
HB hydroxybutyrate
HV hydroxyvalerate
1H NMR proton nuclear magnetic resonance
IBR induced blanket reactor
IPTG isopropyl-ß-D-thiogalactopyranoside
LB luria bertani
OD600 optical density at 600 nm
ONPG 0-nitrophenylgalactoside
P phosphorus
P(HB-co-HV) poly(hydroxybutyrate-co-hydroxyvalerate)
PAGE polyacrylamide gel electrophoresis
PAO phosphate accumulating organism

xiv
PCR polymerase chain reaction
PHA polyhydroxyalkanoate
PHB polyhydroxybutyrate
PHV polyhydroxyvalerate
PNPP ρ-nitrophenylphosphate
PVDF polyvinylidene fluoride
SCL short-chain-length
SDS sodium dodecyl sulfate
TAT twin-arginine translocation
TEM transmission electron microscopy
TMB tetramethylbenzidine
TMS tetramethylsilane
VFA volatile fatty acid
1
CHAPTER 1
INTRODUCTION
Plastic compounds are heavily used in a variety of applications due to their useful
material properties and low production costs. However, traditional plastics, such as
polypropylene and polyethylene, are derived from non-renewable petrochemicals and are
not readily biodegradable [1]. In 2007, an estimated 31 million tons of non-degradable
petrochemical plastic materials were disposed of in the United States in the form of
municipal solid waste [2]. In response to landfill accumulation of this plastic waste,
efforts have increased to reduce plastic consumption, to expand recycling programs, and
to improve waste management technologies, such as pyrolysis and composting [3-4].
However, these methods do not provide an economical and complete waste management
solution [1, 3]. Additionally, the use of non-renewable fossil fuels for plastic production
remains an issue. The pervasive use of petroleum-based plastic compounds reinforces a
need for sustainable bioplastic alternatives [1].
Polyhydroxyalkanoates comprise a class of polyesters accumulated by a variety of
microorganisms [5-7]. These bioplastic compounds are intracellularly accumulated and
stored in response to an environmental stress or nutrient limitation as a reserve of carbon,
energy, and reducing power [5, 7-9]. PHAs have comparable material properties to
conventional plastics, like polypropylene, but are fully biodegradable and renewable [6,
10]. As a result, PHAs are of particular interest as a sustainable source of non-
petrochemically-derived thermoplastics for use in an assortment of commercial and
medical applications [1, 9].

2
High costs of PHA production have limited widespread application of the
bioplastic [3, 6-7, 11-12]. Reported economic analyses for various industrial production
systems have placed the cost of PHAs at $2.65-5/kg [11-14]. In contrast,
petrochemically-derived plastics cost about $1.57-1.67/kg for high-density polyethylene
and $2.11-2.18/kg for polypropylene [15]. This discrepancy in expense is largely
attributable to carbon source and downstream processing costs [16]. Although some
progress has been made to minimize these expenses, the overall cost of PHA has not yet
been sufficiently reduced for economical production.
Downstream processing is commonly the most expensive aspect of PHA
production. It is estimated that extraction and purification costs represent as much as 50%
of the total process expense [17]. Traditional PHA downstream processing methods
requiring the use of solvents, enzymatic digestion, or mechanical disruption are
expensive and impractical for industrial-scale recovery [17]. Over the years, a variety of
PHA recovery methods have been developed, although none of these techniques have
resulted in significant economic improvements [18]. Accordingly, further research and
development of new methods for PHA recovery is necessary.
A secretion-based mechanism holds potential to simplify PHA recovery by
eliminating the need for chemical or mechanical disruption of cells. PHA-associated
proteins, called phasins, are known to bind tightly to the PHA granule surface [19-20]. As
a result of this interaction, this project will investigate the possibility of recovering PHA
indirectly by tagging the phasin protein for translocation. Specifically, appending a signal
peptide to a recombinant protein promotes export of the protein out of the cytoplasm
[21]. The interaction between phasin and PHA is of interest for granule recovery because
3
PHA is a non-proteinaceous compound and, consequently, the signal peptide cannot be
directly attached to PHA granules. The phasin protein with a fused signal peptide would
bind to PHA granules, thereby creating a PHA-phasin-signal peptide complex that may
be recognized by the cell for export.
The size of PHA granules or other properties may inhibit efficient translocation
across cellular membranes [22]. Under these circumstances, secretion of phasin protein is
a valuable discovery as it provides foundational information on how to alter and optimize
the system to better promote PHA export. The secretion of GFP was examined first due
to the relative ease with which the fluorescent protein can be monitored [23-24]. Studying
the behavior of GFP under the influence of various signal peptides provides valuable
information that can be applied to studying phasin expression and recovery. Synthetic
biological engineering techniques and standard biological parts, called BioBricks, were
used to carry out this study. The purpose of using this standardized biological format was
to simplify the construction of different composite devices from a few individual
BioBrick parts and to create parts that can be used directly in other studies for protein
secretion.
Hypotheses
This research was conducted in order to obtain foundational information for
secretion-based recovery of cellular products using synthetic biological engineering
methods. The hypothesis of the overall, long-term study is summarized in three parts:
1. A trial-and-error synthetic biological engineering approach using several different
signal peptides will lead to membrane translocation of GFP.
4
2. The signal peptide information obtained from studying GFP will provide a
foundation for constructing systems for cellular export of phasin.
3. The interaction between phasin and PHAs can facilitate secretion-based bioplastic
recovery.
Objectives
The overall objective of this study is to investigate ways to use synthetic
biological engineering to recover cellular products via secretion, and to potentially
recover bioplastic through a phasin/PHA interaction. More specific project objectives
include:
1. Design and construct a BioBrick library of signal peptides, phasin, and GFP parts,
as well as composite devices for investigating secretion
2. Test the functionality of BioBrick devices in Escherichia coli
3. Monitor the translocation of GFP using microscopy, SDS-PAGE and western
blotting
4. Determine efficient methods for detecting and measuring intracellular PHA
accumulation
5. Produce phasin and PHAs in E. coli and construct systems for PHA secretion
The completion of the outlined objectives would contribute novel information to
PHA research. Investigating the secretion of phasin protein would provide a foundation
for further study and optimization of PHA recovery. Additionally, this project will
produce genetic devices and methods that can be employed in similar studies on PHA or
recombinant protein recovery.
5
Thesis Outline
Chapter II provides a comprehensive review of PHAs, recombinant protein
translocation, and synthetic biological engineering. Chapter III describes the design and
results of the GFP translocation process. Chapter IV details the developed 1H NMR
procedure for quantifying and identifying intracellular PHAs. Chapter V describes phasin
and PHA production in E. coli, as well as the genetic systems constructed for compound
translocation. Chapter VI summarizes general conclusions for the entire study. Chapter
VII provides some insight on potential future directions for product recovery studies.
References
1. Reddy CSK, Ghai R, Rashmi, Kalia VC: Polyhydroxyalkanoates: an overview.
Bioresource Technol 2003, 87:137-146.
2. Common wastes and materials – plastics.
[http://www.epa.gov/epawaste/conserve/materials/plastics.htm]
3. van Wegen RJ, Ling Y, Middelberg APJ: Industrial production of
polyhydroxyalkanoates using Escherichia coli: An economic analysis. Chem
Eng Res Des 1998, 76:417-426.
4. Pinto F, Costa P, Gulyurtlu I, Cabrita I: Pyrolysis of plastic wastes. 1. Effect of
plastic waste composition on product yield. J Anal Appl Pyrol 1999, 51:39-55.
5. Anderson AJ, Dawes EA: Occurrence, metabolism, metabolic role, and
industrial uses of bacterial polyhydroxyalkanoates. Microbiol Rev 1990,
54:450-472.
6. Byrom D: Polymer synthesis by microorganisms - technology and economics.
Trends Biotechnol 1987, 5:246-250.
7. Lee SY: Bacterial polyhydroxyalkanoates. Biotechnol Bioeng 1996, 49:1-14.
8. Doi Y: Microbial polyesters. New York, N.Y.: VCH; 1990.

6
9. Madison LL, Huisman GW: Metabolic engineering of poly(3-
hydroxyalkanoates): From DNA to plastic. Microbiol Mol Biol R 1999, 63:21-
53.
10. Steinbüchel A, Füchtenbusch B: Bacterial and other biological systems for
polyester production. Trends Biotechnol 1998, 16:419-427.
11. Choi JI, Lee SY: Process analysis and economic evaluation for poly(3-
hydroxybutyrate) production by fermentation. Bioprocess Eng 1997, 17:335-
342.
12. Castilho LR, Mitchell DA, Freire DM: Production of polyhydroxyalkanoates
(PHAs) from waste materials and by-products by submerged and solid-state
fermentation. Bioresour Technol 2009, 100:5996-6009.
13. Akiyama M, Tsuge T, Doi Y: Environmental life cycle comparison of
polyhydroxyalkanoates produced from renewable carbon resources by
bacterial fermentation. Polym Degrad Stabil 2003, 80:183-194.
14. Choi J, Lee SY: Factors affecting the economics of polyhydroxyalkanoate
production by bacterial fermentation. Appl Microbiol Biot 1999, 51:13-21.
15. Resin pricing – volume thermoplastics [http://plasticsnews.com]
16. Gurieff N, Lant P: Comparative life cycle assessment and financial analysis of
mixed culture polyhydroxyalkanoate production. Bioresour Technol 2007,
98:3393-3403.
17. Jung IL, Phyo KH, Kim KC, Park HK, Kim IG: Spontaneous liberation of
intracellular polyhydroxybutyrate granules in Escherichia coli. Res Microbiol
2005, 156:865-873.
18. Yu J, Chen LXL: Cost-effective recovery and purification of
polyhydroxyalkanoates by selective dissolution of cell mass. Biotechnol Progr
2006, 22:547-553.
19. Pötter M, Müller H, Reinecke F, Wieczorek R, Fricke F, Bowien B, Friedrich B,
Steinbuchel A: The complex structure of polyhydroxybutyrate (PHB)
granules: four orthologous and paralogous phasins occur in Ralstonia
eutropha. Microbiology+ 2004, 150:3089-3089.
20. York GM, Stubbe J, Sinskey AJ: New insight into the role of the PhaP phasin
of Ralstonia eutropha in promoting synthesis of polyhydroxybutyrate. J
Bacteriol 2001, 183:2394-2397.
7
21. Kaderbhai MA, Davey HM, Kaderbhai NN: A directed evolution strategy for
optimized export of recombinant proteins reveals critical determinants for
preprotein discharge. Protein Sci 2004, 13:2458-2469.
22. Koster M, Bitter W, Tommassen J: Protein secretion mechanisms in Gram-
negative bacteria. Int J Med Microbiol 2000, 290:325-331.
23. LaVallie ER, McCoy JM: Gene fusion expression systems Escherichia coli.
Curr Opin Biotech 1995, 6:501-506.
24. Chalfie M, Tu Y, Euskirchen G, Ward WW, Prasher DC: Green fluorescent
protein as a marker for gene expression. Science 1994, 263:802-805.
8
CHAPTER 2
LITERATURE REVIEW
PHA Biosynthesis
PHAs are a class of naturally accumulated biodegradable plastic compounds [1-
3]. These bioplastics have material properties comparable with commodity plastics, like
polypropylene, and could serve as a renewable and sustainable commercial substitute for
fossil-derived polymers [2, 4-6]. Additionally, high PHA compatibility with human
systems has led to use in a range of medical applications, such as orthopedic materials
and sutures [4, 6-9].
PHAs are classified into three categories based on the number of carbon atoms in
the monomer unit [10]. Specifically, SCL-PHAs consist of 3-5 carbon atoms and are the
most extensively studied group of PHAs [11]. Of SCL-PHAs, PHB is the most
commonly studied. Variation in PHA chain length is a function of the organism, the
metabolic pathway, and the available substrate [1, 5-6, 12]. The material properties of the
polymer can be adjusted through the formation of PHB copolymers [13]. For example,
copolymers of PHB and other SCL-PHAs like PHV are formed in the presence of volatile
fatty acids, such as propionate and acetate [14-15]. The elasticity of the polymer
increases with an increasing proportion of hydroxyvalerate monomers [11].
PHB synthesis from acetyl coenzyme A (acetyl-CoA) occurs by three enzymatic
reactions [11, 16]. In the first step, 3-ketothiolase combines two molecules of acetyl-CoA
to produce acetoacetyl-CoA. The acetoacetyl-CoA molecules are reduced by NADPH-
dependent acetoacetyl-CoA reductase to form 3-hydroxybutyryl-CoA (3HB-CoA).
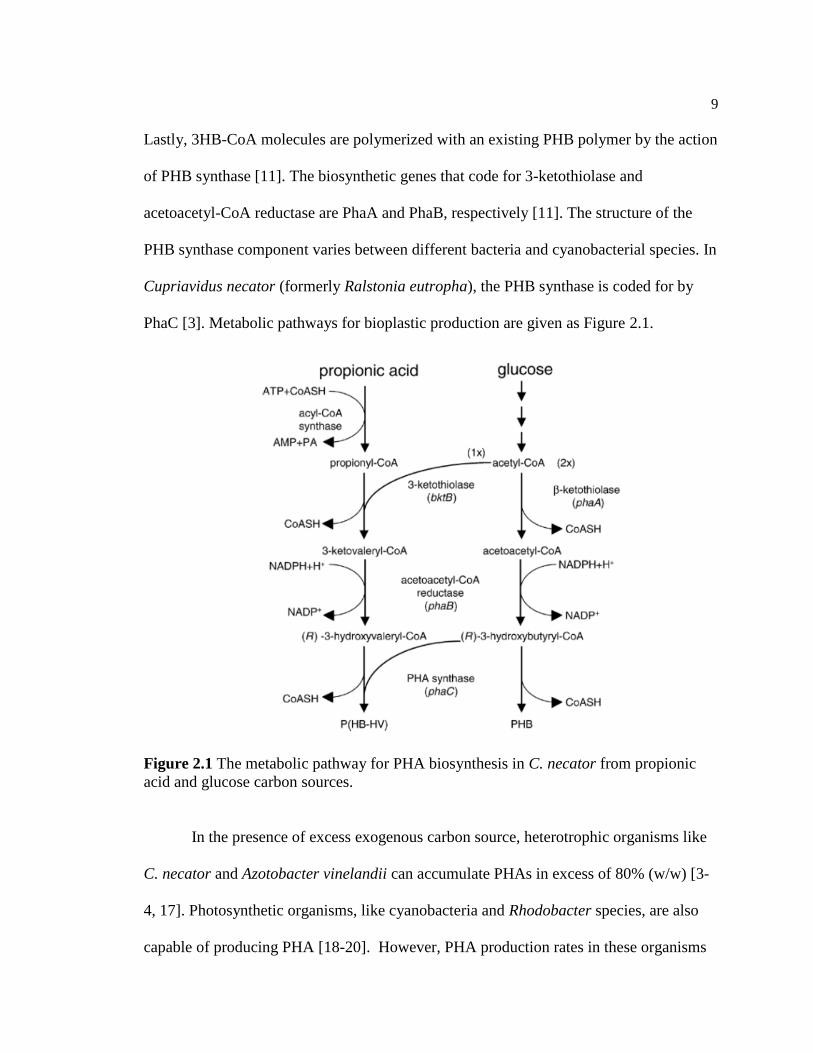
9
Lastly, 3HB-CoA molecules are polymerized with an existing PHB polymer by the action
of PHB synthase [11]. The biosynthetic genes that code for 3-ketothiolase and
acetoacetyl-CoA reductase are PhaA and PhaB, respectively [11]. The structure of the
PHB synthase component varies between different bacteria and cyanobacterial species. In
Cupriavidus necator (formerly Ralstonia eutropha), the PHB synthase is coded for by
PhaC [3]. Metabolic pathways for bioplastic production are given as Figure 2.1.
Figure 2.1 The metabolic pathway for PHA biosynthesis in C. necator from propionic
acid and glucose carbon sources.
In the presence of excess exogenous carbon source, heterotrophic organisms like
C. necator and Azotobacter vinelandii can accumulate PHAs in excess of 80% (w/w) [3-
4, 17]. Photosynthetic organisms, like cyanobacteria and Rhodobacter species, are also
capable of producing PHA [18-20]. However, PHA production rates in these organisms
10
are low in comparison to heterotrophic species, particularly in the absence of exogenous
carbon sources like acetate or fructose [20-21].
Recombinant E. coli harboring the PHA synthesis machinery of C. necator can
accumulate PHB in excess of 90% (w/w) [22]. E. coli have much higher growth rates
than their photoautotrophic counterparts, and are also more readily engineered for
enhanced production [23-24]. PHA production in E. coli is not naturally regulated by the
cell, and can therefore be controlled [24]. For example, constitutive production of PHA is
not efficient for the cell due its negative effect on cellular growth. The use of a well-
regulated promoter, such as the lac or tac promoters, provides the user with the control to
optimize the point of PHA production. After sufficient cellular growth, the addition of
IPTG converts the lac repressor (LacI) into its inactive form, thereby allowing for
transcription of the PHA operon to take place [25].
Current Methods for PHA Recovery
Recovery of cellular products is often a difficult and expensive challenge. It is
estimated that as much as 80% of protein production costs are attributable to downstream
processing [26]. Likewise, the separation and purification cost for non-protein products,
like PHAs, are significant and commonly represent more than half of the total process
expense [27].
The oldest methods for PHA recovery are based on disruption of the cellular
membrane by the addition of chemicals [28]. Variations on these methods have been
developed, which involve the use of different chlorinated [29], liquid halogenated [30],
and non-halogenated solvents [31]. Cellular digestion methods using surfactants (SDS),

11
NaOCl, or combinations of these chemicals have also been extensively studied [32-33]. A
common method for PHA recovery uses NaOCl to digest the cells and chloroform to
dissolve and recover PHA [33].
Mechanical cell disruption for PHA recovery is categorized as either solid shear
or liquid shear [28]. Solid shear methods involve the use of a bead mill to grind the cells,
while high pressure homogenization is an example of liquid shear disruption [28]. Newer
methods, like dissolved air flotation or selective dissolution of cellular mass [34], are also
investigated and could lead to reduced costs [28].
Genetic engineering strategies have also been used in an effort to simplify PHA
recovery. Recombinant E. coli MG1655 harboring PHA biosynthesis genes from C.
necator was used to instigate spontaneous autolysis of the cell [27]. Up to 80% of the
cells in culture released PHA granules, which were subsequently recovered by
centrifuging and washing with distilled H2O [27]. Another method used recombinant
PHA-producing E. coli transformed with the E-lysis gene of bacteriophage PhiX174 from
plasmid pSH2 for recovery [35]. In this system, amorphous PHB is pushed out of the cell
through an E-lysis tunnel structure, which is an opening in the cell envelope [35]. The
osmotic pressure difference between the cytoplasm and the culture medium provides the
driving force for PHA movement into the extracellular medium. PHA is then recovered
by centrifugation or through the addition of divalent cations [35]. These lysis methods
eliminate the need for chemical or mechanical means for cellular disruption, but result in
cell death and fail to promote a continuous PHA production system.
Extracellular deposition of PHA granules was observed in a mutant strain of
Alcanivorax borkumensis SK2, which is a marine bacterium that uses hydrocarbons as its
12
source of carbon and energy [36]. This is the first account of PHA accumulation outside
of a cell [37]. However, the mechanism by which this deposition occurs is unknown [36-
37]. A defined system for PHA excretion has yet to be created. Such a system would be
of value due to the ability to optimize and introduce the mechanism into other organisms
with advantageous characteristics, such as fast-growing E. coli or photoautotrophic PHA-
producers like R. sphaeroides and Synechocystis PCC 6803.
Secretion of products to the culture medium means that mechanical or chemical
cellular disruption is not required for recovery, which could lead to a continuous PHA
production system. Various factors may inhibit PHA export to the extracellular medium.
In this scenario, PHA translocation to the periplasm would still be beneficial because
osmotic shock or cell wall permeabilization techniques can be used for simplified
recovery [38-39].
Recombinant Proteins
Phasin
Phasin is a low-molecular weight protein that plays a role in PHA granule
formation by binding to the PHA granule surface [40-42]. The specific purpose of phasin
production is not completely understood [43], although some effects of the phasin/PHA
interaction have been determined. It has been demonstrated that the production of phasin
is dependent on PHA accumulation [41]. Specifically, it is suggested that phasin
expression requires the presence of an active PHA synthase and that the interaction
between these two proteins promotes PHA synthesis [41].
13
It was observed that the level of PHA accumulation substantially decreases and
the size of PHA granules increases when phasin is either absent or regulated by a
repressor, PhaR [42]. Therefore, PHA production levels are enhanced in the presence of
phasin due to an increased granule surface-to-volume ratio [42, 44]. In addition to
reducing PHA granule size, other functions of phasin have been proposed. In the absence
of phasin, other proteins are able to bind to the granule surface [42]. Therefore, phasin
may function to inhibit attachment of other proteins to the PHA surface that could cause
defects in granule formation [42, 44].
The interaction between phasin and PHB has been exploited for recombinant
protein purification by affinity binding [45]. In this system, a recombinant protein
product, a self-splicing element called an intein, and phasin are genetically fused [45].
The fusion protein complex is produced in PHB-accumulating E. coli [45]. The phasin
protein binds to the surface of the PHB granule, and a cleavage-inducing buffer
stimulates the release of the product protein into the soluble fraction of the solution [45].
For this procedure, PHB is released and proteins are recovered only after the cell is lysed,
which is not ideal. However, the system provides evidence that the phasin/PHA
interaction is strong and that genetic fusion of other elements with phasin does not inhibit
binding to PHA. The fusion of phasin with a targeting signal peptide could therefore
result in a signal peptide/phasin/PHA complex that is recognized by a cell for
transmembrane export.
Efficient recovery of PHA granules via secretion of a signal peptide/phasin/PHA
complex may be inhibited due to the size of PHA granules. The molecular mass of PHAs
varies from about 50 kDA to 1,000 kDA based on the growth parameters and host strain
14
used [5]. However, the binding of phasin decreases the molecular weight of PHA and
encourages its formation as numerous, small granules [42]. Specifically, small granules
of PHA approximately 20 – 60 nm in diameter accumulate in the presence of phasin and
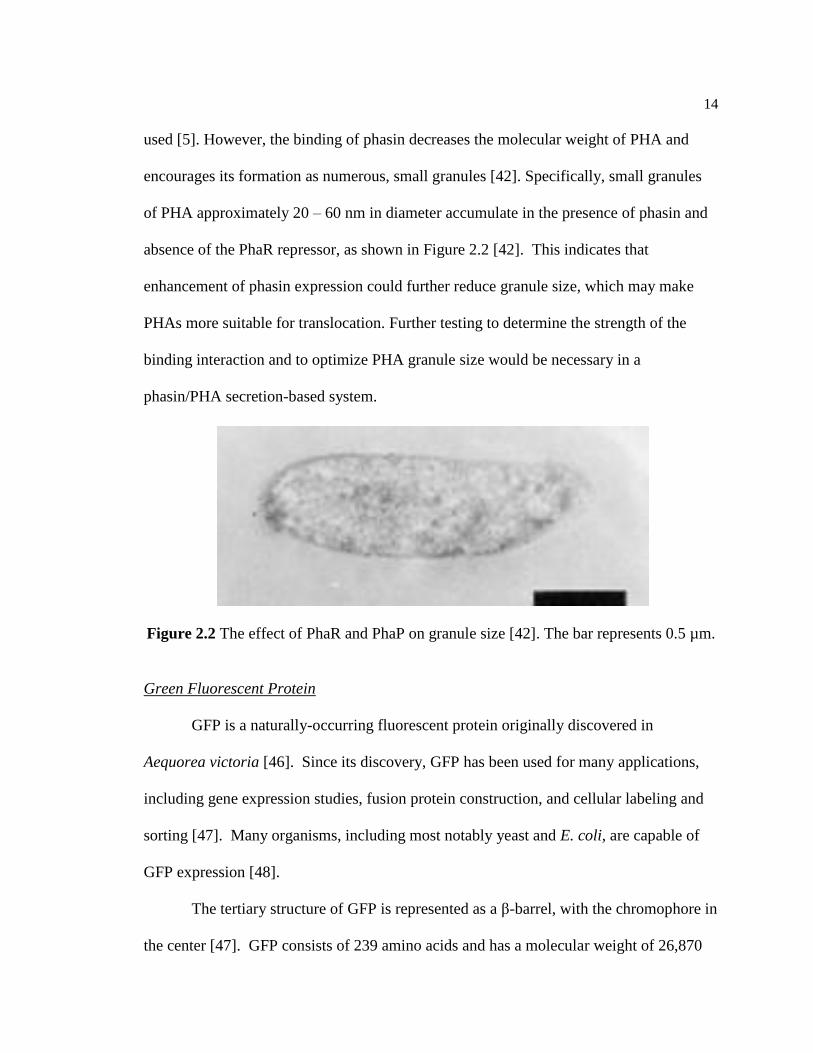
absence of the PhaR repressor, as shown in Figure 2.2 [42]. This indicates that
enhancement of phasin expression could further reduce granule size, which may make
PHAs more suitable for translocation. Further testing to determine the strength of the
binding interaction and to optimize PHA granule size would be necessary in a
phasin/PHA secretion-based system.
Figure 2.2 The effect of PhaR and PhaP on granule size [42]. The bar represents 0.5 µm.
Green Fluorescent Protein
GFP is a naturally-occurring fluorescent protein originally discovered in
Aequorea victoria [46]. Since its discovery, GFP has been used for many applications,
including gene expression studies, fusion protein construction, and cellular labeling and
sorting [47]. Many organisms, including most notably yeast and E. coli, are capable of
GFP expression [48].
The tertiary structure of GFP is represented as a β-barrel, with the chromophore in
the center [47]. GFP consists of 239 amino acids and has a molecular weight of 26,870
15
Daltons [49]. The chromophore of the protein absorbs ultraviolet light at about 395 nm to
excite electrons to a higher energy state. A green light is emitted at about 509 nm when
these electrons move to a lower energy state [47].
The fluorescence photostability and usefulness of GFP as a practical reporter have
been improved through various mutations of the original protein. The cycle 3 mutant is
of special interest because it produces a fluorescence signal 18-fold greater than wild-
type GFP [50-51]. The cycle 3 mutant contains three point mutations of amino acids
found in the β-sheets of the protein. Specifically, amino acids phenylalanine100,
methionine154, and valine164 were mutated to serine, threonine, and alanine,
respectively [50]. These mutations improve the characteristics of GFP by discouraging
the formation of inclusion bodies by increasing the hydrophilicity of the molecule [50].
GFP is an ideal candidate for fusion studies because amino- or carboxy-termini
fusions with GFP typically do not inhibit fluorescence [48]. For example, active and
folded GFP is translocated into the periplasm of gram-negative bacteria after fusion with
TAT-dependent TorA signal peptide [52-54]. Due to its ease of detection, GFP was
studied in parallel with phasin secretion to provide a framework for determining
efficiency and functionality of targeting sequences.
Principles of Secretion in Gram-
Negative Organisms
The functionality of protein secretion mechanisms is affected by the structural
differences between gram-positive and gram-negative organisms [55-56]. Gram-positive
species have a solitary cytoplasmic membrane. This effectively means that membrane
translocation is equivalent to secretion in these species [55]. Alternatively, gram-
16
negative organisms have both an inner and outer membrane that proteins must cross in
order to be fully secreted. Accordingly, proteins can either be exported into the
periplasmic space or secreted into the extracellular medium [57]. The following sections
discuss protein secretion pathways in gram-negative organisms.
Secretion Pathways
There are six pathways for recombinant protein secretion in gram-negative
prokaryotes, numbered I through VI [38, 55]. While these pathways differ, they each
promote secretion while maintaining the integrity of the cellular structure [58]. Types I
and II are the most common pathways for recombinant protein secretion [38] and will be
discussed here.
Type I secretion is a single-step translocation of protein across both the inner and
outer membranes [59]. A commonly discussed example of type I secretion is the
hemolysin system [60]. The constituents of this system include inner membrane proteins
HlyB and HlyD, as well as the TolC outer membrane protein [60]. These three proteins
interact to form a channel that spans the periplasm [38]. Appending the last 42-60 amino
acids of the C-terminus of HlyA protein to the C-terminus of a recombinant protein
targets the protein for secretion [61-63]. The HlyA signal sequence binds to the channel
complex, resulting in ATP hydrolysis by HlyB to drive protein secretion [61]. Proteins as
large as 4000 amino acids can be secreted through the type I channel, which has an
internal diameter of 3.5 nm and a length of 14 nm [64-65]. Unlike in the type II pathway,
the signal peptides of type I secretion remain attached to the protein after export out of
the cytoplasm [38]. The type I secretion system is depicted in Figure 2.3.

17
Figure 2.3 The type I hemolysin secretion system [38].
The type II secretion pathway is a two-step process. The cytoplasmic protein must
first be exported into the periplasm through the action of a translocase [38]. Specifically,
the Sec and TAT machinery facilitate protein movement across the inner membrane and
will be discussed in detail in the next section. After entering the periplasm, translocation
of the protein into the extracellular medium is carried out by a secreton (or secretin),
which is a 12-16 core protein complex present in many gram-negative strains, including
E. coli K-12 [58, 66]. Although the secreton functionality is not completely documented,
it is known that protein conformational changes are necessary for this process to be
carried out [38, 58, 67].
Translocation of cellular products into the periplasm is advantageous over
cytoplasmic production because recovery of periplasmic products is relatively simpler
[38]. There are additional mechanisms for recovering periplasmic proteins if the secreton
machinery is either not present in the host strain or incompatible with the protein of
interest. These mechanisms are depicted in Figure 2.4. L-form and Q-cells are mutant
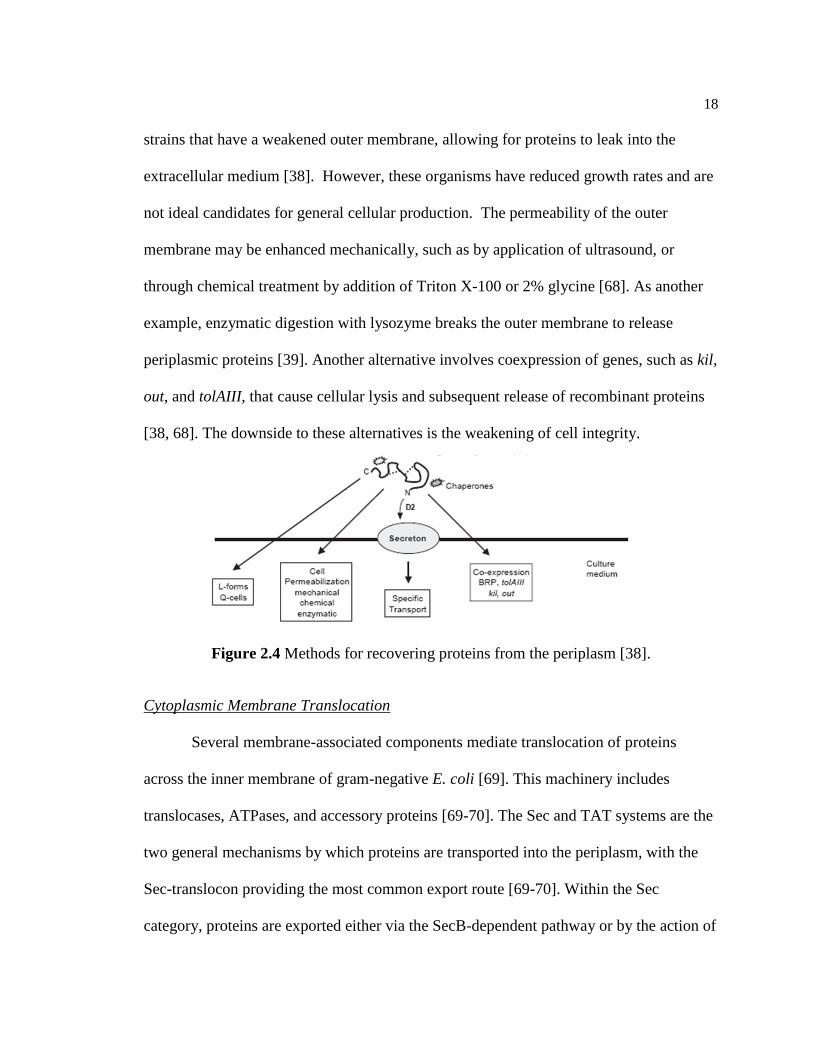
18
strains that have a weakened outer membrane, allowing for proteins to leak into the
extracellular medium [38]. However, these organisms have reduced growth rates and are
not ideal candidates for general cellular production. The permeability of the outer
membrane may be enhanced mechanically, such as by application of ultrasound, or
through chemical treatment by addition of Triton X-100 or 2% glycine [68]. As another
example, enzymatic digestion with lysozyme breaks the outer membrane to release
periplasmic proteins [39]. Another alternative involves coexpression of genes, such as kil,
out, and tolAIII, that cause cellular lysis and subsequent release of recombinant proteins
[38, 68]. The downside to these alternatives is the weakening of cell integrity.
Figure 2.4 Methods for recovering proteins from the periplasm [38].
Cytoplasmic Membrane Translocation
Several membrane-associated components mediate translocation of proteins
across the inner membrane of gram-negative E. coli [69]. This machinery includes
translocases, ATPases, and accessory proteins [69-70]. The Sec and TAT systems are the
two general mechanisms by which proteins are transported into the periplasm, with the
Sec-translocon providing the most common export route [69-70]. Within the Sec
category, proteins are exported either via the SecB-dependent pathway or by the action of

19
the signal recognition particle (SRP) [38]. The attachment of a short sequence, called a
signal peptide, to the N-terminus of a protein is generally necessary for targeting proteins
to any of these translocation pathways [38, 68-69].
In the Sec pathway, SecA is attached peripherally to the inner membrane and
drives peptide translocation through ATPase activity [71]. Integral membrane proteins
SecY and SecE form the core of the Sec translocon, and SecG interacts with this core to
form a multimeric protein complex, SecYEG [70]. This complex functions as a protein-
conducting channel for both post-translational and co-translational protein export [69-70].
Interestingly, the SecYEG translocon can be found in all domains of life, reiterating the
prevalence and importance of this mechanism for protein export [72].
A SecB-dependent mechanism is used by gram-negative species to target post-
translational periplasmic and outer membrane proteins to the Sec-translocon [69]. Of the
three translocation routes, the SecB-dependent pathway is the most common for
recombinant protein export [38]. First, a trigger factor binds to the preprotein as it leaves
a ribosome [38, 69]. Next, the unfolded protein is recognized and bound by the SecB
chaperone protein and directed to SecA, where ATP hydrolysis provides the energy to
move the protein through the SecYEG translocase into the periplasm [38]. In co-
translational protein export, a signal recognition particle (SRP) identifies and interacts
with the signal sequence of the nascent protein as it is exiting the ribosome to the Sec-
translocon [38, 69, 73].
The TAT system is used to export folded proteins into the periplasmic space [68].
Like the Sec-dependent pathways, specific N-terminal signal peptide sequences target a
protein for export by the TAT machinery. Although similar, TAT signal peptides differ
20
from those that target proteins to the Sec machinery. TAT signal peptides contain a
conserved sequence of seven amino acids, (S/T)-R-R-x-F-L-K, at the interface between
the N- and H-regions, where x represents a polar amino acid [74-75]. The twin-arginine
residues are consistently found in TAT signal peptides, and the occurrence of the other
amino acids in the conserved sequence is greater than 50% [74-76].
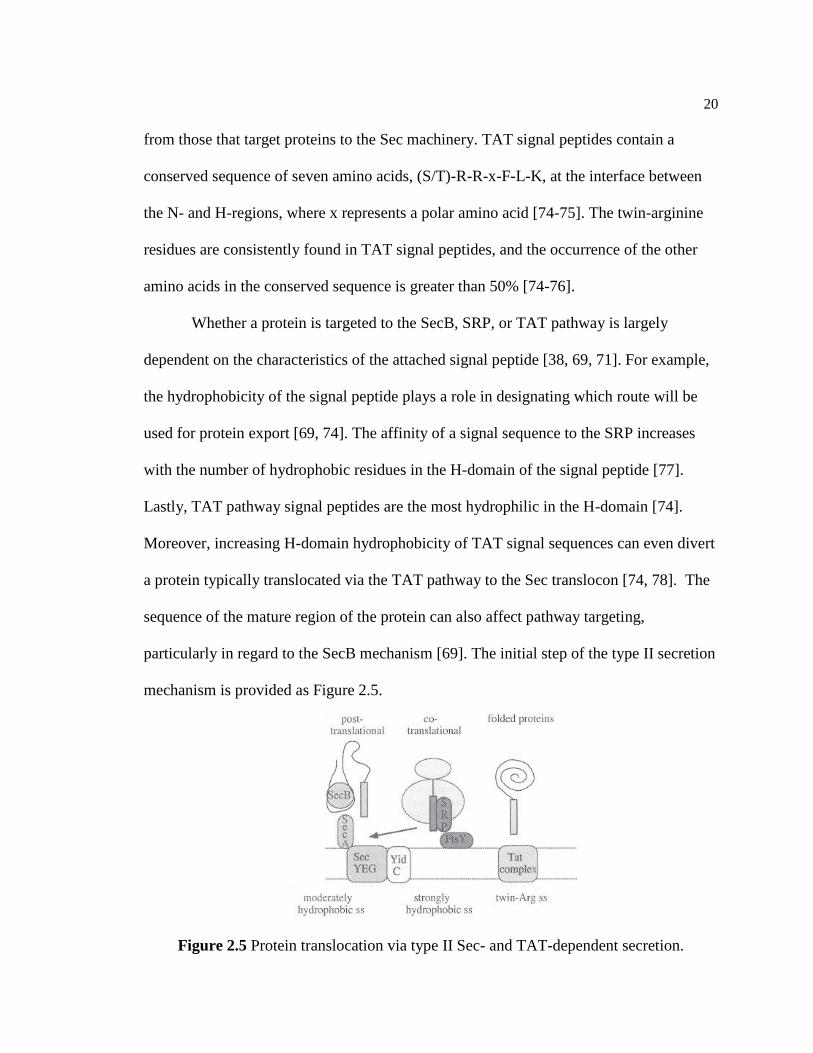
Whether a protein is targeted to the SecB, SRP, or TAT pathway is largely
dependent on the characteristics of the attached signal peptide [38, 69, 71]. For example,
the hydrophobicity of the signal peptide plays a role in designating which route will be
used for protein export [69, 74]. The affinity of a signal sequence to the SRP increases
with the number of hydrophobic residues in the H-domain of the signal peptide [77].
Lastly, TAT pathway signal peptides are the most hydrophilic in the H-domain [74].
Moreover, increasing H-domain hydrophobicity of TAT signal sequences can even divert
a protein typically translocated via the TAT pathway to the Sec translocon [74, 78]. The
sequence of the mature region of the protein can also affect pathway targeting,
particularly in regard to the SecB mechanism [69]. The initial step of the type II secretion
mechanism is provided as Figure 2.5.
Figure 2.5 Protein translocation via type II Sec- and TAT-dependent secretion.

21
Signal Peptides
Signal peptides consist of about 15-30 amino acids and are generally required to
direct a secretory protein to the translocons of the cytoplasmic membrane [57, 68-69].
Despite overall sequence variability, structural similarities exist between different signal
peptides, including a positively-charged 2-10 amino acid N-region, a hydrophobic core
H-region, and a neutral C-domain of about 6 residues [57, 74, 79]. The C-domain
conforms to the -3, -1 rule in which amino acids with short and neutral side-chains, such
as alanine, are required in positions -3 and -1 of the sequence [68, 73]. A signal peptidase
interacts with a cleavage recognition site within the C-domain to release the protein into
the periplasmic space [68-69]. The absence or mutation of the cleavage site can lead to
the targeted protein remaining fixed to the inner membrane [69].
The signal peptide is typically necessary for all translocation pathways. However,
certain protein-coding sequences can be secreted without having an attached signal
peptide due to the presence of additional targeting information within the sequence [69].
Additionally, an attached signal sequence does not guarantee export of a protein, which
further suggests that information in the protein sequence itself can affect secretion
efficiency [69]. However, there are many reported examples of recombinant protein
translocation by gene fusion with a signal peptide. For example, fusion with the TAT
substrate trimethylamine-N-oxide (TMAO) reductase signal peptide TorA resulted in the
export of folded GFP into the periplasm of E. coli [52-54, 75].
Two factors that affect protein export are the positive charge of the N-terminus of
the signal peptide and the charge of the N-terminus of the recombinant protein [80]. It has
been determined that increasing the positive charge of the signal peptide N-terminus not
22
only enhances the interaction with SecA protein, but also reduces the requirements of
SecA ATPase activity for translocation [80]. Therefore, a higher net positive N-terminus
charge improves the rate of protein translocation [38]. For the recombinant protein, the
charge of the N-terminus also affects protein secretion. A net positive charge within the
first five amino acids near the C-domain cleavage site of the signal peptide can reduce
protein export by as much as 50-fold because the charge inhibits the protein from
entering the lipid bilayer [81].
Although factors like hydrophobicity and charge are known to affect protein
export, there are few available guidelines for selecting a proper signal peptide for any
given protein [68]. It is therefore appropriate to investigate recombinant protein secretion
by trial-and-error with different signal peptides [68]. The mechanisms of protein
secretion are complicated and many obstacles can inhibit the process. Some commonly
observed problems include incomplete translocation, degradation of recombinant protein
by proteases, formation of inclusion bodies, and inefficiency of secretion machinery [38,
68]. Optimization of secretion efficiency requires balancing the promoter strength and
gene copy number so as not to overwhelm the system [38]. Lastly, some proteins may
simply be unsuitable for secretion due to their size or sequence [58].
Synthetic Biological Engineering
The BioBrick Standard
The aim of synthetic biological engineering is to simplify the process of
genetically modifying biological systems [82]. Specifically, the BioBrick standard was
created in an effort to provide a defined set of guidelines for engineering biological
23
systems [83]. This standard aims to eliminate much of the guesswork in genetic
engineering and encourage more extensive collaboration through creation of a repository
for genetic parts [83].
A BioBrick refers to a natural nucleic acid sequence that has been obtained and
refined in such a way that it follows defined criterion [82]. The original BioBrick
technical standard (BBF RFC 10) is characterized by a DNA sequence flanked by a
prefix of EcoRI and XbaI restriction sites and a suffix of SpeI and PstI [83]. The
sequence with prefix and suffix is then inserted into a circular, double stranded DNA
vector that contains an origin of replication site and a region coding for antibiotic
resistance [83]. Individual BioBrick parts can then be combined to create functional
composite devices by digestion with different combinations of restriction enzymes and
ligation of parts. For example, digestion of a BioBrick part with EcoRI and XbaI creates
a hole in which a part digested with EcoRI and SpeI can be inserted. SpeI and XbaI sites
are compatible and form a scar upon religation. To conform to the BioBrick standard, the
four restriction enzyme sites present in the prefix and suffix cannot be found at any other
point within the sequence [83].
The motivation for the development of a biological standard was in part provided
by standardized systems used in other fields, such as in uniformity of screw threads,
gasoline formulations, and units of measure [84]. BioBrick parts manufactured by other
researchers can be obtained from the Massachusetts Institute of Technology Registry of
Standard Biological Parts [85]. This infrastructure facilitates more extensive
collaboration and minimizes repetitive construction of similar parts.
24
The BioFusion Standard
The Silver fusion (BioFusion) standard (BBF RFC 23) was created in 2006 to
support genetic fusion of parts using the BioBrick standardized assembly method [86].
The original BioBrick standard does not facilitate genetic fusion because the mixed site
formed upon ligation of two parts is eight base-pairs in length and contains a stop codon,
TAG [86]. These two factors inhibit genetic fusion of proteins. As an alternative, the
BioFusion standard uses a slightly modified prefix and suffix sequence conducive to
genetic fusion, but still retains compatibility with the original BioBrick technical standard
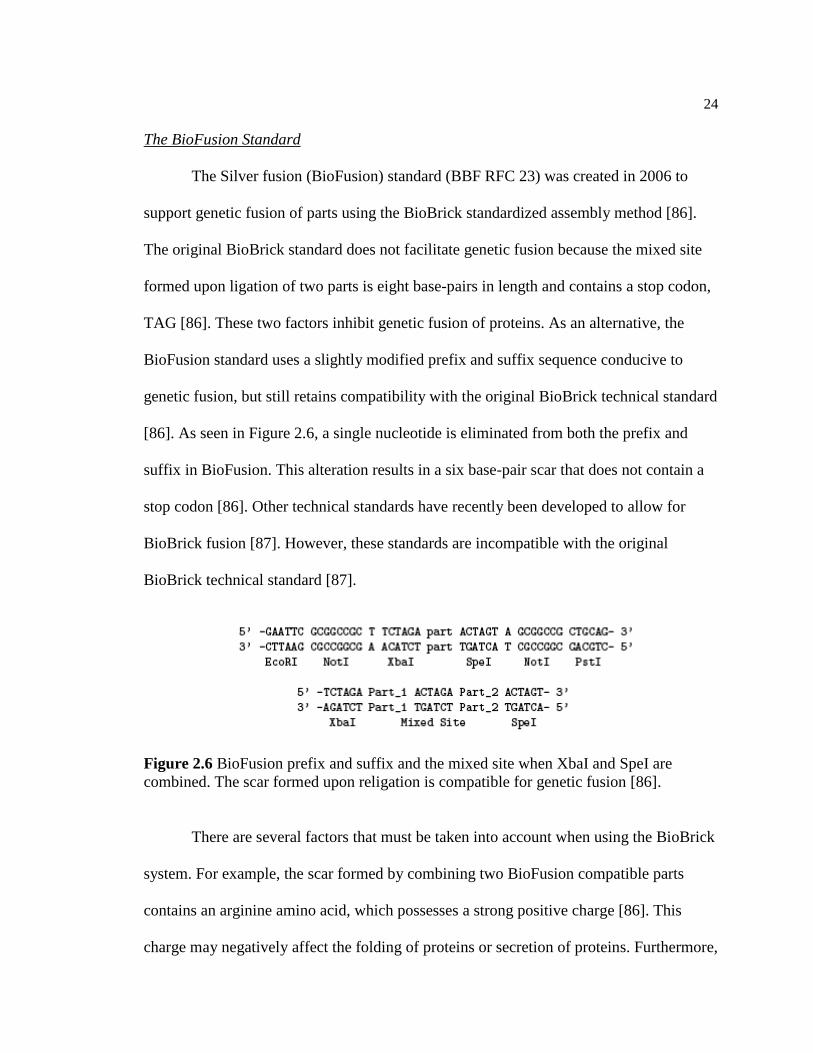
[86]. As seen in Figure 2.6, a single nucleotide is eliminated from both the prefix and
suffix in BioFusion. This alteration results in a six base-pair scar that does not contain a
stop codon [86]. Other technical standards have recently been developed to allow for
BioBrick fusion [87]. However, these standards are incompatible with the original
BioBrick technical standard [87].
Figure 2.6 BioFusion prefix and suffix and the mixed site when XbaI and SpeI are
combined. The scar formed upon religation is compatible for genetic fusion [86].
There are several factors that must be taken into account when using the BioBrick
system. For example, the scar formed by combining two BioFusion compatible parts
contains an arginine amino acid, which possesses a strong positive charge [86]. This
charge may negatively affect the folding of proteins or secretion of proteins. Furthermore,

25
factors like plasmid copy number, antibiotic resistance, and origin of replication can
affect protein expression. For example, the pMB1 origin of replication found in many of
the BioBrick vectors is incompatible with the ColE1 replicon [88].
References
1. Anderson AJ, Dawes EA: Occurrence, metabolism, metabolic role, and
industrial uses of bacterial polyhydroxyalkanoates. Microbiol Rev 1990,
54:450-472.
2. Byrom D: Polymer synthesis by microorganisms - technology and economics.
Trends Biotechnol 1987, 5:246-250.
3. Lee SY: Bacterial polyhydroxyalkanoates. Biotechnol Bioeng 1996, 49:1-14.
4. Holmes PA: Applications of PHB - A microbially produced biodegradable
thermoplastic. Phys Technol 1985, 16:32-36.
5. Madison LL, Huisman GW: Metabolic engineering of poly(3-
hydroxyalkanoates): From DNA to plastic. Microbiol Mol Biol R 1999, 63:21-
53.
6. Steinbüchel A, Füchtenbusch B: Bacterial and other biological systems for
polyester production. Trends Biotechnol 1998, 16:419-427.
7. Williams SF, Martin, DP: Applications of PHAs in medicine and pharmacy. In
Biopolymers: Polyesters III – Applications and Commercial Products. Edited by
Doi Y, Steinbuchel A. Weinheim: Wiley-VCH; 2002: 91–127.
8. Volova T, Shishatskaya E, Sevastianov V, Efremov S, Mogilnaya O: Results of
biomedical investigations of PHB and PHB/PHV fibers. Biochem Eng J 2003,
16:125-133.
9. Chen GQ, Wu Q: The application of polyhydroxyalkanoates as tissue
engineering materials. Biomaterials 2005, 26:6565-6578.
10. Li R, Zhang H, Qi Q: The production of polyhydroxyalkanoates in
recombinant Escherichia coli. Bioresour Technol 2007, 98:2313-2320.
11. Verlinden RAJ, Hill DJ, Kenward MA, Williams CD, Radecka I: Bacterial
synthesis of biodegradable polyhydroxyalkanoates. J Appl Microbiol 2007,
102:1437-1449.

26
12. Reddy CSK, Ghai R, Rashmi, Kalia VC: Polyhydroxyalkanoates: an overview.
Bioresource Technol 2003, 87:137-146.
13. Luzier WD: Materials derived from biomass biodegradable materials. P Natl
Acad Sci USA 1992, 89:839-842.
14. Satoh H, Mino T, Matsuo T: Deterioration of enhanced biological phosphorus
removal by the domination of microorganisms without polyphosphate
accumulation. Water Sci Technol 1994, 30:203–211.
15. Oehmen A, Yuan Z, Blackall LL, Keller J: Comparison of acetate and
propionate uptake by polyphosphate accumulating organisms and glycogen
accumulating organisms. Biotechnol Bioeng 2005, 91:162-168.
16. Suriyamongkol P, Weselake R, Narine S, Moloney M, Shah S: Biotechnological
approaches for the production of polyhydroxyalkanoates in microorganisms
and plants - a review. Biotechnol Adv 2007, 25:148-175.
17. Brandl H, Gross RA, Lenz RW, Fuller RC: Plastics from bacteria and for
bacteria: poly(β-hydroxyalkanoates) as natural, biocompatible, and
biodegradable polyesters. Adv Biochem Eng Biotechnol 1990, 41:77-93.
18. Asada Y, Miyake M, Miyake J, Kurane R, Tokiwa Y: Photosynthetic
accumulation of poly-(hydroxybutyrate) by cyanobacteria - the metabolism
and potential for CO2 recycling. Int J Biol Macromol 1999, 25:37-42.
19. Brandl H, Gross RA, Lenz RW, Lloyd R, Fuller RC: The accumulation of
poly(3-hydroxyalkanoates) in Rhodobacter sphaeroides. Arch Microbiol 1991,
155:337-340.
20. Khatipov E, Miyake M, Miyake J, Asada Y: Accumulation of poly-β-
hydroxybutyrate by Rhodobacter sphaeroides on various carbon and nitrogen
substrates. Fems Microbiol Lett 1998, 162:39-45.
21. Panda B, Mallick N: Enhanced poly-β-hydroxybutyrate accumulation in a
unicellular cyanobacterium, Synechocystis sp. PCC 6803. Lett Appl Microbiol
2007, 44:194-198.
22. Lee SY, Chang HN: Production of poly(hydroxyalkanoic acid). Adv Biochem
Eng Biotechnol 1995, 52:27-58.
23. Lee SY: E. coli moves into the plastic age. Nat Biotechnol 1997, 15:17-18.
27
24. Aldor IS, Keasling JD: Process design for microbial plastic factories:
metabolic engineering of polyhydroxyalkanoates. Curr Opin Biotechnol 2003,
14:475-483.
25. Kidwell J, Valentin HE, Dennis D: Regulated expression of the Alcaligenes
eutrophus PHA biosynthesis genes in Escherichia coli. Appl Environ Microb
1995, 61:1391-1398.
26. Hearn MT, Acosta D: Applications of novel affinity cassette methods: use of
peptide fusion handles for the purification of recombinant proteins. J Mol
Recognit 2001, 14:323-369.
27. Jung IL, Phyo KH, Kim KC, Park HK, Kim IG: Spontaneous liberation of
intracellular polyhydroxybutyrate granules in Escherichia coli. Res Microbiol
2005, 156:865-873.
28. Jacquel N, Lo CW, Wei YH, Wu HS, Wang SS: Isolation and purification of
bacterial poly (3-hydroxyalkanoates). Biochem Eng J 2008, 39:15-27.
29. Baptist JN: Process for preparing poly-β-hydroxybutyric acid. U.S. Patent
3,044,942
30. Vanlautem N, Gilain J: Process for separating poly-β-hydroxybutyrates from
a biomass. U.S. Patent 4,968,611.
31. Kurdikar DL, Strauser FE, Solodar AJ, Paster MD, Asrar J: Methods of PHA
extraction and recovery using non-halogenated solvents. U.S. Patent
6,043,063.
32. Ramsay JA, Berger E, Ramsay BA, Chavarie C: Recovery of poly-3-
hydroxyalkanoic acid by a surfactant-hypochlorite treatment. Biotechnol
Tech 1990, 4:221-226.
33. Hahn SK, Chang YK, Lee SY: Recovery and characterization of poly(3-
hydroxybutyric acid) synthesized in Alcaligenes eutrophus and recombinant
Escherichia coli. Appl Environ Microbiol 1995, 61:34-39.
34. Yu J, Chen LXL: Cost-effective recovery and purification of
polyhydroxyalkanoates by selective dissolution of cell mass. Biotechnol Progr
2006, 22:547-553.
35. Resch S, Gruber K, Wanner G, Slater S, Dennis D, Lubitz W: Aqueous release
and purification of poly(β-hydroxybutyrate from Escherichia coli. J
Biotechnol 1998, 65:173-182.
28
36. Sabirova JS, Ferrer M, Lunsdorf H, Wray V, Kalscheuer R, Steinbuchel A,
Timmis KN, Golyshin PN: Mutation in a "tesB-like" hydroxyacyl-coenzyme
A-specific thioesterase gene causes hyperproduction of extracellular
polyhydroxyalkanoates by Alcanivorax borkumensis SK2. J Bacteriol 2006,
188:8452-8459.
37. Prieto MA: From oil to bioplastics, a dream come true? J Bacteriol 2007,
189:289-290.
38. Mergulhão FJ, Summers DK, Monteiro GA: Recombinant protein secretion in
Escherichia coli. Biotechnol Adv 2005, 23:177-202.
39. Shokri A, Sanden AM, Larsson G: Cell and process design for targeting of
recombinant protein into the culture medium of Escherichia coli. Appl
Microbiol Biot 2003, 60:654-664.
40. Pötter M, Müller H, Reinecke F, Wieczorek R, Fricke F, Bowien B, Friedrich B,
Steinbuchel A: The complex structure of polyhydroxybutyrate (PHB)
granules: four orthologous and paralogous phasins occur in Ralstonia
eutropha. Microbiology+ 2004, 150:3089-3089.
41. York GM, Junker BH, Stubbe J, Sinskey AJ: Accumulation of the PhaP phasin
of Ralstonia eutropha is dependent on production of polyhydroxybutyrate in
cells. J Bacteriol 2001, 183:4217-4226.
42. Maehara A, Ueda S, Nakano H, Yamane T: Analyses of a polyhydroxyalkanoic
acid granule-associated 16-kilodalton protein and its putative regulator in
the pha locus of Paracoccus denitrificans. J Bacteriol 1999, 181:2914-2921.
43. York GM, Stubbe J, Sinskey AJ: The Ralstonia eutropha PhaR protein couples
synthesis of the PhaP phasin to the presence of polyhydroxybutyrate in cells
and promotes polyhydroxybutyrate production. J Bacteriol 2002, 184:59-66.
44. York GM, Stubbe J, Sinskey AJ: New insight into the role of the PhaP phasin
of Ralstonia eutropha in promoting synthesis of polyhydroxybutyrate. J
Bacteriol 2001, 183:2394-2397.
45. Banki MR, Gerngross TU, Wood DW: Novel and economical purification of
recombinant proteins: intein-mediated protein purification using in vivo
polyhydroxybutyrate (PHB) matrix association. Protein Sci 2005, 14:1387-
1395.
46. Shimomura O, Johnson FH, Saiga Y: Extraction, purification and properties of
aequorin, a bioluminescent protein from the luminous hydromedusan,
Aequorea. J Cell Comp Physiol 1962, 59:223-239.

29
47. Prasher DC: Using GFP to see the light. Trends Genet 1995, 11:320-323.
48. LaVallie ER, McCoy JM: Gene fusion expression systems Escherichia coli.
Curr Opin Biotech 1995, 6:501-506.
49. Chalfie M, Tu Y, Euskirchen G, Ward WW, Prasher DC: Green fluorescent
protein as a marker for gene expression. Science 1994, 263:802-805.
50. Crameri A, Whitehorn EA, Tate E, Stemmer WPC: Improved green fluorescent
protein by molecular evolution using DNA shuffling. Nat Biotechnol 1996,
14:315-319.
51. Vessoni Penna TC, Ishii M, Cholewa O, de Souza LC: Thermal characteristics
of recombinant green fluorescent protein (GFPuv) extracted from
Escherichia coli. Lett Appl Microbiol 2004, 38:135-139.
52. Barrett CML, Ray N, Thomas JD, Robinson C, Bolhuis A: Quantitative export
of a reporter protein, GFP, by the twin-arginine translocation pathway in
Escherichia coli. Biochem Bioph Res Co 2003, 304:279-284.
53. Santini CL, Bernadac A, Zhang M, Chanal A, Ize B, Blanco C, Wu LF:
Translocation of jellyfish green fluorescent protein via the Tat system of
Escherichia coli and change of its periplasmic localization in response to
osmotic up-shock. J Biol Chem 2001, 276:8159-8164.
54. Thomas JD, Daniel RA, Errington J, Robinson C: Export of active green
fluorescent protein to the periplasm by the twin-arginine translocase (Tat)
pathway in Escherichia coli. Mol Microbiol 2001, 39:47-53.
55. Desvaux M, Parham NJ, Scott-Tucker A, Henderson IR: The general secretory
pathway: a general misnomer? Trends Microbiol 2004, 12:306-309.
56. Sandkvist M, Bagdasarian M: Secretion of recombinant proteins by gram-
negative bacteria. Curr Opin Biotech 1996, 7:505-511.
57. Pugsley AP: The complete general secretory pathway in Gram-negative
bacteria. Microbiol Rev 1993, 57:50-108.
58. Koster M, Bitter W, Tommassen J: Protein secretion mechanisms in Gram-
negative bacteria. Int J Med Microbiol 2000, 290:325-331.
59. Binet R, Letoffe S, Ghigo JM, Delepelaire P, Wandersman C: Protein secretion
by Gram-negative bacterial ABC exporters - A review. Gene 1997, 192:7-11.

30
60. Gentschev I, Dietrich G, Spreng S, Neuhaus B, Maier E, Benz R, Goebel W,
Fensterle J, Rapp UR: Use of the α-hemolysin secretion system of Escherichia
coli for antigen delivery in the Salmonella typhi Ty21a vaccine strain. Int J
Med Microbiol 2004, 294:363-371.
61. Gentschev I, Goebel W: Type I protein secretion systems in gram-negative
bacteria: Escherichia coli α-hemolysin secretion. In Protein secretion pathways
in bacteria. Edited by Oudega B. Norwell, MA: Kluwer Academic Publishers;
2004:121-140.
62. Hess J, Gentschev I, Goebel W, Jarchau T: Analysis of the hemolysin secretion
system by PhoA-HlyA fusion proteins. Mol Gen Genet 1990, 224:201-208.
63. Kenny B, Taylor S, Holland IB: Identification of individual amino acids
required for secretion within the hemolysin (HlyA) C-terminal targeting
region. Mol Microbiol 1992, 6:1477-1489.
64. Sapriel G, Wandersman C, Delepelaire P: The SecB chaperone is bifunctional
in Serratia marcescens: SecB is involved in the Sec pathway and required for
HasA secretion by the ABC transporter. J Bacteriol 2003, 185:80-88.
65. Fernandez LA, de Lorenzo V: Formation of disulphide bonds during secretion
of proteins through the periplasmic-independent type I pathway. Mol
Microbiol 2001, 40:332-346.
66. Cianciotto NP: Type II secretion: a protein secretion system for all seasons.
Trends Microbiol 2005, 13:581-588.
67. Sandkvist M: Biology of type II secretion. Mol Microbiol 2001, 40:271-283.
68. Choi JH, Lee SY: Secretory and extracellular production of recombinant
proteins using Escherichia coli. Appl Microbiol Biot 2004, 64:625-635.
69. Luirink J, Oudega B: Protein targeting to the inner membrane. In Protein
Secretion Pathways in Bacteria. Edited by Oudega B. Norwell, MA: Kluwer
Academic Publishers; 2004:1-22.
70. Veenendaal AKJ, van der Does C, Driessen AM: The protein-conducting
channel SecYEG. Biochim Biophys Acta 2004, 1694:81-95.
71. van der Does C, Noewen N, Driessen AJM: The Sec translocase. In Protein
secretion pathways in bacteria. Edited by Oudega B. Norwell, MA: Kluwer
Academic Publishers; 2004:23-50.
31
72. Cao TB, Saier MH: The general protein secretory pathway: phylogenetic
analyses leading to evolutionary conclusions. Bba-Biomembranes 2003,
1609:115-125.
73. von Heijne G: Principles of membrane protein assembly and structure. Prog
Biophys Mol Biol 1996, 66:113-139.
74. Berks BC, Sargent F, Palmer T: The Tat protein export pathway. Mol
Microbiol 2000, 35:260-274.
75. Palmer T, Berks BC: The Tat protein export pathway. In Protein secretion
pathways in bacteria. Edited by Oudega B. Norwell, MA: Kluwer Academic
Publishers; 2004:51-64.
76. Berks BC: A common export pathway for proteins binding complex redox
cofactors? Mol Microbiol 1996, 22:393-404.
77. Valent QA, Kendall DA, High S, Kusters R, Oudega B, Luirink J: Early events
in preprotein recognition in E. coli: interaction of SRP and trigger factor
with nascent polypeptides. Embo J 1995, 14:5494-5505.
78. Cristobal S, de Gier JW, Nielsen H, von Heijne G: Competition between Sec-
and TAT-dependent protein translocation in Escherichia coli. Embo J 1999,
18:2982-2990.
79. Molhoj M, Degan FD: Leader sequences are not signal peptides. Nat
Biotechnol 2004, 22:1502.
80. Akita M, Sasaki S, Matsuyama S, Mizushima S: SecA interacts with secretory
proteins by recognizing the positive charge at the amino terminus of the
signal peptide in Escherichia coli. J Biol Chem 1990, 265:8164-8169.
81. Schatz PJ, Beckwith J: Genetic analysis of protein export in Escherichia coli.
Annu Rev Genet 1990, 24:215-248.
82. Shetty RP, Endy D, Knight TF, Jr.: Engineering BioBrick vectors from
BioBrick parts. J Biol Eng 2008, 2:5.
83. Knight TF, Jr.: Idempotent Vector Design for Standard Assembly of
BioBricks [DSpace 2003 http://hdl.handle.net/1721.1/21168.]
84. Endy D: Foundations for engineering biology. Nature 2005, 438:449-453.
85. Registry of Standard Biological Parts [http://partsregistry.org/]
32
86. Phillips IE, Silver PA: A New BioBrick Assembly Strategy Designed for Facile
Protein Engineering. [DSpace 2006 http://hdl.handle.net/1721.1/32535]
87. Anderson JC, Dueber JE, Leguia M, Wu GC, Goler JA, Arkin AP, Keasling JD:
BglBricks: A flexible standard for biological part assembly. J Biol Eng 2010,
4:1.
88. Jobling MG, Holmes RK: Construction of vectors with the p15a replicon,
kanamycin resistance, inducible lacZα and pUC18 or pUC19 multiple
cloning sites. Nucleic Acids Res 1990, 18:5315-5316.
33
CHAPTER 3
TRANSLOCATION OF GREEN FLUORESCENT PROTEIN USING A
SYNTHETIC BIOLOGY APPROACH WITH
MULTIPLE SIGNAL PEPTIDES1
Abstract
Background
Type I and II secretory pathways are commonly used for the translocation of
recombinant proteins out of the cytoplasm of E. coli. The purpose of this study was to
evaluate four signal peptides (HlyA, TorA, GeneIII, and PelB), representing the most
common secretion pathways in E. coli, in their ability to target GFP for membrane
translocation. An important design aspect of this investigation is that synthetic biological
engineering principles and standardized technical formats BBF RFC 10 and BBF RFC 23
were applied for the construction of signal peptide-GFP fusion devices.
Results
It was determined that the HlyA signal peptide targets GFP for secretion to the
extracellular media via the type I secretory pathway, whereas TAT-dependent signal
peptide TorA and Sec-dependent signal peptide GeneIII exported GFP to the periplasm.
Conclusions
The use of biological technical standards simplifies the design and construction of
signal peptide-recombinant protein genetic devices. These parts are functional in
targeting proteins for membrane translocation via type I and II secretion mechanisms in
E. coli. The utility of the standardized parts model is further illustrated because
1 Coauthored by Elisabeth Linton, Ronald C. Sims. and Charles D. Miller.
34
biological parts constructed for this study can be directly applied to other studies on
recombinant protein secretion.
Background
Translocation of recombinant proteins to the extracellular medium or periplasmic
space of gram-negative bacteria is advantageous for a number of reasons. For example,
secretory production can lead to enhanced protein stability, improved yields of active
proteins, and minimized downstream processing requirements [1-4]. The purposes of this
study were to demonstrate both periplasmic translocation and extracellular secretion of
green fluorescent protein (GFP) through comparative analysis of multiple signal peptides
and to determine whether synthetic biological engineering technical standards can be
effectively implemented to construct these systems.
Escherichia coli is commonly used for recombinant protein expression due its
rapid growth rate and ability to express high levels of foreign protein [1, 4-5].
Consequently, understanding the secretory mechanisms of this organism is of particular
importance. Of the six secretory pathways described for gram-negative bacteria [6-9],
type I and type II secretion are most commonly employed for recombinant protein
translocation in E. coli [2, 10]. Type I and II secretion mechanisms and examples of their
use have been previously reviewed in detail [2, 10-12].
Type I secretion is a single-step translocation of targeted proteins across both the
inner and outer membranes to the extracellular milieu [7, 13]. The type I mechanism is
described as the simplest of all gram-negative secretory pathways, and its proteinaceous
constituents include an outer membrane protein, a membrane fusion protein, and an ABC
35
transporter [7, 14]. Secretion of α-hemolysin is an example of the type I mechanism and
involves HlyB and HlyD inner membrane proteins and TolC outer membrane protein [15-
17]. The hemolysin system is naturally present in pathogenic E. coli [14], although TolC
is found in K-12 and B strain genomes.
Unlike type I secretion, the type II secretory pathway targets proteins to the
periplasmic space [2, 18]. Periplasmic proteins can then be recovered by mechanically or
chemically increasing the outer membrane permeability [2, 19], coexpressing genes for
lysis of outer membranes [2], or by the action of a 12-16 core protein secreton (or
secretin) complex [10, 12, 20-21]. Type II translocation of proteins across the inner
membrane of E. coli is mediated by either Sec or TAT cellular machinery, with the Sec-
translocon providing the most common export system [18, 22-23]. The SecYEG
multimeric protein complex functions as a protein-conducting channel for both post- and
co-translational protein export [18, 23-24], whereas the TAT system exports fully-folded
proteins into the periplasmic space [2, 25].
Appending a short signal peptide sequence to the C- or N-termini of a protein is
typically required to target proteins to the type I and II secretory pathways [2, 10, 23, 26].
Many commonly used signal peptides are derived from natural secretory proteins, like
alkaline phosphatase and outer membrane protein A [5]. Recombinant type I secretion is
accomplished by fusing the last 46-60 amino acid residues of the C-terminus of HlyA
protein to the C-terminus of a protein [27-30]. Upon secretion, the signal peptide remains
attached to the recombinant protein [17, 31]. For the type II pathway, protein targeting is
carried out through N-terminal fusion of signal peptides [2]. Most type II signal peptides
are 18-30 amino acids in length and consist of a positively-charged 2-10 amino acid N-
36
region, a hydrophobic core H-region, and a neutral C-domain of about 6 residues [32-35].
Whether a protein is targeted to the TAT or Sec machinery is largely a function of signal
peptide characteristics, like hydrophobicity [23, 34, 36].
Due to its ease of detection, GFP is a popular reporter protein for studying
biological systems [37-38] and is useful for evaluating signal peptide response.
Translocation of active GFP in E. coli has been achieved by the TAT pathway through
fusion with trimethylamine-N-oxide (TMAO) reductase TorA signal peptide [39-42] and
with the FliP signal peptide [43]. In addition to E. coli, Gram-positive organisms [44], V.
anguillarum [45], Chinese hamster ovary cells [46], and Synechococcus PCC 7942 [47]
are all capable of GFP translocation. Unlike these previous studies, a number of signal
peptides representing multiple pathways were evaluated. To our knowledge, translocation
of GFP to the extracellular medium by type I secretion in E. coli has yet to be
demonstrated. Additionally, BioBrick technical standards have not been previously used
to construct type I and II secretory mechanisms for GFP translocation.
The GFPuv (cycle 3) variant was specifically used in this study [48]. This
particular GFP contains three point mutations to amino acids of the protein β-sheet that
discourage formation of GFP inclusion bodies, increase the hydrophilicity of the
molecule, and result in 18 to 45 times brighter fluorescence than wild-type GFP [48-49].
It has been previously reported that fusions onto amino- or carboxy-termini of GFP do
not inhibit fluorescence, which makes GFP an ideal reporter for studies involving genetic
fusion [50].
A number of models and software analysis tools have been developed to predict
protein localization, such as TMHMM and SignalP [51-52]. Additionally, factors like
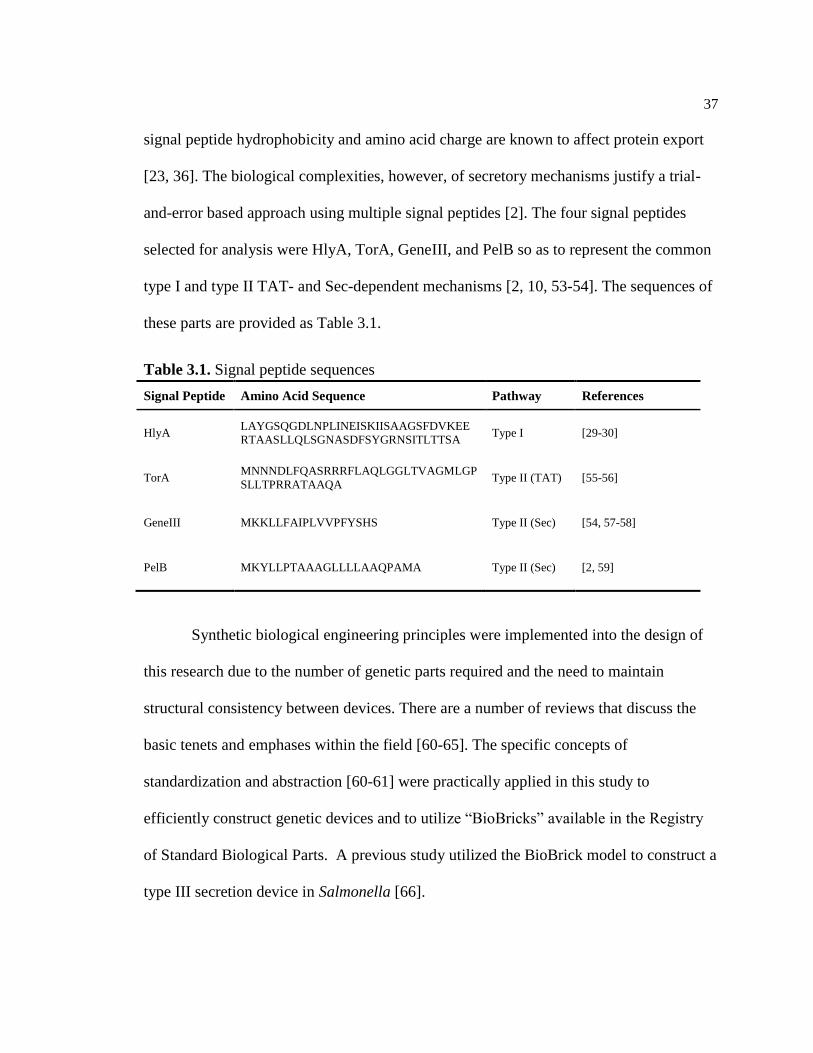
37
signal peptide hydrophobicity and amino acid charge are known to affect protein export
[23, 36]. The biological complexities, however, of secretory mechanisms justify a trial-
and-error based approach using multiple signal peptides [2]. The four signal peptides
selected for analysis were HlyA, TorA, GeneIII, and PelB so as to represent the common
type I and type II TAT- and Sec-dependent mechanisms [2, 10, 53-54]. The sequences of
these parts are provided as Table 3.1.
Synthetic biological engineering principles were implemented into the design of
this research due to the number of genetic parts required and the need to maintain
structural consistency between devices. There are a number of reviews that discuss the
basic tenets and emphases within the field [60-65]. The specific concepts of
standardization and abstraction [60-61] were practically applied in this study to
efficiently construct genetic devices and to utilize “BioBricks” available in the Registry
of Standard Biological Parts. A previous study utilized the BioBrick model to construct a
type III secretion device in Salmonella [66].
Table 3.1. Signal peptide sequences
Signal Peptide Amino Acid Sequence Pathway References
HlyA LAYGSQGDLNPLINEISKIISAAGSFDVKEE
RTAASLLQLSGNASDFSYGRNSITLTTSA Type I [29-30]
TorA MNNNDLFQASRRRFLAQLGGLTVAGMLGP
SLLTPRRATAAQA Type II (TAT) [55-56]
GeneIII MKKLLFAIPLVVPFYSHS Type II (Sec) [54, 57-58]
PelB MKYLLPTAAAGLLLLAAQPAMA Type II (Sec) [2, 59]
38
Individual GFPuv and signal peptide parts were designed in accordance with the
BioFusion standard (BBF RFC 20) because the original BioBrick standard (BBF RFC 10)
is not conducive to genetic fusion [67]. Despite certain disadvantages, like the presence
of a rare and positively-charged arginine amino acid in the formed ligation scar,
BioFusion was selected over recently developed Freiburg (BBF RFC 25) and BglBricks
(BBF RFC 21) standards because of retained compatibility with original BioBrick parts
[67-68]. This study demonstrates that the BioFusion and BioBrick standards can be
implemented to elicit GFP translocation using multiple signal peptides in E. coli.
Materials and Methods
BioBrick Construction, Primers, and Vectors
Several genetic parts and devices were constructed for analyzing GFP export.
Table 3.2 presents the oligonucleotides and primers used in this study. GeneIII and PelB
signal peptides were constructed by annealing forward and reverse oligonucleotides with
XbaI and SpeI overhanging ends for ligation into vector pSB1AK3 (GeneIIIFORoligo,
GeneIIIREVoligo, PelBFORoligo, PelBREVoligo). TorA and HlyA signal peptides were
designed using Gene Designer to include the BioFusion standard prefix and suffix [67],
synthetically produced (DNA 2.0, Menlo Park, CA), and ligated into pSB1AK3 [69]. The
GFPuv BioFusion-compatible BioBrick was isolated by PCR with primers
GFPuvFORprefix and GFPuvREVsuffix. The GFPuv PCR product was isolated by gel
electrophoresis, purified, subjected to restriction enzyme digestion with EcoRI and PstI,
and ligated into pSB1AK3. Parts obtained from the Registry of Standard Biological Parts
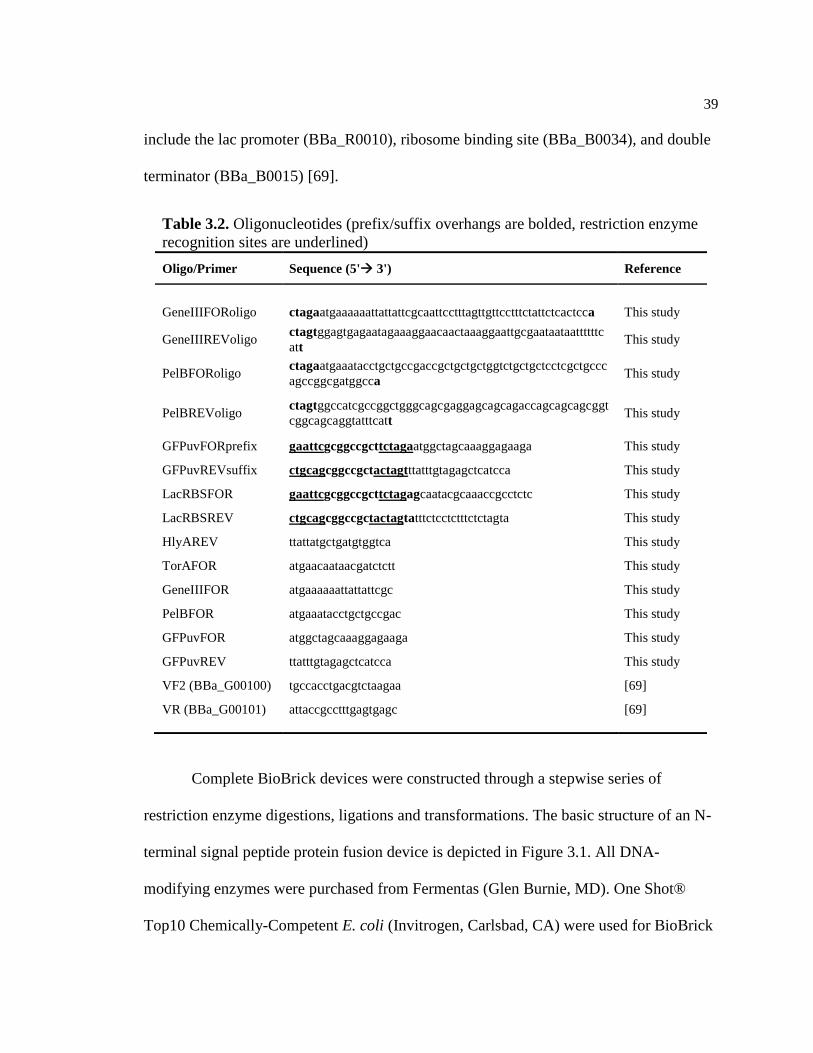
39
include the lac promoter (BBa_R0010), ribosome binding site (BBa_B0034), and double
terminator (BBa_B0015) [69].
Complete BioBrick devices were constructed through a stepwise series of
restriction enzyme digestions, ligations and transformations. The basic structure of an N-
terminal signal peptide protein fusion device is depicted in Figure 3.1. All DNA-
modifying enzymes were purchased from Fermentas (Glen Burnie, MD). One Shot®
Top10 Chemically-Competent E. coli (Invitrogen, Carlsbad, CA) were used for BioBrick
Table 3.2. Oligonucleotides (prefix/suffix overhangs are bolded, restriction enzyme
recognition sites are underlined)
Oligo/Primer Sequence (5' 3') Reference
GeneIIIFORoligo ctagaatgaaaaaattattattcgcaattcctttagttgttcctttctattctcactcca This study
GeneIIIREVoligo ctagtggagtgagaatagaaaggaacaactaaaggaattgcgaataataattttttc
att This study
PelBFORoligo ctagaatgaaatacctgctgccgaccgctgctgctggtctgctgctcctcgctgccc
agccggcgatggcca This study
PelBREVoligo ctagtggccatcgccggctgggcagcgaggagcagcagaccagcagcagcggt
cggcagcaggtatttcatt This study
GFPuvFORprefix gaattcgcggccgcttctagaatggctagcaaaggagaaga This study
GFPuvREVsuffix ctgcagcggccgctactagtttatttgtagagctcatcca This study
LacRBSFOR gaattcgcggccgcttctagagcaatacgcaaaccgcctctc This study
LacRBSREV ctgcagcggccgctactagtatttctcctctttctctagta This study
HlyAREV ttattatgctgatgtggtca This study
TorAFOR atgaacaataacgatctctt This study
GeneIIIFOR atgaaaaaattattattcgc This study
PelBFOR atgaaatacctgctgccgac This study
GFPuvFOR atggctagcaaaggagaaga This study
GFPuvREV ttatttgtagagctcatcca This study
VF2 (BBa_G00100) tgccacctgacgtctaagaa [69]
VR (BBa_G00101) attaccgcctttgagtgagc [69]

40
transformations. Proper construction was confirmed for all parts and composite devices
by sequencing analysis with primers VF2 and VR [69] using an ABI prism 3730 DNA
Analyzer and Taq FS Terminator Chemistry. Transformation colony selection was
carried out using LB agar plates containing appropriate antibiotics.
Figure 3.1 Composite structure of an N-terminal signal peptide protein fusion device.
Strains and Growth Conditions
E. coli BL21-Gold (DE3) (Stratagene, La Jolla, CA), lacking Lon and OmpT
proteases, was used for expression and secretion studies with the various signal peptide-
GFPuv devices. E. coli were precultured from glycerol freezer stocks in 5 ml LB medium
supplemented with 50 µg/ml of ampicillin and 25 µg/ml of chloramphenicol to an OD600
of about 1.5. Precultures were used to inoculate 150 ml of LB (1:100 v/v dilution)
containing appropriate antibiotics. IPTG was added after 1 hr of growth to a final
concentration of 0.1 mM [70]. Cultures were grown for a total of 3-4 hours to an OD600 of
about 1.0, divided into two 50 ml aliquots, and harvested by centrifugation at 4000 x g
for 20 minutes. Approximately 100 ml of supernatant were concentrated to 0.5 ml using
Centricon® YM-10 centrifugal filter devices (Millipore, Bellerica, MA) and analyzed for
GFP secretion to the extracellular media.
41
Cellular Fractionation
Harvested cells were washed with 10 mM Tris (pH 8.0). Spheroplast formation
was carried out by either lysozyme/EDTA/osmotic shock [71-73] or by chloroform
treatment [74]. Each method was carried out on 50 ml of cell culture. The general
principles of fractionation by lysozyme/EDTA/osmotic shock have been previously
discussed [71-73]. The cell pellet was resuspended in 0.5 ml of buffer (20% sucrose, 1
mM EDTA, 50 µg/ml lysozyme), incubated on ice for 5 minutes, and subjected to
osmotic shock by addition of 0.5 ml of cold ddH2O for 5 minutes. For the chloroform
method [74], the washed cell pellet was resuspended in 250 µl of 10 mM Tris-HCl (pH
8.0) and approximately 10 µg of cold chloroform was added gradually while swirling the
solution. After incubation at room temperature for 15 minutes, another 750 µl of 10 mM
Tris-HCl was added.
The periplasmic fractions were recovered by separation of spheroplasts by
centrifugation at 12,000 x g for 10 minutes. The cell pellets were resuspended in 500 µl
of 10 mM Tris-HCl buffer and sonicated for 15 seconds on ice, centrifuged to separate
unlysed cells, and subjected to an additional sonication. The cytoplasmic and membrane
fractions were separated by ultracentrifugation at 103,000 x g for 1.25 hours. The o-
nitrophenyl-β-galactopyranoside assay [75] was used to determine β-galactosidase
activity, and a basic ρ-nitrophenylphosphate hydrolysis procedure was used to determine
alkaline phosphatase levels [76]. For both colorimetric assays, A410 was measured. Total
protein concentrations were determined using the Modified Lowry Assay Kit (Thermo
Scientific Pierce, Rockford, IL).
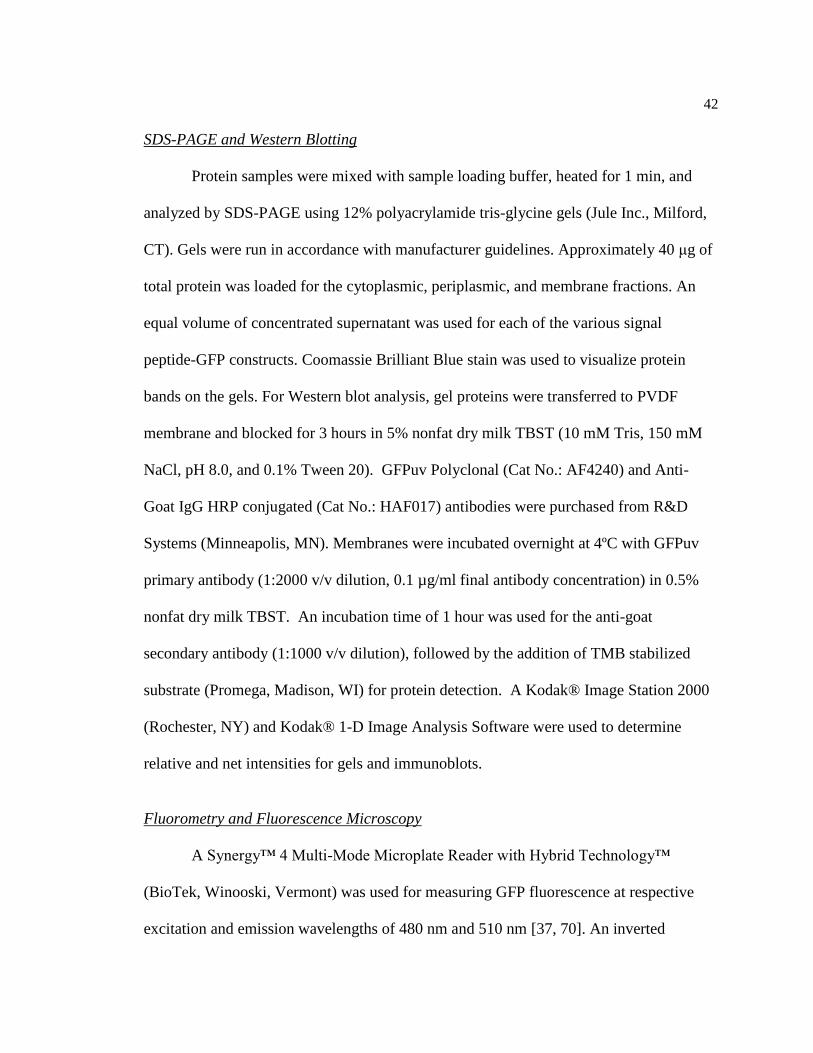
42
SDS-PAGE and Western Blotting
Protein samples were mixed with sample loading buffer, heated for 1 min, and
analyzed by SDS-PAGE using 12% polyacrylamide tris-glycine gels (Jule Inc., Milford,
CT). Gels were run in accordance with manufacturer guidelines. Approximately 40 μg of
total protein was loaded for the cytoplasmic, periplasmic, and membrane fractions. An
equal volume of concentrated supernatant was used for each of the various signal
peptide-GFP constructs. Coomassie Brilliant Blue stain was used to visualize protein
bands on the gels. For Western blot analysis, gel proteins were transferred to PVDF
membrane and blocked for 3 hours in 5% nonfat dry milk TBST (10 mM Tris, 150 mM
NaCl, pH 8.0, and 0.1% Tween 20). GFPuv Polyclonal (Cat No.: AF4240) and Anti-
Goat IgG HRP conjugated (Cat No.: HAF017) antibodies were purchased from R&D
Systems (Minneapolis, MN). Membranes were incubated overnight at 4ºC with GFPuv
primary antibody (1:2000 v/v dilution, 0.1 µg/ml final antibody concentration) in 0.5%
nonfat dry milk TBST. An incubation time of 1 hour was used for the anti-goat
secondary antibody (1:1000 v/v dilution), followed by the addition of TMB stabilized
substrate (Promega, Madison, WI) for protein detection. A Kodak® Image Station 2000
(Rochester, NY) and Kodak® 1-D Image Analysis Software were used to determine
relative and net intensities for gels and immunoblots.
Fluorometry and Fluorescence Microscopy
A Synergy™ 4 Multi-Mode Microplate Reader with Hybrid Technology™
(BioTek, Winooski, Vermont) was used for measuring GFP fluorescence at respective
excitation and emission wavelengths of 480 nm and 510 nm [37, 70]. An inverted
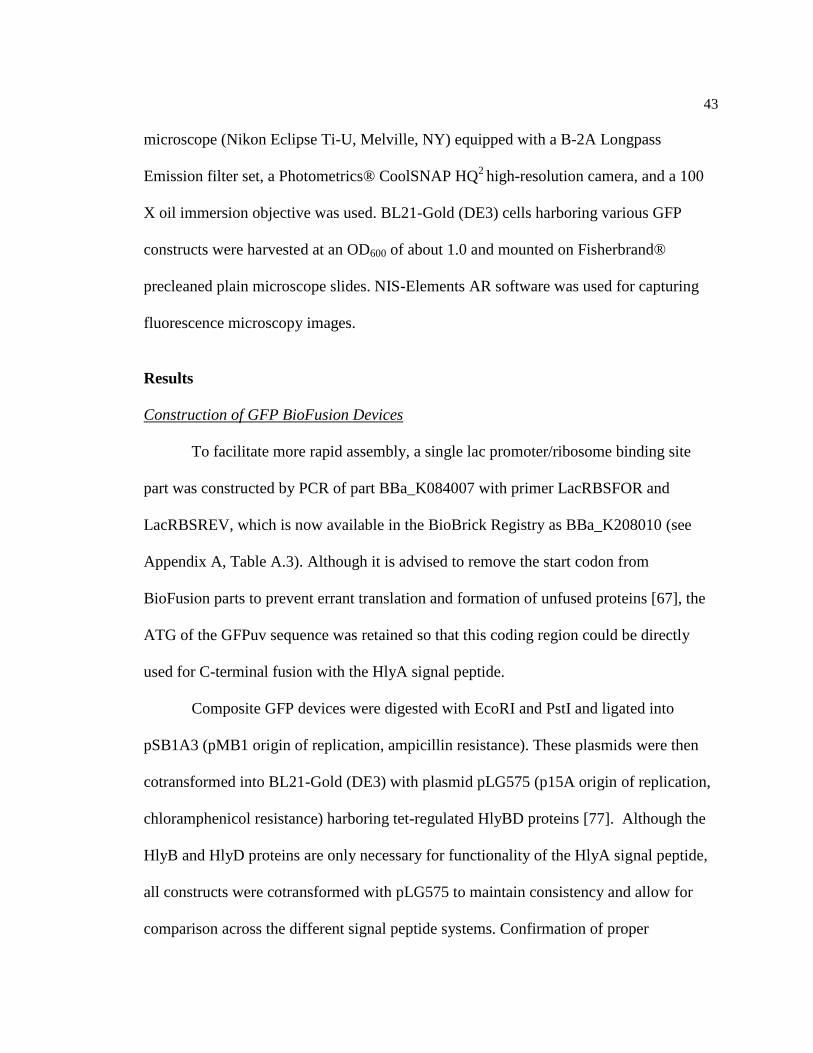
43
microscope (Nikon Eclipse Ti-U, Melville, NY) equipped with a B-2A Longpass
Emission filter set, a Photometrics® CoolSNAP HQ2
high-resolution camera, and a 100
X oil immersion objective was used. BL21-Gold (DE3) cells harboring various GFP
constructs were harvested at an OD600 of about 1.0 and mounted on Fisherbrand®
precleaned plain microscope slides. NIS-Elements AR software was used for capturing
fluorescence microscopy images.
Results
Construction of GFP BioFusion Devices
To facilitate more rapid assembly, a single lac promoter/ribosome binding site
part was constructed by PCR of part BBa_K084007 with primer LacRBSFOR and
LacRBSREV, which is now available in the BioBrick Registry as BBa_K208010 (see
Appendix A, Table A.3). Although it is advised to remove the start codon from
BioFusion parts to prevent errant translation and formation of unfused proteins [67], the
ATG of the GFPuv sequence was retained so that this coding region could be directly
used for C-terminal fusion with the HlyA signal peptide.
Composite GFP devices were digested with EcoRI and PstI and ligated into
pSB1A3 (pMB1 origin of replication, ampicillin resistance). These plasmids were then
cotransformed into BL21-Gold (DE3) with plasmid pLG575 (p15A origin of replication,
chloramphenicol resistance) harboring tet-regulated HlyBD proteins [77]. Although the
HlyB and HlyD proteins are only necessary for functionality of the HlyA signal peptide,
all constructs were cotransformed with pLG575 to maintain consistency and allow for
comparison across the different signal peptide systems. Confirmation of proper

44
transformation was carried out using antibiotic selection and PCR with various signal
peptide and GFPuv specific primers.
A list of complete BioBrick devices constructed for this study is given as Table
3.3. In addition to these functional devices, several intermediate composite parts were
also produced (see Appendix A, Table A.5). The basic functionality of several parts was
confirmed using visual and measurable detection of GFP fluorescence by an ultraviolet
transilluminator, a fluorometric analysis, and fluorescence microscopy. Two negative
controls were also constructed as shown in Table 3. The GFP (-) device contained only a
signal peptide, and a pSB1A3 construct was made by digestion with XbaI and SpeI and
ligation of compatible ends to remove the coding region.
Analysis of GFP Translocation
To ensure proper subcellular fractionation, two methods were carried out on cell
samples and evaluated because the host organism and its physiological state can affect
the efficacy of fractionation procedures [73]. In both procedures, aggregation of the cells
indicated spheroplast formation.
Table 3.3. Description of final BioBrick composite parts
Designation Description
GFPuv Lac promoter, GFPuv BioFusion BioBrick without signal peptide, pSB1A3
GFPuv:HlyA GFPuv C-terminal fusion with HlyA signal peptide, Lac promoter, pSB1A3
TorA:GFPuv GFPuv N-terminal fusion with TorA signal peptide, Lac promoter, pSB1A3
GeneIII:GFPuv GFPuv N-terminal fusion with GeneIII signal peptide, Lac promoter, pSB1A3
PelB:GFPuv GFPuv N-terminal fusion with PelB signal peptide, Lac promoter, pSB1A3
GFP (-) A GFP negative strain expressing only a signal peptide, Lac promoter, pSB1A3
pSB1A3 pSB1A3 plasmid without insert coding region
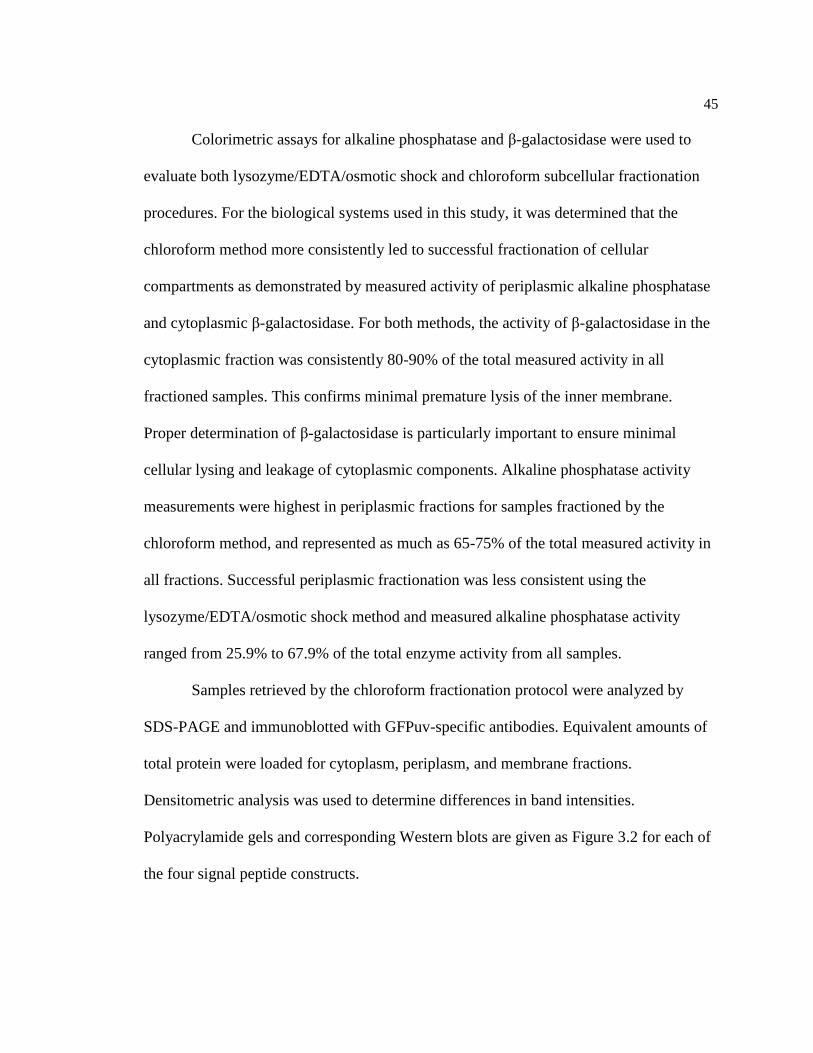
45
Colorimetric assays for alkaline phosphatase and β-galactosidase were used to
evaluate both lysozyme/EDTA/osmotic shock and chloroform subcellular fractionation
procedures. For the biological systems used in this study, it was determined that the
chloroform method more consistently led to successful fractionation of cellular
compartments as demonstrated by measured activity of periplasmic alkaline phosphatase
and cytoplasmic β-galactosidase. For both methods, the activity of β-galactosidase in the
cytoplasmic fraction was consistently 80-90% of the total measured activity in all
fractioned samples. This confirms minimal premature lysis of the inner membrane.
Proper determination of β-galactosidase is particularly important to ensure minimal
cellular lysing and leakage of cytoplasmic components. Alkaline phosphatase activity
measurements were highest in periplasmic fractions for samples fractioned by the
chloroform method, and represented as much as 65-75% of the total measured activity in
all fractions. Successful periplasmic fractionation was less consistent using the
lysozyme/EDTA/osmotic shock method and measured alkaline phosphatase activity
ranged from 25.9% to 67.9% of the total enzyme activity from all samples.
Samples retrieved by the chloroform fractionation protocol were analyzed by
SDS-PAGE and immunoblotted with GFPuv-specific antibodies. Equivalent amounts of
total protein were loaded for cytoplasm, periplasm, and membrane fractions.
Densitometric analysis was used to determine differences in band intensities.
Polyacrylamide gels and corresponding Western blots are given as Figure 3.2 for each of
the four signal peptide constructs.
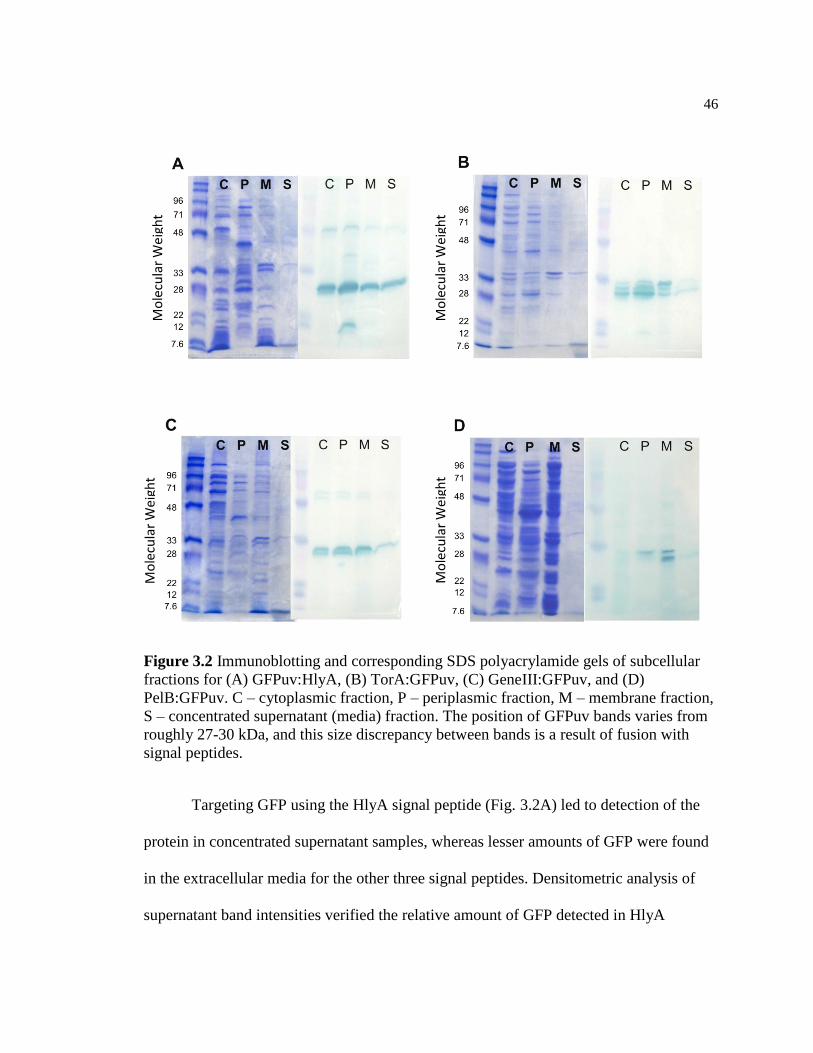
46
Figure 3.2 Immunoblotting and corresponding SDS polyacrylamide gels of subcellular
fractions for (A) GFPuv:HlyA, (B) TorA:GFPuv, (C) GeneIII:GFPuv, and (D)
PelB:GFPuv. C – cytoplasmic fraction, P – periplasmic fraction, M – membrane fraction,
S – concentrated supernatant (media) fraction. The position of GFPuv bands varies from
roughly 27-30 kDa, and this size discrepancy between bands is a result of fusion with
signal peptides.
Targeting GFP using the HlyA signal peptide (Fig. 3.2A) led to detection of the
protein in concentrated supernatant samples, whereas lesser amounts of GFP were found
in the extracellular media for the other three signal peptides. Densitometric analysis of
supernatant band intensities verified the relative amount of GFP detected in HlyA
Mo
lecu
lar
We
igh
t
Mo
lecu
lar
We
igh
t
Mo
lecu
lar
We
igh
t
Mo
lecu
lar
We
igh
t
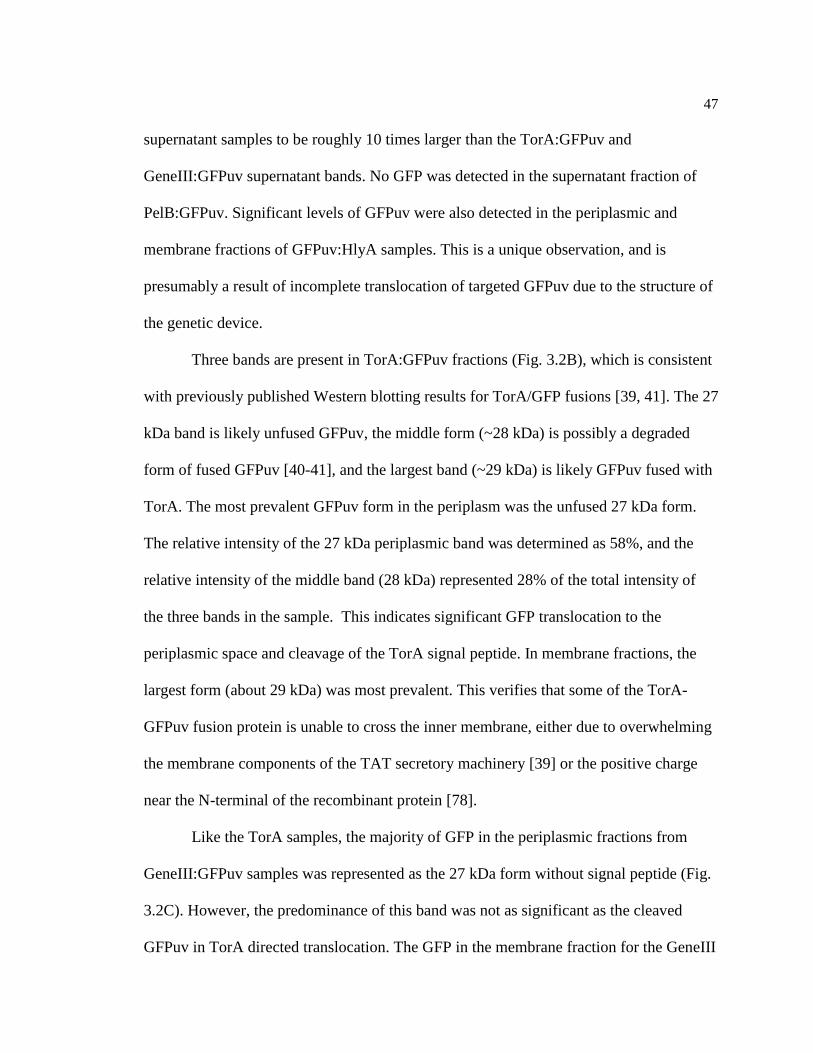
47
supernatant samples to be roughly 10 times larger than the TorA:GFPuv and
GeneIII:GFPuv supernatant bands. No GFP was detected in the supernatant fraction of
PelB:GFPuv. Significant levels of GFPuv were also detected in the periplasmic and
membrane fractions of GFPuv:HlyA samples. This is a unique observation, and is
presumably a result of incomplete translocation of targeted GFPuv due to the structure of
the genetic device.
Three bands are present in TorA:GFPuv fractions (Fig. 3.2B), which is consistent
with previously published Western blotting results for TorA/GFP fusions [39, 41]. The 27
kDa band is likely unfused GFPuv, the middle form (~28 kDa) is possibly a degraded
form of fused GFPuv [40-41], and the largest band (~29 kDa) is likely GFPuv fused with
TorA. The most prevalent GFPuv form in the periplasm was the unfused 27 kDa form.
The relative intensity of the 27 kDa periplasmic band was determined as 58%, and the
relative intensity of the middle band (28 kDa) represented 28% of the total intensity of
the three bands in the sample. This indicates significant GFP translocation to the
periplasmic space and cleavage of the TorA signal peptide. In membrane fractions, the
largest form (about 29 kDa) was most prevalent. This verifies that some of the TorA-
GFPuv fusion protein is unable to cross the inner membrane, either due to overwhelming
the membrane components of the TAT secretory machinery [39] or the positive charge
near the N-terminal of the recombinant protein [78].
Like the TorA samples, the majority of GFP in the periplasmic fractions from
GeneIII:GFPuv samples was represented as the 27 kDa form without signal peptide (Fig.
3.2C). However, the predominance of this band was not as significant as the cleaved
GFPuv in TorA directed translocation. The GFP in the membrane fraction for the GeneIII

48
construct was almost entirely fused to the GeneIII signal peptide, again indicating GFP
entrapment in the inner membrane.
The PelB signal peptide system did not effectively target GFP for translocation
across the inner membrane (Fig. 3.2D). Several repeated analyses of samples led to the
conclusion that the PelB:GFPuv BioFusion construct primarily led to GFP entrapment in
the membrane. The cytoplasmic levels of GFPuv were comparatively low, and the
predominant location of GFPuv was in membrane samples.
Fluorescence Analysis
The effect of signal peptide fusion on GFP fluorescence was examined. In
addition to observed differences in translocation response between signal peptides, the
fluorescence output varied substantially as a result of the signal peptide fusion. As shown
by cells expressing the recombinant proteins (Fig. 3.3A), the visual differences in
fluorescence activity are significant. Although both the HlyA- and TorA-GFP fusion
proteins were strongly fluorescent, their activity was lower than that of unfused GFP. The
exact cause of this observation is unknown, but it has been demonstrated that GFP fusion
with TorA can lead to elevated protein degradation [40]. Additionally, the fusion of
signal peptides could adversely affect GFP folding. Furthermore, there is some evidence
that membrane-bound GFP has diminished fluorescence activity [39], which may affect
total fluorescent output.
It is reported that fusion of GFP to type II Sec-dependent signal peptides
diminishes GFP fluorescence [79]. This same phenomenon was detected for Sec-
dependent signal peptides used in this study. The PelB-GFP fusion protein was found to

49
be completely inactive (Fig. 3.3A and 3.3B). Fluorescence measurement values were
nearly identical to those obtained for GFP (-) and pSB1A3 (no coding region) samples
(Fig. 3.3B). GFP fused with Sec-dependent GeneIII signal peptide emitted detectable
fluorescence, although the measurable activity was significantly lower than other
fluorescent proteins.
Figure 3.3 Difference in BL21-Gold (DE3) GFPuv fluorescence activity as a result of
signal peptide fusions. (A) Observational difference in fluorescence activity for cells
grown on LB-ampicillin plates. (B) Whole cell relative fluorescence.
Fluorescence microscopy analysis was performed for all GFP constructs emitting
significant fluorescence. In Fig. 3.4A, GFP is shown evenly distributed throughout cells
expressing the unfused protein. In contrast, further evidence of GFP translocation by the
TorA signal peptide was demonstrated by a “halo” appearance of accumulated active
GFP in the periplasm of the cells (Fig. 3.4B). All examined cells harboring TorA:GFPuv
clearly exhibited this effect. This demonstrates that BioBrick technical standards can be
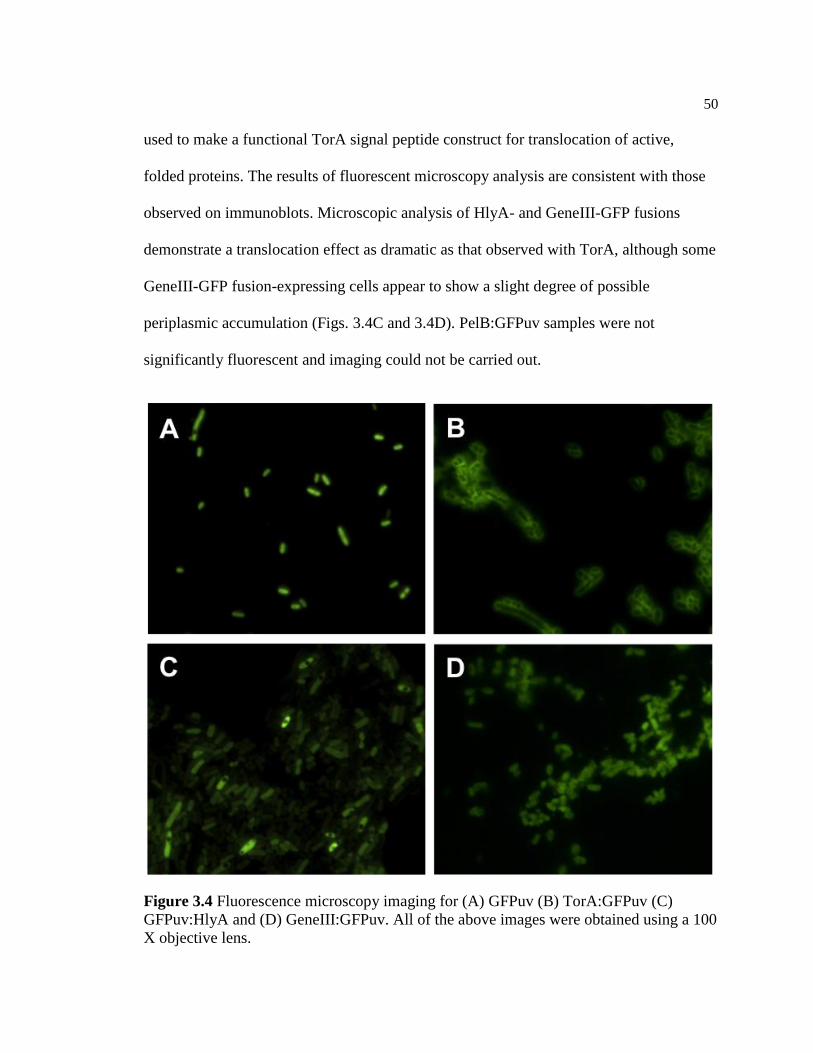
50
used to make a functional TorA signal peptide construct for translocation of active,
folded proteins. The results of fluorescent microscopy analysis are consistent with those
observed on immunoblots. Microscopic analysis of HlyA- and GeneIII-GFP fusions
demonstrate a translocation effect as dramatic as that observed with TorA, although some
GeneIII-GFP fusion-expressing cells appear to show a slight degree of possible
periplasmic accumulation (Figs. 3.4C and 3.4D). PelB:GFPuv samples were not
significantly fluorescent and imaging could not be carried out.
Figure 3.4 Fluorescence microscopy imaging for (A) GFPuv (B) TorA:GFPuv (C)
GFPuv:HlyA and (D) GeneIII:GFPuv. All of the above images were obtained using a 100
X objective lens.

51
The fluorescence intensity was measured in concentrated media samples for each
of the signal peptide/GFP devices. Fluorescence was also measured in pSB1A3 (no
coding region) supernatant samples and subtracted from each replicate to obtain final
fluorescence values. The averages and standard deviations were calculated (Fig. 3.5).
Detected fluorescence in the GFPuv:HlyA supernatant samples was significantly higher
than that measured for other signal peptide devices, thereby further demonstrating the
presence of a significant amount of HlyA-targeted GFP in the extracellular medium.
Targeting GFP with TorA, GeneIII, and PelB signal peptides did not result in measured
fluorescence significantly elevated above the pSB1A3 negative control.
Figure 3.5 Measurement of fluorescence in concentrated extracellular media.
Discussion
This study demonstrates that the BioBrick and BioFusion technical standards can
be used to construct devices for type I and type II secretory translocation of GFP in E.
coli. Transforming E. coli with pLG575 expressing HlyB and HlyD proteins and

52
targeting GFP by fusion with HlyA signal peptide led to elevated levels of GFP in the
extracellular media, as detected by immunoblotting and fluorometry. To our knowledge,
recombinant GFP secretion using the HlyA signal peptide has not been previously
reported for E. coli. TorA signal peptide effectively targeted GFP to the periplasmic
space. Strong GFP-associated bands were detected by immunoblotting with periplasmic
fractions and accumulation of active GFP in the periplasm was visibly apparent by
fluorescence microscopy. Unlike previous studies, the TorA:GFPuv device used in this
study was made entirely using BioBrick and BioFusion technical standards. Targeting
with Sec pathway signal peptides was not as clearly successful in eliciting GFP export.
GeneIII fusions indicated GFP localization to the periplasm. However, the PelB:GFPuv
construct was found to be ineffective with the majority of GFP localized to the inner
membrane. This inability of PelB to induce GFP translocation demonstrates that an
attached signal peptide does not in itself guarantee export of a protein [23] and factors
surrounding the genetic design require consideration.
One of the frequently discussed disadvantages with the BioFusion model is the
presence of the rare arginine codon AGA in the ligation scar [67-68]. The concerns
surrounding the presence of arginine are a result of its charge and prevalence in E. coli.
Due to its positive charge, arginine has potential to adversely affect protein translocation.
Specifically, a net positive charge within the first five amino acids near the C-domain
cleavage site of the signal peptide can inhibit proteins from entering the lipid bilayer and
reduce protein export efficiency by as much as 50-fold [78]. In this study, significant
GFP was observed in the membrane fractions for all signal peptides, and this issue was
particularly problematic when using the PelB signal peptide. One method to circumvent

53
this issue and potentially increase export efficiency is to use single-point mutation after
construction of the device to remove the arginine amino acid and replace it with a neutral
molecule. Removing the arginine would also counter any negative effects related to
expression errors associated with the rarity of the AGA codon in E. coli [80-81].
Another concern with the BioFusion standard is related to the suggestion to
remove the start codon for the second of the two compatible parts [67], as this would
require N-terminal fusion or ligation with a separate start codon BioBrick. The GFP
fusion-compatible BioBrick in this study retained its start codon to allow for this same
part to be used in all devices. The GFPuv:HlyA construct devised for this study has only
one start codon, located at the N-terminus of the GFP coding region. The rest of the
fusion devices, however, had an additional start codon. Unfused GFP forms were
significant in the cytoplasmic fractions, perhaps as a result of aberrant translation of the
second start codon [67] or from proteolysis [39-41]. This discussed issue, however, did
not prohibit translocation of GFP. The design used in this study resulted in functional
secretory devices.
The fluorescence intensity of GFP was measurably affected by fusion with signal
peptides, despite reports that indicate that genetic fusion does not have an effect on GFP
activity. Based on previous reports, it was expected that Sec-dependent signal peptides
would diminish GFP activity [79], which was observed. However, fluorescence was also
diminished considerably after GFP fusion with HlyA and TorA signal peptides. From
fluorometric analysis, it was demonstrated that whole cell samples producing unfused
GFP fluoresced 8 times more intensely than the GFPuv:HlyA samples. It has been
demonstrated that the TAT-dependent TorA signal peptide is useful for translocation of
54
fully-folded and active GFP, however, these studies did not necessarily compare the
whole cell fluorescence of TorA constructs with untargeted GFP following a similar
construction format. Like the signal peptide devices, the untargeted GFP construct was
carried in the pSB1A3 plasmid and cotransformed with pLG575 into BL21-Gold (DE3).
The size of the protein coding region, the BioFusion scar, and interactions with secretion
machinery may play a role in the diminished fluorescence activity. It was also noted that
the GeneIII signal peptide emitted slightly higher fluorescence activity than the other
Sec-dependent signal peptide, PelB.
Conclusions
The use of BioBrick and BioFusion technical standards allowed for efficient
design and assembly of multiple biological composite parts that followed a consistent
format. The functionality of the constructed parts was demonstrated, as evidenced by
significant levels of detectable GFP in the extracellular medium and the intracellular
periplasm. The utility of biological standards for genetic device construction is reinforced
in this study by demonstrating the advantages of using a standardized format. For
example, basic parts (lac promoter, ribosome binding site, and double terminator) created
by other research groups were obtained from a repository and used in assembled
composite parts that successfully resulted in GFP translocation to the extracellular
medium or periplasmic space. Additionally, the specific individual signal peptide-GFP
fusion BioBricks created for this investigation can now be implemented directly by other
researchers studying type I and II protein secretion. This allows for the user to design

55
genetic systems in a controlled manner and to eliminate much of the repeated work of ad
hoc design and construction of specific components.
References
1. Makrides SC: Strategies for achieving high-level expression of genes in
Escherichia coli. Microbiol Rev 1996, 60:512-538.
2. Choi JH, Lee SY: Secretory and extracellular production of recombinant
proteins using Escherichia coli. Appl Microbiol Biot 2004, 64:625-635.
3. Cornelis P: Expressing genes in different Escherichia coli compartments. Curr
Opin Biotechnol 2000, 11:450-454.
4. Schmidt FR: Recombinant expression systems in the pharmaceutical
industry. Appl Microbiol Biot 2004, 65:363-372.
5. Baneyx F: Recombinant protein expression in Escherichia coli. Curr Opin
Biotech 1999, 10:411-421.
6. Pukatzki S, Ma AT, Revel AT, Sturtevant D, Mekalanos JJ: Type VI secretion
system translocates a phage tail spike-like protein into target cells where it
cross-links actin. P Natl Acad Sci USA 2007, 104:15508-15513.
7. Henderson IR, Navarro-Garcia F, Desvaux M, Fernandez RC, Ala'Aldeen D:
Type V protein secretion pathway: the autotransporter story. Microbiol Mol
Biol Rev 2004, 68:692-744.
8. Economou A, Christie PJ, Fernandez RC, Palmer T, Plano GV, Pugsley AP:
Secretion by numbers: protein traffic in prokaryotes. Mol Microbiol 2006,
62:308-319.
9. Desvaux M, Hebraud M, Talon R, Henderson IR: Secretion and subcellular
localizations of bacterial proteins: a semantic awareness issue. Trends
Microbiol 2009, 17:139-145.
10. Mergulhao FJ, Summers DK, Monteiro GA: Recombinant protein secretion in
Escherichia coli. Biotechnol Adv 2005, 23:177-202.
11. Delepelaire P: Type I secretion in gram-negative bacteria. Biochim Biophys
Acta 2004, 1694:149-161.
12. Sandkvist M: Biology of type II secretion. Mol Microbiol 2001, 40:271-283.
56
13. Binet R, Letoffe S, Ghigo JM, Delepelaire P, Wandersman C: Protein secretion
by Gram-negative bacterial ABC exporters - A review. Gene 1997, 192:7-11.
14. Jenewein S, Holland IB, Schmitt L: Type I bacterial secretion systems. In
Bacterial secreted proteins: secretory mechanisms and role in pathogenesis.
Edited by Wooldridge K. Norfolk, UK: Caister Academic Press; 2009:45-65.
15. Gentschev I, Dietrich G, Spreng S, Neuhaus B, Maier E, Benz R, Goebel W,
Fensterle J, Rapp UR: Use of the α-hemolysin secretion system of Escherichia
coli for antigen delivery in the Salmonella typhi Ty21a vaccine strain. Int J
Med Microbiol 2004, 294:363-371.
16. Wandersman C, Delepelaire P: TolC, an Escherichia coli outer membrane
protein required for hemolysin secretion. Proc Natl Acad Sci U S A 1990,
87:4776-4780.
17. Blight MA, Holland IB: Heterologous protein secretion and the versatile
Escherichia coli haemolysin translocator. Trends Biotechnol 1994, 12:450-455.
18. Veenendaal AKJ, van der Does C, Driessen AM: The protein-conducting
channel SecYEG. Biochim Biophys Acta 2004, 1694:81-95.
19. Shokri A, Sanden AM, Larsson G: Cell and process design for targeting of
recombinant protein into the culture medium of Escherichia coli. Appl
Microbiol Biot 2003, 60:654-664.
20. Cianciotto NP: Type II secretion: a protein secretion system for all seasons.
Trends Microbiol 2005, 13:581-588.
21. Koster M, Bitter W, Tommassen J: Protein secretion mechanisms in Gram-
negative bacteria. Int J Med Microbiol 2000, 290:325-331.
22. Ito K, Mori H: The Sec protein secretion system. In Bacterial secreted protein:
secretory mechanisms and role in pathogenesis. Edited by Wooldridge K.
Norfolk, UK: Caister Academic Press; 2009:3-22.
23. Luirink J, Oudega B: Protein targeting to the inner membrane. In Protein
Secretion Pathways in Bacteria. Edited by Oudega B. Norwell, MA: Kluwer
Academic Publishers; 2004:1-22.
24. Mori H, Ito K: The Sec protein-translocation pathway. Trends Microbiol 2001,
9:494-500.
57
25. Panahandeh S, Holzapfel E, Muller M: The Twin-arginine translocation
pathway. In Bacterial secreted proteins: secretory mechanisms and role in
pathogenesis. Edited by Wooldridge K. Norfolk, UK: Caister Academic Press;
2009:23-43.
26. Wickner W: Assembly of proteins into membranes. Science 1980, 210:861-868.
27. Gentschev I, Mollenkopf H, Sokolovic Z, Hess J, Kaufmann SH, Goebel W:
Development of antigen-delivery systems, based on the Escherichia coli
hemolysin secretion pathway. Gene 1996, 179:133-140.
28. Gentschev I, Hess J, Goebel W: Change in the cellular localization of alkaline
phosphatase by alteration of its carboxy-terminal sequence. Mol Gen Genet
1990, 222:211-216.
29. Hess J, Gentschev I, Goebel W, Jarchau T: Analysis of the hemolysin secretion
system by PhoA-HlyA fusion proteins. Mol Gen Genet 1990, 224:201-208.
30. Kenny B, Taylor S, Holland IB: Identification of individual amino acids
required for secretion within the hemolysin (HlyA) C-terminal targeting
region. Mol Microbiol 1992, 6:1477-1489.
31. Felmlee T, Pellett S, Lee EY, Welch RA: Escherichia coli hemolysin is released
extracellularly without cleavage of a signal peptide. J Bacteriol 1985, 163:88-
93.
32. Pugsley AP: The complete general secretory pathway in Gram-negative
bacteria. Microbiol Rev 1993, 57:50-108.
33. Molhoj M, Degan FD: Leader sequences are not signal peptides. Nat
Biotechnol 2004, 22:1502.
34. Berks BC, Sargent F, Palmer T: The Tat protein export pathway. Mol
Microbiol 2000, 35:260-274.
35. Fekkes P, Driessen AJM: Protein targeting to the bacterial cytoplasmic
membrane. Microbiol Mol Biol R 1999, 63:161-173.
36. Cristobal S, de Gier JW, Nielsen H, von Heijne G: Competition between Sec-
and TAT-dependent protein translocation in Escherichia coli. Embo J 1999,
18:2982-2990.
37. Chalfie M, Tu Y, Euskirchen G, Ward WW, Prasher DC: Green fluorescent
protein as a marker for gene expression. Science 1994, 263:802-805.
58
38. Prasher DC: Using GFP to see the light. Trends Genet 1995, 11:320-323.
39. Barrett CML, Ray N, Thomas JD, Robinson C, Bolhuis A: Quantitative export
of a reporter protein, GFP, by the twin-arginine translocation pathway in
Escherichia coli. Biochem Bioph Res Co 2003, 304:279-284.
40. Santini CL, Bernadac A, Zhang M, Chanal A, Ize B, Blanco C, Wu LF:
Translocation of jellyfish green fluorescent protein via the Tat system of
Escherichia coli and change of its periplasmic localization in response to
osmotic up-shock. J Biol Chem 2001, 276:8159-8164.
41. Thomas JD, Daniel RA, Errington J, Robinson C: Export of active green
fluorescent protein to the periplasm by the twin-arginine translocase (Tat)
pathway in Escherichia coli. Mol Microbiol 2001, 39:47-53.
42. Li SY, Chang BY, Lin SC: Coexpression of TorD enhances the transport of
GFP via the TAT pathway. J Biotechnol 2006, 122:412-421.
43. Pradel N, Decorps A, Ye CY, Santini CL, Wu LF: YidC-dependent
translocation of green fluorescence protein fused to the FliP cleavable signal
peptide. Biochimie 2005, 87:191-196.
44. Meissner D, Vollstedt A, van Dijl JM, Freudl R: Comparative analysis of twin-
arginine (Tat)-dependent protein secretion of a heterologous model protein
(GFP) in three different Gram-positive bacteria. Appl Microbiol Biot 2007,
76:633-642.
45. Zhou LY, Liu Q, Wang QY, Ma Y, Xu YZ, Yang Z, Zhao Y, Zhang YX:
Secretory delivery of heterologous proteins in attenuated Vibrio anguillarum
for potential use in vaccine design. Appl Microbiol Biot 2008, 79:1027-1034.
46. Tanudji M, Hevi S, Chuck SL: Improperly folded green fluorescent protein is
secreted via a non-classical pathway. J Cell Sci 2002, 115:3849-3857.
47. Chungjatupornchai W, Fa-aroonsawat S: Translocation of green fluorescent
protein to cyanobacterial periplasm using ice nucleation protein. J Microbiol
2009, 47:187-192.
48. Crameri A, Whitehorn EA, Tate E, Stemmer WPC: Improved green fluorescent
protein by molecular evolution using DNA shuffling. Nat Biotechnol 1996,
14:315-319.
49. Vessoni Penna TC, Ishii M, Cholewa O, de Souza LC: Thermal characteristics
of recombinant green fluorescent protein (GFPuv) extracted from
Escherichia coli. Lett Appl Microbiol 2004, 38:135-139.
59
50. LaVallie ER, McCoy JM: Gene fusion expression systems Escherichia coli.
Curr Opin Biotech 1995, 6:501-506.
51. Bendtsen JD, Nielsen H, von Heijne G, Brunak S: Improved prediction of signal
peptides: SignalP 3.0. J Mol Biol 2004, 340:783-795.
52. Kall L, Krogh A, Sonnhammer ELL: Advantages of combined transmembrane
topology and signal peptide prediction - the Phobius web server. Nucleic
Acids Res 2007, 35:W429-W432.
53. Rapoza MP, Webster RE: The filamentous bacteriophage assembly proteins
require the bacterial SecA protein for correct localization to the membrane. J
Bacteriol 1993, 175:1856-1859.
54. Lee CC, Wong DWS, Robertson GH: An E. coli expression system for the
extracellular secretion of barley α-amylase. J Protein Chem 2001, 20:233-237.
55. Jack RL, Buchanan G, Dubini A, Hatzixanthis K, Palmer T, Sargent F:
Coordinating assembly and export of complex bacterial proteins. Embo J
2004, 23:3962-3972.
56. Buchanan G, Maillard J, Nabuurs SB, Richardson DJ, Palmer T, Sargent F:
Features of a twin-arginine signal peptide required for recognition by a Tat
proofreading chaperone. FEBS Lett 2008, 582:3979-3984.
57. Watson ME: Compilation of published signal sequences. Nucleic Acids Res
1984, 12:5145-5164.
58. Voss SD, DeGrand AM, Romeo GR, Cantley LC, Frangioni JV: An integrated
vector system for cellular studies of phage display-derived peptides. Anal
Biochem 2002, 308:364-372.
59. Lucic MR, Forbes BE, Grosvenor SE, Carr JM, Wallace JC, Forsberg G:
Secretion in Escherichia coli and phage-display of recombinant insulin-like
growth factor binding protein-2. J Biotechnol 1998, 61:95-108.
60. Endy D: Foundations for engineering biology. Nature 2005, 438:449-453.
61. Drubin DA, Way JC, Silver PA: Designing biological systems. Genes Dev 2007,
21:242-254.
62. Knight TF: Engineering novel life. Mol Syst Biol 2005, 1:2005 0020.
63. Benner SA, Sismour AM: Synthetic biology. Nat Rev Genet 2005, 6:533-543.

60
64. Arkin AP: Synthetic cell biology. Curr Opin Biotechnol 2001, 12:638-644.
65. Serrano L: Synthetic biology: promises and challenges. Mol Syst Biol 2007,
3:158.
66. Widmaier DM, Tullman-Ercek D, Mirsky EA, Hill R, Govindarajan S, Minshull
J, Voigt CA: Engineering the Salmonella type III secretion system to export
spider silk monomers. Mol Syst Biol 2009, 5:309.
67. Phillips IE, Silver PA: A New BioBrick Assembly Strategy Designed for Facile
Protein Engineering. [DSpace 2006 http://hdl.handle.net/1721.1/32535]
68. Anderson JC, Dueber JE, Leguia M, Wu GC, Goler JA, Arkin AP, Keasling JD:
BglBricks: A flexible standard for biological part assembly. J Biol Eng 2010,
4:1.
69. Registry of Standard Biological Parts [http://partsregistry.org/]
70. Kang Z, Wang Q, Zhang HJ, Qi QS: Construction of a stress-induced system in
Escherichia coli for efficient polyhydroxyalkanoates production. Appl
Microbiol Biot 2008, 79:203-208.
71. French C, Keshavarz-Moore E, Ward JM: Development of a simple method for
the recovery of recombinant proteins from the Escherichia coli periplasm. Enzyme Microb Tech 1996, 19:332-338.
72. Santini CL, Ize B, Chanal A, Muller M, Giordano G, Wu LF: A novel Sec-
independent periplasmic protein translocation pathway in Escherichia coli. Embo J 1998, 17:101-112.
73. Kaback HR: Bacterial membranes. Methods Enzymol 1971, 22:99-120.
74. Ames GF, Prody C, Kustu S: Simple, rapid, and quantitative release of
periplasmic proteins by chloroform. J Bacteriol 1984, 160:1181-1183.
75. Miller JH: Assay of β-galactosidase. New York: Cold Spring Harbor Laboratory;
1972.
76. Bessey OA, Lowry OH, Brock M: A method for the rapid determination of
alkaline phosphatase with five cubic millimeters of serum. J Biol Chem 1946,
164:321-329.

61
77. Mackman N, Nicaud JM, Gray L, Holland IB: Genetic and functional-
organization of the Escherichia coli hemolysin determinant 2001. Mol Gen
Genet 1985, 201:282-288.
78. Schatz PJ, Beckwith J: Genetic analysis of protein export in Escherichia coli.
Annu Rev Genet 1990, 24:215-248.
79. Feilmeier BJ, Iseminger G, Schroeder D, Webber H, Phillips GJ: Green
fluorescent protein functions as a reporter for protein localization in
Escherichia coli. J Bacteriol 2000, 182:4068-4076.
80. Calderone TL, Stevens RD, Oas TG: High-level misincorporation of lysine for
arginine at AGA codons in a fusion protein expressed in Escherichia coli. J
Mol Biol 1996, 262:407-412.
81. McNulty DE, Claffee BA, Huddleston MJ, Porter ML, Cavnar KM, Kane JF:
Mistranslational errors associated with the rare arginine codon CGG in
Escherichia coli. Protein Expr Purif 2003, 27:365-374.
62
CHAPTER 4
COMPARISON OF SINGLE-STEP EXTRACTION FOR 1H NMR ANALYSIS
WITH GC AND FLUORESCENCE TECHNIQUES FOR
POLYHYDROXYALKANOATE QUANTIFICATION2
Abstract
In this study, an 1H NMR-based method was developed to quantitatively analyze
the PHA content in Cupriavidus necator H16, Azotobacter vinelandii AvOP, and mixed
microbial cultures from the effluent of an agricultural waste treatment anaerobic digester.
In contrast to previous methods, we performed a single-step PHA extraction using
deuterated chloroform, which leaves the PHA in a solvent suitable for direct 1H NMR
analysis. We verified the accuracy of our method by comparison with the well-
established GC methanolysis technique. Nile blue fluorescence staining was also carried
out to serve as an independent and qualitative indicator of intracellular PHA content. Our
results show that 1H NMR correlates closely with traditional methods for detecting
PHAs. The 1H NMR method is appropriate for rapid and non-destructive quantification
of overall PHA content as well as for determination of PHA copolymer composition.
Notably, this technique was effective in measuring PHA content in full-strength waste
samples where high concentrations of background impurities and organic compounds are
present. The straightforward procedures used for extraction of intracellular PHA
minimized error-introducing steps, required less time and materials, and resulted in a
simple and overall accurate method suitable for routine analyses.
2
Coauthored by Elisabeth Linton, Sridhar Viamajala, and Ronald C. Sims.

63
1. Introduction
Polyhydroxyalkanoates (PHAs) are a diverse class of polyesters that represent a
source of non-petrochemically-derived biodegradable plastics (Anderson and Dawes,
1990; Brandl et al., 1990; Byrom, 1987; Doi, 1990; Lee, 1996). A variety of
microorganisms accumulate PHAs when excess carbon substrate is available and cellular
growth is limited due to an environmental stress or nutrient limitation (Doi, 1990; Lee,
1996; Madison and Huisman, 1999; Verlinden et al., 2007). Polyhydroxybutyrate (PHB)
represents a prevalent and commonly studied type of PHA that has material properties
comparable with polypropylene (Byrom, 1987; Holmes, 1985; Steinbüchel and
Füchtenbusch, 1998). Variations in PHA composition are a function of the organism,
metabolic pathway, and available precursor substrates (Anderson and Dawes, 1990;
Madison and Huisman, 1999; Reddy et al., 2003; Steinbüchel and Füchtenbusch, 1998).
For example, the availability of volatile fatty acids like valerate and propionate lead to
the formation of PHB and polyhydroxyvalerate (PHV) copolymers, P(HB-co-HV) (Doi,
1990; Du et al., 2001; Oehmen et al., 2005a; Satoh et al., 1994; Serafim et al., 2008;
Shang et al., 2004). An increased proportion of HV units in the copolymeric structure
corresponds with enhanced polymer elasticity and impact strength, as well as decreased
processing temperatures (Luzier, 1992; Madison and Huisman, 1999). Therefore, the
material properties of PHAs can potentially be tailored for specified applications by
adjusting the copolymeric composition (Braunegg et al., 1998; Luzier, 1992).
The efforts to improve PHA production and characterization methods are largely
due to the potential of these bioplastics to serve as a renewable and sustainable substitute
for fossil-derived polymers (Byrom, 1987; Holmes, 1985; Steinbüchel and Füchtenbusch,
64
1998). Additionally, high PHA compatibility with human systems has led to use in
medical applications, such as orthopedic materials and sutures (Chen and Wu, 2005;
Holmes, 1985; Steinbüchel and Füchtenbusch, 1998; Volova et al., 2003; Williams and
Martin, 2002). High costs, however, have limited widespread application of the bioplastic
(Byrom, 1987; Castilho et al., 2009; Choi and Lee, 1997; Lee, 1996; van Wegen et al.,
1998). Reported economic analyses based on various current industrial practices have
placed the cost of PHAs between $2.65-5/kg (Akiyama et al., 2003; Castilho et al., 2009;
Choi and Lee, 1999; Choi and Lee, 1997). In contrast, the average cost of
petrochemically-derived plastic is around $1.57-1.67/kg for high-density polyethylene
and $2.11-2.16/kg for polypropylene (Plastics News, 2009).
Although petrochemical plastics are currently less expensive than PHAs, a
number of studies suggest that alternative production methods utilizing low value waste
feedstocks and mixed microbial cultures may decrease PHA production costs and energy
requirements (Bengtsson et al., 2008; Khardenavis et al., 2007; Park et al., 2002; Serafim
et al., 2008). More specifically, one intriguing approach integrates PHA production with
waste treatment systems. In this process, polyphosphate accumulating organisms (PAOs)
are enriched to simultaneously achieve biological phosphorus removal and bioplastic
production (Comeau et al., 1986; Mino et al., 1998; Seviour et al., 2003). In these
complex environmental systems, as well as in traditional fermentative processes that
employ pure cultures, efficient quantification and chemical characterization of PHA is
critical for process development, monitoring, and optimization.
A number of methods have been developed for the estimation of PHA content,
including fluorometry, gravimetry, and spectrophotometry (Furrer et al., 2007; Serafim et
65
al., 2002). Of these, Nile blue A sulfate staining is perhaps the most rapid method, which
is based on fluorescent detection of dye bound to intracellular PHA (Kitamura and Doi,
1994; Ostle and Holt, 1982; Page and Tenove, 1996; Spiekermann et al., 1999).
However, Nile blue non-selectively binds to non-PHA materials like waxes and lipids
and can result in inaccurate and inconsistent measurements (Spiekermann et al., 1999).
Gravimetric and spectrophotometric methods are time intensive and require substantial
amounts of PHA-containing sample and/or several replicate measurements to ensure an
acceptable level of accuracy (Serafim et al., 2002). Like the fluorescence staining
method, gravimetric and spectrophotometric methods are also susceptible to interference
by cell materials and lipids (Braunegg et al., 1978; Serafim et al., 2002). Furthermore,
none of the discussed methods provide information on PHA composition, and are
therefore insufficient for microbial systems that are likely to produce mixtures of PHA
polymers.
Gas chromatography methods determine the actual chemical components of PHA,
thereby providing a measurement of both PHA content and composition (Braunegg et al.,
1978; Comeau et al., 1988). Accordingly, GC is one of the most commonly used methods
for PHA analysis (Oehmen et al., 2005b). Preparation of samples for GC analysis
requires extraction, depolymerization, and derivatization of the PHA to produce alkyl
esters (Braunegg et al., 1978). Commonly, a single-step reactive extraction with a
mixture of acidified alcohol and solvent is carried out on PHA-containing samples to
generate transesterified monomers of 3-hydroxyalkanoates (Braunegg et al., 1978;
Oehmen et al., 2005b). Methanolysis and propanolysis derivatization methods are used
for quantifying PHAs by GC (Baetens et al., 2002) but incomplete depolymerization or
66
transesterification during the reactive extraction step can lead to inaccuracies in
measurements (Doi, 1990; Serafim et al., 2002). The loss of sample integrity during the
derivatization steps also renders PHA unsuitable for other characterization, such as by
spectroscopy or calorimetry. Furthermore, peak overlap can cause uncertainty in
quantification (Serafim et al., 2002), particularly in samples containing mixed alkanoate
polymers or when evaluating environmental samples with high organic loads (e.g.
samples from activated sludge). Finally, the presence of cellular debris and acid can lead
to mechanical issues and deterioration of the GC column (Serafim et al., 2002).
Nuclear magnetic resonance (NMR e.g. 1H NMR and
13C NMR) spectroscopy is a
diagnostic tool that is routinely used for PHA structural analysis and metabolic pathway
studies (de Rijk et al., 1998; Doi et al., 1989; Lemos et al., 2003) but has received less
attention for routine quantification of PHA polymers, particularly in environmental
samples. Like GC, the peak area of an NMR signal is linearly proportional to the
concentration of the analyte. The unique splitting patterns of signals in the NMR
spectrum enable structural determination of the compound that could otherwise require
mass spectrometric analysis if GC-based methods had been used (de Rijk et al., 1998).
Further, unlike GC methods that require polymer breakdown and transformation, NMR
can be performed on whole PHA extracts, thereby leaving the polymer intact for other
analyses (Doi, 1990). Short analysis time (5-7 minutes) is another advantage of 1H NMR.
Previous studies using NMR for PHA characterization have generally employed
extensive and time-consuming purification methods that do not necessarily improve the
ease or accuracy of quantification (Dai et al., 2008; Furrer et al., 2007; Ivanova et al.,
2009; Jan et al., 1996; Shang et al., 2004). For example, Jan et al. (1996) performed
67
preliminary extraction of PHB from cells using sodium-hypochlorite/chloroform
dispersion, followed by polymer purification procedures. Eventually, pure PHA extract
was dissolved in deuterated chloroform (CDCl3)for 1H NMR analysis (Jan et al., 1996).
This multi-step sample preparation by extraction, purification, and dissolution of the
polymer increases potential inaccuracies due to material loss, and significantly extends
preparation time and solvent requirements. As another example, Ivanova et al. (2009)
used a 20 h PHA extraction procedure with chloroform, followed by redissolution of the
polymer in CDCl3. Similar time-consuming methods were also employed by Dai et al.
(2008) and Shang et al. (2004). Due to a lack of direct and efficient sample preparation
techniques, routine use of 1H NMR for PHA quantification has been limited (Furrer et al.,
2007).
Quantitative 1H NMR-based measurement has primarily been applied to pure
PHB (Jan et al., 1996), although Dai et al. (2008) recently used 1H NMR to measure PHA
copolymers in environmental samples. In that study, however, the PHAs were measured
in samples taken from a sequencing batch reactor that had been seeded with domestic
wastewater sludge (Dai et al., 2008) instead of measuring the PHA content in full-
strength waste samples, which have higher organic load and levels of impurities. In
contrast, the objectives of our study were to evaluate the accuracy of the 1H NMR-based
method in comparison to traditional GC and fluorescence staining methods in a variety of
PHA-containing samples, and to evaluate whether the complex composition of full-
strength agricultural waste samples interferes with 1H NMR measurements. An improved
extraction procedure that leaves the PHA in a solvent suitable for direct 1H NMR analysis
68
would allow for efficient and reliable measurement of PHA content, and was the overall
aim of this investigation.
2. Materials and Methods
2.1. Chemicals
Standard PHB (Product No. 363502) and P(HB-co-HV) (12% HV) (Product No.
403121) were obtained from Sigma-Aldrich Co. (St. Louis, MO). Sulfuric acid (95-98%
c. p.) and deuterated chloroform (99.8% atom-D) with 0.03% (v/v) tetramethylsilane
(TMS) were purchased from Acros Organics (Thermo Fisher Scientific, Morris Plains,
NJ). All other chemicals, solvents, and reagents were purchased from Fisher Scientific
Research (Pittsburgh, PA) and were of analytical grade.
2.2. Experimental Design
To validate the 1H NMR-based method for PHA quantification,
1H NMR
calibration curves were first constructed using gravimetrically measured PHB and P(HB-
co-HV) standards (0-12 mg/mL) to correlate NMR peak areas with PHA concentration.
PHA content was determined for two pure bacterial cultures and enriched anaerobic
digester samples using 1H NMR and developed calibration curves. To establish
applicability of our method over a broad concentration range, samples were periodically
withdrawn and analyzed during growth. To validate the 1H NMR results, PHA content of
the same samples used for 1H NMR analysis were also evaluated using GC/FID
methanolysis procedures and Nile blue fluorescence staining. Standard curves were
established for the GC procedure using gravimetrically measured PHB and P(HB-co-HV)
standards (similar to preparation for NMR calibration) followed by methanolysis. Nile
69
blue fluorescence staining was used as a qualitative method for measuring PHA content
in order to correlate general trends observed with the two quantitative methods. All
experiments and analyses were replicated. Growth experiments were carried out in
duplicate. Standard curves were constructed using triplicate, independently prepared
standards. A minimum of three replications were used for fluorescence staining
measurements.
2.3. Microorganisms and Culture
Methods for Pure Strains
Two PHA-producing microbial strains were used: Cupriavidus necator H16
(ATCC 17699)(previously Ralstonia eutropha H16) and Azotobacter vinelandii AvOP
(ATCC BAA-1303), which is a nitrogen-fixing bacterium. A phosphate-limited base
medium developed by Ryu et al. (1997) with 10 g/L fructose was used for C. necator
cultivation. This organism accumulates PHA solely in the form of PHB under nutrient-
limitation and in the presence of fructose as the sole carbon source (Kelley and Srienc,
1999). Burk’s nitrogen-free medium containing 20 g/L sucrose was used for A. vinelandii
growth (Wilson and Knight, 1952).
Cells from frozen glycerol stocks (20% v/v) were precultured in 50 mL of
corresponding media, and late log-phase cultures were used to inoculate (1:70 dilution) 3
L Kontes® Cytostir® (Kimble Chase Life Science and Research Products, Vineland, NJ)
stirred bioreactors containing sterile media. Oxygen was supplied by sparging filtered
(0.22 µm) air into the media. Each strain was grown in duplicate vessels. Approximately
50 mL of sample were withdrawn periodically during growth to measure culture density
and PHA content using the methods described in more detail below.

70
2.4. Environmental Samples
Effluent samples from a pilot-scale anaerobic digester (Wade Dairy, Ogden, UT)
were used as an environmental source of PHAs. Details of reactor operating conditions
and parameters are reported elsewhere (Hansen and Hansen, 2002). Digester samples
were subjected to periodic cycling between aerobic and anaerobic conditions with the
intent of creating an enriched population of phosphorus accumulating organisms (PAOs)
(Blackall et al., 2002). PAOs are associated with excessive phosphorus uptake and PHA
accumulation (Blackall et al., 2002). Consequently, these organisms are employed in
Enhanced Biological Phosphorus Removal (EBPR) municipal wastewater treatment
processes (Blackall et al., 2002; Brdjanovic et al., 1998; Mino et al., 1998; Satoh et al.,
1994). PAO enrichment experiments were carried out in 3 L stirred tank reactors, similar
to those used for growing pure strains as described in the previous section. A variety of
volatile fatty acids were present in the waste samples, including acetate (4474.56 mg/L),
propionate (3196.63 mg/L), iso-butyrate (547.09 mg/L), butyrate (270.35 mg/L), iso-
valerate (879.13 mg/L), and valerate (258.19 mg/L). The PHA concentration and
composition in anaerobic phase cultures (where PHA content is presumably highest)
were determined using 1H NMR and GC after 3 weeks of cycling when enriched, stable
populations of PHA-accumulating organisms were expected.
2.5. Sample Preparation
Pure culture samples were centrifuged at 2000 g and lyophilized in a Labconco
Lyph-Lock 4.5 freeze-drying unit (Model 77510, Labconco Corporation, Kansas City,
MO) at -40˚C and 33 10-3
mBar for a minimum of 15 h. Dry cell weight (DCW) was

71
determined by using the lyophilized biomass - the DCW data was used to construct
growth curves. Sample preparation for both NMR and GC/FID (extraction and/or
derivatization) was carried out in 2 mL crimp-top autosampler vials (Fisher Scientific,
Hanover Park, IL) using 15 (±0.2) mg dry cells. The vials were sealed with PTFE lined
septa (Fisher Scientific, Hanover Park, IL).
1H NMR sample preparation procedures were developed using similar principles
of a chloroform-sodium hypochlorite dispersion method for PHA extraction (Hahn et al.
1994), with general modifications and CDCl3 substituted for CHCl3. Approximately 0.7
mL of a 5% (vol/vol) sodium hypochlorite solution and 1 mL of CDCl3 (0.03% TMS)
were added to each sample of dried cells. The addition of chloroform substantially
reduces polymer degradation because the chloroform dissolves the PHAs and minimizes
its interaction with sodium hypochlorite (Hahn et al., 1994; Jacquel et al., 2008). These
slurries were vortexed for 10 minutes, followed by incubation on a shaker table for 2 h at
30˚C. PHA standards were incubated at a higher temperature (50˚C) to facilitate
dissolution. After the 2 h extraction period, all samples were centrifuged at 1500 g for
10 min to induce phase separation. The bacterial and environmental samples yielded
three distinct immiscible phases: (1) a bottom organic layer of CDCl3 and extracted PHA,
(2) a middle layer of cellular debris, and (3) an upper aqueous layer of sodium
hypochlorite. The samples solely containing polymer standards and no cellular material
produced only aqueous and organic phases. The PHA-containing organic phase was
removed and transferred to a 5 mm disposable NMR tube. The use of CDCl3 for
extraction allows for direct 1H NMR analysis of the organic layer.
72
GC sample preparation was carried out in accordance with reported acid
methanolysis procedures (Braunegg et al., 1978; Oehmen et al., 2005b). Equal volumes
(0.7 mL) of acidified methanol (0.03% H2SO4) and chloroform were added to each
sample to result in a total volume of 1.4 mL. These mixtures were vortexed and incubated
at 100˚C for 2 h on a shaker table. After the samples had cooled, 0.4 mL of distilled water
was added, followed by vortexing for 10 minutes. Following a phase separation time of
20 minutes, the organic phase was transferred to a new vial for GC analysis. The total
sample preparation time required for 1H NMR and GC analysis were respectively around
2.15 and 2.5 h, and the 1H NMR method required less labor and materials.
Environmental samples were prepared by repeated centrifugation and washing of
1.5 mL aliquots. The centrifuged pellet was subsequently extracted/digested in
accordance with 1H NMR and GC sample preparation procedures described above.
2.6. Analytical Methods
1H NMR: A Jeol ECX-300 spectrometer (Jeol USA, Inc., Peabody, MA) with an
Oxford 54-mm-bore magnet was used to obtain 300.53 MHz 1H NMR spectra in Fourier
transform mode. The operating parameters consisted of a 13.43 μs pulse width at 90°,
5636 Hz spectral width, 32 k data points, and 32 scans with a 1 s relaxation delay.
Tetramethylsilane (TMS) at a concentration of 0.03% was used as an internal standard.
Jeol Delta NMR Processing Software was used to analyze spectra.
Gas Chromatography: An HP 6890 Series II gas chromatography system
(Hewlett Packard, Wilmington, DE) equipped with a flame ionization detector (FID) and
an autosampler was used in conjunction with an HP-INNOWax cross-linked polyethylene
73
glycol capillary column with dimensions of 30 m 0.25 mm ID 0.25 μm film
thickness (Agilent Technologies, Wilmington, DE). A split injection ratio of 1:20 was
used and argon at a flow rate of 3.8 mL/min was used as the carrier gas. Chromatography
was performed using a temperature profile that consisted of an initial temperature of 60
°C held constant for 4 min followed by a 15 °C/min increase to a final temperature of 250
°C, which was again held constant for 5 minutes. The flame ionization detector and
injection port temperatures were maintained at 250˚C. HP-Chemstation software was
used for peak integration and analysis. The lower initial temperature enabled clear
separation between chloroform and PHA peaks. The retention times for HB and HV
methyl esters were 9.55 and 10.31 minutes, respectively. A new calibration curve with
PHA standards was constructed with every set of GC runs to account for variability and
to ensure accuracy. Including an instrument cooling period, a total analysis time of 24
minutes was required per sample.
Fluorometry: A Nile blue A sulfate fluorescent dye solution was prepared at a
concentration of 0.5 g/L ethanol (Kitamura and Doi, 1994). Approximately 150 μL of the
dye solution was added to 50 μl of sample contained in wells of Microfluor 96-well black
flat-bottom microtiter plates (Product No. 7805, Thermo Scientific, Hanover Park, IL).
Black microtiter plates were used to reduce interference from background signals during
fluorescence analyses. Fluorescence measurements were obtained using a Synergy™ 4
Multi-Mode Microplate Reader with Hybrid Technology™ (BioTek, Winooski,
VT).Respective excitation and emission wavelengths of 490 and 580 nm were used
(Kitamura and Doi, 1994). The total amount of cells in each sample was correlated to the
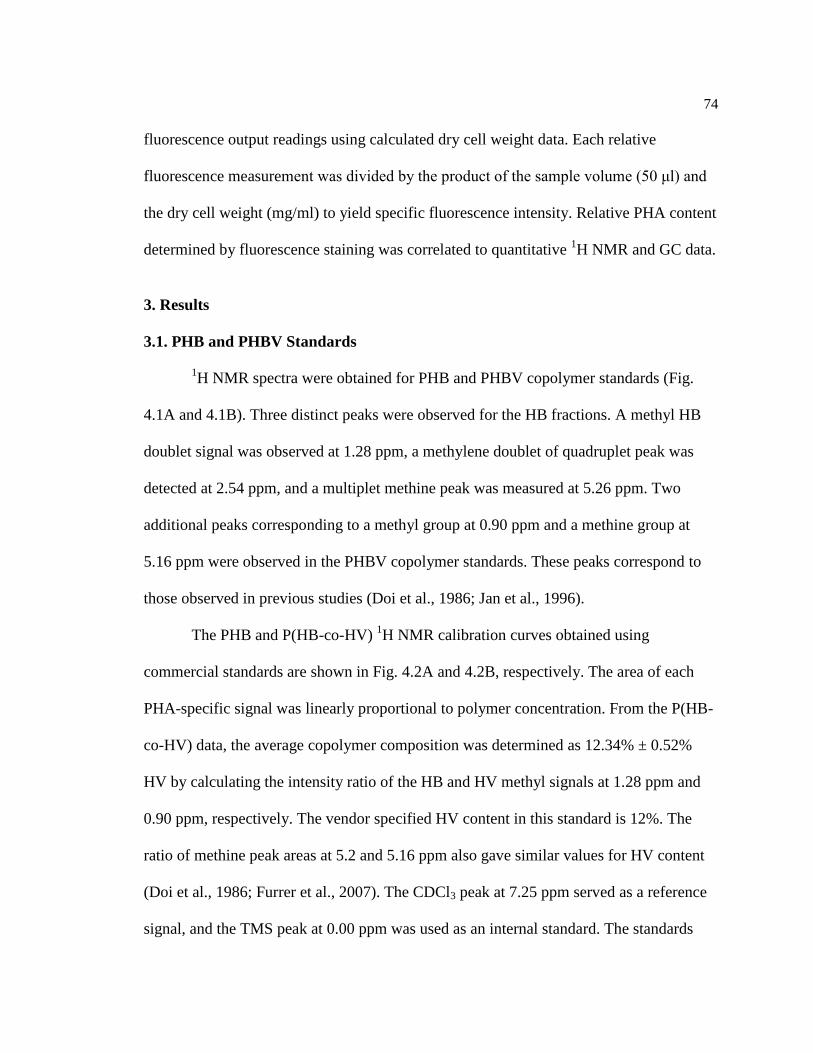
74
fluorescence output readings using calculated dry cell weight data. Each relative
fluorescence measurement was divided by the product of the sample volume (50 μl) and
the dry cell weight (mg/ml) to yield specific fluorescence intensity. Relative PHA content
determined by fluorescence staining was correlated to quantitative 1H NMR and GC data.
3. Results
3.1. PHB and PHBV Standards
1H NMR spectra were obtained for PHB and PHBV copolymer standards (Fig.
4.1A and 4.1B). Three distinct peaks were observed for the HB fractions. A methyl HB
doublet signal was observed at 1.28 ppm, a methylene doublet of quadruplet peak was
detected at 2.54 ppm, and a multiplet methine peak was measured at 5.26 ppm. Two
additional peaks corresponding to a methyl group at 0.90 ppm and a methine group at
5.16 ppm were observed in the PHBV copolymer standards. These peaks correspond to
those observed in previous studies (Doi et al., 1986; Jan et al., 1996).
The PHB and P(HB-co-HV) 1H NMR calibration curves obtained using
commercial standards are shown in Fig. 4.2A and 4.2B, respectively. The area of each
PHA-specific signal was linearly proportional to polymer concentration. From the P(HB-
co-HV) data, the average copolymer composition was determined as 12.34% ± 0.52%
HV by calculating the intensity ratio of the HB and HV methyl signals at 1.28 ppm and
0.90 ppm, respectively. The vendor specified HV content in this standard is 12%. The
ratio of methine peak areas at 5.2 and 5.16 ppm also gave similar values for HV content
(Doi et al., 1986; Furrer et al., 2007). The CDCl3 peak at 7.25 ppm served as a reference
signal, and the TMS peak at 0.00 ppm was used as an internal standard. The standards
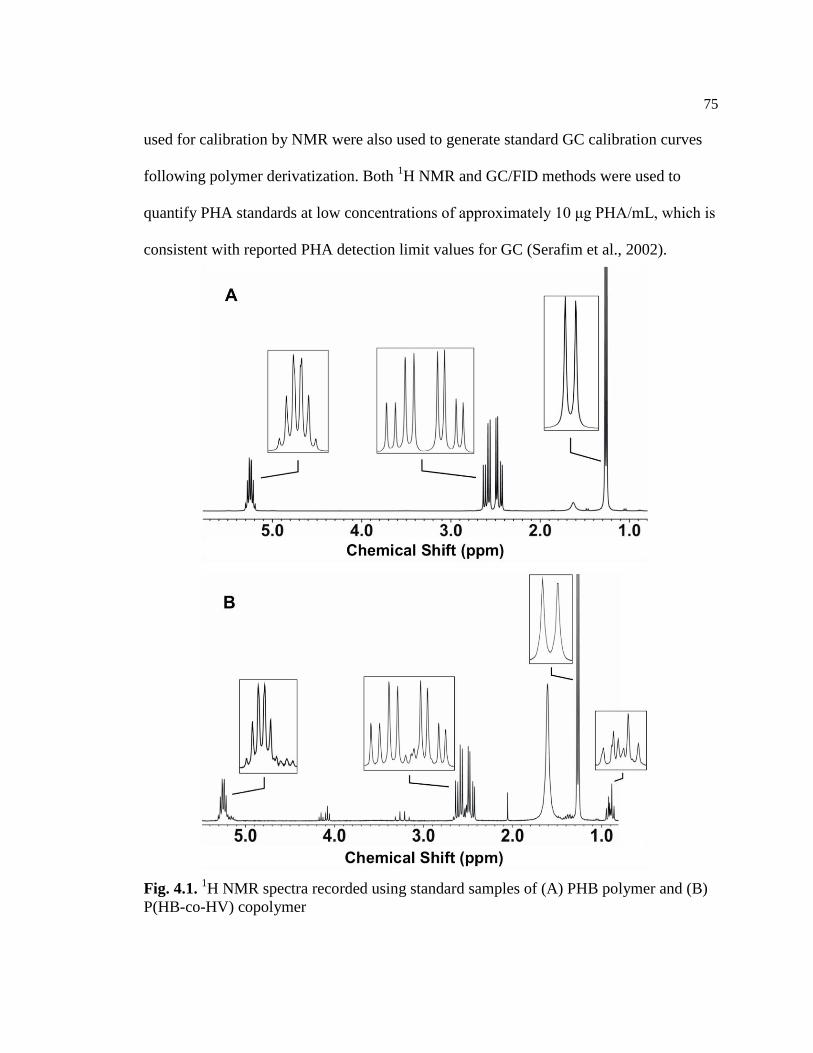
75
used for calibration by NMR were also used to generate standard GC calibration curves
following polymer derivatization. Both 1H NMR and GC/FID methods were used to
quantify PHA standards at low concentrations of approximately 10 μg PHA/mL, which is
consistent with reported PHA detection limit values for GC (Serafim et al., 2002).
Fig. 4.1. 1H NMR spectra recorded using standard samples of (A) PHB polymer and (B)
P(HB-co-HV) copolymer

76
Fig. 4.2. Standard 1H NMR
calibration curves established using standard samples of (A)
PHB and (B) P(HB-co-HV). The standard deviation for each measurement was
determined, but error bars are not visible because the standard deviation is smaller than
the point markers on the graph. All linear regression calibration lines had R2 >0.995
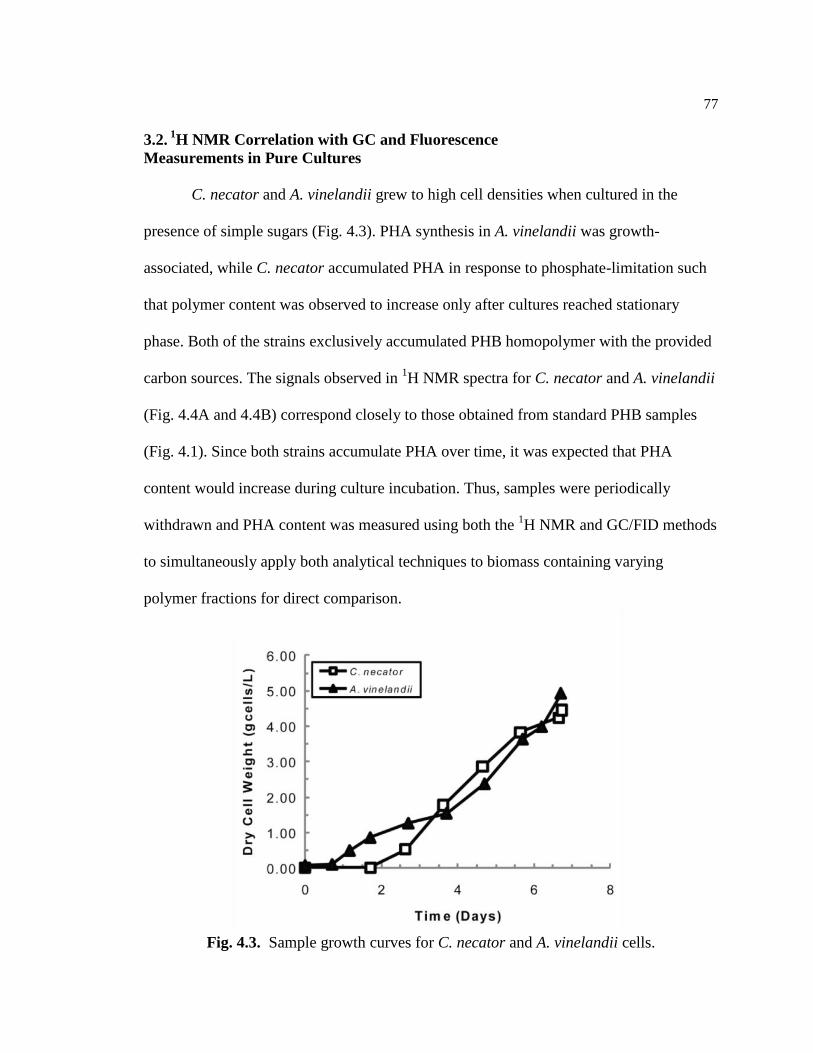
77
3.2. 1
H NMR Correlation with GC and Fluorescence
Measurements in Pure Cultures
C. necator and A. vinelandii grew to high cell densities when cultured in the
presence of simple sugars (Fig. 4.3). PHA synthesis in A. vinelandii was growth-
associated, while C. necator accumulated PHA in response to phosphate-limitation such
that polymer content was observed to increase only after cultures reached stationary
phase. Both of the strains exclusively accumulated PHB homopolymer with the provided
carbon sources. The signals observed in 1H NMR spectra for C. necator and A. vinelandii
(Fig. 4.4A and 4.4B) correspond closely to those obtained from standard PHB samples
(Fig. 4.1). Since both strains accumulate PHA over time, it was expected that PHA
content would increase during culture incubation. Thus, samples were periodically
withdrawn and PHA content was measured using both the 1H NMR and GC/FID methods
to simultaneously apply both analytical techniques to biomass containing varying
polymer fractions for direct comparison.
Fig. 4.3. Sample growth curves for C. necator and A. vinelandii cells.
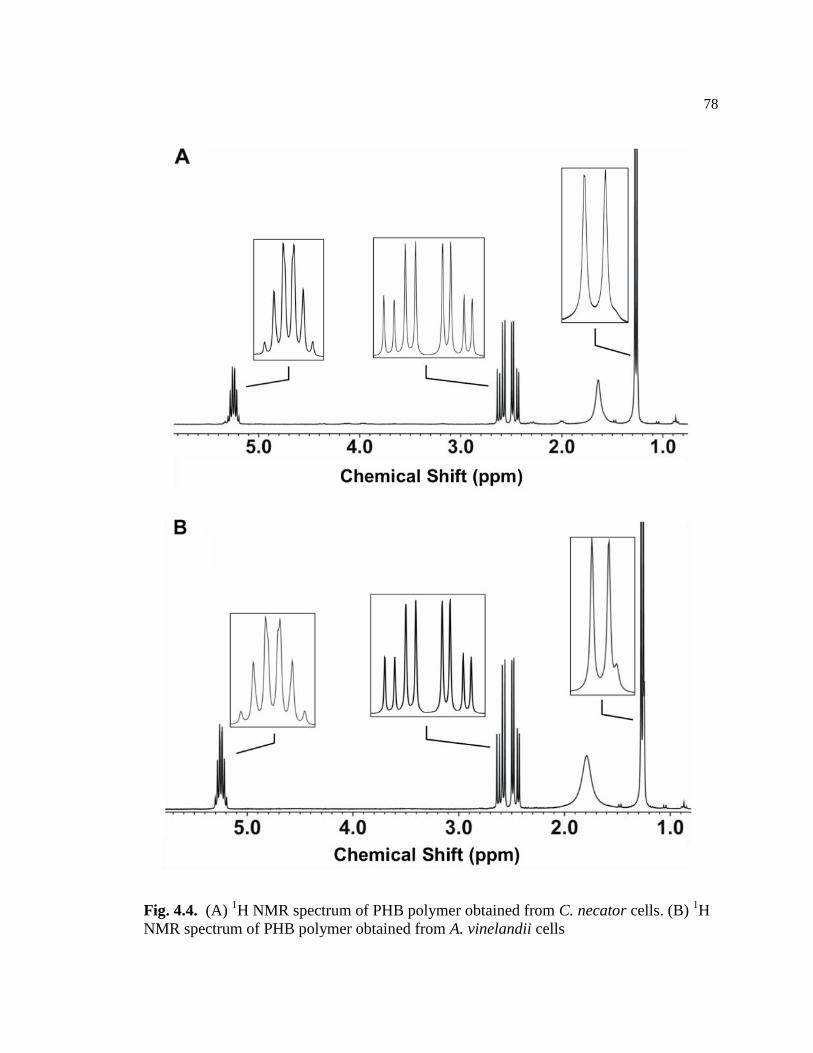
78
Fig. 4.4. (A) 1H NMR spectrum of PHB polymer obtained from C. necator cells. (B)
1H
NMR spectrum of PHB polymer obtained from A. vinelandii cells

79
A strong correlation was observed between the 1H NMR and GC/FID data. Fig.
4.5 shows PHA content data, as measured by both 1H NMR and GC/FID methods, from
all replicate experiments performed with both strains. The slope of the linear regression
line fitted through this data is 0.992 (forced through the origin) with an R2 value of 0.991.
Thus, a near 1:1 correspondence of measured PHA content by both methods with only
slight data scatter is observed demonstrating that the 1H NMR method has accuracy very
similar to the traditional GC-based technique. Individually, for C. necator the regression
line slope was 1.01 (R2 value of 0.998) indicating that the
1H NMR predicted slightly
higher values of PHB content. Overall, the maximum observed PHB content (as
measured by 1H NMR) was 68.6% (w/w) and 73.3% (w/w) in C. necator and A.
vinelandii, respectively, which is consistent with reported values (Brandl et al., 1990;
Holmes, 1985).
Fig. 4.5. Correlation of 1H NMR and GC quantification data of PHB content for C.
necator and A. vinelandii for all replications. A trendline was used to determine the
regression coefficient as 0.992 (R2 = 0.991)
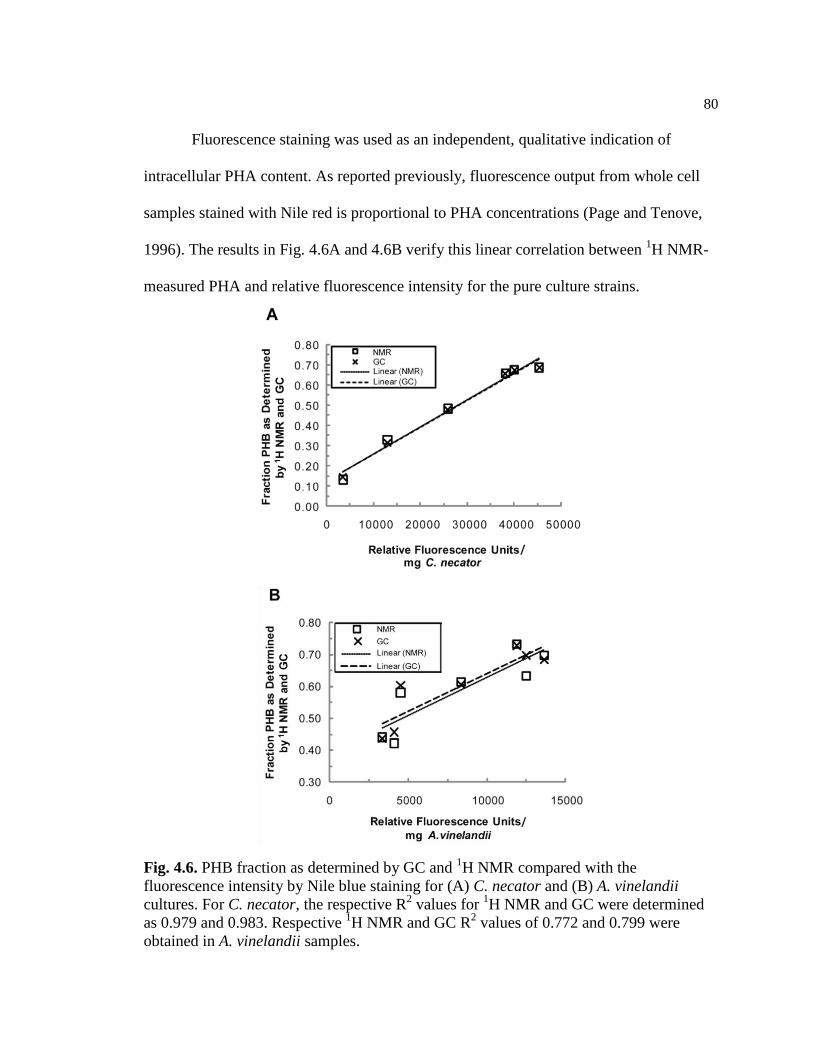
80
Fluorescence staining was used as an independent, qualitative indication of
intracellular PHA content. As reported previously, fluorescence output from whole cell
samples stained with Nile red is proportional to PHA concentrations (Page and Tenove,
1996). The results in Fig. 4.6A and 4.6B verify this linear correlation between 1H NMR-
measured PHA and relative fluorescence intensity for the pure culture strains.
Fig. 4.6. PHB fraction as determined by GC and 1H NMR compared with the
fluorescence intensity by Nile blue staining for (A) C. necator and (B) A. vinelandii
cultures. For C. necator, the respective R2 values for
1H NMR and GC were determined
as 0.979 and 0.983. Respective 1H NMR and GC R
2 values of 0.772 and 0.799 were
obtained in A. vinelandii samples.
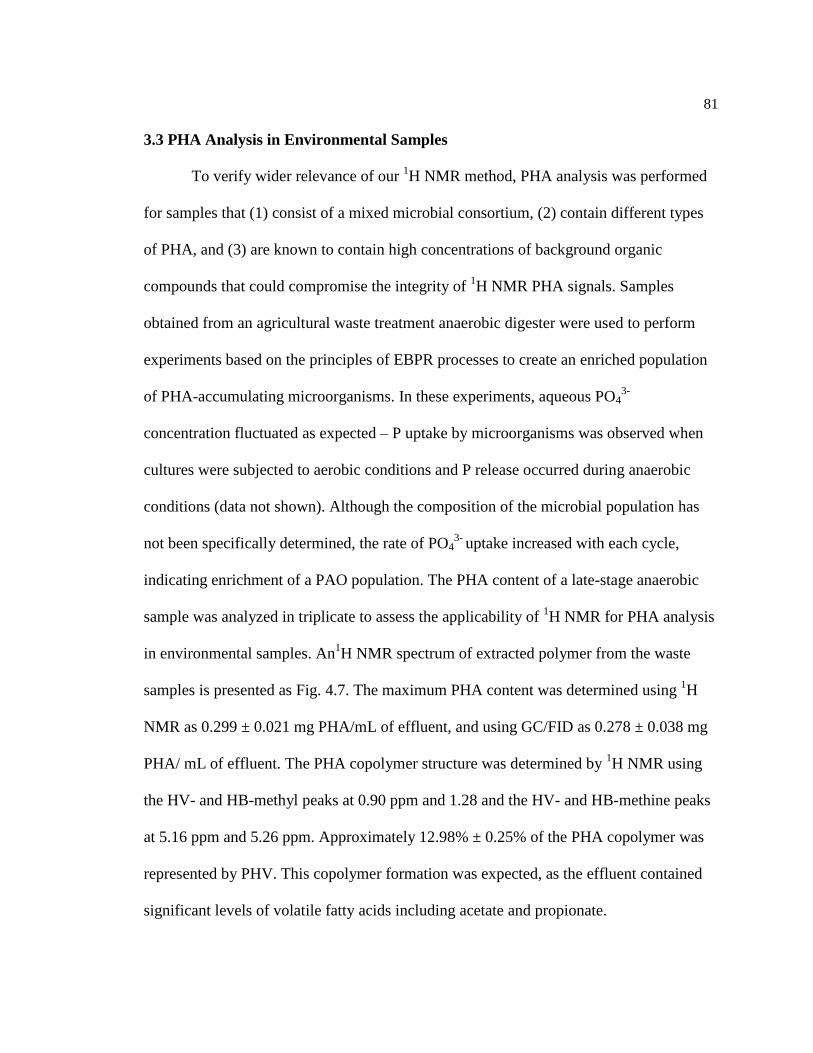
81
3.3 PHA Analysis in Environmental Samples
To verify wider relevance of our 1H NMR method, PHA analysis was performed
for samples that (1) consist of a mixed microbial consortium, (2) contain different types
of PHA, and (3) are known to contain high concentrations of background organic
compounds that could compromise the integrity of 1H NMR PHA signals. Samples
obtained from an agricultural waste treatment anaerobic digester were used to perform
experiments based on the principles of EBPR processes to create an enriched population
of PHA-accumulating microorganisms. In these experiments, aqueous PO43-
concentration fluctuated as expected – P uptake by microorganisms was observed when
cultures were subjected to aerobic conditions and P release occurred during anaerobic
conditions (data not shown). Although the composition of the microbial population has
not been specifically determined, the rate of PO43-
uptake increased with each cycle,
indicating enrichment of a PAO population. The PHA content of a late-stage anaerobic
sample was analyzed in triplicate to assess the applicability of 1H NMR for PHA analysis
in environmental samples. An1H NMR spectrum of extracted polymer from the waste
samples is presented as Fig. 4.7. The maximum PHA content was determined using 1H
NMR as 0.299 ± 0.021 mg PHA/mL of effluent, and using GC/FID as 0.278 ± 0.038 mg
PHA/ mL of effluent. The PHA copolymer structure was determined by 1H NMR using
the HV- and HB-methyl peaks at 0.90 ppm and 1.28 and the HV- and HB-methine peaks
at 5.16 ppm and 5.26 ppm. Approximately 12.98% ± 0.25% of the PHA copolymer was
represented by PHV. This copolymer formation was expected, as the effluent contained
significant levels of volatile fatty acids including acetate and propionate.
82
Fig. 4.7. 1H NMR spectrum for anaerobic digester sample. Peak overlap is observed at
the 1.28 ppm doublet peak. This does not affect PHA quantification because the peaks at
2.4 ppm and 5.26 ppm can each be integrated to determine PHA content
4. Discussion
In C. necator samples, 1H NMR consistently predicted slightly higher PHB
content, as evidenced by a 1H NMR-GC/FID regression coefficient of 1.01. This is a
likely result of the absence of a polymer derivatization step. Incomplete methanolysis of
PHB in the GC/FID procedures could result in consistent underestimation (Jan et al.,
1995; Serafim et al., 2002). In the A. vinelandii samples, PHA content was slightly under-
predicted by 1H NMR such that the slope of the
1H NMR-GC/FID regression line was
0.98 (Fig. 4.5). This discrepancy in 1H NMR-GC/FID correlation between different
strains is presumably due to the composition of accumulated PHB. A. vinelandii can
produce very high molecular weight PHB, ranging from 1 to 4 million Dalton (Chen and
83
Page, 1994). In the methanolysis procedures, the molecular weight is a less relevant
concern as the acid and heat treatment degrade the large polymer into smaller subunits.
However, the high molecular weight polymer is not degraded in the 1H NMR method,
which can result in incomplete extraction due to an increase in viscosity of the extracting
solvent (CDCl3 in our case) and less efficient penetration into the biomass. Although the
molecular weight was not determined in this study, the CDCl3 layer became highly
viscous with larger concentrations of extracted PHA from A. vinelandii. When necessary,
this issue was corrected for by using a lower amount of lyophilized cell mass.
The Nile blue A sulfate staining method was demonstrated as insufficient for
accurate quantitative PHA determination. Although useful as an independent qualitative
measurement of PHA content, significant variability between analyses and differences in
fluorescence intensities between cell types were observed with these procedures (Fig.
4.6). In any case, fluorescence staining does not provide information on polymer
composition.
It is generally assumed that quantitative PHA analysis by 1H NMR requires
purified PHA (Furrer et al., 2007). Such purification methods, as used by Jan et al. (1996)
and Ivanova et al. (2009), were previously discussed and generally require several steps
for extraction of PHA, evaporation of solvent, resuspension in CDCl3, and analysis by 1H
NMR. These multiple steps make the overall process more time-consuming than
GC/FID-based methods and compromise the accuracy of the method due to multiple
sample handling steps (Furrer et al., 2007). The sample preparation method used in our
study is simplified through the direct use of CDCl3 for both extraction and as the solvent
for 1H NMR analysis. The time required for sample preparation was shortened and is less
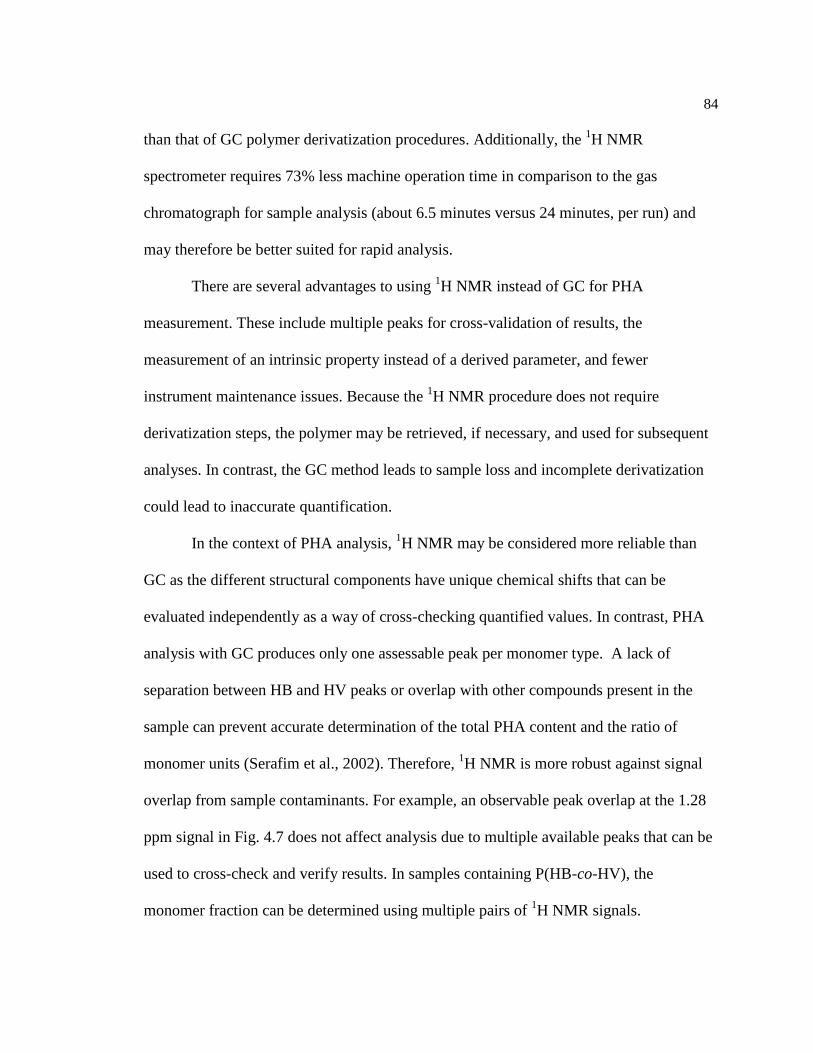
84
than that of GC polymer derivatization procedures. Additionally, the 1H NMR
spectrometer requires 73% less machine operation time in comparison to the gas
chromatograph for sample analysis (about 6.5 minutes versus 24 minutes, per run) and
may therefore be better suited for rapid analysis.
There are several advantages to using 1H NMR instead of GC for PHA
measurement. These include multiple peaks for cross-validation of results, the
measurement of an intrinsic property instead of a derived parameter, and fewer
instrument maintenance issues. Because the 1H NMR procedure does not require
derivatization steps, the polymer may be retrieved, if necessary, and used for subsequent
analyses. In contrast, the GC method leads to sample loss and incomplete derivatization
could lead to inaccurate quantification.
In the context of PHA analysis, 1H NMR may be considered more reliable than
GC as the different structural components have unique chemical shifts that can be
evaluated independently as a way of cross-checking quantified values. In contrast, PHA
analysis with GC produces only one assessable peak per monomer type. A lack of
separation between HB and HV peaks or overlap with other compounds present in the
sample can prevent accurate determination of the total PHA content and the ratio of
monomer units (Serafim et al., 2002). Therefore, 1H NMR is more robust against signal
overlap from sample contaminants. For example, an observable peak overlap at the 1.28
ppm signal in Fig. 4.7 does not affect analysis due to multiple available peaks that can be
used to cross-check and verify results. In samples containing P(HB-co-HV), the
monomer fraction can be determined using multiple pairs of 1H NMR signals.

85
In regard to instrument maintenance issues, the GC method can lead to extensive
column degradation over time if samples contain even trace amounts of water (Serafim et
al., 2002). Consequently, additional drying steps are necessary in GC sample preparation
to avoid variability between successive readings, particularly when analyzing a large
number of samples. Also, frequent measurement of standards must be carried out for
quality control. In contrast, moisture removal is not as crucial in the 1H NMR method as
the H2O peak does not overlap with the component signals or cause maintenance issues.
A proposed limiting factor to the use of NMR is that these machines are more
expensive than GC instruments. However, NMR has applications in several areas of
research that use 1H,
13C,
31P, or
15N nuclei for analysis. For example,
13C NMR can be
used to analyze metabolic pathways and 31
P NMR is useful for polyphosphate
accumulation studies (Doi et al., 1989; Serafim et al., 2002). Accordingly, NMR facilities
are fairly common at academic institutions and may be aptly utilized for PHA analysis at
locations where such systems are available.
5. Conclusions
This study has outlined a consistent, simple, and efficient procedure for direct
PHA quantification by 1H NMR using minimal extraction steps through direct use of
CDCl3 in conjunction with sodium hypochlorite for extraction and analysis. Additionally,
this study has verified that the accuracy of the 1H NMR method is equivalent to the GC-
based techniques. The results of this investigation demonstrate that 1H NMR analysis
with a single-step extraction preparation method can be applied to routinely and
accurately assess both PHA content and composition. The 1H NMR and GC
86
measurements were highly similar for every PHA type and source investigated in this
study. Specifically, the 1H NMR-based method was used for the determination of PHA
content in full-strength agricultural waste samples, demonstrating that it is robust and
unaffected by high levels of background impurities. Fewer extraction steps that
minimized losses resulted in a reliable quantification method that required less time and
materials.
References
Akiyama, M., Tsuge, T., Doi, Y., 2003. Environmental life cycle comparison of
polyhydroxyalkanoates produced from renewable carbon resources by bacterial
fermentation. Polym. Degrad. Stabil. 80, 183-194.
Anderson, A.J., Dawes, E.A., 1990. Occurrence, metabolism, metabolic role, and
industrial uses of bacterial polyhydroxyalkanoates. Microbiol. Rev. 54, 450-472.
Baetens, D., Aurola, A.M., Foglia, A., Dionisi, D., van Loosdrecht, M.C.M., 2002. Gas
chromatographic analysis of polyhydroxybutyrate in activated sludge: a round-
robin test. Water Sci. Technol. 46, 357-361.
Bengtsson, S., Werker, A., Christensson, M., Welander, T., 2008. Production of
polyhydroxyalkanoates by activated sludge treating a paper mill wastewater.
Bioresource Technol. 99, 509-516.
Blackall, L.L., Crocetti, G., Saunders, A.M., Bond, P.L., 2002. A review and update of
the microbiology of enhanced biological phosphorus removal in wastewater
treatment plants. Anton Leeuw. Int. J. G. 81, 681-691.
Brandl, H., Gross, R.A., Lenz, R.W., Fuller, R.C., 1990. Plastics from bacteria and for
bacteria: poly(β-hydroxyalkanoates) as natural, biocompatible, and biodegradable
polyesters. Adv. Biochem. Eng. Biotechnol. 41, 77-93.
Braunegg, G., Lefebvre, G., Genser, K.F., 1998. Polyhydroxyalkanoates, biopolyesters
from renewable resources: physiological and engineering aspects. J. Biotechnol.
65, 127-161.
Braunegg, G., Sonnleitner, B., Lafferty, R.M., 1978. A rapid gas chromatographic
method for the determination of poly-hydroxybutyric acid in microbial biomass.
Eur. J. Appl. Microbiol. Biotechnol. 6, 29-37.
87
Brdjanovic, D., van Loosdrecht, M.C., Hooijmans, C.M., Alaerts, G.J., Heijnen, J.J.,
1998. Minimal aerobic sludge retention time in biological phosphorus removal
systems. Biotechnol. Bioeng. 60, 326-332.
Byrom, D., 1987. Polymer synthesis by microorganisms: technology and economics.
Trends Biotechnol. 5, 246-250.
Castilho, L.R., Mitchell, D.A., Freire, D.M., 2009. Production of polyhydroxyalkanoates
(PHAs) from waste materials and by-products by submerged and solid-state
fermentation. Bioresour. Technol. 100, 5996-6009.
Chen, G.Q., Page, W.J., 1994. The effect of substrate on the molecular weight of poly-β-
hydroxybutyrate produced by Azotobacter vinelandii UWD. Biotechnol. Lett. 16,
155-160.
Chen, G.Q., Wu, Q., 2005. The application of polyhydroxyalkanoates as tissue
engineering materials. Biomaterials. 26, 6565-6578.
Choi, J., Lee, S.Y., 1999. Factors affecting the economics of polyhydroxyalkanoate
production by bacterial fermentation. Appl. Microbiol. Biot. 51, 13-21.
Choi, J., Lee, S.Y., 1997. Process analysis and economic evaluation for poly(3-
hydroxybutyrate) production by fermentation. Bioprocess Eng. 17, 335-342.
Comeau, Y., Hall, K.J., Hancock, R.E.W., Oldham, W.K., 1986. Biochemical model for
enhanced biological phosphorus removal. Water Res. 20, 1511-1521.
Comeau, Y., Hall, K.J., Oldham, W.K., 1988. Determination of poly-β-hydroxybutyrate
and poly-β-hydroxyvalerate in activated sludge by gas-liquid chromatography.
Appl. Environ. Microb. 54, 2325-2327.
Dai, Y., Lambert, L., Yuan, Z., Keller, J., 2008. Characterisation of
polyhydroxyalkanoate copolymers with controllable four-monomer composition.
J. Biotechnol. 134, 137-145.
de Rijk, T.C., van de Meer, P., Eggink, G., Weusthuis, R.A., 1998. Methods for analysis
of poly(3-hydroxyalkanaote) composition. In: Y. Doi, A. Steinbüchel (Eds.),
Biopolymers: Polyesters II – Properties and Chemical Synthesis, Vol. 3b. Wiley-
VCH, New York, pp. 1-12.
Doi, Y., 1990. Microbial polyesters. VCH, New York, N.Y.
88
Doi, Y., Kawaguchi, Y., Nakamura, Y., Kunioka, M., 1989. Nuclear magnetic resonance
studies of poly(3-hydroxybutyrate) and polyphosphate metabolism in Alcaligenes
eutrophus. Appl. Environ. Microbiol. 55, 2932-2938.
Doi, Y., Kunioka, M., Nakamura, Y., Soga, K., 1986. Nuclear magnetic resonance
studies on poly(β-hydroxybutyrate) and a copolyester of β-hydroxybutyrate and β-
hydroxyvalerate isolated from Alcaligenes eutrophus H16. Macromolecules. 19,
2860-2864.
Du, G.C.C., Chen, J., Yu, J., Lun, S.Y., 2001. Feeding strategy of propionic acid for
production of poly(3-hydroxybutyrate-co-3-hydroxyvalerate) with Ralstonia
eutropha. Biochem. Eng. J. 8, 103-110.
Furrer, P., Hany, R., Rentsch, D., Grubelnik, A., Ruth, K., Panke, S., Zinn, M., 2007.
Quantitative analysis of bacterial medium-chain-length poly([R]-3-
hydroxyalkanoates) by gas chromatography. J. Chromatogr. A. 1143, 199-206.
Hahn, S.K., Chang, Y.K., Kim, B.S., Chang, H.N., 1994. Optimization of microbial
poly(3-hydroxybutyrate) recover using dispersions of sodium hypochlorite
solution and chloroform. Biotechnol. Bioeng. 44, 256-261.
Hansen, C.S., Hansen, C.L., 2002. Demonstration of dairy manure remediation using IBR
technology. Waste Research Tech. 1, 1-7.
Holmes, P.A., 1985. Applications of PHB - A microbially produced biodegradable
thermoplastic. Phys. Technol. 16, 32-36.
Ivanova, G., Serafim, L.S., Lemos, P.C., Ramos, A.M., Reis, M.A.M., Cabrita, E.J.,
2009. Influence of feeding strategies of mixed microbial cultures on the chemical
composition and microstructure of copolyesters P(3HB-co-3HV) analyzed by
NMR and statistical analysis. Magn. Reson. Chem. 47, 497-504.
Jacquel, N., Lo, C.W., Wei, Y.H., Wu, H.S., Wang, S.S., 2008. Isolation and purification
of bacterial poly (3-hydroxyalkanoates). Biochem. Eng. J. 39, 15-27.
Jan, S., Roblot, C., Courtois, J., Courtois, B., Barbotin, J.N., Seguin, J.P., 1996. 1H NMR
spectroscopic determination of poly 3-hydroxybutyrate extracted from microbial
biomass. Enzyme Microb. Tech. 18, 195-201.
Jan, S., Roblot, C., Goethals, G., Courtois, J., Courtois, B., Saucedo, J.E., Seguin, J.P.,
Barbotin, J.N., 1995. Study of parameters affecting poly(3-hydroxybutyrate)
quantification by gas chromatography. Anal. Biochem. 225, 258-263.
Kelley, A.S., Srienc, F., 1999. Production of two phase polyhydroxyalkanoic acid
granules in Ralstonia eutropha. Int. J. Biol. Macromol. 25, 61-67.

89
Khardenavis, A.A., Kumar, M.S., Mudliar, S.N., Chakrabarti, T., 2007. Biotechnological
conversion of agro-industrial wastewaters into biodegradable plastic, poly β-
hydroxybutyrate. Bioresource Technol. 98, 3579-3584.
Kitamura, S., Doi, Y., 1994. Staining method of poly(3-hydroxyalkanoic acids)
producing bacteria by Nile blue. Biotechnol. Tech. 8, 345-350.
Lee, S.Y., 1996. Bacterial polyhydroxyalkanoates. Biotechnol. Bioeng. 49, 1-14.
Lemos, P.C., Serafim, L.S., Santos, M.M., Reis, M.A.M., Santos, H., 2003. Metabolic
pathway for propionate utilization by phosphorus-accumulating organisms in
activated sludge: C-13 labeling and in vivo nuclear magnetic resonance. Appl.
Environ. Microb. 69, 241-251.
Luzier, W.D., 1992. Materials derived from biomass biodegradable materials. P. Natl.
Acad. Sci. USA. 89, 839-842.
Madison, L.L., Huisman, G.W., 1999. Metabolic engineering of poly(3-
hydroxyalkanoates): from DNA to plastic. Microbiol. Mol. Biol. R. 63, 21-53.
Mino, T., Van Loosdrecht, M.C.M., Heijnen, J.J., 1998. Microbiology and biochemistry
of the enhanced biological phosphate removal process. Water Res. 32, 3193-3207.
Oehmen, A., Yuan, Z., Blackall, L.L., Keller, J., 2005a. Comparison of acetate and
propionate uptake by polyphosphate accumulating organisms and glycogen
accumulating organisms. Biotechnol. Bioeng. 91, 162-168.
Oehmen, A., Keller-Lehmann, B., Zeng, R.J., Yuan, Z.G., Keller, E., 2005b.
Optimisation of poly-b-hydroxyalkanoate analysis using gas chromatography for
enhanced biological phosphorus removal systems. J. Chromatogr. A. 1070, 131-
136.
Ostle, A.G., Holt, J.G., 1982. Nile blue A as a fluorescent stain for poly-β-
hydroxybutyrate. Appl. Environ. Microb. 44, 238-241.
Page, W.J., Tenove, C.J., 1996. Quantitation of poly-β-hydroxybutyrate by fluorescence
of bacteria and granules stained with Nile blue A. Biotechnol. Tech. 10, 215-220.
Park, S.J., Park, J.P., Lee, S.Y., 2002. Production of poly(3-hydroxybutyrate) from whey
by fed-batch culture of recombinant Escherichia coli in a pilot-scale fermenter.
Biotechnol. Lett. 24, 185-189.
Plastics News, 2009. Resin pricing – volume thermoplastics, Vol. 2009.

90
Reddy, C.S.K., Ghai, R., Rashmi, Kalia, V.C., 2003. Polyhydroxyalkanoates: an
overview. Bioresource Technol. 87, 137-146.
Ryu, H.W., Hahn, S.K., Chang, Y.K., Chang, H.N., 1997. Production of poly(3-
hydroxybutyrate) by high cell density fed-batch culture of Alcaligenes eutrophus
with phosphate limitation. Biotechnol. Bioeng. 55, 28-32.
Satoh, H., Mino, T., Matsuo, T., 1994. Deterioration of enhanced biological phosphorus
removal by the domination of microorganisms without polyphosphate
accumulation. Water Sci. Technol. 30, 203–211.
Serafim, L.S., Lemos, P.C., Albuquerque, M.G., Reis, M.A., 2008. Strategies for PHA
production by mixed cultures and renewable waste materials. Appl. Microbiol.
Biotechnol. 81, 615-628.
Serafim, L.S., Lemos, P.C., Levantesi, C., Tandoi, V., Santos, H., Reis, M.A., 2002.
Methods for detection and visualization of intracellular polymers stored by
polyphosphate-accumulating microorganisms. J. Microbiol. Methods. 51, 1-18.
Seviour, R.J., Mino, T., Onuki, M., 2003. The microbiology of biological phosphorus
removal in activated sludge systems. FEMS Microbiol. Rev. 27, 99-127.
Shang, L., Yim, S.C., Park, H.G., Chang, H.N., 2004. Sequential feeding of glucose and
valerate in a fed-batch culture of Ralstonia eutropha for production of
poly(hydroxybutyrate-co-hydroxyvalerate) with high 3-hydroxyvalerate fraction.
Biotechnol. Prog. 20, 140-144.
Spiekermann, P., Rehm, B.H.A., Kalscheuer, R., Baumeister, D., Steinbüchel, A., 1999.
A sensitive, viable-colony staining method using Nile red for direct screening of
bacteria that accumulate polyhydroxyalkanoic acids and other lipid storage
compounds. Arch. Microbiol. 171, 73-80.
Steinbüchel, A., Füchtenbusch, B., 1998. Bacterial and other biological systems for
polyester production. Trends Biotechnol. 16, 419-427.
van Wegen, R.J., Ling, Y., Middelberg, A.P.J., 1998. Industrial production of
polyhydroxyalkanoates using Escherichia coli: an economic analysis. Chem. Eng.
Res. Des. 76, 417-426.
Verlinden, R.A.J., Hill, D.J., Kenward, M.A., Williams, C.D., Radecka, I., 2007.
Bacterial synthesis of biodegradable polyhydroxyalkanoates. J. Appl. Microbiol.
102, 1437-1449.
91
Volova, T., Shishatskaya, E., Sevastianov, V., Efremov, S., Mogilnaya, O., 2003. Results
of biomedical investigations of PHB and PHB/PHV fibers. Biochem. Eng. J. 16,
125-133.
Williams, S.F., Martin, D.P., 2002. Applications of PHAs in medicine and pharmacy. In:
Y. Doi, A. Steinbüchel (Eds.), Biopolymers: Polyesters III – Applications and
Commercial Products, Vol. 4. Wiley-VCH, Weinheim, pp. 91–127.
Wilson, P.W., Knight, S.G., 1952. Experiments in bacterial physiology. Burgess
Publishing Co., Minneapolis.
92
CHAPTER 5
AN INVESTIGATION OF PHASIN TRANSLOCATION AND PHA
PRODUCTION IN ESCHERICHIA COLI
Abstract
Background
Product extraction and purification are commonly the most expensive aspects of
cellular manufacturing processes. For example, polyhydroxyalkanoates (PHAs) are
microbially-accumulated biodegradable plastics that hold potential to serve as an
alternative to petrochemically-derived polymers. However, the widespread use of PHAs
is limited by downstream processing costs. The purpose of this investigation is to use
synthetic biological engineering techniques to investigate alternative methods for product
recovery. Namely, secretion-based recovery holds potential to decrease production costs
by minimizing mechanical and chemical solvent requirements.
Results
To carry out this project, a trial-and-error based approach using four signal
peptides (HlyA, TorA, GeneIII, and PelB) was implemented to provide more comparative
information on the functionality of targeting sequences and to investigate product
secretion. Due to the binding interaction between phasin protein and PHA granules, a
genetic fusion of phasin with signal peptides was explored to indirectly target PHAs for
cellular export. A library of biological parts and genetic devices was created for studying
translocation of phasin and PHA. Recombinant production of PHAs was carried out in
93
three strains of E. coli and quantified using 1H NMR. Results suggest that the biological
parts are functional and can be used for the production and recovery of cellular products.
Conclusions
The basic parts constructed for this study can now be implemented in further
investigations on cellular product recovery. Additionally, composite BioBrick devices
can now be more rigorously tested and evaluated to confirm phasin translocation and for
further analysis of secretion-based PHA recovery.
Background
PHAs are a family of biodegradable thermoplastics accumulated in more than 300
microbial species [1]. In natural PHA-producers, the bioplastic material serves as a
reserve of carbon, energy, and reducing power and accumulation occurs in response to a
nutrient deficiency or environmental stress [1-4]. PHAs are materially comparable to
conventional plastics, like polypropylene, but are fully biodegradable and renewable [5-
6]. Accordingly, PHAs are of interest as a sustainable source of non-petrochemically-
derived plastics for use in commercial and medical applications [4, 7].
Escherichia coli have been studied for recombinant PHA production due to fast
growth rates and well-characterized genetic systems [8-9]. The natural inability of E. coli
to regulate PHA accumulation offers enhanced control over the production mechanism,
such as through the use of IPTG-regulated promoters [9]. Recombinant E. coli harboring
bioplastic synthesis machinery from Cupriavidus necator can accumulate as much as 80-
90% polyhydroxybutyrate (PHB) [1, 10]. Each type of E. coli varies widely in its ability
to accumulate bioplastics, so testing various strains is necessary [11]. In these organisms,
94
a nutrient deficiency or environmental stress is not required for production and instead
accumulation is dependent on the concentration of acetyl-CoA precursor [1].
The high cost of PHA production is a frequently discussed and studied issue due
to prohibitive effect on the commercial viability of bioplastics as a replacement for
petroleum-based plastics [1, 5, 12-14]. The costs associated with PHA downstream
processing represent as much as 50% of the total process expense [15]. Significant
research has been carried out to develop improved recovery methods that require lower
concentrations of chemical solvents or rely on mechanical disruption [16-17], although
these techniques have fallen short of economic viability [17].
Strategies of further engineering E. coli have also been developed for improved
PHA recovery. For example, PHA-producing E. coli transformed with the E-lysis gene of
bacteriophage PhiX174 from plasmid pSH2 has been studied [18]. In this system,
amorphous PHB is pushed out of the cell through an opening in the cell envelope formed
by an E-lysis tunnel structure [18]. In another example, spontaneous autolysis was carried
out in E. coli MG1655 harboring PHA biosynthesis genes from C. necator. Up to 80% of
the cells in culture released PHA granules, which were subsequently recovered by
centrifuging and washing with distilled H2O [15]. While lysis-inducing methods are an
improvement with reduced mechanical and solvent requirements, cellular death is not
conducive to a continuous bioplastic production system.
In this study, a foundation for secretion-based recovery of bioplastics was
investigated. Recovery of bioplastics using E. coli secretion mechanisms would eliminate
the need for cell disruption by mechanical or chemical means, and could potentially lead
to a continuous PHA production system. In gram-negative bacteria like E. coli,
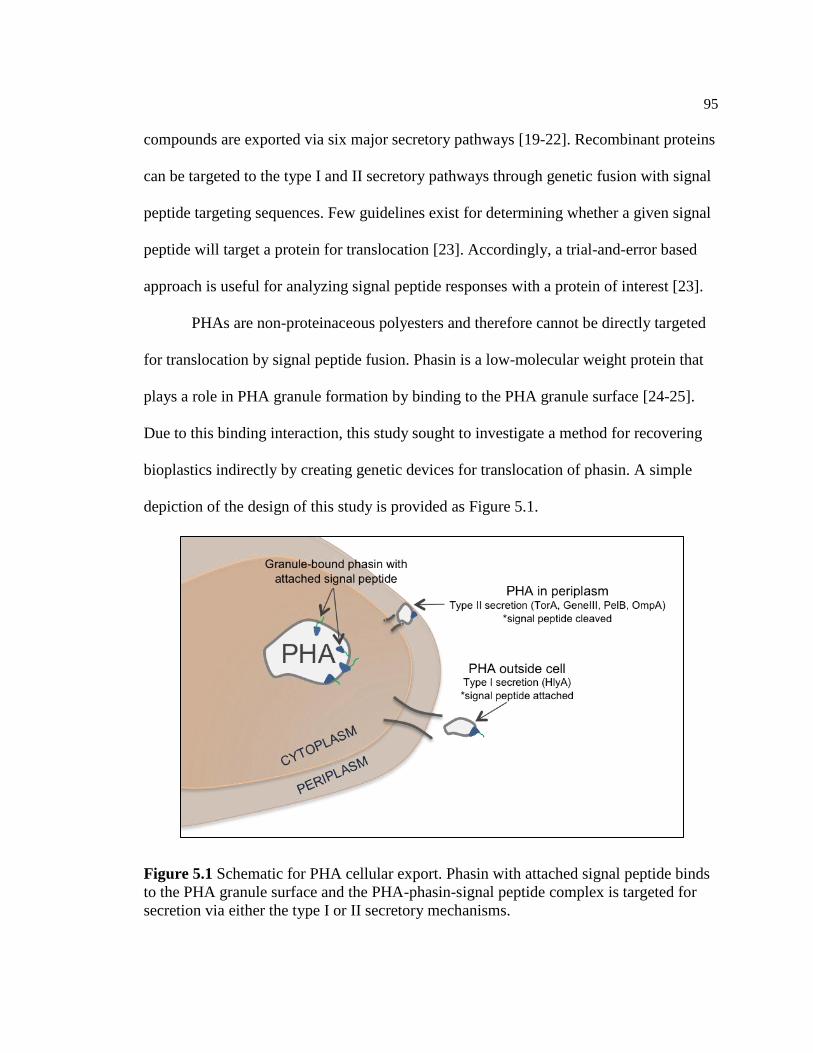
95
compounds are exported via six major secretory pathways [19-22]. Recombinant proteins
can be targeted to the type I and II secretory pathways through genetic fusion with signal
peptide targeting sequences. Few guidelines exist for determining whether a given signal
peptide will target a protein for translocation [23]. Accordingly, a trial-and-error based
approach is useful for analyzing signal peptide responses with a protein of interest [23].
PHAs are non-proteinaceous polyesters and therefore cannot be directly targeted
for translocation by signal peptide fusion. Phasin is a low-molecular weight protein that
plays a role in PHA granule formation by binding to the PHA granule surface [24-25].
Due to this binding interaction, this study sought to investigate a method for recovering
bioplastics indirectly by creating genetic devices for translocation of phasin. A simple
depiction of the design of this study is provided as Figure 5.1.
Figure 5.1 Schematic for PHA cellular export. Phasin with attached signal peptide binds
to the PHA granule surface and the PHA-phasin-signal peptide complex is targeted for
secretion via either the type I or II secretory mechanisms.
96
Translocation of PHAs is more readily possible through sufficient optimization of
granule size, which reportedly varies from 50 to 1,000 kDa based on the growth
parameters and host strain [4]. One of the proposed functions of phasin is to increase the
surface-to-volume ratio of granules so that higher accumulation levels can be achieved
[25-27]. Therefore, the size of PHA granule can be decreased significantly through
phasin overexpression [26]. Proteins of nearly 900 kDa have reportedly been secreted to
the extracellular milieu by the type I secretory mechanism of gram-negative bacteria [28-
29].
Extracellular PHA deposition was observed in a mutated strain of Alcanivorax
borkumensis SK2 [30]. This is the first account of extracellular PHA accumulation [31],
although the mechanism of this system is unknown [30]. A defined secretion-based
bioplastic recovery system would allow for optimization and incorporation of secretion
mechanisms in organisms possessing advantageous characteristics, like E. coli or
photoautotrophic PHA-producers R. sphaeroides and Synechocystis PCC 6803. To date, a
secretion-based bioplastic recovery system has not been demonstrated.
For phasin targeting, type I (HlyA), type II Sec-dependent (GeneIII and PelB),
and type II TAT-dependent (TorA) signal peptides were investigated [23, 32-34]. The
synthetic biological engineering concept of standardization was implemented into the
design of this study due to the number of signal peptides and devices required. Genetic
parts were constructed in accordance with the BioBrick and BioFusion technical
standards [35-36]. This means that genetic devices are carried in BioBrick standard
vectors and conform to rules concerning the presence of restriction enzymes [35]. The
BioFusion standard was specifically used to create phasin and signal peptide parts
97
because this genetic fusion system is compatible with the original BioBrick standard [36-
37].
The objectives of this study are to construct a library of biological devices for
studying phasin and PHA translocation, to investigate and quantify bioplastic production
in recombinant E. coli, and to test the functionality of genetic devices through analysis of
phasin translocation. Movement of phasin or bioplastic to the periplasmic space would be
advantageous due to simplified downstream processing requirements [33, 38].
Furthermore, successful translocation of phasin would be a novel achievement in itself,
and would provide important preliminary information for further optimization of a PHA
recovery mechanism.
Materials and Methods
Strains and Plasmids
Descriptions of strains and plasmids used to study PHA and phasin production
and translocation are provided as Table 5.1. One Shot® Top10 Chemically-Competent E.
coli (Invitrogen, Carlsbad, CA) were used as the host for assembly of BioBrick parts and
devices. Completed BioBrick parts were then transformed in XL1-Blue or BL21-Gold
(DE3) competent E. coli (Stratagene, La Jolla, CA). Plasmid pBHR68 harboring phaCAB
from Ralstonia eutropha was used for recombinant PHA production [39]. Plasmids
pLG575 and pK184HlyBD include the coding regions for proteins HlyB and HlyD [40-
41]. Plasmids pSB1AK3, pSB1A3, and pSB3K3 are BioBrick standard vectors for
assembly and expression of BioBrick genetic devices [42].
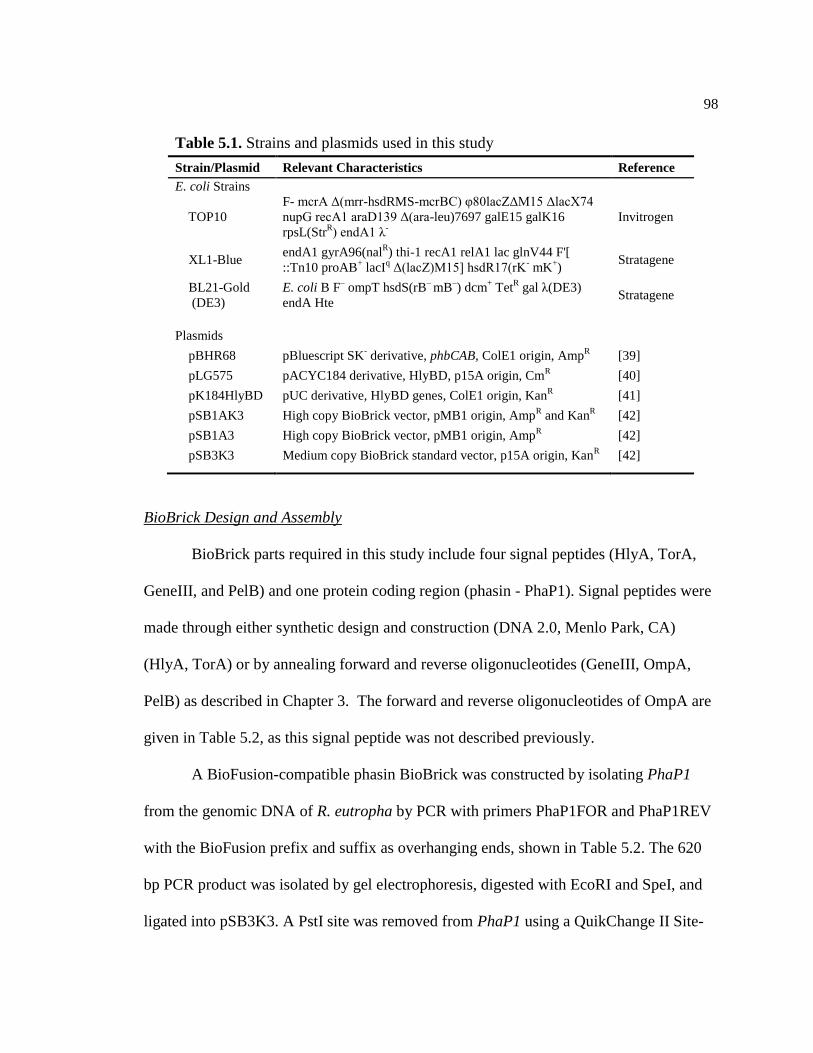
98
Table 5.1. Strains and plasmids used in this study
Strain/Plasmid Relevant Characteristics Reference
E. coli Strains
TOP10
F- mcrA Δ(mrr-hsdRMS-mcrBC) φ80lacZΔM15 ΔlacX74
nupG recA1 araD139 Δ(ara-leu)7697 galE15 galK16
rpsL(StrR) endA1 λ
-
Invitrogen
XL1-Blue endA1 gyrA96(nal
R) thi-1 recA1 relA1 lac glnV44 F'[
::Tn10 proAB+ lacI
q Δ(lacZ)M15] hsdR17(rK
- mK
+)
Stratagene
BL21-Gold
(DE3)
E. coli B F– ompT hsdS(rB
– mB
–) dcm
+ Tet
R gal λ(DE3)
endA Hte Stratagene
Plasmids
pBHR68 pBluescript SK- derivative, phbCAB, ColE1 origin, Amp
R [39]
pLG575 pACYC184 derivative, HlyBD, p15A origin, CmR [40]
pK184HlyBD pUC derivative, HlyBD genes, ColE1 origin, KanR [41]
pSB1AK3 High copy BioBrick vector, pMB1 origin, AmpR and Kan
R [42]
pSB1A3 High copy BioBrick vector, pMB1 origin, AmpR [42]
pSB3K3 Medium copy BioBrick standard vector, p15A origin, KanR [42]
BioBrick Design and Assembly
BioBrick parts required in this study include four signal peptides (HlyA, TorA,
GeneIII, and PelB) and one protein coding region (phasin - PhaP1). Signal peptides were
made through either synthetic design and construction (DNA 2.0, Menlo Park, CA)
(HlyA, TorA) or by annealing forward and reverse oligonucleotides (GeneIII, OmpA,
PelB) as described in Chapter 3. The forward and reverse oligonucleotides of OmpA are
given in Table 5.2, as this signal peptide was not described previously.
A BioFusion-compatible phasin BioBrick was constructed by isolating PhaP1
from the genomic DNA of R. eutropha by PCR with primers PhaP1FOR and PhaP1REV
with the BioFusion prefix and suffix as overhanging ends, shown in Table 5.2. The 620
bp PCR product was isolated by gel electrophoresis, digested with EcoRI and SpeI, and
ligated into pSB3K3. A PstI site was removed from PhaP1 using a QuikChange II Site-
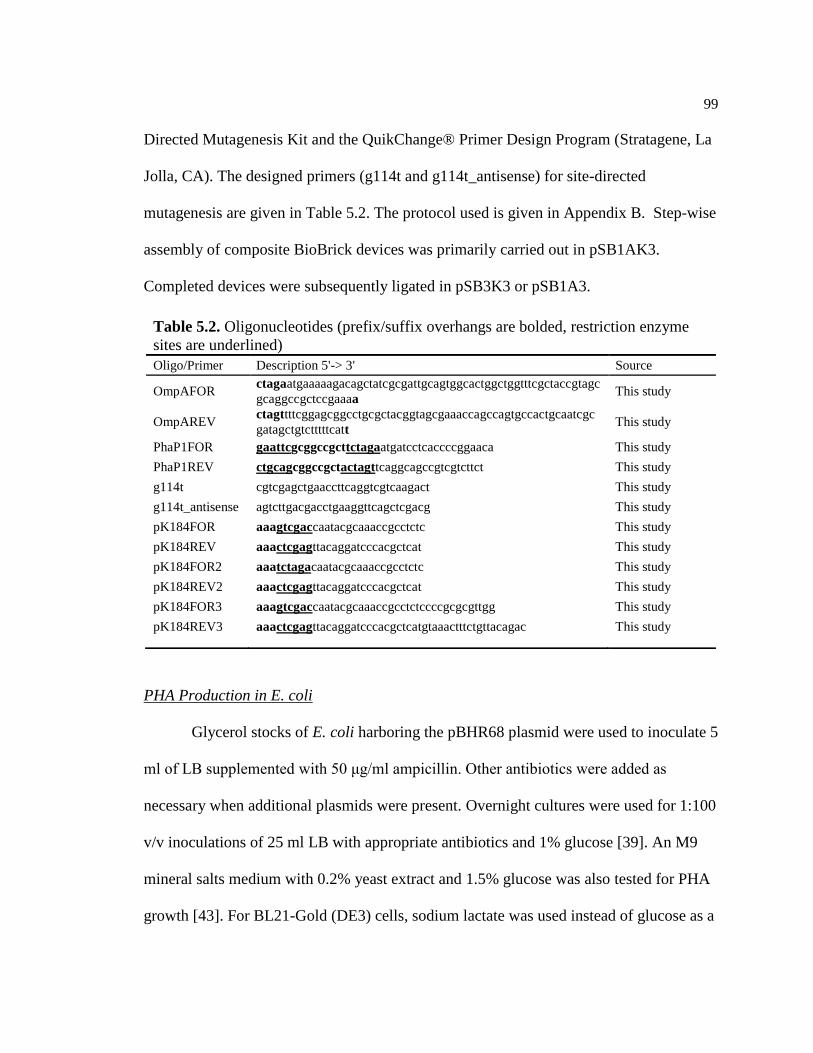
99
Directed Mutagenesis Kit and the QuikChange® Primer Design Program (Stratagene, La
Jolla, CA). The designed primers (g114t and g114t_antisense) for site-directed
mutagenesis are given in Table 5.2. The protocol used is given in Appendix B. Step-wise
assembly of composite BioBrick devices was primarily carried out in pSB1AK3.
Completed devices were subsequently ligated in pSB3K3 or pSB1A3.
PHA Production in E. coli
Glycerol stocks of E. coli harboring the pBHR68 plasmid were used to inoculate 5
ml of LB supplemented with 50 μg/ml ampicillin. Other antibiotics were added as
necessary when additional plasmids were present. Overnight cultures were used for 1:100
v/v inoculations of 25 ml LB with appropriate antibiotics and 1% glucose [39]. An M9
mineral salts medium with 0.2% yeast extract and 1.5% glucose was also tested for PHA
growth [43]. For BL21-Gold (DE3) cells, sodium lactate was used instead of glucose as a
Table 5.2. Oligonucleotides (prefix/suffix overhangs are bolded, restriction enzyme
sites are underlined)
Oligo/Primer Description 5'-> 3' Source
OmpAFOR ctagaatgaaaaagacagctatcgcgattgcagtggcactggctggtttcgctaccgtagc
gcaggccgctccgaaaa This study
OmpAREV ctagttttcggagcggcctgcgctacggtagcgaaaccagccagtgccactgcaatcgc
gatagctgtctttttcatt This study
PhaP1FOR gaattcgcggccgcttctagaatgatcctcaccccggaaca This study
PhaP1REV ctgcagcggccgctactagttcaggcagccgtcgtcttct This study
g114t cgtcgagctgaaccttcaggtcgtcaagact This study
g114t_antisense agtcttgacgacctgaaggttcagctcgacg This study
pK184FOR aaagtcgaccaatacgcaaaccgcctctc This study
pK184REV aaactcgagttacaggatcccacgctcat This study
pK184FOR2 aaatctagacaatacgcaaaccgcctctc This study
pK184REV2 aaactcgagttacaggatcccacgctcat This study
pK184FOR3 aaagtcgaccaatacgcaaaccgcctctccccgcgcgttgg This study
pK184REV3 aaactcgagttacaggatcccacgctcatgtaaactttctgttacagac This study
100
carbon source [44]. IPTG was added to a final concentration of 0.1 mM when the OD600
of cultures was 0.6-1.0 [43]. Stationary phase cells were harvested after 8-10 hours of
growth by centrifugation at 4,000 x g for 20 minutes. PHA content was analyzed using
either staining procedures or 1H NMR.
Cells were stained with Nile blue A sulfate solution for PHA visualization. A 1%
(w/v) solution of Nile blue A sulfate in ethanol [45] was used to stain heat-fixed smears
for 10 minutes at 55˚C in a Coplin staining jar [46]. The stained smears were gently
washed with ddH2O, followed by a washing with 8% acetic acid to remove residual stain.
The slides were then carefully blotted dry and analyzed using a Nikon Eclipse Ti-U
(Melville, NY) equipped with a G-2A green excitation longpass emission filter with an
excitation wavelength range of 510-560 nm. A Photometrics® CoolSNAP HQ2 high-
resolution camera and NIS-Elements AR software was used for image capturing and
analysis.
1H NMR was used to quantify and identify PHAs. A detailed outline of sample
preparation procedures was discussed in Chapter 4. Cells were lyophilized at -40˚C and
33 10-3
mBar. Approximately 10 mg of cells were subjected to solvent dispersion with
CDCl3 (0.03% TMS) and 5% (v/v) sodium hypochlorite for 2 hours at 37˚C. The CDCl3
layer was separated by centrifugation at 1500 x g for 10 minutes and used for 1H NMR
measurements. A Jeol ECX-300 spectrometer (Jeol USA, Inc., Peabody, MA) with an
Oxford 54-mm-bore magnet was used for 300.53 MHz 1H NMR spectral analysis.
Operating conditions are discussed in Chapter 4.
101
Cellular Fractionation and Western Blotting
Overnight cultures of E. coli BL21-Gold (DE3) harboring pLG575 and various
composite BioBrick devices in pSB1A3 and were used to inoculate (1:100 v/v dilution)
100 ml of LB media containing chloramphenicol (25 μg/ml) and ampicillin (50 μg/ml).
The lysozyme/EDTA/osmotic shock and chloroform-based cellular fractionation
procedures were previously discussed in Chapter 3, and more detailed instructions can
also be found in Appendix B. Approximately 50 ml of supernatant was concentrated to
0.5 ml using Centricon® YM-10 centrifugal filter devices (Millipore, Bellerica, MA).
Proteins from fractioned samples were separated using precast 12% SDS-polyacrylamide
tris-glycine gels (Jule Inc., Milford, CT). Electrophoresis operating conditions were used
as specified by the manufacturer. Phasin immunoblotting was carried out using a PhaP1
specific antibody [47, 48]. An Anti-Rabbit IgG HRP conjugated secondary antibody (Cat
No.: W4011) was purchased from Promega (Madison, WI). Respective primary and
secondary antibody concentrations of 1:50,000 v/v and 1:2,500 v/v were used. Western
blotting procedures are discussed in Chapter 3 and in Appendix B.
Results
BioBrick Construction
A complete list of individual and intermediate BioBrick parts is given as Table
A.5, Appendix A. Separation of the PhaP1 PCR product is shown as Figure 5.2A. The
PstI mutation in PhaP1 was successfully carried out and confirmed by sequencing
analysis. The PhaP1 sequence is found in Table A.4, Appendix A. To facilitate an
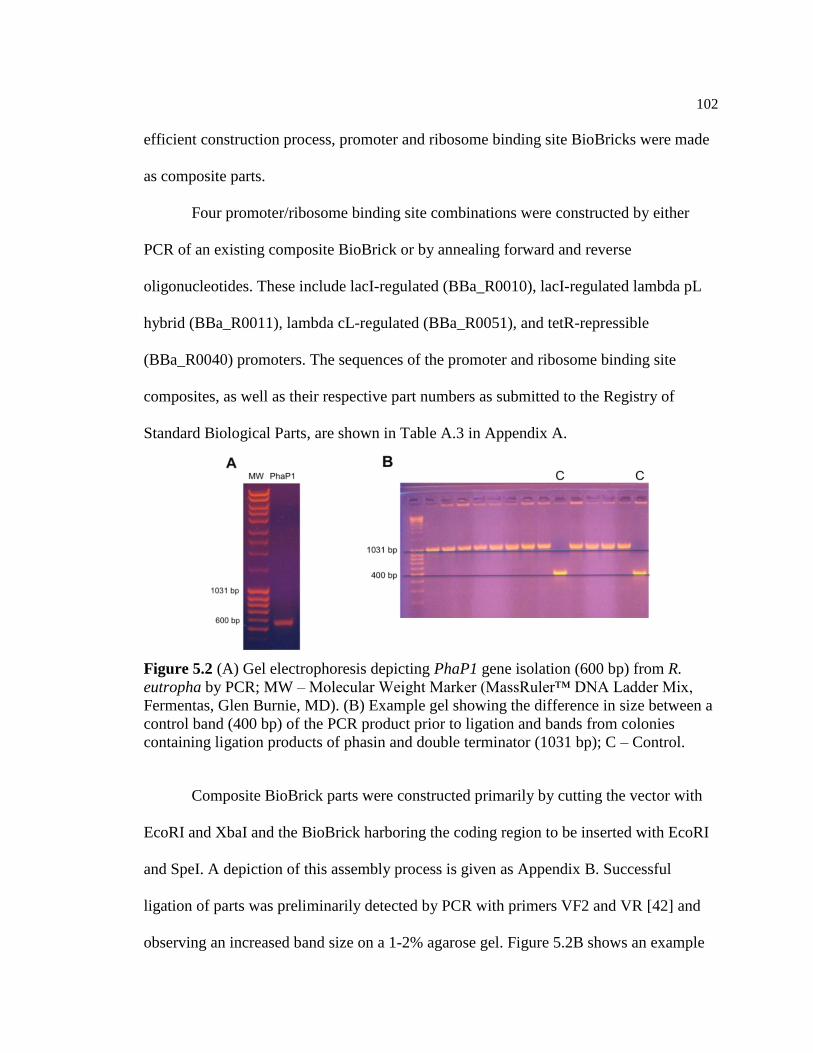
102
efficient construction process, promoter and ribosome binding site BioBricks were made
as composite parts.
Four promoter/ribosome binding site combinations were constructed by either
PCR of an existing composite BioBrick or by annealing forward and reverse
oligonucleotides. These include lacI-regulated (BBa_R0010), lacI-regulated lambda pL
hybrid (BBa_R0011), lambda cL-regulated (BBa_R0051), and tetR-repressible
(BBa_R0040) promoters. The sequences of the promoter and ribosome binding site
composites, as well as their respective part numbers as submitted to the Registry of
Standard Biological Parts, are shown in Table A.3 in Appendix A.
Figure 5.2 (A) Gel electrophoresis depicting PhaP1 gene isolation (600 bp) from R.
eutropha by PCR; MW – Molecular Weight Marker (MassRuler™ DNA Ladder Mix,
Fermentas, Glen Burnie, MD). (B) Example gel showing the difference in size between a
control band (400 bp) of the PCR product prior to ligation and bands from colonies
containing ligation products of phasin and double terminator (1031 bp); C – Control.
Composite BioBrick parts were constructed primarily by cutting the vector with
EcoRI and XbaI and the BioBrick harboring the coding region to be inserted with EcoRI
and SpeI. A depiction of this assembly process is given as Appendix B. Successful
ligation of parts was preliminarily detected by PCR with primers VF2 and VR [42] and
observing an increased band size on a 1-2% agarose gel. Figure 5.2B shows an example
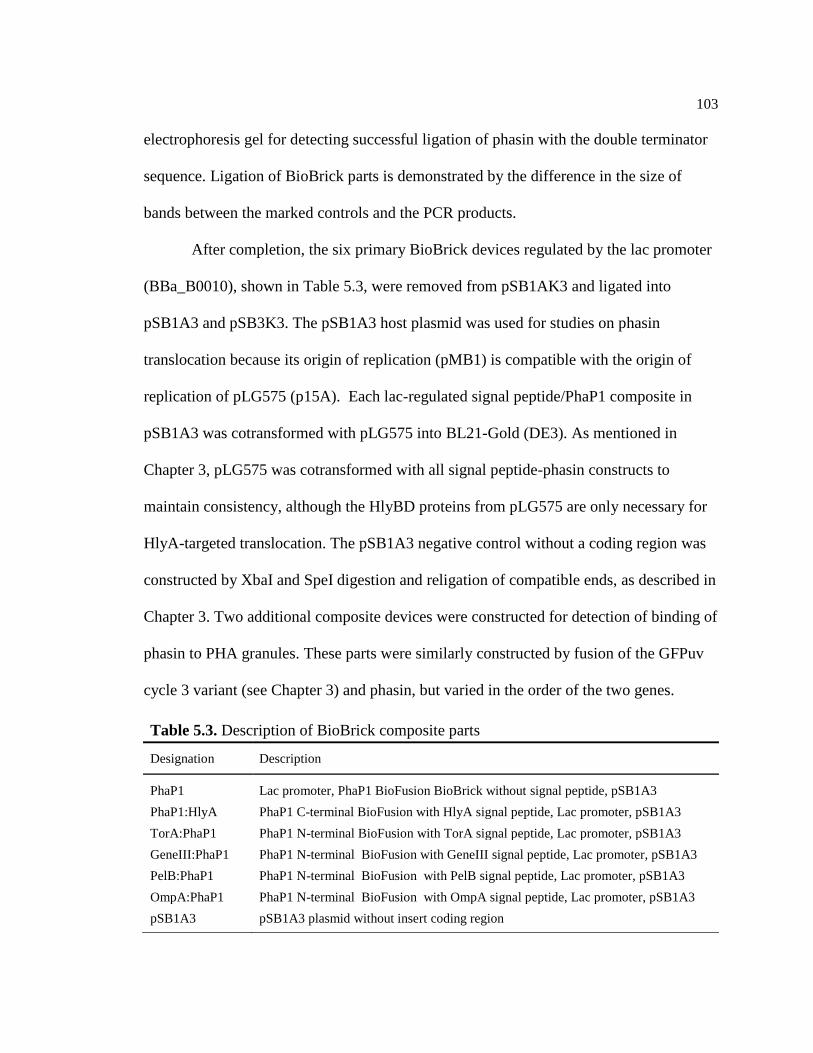
103
electrophoresis gel for detecting successful ligation of phasin with the double terminator
sequence. Ligation of BioBrick parts is demonstrated by the difference in the size of
bands between the marked controls and the PCR products.
After completion, the six primary BioBrick devices regulated by the lac promoter
(BBa_B0010), shown in Table 5.3, were removed from pSB1AK3 and ligated into
pSB1A3 and pSB3K3. The pSB1A3 host plasmid was used for studies on phasin
translocation because its origin of replication (pMB1) is compatible with the origin of
replication of pLG575 (p15A). Each lac-regulated signal peptide/PhaP1 composite in
pSB1A3 was cotransformed with pLG575 into BL21-Gold (DE3). As mentioned in
Chapter 3, pLG575 was cotransformed with all signal peptide-phasin constructs to
maintain consistency, although the HlyBD proteins from pLG575 are only necessary for
HlyA-targeted translocation. The pSB1A3 negative control without a coding region was
constructed by XbaI and SpeI digestion and religation of compatible ends, as described in
Chapter 3. Two additional composite devices were constructed for detection of binding of
phasin to PHA granules. These parts were similarly constructed by fusion of the GFPuv
cycle 3 variant (see Chapter 3) and phasin, but varied in the order of the two genes.
Table 5.3. Description of BioBrick composite parts
Designation Description
PhaP1 Lac promoter, PhaP1 BioFusion BioBrick without signal peptide, pSB1A3
PhaP1:HlyA PhaP1 C-terminal BioFusion with HlyA signal peptide, Lac promoter, pSB1A3
TorA:PhaP1 PhaP1 N-terminal BioFusion with TorA signal peptide, Lac promoter, pSB1A3
GeneIII:PhaP1 PhaP1 N-terminal BioFusion with GeneIII signal peptide, Lac promoter, pSB1A3
PelB:PhaP1 PhaP1 N-terminal BioFusion with PelB signal peptide, Lac promoter, pSB1A3
OmpA:PhaP1 PhaP1 N-terminal BioFusion with OmpA signal peptide, Lac promoter, pSB1A3
pSB1A3 pSB1A3 plasmid without insert coding region
104
Constructs were ligated into pSB3K3 to study potential PHA translocation due to
compatibility between the origin of replications of pSB3K3 and pBHR68. The HlyA-
targeted PHA secretion system required additional consideration because this system also
required the presence of the HlyBD genes from the pLG575 plasmid. Several designs
were investigated to create this system.
The first design for creating a HlyBD/PHA/pLG575 expression system involved
the use of primers to isolate the HlyB and HlyD proteins from pK184HlyBD (primers
pK184FOR and pK184REV) based on the plasmid sequence (see Appendix A). These
primers included SalI and XhoI overhangs so that the PCR product could be digested and
ligated into the pBHR68 plasmid. Two other primer sets (pK184FOR2 and pK184REV2)
were designed with XbaI and XhoI overhangs so that the PCR product could be digested
and ligated into the pBHR68, but so that phaCAB would be removed. PCR reactions were
set up with either PfuUltra™ (Stratagene, La Jolla, CA) or Platinum® Taq (Invitrogen,
Carlsbad, CA) high fidelity polymerases in several replicates to test varied reaction
conditions. Specifically, different primer concentrations, annealing temperatures, reaction
components, and template concentrations were tested in order to create near optimal
conditions for obtaining the 4000 bp PCR product. A PCR product of an incorrect size
(2000 bp) was obtained.
As another attempt to create the HlyBD/PHA/pLG575 expression system, new
primers (pK184FOR3 and pK184REV3) of increased length were designed to increase
primer specificity. Similar negative results were observed. Finally, a restriction enzyme
digestion was carried out with EcoRI. Based on the plasmid sequence, a 2263 bp
fragment and a 3770 bp fragment should have been observed. Instead, one large band at
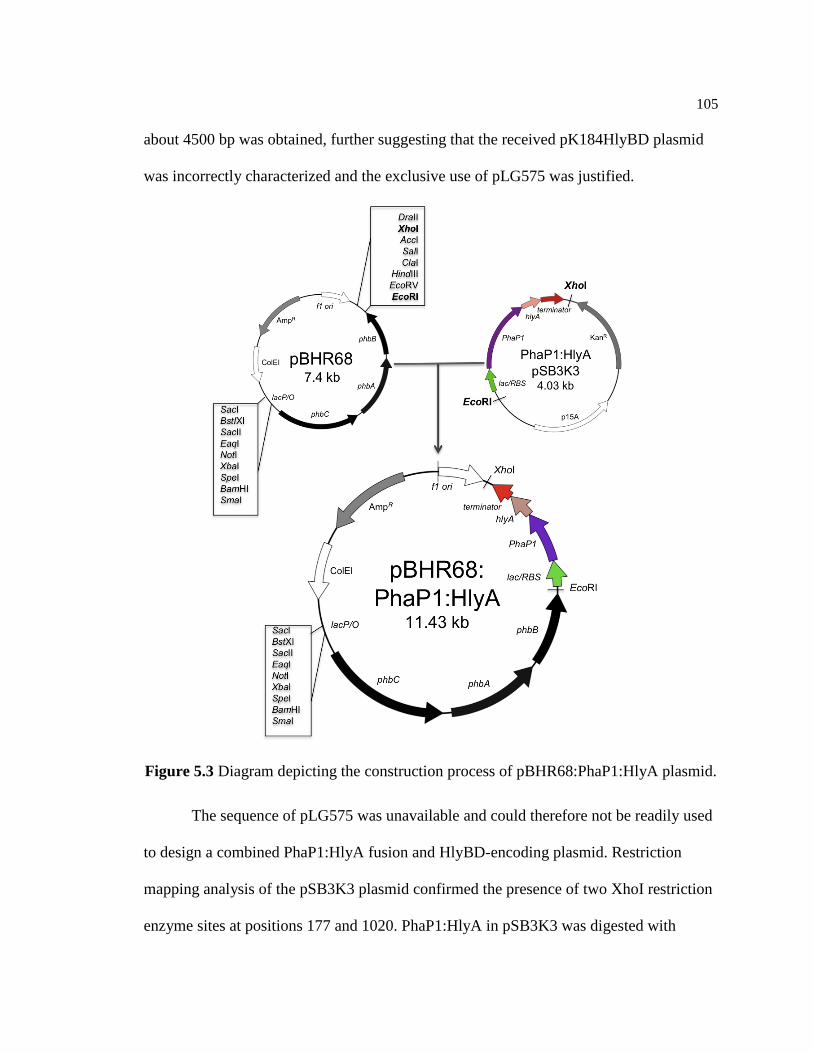
105
about 4500 bp was obtained, further suggesting that the received pK184HlyBD plasmid
was incorrectly characterized and the exclusive use of pLG575 was justified.
Figure 5.3 Diagram depicting the construction process of pBHR68:PhaP1:HlyA plasmid.
The sequence of pLG575 was unavailable and could therefore not be readily used
to design a combined PhaP1:HlyA fusion and HlyBD-encoding plasmid. Restriction
mapping analysis of the pSB3K3 plasmid confirmed the presence of two XhoI restriction
enzyme sites at positions 177 and 1020. PhaP1:HlyA in pSB3K3 was digested with

106
EcoRI and XhoI. The 1217 bp fragment was excised from an electrophoresis gel,
purified, and used for ligation with pBHR68. The process of modifying the PhaP1:HlyA
fusion and pBHR68 plasmids is depicted in Figure 5.3. The resulting plasmid, carrying
both the PHA encoding genes and the PhaP1:HlyA fusion (designated as pBHR68-
PhaP1:HlyA), was cotransformed with pLG575 into E. coli (Fig. 5.4).
Figure 5.4 An illustration of E. coli harboring pLG575 for HlyBD protein expression and
pBHR68:PhaP1:HlyA for PHA production and PhaP1:HlyA BioFusion expression.
PHA Production in E. coli
E. coli harboring the pBHR68 plasmid was studied for PHA accumulation. Cells
were grown on either LB supplemented with 1% glucose, or in M9 Mineral Media with
1.5% glucose and 0.2% yeast extract. There was not a significant detectable difference in
PHA concentration between the two compositions. The LB composition was
predominantly employed. The addition of IPTG was necessary because the phaCAB
operon is regulated by the lacZ promoter from pBluescriptSK- [39].
Figure 5.5 shows the results of Nile blue staining and fluorescence microscopic
analysis with three different strains. Stained intracellular PHA is visible as bright, orange
granules [46]. The negative control (Fig. 5.5A) was created by transforming Top10 cells
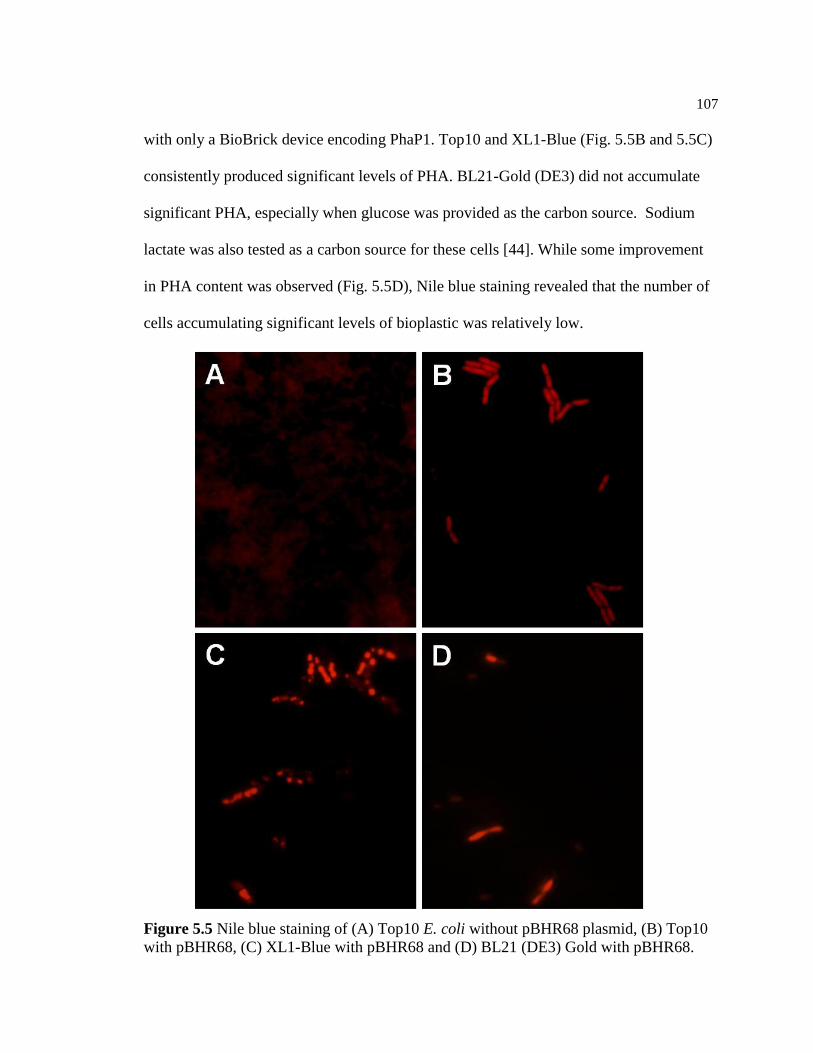
107
with only a BioBrick device encoding PhaP1. Top10 and XL1-Blue (Fig. 5.5B and 5.5C)
consistently produced significant levels of PHA. BL21-Gold (DE3) did not accumulate
significant PHA, especially when glucose was provided as the carbon source. Sodium
lactate was also tested as a carbon source for these cells [44]. While some improvement
in PHA content was observed (Fig. 5.5D), Nile blue staining revealed that the number of
cells accumulating significant levels of bioplastic was relatively low.
Figure 5.5 Nile blue staining of (A) Top10 E. coli without pBHR68 plasmid, (B) Top10
with pBHR68, (C) XL1-Blue with pBHR68 and (D) BL21 (DE3) Gold with pBHR68.
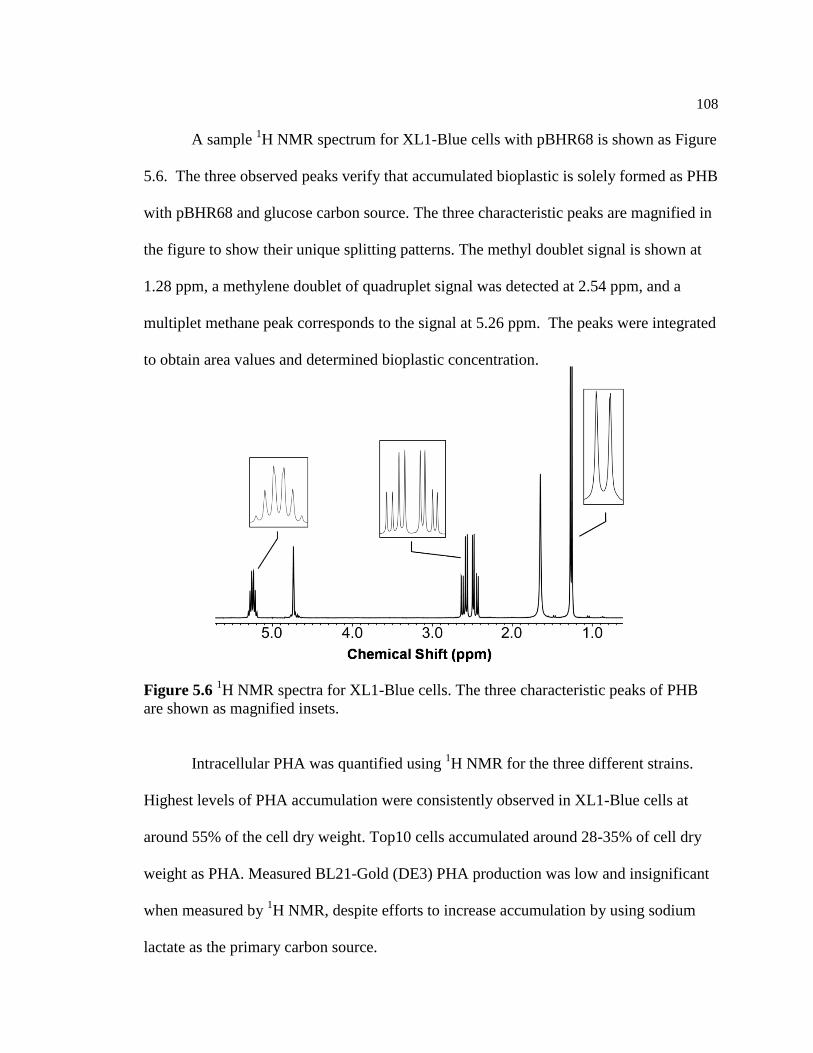
108
A sample 1H NMR spectrum for XL1-Blue cells with pBHR68 is shown as Figure
5.6. The three observed peaks verify that accumulated bioplastic is solely formed as PHB
with pBHR68 and glucose carbon source. The three characteristic peaks are magnified in
the figure to show their unique splitting patterns. The methyl doublet signal is shown at
1.28 ppm, a methylene doublet of quadruplet signal was detected at 2.54 ppm, and a
multiplet methane peak corresponds to the signal at 5.26 ppm. The peaks were integrated
to obtain area values and determined bioplastic concentration.
Figure 5.6 1H NMR spectra for XL1-Blue cells. The three characteristic peaks of PHB
are shown as magnified insets.
Intracellular PHA was quantified using 1H NMR for the three different strains.
Highest levels of PHA accumulation were consistently observed in XL1-Blue cells at
around 55% of the cell dry weight. Top10 cells accumulated around 28-35% of cell dry
weight as PHA. Measured BL21-Gold (DE3) PHA production was low and insignificant
when measured by 1H NMR, despite efforts to increase accumulation by using sodium
lactate as the primary carbon source.
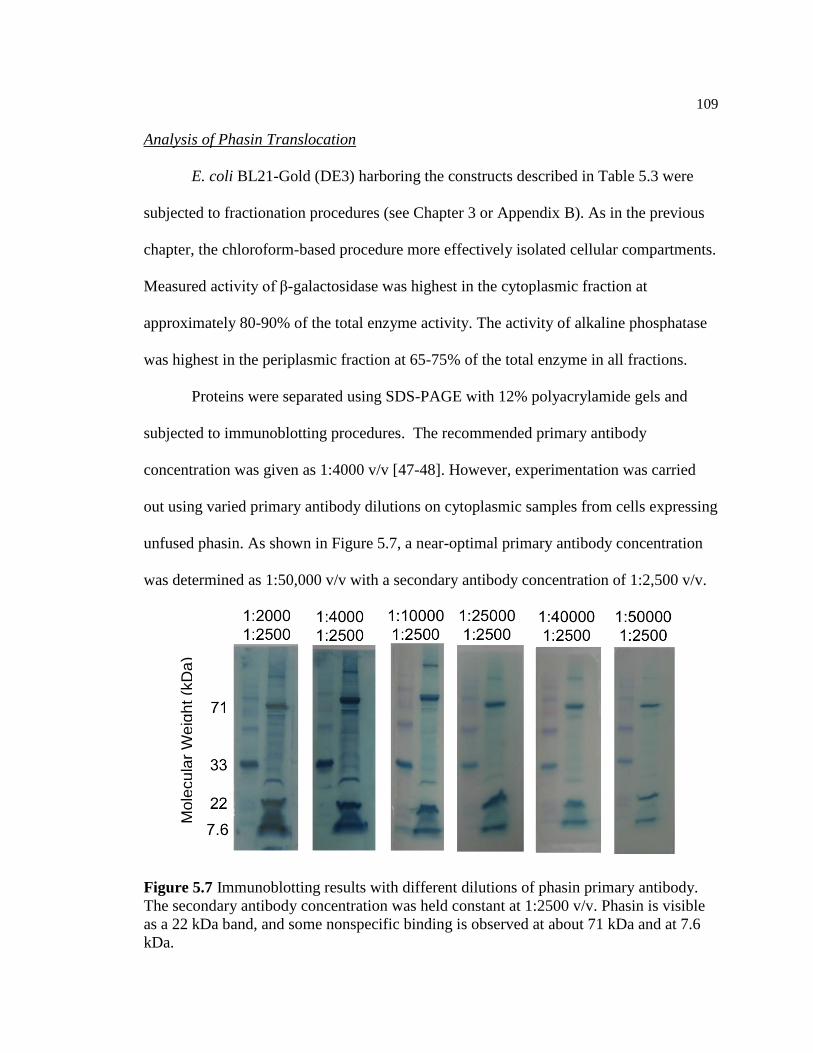
109
Analysis of Phasin Translocation
E. coli BL21-Gold (DE3) harboring the constructs described in Table 5.3 were
subjected to fractionation procedures (see Chapter 3 or Appendix B). As in the previous
chapter, the chloroform-based procedure more effectively isolated cellular compartments.
Measured activity of β-galactosidase was highest in the cytoplasmic fraction at
approximately 80-90% of the total enzyme activity. The activity of alkaline phosphatase
was highest in the periplasmic fraction at 65-75% of the total enzyme in all fractions.
Proteins were separated using SDS-PAGE with 12% polyacrylamide gels and
subjected to immunoblotting procedures. The recommended primary antibody
concentration was given as 1:4000 v/v [47-48]. However, experimentation was carried
out using varied primary antibody dilutions on cytoplasmic samples from cells expressing
unfused phasin. As shown in Figure 5.7, a near-optimal primary antibody concentration
was determined as 1:50,000 v/v with a secondary antibody concentration of 1:2,500 v/v.
Figure 5.7 Immunoblotting results with different dilutions of phasin primary antibody.
The secondary antibody concentration was held constant at 1:2500 v/v. Phasin is visible
as a 22 kDa band, and some nonspecific binding is observed at about 71 kDa and at 7.6
kDa.
Mo
lecu
lar
We
igh
t (k
Da
)
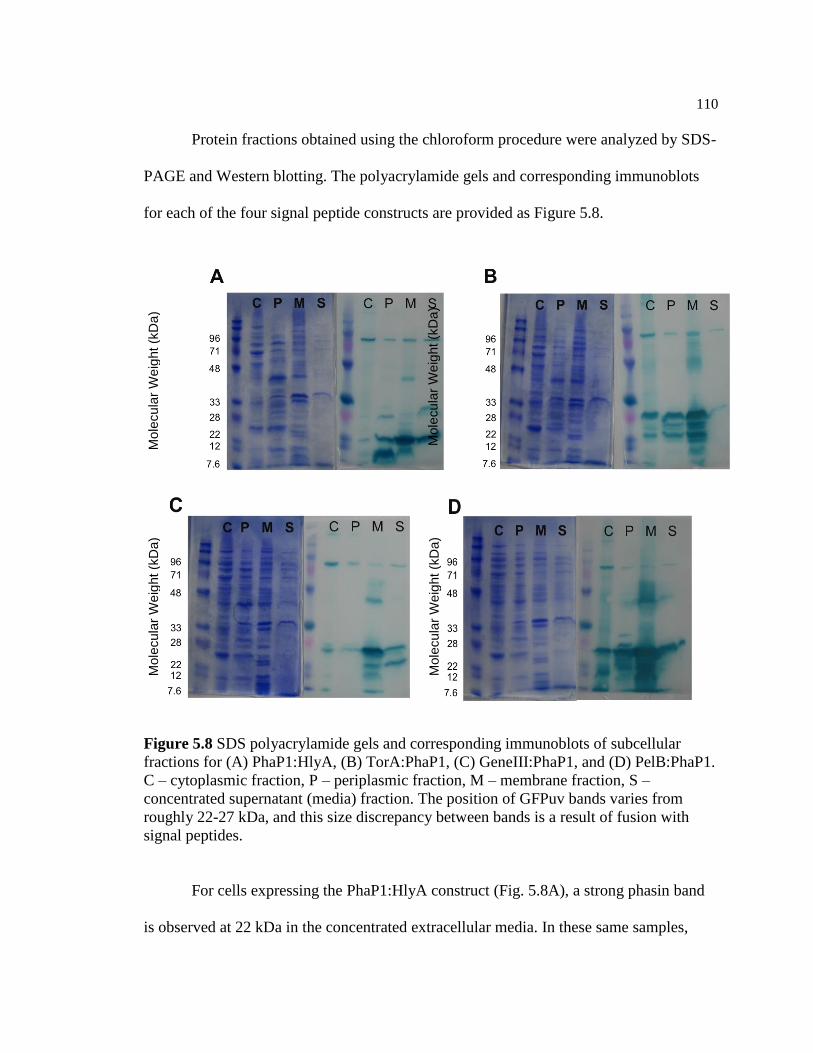
110
Protein fractions obtained using the chloroform procedure were analyzed by SDS-
PAGE and Western blotting. The polyacrylamide gels and corresponding immunoblots
for each of the four signal peptide constructs are provided as Figure 5.8.
Figure 5.8 SDS polyacrylamide gels and corresponding immunoblots of subcellular
fractions for (A) PhaP1:HlyA, (B) TorA:PhaP1, (C) GeneIII:PhaP1, and (D) PelB:PhaP1.
C – cytoplasmic fraction, P – periplasmic fraction, M – membrane fraction, S –
concentrated supernatant (media) fraction. The position of GFPuv bands varies from
roughly 22-27 kDa, and this size discrepancy between bands is a result of fusion with
signal peptides.
For cells expressing the PhaP1:HlyA construct (Fig. 5.8A), a strong phasin band
is observed at 22 kDa in the concentrated extracellular media. In these same samples,
Mole
cula
r W
eig
ht (k
Da)
Mole
cula
r W
eig
ht (k
Da)
Mole
cula
r W
eig
ht (k
Da)
Mole
cula
r W
eig
ht (k
Da)
111
minimal phasin is observed in the cytoplasmic fraction and a strong band is observed in
the membrane fraction. This suggests that the expressed phasin is primarily targeted to
the HlyA secretion machinery and translocated to the extracellular media, although the
size of the secreted band is smaller than expected. The HlyA targeted secretion product
should have the HlyA signal peptide attached to the phasin protein. Accordingly, the
observed product is around 5.5 kDa smaller than expected.
In analyzed TorA:PhaP1 samples, three distinct sizes of phasin were observed,
which was consistent to the number and size differences of TorA targeted GFPuv (see
Chapter 3). The strongest phasin band was observed in the membrane fraction, indicating
that some of the targeted protein becomes entrapped in the inner cellular membrane. Like
the TorA-targeted GFPuv, this could be partially due to the presence of positively-
charged arginine in the fusion scar. A periplasmic phasin band was observed, although
the intensity of the unfused band was not significantly greater than that of the fused band,
thereby indicating a potential issue with the fractionation procedures. Phasin was not
translocated to the supernatant fraction with the TorA signal peptide.
Phasin was primarily found in the membrane fraction when GeneIII was used for
targeting (Fig. 5.8C). Some phasin is found in the supernatant, both in a fused and
unfused form. Samples obtained from PelB:PhaP1 harboring cells contained significantly
larger quantities of overall phasin. In particular, the membrane fraction had high levels of
phasin that is apparent as a single smeared band. This could mean that the PelB targeted
phasin is expressed at more significant levels, or it may be a result of procedural errors.
The total amount of loaded protein, however, appears to be consistent with the total
112
amount of loaded protein for the other analyzed signal peptides. This was concluded by
comparing the polyacrylamide gels for each of the signal peptides.
Discussion
In this study, the BioBrick technical standard was used to efficiently construct a
library of biological devices, including parts to analyze phasin translocation, the PHA-
phasin binding interaction, and PHA translocation. Many of the completed devices and
individual parts were submitted to the Registry of Standard Biological Parts so that
researchers can utilize these parts in creating new devices for targeting proteins for
cellular export.
E. coli XL1-Blue cells harboring the pBHR68 plasmid were shown capable of
accumulating as much as 55% of their cell dry weight as bioplastic. This was
significantly higher than PHA accumulation observed in Top10 and BL21-Gold (DE3) E.
coli at roughly 28% and 2%, respectively. The inability of BL21-Gold (DE3) to
accumulate significant levels of PHA demonstrates the variability between strains for
PHA production. No PHA was detectable when glucose was provided as the carbon
source. The PHA accumulation was slightly improved when sodium lactate was supplied,
although the production levels remained suboptimal. This poor accumulation may be
corrected for through media optimization studies or by using a different plasmid,
although similar comparison studies with E. coli likewise noted significant variability
between strains for PHA accumulation [11]. XL1-Blue was determined as a suitable
candidate for PHA translocation studies, although this strain produces proteases, which
may be dealt with if necessary by the addition of protease inhibitors. Lastly, the
113
developed 1H NMR procedure discussed in the previous chapter was shown to be useful
for PHA quantification in E. coli.
The functionality of phasin BioBrick devices was suggested by SDS-PAGE
analysis. Protein bands at 22 kDa corresponding to the size of phasin are observed [47].
The identity of the phasin protein was confirmed using a phasin-specific antibody. Using
immunoblotting procedures, phasin translocation was analyzed. Preliminary results
suggest some degree of phasin export. A significant phasin band was observed in the
extracellular media when HlyA was used for targeting. A slight supernatant band was
also observed for GeneIII-targeted phasin. For the TorA, GeneIII, and PelB signal
peptides, significant levels of phasin were found in the membrane fractions. Periplasmic
phasin was also observed when TorA was used for targeting.
There are a number of ways that phasin secretion or translocation could be
improved. Among the many possibilities, other studies have investigated ways to further
engineer E. coli to improve the efficiency of secretion mechanisms. SecYEG and TorD
proteins are required for formation of secretion machinery in type II Sec- and TAT-
dependent machinery, respectively. It has been determined that overexpression of TorD
leads to improved translocation efficiency [49]. To incorporate this concept into the
biological systems constructed for this study, the SecYEG or TorD proteins could be
constructed as BioBricks and combined with the signal peptide-phasin devices. This
would not be necessary for the PhaP1:HlyA construct because HlyA operates by the type
I pathway. Another way to potentially increase secretion efficiency is through
optimization of factors like vector copy number and through the removal of the
positively-charged arginine in the BioFusion scar. For example, the use of a high copy

114
number plasmid may lead to higher protein expression levels, but higher production may
result in decreased secretion by overwhelming the secretion machinery. The positively-
charged arginine could lead to issues with the phasin protein becoming entrapped in the
inner membrane.
More information is still required to analyze the potential of the PHA-phasin-
signal peptide secretion-based recovery system, including the significance of the PHA-
phasin interaction. Three potential methods for analyzing this binding interaction involve
GFP fusion, TEM imaging, and 1H NMR analysis. Genetic fusion of phasin with GFP
would potentially allow for microscopic visualization of phasin bound to PHA granules.
Parts were constructed in this study for this purpose. TEM imaging could be used to
analyze the size of accumulated PHA granules. Successful overexpression and binding of
phasin should result in a decreased PHA granule size [26]. Quantification of PHA content
by 1H NMR in cells containing both pBHR68 and a phasin-expressing BioBrick may
demonstrate PHA binding through increased PHA accumulation as a result of a
maximized surface-to-volume ratio.
Conclusions
In conclusion, a library of genetic parts and devices was completed using
synthetic biological engineering concepts and BioBrick and BioFusion technical
standards. These parts were tested for functionality, and current results suggest phasin
expression and secretion in recombinant BL21-Gold (DE3). Phasin was observed in the
supernatant when targeted using the HlyA and GeneIII signal peptides. The basic parts
constructed for this study can now be implemented in other investigations of cellular
115
product recovery. Additionally, composite BioBrick devices can now be more rigorously
tested and evaluated to confirm phasin translocation and for further analysis of secretion-
based PHA recovery.
References
1. Lee SY: Bacterial polyhydroxyalkanoates. Biotechnol Bioeng 1996, 49:1-14.
2. Anderson AJ, Dawes EA: Occurrence, metabolism, metabolic role, and
industrial uses of bacterial polyhydroxyalkanoates. Microbiol Rev 1990,
54:450-472.
3. Doi Y: Microbial polyesters. New York, N.Y.: VCH; 1990.
4. Madison LL, Huisman GW: Metabolic engineering of poly(3-
hydroxyalkanoates): From DNA to plastic. Microbiol Mol Biol R 1999, 63:21-
53.
5. Byrom D: Polymer synthesis by microorganisms - technology and economics.
Trends Biotechnol 1987, 5:246-250.
6. Steinbüchel A, Füchtenbusch B: Bacterial and other biological systems for
polyester production. Trends Biotechnol 1998, 16:419-427.
7. Reddy CSK, Ghai R, Rashmi, Kalia VC: Polyhydroxyalkanoates: an overview.
Bioresource Technol 2003, 87:137-146.
8. Lee SY: E. coli moves into the plastic age. Nat Biotechnol 1997, 15:17-18.
9. Aldor IS, Keasling JD: Process design for microbial plastic factories:
metabolic engineering of polyhydroxyalkanoates. Curr Opin Biotechnol 2003,
14:475-483.
10. Lee SY, Chang HN: Production of poly(hydroxyalkanoic acid). Adv Biochem
Eng Biotechnol 1995, 52:27-58.
11. Lee SY, Lee KM, Chan HN, Steinbuchel A: Comparison of recombinant
Escherichia coli strains for synthesis and accumulation of poly-(3-
hydroxybutyric acid) and morphological changes. Biotechnol Bioeng 1994,
44:1337-1347.

116
12. Choi JI, Lee SY: Process analysis and economic evaluation for poly(3-
hydroxybutyrate) production by fermentation. Bioprocess Eng 1997, 17:335-
342.
13. van Wegen RJ, Ling Y, Middelberg APJ: Industrial production of
polyhydroxyalkanoates using Escherichia coli: An economic analysis. Chem
Eng Res Des 1998, 76:417-426.
14. Castilho LR, Mitchell DA, Freire DM: Production of polyhydroxyalkanoates
(PHAs) from waste materials and by-products by submerged and solid-state
fermentation. Bioresour Technol 2009, 100:5996-6009.
15. Jung IL, Phyo KH, Kim KC, Park HK, Kim IG: Spontaneous liberation of
intracellular polyhydroxybutyrate granules in Escherichia coli. Res Microbiol
2005, 156:865-873.
16. Jacquel N, Lo CW, Wei YH, Wu HS, Wang SS: Isolation and purification of
bacterial poly (3-hydroxyalkanoates). Biochem Eng J 2008, 39:15-27.
17. Yu J, Chen LXL: Cost-effective recovery and purification of
polyhydroxyalkanoates by selective dissolution of cell mass. Biotechnol Progr
2006, 22:547-553.
18. Resch S, Gruber K, Wanner G, Slater S, Dennis D, Lubitz W: Aqueous release
and purification of poly(β-hydroxybutyrate from Escherichia coli. J
Biotechnol 1998, 65:173-182.
19. Pukatzki S, Ma AT, Revel AT, Sturtevant D, Mekalanos JJ: Type VI secretion
system translocates a phage tail spike-like protein into target cells where it
cross-links actin. P Natl Acad Sci USA 2007, 104:15508-15513.
20. Henderson IR, Navarro-Garcia F, Desvaux M, Fernandez RC, Ala'Aldeen D:
Type V protein secretion pathway: the autotransporter story. Microbiol Mol
Biol Rev 2004, 68:692-744.
21. Economou A, Christie PJ, Fernandez RC, Palmer T, Plano GV, Pugsley AP:
Secretion by numbers: protein traffic in prokaryotes. Mol Microbiol 2006,
62:308-319.
22. Desvaux M, Hebraud M, Talon R, Henderson IR: Secretion and subcellular
localizations of bacterial proteins: a semantic awareness issue. Trends
Microbiol 2009, 17:139-145.
23. Choi JH, Lee SY: Secretory and extracellular production of recombinant
proteins using Escherichia coli. Appl Microbiol Biot 2004, 64:625-635.
117
24. Pötter M, Müller H, Reinecke F, Wieczorek R, Fricke F, Bowien B, Friedrich B,
Steinbuchel A: The complex structure of polyhydroxybutyrate (PHB)
granules: four orthologous and paralogous phasins occur in Ralstonia
eutropha. Microbiology+ 2004, 150:3089-3089.
25. York GM, Stubbe J, Sinskey AJ: New insight into the role of the PhaP phasin
of Ralstonia eutropha in promoting synthesis of polyhydroxybutyrate. J
Bacteriol 2001, 183:2394-2397.
26. Maehara A, Ueda S, Nakano H, Yamane T: Analyses of a polyhydroxyalkanoic
acid granule-associated 16-kilodalton protein and its putative regulator in
the pha locus of Paracoccus denitrificans. J Bacteriol 1999, 181:2914-2921.
27. Wieczorek R, Pries A, Steinbuchel A, Mayer F: Analysis of a 24-Kilodalton
protein associated with the polyhydroxyalkanoic acid granules in Alcaligenes
eutrophus. J Bacteriol 1995, 177:2425-2435.
28. Holland IB, Schmitt L, Young J: Type 1 protein secretion in bacteria, the
ABC-transporter dependent pathway (Review). Mol Membr Biol 2005, 22:29-
39.
29. Hinsa SM, Espinosa-Urgel M, Ramos JL, O'Toole GA: Transition from
reversible to irreversible attachment during biofilm formation by
Pseudomonas fluorescens WCS365 requires an ABC transporter and a large
secreted protein. Mol Microbiol 2003, 49:905-918.
30. Sabirova JS, Ferrer M, Lunsdorf H, Wray V, Kalscheuer R, Steinbuchel A,
Timmis KN, Golyshin PN: Mutation in a "tesB-like" hydroxyacyl-coenzyme
A-specific thioesterase gene causes hyperproduction of extracellular
polyhydroxyalkanoates by Alcanivorax borkumensis SK2. J Bacteriol 2006,
188:8452-8459.
31. Prieto MA: From oil to bioplastics, a dream come true? J Bacteriol 2007,
189:289-290.
32. Rapoza MP, Webster RE: The filamentous bacteriophage assembly proteins
require the bacterial SecA protein for correct localization to the membrane. J
Bacteriol 1993, 175:1856-1859.
33. Mergulhao FJ, Summers DK, Monteiro GA: Recombinant protein secretion in
Escherichia coli. Biotechnol Adv 2005, 23:177-202.
34. Lee CC, Wong DWS, Robertson GH: An E. coli expression system for the
extracellular secretion of barley α-amylase. J Protein Chem 2001, 20:233-237.
118
35. Knight TF, Jr.: Idempotent Vector Design for Standard Assembly of
BioBricks [DSpace 2003 http://hdl.handle.net/1721.1/21168.]
36. Phillips IE, Silver PA: A New BioBrick Assembly Strategy Designed for Facile
Protein Engineering. [DSpace 2006 http://hdl.handle.net/1721.1/32535]
37. Anderson JC, Dueber JE, Leguia M, Wu GC, Goler JA, Arkin AP, Keasling JD:
BglBricks: a flexible standard for biological part assembly. J Biol Eng 2010,
4:1.
38. Shokri A, Sanden AM, Larsson G: Cell and process design for targeting of
recombinant protein into the culture medium of Escherichia coli. Appl
Microbiol Biot 2003, 60:654-664.
39. Spiekermann P, Rehm BHA, Kalscheuer R, Baumeister D, Steinbuchel A: A
sensitive, viable-colony staining method using Nile red for direct screening of
bacteria that accumulate polyhydroxyalkanoic acids and other lipid storage
compounds. Arch Microbiol 1999, 171:73-80.
40. Mackman N, Nicaud JM, Gray L, Holland IB: Genetic and functional-
organization of the Escherichia coli hemolysin determinant 2001. Mol Gen
Genet 1985, 201:282-288.
41. Jobling MG, Holmes RK: Construction of vectors with the p15a replicon,
kanamycin resistance, inducible lacZα and pUC18 or pUC19 multiple
cloning sites. Nucleic Acids Res 1990, 18:5315-5316.
42. Registry of Standard Biological Parts [http://partsregistry.org/]
43. Kang Z, Wang Q, Zhang HJ, Qi QS: Construction of a stress-induced system in
Escherichia coli for efficient polyhydroxyalkanoates production. Appl
Microbiol Biot 2008, 79:203-208.
44. Banki MR, Gerngross TU, Wood DW: Novel and economical purification of
recombinant proteins: intein-mediated protein purification using in vivo
polyhydroxybutyrate (PHB) matrix association. Protein Sci 2005, 14:1387-
1395.
45. Kitamura S, Doi Y: Staining method of poly(3-hydroxyalkanoic acids)
producing bacteria by Nile blue. Biotechnol Tech 1994, 8:345-350.
46. Ostle AG, Holt JG: Nile blue A as a fluorescent stain for poly-β-
hydroxybutyrate. Appl Environ Microb 1982, 44:238-241.
119
47. York GM, Junker BH, Stubbe J, Sinskey AJ: Accumulation of the PhaP phasin
of Ralstonia eutropha is dependent on production of polyhydroxybutyrate in
cells. J Bacteriol 2001, 183:4217-4226.
48. Tian J, He A, Lawrence AG, Liu P, Watson N, Sinskey AJ, Stubbe J: Analysis of
transient polyhydroxybutyrate production in Wautersia eutropha H16 by
quantitative Western analysis and transmission electron microscopy. J
Bacteriol 2005, 187:3825-3832.
49. Li SY, Chang BY, Lin SC: Coexpression of TorD enhances the transport of
GFP via the TAT pathway. J Biotechnol 2006, 122:412-421.
120
CHAPTER 6
GENERAL CONCLUSIONS
The overall objective of this research was to use synthetic biological engineering
principles to investigate mechanisms for cellular recovery. GFP, phasin, and PHAs all
served as examples of cellularly manufactured compounds. The aims of this study, as
outlined in the introduction, were all addressed. The research completed provides
significant evidence of BioBrick functionality and secretion of protein.
A library of genetic parts and devices was successfully constructed. This included
signal peptides, GFP, and phasin BioBricks. In total, 58 BioBrick parts and intermediates
were constructed. Additionally, a number of non-BioBrick genetic devices were created
throughout the course of this study using molecular biology techniques.
GFP was expressed and secreted to the extracellular medium of E. coli using
signal peptide HlyA and a type I secretion mechanism. This is of significance as no
previous study has utilized this system to recover GFP. Furthermore, GFP was
translocated to the periplasmic space of E. coli using the TorA and GeneIII signal
peptides. This specific study demonstrated that synthetic biological engineering standards
could be applied to create functional secretion mechanisms.
A consistent and efficient procedure was developed for PHA quantification using
1H NMR. After analyzing various procedures, it was determined that a validated
1H NMR
procedure would be useful in assessing PHA content. This study demonstrated that the 1H
NMR measurements were highly similar to those obtained using a traditional GC method,
but that 1H NMR could be used to elucidate more detailed information about the

121
bioplastic composition. The developed method required fewer extraction steps and could
be used to analyze complex environmental samples. This procedure was subsequently
applied in studies on phasin translocation and PHA production to assess the ability of E.
coli to produce bioplastics.
A number of the constructed BioBricks were used to study phasin translocation.
Although these experiments did not advance as significantly as the GFP translocation
study, significant progress was made toward phasin and PHA recovery. First, XL1-Blue
E. coli were engineered to accumulate 55% of their cell dry weight as PHA. Next,
complex systems were constructed to study PHA secretion, such as the
pBHR68:PhaP1:HlyA plasmid. Lastly, the current results of this study indicate that
phasin is being expressed and is potentially being secreted to the extracellular media.
This foundational work and evidence of BioBrick functionality allows further analysis
and more rigorous testing of these systems. Additionally, all of the individual BioBrick
parts constructed for these studies can be utilized directly by other researchers for
studying secretion and translocation of various proteins.

122
CHAPTER 7
FUTURE DIRECTIONS
This section outlines specific ideas for improving cellular production and
recovery. Efficient systems for optimized recovery would be important in engineering
applications due to the potential beneficial effects on economic viability. There are
several ways that cellular product recovery by secretion can be improved.
The arginine found in the BioFusion ligation scar may be leading to protein
entrapment in the inner membrane. This would likely be a result of the positive charge of
the arginine amino acid. Accordingly, mutation of arginine to a neutral amino acid would
potentially lead to a greater percentage of periplasmic or extracellular protein. Site-
directed mutagenesis could also be used to mutate the start codon in N-terminal fusion
BioBricks to analyze whether higher levels of unfused GFP are observed as a result of
aberrant translation of the start codon furthest from the ribosome binding site. Translation
of unfused GFP may play a role in issues like higher levels of fluorescence observed in
GeneIII:GFPuv than PelB:GFPuv. The second start codon could also be responsible for
the observance of a strong unfused GFP band in cytoplasmic samples where a signal
peptide fusion product should be predominant.
Secretion systems may also be improved through the overexpression of type II
secretion machinery proteins, like TorD and SecYEG. A previous study demonstrated
that TorD overexpression lead to more efficient GFP translocation [1]. The rationale
behind this idea is that overexpression of these proteins leads to more secretion
123
machinery for protein to be transported through. These proteins could be inserted into
BioBrick devices, or, if feasible, can be cotransformed with fusion devices into E. coli.
Further studies could be carried out on the differences in fluorescence activity
between the various signal peptide-GFP fusion constructs. Studies have stated that there
is a fluorescence activity difference between Sec- and TAT-dependent GFP fusions, but
the mechanism by which GFP activity is diminished has not been clearly outlined. It is
possible that Sec-dependent GFP fusions lead to inactive GFP due to binding of Sec
chaperone proteins that inhibit correct folding of GFP. There may also be issues that arise
with GFP folding as a result of signal peptide fusion. For GFP:PhaP1 fusion constructs,
the orientation of the fusion had a significant effect on the observed fluorescence.
Specifically, GFP:PhaP1 fusion protein was fluorescent, whereas the PhaP1:GFP fusion
protein was largely nonfluorescent. This suggests that studies on the crystal structure and
folding of GFP could be worthwhile.
More work is necessary to analyze the PHA/phasin binding interaction. Previous
studies have successfully demonstrated and exploited this interaction for other purposes.
However, it is necessary to ensure that adequate levels of phasin expression and binding
are observed in order for PHA translocation to be possible. This could be analyzed by
TEM to detect a reduction in granule size, 1H NMR quantification to determine whether
phasin expression leads to increased PHA accumulation by maximizing the surface-to-
volume ratio, or fluorescence investigations with constructed GFP-PhaP1 fusion devices.
The binding of phasin to PHA is critical to the success of this project design, and
is also required in order to decrease PHA granule size to a point that is feasible for
membrane translocation. In the type I secretion system, proteins as large as 900 kDa have

124
been successfully secreted. The internal diameter of the HlyA membrane channel is
approximately 3.5 nm. The size of PHA granules would need to be reduced to a size
sufficient for travel through this channel.
BioBricks made for this study could be applied to secretion studies for different
proteins. Product recovery is an important aspect of cellular manufacturing processes, so
applying and optimizing the use of the constructed BioBricks in other systems would be
of significant interest. Additionally, these devices could be moved to other organisms like
Mycobacteria or cyanobacteria and tested for protein recovery [2-3]. As another
alternative, a protein secretion device could be constructed to facilitate even more rapid
analysis of additional proteins. This would entail designing a plasmid that contained a
promoter, ribosome binding site, signal peptide, and terminator. Using specific restriction
enzyme recognition sites, the device could be designed so that restriction enzyme
digestion would create a space that a new protein could be inserted into. Accordingly, the
design of a protein secretion device would reduce the amount of work required to create a
new device to test for protein secretion.
References
1. Li SY, Chang BY, Lin SC: Coexpression of TorD enhances the transport of
GFP via the TAT pathway. J Biotechnol 2006, 122:412-421.
2. Posey JE, Shinnick TM, Quinn FD: Characterization of the twin-arginine
translocase secretion system of Mycobacterium smegmatis. J Bacteriol 2006,
188:1332-1340
3. Chungjatupornchai W, Fa-aroonsawat S: Translocation of green fluorescent
protein to cyanobacterial periplasm using ice nucleation protein. J Microbiol
2009, 47:187-192.

125
APPENDICES
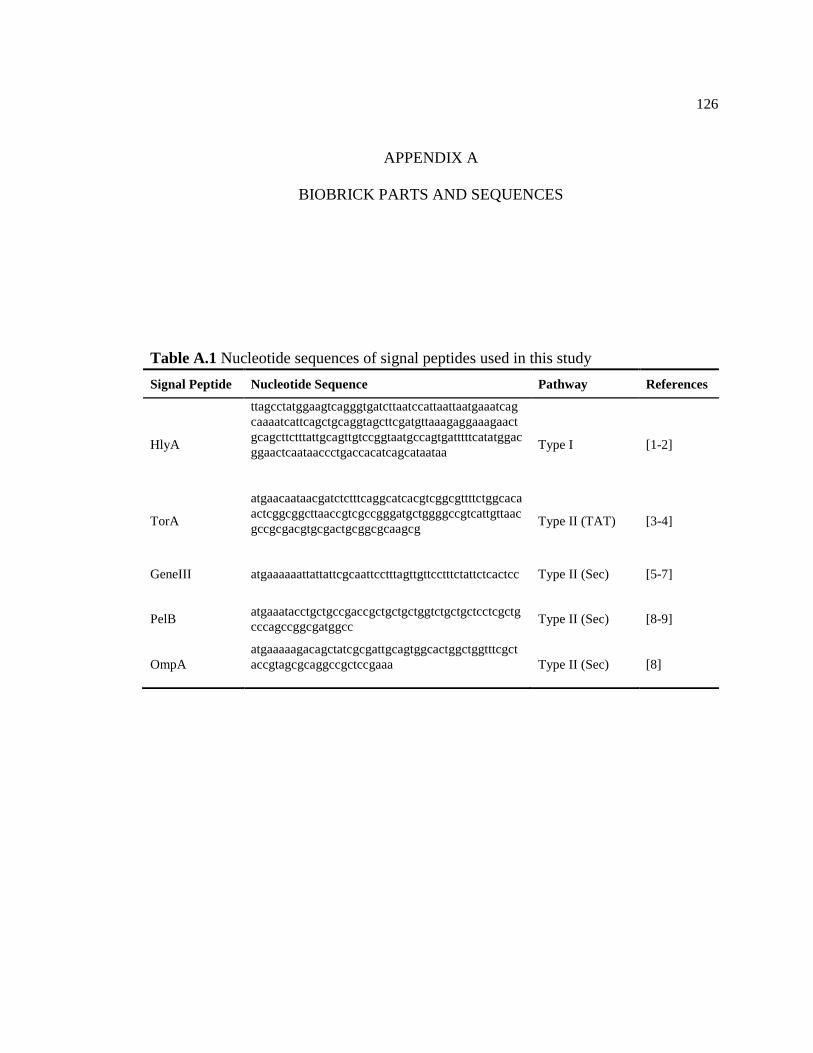
126
APPENDIX A
BIOBRICK PARTS AND SEQUENCES
Table A.1 Nucleotide sequences of signal peptides used in this study
Signal Peptide Nucleotide Sequence Pathway References
HlyA
ttagcctatggaagtcagggtgatcttaatccattaattaatgaaatcag
caaaatcattcagctgcaggtagcttcgatgttaaagaggaaagaact
gcagcttctttattgcagttgtccggtaatgccagtgatttttcatatggac
ggaactcaataaccctgaccacatcagcataataa
Type I [1-2]
TorA
atgaacaataacgatctctttcaggcatcacgtcggcgttttctggcaca
actcggcggcttaaccgtcgccgggatgctggggccgtcattgttaac
gccgcgacgtgcgactgcggcgcaagcg
Type II (TAT) [3-4]
GeneIII atgaaaaaattattattcgcaattcctttagttgttcctttctattctcactcc Type II (Sec) [5-7]
PelB atgaaatacctgctgccgaccgctgctgctggtctgctgctcctcgctg
cccagccggcgatggcc Type II (Sec) [8-9]
OmpA
atgaaaaagacagctatcgcgattgcagtggcactggctggtttcgct
accgtagcgcaggccgctccgaaa
Type II (Sec) [8]

127
Table A.2 Nucleotide sequences of some signal peptides found in E.
coli that were not selected for use in this study [8]
Signal Peptide Nucleotide Sequence Pathway
LamB atgatgattactctgcgcaaacttcctctggcggttgccg
tcgcagcgggcgtaatgtctgctcaggcaatggct Type II (Sec)
Lpp atgaaagctactaaactggtactgggcgcggtaatcctg
ggttctactctgctggcaggt Type II (Sec)
MalE atgaaaataaaaacaggtgcacgcatcctcgcattatcc
gcattaacgacgatgatgttttccgcctcggctctcgcc Type II (Sec)
OmpC atgaaagttaaagtactgtccctcctggtcccagctctgc
tggtagcaggcgcagcaaacgct Type II (Sec)
OmpF atgatgaagcgcaatattctggcagtgatcgtccctgct
ctgttagtagcaggtactgcaaacgct Type II (Sec)
PhoA
atgaaacaaagcactattgcactggcactcttaccgttac
tgtttacccctgtgacaaaagcc
Type II (Sec)
PhoE atgaaaaagagcactctggcattagtggtgatgggcatt
gtggcatctgcatctgtacaggct Type II (Sec)
StII atgaaaaagaatatcgcatttcttcttgcatctatgttcgttt
tttctattgctacaaatgcctatgca Type II (Sec)
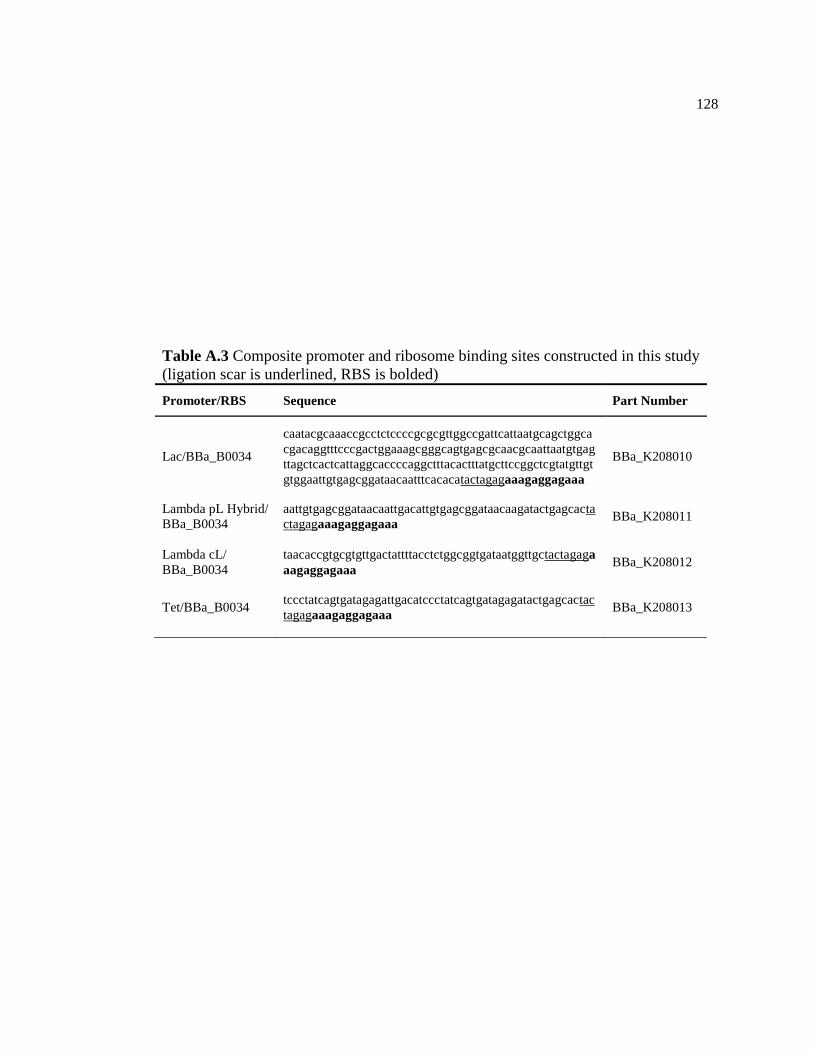
128
Table A.3 Composite promoter and ribosome binding sites constructed in this study
(ligation scar is underlined, RBS is bolded)
Promoter/RBS Sequence Part Number
Lac/BBa_B0034
caatacgcaaaccgcctctccccgcgcgttggccgattcattaatgcagctggca
cgacaggtttcccgactggaaagcgggcagtgagcgcaacgcaattaatgtgag
ttagctcactcattaggcaccccaggctttacactttatgcttccggctcgtatgttgt
gtggaattgtgagcggataacaatttcacacatactagagaaagaggagaaa
BBa_K208010
Lambda pL Hybrid/
BBa_B0034
aattgtgagcggataacaattgacattgtgagcggataacaagatactgagcacta
ctagagaaagaggagaaa BBa_K208011
Lambda cL/
BBa_B0034
taacaccgtgcgtgttgactattttacctctggcggtgataatggttgctactagaga
aagaggagaaa BBa_K208012
Tet/BBa_B0034 tccctatcagtgatagagattgacatccctatcagtgatagagatactgagcactac
tagagaaagaggagaaa BBa_K208013
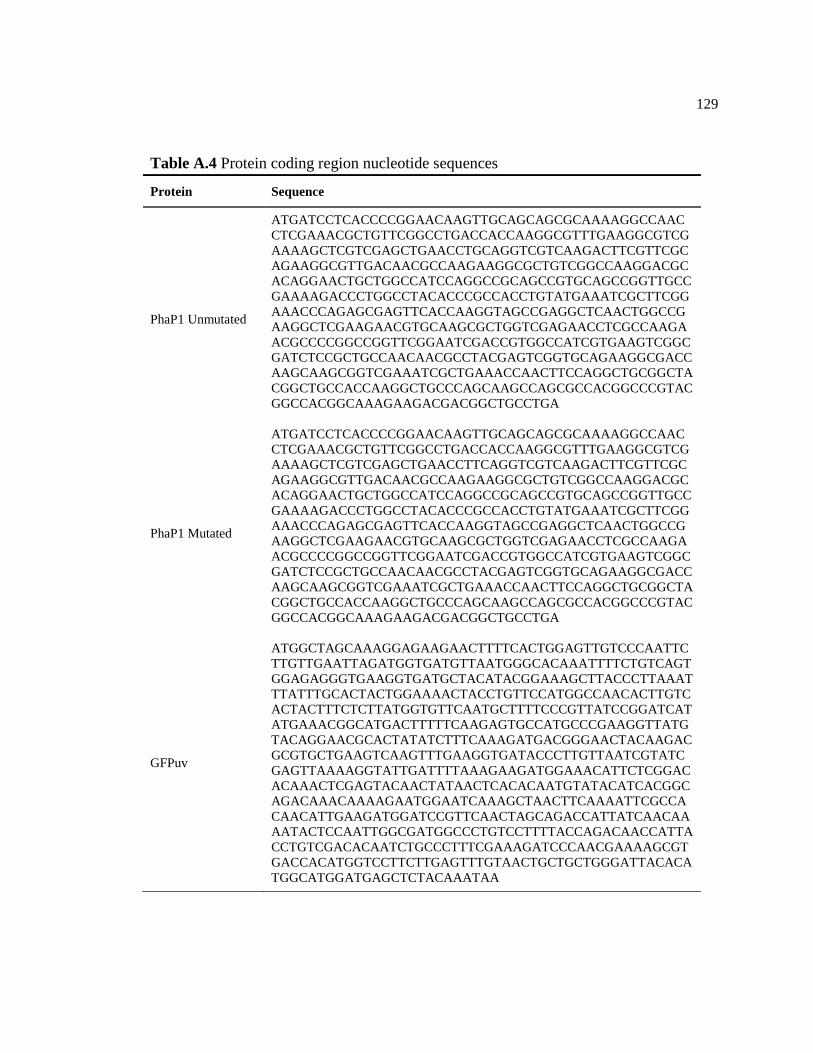
129
Table A.4 Protein coding region nucleotide sequences
Protein Sequence
PhaP1 Unmutated
ATGATCCTCACCCCGGAACAAGTTGCAGCAGCGCAAAAGGCCAAC
CTCGAAACGCTGTTCGGCCTGACCACCAAGGCGTTTGAAGGCGTCG
AAAAGCTCGTCGAGCTGAACCTGCAGGTCGTCAAGACTTCGTTCGC
AGAAGGCGTTGACAACGCCAAGAAGGCGCTGTCGGCCAAGGACGC
ACAGGAACTGCTGGCCATCCAGGCCGCAGCCGTGCAGCCGGTTGCC
GAAAAGACCCTGGCCTACACCCGCCACCTGTATGAAATCGCTTCGG
AAACCCAGAGCGAGTTCACCAAGGTAGCCGAGGCTCAACTGGCCG
AAGGCTCGAAGAACGTGCAAGCGCTGGTCGAGAACCTCGCCAAGA
ACGCCCCGGCCGGTTCGGAATCGACCGTGGCCATCGTGAAGTCGGC
GATCTCCGCTGCCAACAACGCCTACGAGTCGGTGCAGAAGGCGACC
AAGCAAGCGGTCGAAATCGCTGAAACCAACTTCCAGGCTGCGGCTA
CGGCTGCCACCAAGGCTGCCCAGCAAGCCAGCGCCACGGCCCGTAC
GGCCACGGCAAAGAAGACGACGGCTGCCTGA
PhaP1 Mutated
ATGATCCTCACCCCGGAACAAGTTGCAGCAGCGCAAAAGGCCAAC
CTCGAAACGCTGTTCGGCCTGACCACCAAGGCGTTTGAAGGCGTCG
AAAAGCTCGTCGAGCTGAACCTTCAGGTCGTCAAGACTTCGTTCGC
AGAAGGCGTTGACAACGCCAAGAAGGCGCTGTCGGCCAAGGACGC
ACAGGAACTGCTGGCCATCCAGGCCGCAGCCGTGCAGCCGGTTGCC
GAAAAGACCCTGGCCTACACCCGCCACCTGTATGAAATCGCTTCGG
AAACCCAGAGCGAGTTCACCAAGGTAGCCGAGGCTCAACTGGCCG
AAGGCTCGAAGAACGTGCAAGCGCTGGTCGAGAACCTCGCCAAGA
ACGCCCCGGCCGGTTCGGAATCGACCGTGGCCATCGTGAAGTCGGC
GATCTCCGCTGCCAACAACGCCTACGAGTCGGTGCAGAAGGCGACC
AAGCAAGCGGTCGAAATCGCTGAAACCAACTTCCAGGCTGCGGCTA
CGGCTGCCACCAAGGCTGCCCAGCAAGCCAGCGCCACGGCCCGTAC
GGCCACGGCAAAGAAGACGACGGCTGCCTGA
GFPuv
ATGGCTAGCAAAGGAGAAGAACTTTTCACTGGAGTTGTCCCAATTC
TTGTTGAATTAGATGGTGATGTTAATGGGCACAAATTTTCTGTCAGT
GGAGAGGGTGAAGGTGATGCTACATACGGAAAGCTTACCCTTAAAT
TTATTTGCACTACTGGAAAACTACCTGTTCCATGGCCAACACTTGTC
ACTACTTTCTCTTATGGTGTTCAATGCTTTTCCCGTTATCCGGATCAT
ATGAAACGGCATGACTTTTTCAAGAGTGCCATGCCCGAAGGTTATG
TACAGGAACGCACTATATCTTTCAAAGATGACGGGAACTACAAGAC
GCGTGCTGAAGTCAAGTTTGAAGGTGATACCCTTGTTAATCGTATC
GAGTTAAAAGGTATTGATTTTAAAGAAGATGGAAACATTCTCGGAC
ACAAACTCGAGTACAACTATAACTCACACAATGTATACATCACGGC
AGACAAACAAAAGAATGGAATCAAAGCTAACTTCAAAATTCGCCA
CAACATTGAAGATGGATCCGTTCAACTAGCAGACCATTATCAACAA
AATACTCCAATTGGCGATGGCCCTGTCCTTTTACCAGACAACCATTA
CCTGTCGACACAATCTGCCCTTTCGAAAGATCCCAACGAAAAGCGT
GACCACATGGTCCTTCTTGAGTTTGTAACTGCTGCTGGGATTACACA
TGGCATGGATGAGCTCTACAAATAA

130
Table A.5 Total list of individual, intermediate, and complete BioBrick parts
Designation Description and Notes
Individual Parts
PhaP1 (M) Mutated phasin protein from C. necator, BioFusion compatibility, in pSB3K3
GFPuv (G) Cycle-3 GFP mutant, BioFusion compatibility, in pSB1AK3
HlyA (H) HlyA signal peptide, in pSB3K3
TorA (T) TorA signal peptide, in pSB3K3
GeneIII (G3) GeneIII signal peptide, in pSB3K3
PelB (P) PelB signal peptide, in pSB1A2
OmpA (O) OmpA signal peptide, in pSB1A2
Terminator (Te) Double terminator, in pSB1AK3, from BioBrick Registry part BBa_B0015
Silver GFP (S) BioFusion compatible GFP, from BioBrick Registry part BBa_125500
Composite Promoter/RBS
1 Tet Promoter/High efficiency ribosome binding site, parts BBa_R0040 and BBa_B0034, in pSB1AK3
2 Lambda pL Hybrid/ High efficiency RBS, parts BBa_R0011 and BBa_B0034, in pSB1AK3
3 Lambda cL/High efficiency RBS, parts BBa_R0051 and BBa_B0034, in pSB1AK3
4 Lac/ High efficiency RBS, parts BBa_R0010 and BBa_B0034, in pSB1AK3
Intermediate Parts
M/Te PhaP1 with terminator, in pSB1AK3
G/Te GFPuv with terminator, in pSB1AK3
H/Te HlyA signal peptide with terminator, in pSB1AK3
M/H/Te PhaP1 with HlyA signal peptide and terminator, in pSB1AK3
G/H/Te GFPuv with HlyA signal peptide and terminator, in pSB1AK3
T/M/Te TorA signal peptide with PhaP1 and terminator, in pSB1AK3
T/G/Te TorA signal peptide with GFPuv and terminator, in pSB1AK3
G3/M/Te GeneIII signal peptide with PhaP1 and terminator, in pSB1AK3
13
0
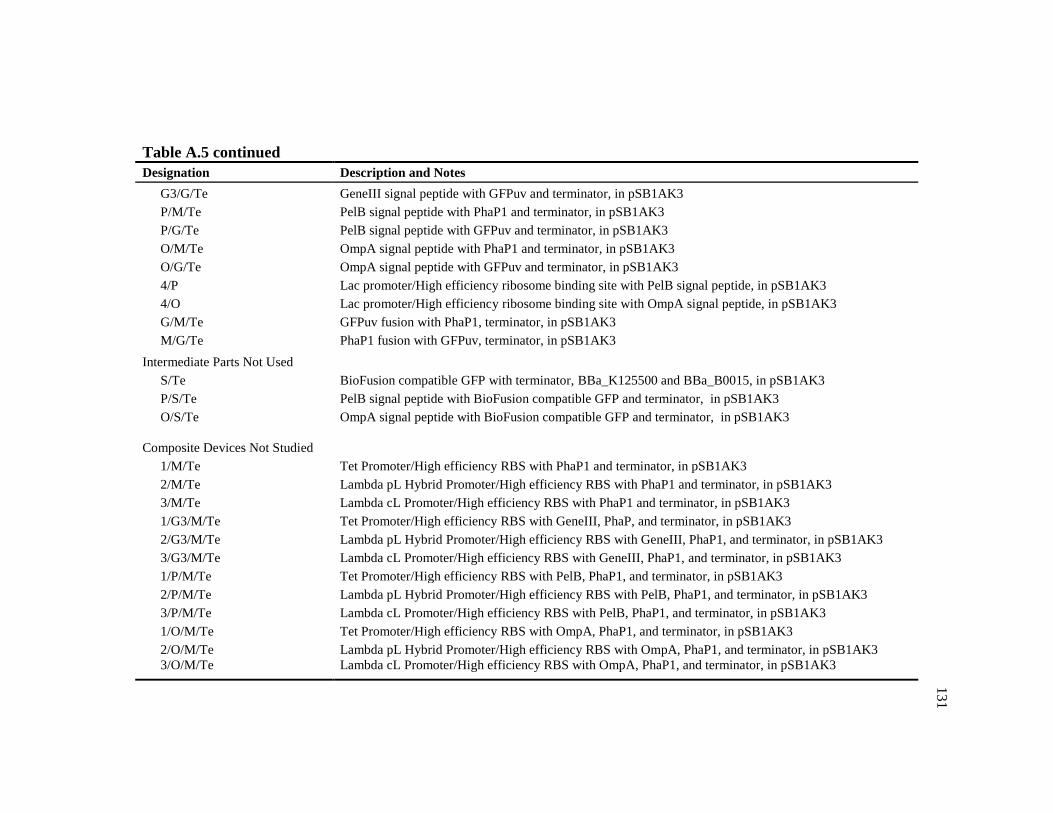
131
Table A.5 continued
Designation Description and Notes
G3/G/Te GeneIII signal peptide with GFPuv and terminator, in pSB1AK3
P/M/Te PelB signal peptide with PhaP1 and terminator, in pSB1AK3
P/G/Te PelB signal peptide with GFPuv and terminator, in pSB1AK3
O/M/Te OmpA signal peptide with PhaP1 and terminator, in pSB1AK3
O/G/Te OmpA signal peptide with GFPuv and terminator, in pSB1AK3
4/P Lac promoter/High efficiency ribosome binding site with PelB signal peptide, in pSB1AK3
4/O Lac promoter/High efficiency ribosome binding site with OmpA signal peptide, in pSB1AK3
G/M/Te GFPuv fusion with PhaP1, terminator, in pSB1AK3
M/G/Te PhaP1 fusion with GFPuv, terminator, in pSB1AK3
Intermediate Parts Not Used
S/Te BioFusion compatible GFP with terminator, BBa_K125500 and BBa_B0015, in pSB1AK3
P/S/Te PelB signal peptide with BioFusion compatible GFP and terminator, in pSB1AK3
O/S/Te OmpA signal peptide with BioFusion compatible GFP and terminator, in pSB1AK3
Composite Devices Not Studied
1/M/Te Tet Promoter/High efficiency RBS with PhaP1 and terminator, in pSB1AK3
2/M/Te Lambda pL Hybrid Promoter/High efficiency RBS with PhaP1 and terminator, in pSB1AK3
3/M/Te Lambda cL Promoter/High efficiency RBS with PhaP1 and terminator, in pSB1AK3
1/G3/M/Te Tet Promoter/High efficiency RBS with GeneIII, PhaP, and terminator, in pSB1AK3
2/G3/M/Te Lambda pL Hybrid Promoter/High efficiency RBS with GeneIII, PhaP1, and terminator, in pSB1AK3
3/G3/M/Te Lambda cL Promoter/High efficiency RBS with GeneIII, PhaP1, and terminator, in pSB1AK3
1/P/M/Te Tet Promoter/High efficiency RBS with PelB, PhaP1, and terminator, in pSB1AK3
2/P/M/Te Lambda pL Hybrid Promoter/High efficiency RBS with PelB, PhaP1, and terminator, in pSB1AK3
3/P/M/Te Lambda cL Promoter/High efficiency RBS with PelB, PhaP1, and terminator, in pSB1AK3
1/O/M/Te Tet Promoter/High efficiency RBS with OmpA, PhaP1, and terminator, in pSB1AK3
2/O/M/Te Lambda pL Hybrid Promoter/High efficiency RBS with OmpA, PhaP1, and terminator, in pSB1AK3
3/O/M/Te Lambda cL Promoter/High efficiency RBS with OmpA, PhaP1, and terminator, in pSB1AK3
13
1
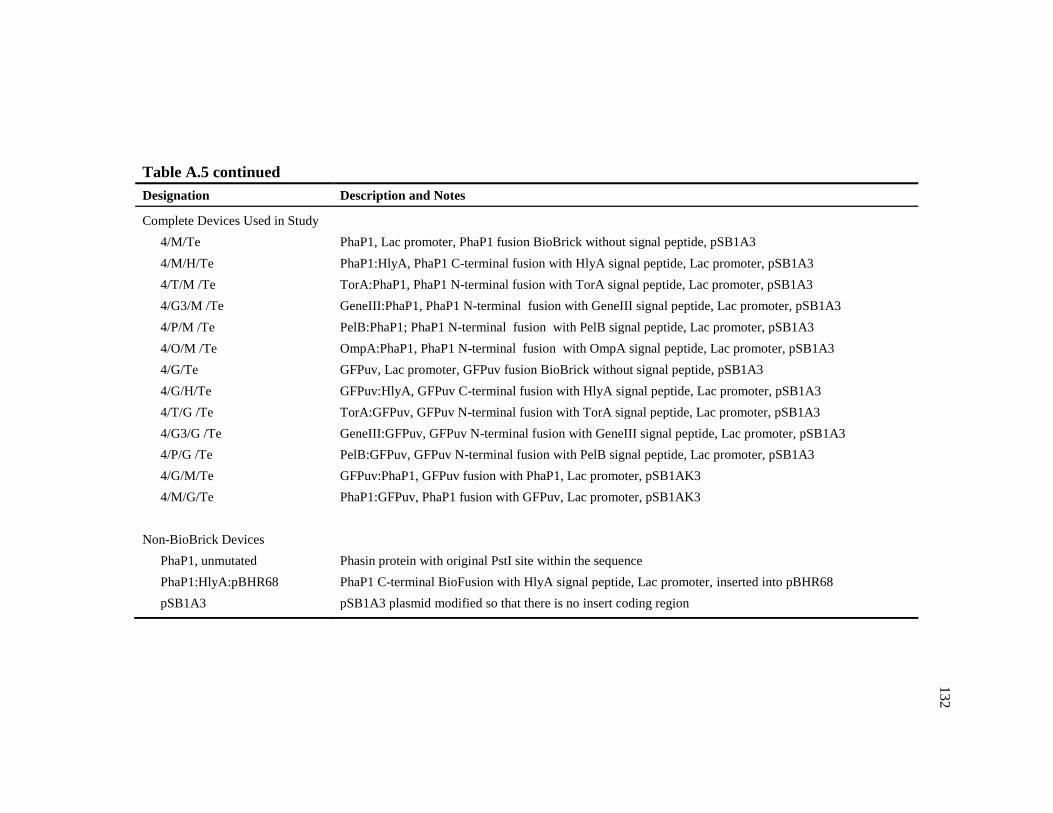
132
Table A.5 continued
Designation Description and Notes
Complete Devices Used in Study
4/M/Te PhaP1, Lac promoter, PhaP1 fusion BioBrick without signal peptide, pSB1A3
4/M/H/Te PhaP1:HlyA, PhaP1 C-terminal fusion with HlyA signal peptide, Lac promoter, pSB1A3
4/T/M /Te TorA:PhaP1, PhaP1 N-terminal fusion with TorA signal peptide, Lac promoter, pSB1A3
4/G3/M /Te GeneIII:PhaP1, PhaP1 N-terminal fusion with GeneIII signal peptide, Lac promoter, pSB1A3
4/P/M /Te PelB:PhaP1; PhaP1 N-terminal fusion with PelB signal peptide, Lac promoter, pSB1A3
4/O/M /Te OmpA:PhaP1, PhaP1 N-terminal fusion with OmpA signal peptide, Lac promoter, pSB1A3
4/G/Te GFPuv, Lac promoter, GFPuv fusion BioBrick without signal peptide, pSB1A3
4/G/H/Te GFPuv:HlyA, GFPuv C-terminal fusion with HlyA signal peptide, Lac promoter, pSB1A3
4/T/G /Te TorA:GFPuv, GFPuv N-terminal fusion with TorA signal peptide, Lac promoter, pSB1A3
4/G3/G /Te GeneIII:GFPuv, GFPuv N-terminal fusion with GeneIII signal peptide, Lac promoter, pSB1A3
4/P/G /Te PelB:GFPuv, GFPuv N-terminal fusion with PelB signal peptide, Lac promoter, pSB1A3
4/G/M/Te GFPuv:PhaP1, GFPuv fusion with PhaP1, Lac promoter, pSB1AK3
4/M/G/Te PhaP1:GFPuv, PhaP1 fusion with GFPuv, Lac promoter, pSB1AK3
Non-BioBrick Devices
PhaP1, unmutated Phasin protein with original PstI site within the sequence
PhaP1:HlyA:pBHR68 PhaP1 C-terminal BioFusion with HlyA signal peptide, Lac promoter, inserted into pBHR68
pSB1A3 pSB1A3 plasmid modified so that there is no insert coding region
132

133
References
1. Hess J, Gentschev I, Goebel W, Jarchau T: Analysis of the hemolysin secretion
system by PhoA-HlyA fusion proteins. Mol Gen Genet 1990, 224:201-208.
2. Kenny B, Taylor S, Holland IB: Identification of individual amino acids
required for secretion within the hemolysin (HlyA) C-terminal targeting
region. Mol Microbiol 1992, 6:1477-1489.
3. Jack RL, Buchanan G, Dubini A, Hatzixanthis K, Palmer T, Sargent F:
Coordinating assembly and export of complex bacterial proteins. Embo J
2004, 23:3962-3972.
4. Buchanan G, Maillard J, Nabuurs SB, Richardson DJ, Palmer T, Sargent F:
Features of a twin-arginine signal peptide required for recognition by a Tat
proofreading chaperone. FEBS Lett 2008, 582:3979-3984.
5. Watson ME: Compilation of published signal sequences. Nucleic Acids Res
1984, 12:5145-5164.
6. Voss SD, DeGrand AM, Romeo GR, Cantley LC, Frangioni JV: An integrated
vector system for cellular studies of phage display-derived peptides. Anal
Biochem 2002, 308:364-372.
7. Lee CC, Wong DWS, Robertson GH: An E. coli expression system for the
extracellular secretion of barley α-amylase. J Protein Chem 2001, 20:233-237.
8. Choi JH, Lee SY: Secretory and extracellular production of recombinant
proteins using Escherichia coli. Appl Microbiol Biot 2004, 64:625-635.
9. Lucic MR, Forbes BE, Grosvenor SE, Carr JM, Wallace JC, Forsberg G:
Secretion in Escherichia coli and phage-display of recombinant insulin-like
growth factor binding protein-2. J Biotechnol 1998, 61:95-108.
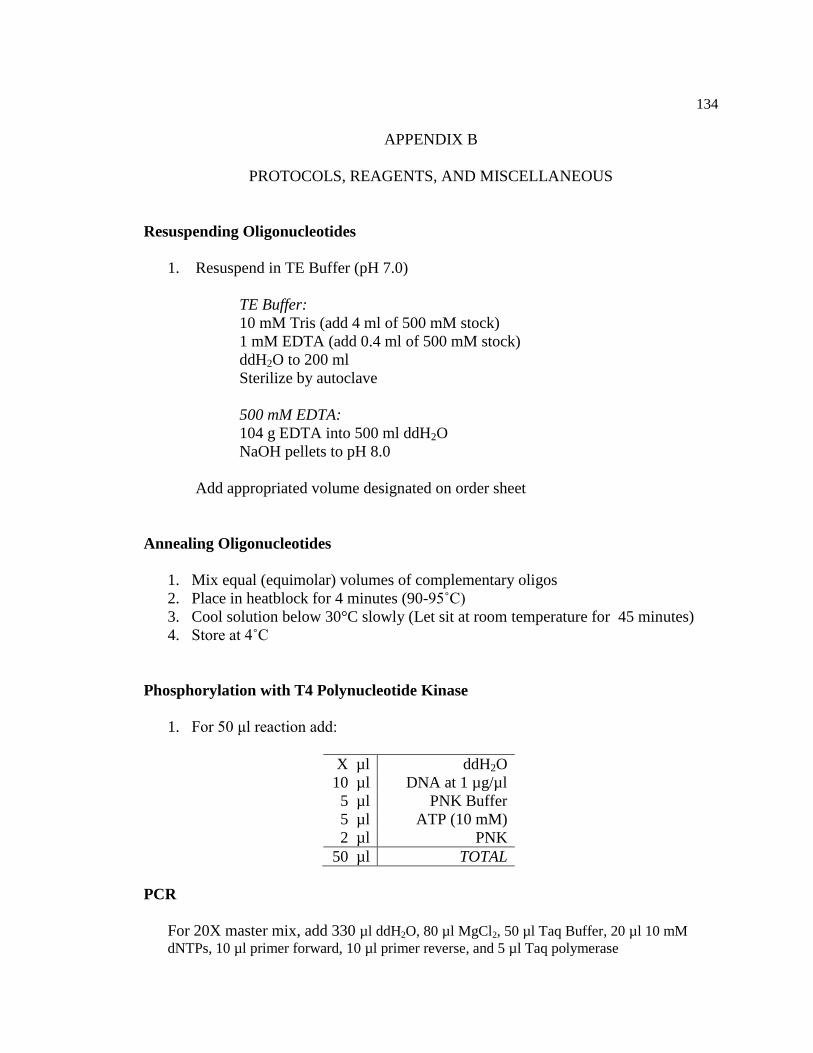
134
APPENDIX B
PROTOCOLS, REAGENTS, AND MISCELLANEOUS
Resuspending Oligonucleotides
1. Resuspend in TE Buffer (pH 7.0)
TE Buffer:
10 mM Tris (add 4 ml of 500 mM stock)
1 mM EDTA (add 0.4 ml of 500 mM stock)
ddH2O to 200 ml
Sterilize by autoclave
500 mM EDTA:
104 g EDTA into 500 ml ddH2O
NaOH pellets to pH 8.0
Add appropriated volume designated on order sheet
Annealing Oligonucleotides
1. Mix equal (equimolar) volumes of complementary oligos
2. Place in heatblock for 4 minutes (90-95˚C)
3. Cool solution below 30°C slowly (Let sit at room temperature for 45 minutes)
4. Store at 4˚C
Phosphorylation with T4 Polynucleotide Kinase
1. For 50 μl reaction add:
X µl ddH2O
10 µl DNA at 1 µg/µl
5 µl PNK Buffer
5 µl ATP (10 mM)
2 µl PNK
50 µl TOTAL
PCR
For 20X master mix, add 330 µl ddH2O, 80 µl MgCl2, 50 µl Taq Buffer, 20 µl 10 mM
dNTPs, 10 µl primer forward, 10 µl primer reverse, and 5 µl Taq polymerase

135
Restriction Enzyme Digestion
1. For 25 μl reaction with Fast Digest Enzymes, add:
19.5 µl DNA sample
2.5 µl Fast Digest Buffer
1.5 µl Enzyme 1
1.5 µl Enzyme 2
20 µl TOTAL
2. Incubate at 37°C for 45-60 minutes in thermocycler
Dephosphorylation using Phosphatases
1. For FastAP: Add less than 10% of total volume
a. Example - 1.5 μl to 20 μl total
2. Incubate for 20 minutes at 37˚C
3. Inactivate for 5 minutes at 75˚C
Electrophoresis
1. Gel Preparation:
a. Weight out agarose
i. For large gel, add 200 ml 1X TAE;
ii. For small gel, add 50 ml 1X TAE .
iii. For 1% gel, add 2 g agarose to large and 0.5 g agarose to small gel.
iv. For 2% gel, add double the agarose.
b. Heat in 20 second increments in microwave until boiling, stir carefully
c. Let cool until comfortable to touch and add 1 μl of EtBR for every 10 μl
of soln.
d. After cooling period, pour into electrophoresis chamber and let solidify
2. Gel Loading:
a. Add 10 μl of DNA ladder (GeneRuler™ DNA Ladder Mix, ready-to-use)
b. Add 6X loading dye (6X = sample volume + X; solve for X)
3. Use Qiagen gel extraction kit to isolate DNA bands
TAE (50X) Buffer:
242 g Tris base to around 600 ml
57.1 ml glacial acetic acid (1 mole)
100 ml 0.5 M EDTA (pH 8.0)
ddH2O to 1000 ml
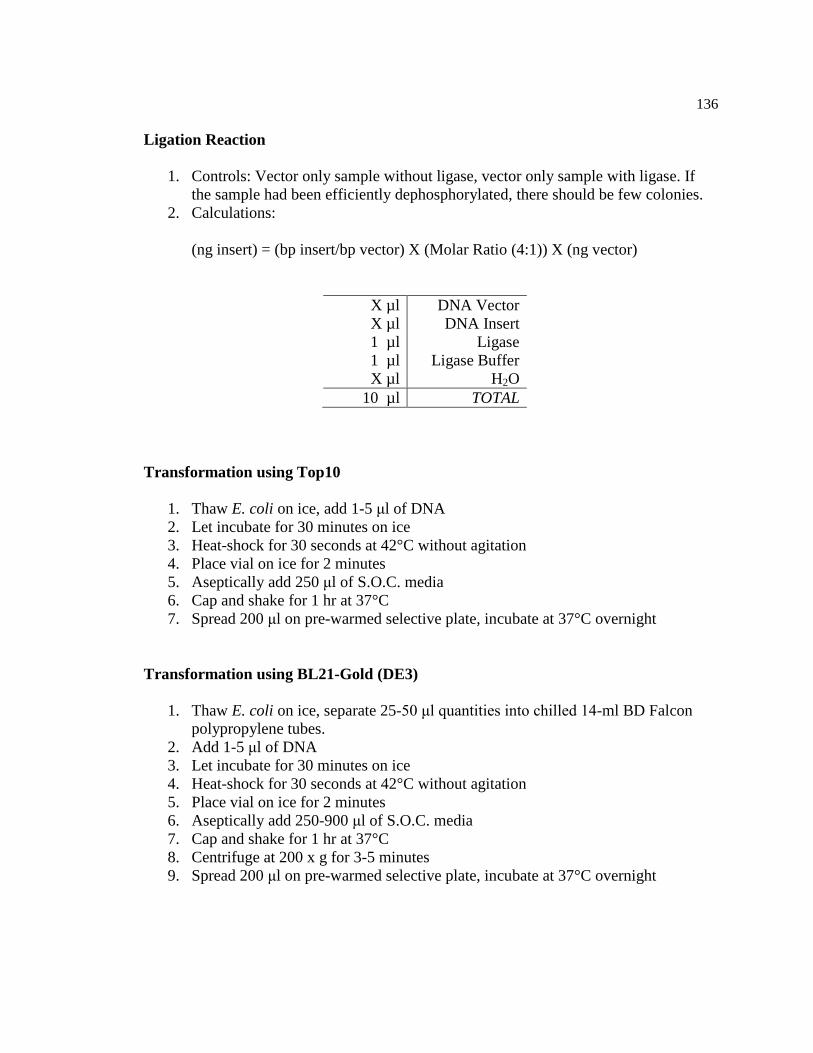
136
Ligation Reaction
1. Controls: Vector only sample without ligase, vector only sample with ligase. If
the sample had been efficiently dephosphorylated, there should be few colonies.
2. Calculations:
(ng insert) = (bp insert/bp vector) X (Molar Ratio (4:1)) X (ng vector)
X µl DNA Vector
X µl DNA Insert
1 µl Ligase
1 µl Ligase Buffer
X µl H2O
10 µl TOTAL
Transformation using Top10
1. Thaw E. coli on ice, add 1-5 μl of DNA
2. Let incubate for 30 minutes on ice
3. Heat-shock for 30 seconds at 42°C without agitation
4. Place vial on ice for 2 minutes
5. Aseptically add 250 μl of S.O.C. media
6. Cap and shake for 1 hr at 37°C
7. Spread 200 μl on pre-warmed selective plate, incubate at 37°C overnight
Transformation using BL21-Gold (DE3)
1. Thaw E. coli on ice, separate 25-50 μl quantities into chilled 14-ml BD Falcon
polypropylene tubes.
2. Add 1-5 μl of DNA
3. Let incubate for 30 minutes on ice
4. Heat-shock for 30 seconds at 42°C without agitation
5. Place vial on ice for 2 minutes
6. Aseptically add 250-900 μl of S.O.C. media
7. Cap and shake for 1 hr at 37°C
8. Centrifuge at 200 x g for 3-5 minutes
9. Spread 200 μl on pre-warmed selective plate, incubate at 37°C overnight
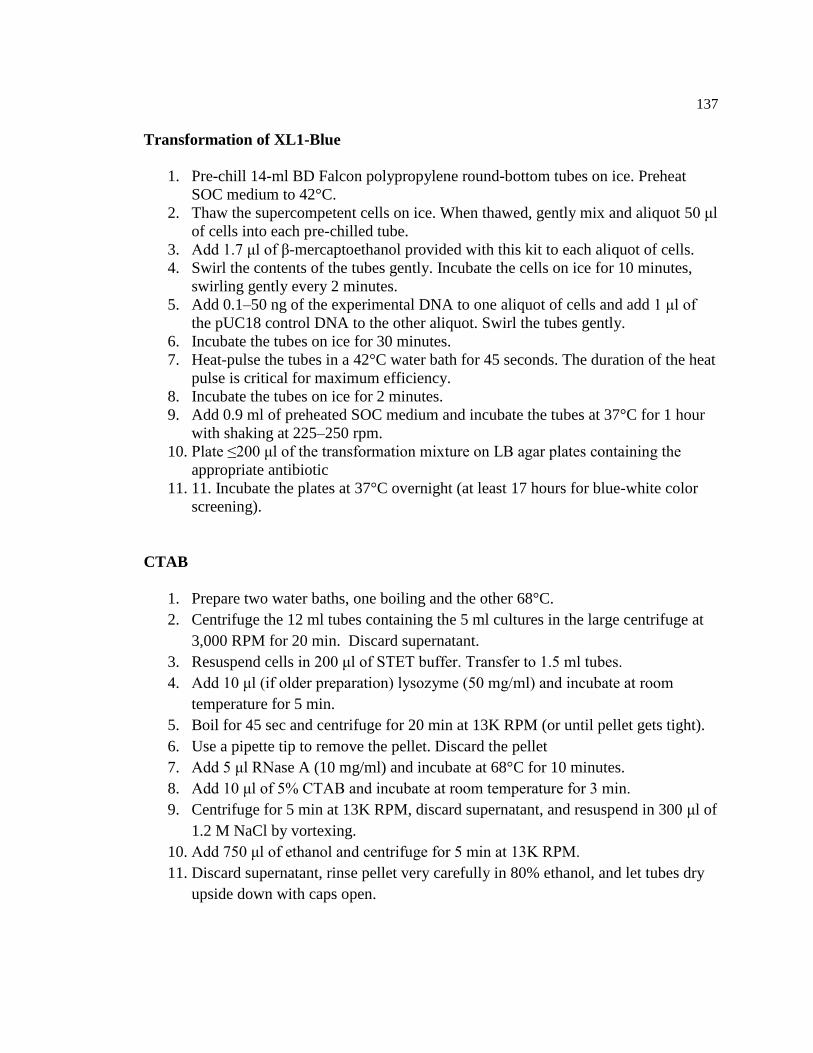
137
Transformation of XL1-Blue
1. Pre-chill 14-ml BD Falcon polypropylene round-bottom tubes on ice. Preheat
SOC medium to 42°C.
2. Thaw the supercompetent cells on ice. When thawed, gently mix and aliquot 50 μl
of cells into each pre-chilled tube.
3. Add 1.7 μl of β-mercaptoethanol provided with this kit to each aliquot of cells.
4. Swirl the contents of the tubes gently. Incubate the cells on ice for 10 minutes,
swirling gently every 2 minutes.
5. Add 0.1–50 ng of the experimental DNA to one aliquot of cells and add 1 μl of
the pUC18 control DNA to the other aliquot. Swirl the tubes gently.
6. Incubate the tubes on ice for 30 minutes.
7. Heat-pulse the tubes in a 42°C water bath for 45 seconds. The duration of the heat
pulse is critical for maximum efficiency.
8. Incubate the tubes on ice for 2 minutes.
9. Add 0.9 ml of preheated SOC medium and incubate the tubes at 37°C for 1 hour
with shaking at 225–250 rpm.
10. Plate ≤200 μl of the transformation mixture on LB agar plates containing the
appropriate antibiotic
11. 11. Incubate the plates at 37°C overnight (at least 17 hours for blue-white color
screening).
CTAB
1. Prepare two water baths, one boiling and the other 68°C.
2. Centrifuge the 12 ml tubes containing the 5 ml cultures in the large centrifuge at
3,000 RPM for 20 min. Discard supernatant.
3. Resuspend cells in 200 μl of STET buffer. Transfer to 1.5 ml tubes.
4. Add 10 μl (if older preparation) lysozyme (50 mg/ml) and incubate at room
temperature for 5 min.
5. Boil for 45 sec and centrifuge for 20 min at 13K RPM (or until pellet gets tight).
6. Use a pipette tip to remove the pellet. Discard the pellet
7. Add 5 μl RNase A (10 mg/ml) and incubate at 68°C for 10 minutes.
8. Add 10 μl of 5% CTAB and incubate at room temperature for 3 min.
9. Centrifuge for 5 min at 13K RPM, discard supernatant, and resuspend in 300 μl of
1.2 M NaCl by vortexing.
10. Add 750 μl of ethanol and centrifuge for 5 min at 13K RPM.
11. Discard supernatant, rinse pellet very carefully in 80% ethanol, and let tubes dry
upside down with caps open.
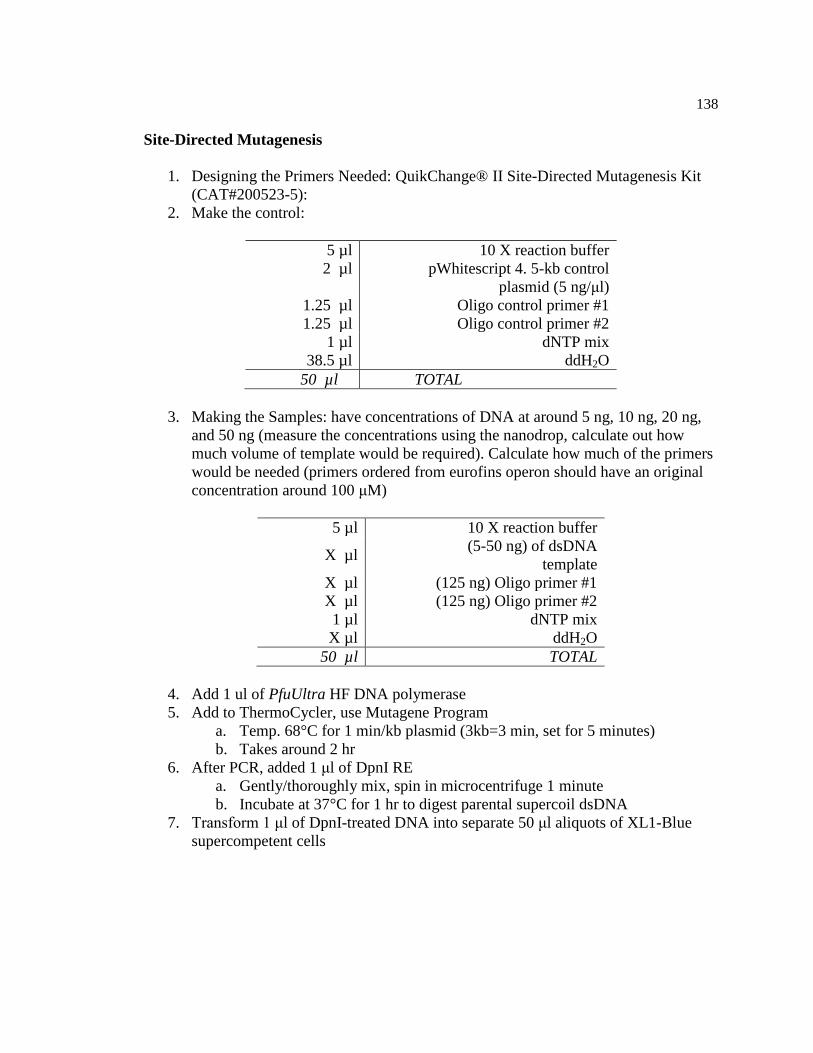
138
Site-Directed Mutagenesis
1. Designing the Primers Needed: QuikChange® II Site-Directed Mutagenesis Kit
(CAT#200523-5):
2. Make the control:
5 µl 10 X reaction buffer
2 µl pWhitescript 4. 5-kb control
plasmid (5 ng/μl)
1.25 µl Oligo control primer #1
1.25 µl Oligo control primer #2
1 µl dNTP mix
38.5 µl ddH2O
50 µl TOTAL
3. Making the Samples: have concentrations of DNA at around 5 ng, 10 ng, 20 ng,
and 50 ng (measure the concentrations using the nanodrop, calculate out how
much volume of template would be required). Calculate how much of the primers
would be needed (primers ordered from eurofins operon should have an original
concentration around 100 μM)
5 µl 10 X reaction buffer
X µl (5-50 ng) of dsDNA
template
X µl (125 ng) Oligo primer #1
X µl (125 ng) Oligo primer #2
1 µl dNTP mix
X µl ddH2O
50 µl TOTAL
4. Add 1 ul of PfuUltra HF DNA polymerase
5. Add to ThermoCycler, use Mutagene Program
a. Temp. 68°C for 1 min/kb plasmid (3kb=3 min, set for 5 minutes)
b. Takes around 2 hr
6. After PCR, added 1 μl of DpnI RE
a. Gently/thoroughly mix, spin in microcentrifuge 1 minute
b. Incubate at 37°C for 1 hr to digest parental supercoil dsDNA
7. Transform 1 μl of DpnI-treated DNA into separate 50 μl aliquots of XL1-Blue
supercompetent cells

139
Cellular Fractionation
Overall
a. Grow two 100 ml flasks of E. coli for each sample (14 vials total) until
they reach OD 1.0-1.5
b. Mix the two flasks that should both be nearly identical in OD
c. Separate each flask of about 200 ml into 3-50 ml centrifuge tube (whole
cells, protocol 1, and protocol 2)
d. Centrifuge at 3500 x g for 15-30 min
e. Save 100 ml of supernatant to concentrate and analyze
f. Follow procedure 1 and 2
1. Chloroform Method
a. Wash the cells in 10 mL of 10 mM Tris-HCl, pH 8.0 buffer
b. Centrifuge again
c. Suspend pellet in smallest possible volume of 10 mM Tris-HCl buffer (do
250 μl for 50 ml of culture)
d. Add ice cold chloroform per OD600 of 1.0 gradually while swirling (add 20
ul or 10 μl, about 2 drops)
e. Mix suspension and incubate at room temp for 15 min.
f. Add 800 μl of 10 mM Tris-HCl, pH 8.0, mix and centrifuge at 10000 x g
for 10 min
g. Recover supernatant using Pasteur pipette without disturbing shocked cell
pellet and put fluid in test tube and place in ice
h. Suspend shocked cells in 1 mL of 10 mM Tris-HCl, pH 8.0
i. Add 1 μl of 0.1 M EDTA, pH 8.0 and 40 μL of lysozyme solution (50 mg
per ml solution)
j. Mix and incubate cells for 1 hr at room temp
k. Add 10 μl of 0.1 M PMSF (dissolve 0.1742 g into 10 ml of 100%
isopropanol). This step is necessary when using an E. coli strain
containing proteases
l. Sonicate for 15 seconds
m. Centrifuge at 10000 x g for 10 min, recover supernatant
2. Lysozyme/EDTA Method
a. Resuspend pellet in 0.5 ml of periplasting buffer (20% sucrose, 1 mM
EDTA, 30000 units/ml lysozyme)
b. Incubate on ice for 5 minutes (in the 50 ml centrifuge tube)
c. Add 0.5 ml of cold, pure water and mix, move to microcentrifuge tube
d. Incubate on ice for 5 min
140
e. Centrifuge at 12000 x g for 2 min to remove spheroplasts
f. Save supernatant
g. Add 0.5 ml purified water to cytoplasmic fraction and let sit for 5 min at
RT to make spheroplasts swell
h. Sonicate in bursts to dissociate proteins
i. Centrifuge at 12000 x g for 2 min, collect supernatant
j. Add 0.5 ml of purified water and sonicate again
k. Centrifuge at 12000 x g and collect supernatant (pool with other
supernatant)
For 1 ml of periplasting buffer:
588 μl of 34% (1 M) Sucrose
2 μl of 500 mM EDTA
12 μl of 50 mg/ml lysozyme solution
398 μl ddH2O
Alkaline Phosphatase Assay
1. Prepare at 37°C in glass tube in order:
a. 0.5M Tris-HCl, pH 9.0 0.26 mL
b. Sample 0.05 mL to 1.0 mL***
c. Water Bring volume to 1.5 mL total
d. 0.1M ρ-nitrophenylphosphate 0.26 mL
2. Sample: cytoplasmic –0.05 to 0.26 ml; periplasmic – requires 0.05 to 1.0 ml
3. Prepare a water control; incubate at 27°C until color formed (15-30 min), record
assay time, stop reaction by adding 1.0 mL of 2 M sodium carbonate
4. For 96-well plates: 42 μl 0.5 M Tris, 20-50 μl sample (about 20 μl for cytoplasm,
50 μl or periplasm, 35 μl for membrane fraction), 40 μl 5 mM PNPP, water to 200
μl, 40 μl of 2 M sodium carbonate.
β-galactosidase Assay
1. Prepare at 37°C in glass tube in order
a. 0.1M Na phosphate buffer, pH 7.5 0.9 mL
b. Sample 0.06 – 0.3 mL ***
c. Water Bring volume of 1.5 mL
d. 5 mM ONPG 1.5 mL
2. As a guideline use 0.1 mL for the cytoplasmic fraction and 0.5 mL fro the
cytoplasmic fraction. However, if the color formation is inadequate or too intense,
repeat the assay after making adjustments in the amounts or dilutions of the
samples. A410 values between 0.05 and 0.5 are optimal.

141
3. Prepare a control with water as sample. The addition of ONPG starts the reaction.
Incubate the reaction for 10 min (or longer if required at room temperature. Stop
the reaction with 1.0 mL of 2 M sodium carbonate. Read the A410 values.
4. For 96-well plates: 90 μl 0.1 M Na phosphate, 1-5 μl sample (about 2 μl for
cytoplasm, 5 μl or periplasm, 4 μl for membrane fraction), 20 μl 5 mM ONPG,
water to 200 μl, 50 μl of 2 M sodium carbonate.
SDS-PAGE and Western Blotting
5X SDS-PAGE Tank Buffer
30.28 g Tris
144.13 g Glycine
10 g SDS (or 10 ml 10% SDS)
ddH2O to 2L total volume
Transfer Buffer
3.03 g Tris
14.4 g Glycine
200 ml Methanol
ddH2O to 1 L
5X TBST Stock
25 ml of 2 M Tris (pH 8.0)
300 ml of 2.5 M NaCl
2.5 ml of Tween-20
ddH2O to 1 L
1. SDS-PAGE
a. Aliquot duplicate samples into 0.5 ml centrifuge tubes so that each
contains around 40 μg of protein
b. Add 3X Protein Loading Buffer
c. Heat sample for 1 minute at 90-100°C
d. Prepare gel by removing from package, breaking off the bottom piece with
pliers, rinse the wells with 1 X SDS Tank buffer, and attach the gel to the
electrophoresis unit
e. Load gels in duplicate and run at 35 mAmps/gel until molecular weight
marker reaches the bottom of the gel apparatus
i. Maximum well volume is 50 μl
f. Stain one gel using Coomassie Brilliant Blue for 15-45 minutes,
depending on age of the solution
g. Destain gel using destain solution and kimwipes to absorb excess dye.
This process takes several hours.
2. Transfer to PVDF Membrane
142
a. Place duplicate gel in dish containing transfer buffer and soak for 10
minutes
b. Cut 4 large and 4 small pieces of Whatman paper and soak in transfer
buffer
c. Cut 1 piece of PVDF membrane, soak in Methanol for 30 seconds,
followed by soaking in transfer buffer for 3-5 minutes
d. Arrange Trans-Blot Electrophoretic cell from anode (red-positive) to
cathode (black-negative):
i. Blot pad
ii. 4 large pieces of Whatman
iii. PVDF membrane
iv. Gel
v. 4 small pieces of Whatman (ensure that these pieces are only in
contact with the gel and not with the PVDF membrane or large
Whatman pieces
vi. Blot pad
e. Ensure that there are no air bubbles and that the membrane does not dry
f. Run at 20-40 V/cell for about 1 hr.
g. Carefully check to ensure transfer of prestain markers to PVDF membrane
i. Do not move the gel or membrane in case the transfer is
incomplete
3. Western Blotting
a. Block PVDF membrane in TBST 5% milk for 2-3 hours at room
temperature
i. Put membrane paper into small Tupperware, add 5% TBST milk
solution, and shake. Do not let the membrane paper dry out
b. Incubate with primary antibody in TBST 0.5% milk overnight at 4°C
i. Move shaker to refrigerated room
ii. Add the smallest volume of primary antibody solution possible
c. Wash thoroughly with TBST 0.5% milk at least 3 times
d. Incubate with secondary antibody in TBST 0.5% milk for 1-2 hours at
room temperature
e. Wash thoroughly with TBST 0.5% milk
f. Wash thoroughly with TBST
g. Drain blot
h. Apply small amount of TMB substrate
i. Add water to stop reaction once bands are visible
j. Take pictures and do densitometric analysis immediately
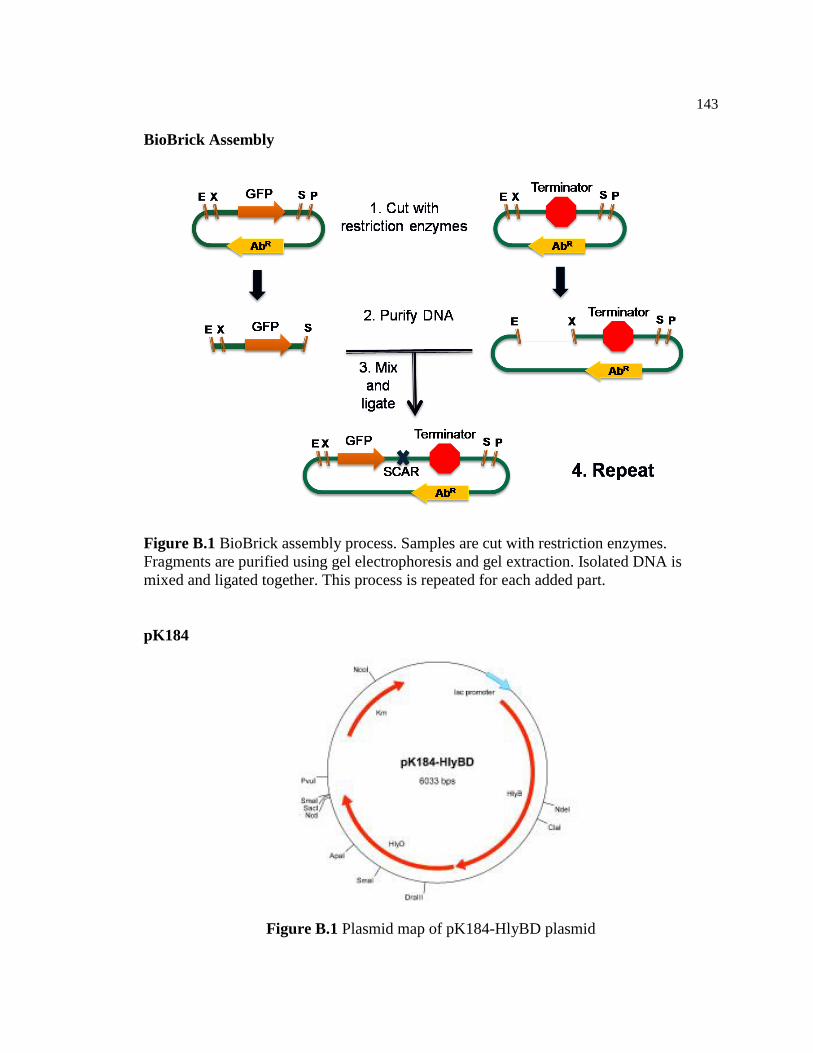
143
BioBrick Assembly
Figure B.1 BioBrick assembly process. Samples are cut with restriction enzymes.
Fragments are purified using gel electrophoresis and gel extraction. Isolated DNA is
mixed and ligated together. This process is repeated for each added part.
pK184
Figure B.1 Plasmid map of pK184-HlyBD plasmid
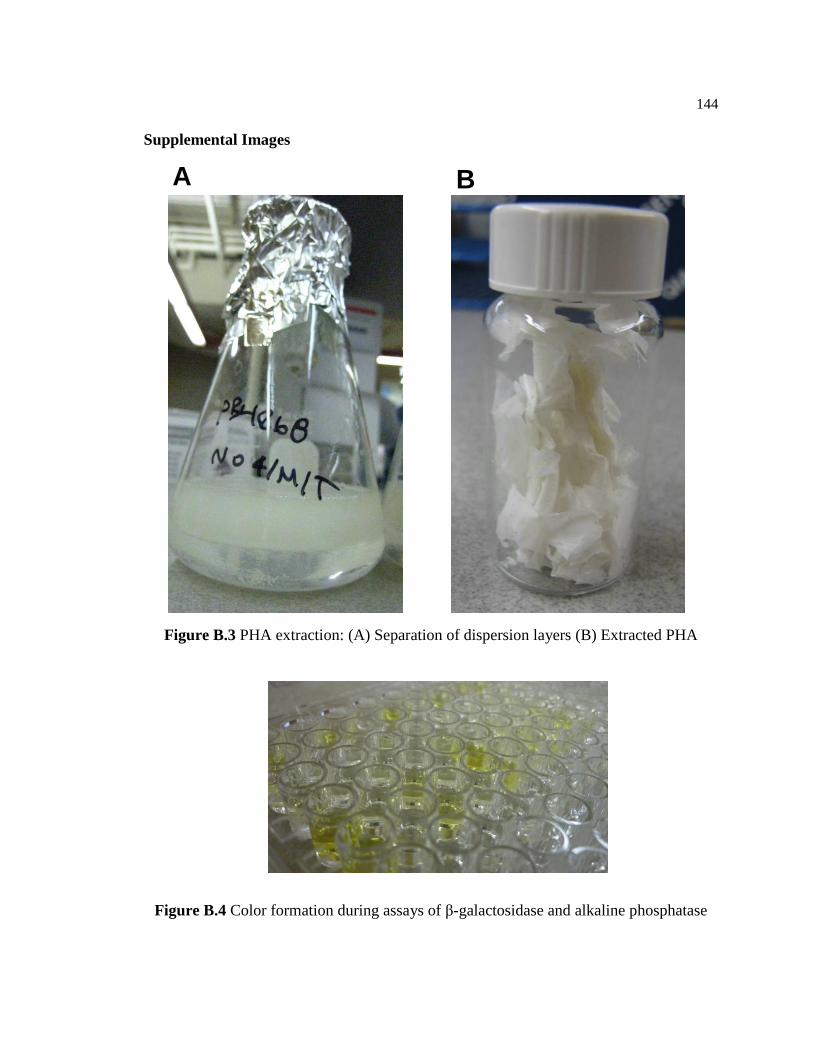
144
Supplemental Images
Figure B.3 PHA extraction: (A) Separation of dispersion layers (B) Extracted PHA
Figure B.4 Color formation during assays of β-galactosidase and alkaline phosphatase
A B

145
Figure B.5 Membrane fraction pellet after ultracentrifugation
Figure B.6 Setup for transfer of protein to PVDF membrane
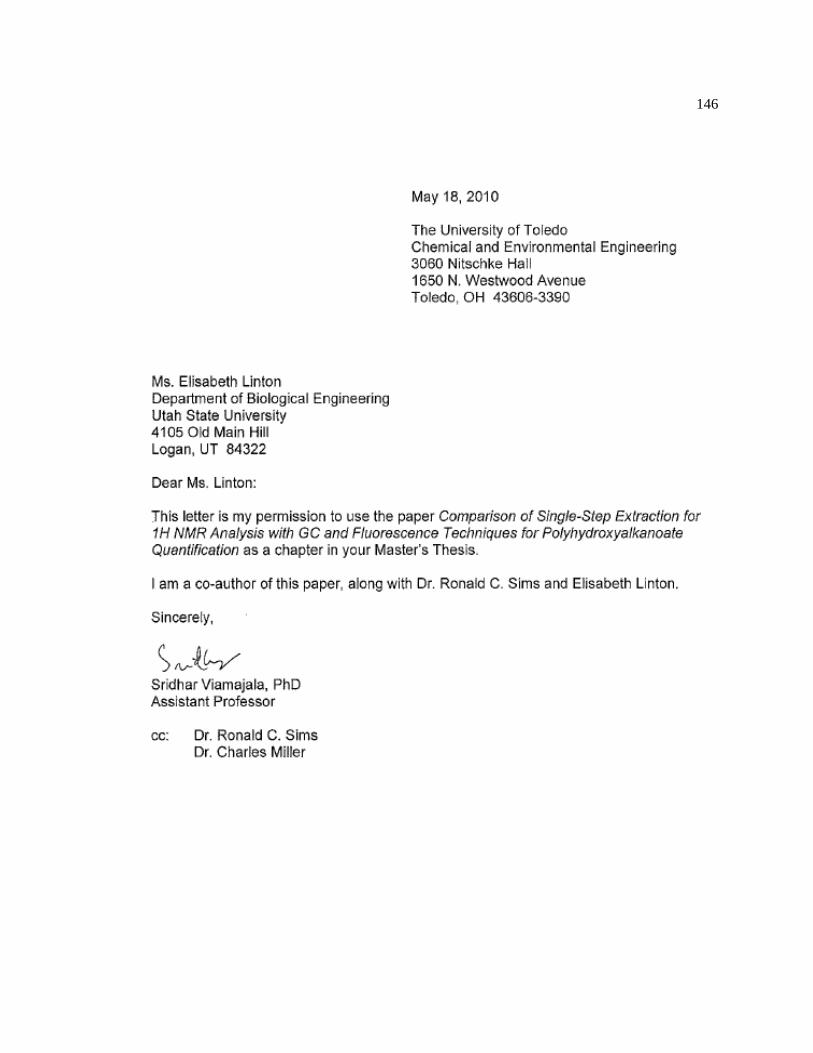
146