a synchronized mobile and web information system …
TRANSCRIPT

i
A SYNCHRONIZED MOBILE AND WEB INFORMATION SYSTEM FOR CROP
DISEASES
CHIKARA HAZEL T (R122145Z)

ii
A SYNCHRONIZED MOBILE AND WEB INFORMATION SYSTEM FOR CROP
DISEASES
By
Chikara Hazel T (R122145Z)
Submitted in partial fulfilment of the requirements for the degree of
BSc Honours Information Systems
Department of Computer Science and Information Systems
in the
Faculty of Science and Technology
at the
Midlands State University
Gweru
November 2017
Supervisor: Mr M. Giyane

i
ABSTRACT
Zimbabwe as an agro economic country focuses immensely on the profit from farming. The
government has been investing heavily on the inputs that help make farming easy. The major
reason for developing such a system is to impact expert information to farmers at a click of a
button.. This document consists of the development of a software system that gives farmers
expert information. This system is an easy to use intelligent system that captures the crop disease
and give information about that crop and treatment recommendations of that crop. The system
development went through phases where there was an introductory phase. This phase consists a
background of past information defining a problem that rose for the system to be justified on
development. There is aspersion of objectives and the aim of the project. Thereafter, a feasibility
study which looks deeply in the question, “can this be done?” There is a deep investigation on
the technical, social and financial reasons that determines the development of this software a go.
After a feasibility study, an analysis is done, verifying the benefit and constraints that were and
are there that justifies why there is need to develop a new system. It flags out the shortcomings
of the existing system and poses the cheapest way to meet requirement. Thereafter, the actual
logical design of the system is done, inputting the unified modelling language diagrams that
gives a conceptual feel of the system. The system is then actually done in the implementation
phase and results are made. The system then goes through a lot of testing, among them are
system testing, defect testing etc. A deployment strategy is emanated that will ensure acceptance
as well as full exploitation of the system. This is where there is verification of which changeover
strategy should be implemented. For the product to be of a consistent flair, it needs to be
monitored and evaluated. Maintenance, monitoring and evaluation of the system is also done
flagging the preventative methods and reactive methods. From there, recommendations are
passed to the users on how to ensure an optimised use of the system. The farmers were
recommended to update their database since new information will continually be added. The
researchers were urged to train the bot for better precision. The administrators were
recommended to allow further developments and maintain the system. All stakeholders were
recommended to have first read the user manual to familiarize themselves with the system.
ii
DECLARATION
I, Chikara Hazel T, hereby declare that I am the sole author of this dissertation. I authorise the
Midlands State University to lend this dissertation to other institutions or individuals for the
purpose of scholarly research.
Signature: ……………………………………………. Date: ………………………………..

iii
APPROVAL
This dissertation, entitled “A synchronised mobile and web information system crop
diseases” by Chikara Hazel T meets the regulations governing the award of the degree of BSc
Honours Information Systems of the Midlands State University, and is approved for its
contribution to knowledge and literary presentation.
Supervisor’s Signature: ……………………………………………….
Date: …………………………………………………………………..

iv
ACKNOWLEDGEMENTS
This project was done successfully because of a number of things and supportive people that
were encouraging me throughout the development of the program. I would like to express
uttermost gratitude to The Division of Research and Specialists Services for allowing me to use
their organisation as the research organisation, it is not easy to trust anyone with company
information. I would also like to thank Takudzwa Kain Mawarire for helping me discover the
wonders of Azure and its competitive APIs and senior engineer, T.I Magwaza for reinsuring me
that wherever there is a will they is obstinately a way when I thought I would not be able to
finish school. A special thanks goes to my supervisor, Mr M. Giyane for being patient with a
hard head like me, he sacrificed a lot of time and excercised a lot of patience. I am in full salute
of all the members under the faculty of Science and Technology at Midlands State University for
their undoubted trust in my capabilities. Another hand of gratitude is extended to my parents and
friends who helped to see this project to go through. Lastly, and certainly not the least, I would
like to thank the Almighty for being a sovereign God, He gave me peace and comfort when l was
facing obstacles during the augmentation and life in general.
May the good Lord bless everyone who helped this concept materialise into reality.
v
DEDICATION
This work is dedicated to my friends, family, Itai and Takudzwa for their abundant time they
help facilitate this project into life. Another special dedication is extended to The Division of
Research and Specialists Services for their acceptance for me to develop a system for their
organisation.

vi
Contents
ABSTRACT............................................................................................................................... i
DECLARATION ...................................................................................................................... ii
APPROVAL ............................................................................................................................ iii
ACKNOWLEDGEMENTS .................................................................................................... iv
DEDICATION ..........................................................................................................................v
LIST OF ACRONYMS .............................................................................................................x
LIST OF FIGURES ................................................................................................................ xi
LIST OF TABLES .................................................................................................................xiv
LIST OF APPENDICES ......................................................................................................... xv
CHAPTER ONE: INTRODUCTION PHASE.........................................................................1
1.1 Introduction .......................................................................................................................1
1.1.1 Background Information ..............................................................................................1
1.2.2 Organisational structure ...............................................................................................2
1.2.3 Vision .........................................................................................................................3
1.2.4 Mission .......................................................................................................................3
1.4 Research Aim ....................................................................................................................4
1.5 Objectives ..........................................................................................................................4
1.6 Justification .......................................................................................................................6
1.7 Conclusion .........................................................................................................................7
CHAPTER TWO: PLANNING PHASE ..................................................................................8
2.1. Introduction ......................................................................................................................8
2.2 Business Values .................................................................................................................8
2.3 Feasibility Study ................................................................................................................9
2.3.1 Technical Feasibility ................................................................................................. 10
2.3.2 Economic Feasibility ................................................................................................. 12
2.3.3 Social Feasibility ....................................................................................................... 19
2.3.4 Operational Feasibility .............................................................................................. 19
vii
2.4 Risk Analysis ................................................................................................................... 20
2.4.1 Technical Risks ......................................................................................................... 20
2.4.2 Economic Risks ......................................................................................................... 20
2.4.2 Security Risks ........................................................................................................... 21
2.4.3 Other Risks ............................................................................................................... 21
2.5 Stakeholder Analysis ....................................................................................................... 21
2.6 Work Plan ........................................................................................................................ 22
2.7 Conclusion ....................................................................................................................... 24
CHAPTER THREE: ANALYSIS PHASE ............................................................................ 25
3.1 Introduction ..................................................................................................................... 25
3.2 Information gathering methodologies ............................................................................... 25
3.2.1 Observations ............................................................................................................. 25
3.2.2 Questionnaires ........................................................................................................... 26
3.2.3 Interviews.................................................................................................................. 27
3.3 Analysis of existing system .............................................................................................. 28
3.4 Process analysis ............................................................................................................... 29
3.5 Data Analysis................................................................................................................... 32
3.6 Weaknesses of current system .......................................................................................... 35
3.7 Evaluate Alternatives ....................................................................................................... 35
3.7.1 Improvement of the existing system .......................................................................... 36
3.7.2 Outsourcing ............................................................................................................... 36
3.7.3 Total Insourcing ........................................................................................................ 37
3.7 Requirements Analysis .................................................................................................... 37
3.8 Use Case ..................................................................................................................... 38
3.8.1 Functional Requirements ........................................................................................... 40
3.8.2 Nonfunctional Requirements ..................................................................................... 41
3.9 Constraints ....................................................................................................................... 41
3.10 Conclusion ..................................................................................................................... 42
CHAPTER FOUR: DESIGN PHASE .................................................................................... 43
4.1 Introduction ..................................................................................................................... 43
4.1.1 Description of the proposed System ........................................................................... 43

viii
4.1.2 Inputs ........................................................................................................................ 43
4.1.3 Processes ................................................................................................................... 43
4.1.4 Outputs...................................................................................................................... 44
4.2 Systems Design ............................................................................................................... 44
4.4 Architecture Design ......................................................................................................... 49
4.5 Database Design .............................................................................................................. 51
4.5.1 Physical Database Design .......................................................................................... 52
4.6 Program Design ............................................................................................................... 56
4.6.1 Package Diagram....................................................................................................... 57
4.6.2 Class Diagram ........................................................................................................... 59
4.6.3 Sequence Diagram ..................................................................................................... 61
4.7 Interface Design ............................................................................................................... 61
4.8 Output Design .................................................................................................................. 64
4.9 Pseudo Code .................................................................................................................... 64
4.10 Security Design.............................................................................................................. 65
4.10.1 Physical Security Design ......................................................................................... 66
4.10.2 Network Security Design ......................................................................................... 66
4.10.3 Operational Security Design .................................................................................... 66
4.10.4 Database Security Design ........................................................................................ 66
4.10.5 Software Security Design ........................................................................................ 66
4.11 Conclusion ..................................................................................................................... 66
CHAPTER FIVE: IMPLEMENTATION PHASE ................................................................ 68
5.1 Introduction ..................................................................................................................... 68
5.2 Coding ............................................................................................................................. 68
5.3 Testing ............................................................................................................................. 68
5.3.1 Unit Testing .............................................................................................................. 69
5.3.2 Module Testing ......................................................................................................... 70
5.3.3 System Testing .......................................................................................................... 71
5.3.5 Verification and Validation ....................................................................................... 76
5.3.4 Acceptance Testing ................................................................................................... 85
5.4 Installation ....................................................................................................................... 86

ix
5.4.1. Training.................................................................................................................... 86
5.4.2 Changeover ............................................................................................................... 86
5.5 Maintenance .................................................................................................................... 88
5.5.1 Corrective maintenance ............................................................................................. 88
5.5.2. Perfective maintenance ............................................................................................. 88
5.5.3 Adaptive Maintenance ............................................................................................... 88
5.6 Recommendations............................................................................................................ 89
5.6.1 To the Farmers .......................................................................................................... 89
5.6.2 To the Researchers .................................................................................................... 89
5.6.3 To the Administrators ................................................................................................ 89
5.6.4 General Recommendations ........................................................................................ 90
5.7 Conclusion ....................................................................................................................... 90
REFERENCES ........................................................................................................................ 91
APPENDIX A .......................................................................................................................... 94
APPENDIX B ........................................................................................................................ 106
APPENDIX C ........................................................................................................................ 108
APPENDIX D ........................................................................................................................ 110

x
LIST OF ACRONYMS
ARR -Accounting Rate of Return
DR&SS - Division of Research and Specialists Services
GDP - Gross domestic product
GIS - Geographic information system
IDE -Integrated development environment

xi
LIST OF FIGURES
Figure 1.1 Organisational structure………………………………………………………….....….2
Figure 3.1 Activity Diagram……………………………………………………………………..30
Figure 3.2: System Context Diagram………………………………………………….………....32
Figure 3.3: Current System Data Flow Diagram………………………………………………...33
Figure 3.7 Use Case Diagram……………………………………………………………..……..37
Figure 4.1: Context diagram of proposed system…………………………………………...… 43
Figure 4.2: Data flow diagram of poposed system…………………………………………........44
Figure 4.3: Star Topology …………………………………………………………………..…...48
Figure 4.4: Remote Access………………………………………………………….……….......49
Figure 4.5: Database Architecture Layers ………………………………………………………50
Figure 4.6: Enhanced Entity Relationship Diagram ………………………………….………...53
Figure 4.7: Package Diagram ……………………………………………………………………56
Figure 4.9: Class Diagram……………………………………………………………………….57
Figure 4.10 Sequence diagram…………………………………………………………………...59
Figure 4.11: Login form …………………………………………………………………….…...60
Figure 4.12: Forgot Password Form ……………………………………………….……………61
Figure 4.13: New Research Form ……………………………………………………...…….….61
Figure 4.14: Pest and Disease Form………………………………………………………...…...62
Figure 5.1: Defect Testing………………………………………………………………..…….. 67
Figure 5.2: Big file size error…………………………………………………………..………...68
Figure 5.3: Training the system ………………………………………………………..………..69

xii
Figure 5.4: Comparison results ………………………………………………………..………..72
Figure 5.5 Display of available results………….……………………………………………….72
Figure 5.6: Performance Test Results……………………………………………………………73
Figure 5.7: Untagged Images in the system……………………………………………………...74
Figure 5.8 Suggestive Prediction on tags……….………………………………………………..75
Figure 5.9: Same Tag example ………………………………………………………….………76
Figure 5.10: Image Summary confirming precision……………………………….………..…...77
Figure 5.11: User credentials input Validation ………………………………………………….79
Figure 5.12: Null values when login……………………………………………………………..80
Figure 5.13: Wrong username input………………………………………………………..……81
Figure 5.14: Wrong password…………………………………………………………….……..81
Figure 5.15 Database login………………………………………………………………………83
Figure 5.16 Login platform………………………………………………………...…………….83
Figure 5.17: Testing …………………………………………………………………………….84
Figure A1: Login page …………………………………………………………………………..93
Figure A2: Password Requirement page ………………………………………………………94
Figure A3: Forgot password ……………………………………………………...…………......95
Figure A4: How to add new images for training………………………………………………...95
Figure A5: Addition of tags on images ……………………………………………..…………...96
Figure A6: Uploading the Image into the system ……………………………………………….97
Figure A7: Display of a successfully uploaded image…………………………………..…….…98
Figure A8: Image testing for precision …………………………………………………………99
Figure A9: Tags of an image………………………………………………………………..…100

xiii
Figure A10: Taking an Image ………………………………………………………….....……101
Figure A11: Retrieving disease information……………………………………………..…..…102
Figure A12: Information display ………………………………………………………..….….103
Figure A13: The number of iterations…………………...……………………………..………104

xiv
LIST OF TABLES
Table 2.1: Hardware requirements ………………………………………………..………….….11
Table 2.2: Operational costs …………………………………………………………….………13
Table 2.3: Development costs ……………………………………………………………….…..14
Table 2.4: System benefits …………………………………………………………...…….…...15
Table 2.5: A Cost and Benefit Analysis Table…………………………………………...….…..15
Table 2.7: Payback Period ……………………………………………………………….....…...17
Table 2.8: Activity Work Plan ………………………………………………,………….…....…23
Table 2.9: Gantt chart……………………………………………………………………….….. 23
Table 4.1: Hardware Specifications ………………………………………………………....…..47
Table 4.2: Software …………………………………………………………………………...... 48
Table 4.3: User Table…………………………………………………………………….……... 51
Table 4.4: Database Design Tables……………………………………………………………... 52

xv
LIST OF APPENDICES
APPENDIX A: User Manual…………………………………………………………………….93
APPENDIX B: Administrator Questionnaire………………………………………………......105
APPENDIX C: Researcher Questionnaire………………………………...…………………....107
APPENDIX D: Source Code………………………………………………..………….…….109

1
CHAPTER ONE: INTRODUCTION PHASE
1.1 Introduction
A synchronised mobile and web information system crop disease bot is a system that allows the
users to take the imagery form of a crop disease, thereafter search through its database to retrieve
information about the disease. This information will include, the disease name, what it affects
and ways to get rid of the pest or the disease which will be encompassed by the mobile platform
of the system which will also locate nearest veterinaries. In this chapter, there will be a deep
analysis of the background of the organization the definition of the problem at hand. Moreover,
there will be a layout of the objectives that are to be achieved as well as the methods to achieve
the objectives. Thereafter, a justification as to why the project was pursued.
1.1.1 Background Information
The Division of Research and Specialists Services (DR&SS) started being conventional in the
year 1948. It has evolved from the stint of its development sustaining its chief directive and
business utilities. The transformation has seen it being consolidated into the following three
divisions:
1. The Department of produce enquiry which has six institutes and staff that are over 1062
who aid in this department
2. The Dissection of Livestock and Meadowlands Exploration which has four
establishments and 627 staff that compliments this
3. The Division of Research Services, this department has 7 establishments and up to 674
total staff.
The Division of Research and Specialists Services is directed by a Prime Executive, it has three
Dissections which are regulated by Chief Departmental Executives. Exploration being a
paramount vehicle which helps enhancing the efficiency of agricultural productivity, fabrication
and agricultural increase it is the main focus of the organization. Research-based evidence,
products and technologies are beleaguered at advancing agricultural performance under various

2
physical and resource platforms. In contrast, agricultural monitoring services help protect the
nation-state’s food production by preventing the restrained introduction into the country of
vexations and infections of confinement significance, to add on to assuring the nation of quality
inputs of agriculture which are available on the market (dr&ss.inc, 2017)
1.2.2 Organisational structure
An organogram is a diagrammatical representation of the communication channel of an
organization. They are three types of representations which are mostly implemented by
organisations which are hierarchical, matrix and horizontal. Hierarchical organogram is where
the subordinates are grouped clearly to one supervisor basing on function or geography or
products. Matrix is in grid format/matrix where pooling of the same skill is done to different
assignments. Horizontal is a setup which is implemented by small to medium companies where
all the middle managers are removed leaving only the senior management followed by
employees. In this research, hierarchical was used to define the company’s organizational
structure (Ghuman, 2010)
Figure 1.1 Organisational structure
3
1.2.3 Vision
According to Russo (2010), a company vision are the set of strategic objectives that the company
has, road mapping where the company appreciates to be in the foreseeable future. They define
the growth spurt of the company and instantiate its transformation initiatives. The department of
Research and Specialists Services is envisioned towards being included amongst all chief
agricultural study and other services establishments that are in the world by the year 2020
(dr&ss.inc).
1.2.4 Mission
A mission statement is a sentence that best describes the reason why the company was brought to
life, it describes its function, markets and competitive advantages which may be summed up as
the business goals and philosophies. It responds to the reason for the company’s existence and its
primary services (Hill & Jones, 2011). The department of Research and Specialists Services has
a Mission Statement that is to provide research-based expertise, knowledge, information and
technologies that aids in the development of a promising and supportable agrarian subdivision
(dr&ss.inc,2017).
1.3 Problem definition
For the design, augmentation and implementation of a substantial system, problems were defined
thus a solution was ascertained accordingly. The problems which were encountered were
limitations that hindered working productively. Farmers had to consult the research department
and hire consultants to advise them, which translated to immense expenses as well time which
they took going back and forth to the department for approval of surveys. To counter this,
farmers had resorted to rely on undocumented WhatsApp groups where people would just
exchange thoughts, opinions and unverified experiences without professional help simply
because it was expensive. The ideal situation would have been if they could have these resources
at hand, to their reach without having to consult external partners, this was going to be cost
effective, direct and would save on time and help make farming easy and enjoyable. Having to
go to the department of research to get a consultant not only did it take a lot of time, it was also
expensive, money had to be produced and there were bureaucratic tapes to acquire the
information that the consultant has. Farmers normally do not have a lot of time at their disposal
since their job require 24/7 attentiveness and less or no time can really be invested in proper

4
research on the diseases that would have attacked their crops. Research is generally a strenuous
process and most of which they will not be sure with the diagrams if they are researching the
proper thing or not and if the route of rectifying the predicament is the right one. This will
eventually inconvenience the whole farming progress.
1.4 Research Aim
The aim of the mobile and web integration system was to develop an intelligent mobile system
that will provide as much information about pests and crop diseases for the convenience of all
the farmers. The system also aims to be cheap in terms of compatibility and other costs
requirements and will have an interface that will be very easy to use. The web based application
program interface aims to show spatial data for better analysis pertaining geographical location
of where much requests of the pests and disease have been recorded and this will help
stakeholders as the researchers and all the houses concerned about crop and livestock production
to take necessary action to refute the spread of diseases.
1.5 Objectives
Once the problems were defined, there was need to set goals and this was going to be completed
by a set of objectives. An objective is a prescribed convention of accomplishments, or a
development used to improve as well as contrivance a new or improved information system
(Gelinas, Dull & Wheeler, 2015). They represent steps along the way toward achieving the goal
and are often called milestones directing the development of the system to eradicate the problem
that would have been flagged.
Pertaining the problems that were stated above, a need to develop a system was raised that will
do the following:
To train the system to increase precision.
To compare images with the diseases in the database with a 90% precision return
To measure the system reliability via performance tests
To group all untagged data images to help researchers update the system
To self-learn from its mistakes, helping in disease precision

5
The system now has an integration of the mobile platform for the farmer and the web based
platform for the other different stakeholders with differing user access for data manipulation and
data sensitisation.
1.1 Instruments
The proposed product was augmented with the following tools:
A relational Database SQL and SQLite
It is a relational querying facility (quinStreet.inc, 2017). In this program it will be
retrieving data and perform create, delete, update and retrieve operations.
Visual Studio
It is an assimilated development environ developed from Microsoft to augment software
systems (MSDN.inc, 2017). It is going to be used to develop the custom vision of the
system
Azure
This is a cloud application development environment which builds tests, deploy and
manage the application (Microsoft.inc, 2017). This will be used for the imagery
customization in the system.
Xamarin Studio
This is sophisticated development platform that has vast features for development of
mobile application (Xamarin.inc, 2017). In this system it will be used for the
responsiveness of the mobile environment.
Telerik for ASP.Net
This is a buffer environment that contains controls of information systems (telerik.inc,
2017). In this program it will be used to call events requested by users.
Android Studio
Aided with Xamarin Studio, this environment help develop the mobile version.
The proposed system was developed using the traditional system development life cycle as the
methodology implemented since there was no other system developed to cater such a need.
1.2 Methods

6
For the development of the proposed system, three types of information gathering tools were
going to be used which are observations, questionnaires and interviews. Observations are a
methodology where the observer pays special attention to the activities being undertaken within
the existing system. A questionnaire is another information gathering technique where there will
be a list of questions where there may be three types of responses i.e. guided responses in form
of a Boolean yes or no, semi- guided where responses are answered freely whilst being guided
contextually. The last type of responses are the open one where the responder can actually write
their own opinion without any guidance. Interviews are an exchange of two communicating
parties in which one will be asking the other and the other responding to the questions asked
(Scheyvens, 2014).
1.6 Justification
The focus is to develop a system that largely helps the farmer that all the crop diseases
information and how to treat them will be in the palm of a farmer’s hands and if ever there will
be an outbreak for a pandemic, differing stakeholders like the veterinary will take quick courses
to rectify the situation. This was going to reduce even the workload of farmers in looking for
treatments and researching further, moreover they would feel eased when if they face new
diseases or anything out of the scope of their knowledge or even the system’s database they will
know higher offices will be attending to the problem they would have conveyed. The farmers,
were going to have convenience that is mobile, regardless of the location they will be able to find
valuable information that will make their farming easier and will eventually raise the country’s
Gross Domestic Product helping the economy as a whole. Communication will be two way that
less time is taken for information to reach the appropriate stakeholder if quick action is required
This system will help the farming sector to be efficient and effective pertaining pest and disease
control of which pests and diseases may be the most detrimental factor or constraint to achieving
above optimal harvest. The system is web based system and this implies it refutes all the
geographic and bureaucratic constraints that may rise. It is not held to one organization per say
but instead even the stakeholders who are abroad and in other organizations are able to use this
system for their convenience. The system will be augmented in such a way that information may
be exported to pdf and or excel thus making is more convenient for the data retrieved from the
7
system to be integrated and be used in other systems by other crop production and animal
husbandry houses hence building an ecosystem in the agricultural sector.
1.7 Conclusion
This chapter clearly identified the need to develop such a system objectifying the problems that
the current regime was facing and the justification of why there is was need to develop such a
system, what will be used to build the system and the probable constraints that may be faced
during system development. The challenges that the farmers were facing have been identified
and there the need to develop a system to help educate the farmers so they can yield greater
harvests was raised. Succeeding to this introductory chapter, there was need to instantiate if
developing the system was feasible. This was carried out in the planning phase, where there was
a scaling of whether or not it is paramount to adhere to the development of the system. This plan
determined the scheduling of tasks in the development of the system.

8
CHAPTER TWO: PLANNING PHASE
2.1. Introduction
In this chapter, a clear definition of the facets of the system were implemented. These included,
its business values which justified the relative advantage of the proposed system over the one it
supersedes, its technical, social, operational as well as the economic feasibility studies.
Furthermore, this chapter projected a plan that will be implemented to manage as well as monitor
the progress that the project is registering at every stage.
2.2 Business Values
Business values are a set of standards used to determine the company’s worth that may include
fair market value, intrinsic value as well as investment value. They determine the company’s
position in the long run (valueadder.inc , 2017).This system is helping the company by giving it
a fast and convenient route to their vision that is be a leading research and facilitating board by
2020 (dr&ss.inc,2017). The following will show the business values of different stakeholders in
the organisation wanted to be appreciated:
a) Managerial Values
Managerial values are values put as first or top priority by management and this
organisation’s managerial values include:
- Customer satisfaction: They wanted to ensure that the system met user requirements
- System Security: They wanted the system to be able to block intruder access
- Market growth: The system had to facilitate them acquire more customers
- Less operational costs: It was supposed to reduce operational cost in goal achieving
for example labour.
- Profit- they wanted to realise benefit from the system
- Decision making- they wanted a verification if the visit is even necessary thus
refuting users who may send new notifications that are not crop related

9
b) Organisational Values
Oganisational Values are those that are unanimously approved and inherently make the
organisation better and profitable. For this organisation, these include:
- Competitive edge: Organisations seek to register progress over competition hence
giving them autonomy in that market
- Balance: The organisation also seeks to acquaint all their employees with top
technology that is effective and help produce more results helping the managerial
values
- Accountability: The system had to have a specific range of responsibilities hence
gaining responsibility for those tasks and answer to questions if raised
c) Stakeholders Values
These are what stakeholders refer to have paramount importance in investing anything in
the organisation. Stakeholder in this context value:
- The farmers aspired to have an improved communication with the researchers without
delay
- They also wanted to have immediate attention to what will be happening on their farms
-Farmers also require a reduction in the cost of acquiring information from the research
experts.
- Researchers had to at least know what they will be dealing with before they reach the
farm hence boosting productivity
- Researchers wanted a means not to repeat the same visits to farms they would have
already gone to
2.3 Feasibility Study
When talking about feasibility study, there is focus on the plausibility of the project being
completed, taking into account the economic, technical, and scheduling pointers (webfinance.inc,
2017). It is used to determine the positive or negative reproduction that the project may have
before investing either money or time into the project. The feasibility study now concentrated on
economic, technical, social and operation aspects of the project.

10
2.3.1 Technical Feasibility
Technical feasibility checked whether the company has or can make acquisitions of the
indispensable technology to support and instrument the proposed system (evirtualservices.inc,
2017). It looked at the software and hardware necessities as well as the expertise to augment the
system until deployment.
2.3.1.1: Technical Expertise
What was gathered to ensure the technical expertise feasibility is made evident in the following:
Users (Farmers)
Farmers nowadays have smartphones amongst other gadgets, these have already been
helping them on the meteorological forecasts and the support groups hence making the
farmers technologically able to operate the system
Users (Research Administrators)
One of the employment criteria at dr&ss is computer literacy making all the researchers
able to cope with the system.
Developer – the developer spent two years on a hands on ASP.Net development
including web and content management and is well acquainted with C# as it is the base
language in the development of this system
Conservation Team- the company has a well-equipped Information and Technology
Department which will be able to see the future use of the system after deployment
Seeing that all the technical expertise required was available without any hazards of failure, it
was confirmed that the project could proceed without complications.
2.3.1.2: Infrastructural, Software and Hardware Prerequisites:
To observe the success of the system being implemented, there was demand to add onto the
already installed hardware and software. Amongst the materials required there was need to add
the following:

11
a) Hardware
The following are the hardware specifications that the system required:
Table 2.1: Hardware requirements
Item Quantity Available Decision
Dell PowerEdge T20
Server with Quad Core
processor,1600MegaHatz
Memory Speed,
32Gigabyte SATA HDD
Memory and Intel Graphics
P4600
1 0 the organisation
will procure a
new server
Dell Latitude Laptop with
750GB Hard Drive, Core i5
processor and 4GB RAM
3 0 The organisation
will buy at least
3 laptops.
Mobile Simulator with
Quad Core Processor, 8 GB
Space
1 0 A new simulator
will be bought
D-Link Wireless Router
DIR 615
1 0 a new router will
be purchased
b) Software
A relational Database SQL and SQLite
Visual Studio
Azure
Xamarin Studio
Telerik for ASP.Net
Android Studio

12
The requirements were acquired and there is assurance that the project can go ahead with
developing the system.
2.3.2 Economic Feasibility
Economic feasibility is defined as the measure of profit per each unit of capital, where the net
profit is the profit remaining after deducting all the operational costs incurred by that unit. It
expresses how much return is being benefited from capital (Ghosh &Kumar, 2003). In
developing the system, the research focused on the possibility of the benefit to develop the
system. This was evaluated from an accounting perspective which focused on the Cost Benefit
Analysis and an Investment Analysis. There was a means to evaluate basing on cash flow that
has been projected as shown in the following:
2.3.2.1 Cost benefit analysis
This analysis method identified the probable gains and probable losses, converted them into
monetary terms and weighed them against the measures of decisions to determine if the
development of the system was desirable (Gent, 2009). Since most costs could not be quantified
in monetary terms, an estimation method was used to assign money values. Below is how the
costs and benefits were clustered:
2.3.2.1.1 The Costs
These are system related incurred in both the development period as well as the maintenance of
the proposed system.
Operational Costs: These are costs that would be incurred in the day to day operations of the
business. They can be fixed or variable, fixed being those that have a close to immutable charge
and variable being ones that are proportionated to the usage unit (webfinance.inc, 2017). The
following represents the operational costs that the system may incur as operational costs:

13
Table 2.2: Operational costs
Operational costs in $USD Year 1 Year 2 Year 3
Operational expenses 1 000 1000 1000
Maintenance. 3000 2000 2000
Training
Printing
Stationery
License and upgrades
1 000
300
500
200
700
300
500
100
400
300
500
100
Total 6000 4600 4300
2.3.2.1.2 Development Costs
These, as defined from the name were incurred during the augmentation of the system and were
estimated before the beginning of the project and later reviewed and refined, at the end of each
phase of the project (accountingcoach.inc, 2017). Such costs included developer transport, food,
training and new equipment. Development costs are to be shown in the following table:

14
Table 2.3: Development costs
Development Costs in $USD Year 1 Year 2 Year 3
Dell PowerEdge T(20) Server 1 900 1900 1900
Mobile Simulators 600 600 600
Dell Latitude Machines 1 600 1600 1600
Wireless Router 500 500 500
Personnel training 300 200 100
Total 4900 4600 4500
2.3.2.1.3 The Benefits
There are two types of benefits, tactical and strategic benefits. Tactical benefits are benefits that
improved the working space and social responsibility factors which may affect the company as a
whole. Strategic benefits now helped in better performance of the company, cutting costs and
they are long term. The benefits’ tangibility was dependable and the tangible benefits include
cost reduction, less customer churn and stakeholder satisfaction. Intangible benefits may include
goodwill and better decision making. The benefits of the proposed system were forecasted to the
following quantifiable amounts:

15
Table 2.4 System benefits
Tangible benefits
estimated amount in
$USD
Year 1
Year 2
Year 3
Less Paperwork 4500 4700 4500
Better accuracy of
accounts
1000 1500 2000
Less Consultancy 600 600 500
Less Running Costs 1500 1100 2000
Intangible benefits 6 000 5000 4500
Total 13600 12300 13500
2.3.2.1.4 Cost Benefit Analysis
Since the costs and benefits had been detailed. The following is the full analysis of the cost
versus the benefits to further justify as to why the system was developed:

16
Table 2.5: A Cost and Benefit Analysis Table
Benefit / Cost in $USD Year 1 Year 2 Year 3
BENEFITS
Total Benefits 13600 12300 13500
COSTS
Development Cost
Operational Cost
(4900)
(6000)
(4600)
(4600)
(4500)
(4300)
Total Costs. (11000) (9200) (8800)
NET BENEFITS/LOSS 8000 3100 4700
From the cost and benefit analysis table, it can be seen that the system is feasible and it is
profitable to pursue with the development of the system. The profits start to diverge as years
pass:
2.3.2.2. Investment Analysis
A lot of methodologies were implemented to show comparison of projects with their cash flow
forecasts. In this research, two were used which included:
Net Profit
Payback Period
Accounting Rate of Return
Net Present Value

17
a) Net Profit Analysis
Brent (2007), describes net profit as the comparison of the turnover and the cost of sales as
well as the operating expenses and for this project is calculated as follows:
Net Profit = Total Benefits less Total Costs
Table 2.6 Net profit over 3 years
Year 1 Year 2 Year 3
Total Benefits 13600 12300 13500
Total Costs 11000 9200 8800
Net Profit 8000 3100 4700
The Net Profit of this particular project is $8000USD for year 1, $3100 for year 2 and $4700.
b) Payback Period
This refers to the amount of time it takes for a project to return the initial investment outlay. It is
measured in time and the following elaborates how the system will pay back the investment,
Brent (2007). The following is how the system was to pay back.
Total Investment Cost – Net profit per year
11000 + 9200 + 4700
Table 2.7 Payback Period
Total Investment Cost Value Balance
Year 0 24900 24900
Year 1 13600 11300
Year 2 12300
Year 3 8800

18
11300 / 12300 * 12 months (to confirm how long in a year was the investment paid back)
11.02 months
The project has a short payback period of 1 year and 11 months.
c) Accounting Rate of Return (ARR)
According to Brent (2007), this can also be termed as Return on Investment and is used to make
comparison between the profit and the capital invested. It was calculated as a percentile of the
profitability as follows:
ARR = (Average Annual Profit/ Total Investment)* 100
Where Average Annual Profit = Net Profit/ Number of Years
For this project the Average Annual Profit = $8000/1
$8000USD $3100 $4700
And ARR is:
(8000/11000)* 100 (3100/9200)*100 (4700/8800)*100
72.73% (Year 1) 33.7% (Year 2) 53.53% (Year 3)
As the Accounting Rate of Return is positive,
From the methodologies used, it is clear that the proposed system was economically viable as the
benefits are more than the costs.

19
d) Net Present Value
Net present value refers to monetary value at a particular time. It checks the present value of the
benefits versus the outflow of the system (Hopkinson, 2017). The following is how net present
value was realized as follows:
Net Present Value => Total Benefits less Total Costs/ (1+ r) ^n
Where R is the Interest Rate and N refers to the number of years
(13600 +12300 + 13500) – ( 11000 + 9200 + 8800)
39400 – 29000 = 10400
10400/ (1+ 0.10)^3
$ 7813.67
The net present value after 3 years will be $ 7813.67. This proved as the other reason why the
system proceeded to development.
2.3.3 Social Feasibility
Hillson & Simon (2007) define social feasibility is how the system will be interacting in the
community where it will be implemented and weighing the effects of what the system will
produce whilst being implemented. This application has more merits to the community at large.
Zimbabwe as an agro economy, will appreciate much of what this system will bring because it
relates to what most citizens do in Zimbabwe. It was of more benefit since it started to enhance
the development of communities. The system is easily maneuverable since it can be used by
anyone and manages to inform anyone from novice to expert from a click of a button.
2.3.4 Operational Feasibility
Operational feasibility examines the support and acceptance of the system by users,
management, and overall stakeholders (Boehme, 2011). In full confirmation of whether there
was a go ahead or not, checks were made using questionnaires and interviews to verify if there is
solid reasons to develop such a system. Management even furthered to mobilization of delegate
to see through the success of the project. The finance department, as they are concerned about
the cost benefit of the project, looked seriously at the project and gave it a go ahead. They saw it

20
beneficial to the financial returns of the company. The farmers as the primary users were ecstatic
to this venture since they always complained about the procedures and costs as well as the time
they had to factor to acquire professional knowledge. The Information Technology department
management saw this research as a technologically forward project and since it will be an expert
system it will position the whole company at a forefront when it comes to technology, which is
the Information Technology Strategy that the company has to technology alignment. Every
interested party was in full support of the research.
2.4 Risk Analysis
There is an element of risk in the development of every system and this may affect success of the
project. Proactively, risks were identified and monitored as well a strategy for contingency plans
to mitigate them. Risk mitigation saves from loss of unnecessary costs, awareness of the risks
thus implementing standard so as to help save time and other available resources. Risks in
system development can be classified as Technical, Economic, Security risks other risks may be
categorized independently. Below is further exaggeration of the clusters of risks that may affect
the project and well as how to mitigate them.
2.4.1 Technical Risks
Apart from the fact that there is an effective two way communication between the developers
and the users, there was a possibility that the interface will be too complicated for the users or
have less of what the user requires. To refute this, a prototype was developed and probed the
clients further as to what exactly they needed as well as facilitating the best infusion by training
and allowing room for errors thus developing the best product that will be exploited to its full
capacity.
2.4.2 Economic Risks
Restrictions on the cash flow towards imports as well as limitations of imported goods left the
company at a bruised position. The main problem is situated towards the purchase of software
and hardware that is needed to develop the system. To ensure this risk did not affect the project,
the company purchased from local traders.

21
2.4.2 Security Risks
Technology has its disadvantages, the server may crash and wipe all the data. To ensure there
was very low risk, partition of the server into backups and backup of backups thus there was
third degree mirroring and no loss of information. If it so happens that there are attacks from
viruses and other Trojans and malware, an additional cost of purchasing a licensed antivirus
which helps protect the firewall and other sort of malware that may attack the system. To avoid
distribution of confidential information to the public, the system came with authentication to
access the system and access level to avoid this.
2.4.3 Other Risks
Some other risks including the quality assurance of the product and to do away with this risk,
was refuted with a strong adherence with the Information Technology Standards that governs the
Software products of Zimbabwe as well as hire an external Assurance Officer who will
benchmark and weigh the quality of the product developed. Technology alignment may also be a
problem so to mitigate this risk, high technology diffusion was instated to ensure the best
infusion of the system, the farmers and other stakeholders were made aware in earnest about the
system and be educated on how to use the system. There was risk that the system will not be
done in time so to reduce this, the developer stayed focused on the development of the system.
2.5 Stakeholder Analysis
Stakeholder analysis was defined by Mapfumo (2003) as the technique used to identify the key
people that are there to ensure that the project is being put into path as well as seeing through the
success of the project. It has three steps which include identifying, prioritising and lastly
understand their key needs. For this project there are three key stakeholders which are the
farmers as the customers, the researchers and the management of the company. Their
expectations are stated below:
a) Farmers
Since they are guaranteed major stakeholders, they were hoping for a responsive system with
real time information and reduction of the red tapes and other procedures they have been going
through to get expert information. They also expected an easy to maneuver system with a
platform that is comprehended by a lame man with little to no skill of using a mobile phone.

22
b) Researchers
Since most time was spent in going into the field as well as educating the agricultural extension
workers through various long workshops to advance their knowledge base as well as seeking
approval from the relevant ministries in the government. Upon familiarizing about the proposed
system, they expected the system to cut all the procedures they spent going to the government
offices and back as well as the workshops which were eating up their research time which was
the time they spent in the labs discovering new things about the pests and diseases.
c) Management and Supervisors
They were the ones who are facilitating the success of the system with confidential information.
They expected the name of the company to be withheld with integrity and maintain the standard
they have had and see that the vision is a step closer to being apprehended and brought to life.
They expected the system not to break any laws fraudulently or not as well as facilitate that the
farmers, the government, the researchers are happy with the system
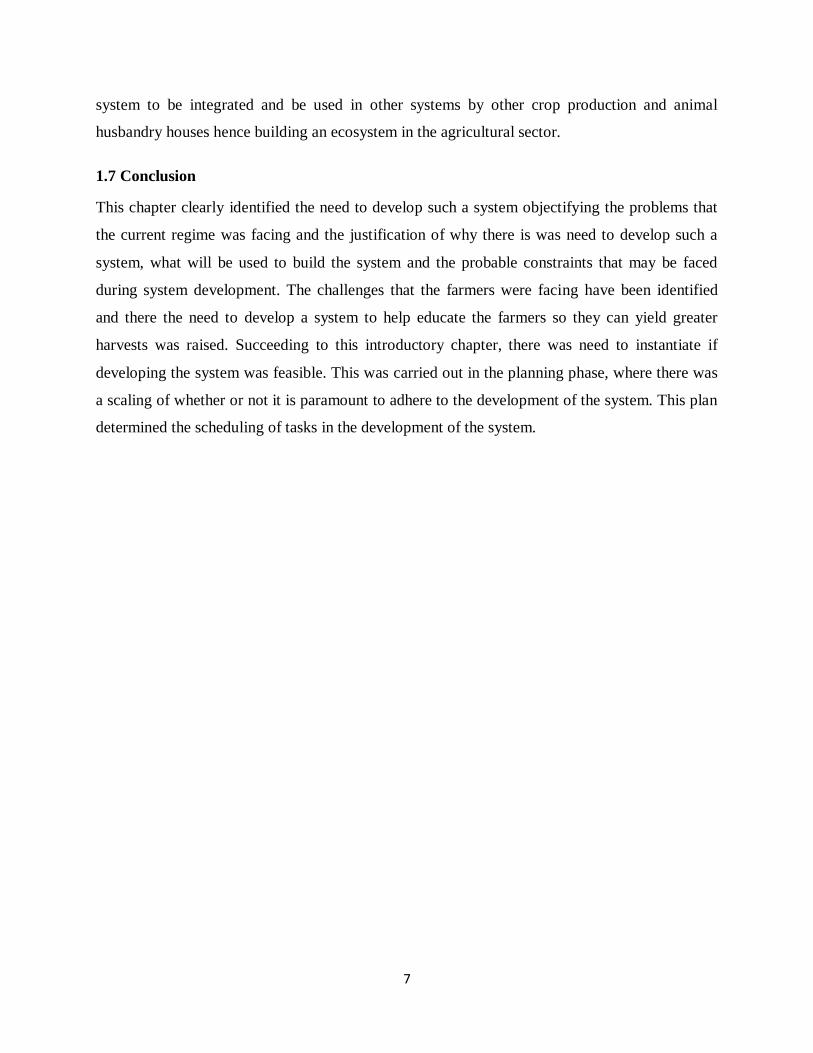
2.6 Work Plan
Every lifecycle have to be given a span from which a detail beginning and ending of activities
will be stipulated. The project was done in stages where one stage succeeded after the precedent
phase has completed. A work plan had to be conventional to keep track on the progress of the
project development. There was a schedule table showing the date a phase begins and when it
will end followed by a Gantt chart
23
Table 2.8 Activity Work Plan
Activity Duration (weeks) Start Date End Date
Investigations 4 22-02-2017 29-06-2017
Planning 4 30-05-2017 06-06-2017
Analysis 4 07-06-2017 06-07-2017
Design 4 15-07-2017 06-08-2017
Implementation 4 07-08-2017 14-09-2017
Evaluation 3 15-09-2017 16-10-2017
The information that is being shown in the work plan above is also to be represented in form of a
Gantt chart as follows:
Table 2.9 Gantt chart
Activity Time (weeks)
Activity 4 8 12 16 17 19 20 24
Investigations
Planning
Analysis
Design
Implementation
Evaluation

24
2.7 Conclusion
In this chapter, a feasibility study was done clearly pointing out the technical, economic, social
and operational feasibility. Furthermore, a risk analysis was done identifying and giving counter
actions to be implemented in the event of those risks occurring. Thereafter, a work plan was
stated as to how the system. Succeeding to this chapter, there will be analysis of the system
where the research will look at the information gathering and analysis of the current system and
evaluate the alternative as well as a requirements analysis.

25
CHAPTER THREE: ANALYSIS PHASE
3.1 Introduction
In this phase a definition of the requirements of the proposed system was done. It expressed the
issues that the system aspired to achieve. In this phase there was a focus on the information
gathering, analysis of the current system. A clear cut showing of the weaknesses of the system
and evaluation of the alternatives on the plate and make a requirement analysis was detailed. The
system needed to be dissected and have a notion of what needed to be deciphered. This segment
surveyed the current system via qualified tools as the context diagram and a dataflow diagram.
3.2 Information gathering methodologies
The development of the system had to be cited with a perspective of how the existing system
operated. There was also stiff investigation of problems that caused the rise to a new set of
options that users felt they should use in the new system rather than keep implementing the old
system (Craig, 2008). This system needed to produce an ease of knowledge syphoning of expert
information to the farmers also addressing the complex procedures of acquiring the information.
To determine all the factors, the following methodologies were used.
3.2.1 Observations
Observations are meant to conceptualise the existing system as one of the decision making
methodologies that are used in system development (Friesen, 2010). These observations were
done to get a subjective view of how the farmers were handling the current system as well as
the company. It also helped figure out how they responded to the farmers and how they
conducted their business functions. Observations helped observe how they feel about the system
by forms of the expressions made during their day to day use of the current system. This was
important as these are the biggest stakeholders and not prioritising their needs will critically
cripple the success of the system. The farmers were disgruntled over the long wait they had to
take to acquire professional information. They resorted to using undocumented social media
platforms to help themselves which was not enough guarantee that the information is legit. For
information acquisition, they had to pay to attend seminars hosted and this whole process
wasted valuable time they could have spent working on their farms. Some farmers would not
even attend these meetings because they felt as though they could not delegate enough time to

26
attend and hoped to be told over an informal gathering after farming hours.
a) Advantages
It provides a hands on access to the existing system
It was flexible, flexible working hours, flexible perspective of opinions of the system
It complimented other methodologies by aiding conceptualizing how to implement the
technologies
b) Disadvantages
It did not give full detail and reason why some actions were done
It was subject to bias, compromising the quality of the data that is being gathered
Observer influenced behavioral change to the farmers and the researchers.
Required a comprehension of how the system works, the standards and policies set to
help gather valuable data
3.2.2 Questionnaires
These involve drafting a list of printed questions structuring them such that they can be
responded on with choice of answers (D rneyei, 2014). This was done using paper and a survey
monkey to the farmers and the research board. The papers and survey links will be distributed to
all the stakeholders targeted by this system. The farmers’ questionnaires looked at the
standardized questioning of how they found the existing system as well giving suggestions as to
how they would improve the system this is the same for the researchers in the research board.
Management questionnaires also made proposals to the new system they felt could be
incorporated to the enhancing of the business vision. Questionnaires gave the new system an
opportunity for maximum exploitation and customer satisfaction.
a) Advantages
Standardized information gathering, it avoided ambiguity saving time and cost
They were distributed and collected by anyone hence increasing productivity
Weighing which route would satisfy most clients from the comparison of the answers
was brought about
They helped create new hypothesis and helping bring new ideas to better satisfy the
farmers

27
b) Disadvantages
With questionnaire, no body language was established hence compromising the quality of
information gathered
Important questions may have been missed on asking deeming the questionnaire
irrelevant
They are written, farmers and researchers chose to interpret differently one question
3.2.3 Interviews
This is a discussion between two parties one being the interviewer, who is the one who asks the
questions and the other being the interviewee, who responds to the questions (Polak ,2016).
This methodology aims at helping make appropriate action validation of the responses giving
more information about the value of the response. This is to exhaust all the other skills that are
needed to get as much information as possible and has the ability to probe further as well as
simplify terms to both the farmer and the researcher as to what some questions imply. The
interviews were done to find out the challenges the farmers were facing before using the
research system that was already being implemented by the board.
a) Advantages
There was discovery of other non-verbal actions which indicated more to the responses
The interviewer had the ability to probe further to get quality data
There was room for the interviewee to ask questions
More information was gathered as speaking is faster than writing
b) Disadvantages
Respondents would fraudulently give wrong data to please the interviewer, hence subject
to bias
Most farmers were not well acquainted with technological terms making the interview
long and hard to conduct

28
3.3 Analysis of existing system
The system that was there was manual cited at one center that is the head office. The system did
not have a computerized system for the distribution of information. For this reason, there was a
file system that was apprehended for the farmers who would come to the organisation. At the end
of a month, there were appraisals of the visits the researchers had made in that month in an excel
sheet. The farmers on the other hand have to commute to the head office of the company to
gather information and help about diseases. The following things happen:
Researchers’ visits: When farmers would want on the ground help, they would book
dates to come to the company and hire a researcher and pay per man hours. Actual visits
for the booking have to be done physically. This implied the farmer had to commute
from the farm to the organisation.
Approval of Visits: Information about the visits had to go through a chain of signatures
for approval. The manager would manually assign a researcher to a farm and day to be
spend after estimating the amount of work to be done on that farm.
Researcher’s new findings: If there was a pandemic in a region after the researchers
and the agricultural extension workers have verified the outbreak, there had to be letters
to the ministry of agriculture to approve strict checks on the diseases. Workshops were
then held to inform the agricultural extension officers thus they syphon information to
the farmers.
Researchers’ feedback: For the researchers to confirm if the outbreaks have been
controlled. They had to manually be on the ground and assess the information on the
ground with help of the agriculture extension workers.
The following are the inputs, processes and outputs that were in the organisation:
a) Inputs
Farmers details (name, contact number)
Farms(size, address, owner, produce)
Researcher’s appointment(date, time spent)
Agriculture extension workers(name, contact number, ward district)
29
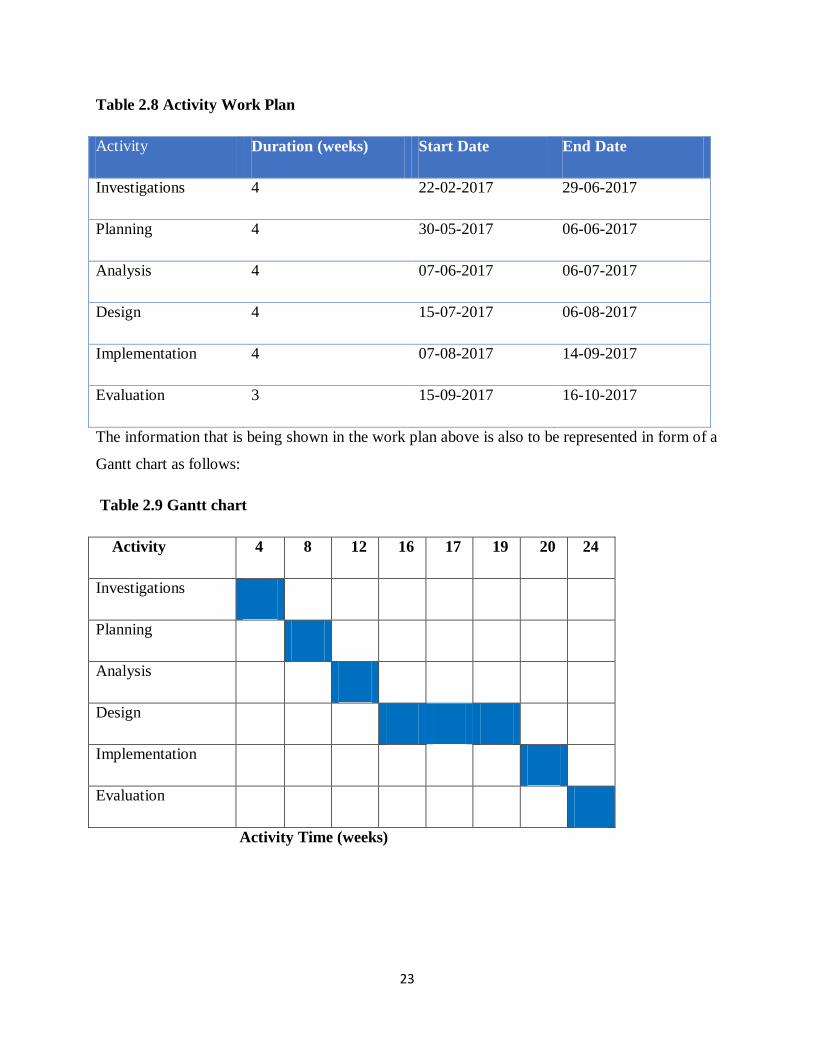
b) Processes
booking of researchers to farms
schedule workshops
research for pandemic mitigation and control
farm disease assessment
preparation of reports
c) Outputs
Appointment records
Receipts of appointment
Reports from farms and workshops
Farm statuses (disease free, pandemic affected etc.)
3.4 Process analysis
This is breaking down the phases a workflow process conveying all the input, operation and
outputs taken on each phase. It is used for improvement of process understanding hence
determining the targets that are potential and removing redundant inefficiencies
(webfinance.inc, 2017). This is shown diagrammatically in an activity diagram which will
control the flow from one activity to another. An activity diagram shows states and transitions
in-between the activity states. It can be branched, sequential or concurrent using elements like
forks or joins (Jalloul, 2004). The following is an activity diagram depicting the activities that
were exercised in the organisation:

30
Farmer Researcher Administrator
Start
Makes
Appointment
Visits
organisation
Allocate
Researcher
Visits farm Is there
available
researche
r
Gives
feedback
on farm
findings
Is disease
new?
Yes
Yes Schedule
workshops
Allocate
researcher to
workshops
Generate
reports
Gives
workshop
feedback
Finish
Assign
researcher
Yes

31
Figure 3.1 Activity Diagram
Farmer Researcher Administrator
Start
Makes
Appointment
Visits
organisation
Allocate
Researcher
Visits farm Is there
available
researche
r
Gives
feedback
on farm
findings
Is disease
new?
Yes
Yes Schedule
workshops
Allocate
researcher to
workshops
Generate
reports
Gives
workshop
feedback
Finish
Assign
researcher
Yes
Give farmer
disease
information
32
Key to the diagram:
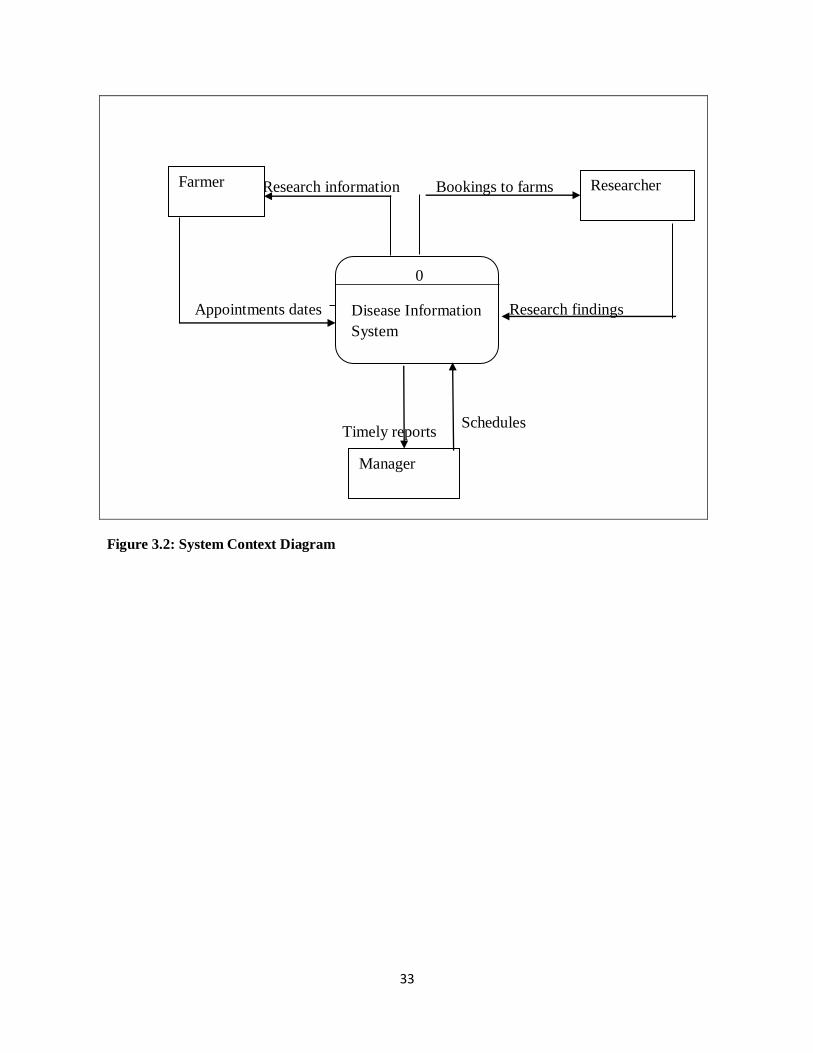
3.5 Data Analysis
Haining (2003) described data analysis as the activities and the processes where the user
expectations are identified. The user may be able to classify, outline, postulate and unify the
elements that are obligatory to placate the expectations. From these elements there was
structuring of inductive extrapolations to differentiate the proposed and existing data. Amongst
the methods used are a dataflow diagram and a system context diagram. A dataflow diagram is a
graphical presentation of data modelling the process aspects as well as the inputs and outputs
from the system (irs.gov, 2017). A system context diagram is graphical representation of the
boundaries that are there between the system and its environment displaying the entities that are
in interaction with it.
(Russell & Cohn, 2012). This is how information is conveyed in the organisation.
Activity
Flow of an Activity
33
Research information Bookings to farms
Appointments dates Research findings
Timely reports
Figure 3.2: System Context Diagram
Schedules
Researcher Farmer
0
Disease Information
System
Manager

34
Figure 3.3: Current System Data Flow Diagram
Researcher
Research findings
Researchers available
Farms
Research findings
Researchers
Appointments
Farm details
Application details
Payment details
Verified farm
details
Appointment dates
Findings details
Payment details
Researcher schedules
Customer details
Rectified farm status
details
Farm status
Research inquiries
Appointments
Farm details
Manager
5
Write
reports
4
Give
feedback
3
Check Researchers’ status
2
Assign
Researcher
Farmer 1
Book
appointment

35
Key to the diagrams
3.6 Weaknesses of current system
Records were never up to date
There was duplication of appointments
Assignment of an already assigned researcher
So much paper use hence caused a lot of stationery costs
Slow reaction to the disease via the long tapes to acquire expert help
The system was manual and was vulnerable to a lot of errors
Required consistent monitoring
No security, information was held in files hence anyone can access it
3.7 Evaluate Alternatives
From the well held feasibility, all the stakeholders gave a go ahead to the augmentation of a
new system. The weaknesses of the old system had to be mitigated in order to maximise
production hence increasing the gross domestic product (GDP) of the country and eventually
better economic growth. Numerous ways of developing an alternative computerized system and
within the alternatives were used and included the following:
Data Store
Data Flow
Process
36
3.7.1 Improvement of the existing system
Another alternative will be just improving what is already there, fixing the areas of concern. This
was going to yield advantages but did not in overall improve the system, it still has the same
process functions and remain monotonous and ineffective. Even if the loopholes were covered
and the system is improved, this alternative was not suitable because of the following reasons:
Upholstering the system implied more costs in upgrading the system
There would be much weight on the employee workload because there may be
some immutable facets of the system
For the reason above, it will implied a file system was still being used in one
module of the system
Failure would compromise security and confidentiality of the information as well
as business functions
3.7.2 Outsourcing
This is contracting an outsider of the organization to handle business functions and or
activities. This may include software augmentation, infrastructure, support and maintenance
(Ashely, 2008). In this project was done for the following arguments:
It implied no risk of system failure
Maintenance and support was to be entirely repatriated to the outsourcer
However, because of the following reasons it was not used for this particular project:
Research information is patented and confidentiality is key so outsourcing would
have increased vulnerability of information security breaches.
Managers would have lost control since the outsourcer would have different standards
The organisation was going to be susceptible to accounting to unconfirmed costs
since external costs are directly variable to additional costs
Quality assurance is compromised since the outsourcer may compromise the product
to maximize profits
Contracting activities implies ensuring the well service of another organisation and
this is detrimental to innovation and cost reduction especially in this economy.

37
Outsourcing would have demotivate the personnel in the information and technology
department
It was generally more costly, because the outsourcer included a mark-up onto the
product developed
3.7.3 Total Insourcing
Insourcing is performing all business functions that can be given to an outside contractor, within
the organisation’s departments (Theodosios, 2014). Schniederjans, Schniederjans &
Schniederjans, (2015) furthered by saying insourcing can also be defined as hiring or bringing in
a third party outsourcer to work within the company facilities. Though there may be technology
lags within the organisation, it induced effort in developing the information technology
department. Doing so, will enable the organization to bridge efforts and the probable success
attached by information technology alignment. Using this way, the organization had to develop
its own customized system, this deemed this way the best alternative because of the following
reasons:
The system had to customized hence synching with the business needs of the organisation
It had cater for all farmer and researcher requirements
Cost reduction in consultancy which is inherently expensive
Due to the security of information issues as well as patents to new finding, it was
important to develop internally.
It does needed transparency of all costs.
Development equipment capacitated the use of the system in future projects without
reacquiring the products.
3.7 Requirements Analysis
Hay (2011) exemplifies requirements analysis to the process of pivoting the expectations of
the user with the new system. It is also termed as requirements engineering and the
requirements are mandated to be quantifiable, detailed and relevant. There are functional
and non-functional requirements. Requirement analysis showed the stakeholders and their
role in the system in form of a use case diagram as shown:

38
3.8 Use Case
The following is a use case diagram represented in a logical concept form. It
shows the actors in the system which are the stakeholders, these actors perform
use cases. In this system there are:
I. Farmer – this represented a regular customer who access the database
using a mobile phone
II. Researcher- this actor would be working with new research areas from
the farmer
III. Administrator-was managing the trips made by the researcher as well and
allocate researchers to farmers

39
Figure 3.7 Use Case Diagram
Makes an appointment
Farmer
Approves appointment
Visits the farm
Researcher
Assign researcher to
farm
Administrator
Updates
Researcher availability
Feedback on farm
Updates disease
information
Schedules
Workshops
Generate
Reports

40
Key:
Component Meaning
Actor
Use Case
3.8.1 Functional Requirements
Central Database: There was going to be a central database that runs simultaneously and
concurrently for multi user thus all updates will be done at the same time and refute all
the update issues.
Security: The system would be having security features such as access levels and
encryption of confidential information.
Report Generation: Feedback of findings is of paramount importance in the
organization. From this understanding the system needed to generate of accurate reports.
These reports were going to be used by management and external stakeholders as the
government.
Real Time Expert Information: The system had to be in real time as well as mobile
hence bringing real time information and assist the farmers immediately.
41
Verification and Validation: The system underwent both black and white box testing to
ensure that it cannot be tempered with or manipulated with by any unauthorized user.
This was for confirming the efficiency and reliability of information
3.8.2 Nonfunctional Requirements
Interface of the System: the system is easy to use to avoid and reduce confusion as well
as support costs and assistance from the IT department. It also came with a manual
showing stakeholders who use the system how to use the system.
Backup: There is a possibility that the system will crash and or be susceptible to
information loss and it may be hard to retrieve. It was of paramount importance that the
system have a backup which is done at frequent intervals.
Exception Handling: There was enough validation to allow the possibility of error
making, such as not entering a required field.
3.9 Constraints
The most probable constraint was the issue of time and convening organizations to
intercommunicate to produce the best product for the farmers.
Most farmers stereotypically are not technologically savvy and there was a probability
that if not deployed well the system would be rejected by the most valuable client that is
the farmer.
The system needed to be deployed on android phones and this will imply there will need
for the purchasing of new gadgets that the farmers may or may not have been preparing
to do.
An upgrade of even the stakeholder’s machines was needed since computers with lesser
specifications will not be able to host the system as it will be carrying big data.
A purchase of a server or rental of server space was needed and this was costly.
Internet connection may be slow in some farming regions as the service providers may
not have set up boosters in those locations.
42
Internet data charges will also be incurred as the farmers will need to download database
updates and data using connectivity and in places with poor connections this may be
detrimental to their overall activity.
Licensing of some of the product that will be used may be a constraint since they are
costly however these may be sunk cost at the end of the day.
These constraints stated above may inherently be the cause of failure to deliver a product
within the scheduled time.
3.10 Conclusion
This phase exhausted the analysis and requirements analysis of the current system clearly
stating the weaknesses of the current system and evaluated the alternatives that are there. There
was clear elucidation of diagrammatic representation of the processes that were being
undertaken. After this there was the design phase which focused on architectural, physical,
database, program and menu as well as security design. The phase looked at the pseudo code of
the proposed system.

43
CHAPTER FOUR: DESIGN PHASE
4.1 Introduction
In the design phase a clear facet of how the projected system was going to be augmented and
how it was going to be working was made. There was also a description of the system’s software
and software infrastructure as well as the other hardware that will be prerequisite in the
architectural design section. In this phase there a clear concept on how the database and the
interfaces was developed and designed.
4.1.1 Description of the proposed System
This system is a crop disease information system that help give farmer expert information. It
allows farmers to capture the image of the disease and retrieve information about that disease. If
there is a new disease that may have not been recorded it is flagged into the system and
researchers can attend to it. Other stakeholders, as all the interested parties that have interests
pertaining the farming sector and diseases can view the spatial data that will be displayed in the
web based version of the system. The system came a few text and click only ensuring a simple to
use system that can accommodate anyone who is not too savvy with technology.
4.1.2 Inputs
The system uses mobile phones, laptops and desktop computers. There is need of the Internet as
well as printers if in any case a hardcopy is required. Information is saved on a strong Microsoft
Server.
4.1.3 Processes
The proposed system gives expert information by a click of a button. It eradicates all the
maneuvering from geographical places that was in the existing system. There is an all-electronic
processing of every request and information will be retrieved by a click of a button. The system
being digital, transformed the inputs accurately and efficiently into outputs.
44
4.1.4 Outputs
The farmers as presented before retrieves expert information by a click of a button. There is
disease data that will be represented using co-ordinate form. There reports data that can be used
by management to make planning and disease mitigation decisions
4.2 Systems Design
Systems design being a rigorous and systematic approach to materialise the objectives of any
system development, it will show how the system was developed and how it is executing. The
proposed system does number of functions which include:
Capture a crop image and retrieve information that is particular to it
Report images that is not assigned to any disease in the database.
The design phase basically emphasized on the following:
I. The Efficiency of the system
It answers the question, does the system meet the user requirements since it was
augmented upon the robust analysis of the existing system.
II. The Functionalities
The system had to give the required functionalities specified in the user requirements and
can be modified to further meet the requirements.
III. The System User Friendliness
The system had to be simple to use giving less to zero consultations.
IV. The Security
The system had to be robust against any security breaches giving access to authorized
users. This was ensured via the use of passwords and access levels.
V. The Performance
It should have performed with accordance to a set of standards that it is expected to do so.
4.2.1 Logical Design
This phase looked at how the system was functioning and modeled the processes that were
incorporated in the system. This was done through a context diagram which is also known as a
level zero dataflow diagram showing system scope and boundaries and a dataflow diagram

45
(Rosenablatt, 2013). A dataflow diagram is an object oriented analysis mapping out the flow of
information in a system (Rajaraman, 2011). These diagrams are represented as follows:
Figure 4.1: Context diagram of proposed system
0
CROP AND
LIVESTOCK
GIS
Farmer
Researcher Office Administrator
Crop and Livestock Images
Reports
Workshop Details
Crop and Livestock
details
Research Details
details
Undocumented
disease details
details

46
Farmer
Researcher
1
Capture image
2
Check disease
availability
5
Bullet news
7
Give Feedback
6
Schedule Workshops
3
Create new disease
information
News Bulletins
Feedback
New disease Image
Crop Image
New disease details
Capture crop image
Disease details
Captured Crop
Image
Unavailable account details
Report details
Reports 8
Generate reports
Captured Images
New Disease
information
Past workshop details
New education
pointers
Workshop
feedback details
Workshop dates
Feedback
New disease
details Office
administrator
Unidentified diseases
New Disease Details
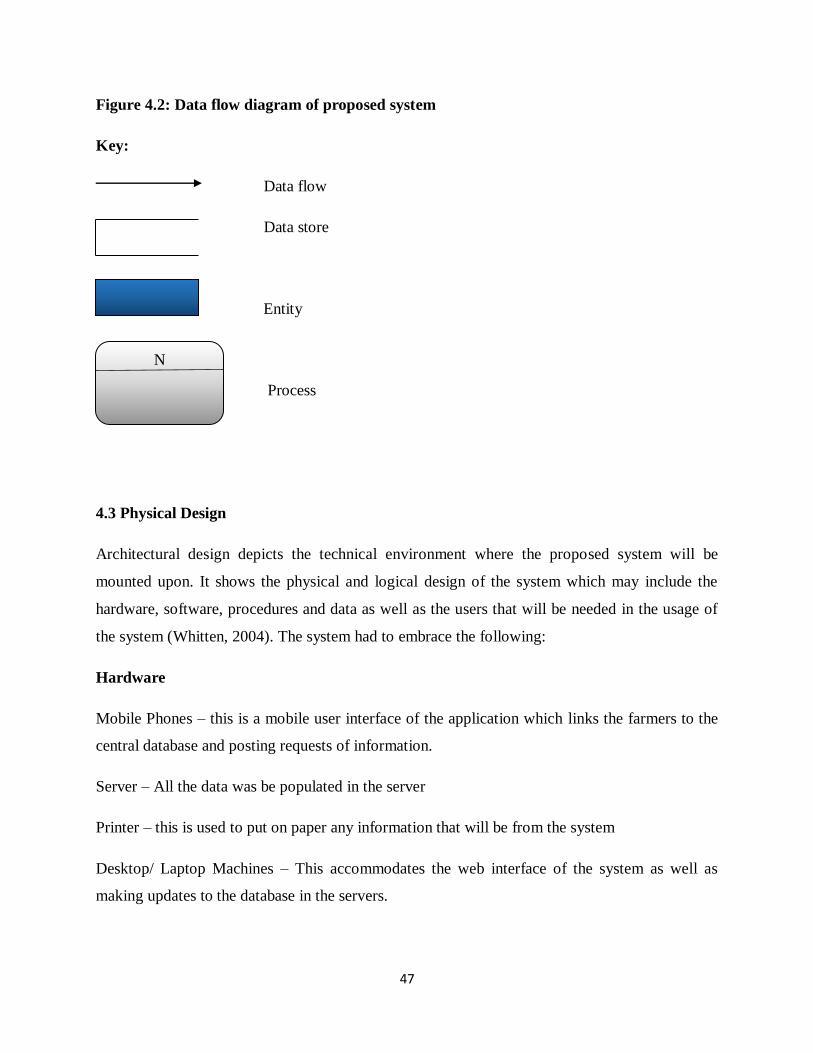
47
Figure 4.2: Data flow diagram of proposed system
Key:
Data flow
Data store
Entity
Process
4.3 Physical Design
Architectural design depicts the technical environment where the proposed system will be
mounted upon. It shows the physical and logical design of the system which may include the
hardware, software, procedures and data as well as the users that will be needed in the usage of
the system (Whitten, 2004). The system had to embrace the following:
Hardware
Mobile Phones – this is a mobile user interface of the application which links the farmers to the
central database and posting requests of information.
Server – All the data was be populated in the server
Printer – this is used to put on paper any information that will be from the system
Desktop/ Laptop Machines – This accommodates the web interface of the system as well as
making updates to the database in the servers.
N

48
Switch – it is a central link that distributes internet and other local area network connection that
came with the server.
Network cables and Router- this furthers distribute the network
The exact component was detailed with specifications in the following table:
Table 4.1: Hardware Specifications
Hardware Hardware Specifications
Desktop Computers Intel Pentium IV processors, 500GB Hard drive
Printers 1320 HP Laser Jet printer, Drivers and interface cables
Network Devices 24 port Trend net Hub, RJ-45 sockets, network cable
and 10/100 mbps Ethernet cards
Server Dell PowerEdge 2950 III Quad Core 16 GB 1TB
Network Cables Cat6 550 MHz 10Gbps
Router Netgear Nighthawk AC1750 Smart Dual Band Wi-Fi
Router
Switch Netgear GS105Ev2 24-Port Gigabit Smart Managed
Plus

49
Software Requirements
The following are the software requirements of the system and the purpose they served in the
development of the system:
Table 4.2 Software Requirements
Software Purpose
Microsoft Visual Studio
2015
It is an Integrated Development Environment (IDE)
doing the actual development of the system
SQL Server It is a database management used to perform tasks
queried by the database
SQLLite It is a self-contained transitioning engine that will be
doing the database manipulations and communicating
with the server.
Android Studio It is the IDE developing the mobile platform
GPS It enhances the taking of geo-coordinates
Xamarin Studio It aided in the development of the mobile platform.
Azure It helps in application development.
4.4 Architecture Design
This phase embraces how the hardware components was distributed to give the optimum
communication with the software requirements. There is a client server network architecture
where each computer a client or a server and the database is stored on the server (McGovern,
2004). All the client machines will be accessing the server either remotely or physically
depending on the location and the mobile devices will communicate with the server remotely via
the internet. There will be two types of connections which are the Local Area Network (LAN)
and Remote Access, where the LAN will be used for those client machines that have a close
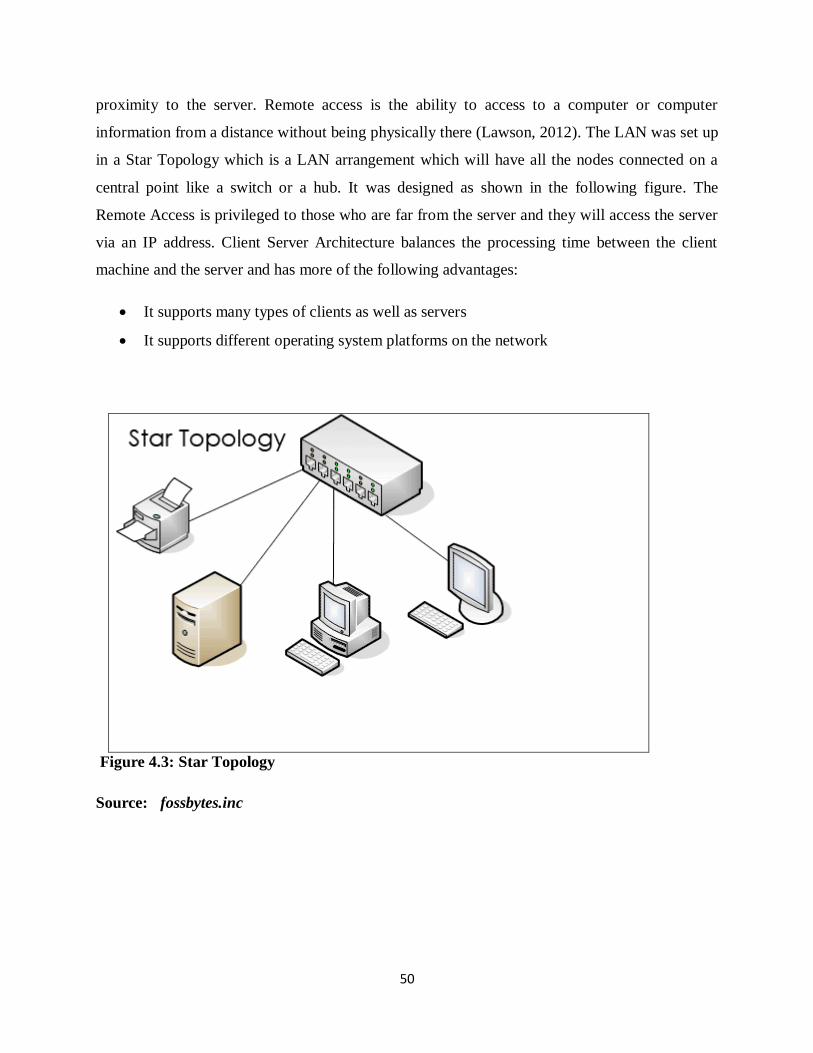
50
proximity to the server. Remote access is the ability to access to a computer or computer
information from a distance without being physically there (Lawson, 2012). The LAN was set up
in a Star Topology which is a LAN arrangement which will have all the nodes connected on a
central point like a switch or a hub. It was designed as shown in the following figure. The
Remote Access is privileged to those who are far from the server and they will access the server
via an IP address. Client Server Architecture balances the processing time between the client
machine and the server and has more of the following advantages:
It supports many types of clients as well as servers
It supports different operating system platforms on the network
Figure 4.3: Star Topology
Source: fossbytes.inc

51
Figure 4.4: Remote Access
Source: techheads.au.uk
4.5 Database Design
The data collected is being warehoused in an azure relational database which uniquely stores
information with tags. The proposed system has a database management system as it defines,
manipulates, constructs and maintain the database amongst the user and applications. The system
user information was designed using SQL Server as the database Management System. This
choice was made over the file based system because of:
Integration of files was easy and normalisation is effected to reduce data redundancy
There was improved security by the use of passwords and access levels
There was incorporation of data in one central database hence reducing costs
There was backup and recovery facilities
There was room for concurrency and a well effected concurrency control algorithm
There was data consistency since data will be validated upon entry
The design of the database was represented in a physical and logical form:

52
4.5.1 Physical Database Design
This is the actual architecture of the database identifying the schemas in the system. The design
describes the arrangement of data in the database in the form of schemas or layers. In the
database, there is the physical, conceptual and application layers as shown in the following:
Figure 4.5: Database Architecture Layers
Source: SlidePlayer.com.inc
View 1 View 2 View n
Conceptual Layer
Internal Layer
Database

53
a) Physical Layer
This is the actual location where the data will be stored.
b) Conceptual Layer
In this level, data is stored in the database and collaborated with the relationships that the
data has. The data is stored in tables which were validated by the design to ensure what
the database stores in that particular table. The table attributes and data types standardises
data being stored and attributes include integers and strings. This was where queries were
also defined to know how the data can be retrieved
c) Application Layer/View Level
This is abstraction at its highest level. It simplifies the user interaction with the database
thus the user can manipulate the data. There is also viewing processed data in form of
reports and grid views, Manipulation at the user’s end is done by SQL. Tables have either
one to many or many to many relationships. The following is a normalised schema of a
sample table in the database. The field name is the attribute name, the data type means
the type of the characters for example string or long. With the data type it will check the
maximum characters accepted on that field.
Table 4.3 User Table
Field Name Data Type
Username VarChar (50)
Password VarChar (50)
Access Level Int (10)
4.5.1 Logical Database Design
This is the identification of the entities in the system and how they relate to each other. This will
be done using an entity relationship diagram and an enhanced entity relationship diagram.
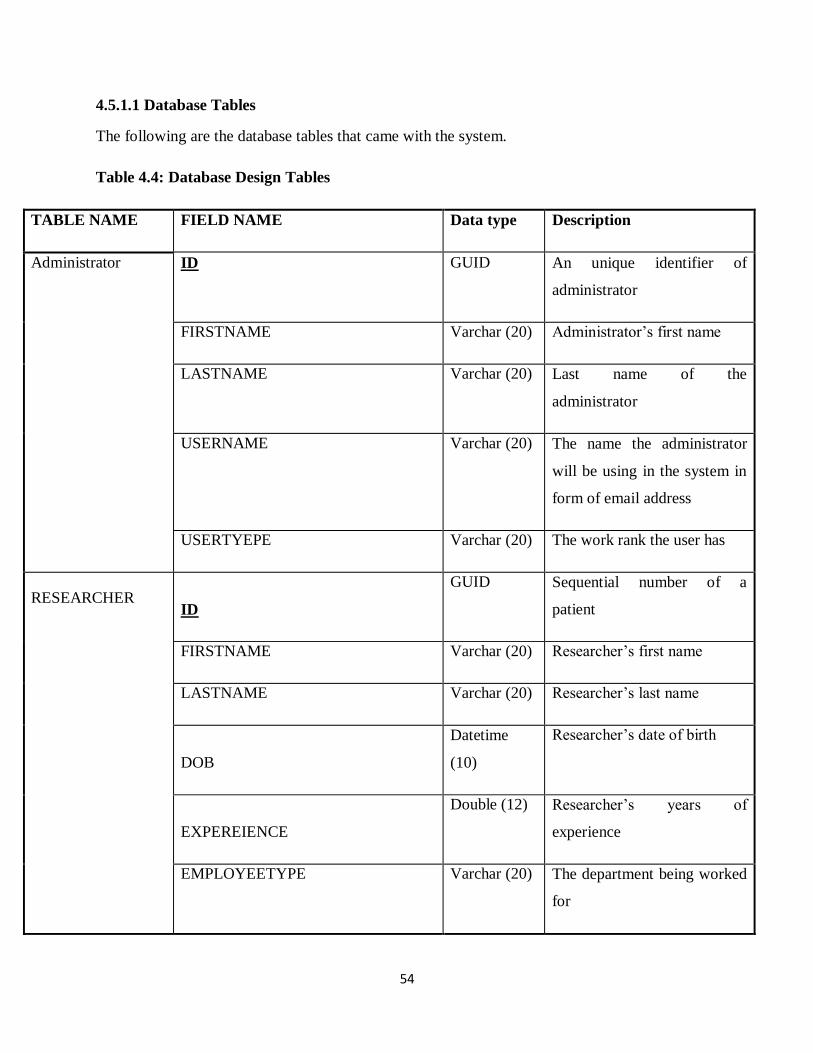
54
4.5.1.1 Database Tables
The following are the database tables that came with the system.
Table 4.4: Database Design Tables
TABLE NAME FIELD NAME Data type Description
Administrator ID GUID An unique identifier of
administrator
FIRSTNAME Varchar (20) Administrator’s first name
LASTNAME Varchar (20) Last name of the
administrator
USERNAME Varchar (20) The name the administrator
will be using in the system in
form of email address
USERTYEPE Varchar (20) The work rank the user has
RESEARCHER ID
GUID Sequential number of a
patient
FIRSTNAME Varchar (20) Researcher’s first name
LASTNAME Varchar (20) Researcher’s last name
DOB
Datetime
(10)
Researcher’s date of birth
EXPEREIENCE
Double (12) Researcher’s years of
experience
EMPLOYEETYPE Varchar (20) The department being worked
for

55
Figure 4.6: Enhanced Entity Relationship Diagram
Web Users
Researcher
Administrator
O
Farmer
Username Password Id
Name
Rank
Inform
s
Views
Manages
Name Address ID No Tel no
New
disease
1
M
M
M M
M
Access
Level
schedules
Workshop
details
M
M
Disease Details
Adds
Receives
Gets
Feedback
Workshop
details
Gets
M

56
4.6 Program Design
In this phase there is the actual augmentation of modules functions and classes of the proposed
system. The design methodology will break down the system into subsystem and further into
modules. This will be represented into:
Package diagram
Class diagram
Collaboration diagram
Entity
Super-type sub-type discriminator
Relationship
Attribute

57
4.6.1 Package Diagram
This shows the dependencies between packages. It helps see views using different angles on the
tier basis (Ambler, 2005). The following represents the packages of the system:

58
Figure 4.7: Package Diagram
.WebUser
Web API Utils Com::Site::Resources
Views
Partial
views
DBMS
MVC SQL Server
GUI
Farmer
Mobile Module
Reports
Diseases Researcher
Admin

59
Key:
4.6.2 Class Diagram
This is a static structure diagram describing the system structure, showing their classes and
attributes as well as operations and relationships conjoined (Terry, 2000). The proposed system
has the farmer, the stakeholders and administrator as some of the main classes as represented in
the following:
Package
Generalisation
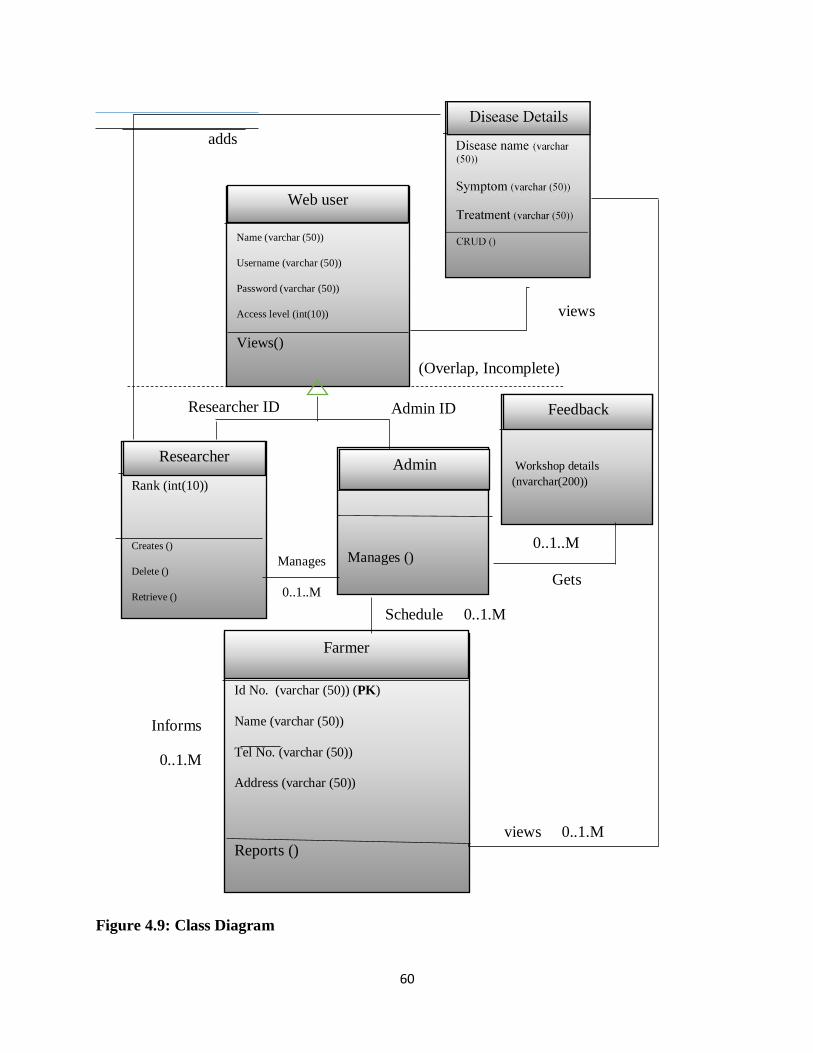
60
Figure 4.9: Class Diagram
Rank (int(10))
Creates ()
Delete ()
Retrieve ()
Researcher
Manages ()
Admin
Id No. (varchar (50)) (PK)
Name (varchar (50))
Tel No. (varchar (50))
Address (varchar (50))
Reports ()
Farmer
Admin ID Researcher ID
(Overlap, Incomplete)
Manages
0..1..M
Schedule 0..1.M
Informs
0..1.M
(GUID) (PK)
Name (varchar (50))
Username (varchar (50))
Password (varchar (50))
Access level (int(10))
Views()
Web user
Workshop details
(nvarchar(200))
Feedback
Gets
adds
views
views 0..1.M
0..1..M

61
4.6.3 Sequence Diagram
This is an interaction structure which emphasizes on the organisation of and the relationships that
are amongst objects. They show different views from each perspective (B’far, 2004). The
proposed system will have the following collaborations:
Figure 4.10 Sequence diagram
4.7 Interface Design
This was designed to handle all the interactions platform as viewed by the user also known as the
graphical user interface. The Interface of the system is definitely user friendly with little to no
complexity. It acts as a display tool to communicate between the user and low level tiers of the
system which included the database. There is a mobile interface for the farmers and a web based
user interface for the other stakeholders. The web based interface is able to communicate to the
server retrieving information from the central database. The following are the main forms that
are in the system:

62
a) Login Form
This form authenticates the users that will be given access in the system. Depending on the
access levels it will give you either entire or partial access to all the facets of the system.
Login Form
Password Recovery
Figure 4.11: Login form
Cancel Login
Username
Password

63
Forgot Password form
This form helps retrieve password to any user who would have lost their credentials to the
system. This form is shown after the user have clicked the Password Recovery text in the login
form. The form will be as follows:
Forgot Password Form
Figure 4.12: Forgot Password Form
b) New Research Form
The form makes the researcher able to register new pest and diseases that are new to the
database. It even manages to make manipulations in the database which will update the
information in the database. The following displays the diagrammatic interface of the form:
Figure 4.13: New Research Form
New Research Form
Cancel Done
New Password
Repeat Password
Cancel Done
Disease Name
Disease Details
Method of Treatment
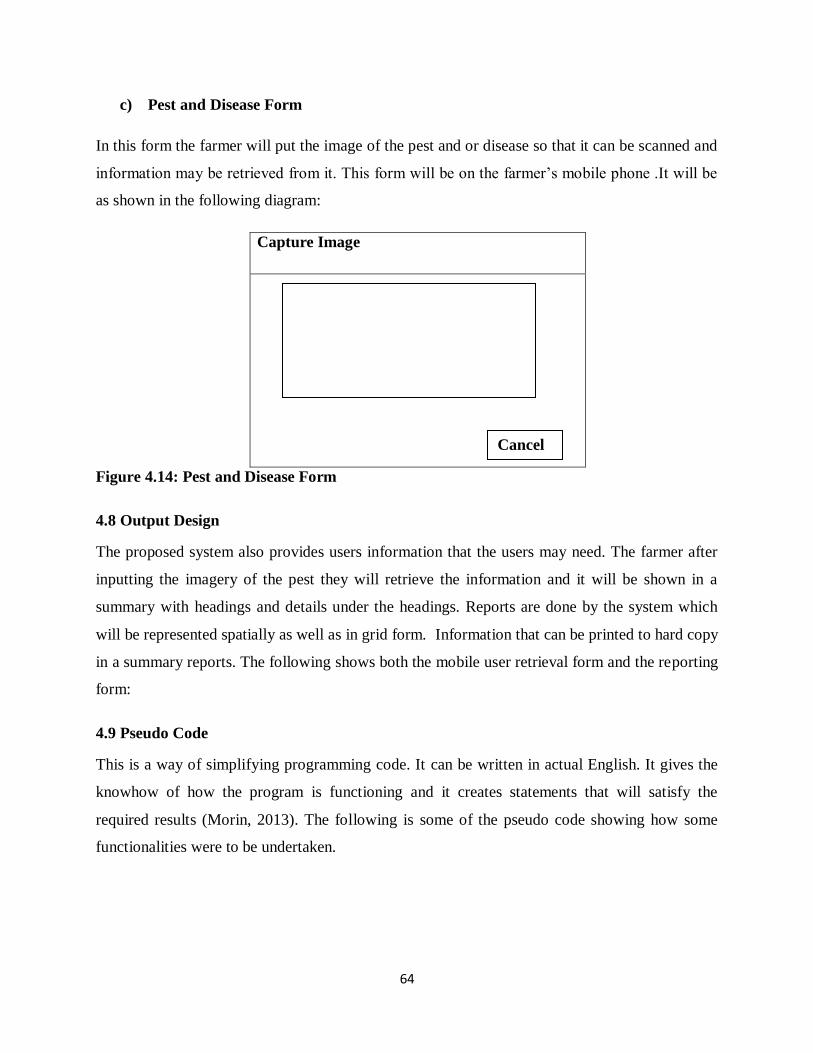
64
c) Pest and Disease Form
In this form the farmer will put the image of the pest and or disease so that it can be scanned and
information may be retrieved from it. This form will be on the farmer’s mobile phone .It will be
as shown in the following diagram:
Capture Image
Figure 4.14: Pest and Disease Form
4.8 Output Design
The proposed system also provides users information that the users may need. The farmer after
inputting the imagery of the pest they will retrieve the information and it will be shown in a
summary with headings and details under the headings. Reports are done by the system which
will be represented spatially as well as in grid form. Information that can be printed to hard copy
in a summary reports. The following shows both the mobile user retrieval form and the reporting
form:
4.9 Pseudo Code
This is a way of simplifying programming code. It can be written in actual English. It gives the
knowhow of how the program is functioning and it creates statements that will satisfy the
required results (Morin, 2013). The following is some of the pseudo code showing how some
functionalities were to be undertaken.
Cancel

65
Procedure on Login
Open Page Window
Prompt User to enter credentials
If input is null
Then display (“Please Enter username and Password”)
If user input is NOT equal to username && password
Then display (“Please Enter Correct Credentials”)
Else Login
Display Main Form
Procedure on New Disease
Start Mobile Application
Scan Image
If scanned image is NOT equal to Database disease
Then display (“Disease not found. Do you want to report new Disease?”)
If Response == yes
Then get coordinates
End
4.10 Security Design
This is the architecture of how unwanted or unauthorised entries can be mitigated. Standards or
precautions were set to ensure less risk of either security breaches or loss of information
(Wheeler, 2011). The system look at the following security design:

66
4.10.1 Physical Security Design
The server ensures security is housed in a room that can be locked and the keys will be managed
by the administrator and a request to visit the server form shall be filled when needed.
4.10.2 Network Security Design
The network barriers to unauthorized entry is enhancing by use of firewalls and passwords on the
network connection (Convery, 2004). Moreover, the antivirus installed also has a firewall to help
advance the network security.
4.10.3 Operational Security Design
This is safeguarding the day to day operations, manage sensitive information and maintenance of
secrecy when needed (Guidspot.inc, 2017). In this system this is ensured by the use of passwords
on the system and access levels as well as backup of a certain interval of time.
4.10.4 Database Security Design
Since the database is the central warehouse of all the system data it will need a password and
level access rights as administrator, where it will filter what each authorized users will view and
well as manipulation rights (Thuraisingham, 2007). This will restrict access to unauthorized
users.
4.10.5 Software Security Design
The Web based API authorized user access. There is now access levels which the system is
privileged pertaining manipulation and viewing. Client machines have an antivirus to protect
software and the firewall.
4.11 Conclusion
This phase has focused on the design phase of the system, clearly pointing the systems design as
well as the architectural design, the physical design and the database design. It also looked at the
program design showing the sequence diagram and the class diagrams. There after it explained
the interface design giving a bit of pseudo code as well as the security design of the system.

67
From this phase there was the implementation phase where there would be testing, installations
and maintenance as well as the recommendations that the system requires if any.

68
CHAPTER FIVE: IMPLEMENTATION PHASE
5.1 Introduction
The implementation stage where there is the actual code of the system that is implemented after
the design phase. The software system went under several testing to confirm if there are any
errors. These tests were done before the system was installed to the user and the steps are iterated
until the system passed all the tests. Thereafter, the system was deployed and installed on the
internet. Training was done as well as maintenance and recommendations for future use. All in
all, this phase looked at the implementation plan and how to effect maximum system
exploitation. There are details of various changeover plans and all types of testing before the
system is installed.
5.2 Coding
Coding is writing commands that will help interact with the system in a programming language
as C# or Java (codeconquest.inc, 2017). Design was done using Microsoft Visual Studio and
SQL server with SQLite as the database management of the system. Microsoft Visual Studio was
used to develop the graphic user interface with ASP.Net. The intelligent algorithm was done with
Azure. The system was modularized based on the procedures as regarded by object oriented
programming. The modules were then assembled into one application. The SQL Server Database
Management was used to link the program to the database. SQLite was used for the same
connection only on the mobile version of the system. The database manager was responsible of
query execution such the SELECT, INSERT and DELETE as well as managing views.
5.3 Testing
System testing is the process of verifying the integrated system modules to see if it is performing
as per requirements (softwaretestingfundamentals.inc, 2017). Testing for the crop information
system was done using the following techniques:
Unit testing
System testing
Acceptance testing
Module testing
69
5.3.1 Unit Testing
This refers to the testing of a specific and directed part of code normally code on a functional
level. Components were tested individually and independently to verify whether there any errors
may happen. These errors include runtime errors which may happen when the system is in
operation (softwarequality.inc, 2017). Two techniques are used for this type of testing which
include:
Black box Testing
This is a testing of the system interior components versus the output that it produces
when a condition has been parsed. It tests the absence of functional requirements in
relation to the objectives that would have been imposed (Valacich, 2012).
a) Advantages
- It puts into consideration the actual user than the programmer
- The test is unbiased since the results will prove the condition that would have been
entered
b) Disadvantages
- It is very vague that not all tests will be considered in the testing
- As it is vague, it is also difficult to confirm which type of test was being in to
consideration.
The system underwent black box testing.
White box testing
This is testing of the internal operations of the program. This type of testing goes deeper
with detail on identifying errors not revealed by the black box testing method
(softwarequality.inc, 2017).
a) Advantages
- It is precise since a test will be focused on the functionality being tested
b) Disadvantages
- The one testing must be well vexed with programming to be able to perform such test.

70
Defect testing
Under this testing, there is irregularities discovery within the system. It opened up the system
errors before the system is deployed (softwarequality.inc, 2017). The following diagram
shows defect testing process:
Figure 5.1: Defect Testing
Source: softwaretestinghelp.inc
From the diagram:
Test Data: This is input that has been inserted into the system to confirm if the system
will compile relevant reports in the system
Test Cases: These are input and output specifications of the module that is being tested
Test Results: These are the outcomes that come out when each modules have been run.
They are then summed to give a big picture of if the system is functioning well
Test Report: This is now the summarized on the system as a whole to confirm if it meets
user requirements
5.3.2 Module Testing
This is the collection of component that depended on each other for functionality, for example a
package or collection of functions and or inherent procedures (softwarequality.inc, 2017). This
Test
Cases.
Test data. Test
Results.
Test
Report.
Define Test
Data.
Prepare
Test Data
Run Program
with Test
Data.
Compare results
with Test Cases.
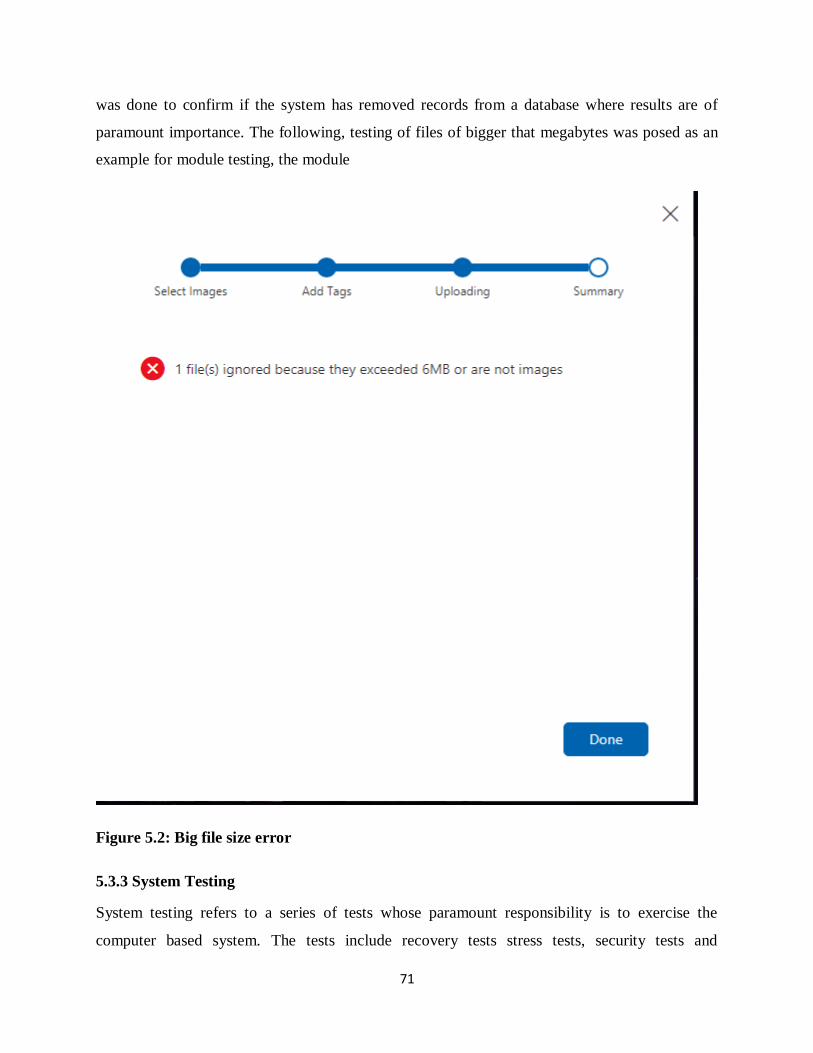
71
was done to confirm if the system has removed records from a database where results are of
paramount importance. The following, testing of files of bigger that megabytes was posed as an
example for module testing, the module
Figure 5.2: Big file size error
5.3.3 System Testing
System testing refers to a series of tests whose paramount responsibility is to exercise the
computer based system. The tests include recovery tests stress tests, security tests and
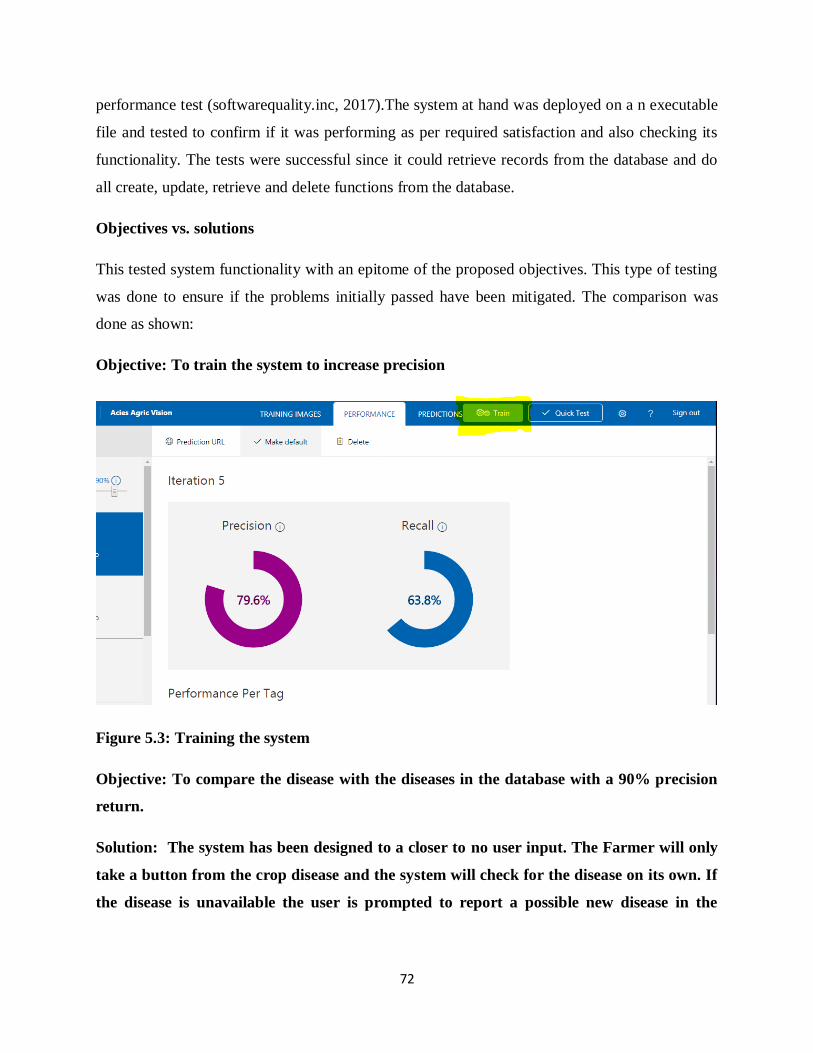
72
performance test (softwarequality.inc, 2017).The system at hand was deployed on a n executable
file and tested to confirm if it was performing as per required satisfaction and also checking its
functionality. The tests were successful since it could retrieve records from the database and do
all create, update, retrieve and delete functions from the database.
Objectives vs. solutions
This tested system functionality with an epitome of the proposed objectives. This type of testing
was done to ensure if the problems initially passed have been mitigated. The comparison was
done as shown:
Objective: To train the system to increase precision
Figure 5.3: Training the system
Objective: To compare the disease with the diseases in the database with a 90% precision
return.
Solution: The system has been designed to a closer to no user input. The Farmer will only
take a button from the crop disease and the system will check for the disease on its own. If
the disease is unavailable the user is prompted to report a possible new disease in the

73
database that will notify directly the administrators and research on that disease is done as
follows:
Figure 5.4: Comparison Results

74
Figure 5.5: Display of available disease which the user will refer to.
Objective: To measure the system reliability via performance tests
Solution: The system will calculate the total number of test images and expresses it in terms
of an average of the precise images that satisfy the system requirements. The system will
pronounce to you in terms of a pie chart of how reliable a test is using the precision and
recall charts.

75
Figure 5. 6: Performance Test Results
Objective: To group all untagged data for the web users of untrained images
Solution: The web platform will save all untagged images that help the researcher to
update the database quickly. This will tag a summary in the predictions tab of the system.
Figure 5.7 : Untagged image in the system.

76
Objective: To self-learn from its mistakes, helping in disease precision
Solution: The system has an algorithm that enables it to learn from its past experience.
This entells the system has the ability to help the trainer make better on the tags to put on
that image.
Figure 5.8 : Suggestive prediction to tag training images.
5.3.5 Verification and Validation
The system had to go under validation and verification processes.
5.3.5.1 Validation
System validation tends to answer the question, “Is this the RIGHT software?” Validation is the
evaluation of software system to determine whether the components of the product satisfy the
conditions put into consideration (ieee.inc, 2017). It was carried out to determine if the
augmented system is conforming to the specific user requirements. As posed in system testing,
there needed insurance of the system meeting the expectations of the users. This process also
aided in informing or notifying the user if the input entered is the right data format that is
required by the system. Specific tests are exercised which include the following:

77
Regression Testing- Here was performed on the system to ensure if the features of the
system are working. This is done by comparing the system functions of the older system
versus the functions of the new system (guru99.inc, 2017).
Recovery Testing – the system is crashed on purpose to confirm if records that had been
entered are lost. This benchmark the system performance with the previous methods of
saving data (tutorialspoint.edu, 2017).
To ensure that the image is of a file type is acceptable, the system itself filter the image types as
follows:
If the file size is bigger than the required the system the system airs an error written as follows.
The system does not allow the same disease tags on one training image.
Figure 5.9: Same Tag example
When there is a same tag, the system will not allow to enter it on the tags, it does not add
the tag.
The system is intelligent enough to help the researcher confirm the precision of tags on
images, thus helping the researcher to filter information to be precise. The previous
Iterations will help the system make precision to the images that may come later. This is
shown by a percentile on the image tags shown as follows.

78
Figure 5.10: Image Summary confirming precision
Security Testing -This ensured that there is no unauthorised entry by any party. It
included attempting to illegally acquire information to obtain information and or sending
in threats to harm the system. This substantially rebates the fact that the system will
remain strongly functional and not allow unauthorised access (owasp.com, 2017). For
instance if there is unauthorised access on the web and a web user fill in the wrong
credentials, the system does not log in instead reflects an error to tell the user the
username and password do not match. The system is highly secure since it uses Microsoft
authentication. The following are how the system will validate a user:
Stress Testing – Here abnormal requests were made to increase the rate at which it is
asked to accept information. This can also be termed as the rate at which information is
required to be produced by the system. This helps to realize the system’s strength after
use by a large number of users. Since this is an Internet requiring application, if the
system runs to a time out it will show an error as follows:

79
.
Figure 5.11: System Timeout
Performance Testing- This tested the robustness of the system, checking if the memory
size accommodate a lot of user activity. It is checking the main memory, buffer memory
and other secondary memories to confirm its response time (tutorialspoint.edu, 2017).
Usability Testing- Under this testing there was checking if the system user friendly. The
test was achieved by developing prototype that will require the system user to have a feel
and confirm if they can use the system without much hassle (guru99.inc, 2017).
Alpha and Beta Testing- Here end users were given a real feel of the actual system. This
is sampled to a smaller cell of users who in turn give feedback to the production team on
what they require changed. Once the users were satisfied with this type of test then the
real system was deployed to all users (guru99.inc, 2017).
As said earlier, the system uses Microsoft authentication since it is hosted by Azure. The
following are the validation testing that were handled by the system on inputting data:
a) User credential input validation
Upon registering there are certain characters required by the system when inputting a
password. A password must contain special characters as asterisks and periods, at least one
number and uppercase letters for it to be deemed an acceptably strong password. The
username is in an email format. If the users does not put full characters required on the
username and password it will not log in and flags the following:

80
Figure 5.12: User credentials input Validation
b) Null input validation
When the user just presses enter without filling in details, the system will flag errors as
shown in the following figure:

81
Figure 5.13: Null values on signing in
5.3.5.2 Verification
Verification is now the process of evaluating the system shaping whether the product satisfy the
conditions imposed (istqbExamCertification.inc, 2017).This was carried out to figure out if the
specifications were well met. There was confirming if the system components were properly
functioning. It was done using test data and comparing the results with what was expected from
the system.
5.3.6 System Security
This poses as one of the most important part of testing. To ensure a high capacitate
authentication the system was hosted in azure with a Microsoft authentication which is a globally
recognized authentication and amount to subscription to be privileged to these facilities. This
was testing the security governing the system from possible threats and under it there are:
a) If a user does not enter the correct username, an error will flag the following error:

82
Figure 5.14: Wrong username input
b) If a user does not input the correct password the system will flag
Figure 5.15: Wrong password
83
5.3.6.1 Physical Security
This was pursued by adopting the following processes:
Physical Locks: The server, since it contains sensitive data should be monitored every
time by the organisation’s security. The server room will be locked and every access to it
should be documented with a name to serve as aid when a threat occurs. Conditioners
were put to maintain the cooling of the server and an additional power should be cited to
power the server when there are power cuts. All these are situated in one room and the
room is locked.
Log-in Book: As cited before, there is a clocking strategy that documents every
instantaneous access to the physical server. The clocking records and document the time
of access and the departure time of the server room by any user who may access the
room.
Fire Control: The server has sensors and alarms that notify when a smoke or fire has
been detected. The fire controls will put out fire in its early stages as well as warn
stakeholders so that they will act as soon as they can. This meant the server on its own
had to be in a compartment that ensures that the sprinklers will not put water on the
server.
5.3.6.2 Software Security
This is the insurance of the system safety from intruders (techopedia.inc, 2017) and these
include:
Database Authorisation: SQL Server Management System has a username and
password requiring technique. This will show each user access level relevant information
to the data. The following represents the password and user credentials required by
database manipulation:

84
Figure 5.16 Database login
System User Credentials: All users of the web based system should have user
credentials that include username and password. These also include the access levels to
the system information. The following depicts the user password and requirements upon
entering the system that if a user does not have these cannot access the system:
Figure 5.17 Login platform
5.3.6.3 Backup
This system has an independent back up strategy that occur when there is a reinstallation of
the system at any interval. The following are the types of backups the system will have

85
Print Outs: The system has reports that are used for audit tasks for future use. It
contains queries by the users and help in planning and control of the user
requirements
Backup Tapes: Every weekend, the system information is downloaded on an external
file and is stored offline to mitigate data loss. Some of the information is loaded on
the cloud which will be accessed by the managing team.
Standby Server: The system backs up itself every day after working ours when the
server will be on standby. The server itself has a mirroring technique that copies
information to different sleeves of the multiple drives that information will not be lost
easily.
5.3.4 Acceptance Testing
After all the system functionalities have been verified as working perfectly, there came the last
type of testing. Acceptance testing is referred to as the testing of the software system’s
acceptance to its users (softwaretestingfundamentals.inc, 2017). This was done using already
supplied data by the users and have an actual feel on the information entered into the system:
Figure 5.18: Testing
Unit testing
Module testing
System testing
Acceptance testing

86
Source: softwaretesting.inc
5.4 Installation
The system was deployed within the organisation as put in the design phase. The installation will
include the following:
Install SQL Server on the server
Insert the system executable in htdocs ready for deployment in http://localhost:56194
Run the setup script which include the database details thus creating them on the server
and first time login is required
5.4.1. Training
The users should be taught on how to operate the system. Since a few people would have been
acquainted during system testing, now everyone should also be educated on how the system
works. Training is done at:
Module Level: This is training on the users on specific modules of the system. Some
users will not need to use the whole system but just a part of the system hence there is
education at module level.
System Level: This is education of the whole system as a whole and is normally done to
management thus they have a full feel of the whole system hence making it better for
them even to help their subordinates if a query of how the system works is raised.
5.4.2 Changeover
This is now the process of replacing the old system with the new system after the certified
establishment of the environment and training has completed (smallbusiness.chron.com, 2017).
This aimed on the full exploitation of the system and maximum user acceptance. There was an
imperative focus on caution, attention and anticipation of probable faults. This implied that the
system will replace and is reformatted and probable faults mitigated. The following are the
changeover strategies that were available:
I. Pilot Conversion

87
In this type of conversion the system was going to be deployed on a small department of
the organisation mainly for testing. This department verifies the system functionalities.
Once the department have considered it a go, the system was deployed to the whole
organisation. With this technique, the risk is relatively small as it was only going to affect
one department and also the department will be running both the old and new system
(smallbusiness.chron.com, 2017).
II. Direct Conversion
Here the system directly replaces the old system at once. The old system is then
considered obsolete and users start using the new system. This conversion is low in cost
as only one system is in operation but there is more risk in data loss if the system is not
functional or crashes (smallbusiness.chron.com, 2017).
III. Phased Conversion
This technique is whereby the system is installed in parts thus giving users a feel of
familiarizing with the system until they are proficient in using it and slowly removing the
old system. There is moderate risk since there is thorough insurance of user exploitation
on the system (smallbusiness.chron.com, 2017).
IV. Parallel Conversion (Recommended Strategy)
This strategy now involved the old and new system working concurrently hence giving
the user a fall back plan when the new system stops working. There was much labour
associated with this conversion since there will be two system that will need data input.
However, there was less risk since there was and still is an abundance of back up options.
This strategy gave the user room to learn the system and migrate to the new system at the
user’s own pace (Chen, 2004). The steps in this conversion strategy included:
1. Installation of the system on the cloud
2. Train the users on how to use the system
3. Capturing of data
4. Do the same processes with the new as with the old system.
Rationale for Parallel Conversion

88
1. There was ample time to learn the system hence giving high productivity and maximum
exploitation
2. It reduced the failure to accept the new system
3. Risk were low since there is backup
5.5 Maintenance
Maintenance, the modification of software components and hardware components to improve on
performance and efficiency. This called to deliver aid when faults occur. The purpose was to
have full exploitation of the system software and a greater life usage as well as good acceptance
to the users (April & Abran, 2012). There are types of maintenance which include:
5.5.1 Corrective maintenance
In this type of maintenance there is a number of actions in an ongoing process. It is a continual
strategy that refute error when they occur. When an error occurs, investigation is carried out and
error handling activities are done. When the error has been solved, a documentation is done to
book when the error occur thus helping in future cases and add as historical data for future
analysis for augmentation. It focused on error handling without adding on new facets on the
system.
5.5.2. Perfective maintenance
This is direct improvement of the functions at an optimum thus making it possible to confirm if
upgrades are required. As system requirements changes over time, this type of maintenance was
going to help in the upgrades required.
5.5.3 Adaptive Maintenance
This dealt with the changes within the system’s operating sphere. It occurs when a certain area of
the system environment requires changing. For instance if a computer hardware is not working,
the change of the component is adaptive maintenances. This was also exercised on software
components as well. If the system environment is creating a limit in the exploitation of the
system functionality and when there are erratic changes in the system environment.

89
5.6 Recommendations
After the system had gone through the testing, testing and training, there was supposed to have
recommendations to exercise the maximum exploitation of the system.
5.6.1 To the Farmers
The farmers were recommended to be updating their database since it will be constantly updated
with the vast diseases that will be fed into the system database.
They needed to be savvy to send in notifications whether they deem the please report new image
as not important.
5.6.2 To the Researchers
The researchers had to be able to vet the type of new photos as a threat to crop disease or not.
They needed keep the database information updated that the farmers do not render the system as
incompetent.
The crop disease database had to be trained to ensure a higher level of precision
A well up-to-date browsing platform since the technologies that support the system can change
. The system should be constantly monitored to delete images without relevance thus the
database under untagged does not flood with images without tags.
5.6.3 To the Administrators
The administrators needed to consider the migration of the system to a flat database that handles
the storage of large amounts of data.
There was a requirement to upgrade the database into a flat database since the information will
be growing and may not accommodate big data.
For more security, the organisation were recommended to consider putting on a more
contemporary locking system as a biometric door and IP cameras which will help remotely
manipulate the server room.

90
They ensure that the system is consistently well maintained and convey to their subordinates that
if they face difficulties they should refer to them so that the threat may be mitigated in earnest
and not cause much harm to productivity
. The administrators should also not leave unauthorised personnel to do the maintenance.
A consistent touch with the developer is also required since there may be change in user
requirements.
5.6.4 General Recommendations
The users were urged to read the manual before use of the system so that they will have a
familiarisation of how the system works and refer to the user manual for assistance A strong
recommendation was also passed on the training of the system to increase its level of accuracy.
5.7 Conclusion
In this chapter, there was focus on the implementation of the system, how it was deployed and
training as well as actual use and maintenance and monitoring of the system performance.
Recommendations were also done on all the logical scenarios that were likely occur when the
system requires change to best suit the user requirements. As the last chapter, the documentation
of the system was thoroughly done. An in-depth survey on the problem at hand and probable
solution was done. Thereafter, an answer to the question; “Should we continue to pursue this”
was answered. A feasibility study was done. An analysis of the system was done checking
whether the system has enough resources to achieve it and the resources that are not there easy to
acquire. A logical and physical design was done which led to the actual implementation of the
software system.
91
REFERENCES
Ambler, S.W (2005), The Element of UMLTM 2.0 Style, Cambridge University Press,
Cambridge, UK
April, Abran (2012), Software Maintenance Management, John Wiley and Sons, New Jersey,
USA
Ashely, E (2008), Outsourcing for Dummies, John Wiley & Sons, New Jersey, USA
B’far, R (2004), Mobile Computing Principles: Designing and Developing Mobile Systems
using UML & XML, Cambridge University Press, Cambridge, UK
Brent, A (2007), Applied Accounting Systems, APM, Washington, USA
Boehme, C.C (2011), Feasibility, diagnostic accuracy and effectiveness: a multi
implementation, Lancet, UK
Chen, H (2004), Intelligence and Security Informatics, Springer Science and Business, Berlin,
Germany
Craig, V.S (2008), Information Communication Technologies: Concepts, Methods, Tools
and
Applications, Information Science Gathering, New York, USA
Convery, S (2004), Network Security Architecture, 2nd
Edition, Cisco Press, Indiana, USA
Dorneyei, Z (2014), The Psychology of a language learner, 2nd
Edition, Routledge, Abingdon,
UK
Friesen, M (2010), Expected End, 3rd
Edition, Lulu.com, North Carolina, USA
Gelinas, J.U, Dull, R.B and Wheeler, P (2015), Accounting Information Systems, 10th
Edition,
Cengage Learning, Boston, New York, USA
Gent I.P (2009), Principles and Practice of Constraint, 9th Edition, Springer Berlin Heideberg,
New York USA
Ghosh & Kumar (2003), Personnel Management and Industrial Relations, 2nd
Edition, Anmol
Publications, New Dehli
Ghuman, K (2010), Management: Concepts, Practice and Cases, McGraw Hill Education,
New York, USA
Haining, M (2003), Spatial Data Analysis: Theory and Practice, 2nd
Edition, Cambridge
University Press, UK

92
Hay, D.C (2011), Enterprise Model Patterns: Describing the World, 2nd
edition, Technics
Publications, Michigan, USA
Hill, C.W.L and Jones G.R (2008), Essentials of Strategic Management, 3rd
Edition, McGraw
Hill Education, New York, USA.
Hillson D, Simons. P (2007), Practical Project and Risk Management, 2nd
Edition, APM,
Washington, USA
Hopkinson, M (2017), Net Present Value and Risk Modelling for Projects, Quineti, UK
Jalloul, G (2004), UML by Example, Cambridge University Press, UK
Lawson, B (2012), What Designers Know, 2nd
Edition, Routledge, Abington, UK
Mapfumo, A (2003), Using Stakeholder Analysis for Information System development for
Land Use Planning, ITC, New Delhi, India
McGovern, J (2004), A Practical Guide to Enterprise Architecture, Prentice Hall
Proffessional, New York, USA
Morin, P (2013), Open Data Structures, Athabasca University, Alberta, Canada
Polak, M (2016), Antique Trader Bottles: Identification and Price Guide, F+W Media, New
York, USA
Rajaraman, V (2011), Analysis and Design of Information Systems, PHI Learning Pvt. Ltd,
New Delhi, India
Rossenblatt, H.J, System Analysis and Design, 10th Edition, Cengage Lerning, Boston, New
York, USA
Russel J. & Cohn R (2012), Elton Musk, Book on Demand, Stoughton WI, USA
Russo, D. (2010), Align Your Company’s Vision and Mission with Your Employees’ Values,
Pearson, New York, USA
Scheyvens, R (2014), Development Fieldwork: A practical Guide, 2nd
edition, Sage
Publishing, California. USA
Schniederians, M.J, Schniederians A.M & Schniederians D.G (2015), Outsourcing and
Insourcing in an International Context, Routledge, Abingdon, UK
Singh, S.K (2011), Database System: Concepts, Design and Application, Pearson Education,
New Delhi, India
Terry, H (2000), Unified Modelling Language, Idea Group inc, Alberta, Canada

93
Theodosios, T (2012), Approaches and Processes for Managing the Economics of
Information Systems, IGI Global, Pennsylvania, USA
Thurasingham, B (2007), Building Trustworthy Semantic Webs, CRC Press, Florida, USA
Valacich, (2012), Information System Professional Practice, Pearson Education, Sydney,
Australia
Wheeler, E (2011), Security Risk Management: Building an Information Risk Management,
Elsevier, Amsterdam, Netherlands
https://www.accountingcoach.com/ accessed on 08/08/2017
http://www.codeconquest.com accessed on 01/10/2017
http://www.drss.gov.zw/ accessed on 14/05/2017
http://www.evirtualservices.com/ accessed on 03/07/2017
http://www.file.gov.com/ accessed on 13/08/2017
https://www.guidspot.com accessed on 03/09/2017
http://www.ieee.com/ accessed on 17/09/2017
http://www.istqb.ExamCertificate.com accessed on 18/09/2017
http://www.guru99.com/ accessed on 11/05/2017
https://www.microsoft.com/en-us/ accessed on 07/ 06/2017
https://www.msdn.microsoft.com/ accessed on 14/07/2017
http://www.owasp.com/ accessed on 04/10/2017
http://www.quinstreet.com/ accessed on 25/05/2017
http://www.smallbusiness.chron.com accessed on 24/09/2017
http://www.softwaretestingfundamentals.com accessed on 14/09/2017
http://www.softwarequality.com accessed on 14/09/2017
http://www.techopedia.com accessed on 08/10/2017
http://www.telerik.com/ accessed on 25/06/2017
http://www.tutorialspoint.com/ accessed on 02/09/2017
http://www.valuadder.com/ accessed on 23/06/2017
http://www.webfinanceinc.com/ accessed on 27/06/2017
https://www.xamarin.com/ accessed on 07/06/2017
http://www.homeandlearn.co.uk accessed on 14/06/13

94
APPENDIX A
USER MANUAL
Introduction
Any software system which will be greatly accepted and has maximum exploitation has to have a
comprehensible system functions. A manual was done to help users when they face an error or if
they want to know how the system works.
WEB USER
a) To login into the system
The web user has to have a username and a password and there are two buttons, the user will
have to click the sign in button. If it a first time user there will be a folder that adds a new user
into the system. This is done as follows:
b) Login
To enter into the system the user should provide a valid username and password. The system will
use Microsoft login which will need a Microsoft account of an account linked to Microsoft
account.
1

95
Figure A1: Login page
1-As shown in figure A1, it represents the exact place to enter their username
After inputting a username it will load and request for a password. The user will have to enter
their password credentials.
Figure A2: Password Requirement page
1: Represented in figure A2 is where you type in your password to get in the system. After you
type in press the sign in button as shown in figure A2.
c) Forgot Credentials
If it so happens the user will have lost their user credentials the system will help them recover the
credentials to their emails as follows:
1

96
Figure A3: Forgot password
1: Press the button to start recovery process
d) To train the system to recognize the image
The system will have to learn from the test images that it will be having. So to train the system,
the user will have to put in images into the system as follows:
i) Select images from your local storage are shown in figure A5
Figure A4: How to add new images for training.

97
1: pointed is where the user will press to proceed to the next step in adding an image.
ii) To add tags that come with the image when requested in the system
When the user have put in the images, they will need to add tags that will populate data of the
that particular type of data.
Figure A5: Addition of tags on images
To upload into the system
When an image has gotten tags it is then uploaded and it notifies when it is done uploading:
1: This is where the user inserts the tags. The user can put as many as tags as possible
2: when a tag is typed in, the user has to now press that button for the system to proceed to
another step.

98
iii) To upload the image into the system
Figure A6: Uploading the Image into the system
1: That progress bar has to complete and this may take a bit of time
When it has a notification as follows, the system will then proceed to the next step this requires
Internet connection

99
iv) To finish up the process
Figure A9: Display of a successfully uploaded image
1: When the progress bar completes, the system flags a message. The user now can click the
Done button

100
v) To test the system
To confirm if the tests being held by the system is valid, they need to test the images to confirm
its tags. For this to happen they have to do as follows. When the system has tested it will report
in form of a threshold the probability of matching of the image. The optimum training percentile
will be at least 90%:
Figure A8: Image testing for precision
Click the highlighted area to train the system

101
vi) To confirm the probabilities
When the tests are done now the user can confirm the probabilities to confirm if it valid enough
to recognize any image related. This is shown if the user highlights the image. The image will
show all the tags with their respective probabilities. This can be achieved as follows:
Figure A9: Tags of an image
The red boarders outlining the images depicts that the images are highlighted. When the user
hover the mouse over the highlighted images, there will be the percentile of the prediction.

102
vii) MOBILE USER
To capture the image
When the user open up the application it will request to capture with an okay or cancel button.
There will be two segments that will encompass the application and for the capturing they have
to go the capturing platform which is represented by a button:
Figure A10: Taking an Image
The user has to press okay to capture the image.
viii) To search the disease match and information
When the image has been captured, the system will search for the disease information. Whilst
looking for the match, it will display a loading showing the progress of the search,

103
Figure A11: Retrieving disease information

104
ix) To view disease information
Once the image has been captured, attached to it will be information about the crop disease as
follows:
Figure A12: Information display
The system now retrieves information that is attached to matching diseases.

105
x) To view the number of Testing the system has done and level of precision
In the system there will be a platform to report the number of alterations keeping track of what
was done in that iteration.
Fig A13: The number of iterations
1 -The iterations will be displayed on the left side of the system as pointed

106
APPENDIX B
ADMINISTRATOR QUESTIONNAIRE
INSTRUCTIONS:
Please do not write your name on this questionnaire.
Tick where appropriate and fill in where spaces are provided
1) Gender M F
2) Age group 18-25 26-30 31-40 41 +
3) Is there a disease research information systems here ?YES NO
4) Do you document all the queries made by farmers? YES NO
5) The current system is the one you use to do all the operations of the whole organisation.
Agree Disagree Other
6) Your current system is able to do the following:
Database Reports
Other

107
7) What are the probable limitations to the use of the current system?
8) How easy is it to perform tasks using this system?
Easy Not Easy Other
Other Comments / Recommendations

108
APPENDIX C
RESEARCHER QUESTIONNAIRE
INSTRUCTIONS:
Please do not write your name on this questionnaire.
Tick where appropriate and fill in where spaces are provided
1) Gender Male Female
2) Age group 18-25 26-30 31-40 41 +
3) The current system is the system that you use to perform tasks?
Agree Disagree Other
4) Your current system is able to do the following:
Database Reports
Other
5) What challenges are being experienced with the current system?

109
Any Other Comments

110
APPENDIX D
SOURCE CODE
@using agricbot.Models @model LoginViewModel @{ ViewBag.Title = "Log in"; } <h2>@ViewBag.Title.</h2> <div class="row"> <div class="col-md-8"> <section id="loginForm"> @using (Html.BeginForm("Login", "Account", new { ReturnUrl = ViewBag.ReturnUrl }, FormMethod.Post, new { @class = "form-horizontal", role = "form" })) { @Html.AntiForgeryToken() <h4>Use a local account to log in.</h4> <hr /> @Html.ValidationSummary(true, "", new { @class = "text-danger" }) <div class="form-group"> @Html.LabelFor(m => m.Email, new { @class = "col-md-2 control-label" }) <div class="col-md-10"> @Html.TextBoxFor(m => m.Email, new { @class = "form-control" }) @Html.ValidationMessageFor(m => m.Email, "", new { @class = "text-danger" }) </div> </div> <div class="form-group"> @Html.LabelFor(m => m.Password, new { @class = "col-md-2 control-label" }) <div class="col-md-10"> @Html.PasswordFor(m => m.Password, new { @class = "form-control" }) @Html.ValidationMessageFor(m => m.Password, "", new { @class = "text-danger" }) </div> </div> <div class="form-group"> <div class="col-md-offset-2 col-md-10"> <div class="checkbox"> @Html.CheckBoxFor(m => m.RememberMe) @Html.LabelFor(m => m.RememberMe) </div> </div> </div> <div class="form-group"> <div class="col-md-offset-2 col-md-10"> <input type="submit" value="Log in" class="btn btn-default" /> </div> </div> <p> @Html.ActionLink("Register as a new user", "Register") </p>
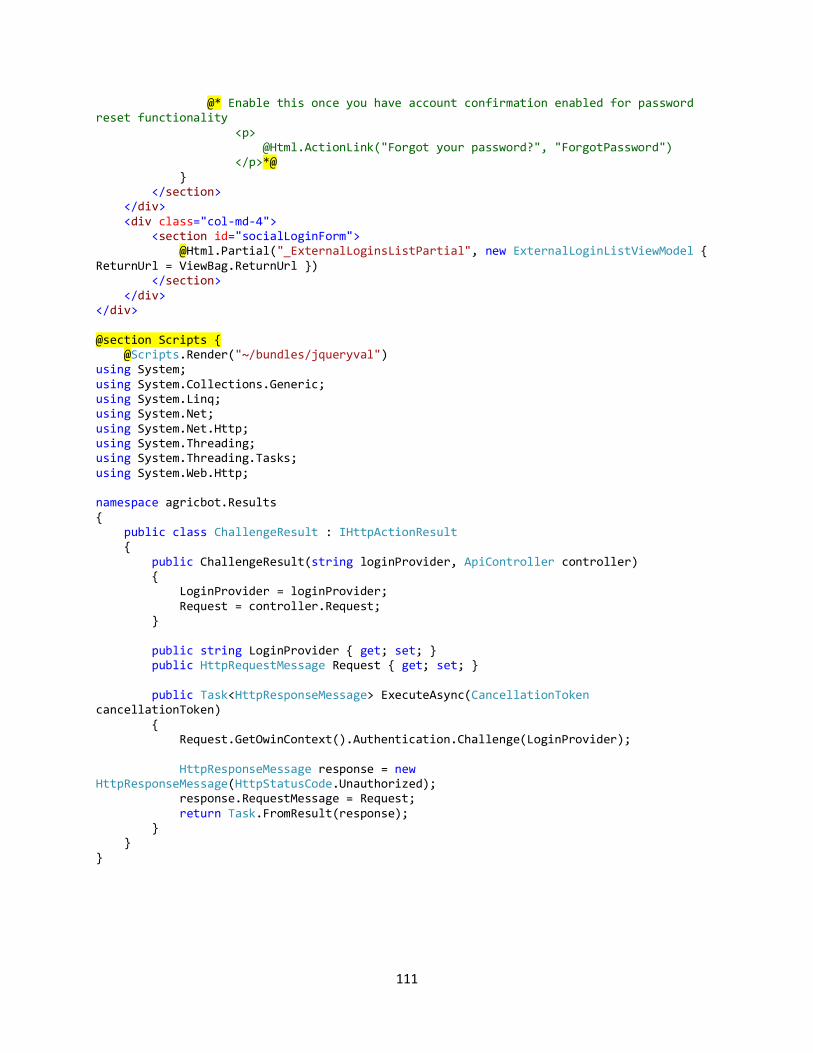
111
@* Enable this once you have account confirmation enabled for password reset functionality <p> @Html.ActionLink("Forgot your password?", "ForgotPassword") </p>*@ } </section> </div> <div class="col-md-4"> <section id="socialLoginForm"> @Html.Partial("_ExternalLoginsListPartial", new ExternalLoginListViewModel { ReturnUrl = ViewBag.ReturnUrl }) </section> </div> </div> @section Scripts { @Scripts.Render("~/bundles/jqueryval") using System; using System.Collections.Generic; using System.Linq; using System.Net; using System.Net.Http; using System.Threading; using System.Threading.Tasks; using System.Web.Http; namespace agricbot.Results { public class ChallengeResult : IHttpActionResult { public ChallengeResult(string loginProvider, ApiController controller) { LoginProvider = loginProvider; Request = controller.Request; } public string LoginProvider { get; set; } public HttpRequestMessage Request { get; set; } public Task<HttpResponseMessage> ExecuteAsync(CancellationToken cancellationToken) { Request.GetOwinContext().Authentication.Challenge(LoginProvider); HttpResponseMessage response = new HttpResponseMessage(HttpStatusCode.Unauthorized); response.RequestMessage = Request; return Task.FromResult(response); } } }