a sustainable energy future for new zealand by · pdf filea sustainable energy future for new...
TRANSCRIPT
A Sustainable Energy Future for New Zealand by 2050A BUSINESS VIEW
Facilitated by
1Introduction
Why is sustainability important?
2The issues at a glance
4 Technological change – how fast can it happen?
5What have we learnt from history?
6We do have technology and energy options
8Future energy scenarios
10Journeys to energy sustainability in 2050
16Scenario resilience and robustness
17Scenario dependencies and optionality
18What do we need to do?
20The challenges ahead
Inside back coverGlossaryProject rolesReferences
Contents
New Zealanders need to be aware that there are choices to be made about energy.
New Zealand, like many countries around the world, is facing two significant challenges: • Finding the energy needed to power the economy; and • Transitioning to a more sustainable energy future.
The Sustainable Energy Futures – Outlook 2050 project is a business initiative using participants’ combined resources to develop a better understanding of the sustainable energy options for New Zealand out to 2050. The project develops a number of scenarios which will provide future generations with comparable or greater options than we have today. Under each scenario potential solutions are suggested to help government, companies and New Zealanders make informed choices about what they want to happen.
The project’s aims include:• Providing a framework to assess how New Zealand might achieve
energy sustainability by 2050.• Providing scenarios and pathways to show how we can continue
to grow, innovate and develop apace with other OECD countries. • Using the scenarios to identify the options available and the
timeframe for decisions that need to be made to develop our energy infrastructure.
Growth is a fundamental requirement for economic and social development. The scenarios illustrate how sufficient energy to fuel New Zealand’s growth may be obtained.
This work has been facilitated by the New Zealand Business Council for Sustainable Development (The Business Council). The project team comprises: Energy companies (BP, Meridian Energy, Mighty River Power, Shell, Solid Energy); Transport providers (Honda and Toyota); Electricity network companies (Orion, WEL Networks); Research or business associations (Coal Association, Energy Federation, NIWA, PEPANZ); and, on the demand side, Business New Zealand.
This report may be copied provided that the source is acknowledged. Working papers which form the basis of this report are available on www.nzbcsd.org.nz/energy2050
Balancing energy supply and demand with affordability and environmental protection is fundamental to our economic and social development.Fossil fuels in the form of oil and gas are a finite resource and there is a growing consensus that global oil production will peak sometime over the next 50 years. Furthermore, a body of science believes that the impact of fossil fuel use on the level of carbon dioxide (CO2) in the atmosphere means we cannot go on using these resources in the way we have in the past if climate change issues are to be addressed.
The Brundtland Commission highlighted the conflict between the interests of economic development and the interests of the environment and developed the concept of sustainability where:
“Development should meet the needs of the present without compromising the ability of future generations to meet their own needs.”
The New Zealand Government has released its own discussion paper on sustainable energy (October 2004). This summarises the current situation here as:• Innovation is modest;• Use of renewable fuels compared to world average is high
but still reliant on fossil fuels;• Supply security is a growing concern; and• The environment is under threat from climate change.
A number of national and international organisations have undertaken similar studies on the challenges to achieve sustainable energy. We have distilled some key learnings from these studies, applied them to the New Zealand context and then developed alternative scenarios that tell a story about the different ways New Zealand may achieve energy sustainability by 2050.
We look at key drivers influencing energy use in New Zealand and considering our future energy choices and the impact of technology, environmental issues and social constraints on those energy choices. Through this we can develop insights into what a sustainable energy future might look like and how we might get there.
We assume key aspirations for our country:• New Zealand will remain a good, global citizen;• New Zealand will take care of its environment; and• New Zealand should have a world-class quality of life with
better-than-average incomes amongst developed countries.
We consider the International Energy Agency (IEA) criteria of affordability, security of supply and environmental protection appropriate for assessing the various sustainable energy options for New Zealand.
An additional criterion, not covered by the international literature, is optionality. By this we mean, for example, the extent to which a long-term energy investment forecloses on other options for a period, impeding the take-up of other energy-efficient and cost-effective investments.
Why is sustainability important?
Introduction
1
Our energy demand has almost tripled over the last 30 years.
Energy drives growthEconomic growth is an essential requirement because it funds our improving living standards and social development. This has been fuelled by increasing energy supply.
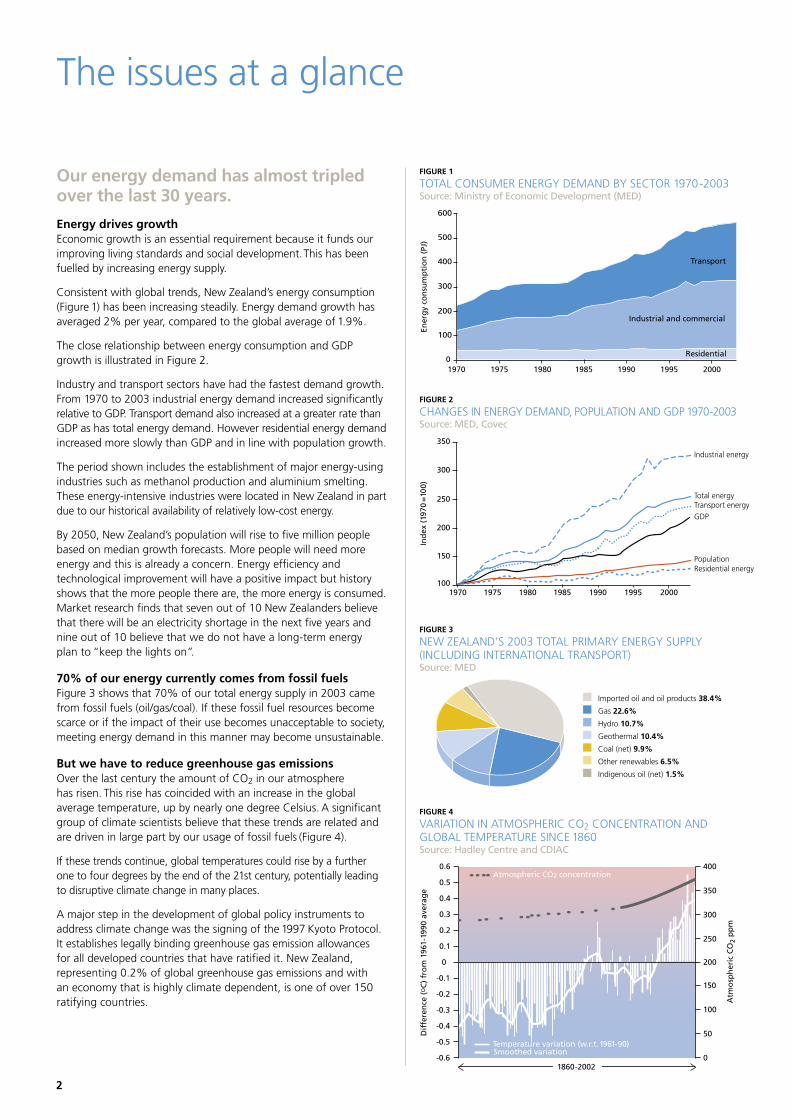
Consistent with global trends, New Zealand’s energy consumption (Figure 1) has been increasing steadily. Energy demand growth has averaged 2% per year, compared to the global average of 1.9%.
The close relationship between energy consumption and GDP growth is illustrated in Figure 2.
Industry and transport sectors have had the fastest demand growth. From 1970 to 2003 industrial energy demand increased significantly relative to GDP. Transport demand also increased at a greater rate than GDP as has total energy demand. However residential energy demand increased more slowly than GDP and in line with population growth.
The period shown includes the establishment of major energy-using industries such as methanol production and aluminium smelting. These energy-intensive industries were located in New Zealand in part due to our historical availability of relatively low-cost energy.
By 2050, New Zealand’s population will rise to five million people based on median growth forecasts. More people will need more energy and this is already a concern. Energy efficiency and technological improvement will have a positive impact but history shows that the more people there are, the more energy is consumed. Market research finds that seven out of 10 New Zealanders believe that there will be an electricity shortage in the next five years and nine out of 10 believe that we do not have a long-term energy plan to “keep the lights on”.
70% of our energy currently comes from fossil fuelsFigure 3 shows that 70% of our total energy supply in 2003 came from fossil fuels (oil/gas/coal). If these fossil fuel resources become scarce or if the impact of their use becomes unacceptable to society, meeting energy demand in this manner may become unsustainable.
But we have to reduce greenhouse gas emissionsOver the last century the amount of CO2 in our atmosphere has risen. This rise has coincided with an increase in the global average temperature, up by nearly one degree Celsius. A significant group of climate scientists believe that these trends are related and are driven in large part by our usage of fossil fuels (Figure 4).
If these trends continue, global temperatures could rise by a further one to four degrees by the end of the 21st century, potentially leading to disruptive climate change in many places.
A major step in the development of global policy instruments to address climate change was the signing of the 1997 Kyoto Protocol. It establishes legally binding greenhouse gas emission allowances for all developed countries that have ratified it. New Zealand, representing 0.2% of global greenhouse gas emissions and with an economy that is highly climate dependent, is one of over 150 ratifying countries.
The issues at a glance
FIGURE 4
VARIATION IN ATMOSPHERIC CO2 CONCENTRATION AND GLOBAL TEMPERATURE SINCE 1860Source: Hadley Centre and CDIAC
��������������������������������������
���������������������������������������������������������
�������������������
���
���
���
���
���
���
�
����
����
����
����
����
����
���
���
���
���
���
���
���
��
����������
�����������������������������
FIGURE 1
TOTAL CONSUMER ENERGY DEMAND BY SECTOR 1970-2003 Source: Ministry of Economic Development (MED)
����
���
���
���
���
���
���
���� ���� ����
�����������������������
���� ���� ����
���������
�������������������������
������������
FIGURE 2
CHANGES IN ENERGY DEMAND, POPULATION AND GDP 1970-2003Source: MED, Covec
����
���
���
���
���
���
���
���� ���� ���� ���� ���� ����
����������������
����������
����������������
���
������������������
������������
�����������������
FIGURE 3
NEW ZEALAND’S 2003 TOTAL PRIMARY ENERGY SUPPLY (INCLUDING INTERNATIONAL TRANSPORT)Source: MED
�����������������������������������
���������
�����������
����������������
���������������
���������������������
�������������������������
2
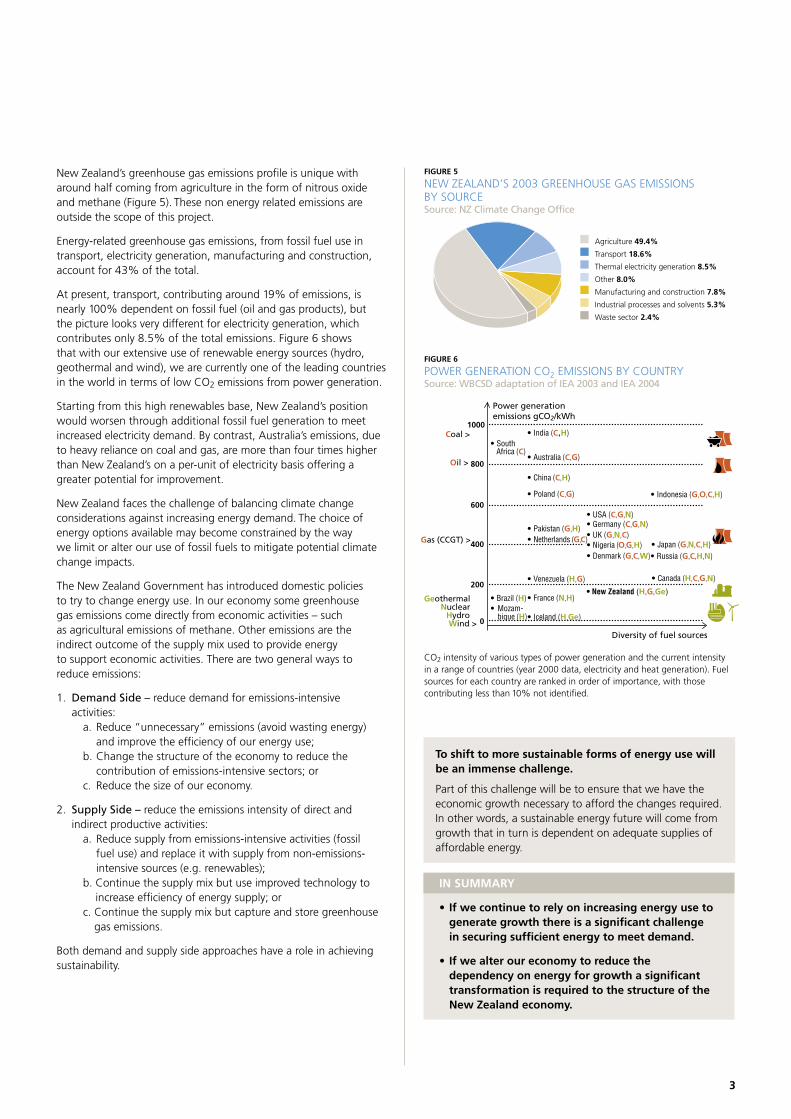
New Zealand’s greenhouse gas emissions profile is unique with around half coming from agriculture in the form of nitrous oxide and methane (Figure 5). These non energy related emissions are outside the scope of this project.
Energy-related greenhouse gas emissions, from fossil fuel use in transport, electricity generation, manufacturing and construction, account for 43% of the total.
At present, transport, contributing around 19% of emissions, is nearly 100% dependent on fossil fuel (oil and gas products), but the picture looks very different for electricity generation, which contributes only 8.5% of the total emissions. Figure 6 shows that with our extensive use of renewable energy sources (hydro, geothermal and wind), we are currently one of the leading countries in the world in terms of low CO2 emissions from power generation.
Starting from this high renewables base, New Zealand’s position would worsen through additional fossil fuel generation to meet increased electricity demand. By contrast, Australia’s emissions, due to heavy reliance on coal and gas, are more than four times higher than New Zealand’s on a per-unit of electricity basis offering a greater potential for improvement.
New Zealand faces the challenge of balancing climate change considerations against increasing energy demand. The choice of energy options available may become constrained by the way we limit or alter our use of fossil fuels to mitigate potential climate change impacts.
The New Zealand Government has introduced domestic policies to try to change energy use. In our economy some greenhouse gas emissions come directly from economic activities – such as agricultural emissions of methane. Other emissions are the indirect outcome of the supply mix used to provide energy to support economic activities. There are two general ways to reduce emissions:
1. Demand Side – reduce demand for emissions-intensive activities:
a. Reduce “unnecessary” emissions (avoid wasting energy) and improve the efficiency of our energy use;
b. Change the structure of the economy to reduce the contribution of emissions-intensive sectors; or
c. Reduce the size of our economy.
2. Supply Side – reduce the emissions intensity of direct and indirect productive activities:
a. Reduce supply from emissions-intensive activities (fossil fuel use) and replace it with supply from non-emissions-intensive sources (e.g. renewables);
b. Continue the supply mix but use improved technology to increase efficiency of energy supply; or
c. Continue the supply mix but capture and store greenhouse gas emissions.
Both demand and supply side approaches have a role in achieving sustainability.
FIGURE 5
NEW ZEALAND’S 2003 GREENHOUSE GAS EMISSIONS BY SOURCESource: NZ Climate Change Office
�����������������
���������������
�����������������������������������
����������
�����������������������������������
��������������������������������������
�����������������
FIGURE 6
POWER GENERATION CO2 EMISSIONS BY COUNTRYSource: WBCSD adaptation of IEA 2003 and IEA 2004
���
���
�
�������������������������
�����������������������������������
���������������������
����������� ���������
������������
�������������
�����������������
�������������
��������������
����������������
�����������������
��������������
����������������
����������������������������������������������������������������������������
����������������������
���������������������
�����������������
������������������
������������������
���������������
��������
����������
��������������������������������������
�������������������
IN SUMMARY
• If we continue to rely on increasing energy use to generate growth there is a significant challenge in securing sufficient energy to meet demand.
• If we alter our economy to reduce the dependency on energy for growth a significant transformation is required to the structure of the New Zealand economy.
CO2 intensity of various types of power generation and the current intensity in a range of countries (year 2000 data, electricity and heat generation). Fuel sources for each country are ranked in order of importance, with those contributing less than 10% not identified.
To shift to more sustainable forms of energy use will be an immense challenge.
Part of this challenge will be to ensure that we have the economic growth necessary to afford the changes required. In other words, a sustainable energy future will come from growth that in turn is dependent on adequate supplies of affordable energy.
3
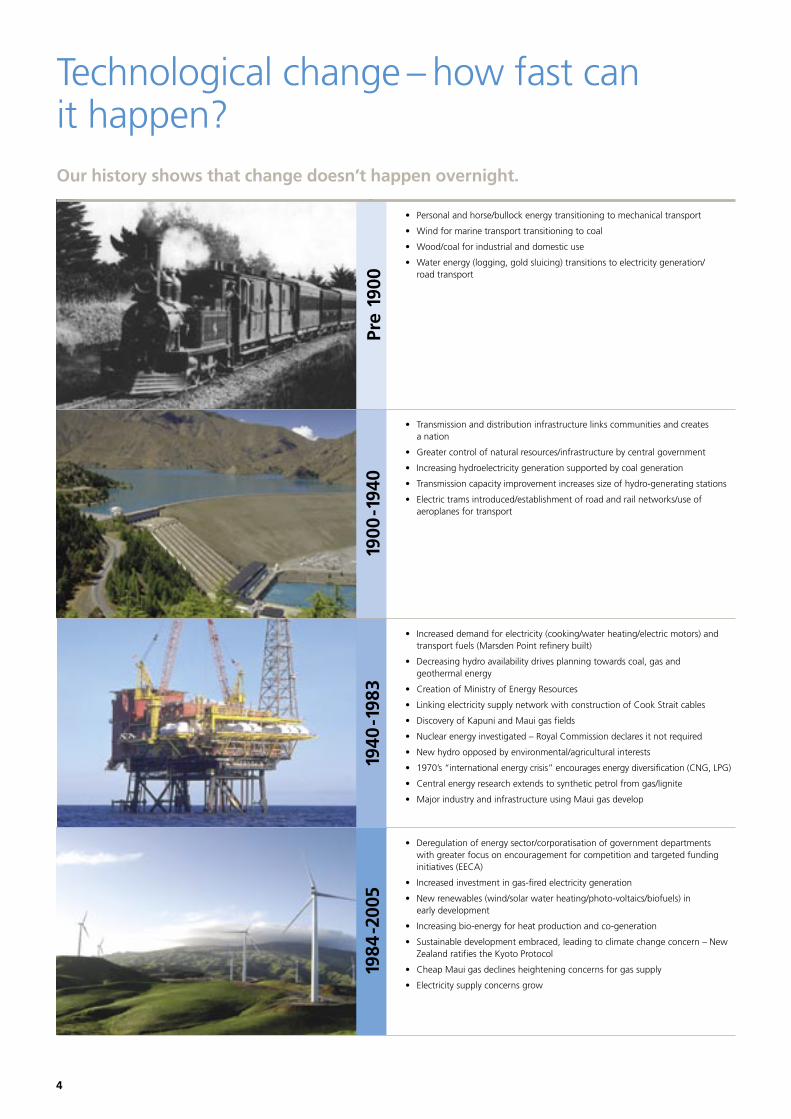
• Personal and horse/bullock energy transitioning to mechanical transport
• Wind for marine transport transitioning to coal
• Wood/coal for industrial and domestic use
• Water energy (logging, gold sluicing) transitions to electricity generation/ road transport
• Transmission and distribution infrastructure links communities and creates a nation
• Greater control of natural resources/infrastructure by central government
• Increasing hydroelectricity generation supported by coal generation
• Transmission capacity improvement increases size of hydro-generating stations
• Electric trams introduced/establishment of road and rail networks/use of aeroplanes for transport
• Increased demand for electricity (cooking/water heating/electric motors) and transport fuels (Marsden Point refinery built)
• Decreasing hydro availability drives planning towards coal, gas and geothermal energy
• Creation of Ministry of Energy Resources
• Linking electricity supply network with construction of Cook Strait cables
• Discovery of Kapuni and Maui gas fields
• Nuclear energy investigated – Royal Commission declares it not required
• New hydro opposed by environmental/agricultural interests
• 1970’s “international energy crisis” encourages energy diversification (CNG, LPG)
• Central energy research extends to synthetic petrol from gas/lignite
• Major industry and infrastructure using Maui gas develop
• Deregulation of energy sector/corporatisation of government departments with greater focus on encouragement for competition and targeted funding initiatives (EECA)
• Increased investment in gas-fired electricity generation
• New renewables (wind/solar water heating/photo-voltaics/biofuels) in early development
• Increasing bio-energy for heat production and co-generation
• Sustainable development embraced, leading to climate change concern – New Zealand ratifies the Kyoto Protocol
• Cheap Maui gas declines heightening concerns for gas supply
• Electricity supply concerns grow
Technological change – how fast can it happen?Our history shows that change doesn’t happen overnight.
Pre
1900
1900
-194
019
40-1
983
1984
-200
5
4
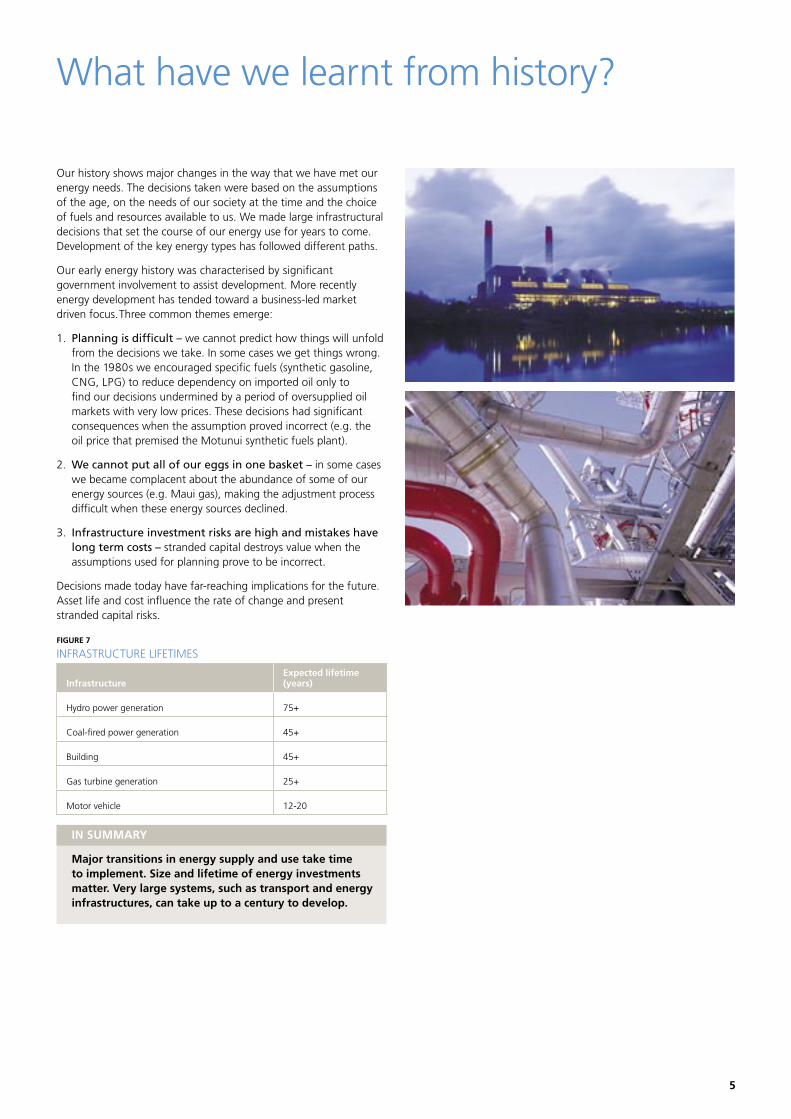
Our history shows major changes in the way that we have met our energy needs. The decisions taken were based on the assumptions of the age, on the needs of our society at the time and the choice of fuels and resources available to us. We made large infrastructural decisions that set the course of our energy use for years to come. Development of the key energy types has followed different paths.
Our early energy history was characterised by significant government involvement to assist development. More recently energy development has tended toward a business-led market driven focus. Three common themes emerge:
1. Planning is difficult – we cannot predict how things will unfold from the decisions we take. In some cases we get things wrong. In the 1980s we encouraged specific fuels (synthetic gasoline, CNG, LPG) to reduce dependency on imported oil only to find our decisions undermined by a period of oversupplied oil markets with very low prices. These decisions had significant consequences when the assumption proved incorrect (e.g. the oil price that premised the Motunui synthetic fuels plant).
2. We cannot put all of our eggs in one basket – in some cases we became complacent about the abundance of some of our energy sources (e.g. Maui gas), making the adjustment process difficult when these energy sources declined.
3. Infrastructure investment risks are high and mistakes have long term costs – stranded capital destroys value when the assumptions used for planning prove to be incorrect.
Decisions made today have far-reaching implications for the future. Asset life and cost influence the rate of change and present stranded capital risks.
FIGURE 7
INFRASTRUCTURE LIFETIMES
InfrastructureExpected lifetime (years)
Hydro power generation 75+
Coal-fired power generation 45+
Building 45+
Gas turbine generation 25+
Motor vehicle 12-20
IN SUMMARY
Major transitions in energy supply and use take time to implement. Size and lifetime of energy investments matter. Very large systems, such as transport and energy infrastructures, can take up to a century to develop.
What have we learnt from history?
5
Energy will not constrain our growth unless we allow it to.How New Zealand meets its future energy requirements will be influenced and constrained by the availability and affordability of energy sources and technologies.
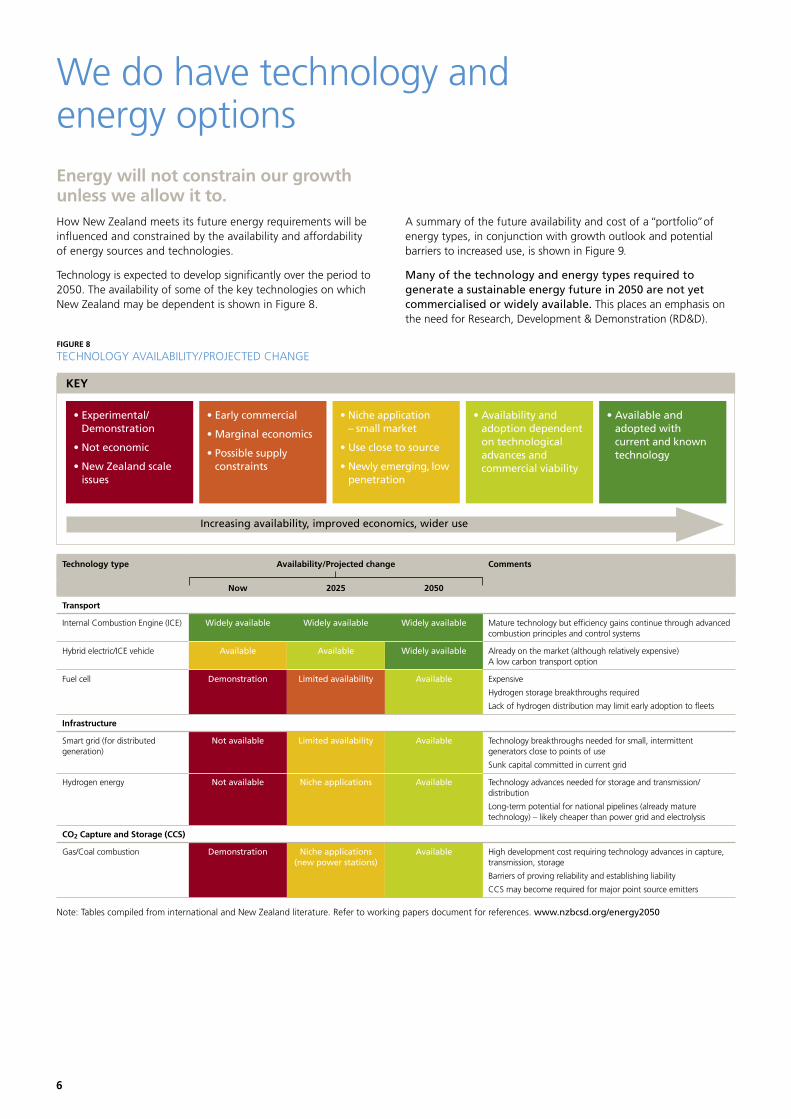
Technology is expected to develop significantly over the period to 2050. The availability of some of the key technologies on which New Zealand may be dependent is shown in Figure 8.
A summary of the future availability and cost of a “portfolio” of energy types, in conjunction with growth outlook and potential barriers to increased use, is shown in Figure 9.
Many of the technology and energy types required to generate a sustainable energy future in 2050 are not yet commercialised or widely available. This places an emphasis on the need for Research, Development & Demonstration (RD&D).
We do have technology and energy options
Technology type Availability/Projected change Comments
Now 2025 2050
Transport
Internal Combustion Engine (ICE) Widely available Widely available Widely available Mature technology but efficiency gains continue through advanced combustion principles and control systems
Hybrid electric/ICE vehicle Available Available Widely available Already on the market (although relatively expensive) A low carbon transport option
Fuel cell Demonstration Limited availability Available Expensive
Hydrogen storage breakthroughs required
Lack of hydrogen distribution may limit early adoption to fleets
Infrastructure
Smart grid (for distributed generation)
Not available Limited availability Available Technology breakthroughs needed for small, intermittent generators close to points of use
Sunk capital committed in current grid
Hydrogen energy Not available Niche applications Available Technology advances needed for storage and transmission/distribution
Long-term potential for national pipelines (already mature technology) – likely cheaper than power grid and electrolysis
CO2 Capture and Storage (CCS)
Gas/Coal combustion Demonstration Niche applications (new power stations)
Available High development cost requiring technology advances in capture, transmission, storage
Barriers of proving reliability and establishing liability
CCS may become required for major point source emitters
Note: Tables compiled from international and New Zealand literature. Refer to working papers document for references. www.nzbcsd.org/energy2050
KEY
Increasing availability, improved economics, wider use
• Experimental/Demonstration
• Not economic
• New Zealand scale issues
• Early commercial
• Marginal economics
• Possible supply constraints
• Niche application – small market
• Use close to source
• Newly emerging, low penetration
• Availability and adoption dependent on technological advances and commercial viability
• Available and adopted with current and known technology
FIGURE 8
TECHNOLOGY AVAILABILITY/PROJECTED CHANGE
6
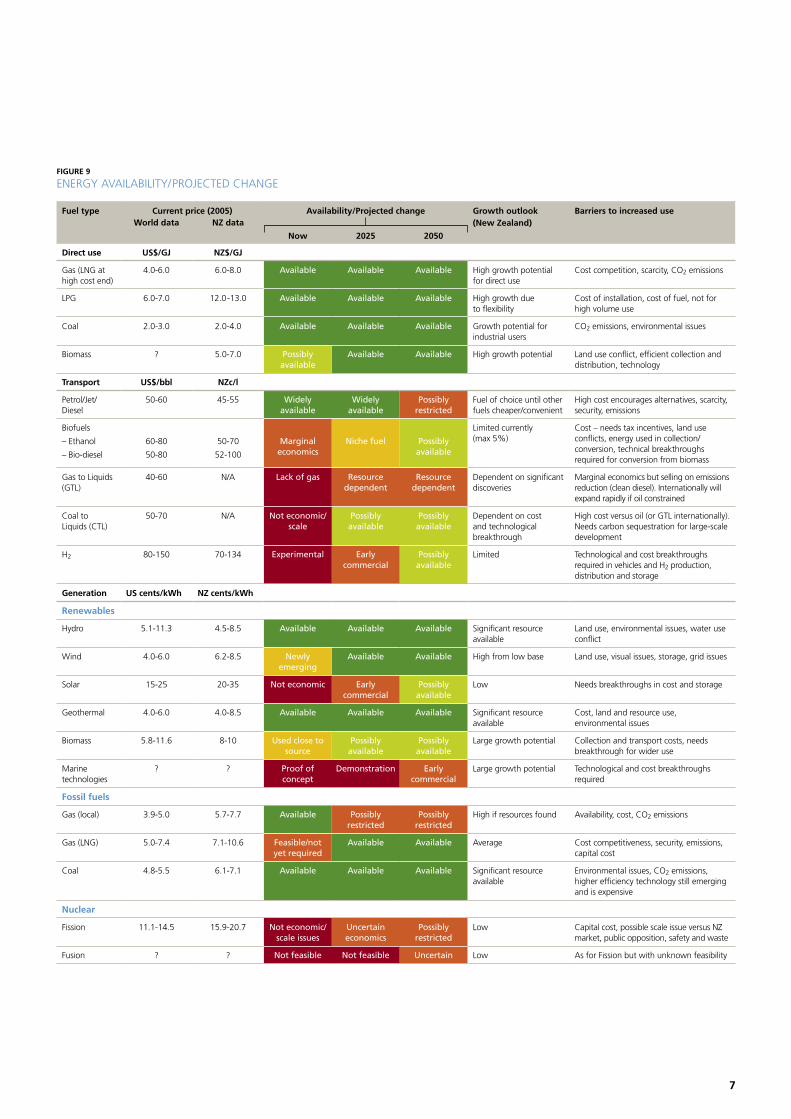
FIGURE 9
ENERGY AVAILABILITY/PROJECTED CHANGE
Fuel type Current price (2005) Availability/Projected change Growth outlook (New Zealand)
Barriers to increased use World data NZ data
Now 2025 2050
Direct use US$/GJ NZ$/GJ
Gas (LNG at high cost end)
4.0-6.0 6.0-8.0 Available Available Available High growth potential for direct use
Cost competition, scarcity, CO2 emissions
LPG 6.0-7.0 12.0-13.0 Available Available Available High growth due to flexibility
Cost of installation, cost of fuel, not for high volume use
Coal 2.0-3.0 2.0-4.0 Available Available Available Growth potential for industrial users
CO2 emissions, environmental issues
Biomass ? 5.0-7.0 Possibly available
Available Available High growth potential Land use conflict, efficient collection and distribution, technology
Transport US$/bbl NZc/l
Petrol/Jet/ Diesel
50-60 45-55 Widely available
Widely available
Possibly restricted
Fuel of choice until other fuels cheaper/convenient
High cost encourages alternatives, scarcity, security, emissions
Biofuels
– Ethanol
– Bio-diesel
60-80
50-80
50-70
52-100
Marginal economics
Niche fuel Possibly available
Limited currently (max 5%)
Cost – needs tax incentives, land use conflicts, energy used in collection/conversion, technical breakthroughs required for conversion from biomass
Gas to Liquids (GTL)
40-60 N/A Lack of gas Resource dependent
Resource dependent
Dependent on significant discoveries
Marginal economics but selling on emissions reduction (clean diesel). Internationally will expand rapidly if oil constrained
Coal to Liquids (CTL)
50-70 N/A Not economic/scale
Possibly available
Possibly available
Dependent on cost and technological breakthrough
High cost versus oil (or GTL internationally). Needs carbon sequestration for large-scale development
H2 80-150 70-134 Experimental Early commercial
Possibly available
Limited Technological and cost breakthroughs required in vehicles and H2 production, distribution and storage
Generation US cents/kWh NZ cents/kWh
Renewables
Hydro 5.1-11.3 4.5-8.5 Available Available Available Significant resource available
Land use, environmental issues, water use conflict
Wind 4.0-6.0 6.2-8.5 Newly emerging
Available Available High from low base Land use, visual issues, storage, grid issues
Solar 15-25 20-35 Not economic Early commercial
Possibly available
Low Needs breakthroughs in cost and storage
Geothermal 4.0-6.0 4.0-8.5 Available Available Available Significant resource available
Cost, land and resource use, environmental issues
Biomass 5.8-11.6 8-10 Used close to source
Possibly available
Possibly available
Large growth potential Collection and transport costs, needs breakthrough for wider use
Marine technologies
? ? Proof of concept
Demonstration Early commercial
Large growth potential Technological and cost breakthroughs required
Fossil fuels
Gas (local) 3.9-5.0 5.7-7.7 Available Possibly restricted
Possibly restricted
High if resources found Availability, cost, CO2 emissions
Gas (LNG) 5.0-7.4 7.1-10.6 Feasible/not yet required
Available Available Average Cost competitiveness, security, emissions, capital cost
Coal 4.8-5.5 6.1-7.1 Available Available Available Significant resource available
Environmental issues, CO2 emissions, higher efficiency technology still emerging and is expensive
Nuclear
Fission 11.1-14.5 15.9-20.7 Not economic/scale issues
Uncertain economics
Possibly restricted
Low Capital cost, possible scale issue versus NZ market, public opposition, safety and waste
Fusion ? ? Not feasible Not feasible Uncertain Low As for Fission but with unknown feasibility
7
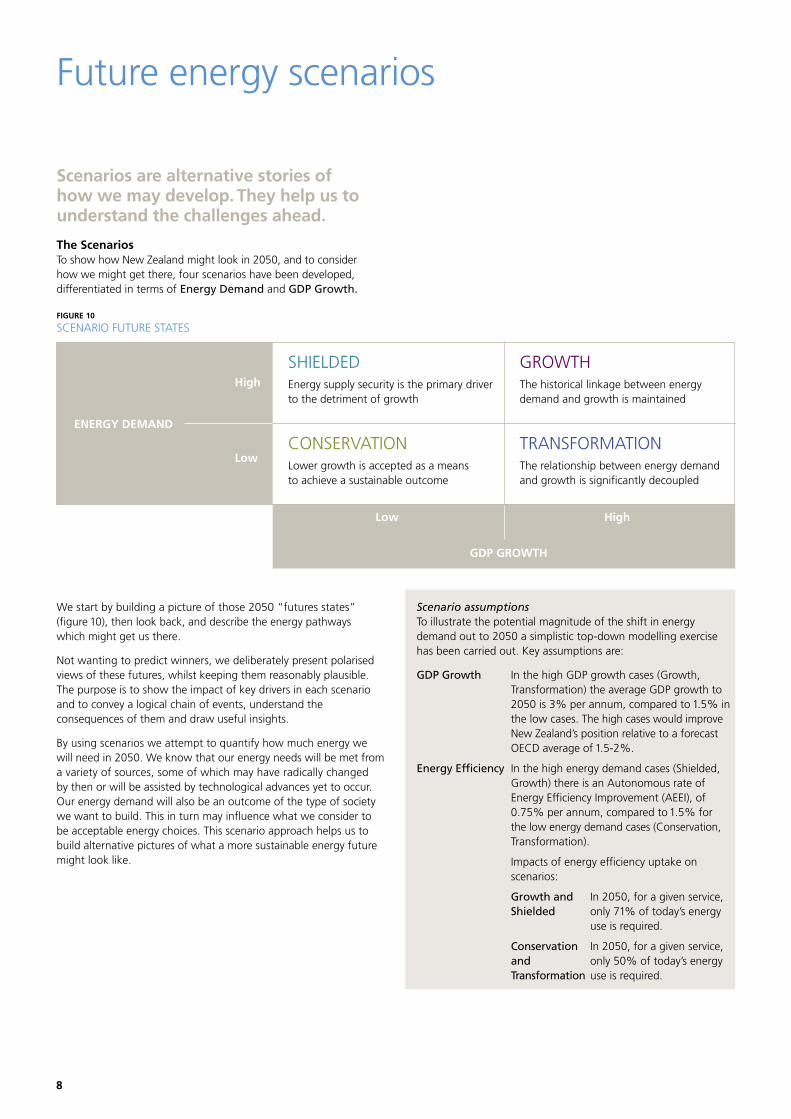
We start by building a picture of those 2050 “futures states” (figure 10), then look back, and describe the energy pathways which might get us there.
Not wanting to predict winners, we deliberately present polarised views of these futures, whilst keeping them reasonably plausible. The purpose is to show the impact of key drivers in each scenario and to convey a logical chain of events, understand the consequences of them and draw useful insights.
By using scenarios we attempt to quantify how much energy we will need in 2050. We know that our energy needs will be met from a variety of sources, some of which may have radically changed by then or will be assisted by technological advances yet to occur. Our energy demand will also be an outcome of the type of society we want to build. This in turn may influence what we consider to be acceptable energy choices. This scenario approach helps us to build alternative pictures of what a more sustainable energy future might look like.
Scenario assumptionsTo illustrate the potential magnitude of the shift in energy demand out to 2050 a simplistic top-down modelling exercise has been carried out. Key assumptions are:
GDP Growth In the high GDP growth cases (Growth, Transformation) the average GDP growth to 2050 is 3% per annum, compared to 1.5% in the low cases. The high cases would improve New Zealand’s position relative to a forecast OECD average of 1.5-2%.
Energy Efficiency In the high energy demand cases (Shielded, Growth) there is an Autonomous rate of Energy Efficiency Improvement (AEEI), of 0.75% per annum, compared to 1.5% for the low energy demand cases (Conservation, Transformation).
Impacts of energy efficiency uptake on scenarios:
Growth and In 2050, for a given service, Shielded only 71% of today’s energy use is required.
Conservation In 2050, for a given service, and only 50% of today’s energy Transformation use is required.
Future energy scenarios
SHIELDED Energy supply security is the primary driver to the detriment of growth
CONSERVATIONLower growth is accepted as a means to achieve a sustainable outcome
GROWTHThe historical linkage between energy demand and growth is maintained
TRANSFORMATION The relationship between energy demand and growth is significantly decoupled
Low High
GDP GROWTH
ENERGY DEMAND
High
Low
The Scenarios To show how New Zealand might look in 2050, and to consider how we might get there, four scenarios have been developed, differentiated in terms of Energy Demand and GDP Growth.
Scenarios are alternative stories of how we may develop. They help us to understand the challenges ahead.
FIGURE 10
SCENARIO FUTURE STATES
8
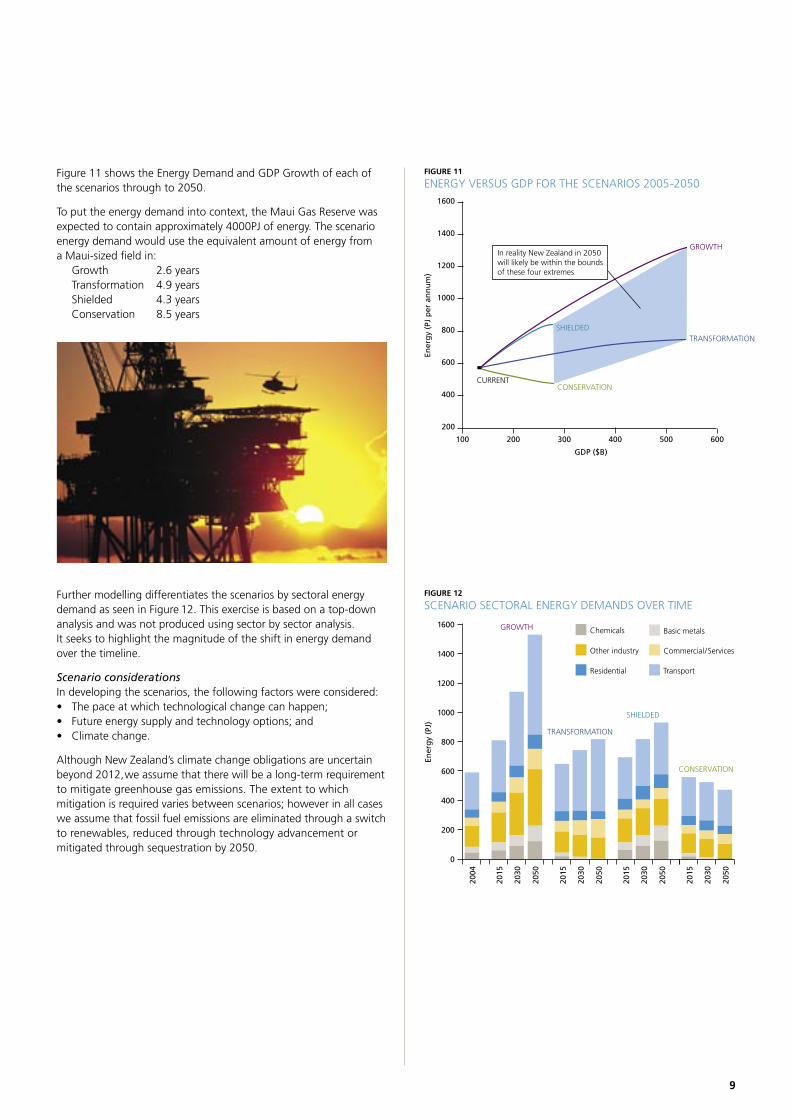
Figure 11 shows the Energy Demand and GDP Growth of each of the scenarios through to 2050.
To put the energy demand into context, the Maui Gas Reserve was expected to contain approximately 4000PJ of energy. The scenario energy demand would use the equivalent amount of energy from a Maui-sized field in: Growth 2.6 years Transformation 4.9 years Shielded 4.3 years Conservation 8.5 years
����
��������
���������������������
������
��������������
�������������������
��������
����
����
����
���
���
���
��� ��� ��� ��� ������
���
��������������������������������������������������������������������������������������
FIGURE 11
ENERGY VERSUS GDP FOR THE SCENARIOS 2005-2050
��������������
����
����
����
��������
����
����
����
����
�����������
������
������������
����
����
����
���
���
���
���
�
��������� ������������
�������������� �������������������
����������� ���������
����
����
����
����
����
����
����
FIGURE 12
SCENARIO SECTORAL ENERGY DEMANDS OVER TIME
9
Further modelling differentiates the scenarios by sectoral energy demand as seen in Figure 12. This exercise is based on a top-down analysis and was not produced using sector by sector analysis. It seeks to highlight the magnitude of the shift in energy demand over the timeline.
Scenario considerationsIn developing the scenarios, the following factors were considered:• The pace at which technological change can happen; • Future energy supply and technology options; and • Climate change.
Although New Zealand’s climate change obligations are uncertain beyond 2012, we assume that there will be a long-term requirement to mitigate greenhouse gas emissions. The extent to which mitigation is required varies between scenarios; however in all cases we assume that fossil fuel emissions are eliminated through a switch to renewables, reduced through technology advancement or mitigated through sequestration by 2050.
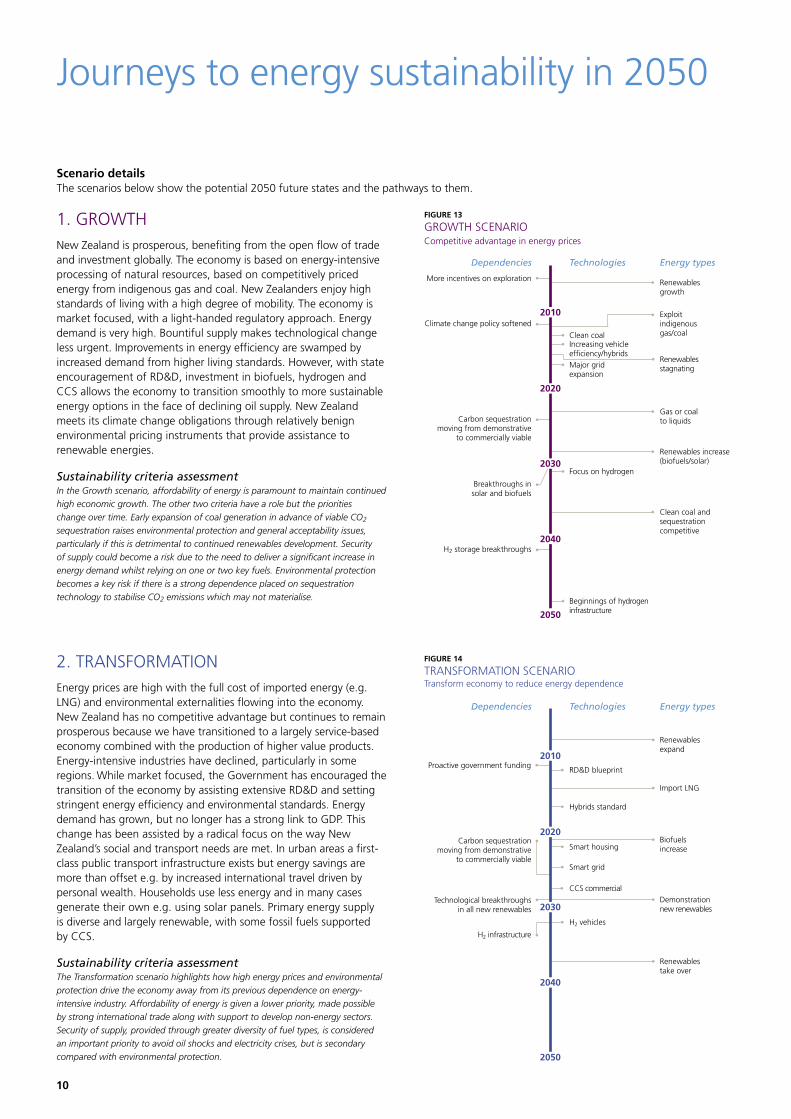
1. GROWTHNew Zealand is prosperous, benefiting from the open flow of trade and investment globally. The economy is based on energy-intensive processing of natural resources, based on competitively priced energy from indigenous gas and coal. New Zealanders enjoy high standards of living with a high degree of mobility. The economy is market focused, with a light-handed regulatory approach. Energy demand is very high. Bountiful supply makes technological change less urgent. Improvements in energy efficiency are swamped by increased demand from higher living standards. However, with state encouragement of RD&D, investment in biofuels, hydrogen and CCS allows the economy to transition smoothly to more sustainable energy options in the face of declining oil supply. New Zealand meets its climate change obligations through relatively benign environmental pricing instruments that provide assistance to renewable energies.
Sustainability criteria assessmentIn the Growth scenario, affordability of energy is paramount to maintain continued
high economic growth. The other two criteria have a role but the priorities
change over time. Early expansion of coal generation in advance of viable CO2
sequestration raises environmental protection and general acceptability issues,
particularly if this is detrimental to continued renewables development. Security
of supply could become a risk due to the need to deliver a significant increase in
energy demand whilst relying on one or two key fuels. Environmental protection
becomes a key risk if there is a strong dependence placed on sequestration
technology to stabilise CO2 emissions which may not materialise.
2. TRANSFORMATIONEnergy prices are high with the full cost of imported energy (e.g. LNG) and environmental externalities flowing into the economy. New Zealand has no competitive advantage but continues to remain prosperous because we have transitioned to a largely service-based economy combined with the production of higher value products. Energy-intensive industries have declined, particularly in some regions. While market focused, the Government has encouraged the transition of the economy by assisting extensive RD&D and setting stringent energy efficiency and environmental standards. Energy demand has grown, but no longer has a strong link to GDP. This change has been assisted by a radical focus on the way New Zealand’s social and transport needs are met. In urban areas a first-class public transport infrastructure exists but energy savings are more than offset e.g. by increased international travel driven by personal wealth. Households use less energy and in many cases generate their own e.g. using solar panels. Primary energy supply is diverse and largely renewable, with some fossil fuels supported by CCS.
Sustainability criteria assessmentThe Transformation scenario highlights how high energy prices and environmental
protection drive the economy away from its previous dependence on energy-
intensive industry. Affordability of energy is given a lower priority, made possible
by strong international trade along with support to develop non-energy sectors.
Security of supply, provided through greater diversity of fuel types, is considered
an important priority to avoid oil shocks and electricity crises, but is secondary
compared with environmental protection.
FIGURE 14
TRANSFORMATION SCENARIOTransform economy to reduce energy dependence
Renewables expand
Proactive government funding
Carbon sequestration moving from demonstrative
to commercially viable
Technological breakthroughs in all new renewables
H2 infrastructure
RD&D blueprint
Import LNG
Hybrids standard
Demonstration new renewables
CCS commercial
Biofuels increase
Energy typesTechnologiesDependencies
Smart housing
Smart grid
H2 vehicles
Renewables take over
2010
2020
2030
2040
2050
Scenario details The scenarios below show the potential 2050 future states and the pathways to them.
FIGURE 13
GROWTH SCENARIOCompetitive advantage in energy prices
Energy typesTechnologiesDependencies
Renewables growth
More incentives on exploration
Climate change policy softened
Carbon sequestration moving from demonstrative
to commercially viable
Breakthroughs in solar and biofuels
H2 storage breakthroughs
Clean coalIncreasing vehicle efficiency/hybrids
Renewables stagnatingMajor grid
expansion
Beginnings of hydrogen infrastructure
Clean coal and sequestration competitive
Focus on hydrogen
Renewables increase (biofuels/solar)
Gas or coal to liquids
Exploit indigenous gas/coal
2010
2020
2030
2040
2050
Journeys to energy sustainability in 2050
10
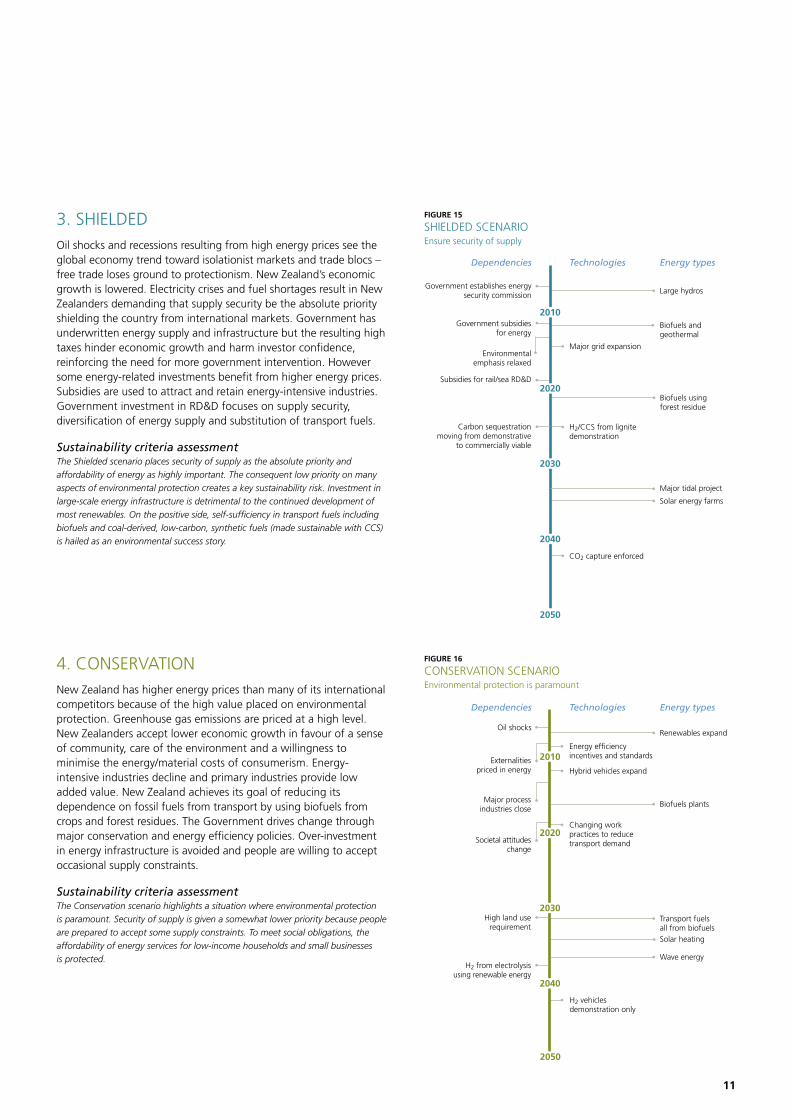
3. SHIELDEDOil shocks and recessions resulting from high energy prices see the global economy trend toward isolationist markets and trade blocs – free trade loses ground to protectionism. New Zealand’s economic growth is lowered. Electricity crises and fuel shortages result in New Zealanders demanding that supply security be the absolute priority shielding the country from international markets. Government has underwritten energy supply and infrastructure but the resulting high taxes hinder economic growth and harm investor confidence, reinforcing the need for more government intervention. However some energy-related investments benefit from higher energy prices. Subsidies are used to attract and retain energy-intensive industries. Government investment in RD&D focuses on supply security, diversification of energy supply and substitution of transport fuels.
Sustainability criteria assessmentThe Shielded scenario places security of supply as the absolute priority and
affordability of energy as highly important. The consequent low priority on many
aspects of environmental protection creates a key sustainability risk. Investment in
large-scale energy infrastructure is detrimental to the continued development of
most renewables. On the positive side, self-sufficiency in transport fuels including
biofuels and coal-derived, low-carbon, synthetic fuels (made sustainable with CCS)
is hailed as an environmental success story.
4. CONSERVATIONNew Zealand has higher energy prices than many of its international competitors because of the high value placed on environmental protection. Greenhouse gas emissions are priced at a high level. New Zealanders accept lower economic growth in favour of a sense of community, care of the environment and a willingness to minimise the energy/material costs of consumerism. Energy-intensive industries decline and primary industries provide low added value. New Zealand achieves its goal of reducing its dependence on fossil fuels from transport by using biofuels from crops and forest residues. The Government drives change through major conservation and energy efficiency policies. Over-investment in energy infrastructure is avoided and people are willing to accept occasional supply constraints.
Sustainability criteria assessmentThe Conservation scenario highlights a situation where environmental protection
is paramount. Security of supply is given a somewhat lower priority because people
are prepared to accept some supply constraints. To meet social obligations, the
affordability of energy services for low-income households and small businesses
is protected.
FIGURE 15
SHIELDED SCENARIOEnsure security of supply
Energy typesTechnologiesDependencies
Large hydrosGovernment establishes energy
security commission
Government subsidies for energy
Subsidies for rail/sea RD&D
Carbon sequestration moving from demonstrative
to commercially viable
Biofuels using forest residue
H2/CCS from lignite demonstration
CO2 capture enforced
Solar energy farms
Major tidal project
Biofuels and geothermal
2010
2020
2030
2040
2050
Major grid expansionEnvironmental
emphasis relaxed
FIGURE 16
CONSERVATION SCENARIOEnvironmental protection is paramount
Renewables expandOil shocks
Externalities priced in energy
Major process industries close
Societal attitudes change
Energy efficiency incentives and standards
Hybrid vehicles expand
H2 vehicles demonstration only
Transport fuels all from biofuels
Biofuels plants
Energy typesTechnologiesDependencies
Changing work practices to reduce transport demand
Solar heating
2010
2020
2030
2040
Wave energy
High land use requirement
H2 from electrolysis using renewable energy
2050
11
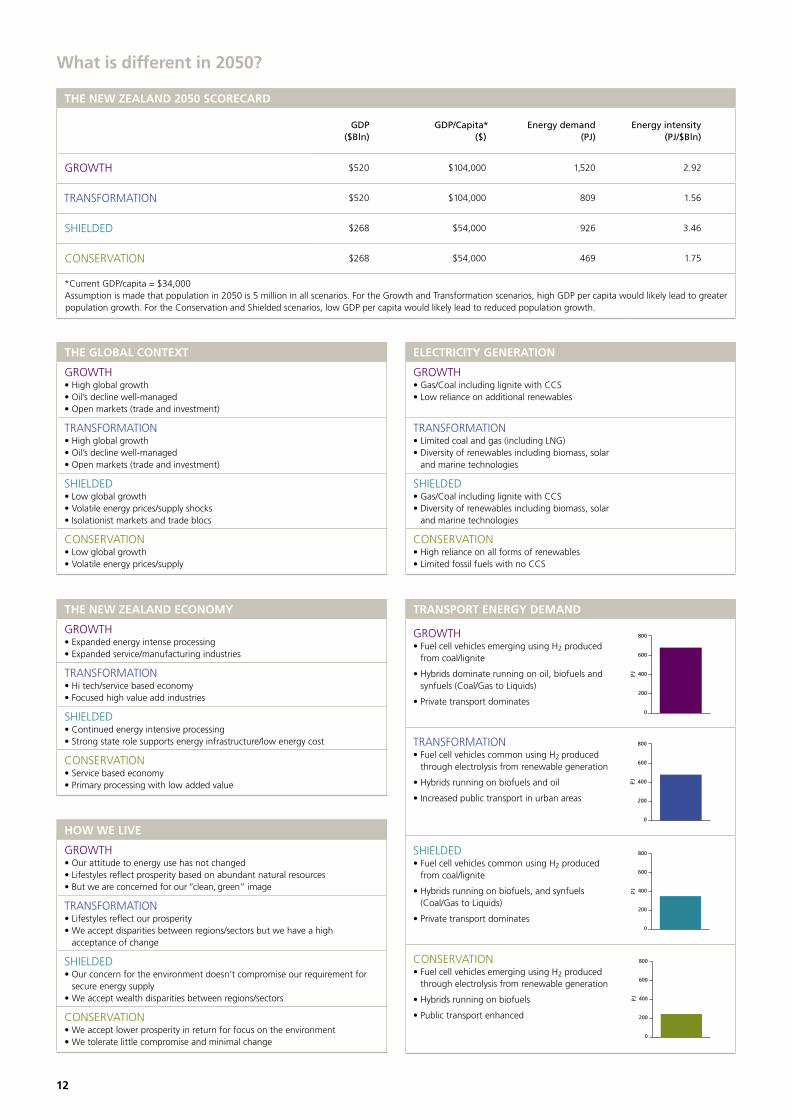
THE NEW ZEALAND 2050 SCORECARD
GDP ($Bln)
GDP/Capita* ($)
Energy demand (PJ)
Energy intensity (PJ/$Bln)
GROWTH $520 $104,000 1,520 2.92
TRANSFORMATION $520 $104,000 809 1.56
SHIELDED $268 $54,000 926 3.46
CONSERVATION $268 $54,000 469 1.75
* Current GDP/capita = $34,000Assumption is made that population in 2050 is 5 million in all scenarios. For the Growth and Transformation scenarios, high GDP per capita would likely lead to greater population growth. For the Conservation and Shielded scenarios, low GDP per capita would likely lead to reduced population growth.
THE NEW ZEALAND ECONOMY
GROWTH• Expanded energy intense processing• Expanded service/manufacturing industries
TRANSFORMATION• Hi tech/service based economy• Focused high value add industries
SHIELDED• Continued energy intensive processing• Strong state role supports energy infrastructure/low energy cost
CONSERVATION• Service based economy• Primary processing with low added value
THE GLOBAL CONTEXT
GROWTH• High global growth• Oil’s decline well-managed• Open markets (trade and investment)
TRANSFORMATION• High global growth• Oil’s decline well-managed• Open markets (trade and investment)
SHIELDED• Low global growth• Volatile energy prices/supply shocks• Isolationist markets and trade blocs
CONSERVATION• Low global growth• Volatile energy prices/supply
HOW WE LIVE
GROWTH• Our attitude to energy use has not changed • Lifestyles reflect prosperity based on abundant natural resources• But we are concerned for our “clean, green” image
TRANSFORMATION• Lifestyles reflect our prosperity• We accept disparities between regions/sectors but we have a high
acceptance of change
SHIELDED• Our concern for the environment doesn’t compromise our requirement for
secure energy supply• We accept wealth disparities between regions/sectors
CONSERVATION• We accept lower prosperity in return for focus on the environment• We tolerate little compromise and minimal change
ELECTRICITY GENERATION
GROWTH• Gas/Coal including lignite with CCS• Low reliance on additional renewables
TRANSFORMATION• Limited coal and gas (including LNG)• Diversity of renewables including biomass, solar
and marine technologies
SHIELDED• Gas/Coal including lignite with CCS• Diversity of renewables including biomass, solar
and marine technologies
CONSERVATION• High reliance on all forms of renewables• Limited fossil fuels with no CCS
What is different in 2050?
TRANSPORT ENERGY DEMAND
GROWTH• Fuel cell vehicles emerging using H2 produced
from coal/lignite
• Hybrids dominate running on oil, biofuels and synfuels (Coal/Gas to Liquids)
• Private transport dominates
TRANSFORMATION• Fuel cell vehicles common using H2 produced
through electrolysis from renewable generation
• Hybrids running on biofuels and oil
• Increased public transport in urban areas
SHIELDED• Fuel cell vehicles common using H2 produced
from coal/lignite
• Hybrids running on biofuels, and synfuels (Coal/Gas to Liquids)
• Private transport dominates
CONSERVATION• Fuel cell vehicles emerging using H2 produced
through electrolysis from renewable generation
• Hybrids running on biofuels
• Public transport enhanced
���
���
���
���
�
��
���
���
���
���
�
��
���
���
���
���
�
��
���
���
���
���
�
��
���
���
���
���
�
��
���
���
���
���
�
��
���
���
���
���
�
��
���
���
���
���
�
��
���
���
���
���
�
��
���
���
���
���
�
��
���
���
���
���
�
��
���
���
���
���
�
�����
���
���
���
�
��
���
���
���
���
�
�����
���
���
���
�
��
���
���
���
���
�
��
12
Scenario GROWTH TRANSFORMATION SHIELDED CONSERVATION
2010
2020
2030
2040
2050
2010
2020
2030
2040
2050
Direct use energy
Gas – indigenous
LNG
Coal
Biomass
Transport energy
Oil
Biofuels
Coal/Gas to Liquids
H2
Vehicle technology
Internal Combustion Engine (ICE)
Hybrid electric/ICE vehicle
Fuel cell – H2
Electricity generation
Renewables
Hydro
Wind
Solar
Geothermal
Biomass
Marine technologies
Fossil fuels
Gas – indigenous
LNG
Coal including lignite
CCS (gas/coal combustion)
Infrastructure
Major electrical grid upgrade
Smart electricity grid
Hydrogen infrastructure
Energy conservation/efficiency
Efficiency focus
Smart buildings
Solar heating
Demand controls
2010
2020
2030
2040
2050
2010
2020
2030
2040
2050
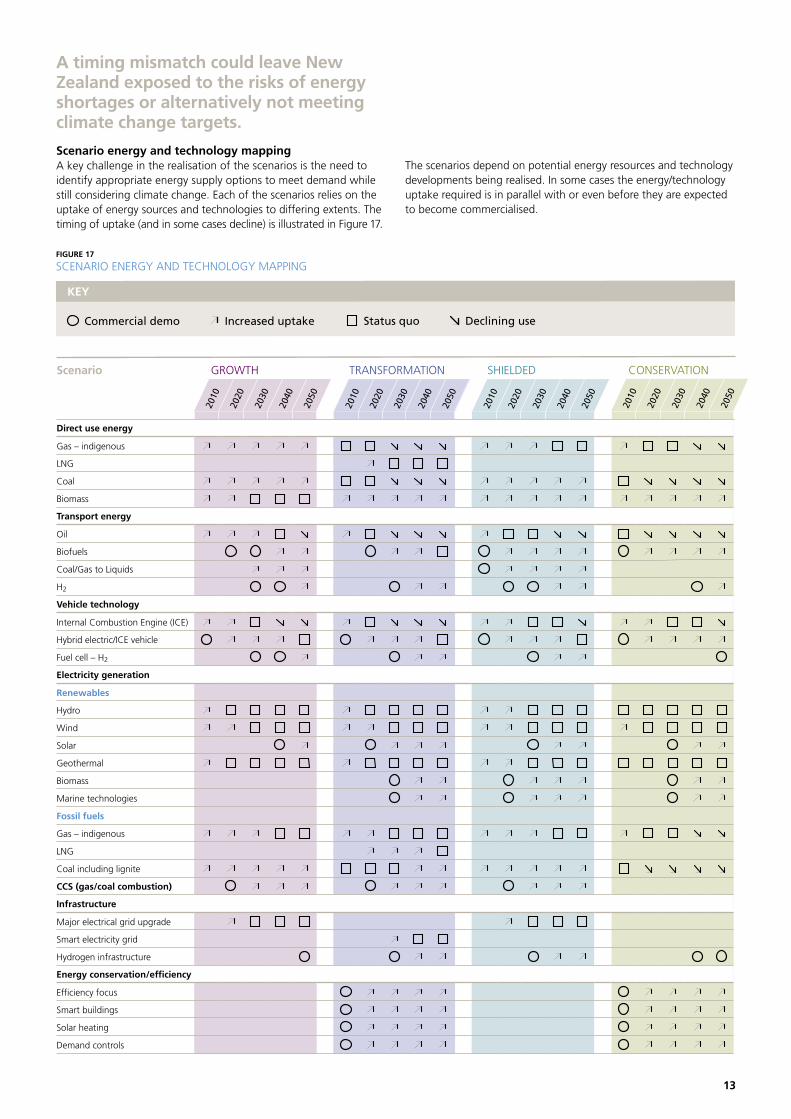
A timing mismatch could leave New Zealand exposed to the risks of energy shortages or alternatively not meeting climate change targets.
Scenario energy and technology mappingA key challenge in the realisation of the scenarios is the need to identify appropriate energy supply options to meet demand while still considering climate change. Each of the scenarios relies on the uptake of energy sources and technologies to differing extents. The timing of uptake (and in some cases decline) is illustrated in Figure 17.
The scenarios depend on potential energy resources and technology developments being realised. In some cases the energy/technology uptake required is in parallel with or even before they are expected to become commercialised.
KEY
Commercial demo Increased uptake Status quo Declining use
FIGURE 17
SCENARIO ENERGY AND TECHNOLOGY MAPPING
13
Biofuels – the challenge
6% of our current diesel demand could be met from bio-diesel if all New Zealand’s arable land was converted to rapeseed production. A further 10% of our current diesel demand could come from forest residue and wood waste conversion provided
the challenge of collection and transport to a biofuels plant can be overcome. Source: www.eeca.govt.nz
There are other opportunities such as turning tallow and used cooking oil into fuel. Argent Energy recently installed a plant in Scotland that can produce 50 million litres of bio-diesel per year, enough to produce nearly 5% of Scotland’s diesel needs (nearly 2% of New Zealand’s diesel demand).
Vehicle technology
Hybrid vehicles are already on sale in New Zealand today. In the USA analysts predict that hybrids could be around one-third of the total market by 2015. Use of hybrid technology can save 30-50% fuel for the same size of vehicle.
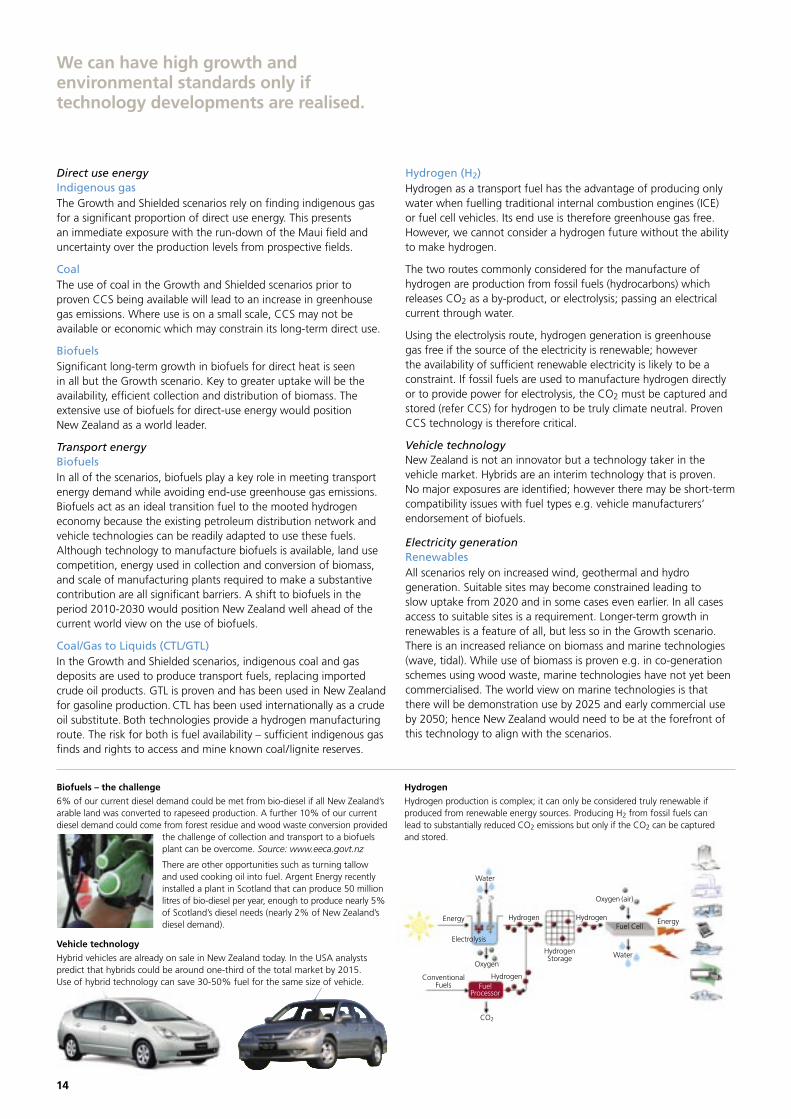
Hydrogen
Hydrogen production is complex; it can only be considered truly renewable if produced from renewable energy sources. Producing H2 from fossil fuels can lead to substantially reduced CO2 emissions but only if the CO2 can be captured and stored.
Direct use energyIndigenous gasThe Growth and Shielded scenarios rely on finding indigenous gas for a significant proportion of direct use energy. This presents an immediate exposure with the run-down of the Maui field and uncertainty over the production levels from prospective fields.
Coal The use of coal in the Growth and Shielded scenarios prior to proven CCS being available will lead to an increase in greenhouse gas emissions. Where use is on a small scale, CCS may not be available or economic which may constrain its long-term direct use.
BiofuelsSignificant long-term growth in biofuels for direct heat is seen in all but the Growth scenario. Key to greater uptake will be the availability, efficient collection and distribution of biomass. The extensive use of biofuels for direct-use energy would position New Zealand as a world leader.
Transport energyBiofuelsIn all of the scenarios, biofuels play a key role in meeting transport energy demand while avoiding end-use greenhouse gas emissions. Biofuels act as an ideal transition fuel to the mooted hydrogen economy because the existing petroleum distribution network and vehicle technologies can be readily adapted to use these fuels. Although technology to manufacture biofuels is available, land use competition, energy used in collection and conversion of biomass, and scale of manufacturing plants required to make a substantive contribution are all significant barriers. A shift to biofuels in the period 2010-2030 would position New Zealand well ahead of the current world view on the use of biofuels.
Coal/Gas to Liquids (CTL/GTL)In the Growth and Shielded scenarios, indigenous coal and gas deposits are used to produce transport fuels, replacing imported crude oil products. GTL is proven and has been used in New Zealand for gasoline production. CTL has been used internationally as a crude oil substitute. Both technologies provide a hydrogen manufacturing route. The risk for both is fuel availability – sufficient indigenous gas finds and rights to access and mine known coal/lignite reserves.
Hydrogen (H2)Hydrogen as a transport fuel has the advantage of producing only water when fuelling traditional internal combustion engines (ICE) or fuel cell vehicles. Its end use is therefore greenhouse gas free. However, we cannot consider a hydrogen future without the ability to make hydrogen.
The two routes commonly considered for the manufacture of hydrogen are production from fossil fuels (hydrocarbons) which releases CO2 as a by-product, or electrolysis; passing an electrical current through water.
Using the electrolysis route, hydrogen generation is greenhouse gas free if the source of the electricity is renewable; however the availability of sufficient renewable electricity is likely to be a constraint. If fossil fuels are used to manufacture hydrogen directly or to provide power for electrolysis, the CO2 must be captured and stored (refer CCS) for hydrogen to be truly climate neutral. Proven CCS technology is therefore critical.
Vehicle technologyNew Zealand is not an innovator but a technology taker in the vehicle market. Hybrids are an interim technology that is proven. No major exposures are identified; however there may be short-term compatibility issues with fuel types e.g. vehicle manufacturers’ endorsement of biofuels.
Electricity generationRenewablesAll scenarios rely on increased wind, geothermal and hydro generation. Suitable sites may become constrained leading to slow uptake from 2020 and in some cases even earlier. In all cases access to suitable sites is a requirement. Longer-term growth in renewables is a feature of all, but less so in the Growth scenario. There is an increased reliance on biomass and marine technologies (wave, tidal). While use of biomass is proven e.g. in co-generation schemes using wood waste, marine technologies have not yet been commercialised. The world view on marine technologies is that there will be demonstration use by 2025 and early commercial use by 2050; hence New Zealand would need to be at the forefront of this technology to align with the scenarios.
Water
Energy Hydrogen Hydrogen
HydrogenStorage
HydrogenConventional Fuels
CO2
Water
Oxygen (air)
Energy
Electrolysis
Oxygen
FuelProcessor
Fuel Cell
We can have high growth and environmental standards only if technology developments are realised.
14
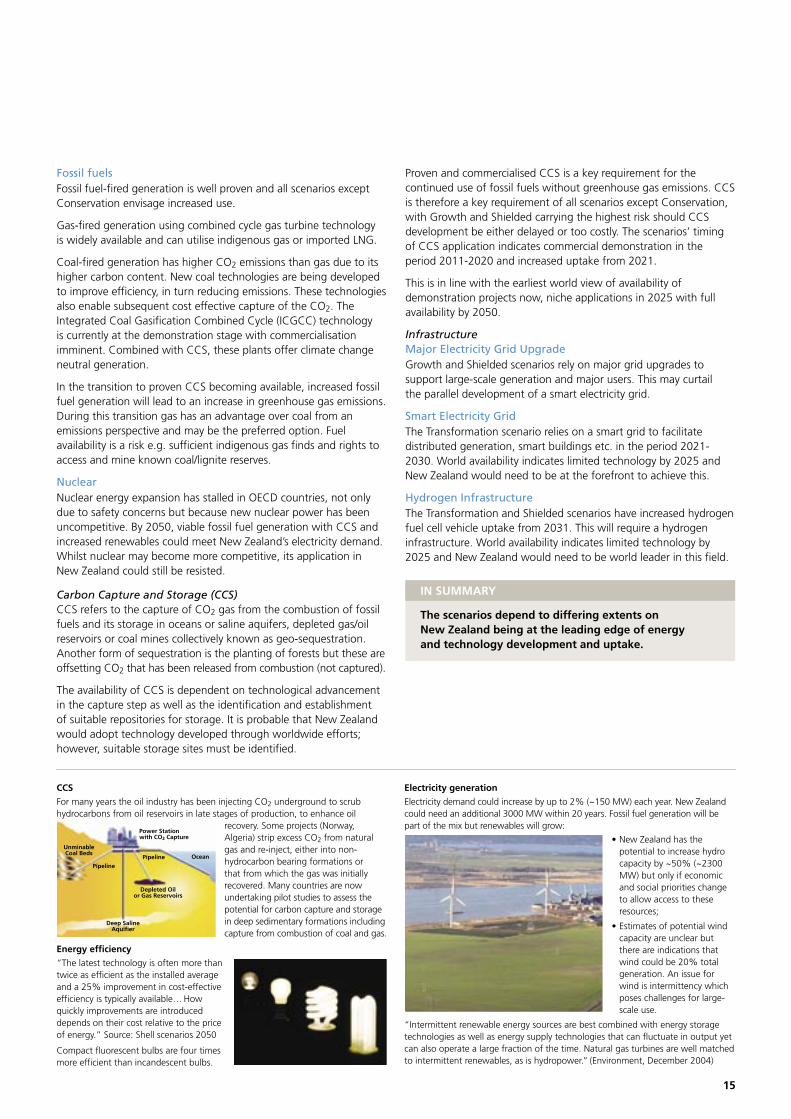
CCS
For many years the oil industry has been injecting CO2 underground to scrub hydrocarbons from oil reservoirs in late stages of production, to enhance oil
recovery. Some projects (Norway, Algeria) strip excess CO2 from natural gas and re-inject, either into non-hydrocarbon bearing formations or that from which the gas was initially recovered. Many countries are now undertaking pilot studies to assess the potential for carbon capture and storage in deep sedimentary formations including capture from combustion of coal and gas.
Energy efficiency
“The latest technology is often more than twice as efficient as the installed average and a 25% improvement in cost-effective efficiency is typically available… How quickly improvements are introduced depends on their cost relative to the price of energy.” Source: Shell scenarios 2050
Compact fluorescent bulbs are four times more efficient than incandescent bulbs.
Electricity generation
Electricity demand could increase by up to 2% (~150 MW) each year. New Zealand could need an additional 3000 MW within 20 years. Fossil fuel generation will be part of the mix but renewables will grow:
• New Zealand has the potential to increase hydro capacity by ~50% (~2300 MW) but only if economic and social priorities change to allow access to these resources;
• Estimates of potential wind capacity are unclear but there are indications that wind could be 20% total generation. An issue for wind is intermittency which poses challenges for large-scale use.
“Intermittent renewable energy sources are best combined with energy storage technologies as well as energy supply technologies that can fluctuate in output yet can also operate a large fraction of the time. Natural gas turbines are well matched to intermittent renewables, as is hydropower.” (Environment, December 2004)
Fossil fuelsFossil fuel-fired generation is well proven and all scenarios except Conservation envisage increased use.
Gas-fired generation using combined cycle gas turbine technology is widely available and can utilise indigenous gas or imported LNG.
Coal-fired generation has higher CO2 emissions than gas due to its higher carbon content. New coal technologies are being developed to improve efficiency, in turn reducing emissions. These technologies also enable subsequent cost effective capture of the CO2. The Integrated Coal Gasification Combined Cycle (ICGCC) technology is currently at the demonstration stage with commercialisation imminent. Combined with CCS, these plants offer climate change neutral generation.
In the transition to proven CCS becoming available, increased fossil fuel generation will lead to an increase in greenhouse gas emissions. During this transition gas has an advantage over coal from an emissions perspective and may be the preferred option. Fuel availability is a risk e.g. sufficient indigenous gas finds and rights to access and mine known coal/lignite reserves.
NuclearNuclear energy expansion has stalled in OECD countries, not only due to safety concerns but because new nuclear power has been uncompetitive. By 2050, viable fossil fuel generation with CCS and increased renewables could meet New Zealand’s electricity demand. Whilst nuclear may become more competitive, its application in New Zealand could still be resisted.
Carbon Capture and Storage (CCS)CCS refers to the capture of CO2 gas from the combustion of fossil fuels and its storage in oceans or saline aquifers, depleted gas/oil reservoirs or coal mines collectively known as geo-sequestration. Another form of sequestration is the planting of forests but these are offsetting CO2 that has been released from combustion (not captured).
The availability of CCS is dependent on technological advancement in the capture step as well as the identification and establishment of suitable repositories for storage. It is probable that New Zealand would adopt technology developed through worldwide efforts; however, suitable storage sites must be identified.
Proven and commercialised CCS is a key requirement for the continued use of fossil fuels without greenhouse gas emissions. CCS is therefore a key requirement of all scenarios except Conservation, with Growth and Shielded carrying the highest risk should CCS development be either delayed or too costly. The scenarios’ timing of CCS application indicates commercial demonstration in the period 2011-2020 and increased uptake from 2021.
This is in line with the earliest world view of availability of demonstration projects now, niche applications in 2025 with full availability by 2050.
InfrastructureMajor Electricity Grid UpgradeGrowth and Shielded scenarios rely on major grid upgrades to support large-scale generation and major users. This may curtail the parallel development of a smart electricity grid.
Smart Electricity GridThe Transformation scenario relies on a smart grid to facilitate distributed generation, smart buildings etc. in the period 2021-2030. World availability indicates limited technology by 2025 and New Zealand would need to be at the forefront to achieve this.
Hydrogen InfrastructureThe Transformation and Shielded scenarios have increased hydrogen fuel cell vehicle uptake from 2031. This will require a hydrogen infrastructure. World availability indicates limited technology by 2025 and New Zealand would need to be world leader in this field.
IN SUMMARY
The scenarios depend to differing extents on New Zealand being at the leading edge of energy and technology development and uptake.
Pipeline
Unminable Coal Beds
Pipeline
Deep Saline Aquifier
Ocean
Depleted Oil or Gas Reservoirs
15
Power Station with CO2 Capture
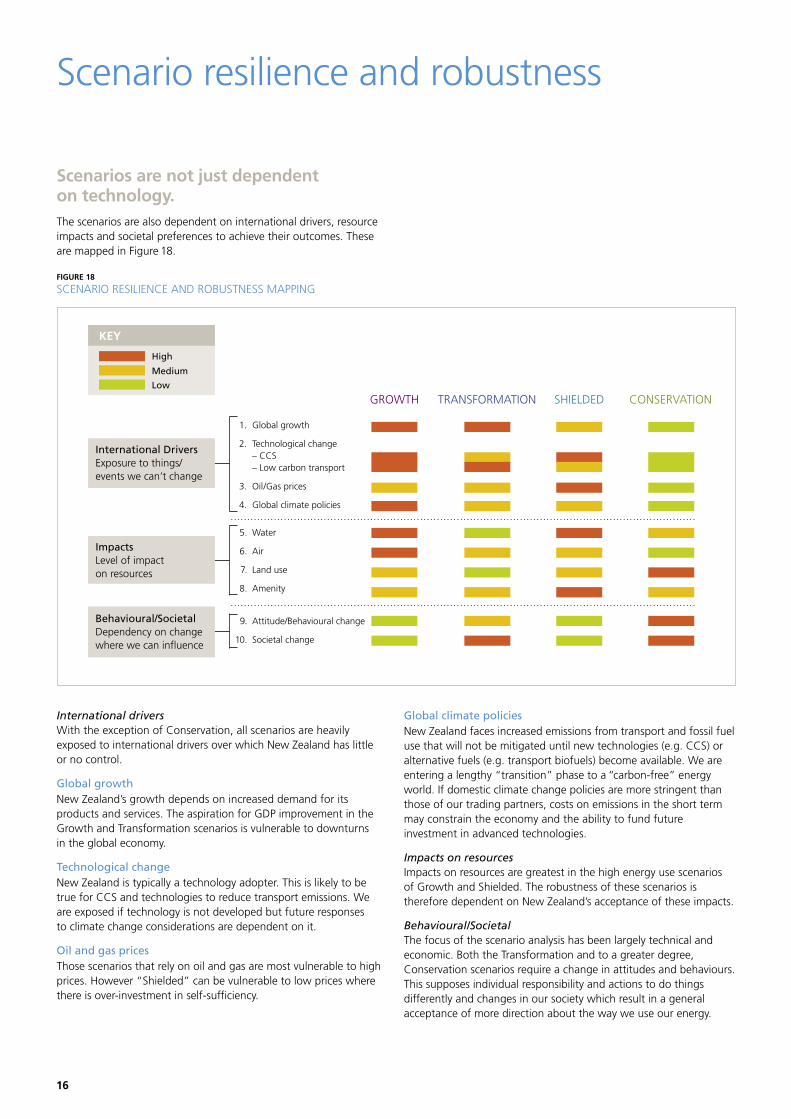
Scenarios are not just dependent on technology.The scenarios are also dependent on international drivers, resource impacts and societal preferences to achieve their outcomes. These are mapped in Figure 18.
FIGURE 18
SCENARIO RESILIENCE AND ROBUSTNESS MAPPING
������ �������������������������� ��������
���
� ��� �������������
� ��� ��������������������� � ������ � ����������������������
� ��� ��������������
� ��� �����������������������
� ��� �����
� ��� ���
� ��� ��������
� ��� �������
� ��� ���������������������������
����� ���������������
����
������
���
��������������������������������������������������������������
�����������������������������������
���������������������������������������������������������������
Scenario resilience and robustness
International driversWith the exception of Conservation, all scenarios are heavily exposed to international drivers over which New Zealand has little or no control.
Global growthNew Zealand’s growth depends on increased demand for its products and services. The aspiration for GDP improvement in the Growth and Transformation scenarios is vulnerable to downturns in the global economy.
Technological changeNew Zealand is typically a technology adopter. This is likely to be true for CCS and technologies to reduce transport emissions. We are exposed if technology is not developed but future responses to climate change considerations are dependent on it.
Oil and gas pricesThose scenarios that rely on oil and gas are most vulnerable to high prices. However “Shielded” can be vulnerable to low prices where there is over-investment in self-sufficiency.
Global climate policiesNew Zealand faces increased emissions from transport and fossil fuel use that will not be mitigated until new technologies (e.g. CCS) or alternative fuels (e.g. transport biofuels) become available. We are entering a lengthy “transition” phase to a “carbon-free” energy world. If domestic climate change policies are more stringent than those of our trading partners, costs on emissions in the short term may constrain the economy and the ability to fund future investment in advanced technologies.
Impacts on resourcesImpacts on resources are greatest in the high energy use scenarios of Growth and Shielded. The robustness of these scenarios is therefore dependent on New Zealand’s acceptance of these impacts.
Behavioural/SocietalThe focus of the scenario analysis has been largely technical and economic. Both the Transformation and to a greater degree, Conservation scenarios require a change in attitudes and behaviours. This supposes individual responsibility and actions to do things differently and changes in our society which result in a general acceptance of more direction about the way we use our energy.
16

�������������������������
��������������������
���������������������������
���������������������
���������������������
����������������������������������
���������������������������������������������
FIGURE 19
SCENARIO DEPENDENCIES AND ENERGY DEMAND IN 2050The barriers to change.Figure 19 highlights the relationship between energy demand in the scenarios and their relative dependencies on technological and behavioural or societal change.
At the extremes, the Growth and Shielded scenarios are highly dependent on technological change but are independent of behavioural or societal change, while the Conservation scenario is the inverse.
Transformation is the scenario that achieves high GDP Growth, with decoupled energy demand. It is dependent on both technological and behavioural/societal change but preserves the greatest optionality.
Scenario dependencies and optionality
GROWTHThe Growth scenario can transition into Transformation further along the pathway if circumstances change. The advantage is in the less urgent pace of change and the added wealth gained from the “boom” years acting as an economic cushion in the vulnerable transformation years. A more measured pace would allow better signalling to be made of future intentions and recognition of the long-term investment in many industrial plants and much of the energy infrastructure.
SHIELDEDThe Shielded scenario can transition into Transformation but the over-investment in security would greatly reduce the ability to shift economic production. The only advantage in this scenario in terms of changed circumstances is that an export industry based on transport fuels would have a significant benefit from higher oil prices. Shielded has the biggest risk of capital stranded by technological or behavioural change.
TRANSFORMATIONThe Transformation scenario has the advantage of greater diversity of products and services generating wealth and less dependence on commodity prices. Once the transformation to a less energy-intensive economy has been achieved, the exposure to climate change policy risk is much reduced and resilience to various potential economic shocks are greatly increased. While the 2050 position is undoubtedly the one with the greatest optionality to meet changed circumstances, there is a major risk during the transition period. If the transition is only partly successful many energy-intensive industries may choose not to return.
CONSERVATIONThe Conservation scenario has the advantage of stabilising CO2 emissions and gaining an international trade image that would accompany such environmental leadership. Once the transformation to a less energy-intensive and more self-sufficient economy has been achieved, there is greater resilience to economic shocks. This future state therefore has good optionality to meet changed circumstances. However, there will be a major risk in terms of acceptability during the transition period when the challenge will be matching job and wealth losses from the outgoing industries with gains in the service and light manufacturing industries.
The scenarios are not mutually exclusive.
17
For a sustainable future we face trade-offs between affordability, security of supply and environmental protection.
What are the choices?If New Zealanders want to maintain their relative living standards and quality of life the country needs to face up to an emerging energy problem.
Relying on energy efficiency alone will not solve the problem of how we meet energy demand in the future. In each scenario we have assumed a sustained rate of energy-efficiency up-take through to 2050. For the low energy scenarios (Conservation and Transformation), the assumed rate of energy-efficiency up-take has been set at an aggressive level.
Energy demand may continue its historical relationship with GDP growth (the Growth scenario).
If we try to break this historical link between GDP growth and energy demand there are significant challenges in how we transform the structure of our economy and the way we organise to meet our social and transport needs (the Transformation scenario).
An alternative is to agree to accept lower living standards and growth (the Conservation scenario).
In order to sustain GDP growth we know that increased energy demand has to be met (even in the Transformation scenario). The challenge is managing the supply:• Even with a marked increase in renewables, starting from an
already high base, there is a risk that renewables alone will not meet the full demand.
• Fossil fuels will continue to be part of our future energy mix. Given this, we need to deal with the associated greenhouse gas emissions to address climate change considerations.
We recommend that both renewables and fossil fuels are part of the energy mix, with use of renewables broadened and fossil fuel impacts mitigated through increased efficiency in conjunction with carbon capture and storage.
We consider that most New Zealanders will prefer a future that is closer to the Transformation scenario combining improved living standards with increasing environmental protection. The Conservation scenario is not the only one providing environmental protection – we can address this prerequisite whilst growing the economy. To do this we will require behavioural change in the way we use energy combined with reliance on developing technologies.
What do we need to do?
18
We need to be nimble, not “nimby”.This study helps us to identify some key areas where action is required with leadership from government. These are presented in the context of the sustainability criteria.
Security of supply: “Nine out of 10 New Zealanders do not believe we have a long-term strategy to keep the lights on”Security of supply will be influenced by the energy demand of the economy and the availability of suitable energy sources. Both have a role to play. The government needs to decide what sort of long-term energy future it is seeking for New Zealand and regularly review the emerging options available.
As part of this study, we have examined the opportunity to decouple energy use from GDP. There must be:
• Ongoing promotion and development of cost-effective energy efficiency and conservation programmes with the aim of doubling the rate of improvement in energy efficiency.
• Continued encouragement for organisations to find and develop indigenous energy sources; both fossil fuels and renewables. This will help identify new technology and fuel options for New Zealand.
Affordability: “Economic growth can fund affordable energy” • Our analysis clearly shows that if we do not find major new oil
or gas fields or have access to a commercial CO2 storage and sequestration technology that works with New Zealand coal types (in particular lignites), we become much more dependent on worldwide energy prices and supply constraints e.g. through dependency on LNG. Our economy loses comparative advantage in energy costs. Affordability may decline.
• Increased prices can provide the signal to transform the economy and improve energy efficiency. Some perceive that this is the only way in which decoupling of energy demand and GDP will occur. History shows, however, that changes to our economy will take time to implement. Significant short-term changes in energy prices may harm the energy-intensive sectors of the economy at a time when their economic contribution could help New Zealand to fund our transformation.
Environmental protection: “Renewables alone will not meet future demand”• We still have the capacity to considerably expand renewables
such as hydro, wind, solar and marine, but the issues which often hinder progress are not simply technological but also attitudinal.
• Fossil fuels will continue to be part of the future energy mix with technological advances to help ensure that we address long-term climate change. We should not foreclose on fossil fuel options in the short term due to current technology gaps that can be filled in the future.
• Revenue gathered from policies such as a carbon tax should be recycled back into targeted research and uptake of enhanced technologies, taking into account our need for additional fossil fuel and renewable energy.
• The transport sector is significant in terms of energy demand and greenhouse gas emissions. This sector has clear options available now to reduce energy demand through vehicle technology improvement. Government policies should encourage uptake of these technologies and discourage reliance on old technology from less fuel-efficient second-hand imports.
• The government should recognise that domestic climate change and other policies which are more stringent than those of our key trading competitors may constrain the economy and therefore the ability to fund long-term transitional technology investment.
Optionality: “We need to become a fast adapter”When preparing its energy policy the government should add optionality, the potential to keep options open, to the traditional criteria of security, affordability and environmental protection.
• In order to preserve its future options, the government should encourage multiple energy sources and avoid dominance of a single energy type.
• It should also encourage appropriate research into how to increase our energy options for the future. Australia has acknowledged that its relatively small size in the global economy means it cannot be a leader in all technologies so an assessment of strategic interests identified the following broad categories:
– Market leader technologies with strategic importance for Australia that international efforts will not adequately address, or in which Australia has a clear technology advantage.
– Fast follower technologies where Australia has a strategic interest but where domestic efforts should focus on supplementing international developments, and adopting these technologies quickly when available.
– Reserve technologies in which Australia has a lesser strategic interest at this stage but will maintain a watching brief.
The New Zealand government needs to take a similar approach but primarily as a fast adapter. Examples that would be appropriate may include:
– Adaptation of clean coal technologies for New Zealand lignites
– Adaptation of CO2 capture and storage in the context of New Zealand conditions
– Development of renewable opportunities – Bio-energy manufacture from forestry waste• The planning process, including the Resource Management Act
(RMA), should enable the government to set clear national goals for energy and projects should be assessed using clear unambiguous guidelines. Parochial and “nimby” concerns should be considered in the context of national interest.
• Any RMA review must consider how to increase optionality and strengthen the decision making framework. If an improved environmentally sound technology is available, its introduction should not be delayed by the consenting process.
• The government needs to fund research and to understand what drives the acceptability and uptake of energy and usage options in New Zealand. Understanding this will help us to decide what matters for New Zealanders and why.
19
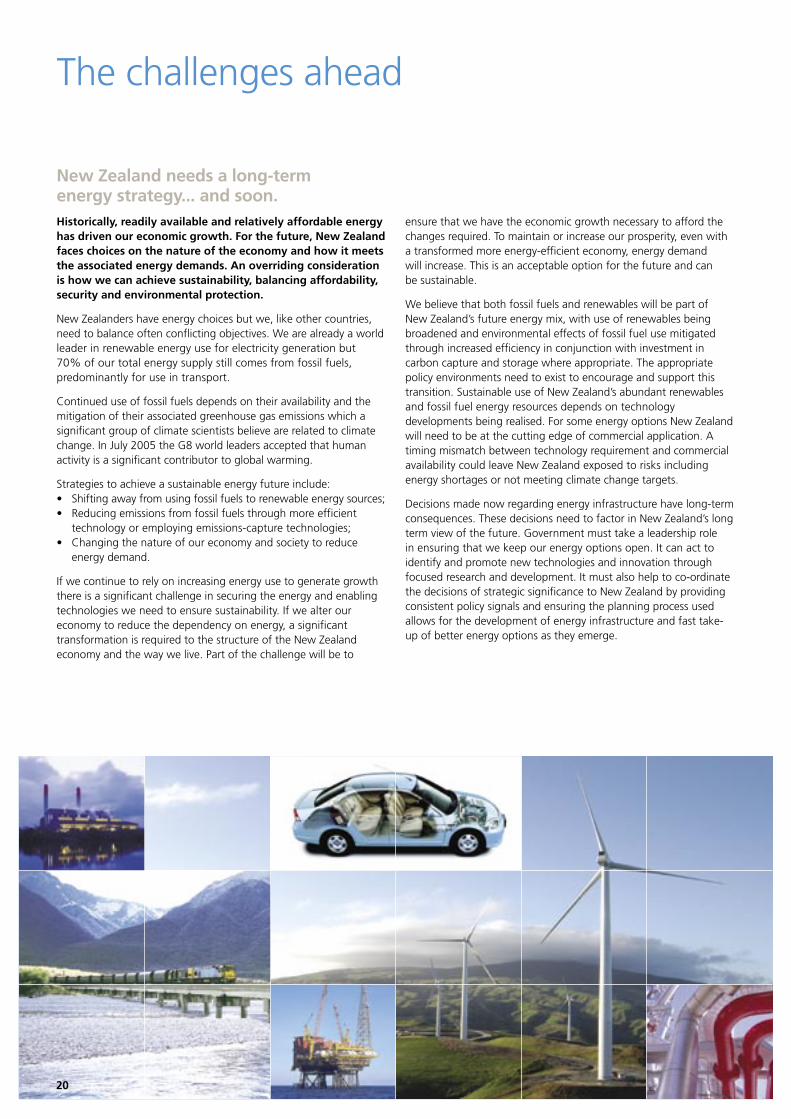
New Zealand needs a long-term energy strategy... and soon.Historically, readily available and relatively affordable energy has driven our economic growth. For the future, New Zealand faces choices on the nature of the economy and how it meets the associated energy demands. An overriding consideration is how we can achieve sustainability, balancing affordability, security and environmental protection.
New Zealanders have energy choices but we, like other countries, need to balance often conflicting objectives. We are already a world leader in renewable energy use for electricity generation but 70% of our total energy supply still comes from fossil fuels, predominantly for use in transport.
Continued use of fossil fuels depends on their availability and the mitigation of their associated greenhouse gas emissions which a significant group of climate scientists believe are related to climate change. In July 2005 the G8 world leaders accepted that human activity is a significant contributor to global warming.
Strategies to achieve a sustainable energy future include:• Shifting away from using fossil fuels to renewable energy sources; • Reducing emissions from fossil fuels through more efficient
technology or employing emissions-capture technologies; • Changing the nature of our economy and society to reduce
energy demand.
If we continue to rely on increasing energy use to generate growth there is a significant challenge in securing the energy and enabling technologies we need to ensure sustainability. If we alter our economy to reduce the dependency on energy, a significant transformation is required to the structure of the New Zealand economy and the way we live. Part of the challenge will be to
ensure that we have the economic growth necessary to afford the changes required. To maintain or increase our prosperity, even with a transformed more energy-efficient economy, energy demand will increase. This is an acceptable option for the future and can be sustainable.
We believe that both fossil fuels and renewables will be part of New Zealand’s future energy mix, with use of renewables being broadened and environmental effects of fossil fuel use mitigated through increased efficiency in conjunction with investment in carbon capture and storage where appropriate. The appropriate policy environments need to exist to encourage and support this transition. Sustainable use of New Zealand’s abundant renewables and fossil fuel energy resources depends on technology developments being realised. For some energy options New Zealand will need to be at the cutting edge of commercial application. A timing mismatch between technology requirement and commercial availability could leave New Zealand exposed to risks including energy shortages or not meeting climate change targets.
Decisions made now regarding energy infrastructure have long-term consequences. These decisions need to factor in New Zealand’s long term view of the future. Government must take a leadership role in ensuring that we keep our energy options open. It can act to identify and promote new technologies and innovation through focused research and development. It must also help to co-ordinate the decisions of strategic significance to New Zealand by providing consistent policy signals and ensuring the planning process used allows for the development of energy infrastructure and fast take-up of better energy options as they emerge.
The challenges ahead
20
Glossary Project roles
AEEI Autonomous rate of Energy-Efficiency Improvement, expressed as an annual percentage, often referring to the historical rate without special efficiency measures.
AffordabilityOne of the three IEA sustainability criteria referring to the relative price of energy in terms of its consequent availability to users ranging from industries down to individual households.
Biomass/BiofuelsThese two terms are used interchangeably, to cover a broad range of fuels including wood waste, biogas, ethanol and plant oils.
Brundtland CommissionThe World Commission on Environment and Development chaired by Norwegian Prime Minister Gro Harlem Brundtland. The Commission’s report, Our Common Future (1987), popularised the notion of sustainable development.
CCSCO2 Capture and Storage (strictly it includes possible ocean storage of CO2 but otherwise synonymous with geo-sequestration or underground storage).
CO2Carbon dioxide.
DGDistributed Generation usually refers to a combination of several small- to medium-scale generation sources feeding into the transmission grid.
EECAEnergy Efficiency and Conservation Authority.
Environmental protectionOne of the three IEA sustainability criteria normally referring to minimising two types of environmental impact from energy supply and demand: localised impacts from air and water pollutants and global impacts from greenhouse gas (usually CO2) emissions.
GDPGross Domestic Product (usually in the context of annual percentage growth).
Geo-sequestrationGeological or underground storage of CO2; effectively ‘the S’ in CCS.
Gigajoule (GJ)A gigajoule is a billion or 109 (1,000,000,000) joules approximately equivalent to the energy contained in a small car’s full petrol tank.
ICEInternal Combustion Engine.
IEAInternational Energy Agency.
ICGCCIntegrated Coal Gasification Combined Cycle.
kVA kilovolt is 1000 volts.
kWhA kilowatt-hour is the energy used by a device with a power rating of one kilowatt (kW) used over one hour.
Kyoto ProtocolThis international agreement was established in 1997 as a means of setting binding emission reduction targets for greenhouse gases. It entered into force in 2005 meaning that New Zealand has agreed to return its net greenhouse gas emissions over the 2008-2012 commitment period to 1990 levels. It allows the opportunity for international initiatives to reduce emissions cost effectively through the use of its flexible mechanisms based on the trading of CO2 equivalent emission allowances.
LNGLiquefied Natural Gas.
LPGLiquefied Petroleum Gas.
MEDMinistry of Economic Development.
MWA megawatt is a million watts and is the usual unit for describing the power capacity for electricity generating units. It is also used to describe the heat rating of industrial boilers.
NIMBY“Not In My Back Yard”, in reference to residents objecting to development in their locality.
NOXNitrogen Oxides produced from combustion.
The NZBCSDThe New Zealand Business Council for Sustainable Development (The Business Council).
OECD Organisation for Economic Cooperation and Development.
OptionalityThe issue of optionality relates to the dependence of scenarios on certain assumptions and how readily the scenario pathways can shift to meet changed circumstances.
Petajoule (PJ)A petajoule is 1015 (1,000,000,000,000,000) joules. The original Maui gas reserve was approximately 4000PJ.
RD&DResearch, Development and Demonstration.
RMAResource Management Act.
Security of supplyOne of the three IEA sustainability criteria referring to the relative risk of being able to supply different forms of energy. In terms of most fuels, it usually refers to the continuity of supply at a certain price. For electricity, there is the added issue of transmission management ensuring continuity of supply from hour to hour at a quality level that will not disrupt usage in industries or households.
SOXSulphur Oxides produced from combustion.
Stranded capitalInvested capital (or that part of invested capital) that has not been depreciated but which has no future earning potential.
WBCSDWorld Business Council for Sustainable Development.
Project facilitatorThe New Zealand Business Council for Sustainable Development
The Business Council is a coalition of around 50 leading businesses united by a shared commitment to sustainable development via the three pillars of economic growth, environmental protection and social progress. Its mission is to provide business leadership as a catalyst for change towards sustainable development, and promotes eco-efficiency, innovation and responsible entrepreneurship.
Project participantsBP Oil New Zealand Limited
Business New Zealand
Coal Association of New Zealand
Energy Federation of New Zealand
Honda New Zealand Limited
Meridian Energy Limited
Mighty River Power Limited
National Institute of Water & Atmospheric Research (NIWA)
Orion New Zealand Limited
Petroleum Exploration and Production Association of New Zealand (PEPANZ)
Shell New Zealand Limited
Solid Energy New Zealand Limited
Toyota New Zealand Limited
WEL Networks Limited
Project consultantsCovec Limited
CRL Energy Limited
Hale & Twomey Limited
Frazer Lindstrom Limited
ReferencesPlease refer to the working papers available on www.nzbcsd.org.nz/energy2050
Photographic acknowledgements: Page 4 train supplied by Peter McGavin. All other photographs supplied by project participants.
Cover: 50% recycled fibre (35% pre-consumer, 15% post-consumer), 50% elemental chlorine free (ECF) fibre. Text pages: 100% recycled. Manufactured in a totally chlorine free process.

Facilitated by