a survey on the usage of eye-tracking in computer...
TRANSCRIPT

A Survey on the Usage of Eye-Tracking in ComputerProgramming
Unaizah Obaidellah1, Mohammed Al Haek2, Peter C-H Cheng3
1Department of Artificial Intelligence, Faculty of Computer Science and Information Technology, University of
Malaya, Malaysia. [email protected] of Artificial Intelligence, Faculty of Computer Science and Information Technology, University of
Malaya, Malaysia. [email protected] of Informatics, School of Engineering and Informatics, University of Sussex, United Kingdom.
Abstract
Traditional quantitative research methods of data collection in programming, such asquestionnaires and interviews, are the most common approaches for researchers in thisfield. However, in recent years, eye-tracking has been on the rise as a new method ofcollecting evidence of visual attention and the cognitive process of programmers. Eye-tracking has been used by researchers in the field of programming to analyze and under-stand a variety of tasks such as comprehension and debugging. In this paper, we willfocus on reporting how experiments that used eye-trackers in programming research areconducted, and the information that can be collected from these experiments. In thismapping study, we identify and report on 63 studies, published between 1990 and June2017, collected and gathered via manual search on digital libraries and databases relatedto computer science and computer engineering. Among the five main areas of researchinterest are program comprehension and debugging, which received an increased interestin recent years, non-code comprehension, collaborative programming and requirementstraceability research, which had the fewest number of publications due to possible limi-tations of the eye-tracking technology in this type of experiments. We find that most ofthe participants in these studies were students and faculty members from institutions ofhigher learning, and while they performed programming tasks on a range of programminglanguages and programming representations, we find Java language and UML representa-tion to be the most used materials. We also report on a range of eye-trackers and attentiontracking tools that have been utilized, and find Tobii eye-trackers to be the most useddevices by researchers.
1

Contents1 Introduction 2
1.1 Related work . . . . . . . . . . . . . . . . . . . . . . . . . . . . . . . . . . . . . 4
2 Methodology 42.1 Papers collection and selection . . . . . . . . . . . . . . . . . . . . . . . . . . . . 52.2 Inclusion, Exclusion . . . . . . . . . . . . . . . . . . . . . . . . . . . . . . . . . . 72.3 Classification Scheme . . . . . . . . . . . . . . . . . . . . . . . . . . . . . . . . . 82.4 Data collection Results . . . . . . . . . . . . . . . . . . . . . . . . . . . . . . . . 9
3 Mapping 113.1 [RQ1: ] How many papers have used eye-tracking in research on computer
programming? . . . . . . . . . . . . . . . . . . . . . . . . . . . . . . . . . . . . . 113.2 [RQ2: ] What programming tasks and areas were explored using eye-tracking? . 133.3 [RQ3:] What programming materials were used as stimulus in eye-tracking ex-
periments on computer programming? . . . . . . . . . . . . . . . . . . . . . . . 163.4 [RQ4:] Who were the subjects of eye-tracking experiments in computer program-
ming? . . . . . . . . . . . . . . . . . . . . . . . . . . . . . . . . . . . . . . . . . 173.5 [RQ5:] What eye-tracking technology and devices were used in computer pro-
gramming experiments? . . . . . . . . . . . . . . . . . . . . . . . . . . . . . . . 263.6 [RQ6:] What eye-tracking metrics and variables are commonly reported in pro-
gramming studies? . . . . . . . . . . . . . . . . . . . . . . . . . . . . . . . . . . 283.6.1 Eye-tracking metrics . . . . . . . . . . . . . . . . . . . . . . . . . . . . . 283.6.2 Variables . . . . . . . . . . . . . . . . . . . . . . . . . . . . . . . . . . . . 31
4 Discussion 33
5 Threats to validity 39
6 Conclusion 40
1 IntroductionThe lack of problem solving ability has been cited by many researchers as one of the mainreasons students face difficulties in learning to write computer programs Deek and McHugh(1998); Gomes and Mendes (2007a,b). Based on a survey conducted on students and tutors,Milne and Rowe (2002) associated the most difficult topics in learning programming to the lackof understanding of concepts and comprehension inability. In another attempt to understandthe difficulties novice programmers encounter, Mow (2008) classified cognitive requirementsof programming, (i.e. cognitive demand, mental models, cognitive load), as one of the fivemain areas of difficulties in learning programming. Based on the Bloom’s Taxonomy Andersonet al. (2001) in relation to learning computer programming, Renumol et al. (2009) found thatstudents have problems in all three domains of Bloom’s Taxonomy, with majority of themhaving difficulties in the cognitive domain.
The relation between programming education and the cognitive process of students is, how-ever, not a new finding. In 1990, Crosby and Stelovsky (1990) proposed the analysis of datacollected from eye movement to investigate the cognitive process of programmers, based ontheories that linked eye fixation to comprehension to understand how programmers read andunderstand algorithms. In their work, Crosby and Stelovsky (1990) used the Applied ScienceLaboratories (ASL) eye movement monitor to track the focused attention of the subjects. This
2

work by Crosby and Stelovsky (1990) is one of the first attempts to study computer program-ming by tracking the eye movement of students. However, this approach was not adoptedimmediately by researchers in this field. In a review, Sheard et al. (2009) analysed publishedresearch between 2005 and 2008 related to programming education, and found that most papersused quantitative research methods such as course assessments, questionnaires, and interviews.The traditional data collection methods adopted in most papers follows that of Sheard et al.(2009). Limited number of reports used eye-tracking. In fact, eye-tracking was not in the top12 data gathering techniques reported at that time. In 2013, Lai et al. (2013) reviewed researchusing eye-trackers in studies related to learning, and showed the emerging use of eye-trackersin research related to learning.
Given the increasing use of eye-tracking in assessing the underlying cognitive processesof programming, this survey will provide a summary of existing work in this field. This isconsidered necessary due to the absence of a guideline or methodology specifically designedfor this type of research. We decide to report this work as a mapping study to find linkagesbetween the existing published studies, identify patterns of publication and facilitate collectionof literature retrieval in the field of computer programming using eye-tracking. In this mappingstudy, we will try to answer questions about eye-tracking experiments and its setup, and providequantitative information from existing work, such as the type of materials used and the numberof subjects recruited for the study. This work will also provide a wide overview of eye-trackingin programming, and try to identify areas suitable for conducting a Systematic LiteratureReview (SLR) with more appropriate primary studies. This survey can serve as a reference forresearchers who are using eye-tracking to conduct a study related to learning and education, andit can provide detailed information for those who want to get started on a research in similarfields using eye-trackers. This mapping study discusses an extensive list of research areasstudied using eye-tracker in relation to programming, as to provide information to studentsand researchers who are planning on exploring this field. Furthermore, it can be helpful to eye-tracking manufacturers in terms of providing quantitative information about the eye-trackingdevices used by researchers in this field.
In this research, we describe the details of papers collection in the methodology Section 2 andthe results of the data collection in Section 2.4. Then, we report the mapping from the papersin Section 3, starting with the number of research that used eye-tracking, the classification ofexperiments, the different materials used, the participant selection and sample details, followedby types of eye-trackers used in each paper, along with the metrics and variables used in thestudies. We present a discussion of the mapping results in Section 4 then state any threats tothe validity of our study in Section 5, and conclude our survey in Section 6.
Throughout this work, we will use the LATEX generated BibTeX bibliography style AlphaPatashnik (1988) to reference the papers included in our study. The Alpha bibliography stylemakes use of the first initials of the last name of the authors along with the year of thepublication. We decided on using this style since it helps reducing the space of the citation,and make reporting 63 papers easier to fit into a diagram or a table. For example, if wewant to reference paper Crosby and Stelovsky (1990) published by Crosby and Stelovsky in1990, we will use the Alpha bibliography style to refer to it as [CS90]. If two papers have thesame initials, such in the case of Bednarik and Tukiainen (2007a) and Bednarik and Tukiainen(2007b), both papers published by Bednarik and Tukiainen in 2007 would have the same alphastyle of [BT07]. These papers will be distinguished by a letter following the year, and the orderof the letters is based on the alphabetical order of the papers’ title. Therefore, Bednarik andTukiainen (2007a) will be [BT07a] and Bednarik and Tukiainen (2007b) will be [BT07b]. It isalso worth noting that in all the tables and the figures, we present the papers of our mappingstudy sorted and organized by the year of the publication, not alphabetically.
3

1.1 Related workIn the course of this research, we came across a recent SLR that reported on the use of eye-trackers in software engineering. In their research, Sharafi et al. (2015) provided details ofdifferent experiments that used an eye-tracker to examine studies on software engineering.Upon starting our research, we noticed similarities between our work, and the work done bySharafi et al. (2015), as well as differences. Although most studies reported by Sharafi et al.(2015) are included in our reporting, it is worthy to note that our work focuses more on theprogramming aspects of these studies. As Sharafi et al. (2015) has provided detailed informationon the calculations and formulas for the metrics of visual effort, we advise readers to refer toSharafi et al. (2015) for further details. We noticed some differences in the reporting betweenour survey and Sharafi et al. (2015). However, we acknowledge the level of details reportedon the use of eye-trackers in software engineering studies. In their work, Sharafi et al. (2015)provided detailed information on the background of eye-tracking technology and different setupof devices, along with visual description of the technology. Again, we advise the reader torefer to Sharafi et al. (2015) for detailed information on the metrics used for calculating andprocessing the collected data from the eye-trackers, as we will not be reporting these topics toavoid repetition. Instead, we will focus on the findings of the studies in relation to experimentalsetup, analysing the materials, type of trackers, and the types of participants recruited in thestudies.
2 MethodologyThis survey is based on the guidelines suggested by Barbara Kitchenham (2007) and andPetersen et al. (2008) for mapping studies. In our work, the mapping study helps to determinethe amount and scope of research that has been conducted in the area of computer programmingusing eye trackers within certain period of time. We estimate that the reported work guidesresearch and practices in this area such as the selection of participants, types of test materials,types of and eye-tracker devices, types of information an eye-tracker can help gather, and thevariables it can measure. In this survey, we try to answer the following research questions:• RQ1 : How many papers have used eye-tracking in research on computer programming?
• RQ2 : What kinds of programming tasks and areas were explored using eye-tracking?
• RQ3 : What types programming materials were used as stimulus in eye-tracking experi-ments on computer programming?
• RQ4 : Who were the subjects of eye-tracking experiments in computer programming?
• RQ5 : What eye-tracking technology and devices were used in computer programmingexperiments?
• RQ6 : What eye-tracking metrics and variables are commonly reported in programmingstudies?
RQ1 will help identify the number of published work that used eye-trackers, thereby identi-fying how the technology has been adopted over the years, and provide evidence to it emergencein this field. RQ2 will help to identify and classify programming topics suitable for conduct-ing a systematic literature reviews, as well as to provide a detailed classification of researchattributes of the reported studies. RQ3, RQ4, RQ5 and RQ6 will answer questions related tothe experimental setup, and provide detailed information about the sample of subjects and itssize, type of materials and stimulus, eye-tracking device, metrics and variables that researchersneed to consider prior to conducting a similar study.
4

2.1 Papers collection and selectionWe focus on the collection of papers related to the use of eye-trackers in programming tasks,or programming related topics such as algorithms and diagrams. We performed our searchon electronic databases using multiple search queries (see below). Then, we went throughthe initial search results returned by each search engine, and selected papers that fit our aimby analysing the abstract and keywords of each paper. Finally, we performed the Snowballingprocess. Each search query consisted of variation of the words “Eye Track”, followed by stimuliand/or a task. The details of the search queries are as follows:
1. Eye-tracking: In order to ensure that the search results are related to eye-tracking oreye-trackers, the first keyword in every search query was “eye track” or “eye-track”.
2. Stimuli: To make sure we find papers related to programming, we included terms such as,“code” and “program”, as well as “UML” and “pseudocode”, followed by a programmingtask.
3. Task: Since our main focus is to find papers related to programming, we included pro-gramming related tasks into the search queries such as, “comprehension”, “debugging”,“scan” and “read”.
Barbara Kitchenham (2007) suggested a list of electronic sources to consider for findingstudies relevant to software engineers, including: IEEEXplore, ACM Digital library, SCOPUS,Citeseer, ScienceDirect and Springer. However, in an experience report, Dyba et al. (2007)reported on multiple returned similarities or no unique results returned from some digitallibraries, stating that:
“ after performing the searches we found that we could have saved ourselves somework as none of the publisher-specific databases except the IEEEXplore and ACMDigital Library returned any unique “hits”. That is, all articles returned by KluwerOnline, ScienceDirect, SpringerLink, and Wiley Inter Science Journal Finder werealso returned by either ISI Web of Science or Compendex” Dyba et al. (2007), pp229.
This point was later echoed by Kitchenham and Brereton (2013), who stated:
“ This is similar to the point made by Dyba et al. (2007). . . they could have savedtime and effort for general searches by using ACM, IEEE, plus two indexing sys-tems rather than searching multiple publishers’ digital libraries” Kitchenham andBrereton (2013), pp 2063.
In an updated guidelines for mapping studies, Petersen et al. (2015) cited the recommendationsof Dyba et al. (2007) and Kitchenham and Brereton (2013) in searching digital libraries, andstated that using IEEE, ACM and two indexing systems such as Inspec/Compendex and Scopusis sufficient.
We conducted our electronic database search in two phases. Phase one was an initial searchusing IEEEXplore, ACM Digital library and SCOPUS. This initial search phase will validate ourkeywords search selection, and help edit the search query if no adequate results were returned.The libraries or databases used in phase one were ACM, IEEEXplore and SCOPUS, in thatorder. The searching string used for the digital libraries are shown in Table 1, where eachsearch string was modified accordingly. For instant, IEEEXplore ignores most punctuation,and when searching for “Eye-track”, it also looks for “Eye track” and “Eye track”. IEEEXplorealso makes use of the wild card (*) at the end of a word to search for words with differentendings. The search strings for other digital libraries were modified as well.
5

Table 1: Search strings used and the number of papers returnedDatabase Search string Number of papersACM (((comprehension OR understand OR debug
OR debugging OR scan OR read) AND codeOR program OR programming ) AND eye-tracker OR eye-tracking)
74
ACM ((uml OR diagram OR pseudocode ORflowchart) AND eye-tracking)
138
IEEEXplore (((comprehension OR understand OR de-bug* OR scan OR read) AND code ORprogram OR programming OR ) AND eye-track*)
83
IEEEXplore ((uml OR diagram OR pseudocode ORflowchart) AND eye-track*)
12
SCOPUS ((((comprehension OR understand OR de-bug OR debugging OR scan OR read ) ANDcode OR program OR programming ) ANDeye AND tracker OR eye AND tracking))
163
SCOPUS (eye AND tracker OR eye AND tracking)AND (uml OR “class diagram” OR pseu-docode OR flowchart)
17
Phase two took place after the returned results from phase one were analysed. Phasetwo depended on phase one, and it included either editing the search queries, or expandingthe search to other recommended electronic databases. As our search queries and keywordsselection returned sufficient results, we expanded our search to other digital libraries. For thesecond phase, we explored ScienceDirect, Springer, Web of Science and Citeseer. However, nonew results were retrieved from these sources, as all returned papers were already collectedfrom the initial searching phase. For example some of the results returned by conducting thekeywords search on Web of Science were [Bed12, BDL+13, DcI13, ASGA15], which were alreadyretrieved through Scopus. Similarly, [SUGGR15, JF15] were retrieved through IEEEXploreand [FBM+14, RLMM15] were retrieved from ACM. As no new results were retrieved fromthe second phase search, we relied on the snowballing process to find additional papers. Thesnowballing process depended on exploring the references, suggestions from related work andrecommendations from Mendeley Henning and Reichelt (2008). The papers selection processcarried out, is shown in Figure 1, where the number on the left is the number of papers extractedfrom each of the following steps:
1. We started with a Keyword search of the ACM digital library searching for papers thatmatched our keywords selection, then selected papers related to our study by lookinginto the abstract and keywords of each paper. As we began with ACM, then movedto IEEEXplore and then Scopus, some similar results were returned by the search query,especially from Scopus, as it was the last engine used. Second phase of search on additionalelectronic databases did not return new papers.
2. We applied inclusion and exclusion evaluation criteria in order to determine if the collectedpapers are related to our study.
6

3. Using the Snowballing technique, we went through the list of references of each paper, andselected those references related to our study. For the purpose of finding these papers, weused Google Scholar to find titles retrieved from the references, or tried to find the journalsor conference website. We also relied on recommendations from electronic databases andthe Mendeley bibliography software.
4. On examining each paper in full, we considered the most comprehensive paper out ofthe repeated experiments. Some papers re-reported or did a re-analysis of a previouslypublished experiment. Based on those duplicates, we selected the one with most detailsreported about the experiment.
Figure 1: Steps of the selection process of finding papers related to the study
2.2 Inclusion, ExclusionEach paper selected from the keywords search underwent a full analysis to ensure that papersincorporating the following were included:
1. Use of eye-tracking in programming or programming related context.
2. Having been published in journal, conference or proceeding reporting the results of anexperiment using eye-tracker.
3. Papers not specifically on computer programming and program code, but a related topicsuch as software engineering, and using stimuli other than source code such as UMLdiagrams and flowcharts, as included in the context of programming related topics.
We excluded papers based on the following:
1. Papers not reporting the use of eye-trackers.
7

2. Papers using eye-trackers in a context not related to computer programming.
3. Papers not published in English.
4. Papers that did not go through a referring process, such as posters, work sessions, lecturenotes and dissertations.
5. Papers re-reporting the results, or doing a re-analysis of a previously published experimentwere studied, and the most comprehensive paper was selected.
6. Other materials such as books, (technical papers), government reports, letters and edito-rial, possession papers and papers with abstract but no full text available.
7. Papers not involving an empirical study or only those that propose a proof of concept.
2.3 Classification SchemeWe adopted the classification scheme used by Sjøberg et al. (2005), as it was cited and rec-ommended by Petersen et al. (2008). In their work, Sjøberg et al. (2005) classified controlledexperiments in software engineering based on the aspects of extent, topic, subjects, task and en-vironment, and replication. Given that we consider our work as a mapping study that reportsexperiments related to computer programming, we see this criteria to fit our objective. Wefound the aspects listed in Table 2 to be more fit to the nature of the work we are reporting.
Table 2: Classification aspects for data extraction and reporting of the study papersAspect Data ExtractedExtent Author(s) names, Year of publication,
Journal or ConferenceTopic From title, keywords, abstract, prob-
lem statement and objectiveSubjects Details of the sample for the study,
their affiliation, number, gender, expe-rience and grouping
Task and Environment The programming materials used, Eye-tracker and its configuration, eye-tracking metrics and variable of thestudy
Replication Form subjects, topics, authors and fullanalysis
The aspect of extent help classify publication frequency and venues such as journals andproceedings. Additional information from extent also assisted the authors in identifying andclassifying repeated experiments. As for topic, we identify and classify programming area ortask that was the focus of each study. We attended to the problem statement and objective ofeach study to accurately classify papers into topics such as debugging, collaborative program-ming and comprehension, however, keywords and complete abstracts were mostly sufficient
8
in classifying the programming topic or area each paper addressed. Details of the subjectsaffiliation, number, grouping and other information were classified mostly for the purpose ofidentifying the targeted audience of eye-tracking research in programming studies. As for theaspect of task and environment, we were able to identify and classify the materials used in eachexperiment, the type of eye-tracking technology utilized, and details of the metrics and variableseach study tried to evaluate and examine. The last aspect of replication insures that paperswhich re-reported or re-published the results of a previous experiment was not included. Thisclassification of unique and repeated experiment ensures more accurate statistical reporting ofinformation from the collected papers.
For the first two aspects: extent and topic, the data collected from title, publisher, year,abstract and keywords were in most cases sufficient enough to categorize papers. However, forthe other aspects of subjects, task and environment and replication, a full analysis of each paperwas required by one of the first two authors to accurately classify each paper. While one authorextracted and recorded information from a selected paper and classified it, the other authorconfirmed the classification.
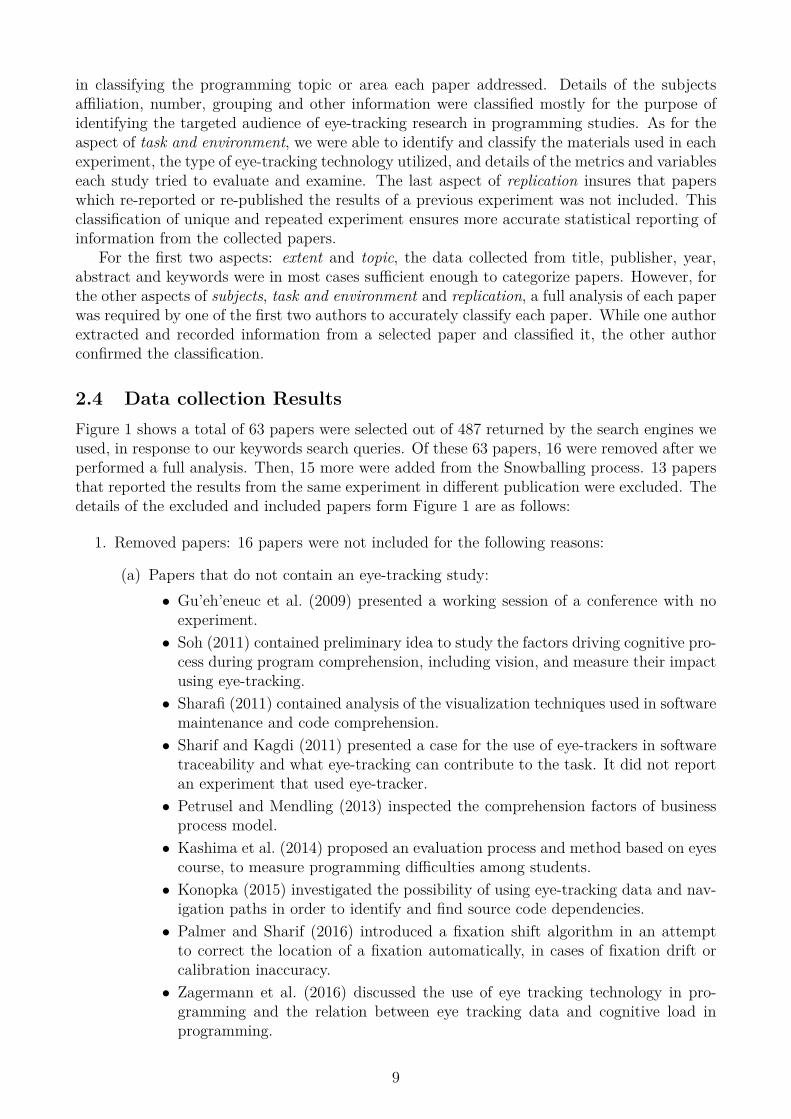
2.4 Data collection ResultsFigure 1 shows a total of 63 papers were selected out of 487 returned by the search engines weused, in response to our keywords search queries. Of these 63 papers, 16 were removed after weperformed a full analysis. Then, 15 more were added from the Snowballing process. 13 papersthat reported the results from the same experiment in different publication were excluded. Thedetails of the excluded and included papers form Figure 1 are as follows:
1. Removed papers: 16 papers were not included for the following reasons:
(a) Papers that do not contain an eye-tracking study:• Gu’eh’eneuc et al. (2009) presented a working session of a conference with no
experiment.• Soh (2011) contained preliminary idea to study the factors driving cognitive pro-
cess during program comprehension, including vision, and measure their impactusing eye-tracking.• Sharafi (2011) contained analysis of the visualization techniques used in software
maintenance and code comprehension.• Sharif and Kagdi (2011) presented a case for the use of eye-trackers in software
traceability and what eye-tracking can contribute to the task. It did not reportan experiment that used eye-tracker.• Petrusel and Mendling (2013) inspected the comprehension factors of business
process model.• Kashima et al. (2014) proposed an evaluation process and method based on eyes
course, to measure programming difficulties among students.• Konopka (2015) investigated the possibility of using eye-tracking data and nav-
igation paths in order to identify and find source code dependencies.• Palmer and Sharif (2016) introduced a fixation shift algorithm in an attempt
to correct the location of a fixation automatically, in cases of fixation drift orcalibration inaccuracy.• Zagermann et al. (2016) discussed the use of eye tracking technology in pro-
gramming and the relation between eye tracking data and cognitive load inprogramming.
9
(b) Papers on the use of systems or tools:• Torii et al. (1999) presented a Computer-Aided Empirical Software Engineer-
ing (CAESE) framework and introduces the Ginger2 environment, which wasdeveloped based on the CAESE framework, and has a variety of data collec-tion and analysis tools including audio and video recorder, monitoring tools andeye-tracking.• Uwano et al. (2007) designed and implemented the DRESREM system, a single-
document review evaluation system, capable of measuring and recording eyemovements of reviewers during a document review task.• Uwano et al. (2008) reported on an enhanced version of DRESREM system to
a multi-document review evaluation system named DRESREM2.• Ben-Ari et al. (2011) reported on the research and development of a program
animation system named Jeliot.• Kocejko et al. (2016) examines the possibility of using eGlasses as eye tracking
tool. It focused more on the tool, rather than programming.(c) Workshop with papers on eye-tracking data provided by the organizers:
• Bednarik et al. (2014) the results of this workshop were reported in [BSS+14].• Busjahn et al. (2015b) contained a workshop on analysing eye-tracking data
from novice programmers.
2. Snowballing papers: 15 papers were obtained through the Snowballing process, 11 of thesewere from the Psychology of Programming Interest Group (PPIG) [CSW02, RBCL03,NS04, BT04a, NS05, BMST05b, BMST06b, BT07a, Dub09, PBT09, Loh14], and fourother papers were from different sources [RCdBL02, AC06, BMST06a, DcI13]
3. Repeated experiments: 13 papers re-reported or did a re-analysis of 8 published exper-iments were not included in the study. These repeated experiments shown in Figure 2where the selected paper for a repeated experiment has a star symbol to highlight it:
• Romero et al. (2003): A quantitative analysis of the same experiment was reportedin [RLCdB02]. In this new paper, Romero et al. (2003) analysed the data for two ofthe six most vocal participants from the experiment reported in [RLCdB02], due totheir differing scores.• Bednarik and Tukiainen (2005): Re-reports the experiment from [BT04b] to further
explore the effect of RFV’s blurring condition on participants with different levelsof expertise.• Bednarik et al. (2005a), Bednarik et al. (2005b), Bednarik and Tukiainen (2006)
and Bednarik et al. (2006b): All reported results from the same experiment, but themost comprehensive report was in [BMST06a].• Bednarik and Tukiainen (2008): Extended the analysis from [BT07b] by dividing
the data into a series of shorter intervals.• Pietinen et al. (2008) and Pietinen et al. (2010): While Pietinen et al. (2008) focused
more on the setup of the eye tracking environment for paired programmers, Pietinenet al. (2010) was a follow up on the results achieved and reported previously in[PBT09].• Busjahn et al. (2014a): Used the same data from the feasibility study in [BSB11],
in order to study attention distribution on code elements.
10

• Sharma et al. (2013): Used the same experiment data from [JN12], but with differentanalysis and research question.• Rodeghero et al. (2014) and Rodeghero and McMillan (2015): A more comprehensive
analysis of the data from the same experiment was reported in [RLMM15].
Figure 2: Repeated experiments
3 MappingAfter an analysis of the selected papers, detailed information from each publication was ex-tracted for reporting, starting with the year of publication, the general purpose of each paper,and ending with the types of variables and eye-tracking metrics performed on each study. Thissection will answer our research questions and present all the information available. Figure 3shows the summary of all papers included in our study, with basic information about the partic-ipant and the type of eye-tracker used in each study, categorized into five groups (i.e. programcomprehension, debugging, non-code comprehension, collaborative programming and require-ments traceability). Over the years, research on program comprehension has received regularand more recently, increased interest among researchers. In contrast , research on collaborativeprogramming and requirement traceability did not receive the same attention, evident by thelow number of publications and experiments on these topics.
3.1 [RQ1: ] How many papers have used eye-tracking in researchon computer programming?
Figure 4 shows the number of papers published by year. The earliest paper that reportedan experiment on eye-tracking in programming comprehension was published in 1990. Fromthe figure, we can see that nearly 62% (39 papers) of the papers on the use of eye-trackingin programming have been published after 2012, with the highest number of publications per
11

Figure 3: A visual summary of all the papers used in this mapping study
12

year reaching 8 papers in 2015. This reflects the increasing popularity of using eye-tracking inprogramming studies in recent years.
This increased interest in using eye-trackers in programming research aligns with findingsreported by Lai et al. (2013), where they found an emerging use of eye-trackers in researchrelated to learning.
Figure 4: Years of publication of the included papers in this mapping study
Out of the 63 papers listed in Table 3, 16 (25%) were journal papers and 47 (75%) were fromconferences or proceedings. Table 4 shows the names of journal papers, while Table 5 showsconferences and workshop proceedings. On the topic of eye-tracking in computer programming,more conference papers were published than journals. The highest number of journal paperswas published by “Empirical Software Engineering” with 3 journal papers. As for conferencepapers, “ICPC” published 9, followed by “PPIG” with 8 and “ETRA” with 4 papers on eyetracking in relation to programming, while the remaining venues published 1 or 2 papers atmost. Data analysed for RQ1 also suggests the potential journal and conference or workshopvenues for readers to submit their work related to eye-tracking and computer programming.
3.2 [RQ2: ] What programming tasks and areas were explored us-ing eye-tracking?
We looked into topics and areas of programming that have been studied by researchers usingeye-trackers. The collected papers were categorized into five groups based on the type of taskperformed by participants. These groups are shown in Table 3. The categories shown in Table3 were gathered through an analysis process, and they are similar to the categorization done bySharafi et al. (2015). A pattern began to emerge, and we noticed that in relation to computerprogramming and using codes in eye-tracking experiments, researchers tended to perform oneof these five tasks to collect eye-tracking data from participants.
The highest number of papers focused on comprehension of code or program with 26 pa-pers(41%). In this type of task, participants are asked to read a source code, and summarizeit or answer questions related to the code for a variety of purposes such as finding readingpatterns, or comparing the way an expert programmer examines a code compared to a novice.
As for debugging task with 19 papers (30%), participants were asked to find defect(s)in a source code, or perform a debugging process from a given program. Majority of thepapers on debugging tasks investigated the visual strategies of programmers during debugging,and find the relation between different representations and debugging performance. As for
13

Table 3: Selected papers classified into groups based on tasksTasks Number of papers List of papersProgram/Codecomprehension
26 [CS90] [CSW02] [NS04] [NS05] [AC06] [BMST06a][NS06] [UNMM06] [Dub09] [SM10a] [BSB11][SSGA12] [BDL+13] [DcI13] [BSS+14] [FBM+14][Loh14] [ASB+15] [BBB+15] [JF15] [MD15][RLMM15] [BdP16] [MDPVRDVI16] [PIS17][PSGJ17]
Debugging 19 [RCdBL02] [RLCdB02] [BT04a] [BT04b] [BT07a][BT07b] [Bed12] [HN12] [SFM12] [CL13][HLL+13] [SJAP13] [TFSL14] [GWMP16][LWH+16] [NHMG16] [PLS+16] [BSL+17][MNH+17]
Comprehension(non-code)
10 [Gu’06] [YKM07] [JGSH09] [PG10] [SM10b][SSVdP+12] [CTKT13] [SMS+13] [DSLS+14][SUGGR15]
Collaborative 5 [SB04] [PBT09] [JN12] [MGRB15] [DB17]Traceability 3 [ASGA12] [WSSK14] [ASGA15]
Table 4: List of journals and the number of papers publishedJournal Number of papers List of papersBehavior Research Methods 1 [BT07b]Communications in Computer and Information Science (CCIS) 1 [CL13]Dyna Journal 1 [MGRB15]Empirical Software Engineering 3 [PG10][BDL+13][ASGA15]Journal of Systems and Software 1 [CTKT13]IEEE Revista Iberoamericana de Tecnologias del Aprendizaje 1 [MDPVRDVI16]IEEE Computer Journal 1 [CS90]IEEE Transactions on Education 1 [LWH+16]IEEE Transactions on Software Engineering 1 [RLMM15]Interactive Learning Environments 1 [ASB+15]International Journal of Human-Computer Interaction 1 [DcI13]International Journal of Human-Computer Studies 1 [Bed12]Science of Computer Programming 1 [DSLS+14]Technology, Instruction, Cognition and Learning 1 [BMST06a]
comprehension task with 10 papers, it refers to papers examining resources other than codes,such as UML diagram or flowchart, or focus on a task related to software engineering and notspecifically a source code. Most of the papers from this task used UML diagrams. In 5 papers,collaborative programming research focused on the visual attention of pair of programmers ormore, to evaluate an emerging trend of collaborative programming. We also found 3 papersthat used eye-tracking to evaluate links traceability in software or programs.
Figure 3 shows that the early studies to use eye-trackers in programming research mostlyfocused on code comprehension and debugging, while few work studied non-code representa-tions and collaborative programming in the early years. The earliest work on collaborativeprogramming done by [SB04] did not study the visual attention of pair programmers simul-taneously, since the eye-tracking technology was not suitable for that type for research, butused the recorded eye gaze of one programmer as a cue of another programmer attempting tosolve the same task. Additional set up to the eye-tracking environment was required in orderto simultaneously recode the viewing habits and collaboration of pair programmers, which wasdone by [PBT09] who presented the details of the hardware set up for the eye-tracking environ-
14

Table 5: List of Conference and the number of papers publishedConference/ Workshop Number of papers List of papersCHI Conference on Human Factors in Computing Systems 1 [DB17]Computer Software and Applications Conference (COMPSAC) 1 [PLS+16]Computer Vision, Pattern Recognition, Image Processing andGraphics (NCVPRIPG)
1 [MD15]
Conference of the Center for Advanced Studies on CollaborativeResearch
1 [Gu’06]
Conference of the South African Institute of Computer Scientistsand Information Technologists
1 [BdP16]
Conference on Computer Supported Cooperative Work 1 [JN12]Conference on Interaction Design and Children 1 [PSGJ17]Diagrammatic Representation and Inference 1 [RCdBL02]Global Engineering Education Conference 1 [NHMG16]Hawaii International Conference on System Sciences 1 [AC06]International Conference on Augmented Cognition 1 [PIS]International Conference on Computer Supported Education(CSEDU)
1 [HLL+13]
International Conference on Multimodal Interfaces (ICMI) 1 [SB04]International Conference on Program Comprehension (ICPC) 9 [YKM07] [SM10a]
[SSVdP+12] [SSGA12][SMS+13] [WSSK14][BBB+15] [JF15][MNH+17]
International Conference on Software Engineering (ICSE) 2 [FBM+14] [BSL+17]International Conference on Software Maintenance (ICSM) 2 [SM10b] [ASGA12]International Symposium on Empirical Software Engineering andMeasurement (ESEM)
2 [JGSH09] [GWMP16]
International Working Conference on Source Code Analysis andManipulation (SCAM)
1 [SUGGR15]
International Workshop on Computing Education Research(ICER)
2 [NS06] [BSS+14]
Koli Calling International Conference on Computing EducationResearch
1 [BSB11]
Nordic Conference on Human-computer Interaction 1 [BT04b]Symposia on Human Centric Computing Languages and Environ-ments
1 [RLCdB02]
Symposium on Eye Tracking Research and Applications (ETRA) 4 [UNMM06] [SFM12][HN12] [TFSL14]
Working Conference on Software Visualization (VISSOFT) 1 [SJAP13]Workshop of Psychology of Programming Interest Group (PPIG) 8 [NS04] [NS05] [Loh14]
[CSW02] [BT04a] [BT07a][PBT09] [Dub09]
ment in Pietinen et al. (2008). Although the use of eye-trackers in collaborative programmingand tractability studies showed an increase in recent years, but the number of publications inthese areas are still small compared to comprehension and debugging studies. Since the earlyyears of eye-tracking research in programming, code comprehension has been a regular interestof researchers, and saw an increase in the number of publication in recent years, as more thanhalf the papers on code comprehension (15 out of 26) have been published in the past 5 years.The same trend of increased interest can be observed for debugging research, as nearly 70% (13out of 19) of the published work was produced in last 5 years years.
15

3.3 [RQ3:] What programming materials were used as stimulus ineye-tracking experiments on computer programming?
To answer RQ3, we will look into the programming materials used by researchers. The selectionof participants and materials can correlate in some cases, where both can have a great influenceon the outcome of the study. Most of the papers in this study are related to code comprehen-sion and debugging, hence, the selection of the programming language and the participants’familiarity and skills in the selected language are the major factors to be considered in similarstudies. While a variety of programming languages were used by researchers in this area, Javaprogramming language stands out as the favourite choice, with students as the major partic-ipants in these studies. In answering this research question, we will list details of the type ofmaterials and the participants considered by researchers in an eye-tracking experiment relatedto programming.
Materials refer to all types of stimuli used by researchers during the eye-tracking experi-ment. In empirical studies involving the collection of data from eye gaze and eye fixation toexamine the visualization patterns or viewing habit, participants are subjected to a task re-lated to programming. Often, stimulus for the task are prepared using a code or other types ofprogramming data presentation, written in a programming language or presented in a formatsuch as graphs or algorithms. The selection of materials can be in direct relation to the topic(s)being examined or selected based on popularity or participants’ preferences.
While performing full analysis of the selected papers for our study, we kept track andcollected information about the materials used during the experiment, and the associated pro-gramming language used. Table 9 (Appendix A) presents the type of materials used for eachexperiment and the details provided by researchers. It is shown in Figure 5 that majority of thesource code used during the experiment were written in Java programming language. While 24papers (38 %) used Java alone as a main stimulus, 3 other papers used Java alongside otherstimuli such as [CL13] which used Java with C# and [BSB11] and [BBB+15] which used Javawith natural language text (NLT). The experiment done by [BBB+15] to compare Jave andNLT reading was later replicated in [PIS17], but replacing Java with C++. Another paperthat used multiple materials is [TFSL14], which compared the languages of C++ and Pythonto assess their impact on students’ comprehension. Figure 6 shows that out of the 24 papersthat used Java, 9 papers (nearly 37%) were on programming comprehension, while 12 out of19 debugging papers (63%) used Java. As for comprehension task, 7 out of the 10 papers onthis task used the UML class diagram.
For a programming language in eye-tracking experiments, no language stands out as muchas Java, which seems to be researchers’ favourite type of language used in stimuli for eye-tracking studies related to programming. Some of the experiments listed the following reasonsfor choosing Java codes:
• [RLCdB02] All participant enrolled in an introductory course in Java, and the debuggingenvironment used in the experiment was a Java software.
• [SB04] The first author was a Java programmer.
• [BT04b, BT04a] The software development environment used in the experiment was forJava debugging.
• [BMST06a] Used Jeliot 3 visualization tool that automatically visualizes execution ofJava programs.
• [AC06] Java is the primary language used to teach programming at the University ofHawaii.
16

Figure 5: Programming languages and programming representations used by papers in thisstudy
• [BSB11] Because of its wide use and representativeness.
• [ASGA12, ASGA15] Java programming language was well known to the participants, andit contains a variety of different Source Code Entities.
• [HN12] Subjects had a Java programming experience of minimum 6 months.
• [JN12] Used a custom Java programming editor based on Eclipse Murphy et al. (2006)to present the code.
• [SJAP13] The software visualization tool examined, SeeIT 3D Montano et al. (2009), isimplemented as an Eclipse plugin.
• [RLMM15] The participants were professional Java programmers.
• [MGRB15] Used COLLECE system Bravo et al. (2013) for collaborative programming,which compatible with and accommodates Java and C programs.
• [BBB + 15] Novice participants attended a Java beginner’s course, and the professionalswere Java programmers.
3.4 [RQ4:] Who were the subjects of eye-tracking experiments incomputer programming?
The selection of both the materials and the subjects may be correlated in some cases. Asdiscussed earlier in Section 3.3: Materials, some of the experiments used specific materialsthat required the subjects to be familiar with it. For instance, [ASGA12, ASGA15] used Javabecause it is well known to the participants, while [RLMM15] used Java as a material for theexperiment, therefore the participants were professional Java programmers. The selection ofthe participants in the experiment is in some cases related directly to the aim of the study, andcan have a significant impact on the outcome and the findings.
17

Figure 6: Materials used by each paper grouped by tasks
Since most of the experiments reported in relation to programming were conducted in aninstitute for higher learning, we see a pattern of using one or a compilation of three typesof participants used as a sample in each study. As shown in Figure 7 and Table 10, eachstudy either used Students (S), Faculty Members (FM), or professional programmers (P), ora compilation of the three to fit the purpose of the study. From Figure 7, it can be seen thatover 52% (33 papers) of the studies used students alone, while more than 22% (14 papers) useda compilation of students and faculty members (S & FM), which means that almost 75% ofthe studies used participants that were learning, teaching or have direct relation to computerprogramming courses. Figure 7 also provides detailed look into the status of the participantsin each task. From this figure, it can be seen that students were the subject of study in everytask examined by researchers. We refer to the experiments with no available details about itsparticipants with (N/A).
Figure 7 shows that 7 experiments were conducted with professional programmers. Forexample, [SB04] examined whether the eye gaze of professional programmers in debugging aprogram can provide hints for another programmer in finding bugs. While [DcI13] investigatedreasons why the software engineering industry did not widely adopt visualization tools, with thehelp of professional software engineers, and [FBM+14] tried to classify the difficulty softwaredevelopers experience while they work on their programming tasks, while others studied thebehaviour of professional programmers during various programming tasks [CTKT13, BSS+14,RLMM15, DB17]. As for studies that used the compilation of students and professional pro-grammers (S & P), three out of the six studies examined the differences between novice andexperts [SSVdP+12,SUGGR15,BBB+15], while others did not state a direct reason [RCdBL02,DSLS+14, Loh14].
Sample size for each experiment can be seen in Figure 8. The largest sample size was[JN12] with 82 participants divided into pairs of programmers, followed by [PSL+17] eith 56,[RLCdB02] with 49, [PSGJ17] with 44, and [TFSL14, BdP16 and LWH+16] with 38 participantin each. The average number for participant in all the studies was 19.6 with STDEV 13.5,and Table 6 shows the average sample size for each task, calculated by dividing the sum ofparticipants by the number of papers. It also shows the minimum and maximum number of
18

Figure 7: Summary of the participants’ affiliation grouped by task (S: Students, S&FM: Stu-dents and faculty members, P: Professionals, S&P: Students and professionals, N/A: Not avail-able)
participants used, and the standard deviation of the sample size. It is important to addressthat the average value might be misleading due to outliers in the sample size. For instant, theaverage number of participants in collaborative programming studies is 21, however Figure 8shows that one study used 82 participants [JN12], while the others used 10 or less. A possiblebetter alternative to average sample size might be frequency of the samples used. Nine studiesused a sample of less than 10 participants [CL13, WSSK14, RCdBL02, UNMM06, CTKT13,PBT09, BSS+14], while the most common sample size was 15 participants, which was used in 7studies [AC06, SMI10b, SM10a, BSB11, SFM12, BDL+13, FBM+14, MD15 and DB17]. Othernoticeable frequencies in the sample size was 20 participants which mostly occurred in recentstudies [SJAP13, BBB+15, JF15, SUGGR15, PLS+16, MNH+17], 24 in 4 studies [JGSH09,PG10, SSGA12, NHMG16] and 38 participants in 3 studies [TFSL14, LWH+16, BdP16].
Table 6: Details of the sample size for each taskTasks Number
ofpapers
Sum ofparticipants
Minimum Maximum Averagesamplesize
StandardDevia-tion
Program/Code comprehension 26 470 2 44 18.08 9.90Debugging 19 432 5 56 22.74 13.39Comprehension (non-code) 10 183 4 28 18.30 7.35Collaborative 5 106 2 82 21.20 34.22Traceability 3 48 8 26 16 9.17
Table 10 (Appendix A) lists down the details of the sample of participants in each paper.Table 10 (Appendix A) shows the status of the participants, the sample size considered in theexperiment, the way the sample was split or divided in the experiment, the details on the splitsample size and the gender of the participant if mentioned.
In some studies, the sample considered for the experiment was not necessarily the same
19

selection of sample considered for the eye-tracking data analysis for various reasons. Somesamples where discarded due to technical issues with the eye-tracking device [BMST06a], datacorruption [BT07a, SFM12, DSLS+14], participants withdrawing from the experiment [BT07b,FBM+14] or they were unfit for the experiment [ASGA12, ASB+15].
In the last column of Table 10, the gender of the participants is listed if it was mentioned bythe researcher. Although in most cases the gender of the participants did not affect the analysisof the results, some of the work tried to provide as much information on the selected subjects aspossible. Some work list down the experience of the participants, classes they have taken, andthe department from which they were recruited. All the reported information regarding theparticipants can help provide some insights into the setup of the experiments, but there werefew studies in which details of the participants were important to the study and the analysisof the results, especially in the cases where the sample was divided into two or more groups.Although columns 4 (Split) and 5 (Split details) in Table 10 list the way in which the samplewas divided, the details of the sample division and split can be seen in detail in Figure 9.
Sample Split We use the term sample split to refer to the way a sample of participants or thecollected data from participants were divided for purposes related to the experimental setup.Since the selected studies focused on computer programming, the participants had variousknowledge and skills in one or more programming languages and programming representations.
While most of the studies analysed the collected data from the sample of participants as awhole, 30 studies (48%) divided the selected sample into one or more groups for various reasons.Figure 9 shows the details of the papers that had a single sample split from the studies, whileFigure 10 shows the studies that divide the participants based on two or more splits. Out ofthe 30 reported experiments, 24 did a single split of the sample, while the remaining 6 studiesdid two or more splits.
From the 24 single split experiments, 13 divided the sample based on experience, while theremaining 11 divided the sample based on other reasons such as visualization, representation,identifier style, gender, age, programming language or performance. Details of the single samplesplit of the participants in Figures 9 are as follows:
1. Samples divided based on experience
• [CS90] In order to examine the differences in reading algorithms, 10 students fromthe second semester of computer science course were considered as low experiencegroup, while eight graduates and one PhD faculty member were the high-experiencegroup.• [CSW02] To determine how programmers from different experience levels under-
stand a typical simple program, nine students with one semester of programmingexperience were considered novices, while the experienced group consisted of com-puter science faculty members and students from advanced undergraduate and grad-uate classes.• [RLCdB02] To find out if excellent debugging skills were associated with specific
representation patterns, the sample was divided into two groups of less and moreexperienced students.• [BMST06a] To improve program visualization systems, it is important to study
how the behaviour of the novices differ from intermediates in relation to programanimation. Subjects who had below 2 years of experience in programming wereconsidered to be novices, while those with 2 years or more were intermediates.
20

Figure 8: Details of the participants in all papers grouped by task
• [BT07a] To investigate the visual strategies of programmers during debugging, 6
21

Figure 9: Sample analysis is done based on a single split
participants were in the novice group, while 8 were in the experienced group, basedon the reported period of experience by the participants.• [BT07b] To investigate the differences in the allocation of visual attention between
experts and novices programmers, subjects with an average of 8.13 months of Javaexperience were the novice group (10 programmers), while remaining 8 subjects whohad an average of 16.25 months of Java experience formed the expert group.• [SM10b] To examine the impact of design patterns in different layouts on the com-
prehension of UML class diagrams. Seven second year students formed the novicegroup, while six graduates along with two faculty members were grouped as expertson UML diagrams and design patterns.• [SFM12] To study the impact of scan time on debugging performance, the novice
group had 7 students in their second year of undergraduate study, while the expertgroup was formed from 6 graduates and two faculty members.• [Bed12] In order to study the visual attention strategies of programmers during
debugging, students and faculty members were divided into two distinct levels ofexperience consisting of 8 experts and 6 novices.
22
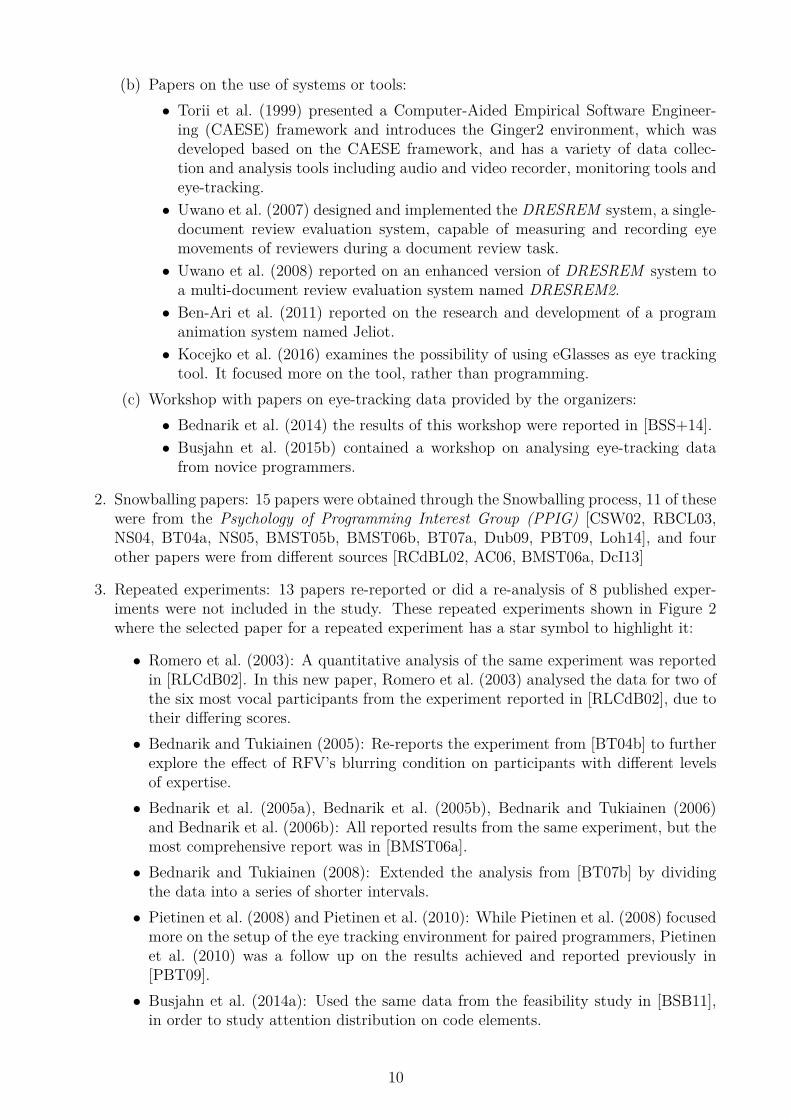
• [SUGGR15] In order to find out what elements of the visualizations are most impor-tant for comprehension, participant were divided based on their performance, into 4novices, 10 intermediates and 6 experts.• [BBB +15] In order to identify the reading patterns of source-codes and its linearity
(top to bottom, left to right), eye-tracking data was collected from 14 novice studentsfrom a beginner’s course in Java, and 6 professional software engineers.• [NHMG16] to examine the difference in debugging behaviour based on experience,
the sample of 24 students was divided into 15 novice and 9 considered to be advanced.• [PIS17] In order to examine the differences in reading patterns between NLT and
C++, the sample consisted of 33 novice and non-novice students.
2. Samples divided based on gender
• [SSGA12] In order to study the relationship between source-code reading and iden-tifier style in regards to gender, 9 female and 15 male students were subject of theexperiments.• [HLL + 13] To address and investigate the gender differences in program debugging,
12 female and 13 male students from the Department of Computer Science wererecruited.
3. Samples divided based on code representation
• [BdP16] In order to investigate the affect syntax highlighting may have of the readingbehaviour of programmers, a sample of 34 students was divided in half into black-and-white group, and colour group, based on the syntax highlights. Then the datawas compared with 4 experts.• [MDPV RDV I16] To assess the usefulness of the GreedEx representations two ex-
periments were performed, where the first one had 13 student work with a staticrepresentation, while the second experiment had 6 students work with a dynamicrepresentation.
4. Samples divided based on performance
• [Y KM07] In order to evaluate the comprehension of participants with varying knowl-edge of UML diagrams and their designs, the sample was divided based on per-formance into four groups: •UADA: UML and Design Agnostic had 3 subjects,•UEDI: UML Expert but Design Inexperienced had one subject, •UEDK: UMLExpert and Design Knowledgeable had 3 subjects and •UEDE: UML and DesignExpert had 5 subjects.• [ASB + 15] To track and study the algorithmic problem solving techniques among
students, 13 students who solved the algorithmic problem were selected into theeffective group, and 13 who solved the problem incorrectly were selected to thenon-effective group.• [LWH+16] To investigate the behaviour of students in debugging, each participant’s
performance was evaluated based on tasks related to debugging two programs pro-vided in either an iterative structure (10 high-performance, 28 low-performance) ora recursive structure (12 high-performance, 26 low-performance)
5. Samples divided based on visualization
23

• [NS06] In order to study and compare the differences between animated and staticvisualization during program comprehension, the participants were grouped intoeither an animation or a static group, based on the score of a pre-test.• [Dcl13] In order to evaluate different software visualization tools, 5 professional pro-
grammers were assigned to the visual studio group, while 8 were in the NDEPENDgroup.
6. Sample divided based on programming language
• [TFSL14] To examine if program comprehension of students is influenced by theof programming language selected, 25 subjects were assigned to the C++ group(17 novices, 8 non-novices) or Python group (10 novices, 3 non-novices) based on abackground questionnaire.
7. Sample divided based on age
• [PSGJ17] To understand the differences in coding activities between kids (age [8-12]) and teens (age [13-17]), the eye movements of 44 students were recorded whileworking on Scratch tool Resnick et al. (2009) .
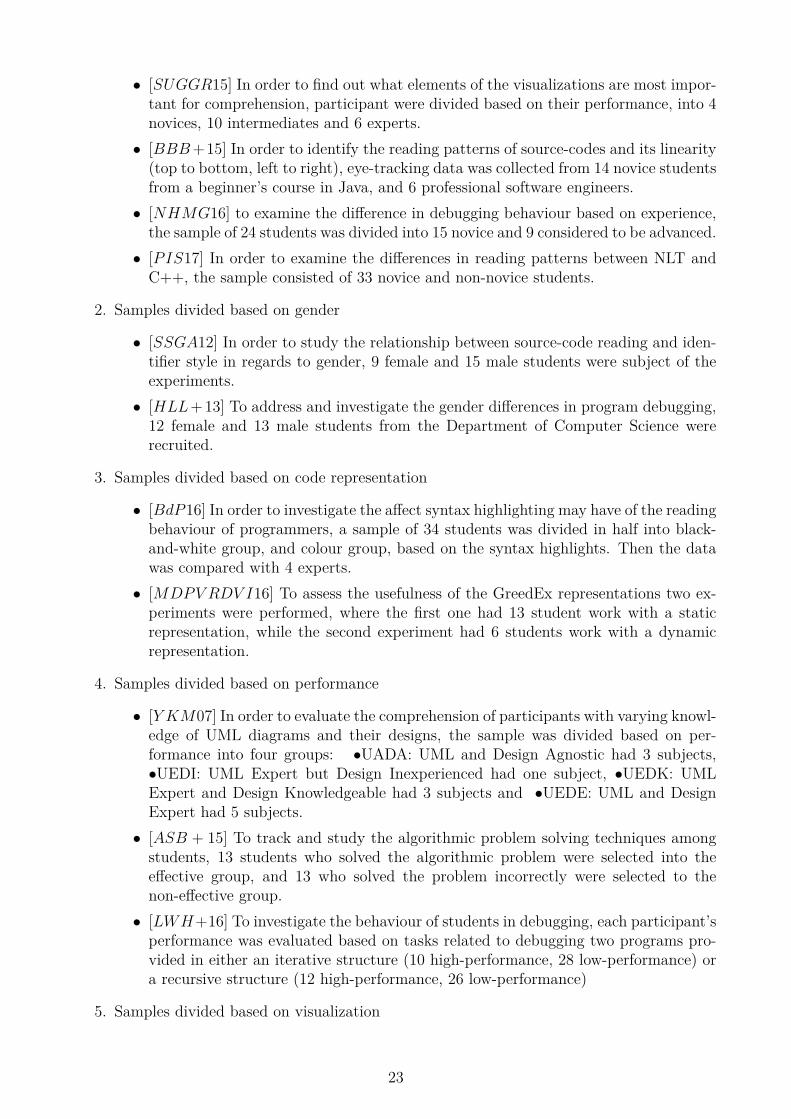
Six experiments reported in this survey divided the selected sample of participants into twoor more groups. Details of the multiple sample split of the participants in Figures 10 are asfollows:
1. [SM10a] In order to examine how students from different background perform with dif-ferent identifier styles, the collected data was analysed based on:
• Experience: 7 novices and 8 experts• Identifier style: 6 participants stated they prefer camel-case style, 9 prefer under-
score, and 2 had not preference
2. [BDL + 13] Similar to [SM10a], participants were divided into groups based on:
• Experience: 7 beginners and 8 experts• Identifier style: 40% of the participants stated they prefer camel-case style, 47%
prefer underscore, and 13% had not preference
3. [SSV dP +12] In order to evaluate the impact expertise and experience has on the time andaccuracy of UML class diagrams, students and professional programmers were evaluatedbased on:
• Status: 9 practitioners and 12 students• Experience: 9 novices and 12 experts
4. [JN12] 82 students were recruited for a collaborative programming experiment, and di-vided into pair programmers based on:
• Experience: 40 pair of 21 novices, 9 experts, and 9 mixed expertise• Experimental conditions: 40 pair where 14 were individual pair, 16 dual pair and 10
shared pair.
5. [SJAP13] In order to assess the effect of SeeIT 3D, students were divided based onexperience and visualization conditions as follow:
24
Figure 10: Samples were split into multiple groups
• Experience: 10 novice and 10 experts• Visualization: 9 with SeeIT 3D, and 9 with No-SeeIT 3D tools
6. [HN12] 19 students were evaluated and given a score based on their experience, perfor-mance, and familiarity with the IDE used:
• Experience: 10 high and 9 low• jGRASP familiarity: 14 high and 5 low• Performance: 16 good and 3 poor
25

3.5 [RQ5:] What eye-tracking technology and devices were used incomputer programming experiments?
Before we discuss about the devices used by researchers to track participants’ attention whileworking on a task related to programming, we will provide a brief overview of the eye-trackingtechnology. For more details on the eye-tracking devices used and their measures and abilities,we refer the reader to recent review that examined the use of eye-tracking in learning Lai et al.(2013), and Sharafi et al. (2015) for details on the metrics used by researchers for data collectedfrom experiments related to software engineering. The use of an eye-tracker in an experimentinvolves the selection of the devices, as well as the types of data eye-trackers can collect tocalculate the variables that help the researcher evaluate their hypothesis for the experiment.In this part, we will discuss the different types of eye-trackers used in experiments related toprogramming, then in the next part we will examine the common eye-tracking metrics thesedevices are used to collect data before looking into the variables evaluated based on theseeye-tracking metrics.
Eye-tracking devices From Figure 11 and Table 11 (Appendix A), the details of the devicesused are listed for each experiment. In relation to programming, the literature we reviewed usedone of two methods to track the attention of programmers: Restricted Focus Viewer (RFV) oreye-tracker.
The RFV was developed as an alternative to eye-trackers Blackwell et al. (2000). RFVallows subjects to see a limited focused region of a material at a time, and the subject usesmouse to move the focused area, while the RFV tracks and records these moves of the mouseand the timestamps for analysis Blackwell et al. (2000); Bednarik and Tukiainen (2004a,b).Figure 12 shows that the RFV alone was used in two studies, while it was used in 4 studiesalong with a Tobii eye-tracker. In [RCdBL02, RLCdB02], RFV was used to track the visualattention of programmers during a debugging task, focusing mainly on switching behaviourbetween different representation of the code. Later, these experiments were replicated by[BT04a, BT04b], with the addition of a Tobii eye-tracker, in order to compare the performanceand accuracy of the two technologies in measuring visual attention, and verify the effect ofRFV on the behaviour of participants. The validity of the RFV was later questioned again,and examined in [BT07a, BT07b] but this time with an RFV 2.1 with a Tobii eye-tracker. Figure11 and Table 11 show that RFV was not widely adapted and used in experiments related tocomputer programming, and its validity was questioned and examined multiple times.
The reported studies indicated two types of trackers: intrusive tracker and non-intrusivetracker. Intrusive devices are head-mounted onto the subjects’ head with a head-band, andrequire the subject to be situated in front of the screen to keep a relatively steady position.Examples of these intrusive devices are the EyeLink II tracker from SR Research (http://www.eyelinkinfo.com/eyelinkII.html), which was used by [Gu’06, JGSH09, PG10, SSVdP+12],the ISCAN RK-726PCI (http://www.iscaninc.com) pupil/ corneal reflection eye-tracker usedby [SB04], and the Head Mounted ASL 501 from Applied Science Laboratories (http://host.web-print-design.com/asl/), which was compared to two non-intrusive devices by [NS04].Few researchers stated a clear reason for not using this type of device, such as [PBT09] who intheir attempt to build a system for tracking the visual attention of pair of programmers stated:
“As our goal was to combine both programmer’s eye-tracking data with the singledisplay screen, we found that the field of view of the head mounted camera was toolarge, and coordination of its output with the screen was too coarse.”
Also [JF15] stated:
26

Figure 11: The version of eye-tracker used, grouped by manufacturer
Figure 12: The version of eye-tracker used grouped by manufacturer
27

“There is an obvious advantage to using a remote eye-tracker over a head mounteddevice, especially when considering intrusiveness and how natural is the experimentenvironment.”
As for non-intrusive devices, these devices were the most frequently used. It allows the visualattention to be measured without interfering with the subject’s thought process, and without re-stricting their head movement, except during the calibration process. Example of non-intrusiveeye-trackers are: the FaceLAB from Seeing Machine (https://www.seeingmachines.com) usedby [ASGA12, SSGA12, DSLS+14, ASGA15, SMS+13], and Tobii 1750.
We found a variety of devices used in the experiments, with one manufacturer standing outthe most popular device for tracking visual attention of participant in relation to programming,which is Tobii. The first eye-tracker used in a study in relation to computer programming wasthe ASL eye-tracker used by [CS90] to examine the way programmers read algorithms. It wasused again by the same first author in [CSW02], and by [AC06]. Two different distributions ofASL (ASL 501, ASL 504) were evaluated and compared with Tobii by [NS04], especially focus-ing on the head mounted version (ASL 501). ASL was also part of a system developed and builtby [PBT09] for tracking the eye movement of pair programmers during collaborative program-ming. The least used devices in the experiments are: 1) ISCAN: A lightweight head-mountedeye-tracker used by [SB04] to demonstrate that debugging performance can improve by viewinganother person’s eye gaze, 2) NAC Incorporated Non-Contact Eye Mark Recorder (EMR-NC)(http://www.nacinc.com): Used by [UNMM06] to characterize the performance of individualsin reviewing source code, 3) Mirametrix S2 eye-tracker (http://www.mirametrix.com): Usedby [TFSL14] to compare C++ and Python, 4) Eye Tribe (http://www.theeyetribe.com):Used by [JF15] to verify and quantify the effect of repetitions of code pattern comprehension,and 4) GazePoint GP3 (https://www.gazept.com): Used by [BSL+17] to examine if develop-ers pay attention to error messages from the IDE compiler. On the other hand, the most widelyused device by researchers in programming research is Tobii. Tobii was reported in over 55 %of the gathered papers (35 papers). In 7 of these, Tobii was used along with another devicesuch as ASL, RFV and SMI, while it was the main device for eye-tracking in 28 papers (44%).The versions of Tobii eye-trackers used in the 35 experiments are shown in Figure 13, wherethe papers are organized by the year of publication. Figure 13 shows that version 1750 was thetype of eye-tracker most widely used in a total of 16 studies (25% of all the papers reportedin this study) between the years 2004 and 2013. However, Tobii 1750 is now considered anoutdated model prior to the introduction of T60 and X60 which have been replaced by newerand mobile X2 version. Until recent years when it was replaced by newer systems, Tobii 1750was leading the way in tracking the eye movement of participants in a programming task.
3.6 [RQ6:] What eye-tracking metrics and variables are commonlyreported in programming studies?
The main reason for using an eye-tracking device in an experiment is to be able to gatherinformation on the visual attention of subjects while they examine a stimuli or material ona computer screen. The visual attention gives some indication of the underlying cognitiveprocesses occurring at the time a participant performs a given task. In this part, we will mapthe common eye-tracking metrics and variables used by researchers in programming studies.
3.6.1 Eye-tracking metrics
According to Lai et al. (2013), eye movements are generally made from a series of fixations andsaccades. While fixations are a state of relatively stable eye movement ranging from 100 to 500
28

Figure 13: Version of Tobii devices used in each experiment, organized by year of publication
ms, saccades occur between two consecutive fixations in the form of rapid eye movement whichin a typical reading task usually last from 30 to about 50 ms Rayner (1998, 2009).
A range of eye-tracking metrics have been utilized and used in the studies, and we will focuson reporting the most common eye-tracking metrics in Table 7. Most of the experiments oncomputer programming used eye-trackers to collect the number and duration of the subjects’fixations. We categorized the eye-tracking metrics used in the studies into measures calculatedusing the number of fixations, measures calculated using fixation duration; attention measuresand scan behaviour measures. These information, along with other metrics that eye-trackingdevices are able to collect, can be used in many formulas that will help researchers evaluatethe participants’ level of cognitive processing for the research questions studied. Details of theeye-tracking metrics listed in Table 7 are as follows:
1. Measures related to the number of fixations
• Fixation Count: Defined as the total number of eye fixations on a specific area, andcan be interpreted as an indication to the importance of an area Bednarik et al.(2006a); Andrzejewska et al. (2016); Jbara and Feitelson (2015). A higher fixationcount on a specific area indicates more interest in that part, and suggests more effortspent in solving the task Sharif and Maletic (2010b).• Fixation Rate: Calculated by dividing the number of fixations on an Area of Interest
(AoI) by the total number of fixations, and it can be an indicator of the importanceof a specific part Goldberg and Kotval (1999); Sharif and Maletic (2010a,b); Sharifet al. (2012). The AoI on which fixation rate was calculated by researchers is relatedto the task or the objective of the research. For example: the AoI for [TFSL14] wasbuggy lines of code.• Spatial Density: Proposed by Goldberg and Kotval (1999), it is calculated by di-
viding the screen into a grid, then finding the proportion of cells with at least onefixation to the total number of cells in the grid Busjahn et al. (2014b); De Smet et al.(2014). More detailed information about this measure was presented by [DSLS+14]as they presented the Taupe visualization tool.• Convex hull area: This was introduced and used by Goldberg and Kotval (1999)
to evaluate user interfaces quality, and it represents the smallest convex Goldberg
29

Table 7: List of most common eye-tracking metrics used in the papersBased on Measurements Number of Papers Papers
Number of Fixations
Fixation Count 18 [BT04b] [BMST06a][BT07b] [UNMM06][SM10a] [SM10b] [HN12][SFM12] [SSGA12][BDL+13] [SJAP13][TFSL14] [ASB+15] [JF15][BdP16] [GWMP16] [MD-PVRDVI16] [MNH+17]
Fixation Rate 5 [SM10a] [SM10b] [SSGA12][BDL+13] [TFSL14]
Spatial Density 4 [Gu’06] [BT07a][SSVdP+12] [BSS+14]
Convex hull area 4 [SSGA12] [SSVdP+12][SMS+13] [DSLS+14]
Duration of fixations
Fixation Time 18 [CS90] [CSW02] [RLCdB02][BT04b] [BMST06a][BT07b] [PG10] [BSB11][BDL+13] [JF15] [ASGA15][SUGGR15] [BdP16][GWMP16] [NHMG16][PLS+16] [MNH+17][PSGJ17]
Average Fixation Duration 11 [CS90] [CSW02][SM10a] [SM10b] [PG10][SSVdP+12] [BDL+13][SMS+13] [ASGA15][GWMP16] [MD-PVRDVI16]
Attention switching Attention switching 12 [RLCdB02] [RCdBL02][BT04b] [BMST06a][BT07a] [BT07b] [BSB11][Bed12] [HN12] [PLS+16][MNH+17] [PSGJ17]
Scan-paths Scan-path 11 [SM10b] [PG10] [PBT09][DcI13] [SJAP13] [BSS+14][MGRB15] [ASB+15][SUGGR15] [BdP16] [MD-PVRDVI16]
and Kotval (1999); Soh et al. (2012); Sharafi et al. (2013) or polygon De Smet et al.(2014) set of fixations which includes all fixations. Closer fixations are indicated bya smaller value, which in turn indicates that the participants spend less effort to findusable elements [SSVdP+12] or areas [SMS+13].
2. Measures related to the fixations duration
• Fixation Time: Total fixation time is calculated as the sum of all fixation durations,and it measures the time spent on an AoI or the stimuli by the participants Bednarikand Tukiainen (2006); Ali et al. (2015). It is calculated and presented either as thetotal time in seconds of all fixations or as a percentage of the total time Crosby andStelovsky (1990). This measure does not only help calculate the average fixationduration, but it can also determine the visual effort Sharif and Maletic (2010a,b);
30

Sharif et al. (2012). More visual effort from the participants to solve the task isindicated by a higher fixation count, duration and fixation rate Sharif and Maletic(2010b).• Average Fixation Duration (AFD): The AFD refers to the portion of fixation time
to total time spent on a particular AoI or the stimuli Goldberg and Kotval (1999),and it can be calculated for an AoI or the stimuli using the fixation time and numberof fixations. Longer AFD means that more time is needed by the participants toanalyse and build a mental model of the task Goldberg and Kotval (1999); Sharafiet al. (2013).
3. Attention switching: Refers to the number of switches between two or more AoIsBednarik and Tukiainen (2005). It was mainly used to find the switching behaviourof participants with different representations [BMST06a, BT07a, Bed12], or the effect ofRFV on programmers’ behaviour [BT04b, BT07b]. Attention switching can be interpretedas a measure of an existing relation between two or more AoIs, that is, the more frequentthe switches between AoIs, the more related they are.
4. Scan-paths: A path formed by saccades between fixations, in the form of a directed se-quence Sharif and Maletic (2010b); Sharif et al. (2013); Busjahn et al. (2014b); Sami Uddinet al. (2015). It provides the order and directionality in which elements of the materialwere examined by the subject. For example, what parts were immediately visited andwhich area directed the subject to where they are at a specific point. This type of infor-mation can be used to try and find reading patterns Porras and Gu’eh’eneuc (2010), andhelp organizing visual space and designing visual layouts Sharif and Kagdi (2011).
These are the most commonly used eye-tracking metrics to calculate the data collected from theeye-tracker. However, there are some variations and more complex eye-tracking metrics thatcan be used, depending on the type of information the researcher is aiming to find. Along withthese metrics, eye-trackers can also provide some techniques to visualize and view details of theparticipants’ behaviour during the task performance. For example, the heat-map technique isused to visualize the intensity of fixations using a colour spectrum. It overlays on top of thestimulus to show the viewing patterns of the subjects Sharif and Maletic (2010b); Busjahn et al.(2011); Jbara and Feitelson (2015). Jbara and Feitelson (2015) provides detailed informationon the use of heat maps, along with examples and the participants responses to their heatmaps. Also some examples of heat maps can be found in [BSB11, DSLS+14, ASB+15, JF15,SUGGR15, MNH+17]. Other eye-tracking data can be presented in the form of a gaze plot,which can help in visualizing the scan path by displaying the eye gaze data for each stimulusin a static viewpoint Sharif and Maletic (2010b). Some of the experiments used this technique,and examples can be seen in [YKM07, SM10a, SM10b, BDL+13, MGRB15, SUGGR15].
3.6.2 Variables
Based on the collected data from an eye-tracking experiment, along with the metrics thesedevices calculate, researchers can evaluate the variables correspond to their hypothesis. Thus,make sense of the data and derive a conclusion for their work. Table 12 (Appendix A) lists allthe available variables from the literature.
Dependent Variables Dependent variable are selected based on the hypotheses for theexperiment Porras and Gu’eh’eneuc (2010); Turner et al. (2014), and are directly related to theanalysis and interpretation of the collected data. Table 8 shows the most common dependentvariables from the study papers, which are:
31

1. Time: The most commonly measured and used variable in studies of eye-tracking incomputer programming. While the term Time in Table 8 is general and refers to all thestudies that used a variation of time measurements, Table 12 (Appendix A) shows moredetails on what time was measured and used to evaluate the findings. The most commontypes of time measured in the study papers were:
• Completion Time, Required Time, Speed or Efficiency: The time needed by a par-ticipant to perform and complete a task [SSGA12, SSVdP+12], or the time spenton performing each task [JF15, SM10b, SMS+13, TFSL14, GWMP16, NHMG16,DB17].• Fixation Time: The time participants spent focusing on the AoI [CS90, BMST06a],
or a type of Source code entities (SCEs) [ASGA12, ASGA15].• Scan Time: Time needed for an initial scan pattern to occur [UNMM06, SFM12].• Detection Time: The time taken to detect or find defect and bugs, and it is related
to studies on scan time [UNMM06, SFM12, NHMG16, MNH+17].• Response Time: Time taken by the subjects to start answering the task [YKM07,
SUGGR15].• Inspection Time: Time spent looking on a certain AoIs [MGRB15, MDPVRDVI16]
2. Performance: It can also be referred to as accuracy, which is based on the subjects’performance, and is measured by the correct answers given by subjects during a task ofdebugging or comprehension. Performance and accuracy was measured in different wayssuch as the Percentage of Correct Answer (PCA) provided by a participant [SSVdP+12,SSGA12, SMS+13, ASGA15], all scores summed from each task [SM10b], or a scalefrom 1 to 5 (wrong to correct) to measure accuracy [TFSL14]. While in most of thestudies accuracy was related to the participants’ performance, there was one study whereaccuracy was related to the eye-tracking devices and their performance during a computerprogramming experiment [NS04].
3. Viewing Pattern: It includes patterns such gaze path, viewing path, number of switchesbetween different areas and switching frequency which can measure the dynamics atten-tion allocation Bednarik et al. (2006a). It is a common variable for studies that focusedon visual attention of multiple representations and visualization tools, and it is measuredby the tracking device.Viewing pattern try to identify the most associated areas of a code, its representationsor AoIs [RLCdB02, BMST06a]. Viewing patterns and switching behaviour were notablyused in the studies that focused on validating the RFV, and determining its effect on theparticipant’s behaviour and attention [BT07a, BT07b].
4. Visual Effort: Indirectly measured with fixation related variables such as count and du-ration Sharif and Maletic (2010a,b); Sharif et al. (2012); Jbara and Feitelson (2015). It isthe amount of visual attention the subjects spend on an AoI Sharafi et al. (2013); Sharifet al. (2013); Turner et al. (2014), or the visual effort spent to find the answer Sharif andMaletic (2010b).
Independent Variable The independent variables mostly were related to the aim of thestudy and they are related to the hypotheses, and may have impact on or/and effect thedependent variables Porras and Gu’eh’eneuc (2010); Ali et al. (2015). While full details of the
32

independent variables can be seen in Table 12, the most common independent variables wefound in the study papers were related to:
• Programming experience in tasks that tried to study the differences between participantswith different expertise [CS90, CSW02, RLCdB02, BMST06a, BT07b, HN12, SSVdP+12,Bed12, MGRB15, BBB+15].
• Type of representation in experiments that studied the effect of representation on partic-ipants’ performance [RLCdB02, PG10, SMS+13, ASB+15].
• The different types of source code entities and code elements [ASGA12, ASGA15].
• Visualization tools and their effect on participants’ performance [NS05, NS06, SJAP13,DcI13].
• Identifier style [SM10a, SSGA12, BDL+13].
• Gender of the participants in studies that examined if gender has an effect on computerprogramming [SSGA12, HLL+13].
• Errors or defects, their type and presence mostly in debugging studies [RLCdB02, UNMM06,SFM12].
• Algorithm or code type and language in studies that used multiple codes or languages[AC06, HLL+13, TFSL14, LWH+16, JF15].
• The RFV restricting condition in studies that validated RFV [BT04b, BT07b].
Mitigating Variables Mitigating variables are related to both independent and dependentvariables, and they can have an impact on the way independent variables affect dependent vari-ables Sharafi et al. (2012, 2013); Ali et al. (2015). The details of the mitigating variables areshown in Table 12. In the survey papers we studied, we found mitigating variables to be mostlyrelated to the experience of the participants and their knowledge of a programming language,representation of source code or diagrams, or a tool. Examples include the participants’ expe-rience [AC06, SM10a, ASGA12, SFM12, BDL+13, SMS+13, SJAP13, TFSL14], level of study[ASGA12, SSGA12, SMS+13], UML knowledge [JGSH09, SMS+13], design patterns knowledge[JGSH09, PG10] and the participants’ style preference of identifiers [SM10a, SSGA12].
4 DiscussionAs shown in Section 3: Mapping, we performed a quantitative analysis on 63 papers thatused an eye-tracker in an experiment related to computer programming. In this section wewill discuss some of the quantitative findings reported in the mapping section, and highlightpotential issues or problems to be further explored by researchers.
Trend
RQ1 confirmed our claim on the rising use and adaptation of eye-tracking technology in pro-gramming research. Considering that the first paper to use an eye-tracker in this field waspublished in 1990, it took over a decade for similar research in this area to emerge again. Inthe early 2000s, although a considerable number of publications started using eye-trackers tostudy the way programmers examine and comprehend programming materials, another portion
33

Table 8: The most common dependent variables in the study papersDependent variable Task Number of Papers Papers
Time
Program Comprehension 17 [CS90] [CSW02] [NS04] [Dub09] [SM10a][BSB11] [SSGA12] [BDL+13] [DcI13][Loh14] [FBM+14] [BSS+14] [ASB+15][BBB+15] [JF15] [BdP16] [PSGJ17]
Debugging 13 [RLCdB02] [BT04a] [BT04b] [BT07a][BT07b] [SFM12] [HN12] [Bed12][TFSL14] [GWMP16] [NHMG16][PLS+16] [MNH+17]
Non-code comprehension 10 [UNMM06] [YKM07] [JGSH09] [PG10][SM10b] [SSVdP+12] [SMS+13] [SJAP13][DSLS+14] [SUGGR15]
Collaborative programming 2 [MGRB15] [DB17]Traceability 1 [ASGA12]
Performance
Program Comprehension 11 [CSW02] [NS04][NS05] [NS06][AC06] [Dub09] [SM10a] [SSGA12][DcI13][BDL+13] [Loh14]
Debugging 10 [RCdBL02] [BT04b] [BT07b] [Bed12][SFM12] [CL13] [TFSL14] [JF15][GWMP16] [NHMG16] [PLS+16][MNH+17]
Non-code comprehension 8 [YKM07] [SM10b] [SSVdP+12] [SMS+13][CTKT13] [SJAP13] [DSLS+14][SUGGR15]
Collaborative programming 2 [SB04] [PBT09]Traceability 2 [WSSK14] [ASGA12]
Visual Effort
Program Comprehension 5 [SM10a] [SSGA12] [BDL+13] [FBM+14][JF15]
Debugging 2 [SFM12] [TFSL14]Non-code comprehension 6 [YKM07] [JGSH09] [SM10b] [SSVdP+12]
[SMS+13] [SJAP13]Collaborative programming 0 N/ATraceability 0 N/A
Viewing Pattern
Program Comprehension 3 [BMST06a] [BdP16] [PSGJ17]Debugging 11 [RLCdB02] [BT04a] [BT04b] [BT07a]
[BT07b] [HN12] [Bed12] [HLL+13][GWMP16] [PLS+16] [MNH+17]
Non-code comprehension 0 N/ACollaborative programming 1 [DB17]Traceability 0 N/A
of the research published in that period focused on validating attention tracking technologies.RFV technology was validated and tested multiple times in order to determine its accuracy inmeasuring the viewing habits of programmers. RFV technology was not used in any studiesafter 2007, as its limitations and effect on the viewing habits of participants was questionedand reported in multiple publications Bednarik and Tukiainen (2007b,a). All the experimentsreported after 2007 relied on the use of eye-trackers. In the second decade of the 21st century,the use of eye-trackers in programming research saw a noticeable hike, evident by the reportedmapping result in RQ1, where over 62% (39 papers) of the papers mapped in this survey werepublished in the last 5 years. This result, although does not provide a qualitative argumentto the validity of eye-tracking in programming research, it can be quantitatively interpreted asan argument in favor of using eye-trackers in programming studies, as researches realized itspotential and advantages.
34

Categorization
RQ2 focused on categorizing the collected research papers to identify areas that might besuitable for qualitative systematic literature reviews, or where more primary studies are needed.We identified 5 classes based on the materials used (code or non-code), the programming taskgiven to participants (comprehension, debugging or tractability) or the number of programmersworking on the task (individual or collaborative programming). Over 80% of the reportedstudies used a source code or a programming language, while only 11 studies used diagrams ornon-code stimuli. Code comprehension and debugging tasks have been studied in over 70% ofthe collected papers, while collaborative programming and traceability had the least number ofpublications, with 5 and 3 papers respectively. The lack of studies on the latter type of problemscan be due to the difficulty of setting up the eye-tracking environment for such tasks Pietinenet al. (2008); D’Angelo and Begel (2017). In code and non-code comprehension tasks, as well asdebugging tasks, participants are shown a code or a diagram that was selected or modified to fiton one screen, and avoid any scrolling that might affect the eye-tracking metrics, such as scanpaths or heat maps. In order to avoid any noise in eye-tracking data, the stimulus needed to beshown in a full view on one display, and in most reported experiments, participants did not use amouse to navigate through stimulus. This limitation and possible noise to the eye-tracking dataposed a challenge in setting up an environment suitable to perform collaborative programmingand traceability experiments. In collaborative task, the viewing patterns of pair programmersare monitored on either a distributed or shared display. As eye-trackers are designed to followthe eye movement of a single participant sitting in front of a display, collaborative researchrequired a special set up and modified equipment Pietinen et al. (2008). In one particular case,D’Angelo and Begel (2017) stated:
“We would have liked to use two of the much cheaper Tobii EyeX trackers, but itis not possible to put more than one EyeX on a computer”. pp 6248.
Instead of using another Tobii EyeX tracker, D’Angelo and Begel (2017) had to use Tobii TX300which costs around 300 times more.
Materials preference and targeted audience
RQ3 and RQ4 reported on the materials and participants used in an eye-tracking experiment inprogramming research. While students were subjects of eye-tracking experiments in program-ming, there does not seem to be an agreement on the optimal sample size for programmingstudy with eye-trackers, and in most cases, the sample size and diversity was highlighted as anissue or cite as possibility for future improvements. The most common sample size used in thestudies was 15, followed by 20, and the most common participants were students and facultymembers, which reflects that the targeted audience for the majority of these studies is in theacademic field.
The most commonly used stimuli in the experiments were written using the Java program-ming language. This can be directly related to the fact that Java is the language used in amajority of introductory programming courses. Since a vast majority of the reported exper-iments were conducted in an institute of higher learning and used students as subjects, Javaseems to be a rational choice for an experiment in programming research, which will allow thefindings to be generalized and adapted by others. While researchers in the reported studiesfocused more on the students’ reading patterns and viewing habits, fewer researchers tried tocompare multiple programming languages. Only one paper compared C++ and Python pro-gramming languages to find if the students’ performance differs between the two languagesTurner et al. (2014). The selection of Python programming language was interesting as itfollows a different syntax and structure of programming than the traditional Java and C++
35

languages. However, it was stated by the authors that the sample size for the Python group wassmaller due to the fact that it is not a language students learned as an offered course in theirinstitution. Such comparison and possible findings from comparing two different languagescan have an impact on the programming language selected to teach introductory programmingcourses. Another comparison that lacked in terms of quantity of publication was comparingthe differences between reading a natural text and a source code, with only two papers pub-lish on such comparison. Such comparison between the reading patterns of natural text and asource code can possible be linked to the research of comparing programming languages withdifferent structure and syntax, in order to select a language that is easier and more suitablefor introductory courses Busjahn et al. (2015a); Peachock et al. (2017). One recent paper usedScratch programming tools to examine the differences between kids and teens [PSGJ17].
While most of the papers we reviewed tried to examine the usefulness of code representa-tion, no other paper examine an alternative way of programming, such as Scratch. Anothernoticeable lack or absence in use of materials is the evaluation of the methods used to teachstudents the fundamentals of programming and problem solving skills, such as pseudocode andflowcharts. Only one paper used pseudocode and flowcharts as stimuli in an eye-tracking ex-periment Andrzejewska et al. (2016). However, no experiment showed the effect of using thesemethods on the students’ ability to perform a programming task. As these methods are someof the first techniques students learn in introductory programming courses, their effectivenessand usefulness remains untested by an eye-tracking experiment.
Eye-trackers
The early work on using eye-tracking in computer programming was done on the basis thatswitching behaviour during program comprehension can be effectively monitored using an eye-tracker Bednarik et al. (2005b), and the cognitive processes of the subjects can be studied withthe support of their focused attention Nevalainen and Sajaniemi (2004). Eye-trackers usedin programming research have some limitations. For example, the use of large materials thatrequire scrolling can introduce noise to the collected data, hence inaccurate eye-tracking metrics.Another issue with eye-trackers is related to their limitation on tracking the eye movement ofa single participant at a time, which may affect the studies of collaborative programming. In2008, Pietinen et al. (2008) stated that:
“The currently available eye-tracking technologies do not provide solutions for stud-ies on collaborative aspects of visual attention” Pietinen et al. (2008), pp 42.
Another issue that eye-trackers had in early years of research is their intrusiveness whenmounted on the participants’ head, and the affect it might have on creating a comfortablework environment for the subject. An important study evaluating the performance of threetypes of eye-tracking devices was conducted by Nevalainen and Sajaniemi (2004), using Tobii1750, ASL 504, and the head mounted ASL 501 tracker. Given on the time needed to setupeach device, Nevalainen and Sajaniemi (2004) found that the head mounted ASL 501 requiredtwice as much time as the stationary devices. Although less than 10% of invalid data wasreported by all the devices; in terms of accuracy, Tobii was the most accurate, followed bythe ASL 504 and ASL 501, respectively. The head mounted version of the eye-tracking devicewas found to be obtrusive, less accurate and required a longer setup time. As the RFV wasabandoned by researches in this field after 2007, the use of eye-trackers were focused on itsaccuracy and effectiveness in measuring eye movements, as well as its usability in experimentalenvironment. The early version of head mounted eye-trackers became obsolete in later years,with Tobii devices leading the way in producing non-intrusive, accurate and easy to use eye-trackers. However, one of the issues research might still face when deciding to use an eye-tracker
36

in their study is the cost of such devices. Even though eye-trackers have evolved considerablyover the years in terms of design and abilities, they are still not easy to be obtained by allresearchers due to high prices. This study focuses on the quantitative reporting of eye-trackersin programming research, and a qualitative assessment of the effectiveness and usability of eye-trackers in programming studies needs to be explored and discussed in a systematic review ofprimary studies.
Metrics and variables
Eye-tracking metrics, reported in RQ6, can be a variation of calculations based on duration,count and sequence of fixations collected by an eye-tracker. A noticeable issue in the reportedexperiments is the lack or a terminology and inconsistent names of metrics, where consider-able number of papers reported the same measure with different names. While some papersmeasured fixation duration, others called it fixation time or fixation intensity. Similarly, someresearchers used fixation count to evaluate their variables, while others used average fixationcount or fixation rate. In this study, we can only report on the quantitative values of the eye-tracking metrics used by researches in programming experiments, while leave the terminologyand guidelines of using these metrics to be reported in a qualitative review. RQ6 also mapsthe set of variables used in the selected studies, and can help identify any possible relationshipsor links between the dependent or independent variables used in the reported studies. It canbe seen in the mapping of RQ6 that, while dependent variables were related in most parts tothe performance and behaviour of the participants, independent variables were more relatedto participants’ background and environmental set up of the experiment. The most commondependent variable used in the studies was time. Time in its variations was used in every classof tasks to identify and measure the performance and viewing habits of participants. Albeitmeasuring detection, scan, response, fixation or completion time, this most commonly measuredvariable can be affected by a variety of independent variables:
• Measuring Completion time can be affected by the experience of participants, their pro-gramming background or programming language preference.
• Since Fixation time as a dependent variables measures the time participants spend fo-cusing on a specific AoI, it is safe to assume that the selected AoI can be an independentvariable that could affect fixation time. This can be verified by examining studies wherethe defined AoIs were Source Code Entities (SCEs), and while fixation time was a de-pendent variable, the different types of SCEs and code elements were the independentvariables in those studies.
• Scan time and Detection time were used mostly in debugging studies where the type orthe presence of errors and defects was an independent variable
• Completion time did not show an associated independent variable that stands out fromthe reported set. It was measured along with various independent variables such as codeor algorithm type variable, experience variable or representation type variable.
One noticeable dependent variable is switching behaviour, which was mostly used in de-bugging studies. Switching variable was commonly used in studies that used multiple rep-resentations or examined a visualization tool in order to measure its effectiveness in helpingprogrammers improve their performance. These tools usually represent the code in multipleforms and include a visualization field that aims at improving the understanding and simplify-ing the logic flow of the source code. Switching as a dependent variable was also used in studiesthat validated the effects of RFV on participants behaviour, and where the RFV display blur-ring conditions were an independent variable. Visual effort as a dependent variable measures
37

participants’ strain and focused attention to understand a specific AoI. This variable was mostcommonly used in both code and non-code comprehension tasks. Comprehension tasks triedto understand the viewing habits of participants, and measure the parts of a code or a diagramthat required more focused attention and effort to understand. An independent variable thatwas associated with visual effort is the participants’ preference, noticeably in studies whereidentifier style or programming language preference was set as independent variables. In otherwords, visual effort as a dependent variable can be affected by the participants’ familiarity withthe materials and stimulus used in the experiment.
Out of the 63 mapped studies, only 13 study (25%) stated mitigating variables that had alesser impact or milder effect on the relation between dependent and independent variables.The reported mitigating variables in the mapped studies were related to the participants’background and the materials used. In seven of the studies where visual effort and performancewere the dependent variables, participants’ experience was reported as a mitigating variable[SM10a,ASGA12,SFM12,BDL+13,SMS+13,SJAP13,TFSL14]. This can be confusing, as oneof the most commonly used independent variables in the studies was participants’ level ofexperience, and it has been associated with visual effort and performance variables in otherstudies. The way to determine if experience is an independent or a mitigating variable canbe related to the experimental setup, objective of the study and the analysis of the dependentvariables. This can be further clarified by looking into two examples: When [JGSH09, SMS+13]tried to measure visual effort (dependent variable), then the representation of the stimuli was anindependent variable that can affect the participants’ effort, while the participants’ experienceand familiarity with this representation were mitigating variables. In other words, while thetype of representation may affect visual effort, a participant who is familiar with the way thestimuli were represented may not be impacted by the representation, hence require lesser visualeffort than those who are not familiar with it, and vice versa. Similarly, when the identifierstyle was an independent variable that may affect the visual effort and performance (dependentvariables) of the participants in [SM10a, SSGA12], then the participants’ preference for identifierstyle and their experience were mitigating variables.
While the link between eye-tracking data and the cognitive load is still an on going topic ofresearch, some researchers try to provide possible interpretations of the metrics calculated fromeye-tracking data. In the reported studies, variables such as performance and accuracy weremostly calculated by evaluating the answers participants provided, or the ability to find bug(s)in source code. On the other hand, other variables were evaluated based on the eye-trackingmetrics and the measures related to eye-tracking data, such as visual effort and viewing patterns.In a recent review, Bylinskii et al. (2015) provided a possible interpretations of eye-trackingmetrics in relation to information visualization. Similarly, Zagermann et al. (2016) discussesthe relation between eye-tracking data and the cognitive load in relation to visual computing.Based on the work of Bylinskii et al. (2015) and Zagermann et al. (2016), and from the literaturereviewed in this study, we will try to briefly touch on the relation between some variables andthe eye-tracking metrics and their relation to programming, while leave an extended study onthis subject for possible future qualitative review. For instant, viewing pattens variable can bestudied using the eye-tracking metrics of attention switching and scan-path. While attentionswitching provides information on the areas that attracted most attention from participants,it also can be used to interpret a possible link or strong correlation between two AoIs. Asmentioned in RQ6, attention switching was mostly used in studies where researchers try toexamine the effectiveness of multiple representations, or the affect different presentations of asource-code or a diagram can have on the participants’ performance. Scan-path provides detailsabout the order in which the participants viewed the stimuli, hence the way a participant followsthe logic of a source-code or how they jump form one AoI to another can be highlighted andstudied. Hence attention switching and scan-path can be used to evaluate the viewing patterns
38

variable.The variable of visual effort in programming studies can be interpreted using fixation duration
and fixation count metrics. Fig.14 shows the possible interpretations of visual effort on an AoIbased on the fixation metrics. While a high fixation duration on AoI can mean difficultyto understand, complex section, impotence or notability, a low fixation duration can meansimplicity of the AoI, unimportance or the participants’ fast comprehension. Similarly, visualeffort can relate to fixation count, that is the more frequently a participant keeps visiting anAoI, the more significant and meaningful that area could be. Thus, the relationship betweenthese measures indicates that interpretation of results based on these matrices need to be donecarefully to avoid misleading discussions.
Figure 14: Possible interpretations of visual effort based on fixation metrics
The interpretation of visual effort variable can be simplified as:
• Low fixation count and low time indicate less effort [SSGA12, SMS+13].
• High fixation count and more time indicate more effort [TFSL14, SM10a].
• Long fixations on an AoI mean more effort is needed, while AoI with shorter fixations aremore efficient as they require less effort [ASGA15].
5 Threats to validityPossible threats to the validity of this mapping study are publication selection, data extractioninexactness, and misclassification.
Publication selection In conducting this study, we focused our search for papers on someof the most common electronic databases that are considered leaders in computer science andcomputer engineering, using sequences of keywords as a search query. We did not examineprinted materials, grey literature or publications that were not written in English in our survey.In principle, the inclusion of such materials can provide more information and data for thesurvey, and allow more general results to be drawn. Our research questions were derived from
39

our aim to conduct an eye-tracking study, and therefore, the papers selected for the surveyfollowed a pre-defined set of questions to avoid any bias. Selection of publications involved thefirst and second authors of this papers, with inclusion and exclusion reasons stated as discussedin subsection 2.2: Inclusion, Exclusion and Data collection. To avoid possible threats to thestatistics and frequencies reported in this survey, duplicated experiments that were publishedin multiple articles or conferences were not included in the analysis. The second author initiallycompared the repeated experiments in order to choose one paper to report in this survey, andthe first author confirmed the selection.
Extraction of information and Data Data and information included in this survey wereextracted by two researchers, one article at a time. Both researchers had to reach a level ofagreement on the collected data. Any inaccuracy in the data can be a result of the absenceof any guideline or methodology for conducting such experiments in this field of study. Themost commonly cited guideline in the surveyed papers was Kitchenham et al. (2002). However,not every experiment followed the same style of reporting, which may cause inaccuracy in datacollection.
Categorization of papers The papers included in this survey were categorized into oneof five classes: code comprehension, debugging, non-code comprehension, collaborative pro-gramming and traceability The process of classifying a paper was based on either the taskparticipants were asked to perform (comprehend, debug or trace), the material used (sourcecode or non-code) or the setup of the environment (single or pair). Each paper’s classificationwas confirmed and checked by the first author, while disagreements were discussed until a deci-sion is made. In some cases the classification was easy, especially for articles that used non-codestimuli, did traceability study or used two programmers at the same time in the experiment.However, some of the difficulties in classifying an article were due to the similarities betweencomprehension and debugging tasks. Generally, in order to debug a code, programmers needto understand the code first, and then try to find any bug(s) in the program. In some experi-ments, researchers may ask participants to assess the correctness of a code, however, the mainobjective of the study may not be the debugging performance, but rather the way participantsview and try to understand the code. In any confusion similar to this, we relied on the title,the objective of the experiment stated by the authors or the analysis of the collected data inrare cases. We looked into the data analysis to see if the author considered the debuggingperformance in their analysis, or just studied the viewing habit and the comprehension of thecode.
6 ConclusionThis systematic mapping study reported on papers that used eye-tracking technology in experi-ments related to programming. Using online electronic databases that are most commonly usedby computer scientists and software engineers; we were able to identify 63 papers publishedbetween 1990 and June 2017, which used eye-tracking in programming research. Although thefirst two studies in our reporting, [CS90] and [CW02], had over a 10 years gap between them,the use of this technology has seen a rise in recent years, with over 60% of the 63 reportedpapers published after 2011. We categorized the collected studies into five classes based onthe programming area and task: code comprehension, debugging, non-code comprehension,collaborative programming and requirements traceability. We found that majority of the re-ported experiments were conducted on code comprehension and debugging, with fewer papersreporting on collaborative programming and requirements traceability. The fewer number of
40

studies on collaborative programming and traceability studies can be due to some limitationsin the eye-tracking technology. In case of collaborative programming, additional set up andmodification to the environment is required as current eye-tracking device are not designed totrack the visual attention of more than one participant at a time. As for traceability studies,which require and large source code, current eye-tracking devices require a stimuli to be pre-sented on a full screen with no scrolling, which might cause some noise in the eye-tracking data.Researchers took into consideration the possibility of noise in the eye-tracking data due to largesource codes or diagrams. Therefore, this limitation of eye-tracking devices may have affectedthe selection of stimulus. An important part of conducting an eye-tracking experiment relatedto programming was the selection of participants and materials used to evaluate the participantvisual effort and performance. We found the most commonly used materials by researchers inan experiment related to programming was the Java programming language, followed by theUML class diagrams. We relate this common usage of Java in eye-tracking experiments to theparticipants’ familiarity with the language as it is the most common language students learnin their introductory programming course. In this survey, we found that only one paper dida comparison of two different programming languages (C++ and Python) in order to evalu-ate their effect on students’ performance [TFSL14]. Similarly, we found that only one paperstudied students’ behaviour when using flowcharts and pseudocode [ASB+15], which are fun-damental tools that novice programmers learn in their introductory programming course. Interms of eye-tracking metrics, an important finding of this study is the lack of a methodologyin conducting such experiments, which resulted in terminological inconsistency in the namesand formulas of metrics used, which needs to be addressed in a future qualitative review.
41

APPENDIX
Appendix A: Figures and tables
Table 9: Details of programming languages and materials used for each paper(sorted by year)
Paper Task Materials Details of the materials used[CS90] Program Comprehen-
sionPascal Short but complex algorithm.
[CSW02] Program Comprehen-sion
Algorithm N/A.
[RCdBL02] Debugging Java 3 debugging sessions for each participant to find asmany errors as they could.
[RLCdB02] Debugging Java 5 debugging sessions, 1 was a warm-up and fourmain sessions followed.
[BT04a] Debugging Java 3 debugging sessions, 1 was a warm-up performed[BT04b] Debugging Java 3 programs, 1 was a warm-up.[NS04] Program Comprehen-
sionN/A 6 short programs in total, two for each eye-tracker.
[SB04] Collaborative pro-gramming
Java 3 programs that can fit on one screen, and suitablefor novice programmers.
[NS05] Program Comprehen-sion
Pascal 7 short programs, between 11-29 LoC.
[NS06] Program Comprehen-sion
Java 2 Java programs with 63 and 58 LoC.
[BMST06a] Program Comprehen-sion
Java 3 short Java programs, with 15, 34, and 38 Linesof Code (LoC).
[AC06] Program Comprehen-sion
Java 12, recursive and non- recursive versions of six al-gorithms.
[Gu’06] Comprehension UML diagram 2 different class diagrams from two different pro-grams.
[UNMM06] Program Comprehen-sion
C 6 small-scale programs. Each program had 1 logicdefect.
[BT07a] Debugging Java 1 Java program that contained four non-syntacticerrors.
[BT07b] Debugging Java Similar to the experiment from [RCdBL02][YKM07] Comprehension UML diagram 6 modules of a program presented using 3 different
types of layouts.[Dub09] Program Comprehen-
sionScala 3 algorithms are implementations of relational al-
gebra operators.[PBT09] Collaborative pro-
grammingSoftware De-velopmentProject
N/A
[JGSH09] Comprehension UML diagram Diagrams from 3 open-source programs.[PG10] Comprehension UML diagram 2 diagrams of 15 and 40 classes.[SM10b] Comprehension UML diagram 8 diagrams investigating four design patterns on 3
systems: JUnit, JHotdraw, and Qt.[SM10a] Program Comprehen-
sionPhrases 8 phrases.
[BSB11] Program Comprehen-sion
NLT and Java 11 small programs with a varying complexity withmultiple choice questions about the programs.
[ASGA12] Traceability Java 6 short source-codes, each can fit on one screen.[SFM12] Debugging C 4 C language source code snippets, each loaded
with a single logical defect.[JN12] Collaborative pro-
grammingJava 1 Java program of three hundred lines.
[HN12] Debugging Java 1 Bubble sort program consisting of two classes andloaded with three bugs.
[SSGA12] Program Comprehen-sion
Java 3 small Java programs with 30, 36 and 40 LoC.
[SSVdP+12]Comprehension UML diagram 3 UML class diagrams.[Bed12] Debugging Java 3 programs, 1 warm-up (data not considered for
analysis) and 2 main programs with about 100 LoCeach.
[BDL+13] Program Comprehen-sion
C++ 1 code with two functions that had six and fifteenidentifiers.
[CTKT13] Comprehension ER Diagram 1 Entity Relationship Diagram seeded with 17 de-fects.
[DcI13] program Comprehen-sion
.NET 1 e-commerce application (around 1000 LOC) inMicrosoft ASP.NET that is designed to manage theproduct inventory and orders received by a small-scale business enterprise.
42

[SMS+13] Comprehension TROPOS 3 requirements comprehension tasks.[SJAP13] Debugging Java 1 open source system with around 60 KLoC.[CL13] Debugging C# and Java 27 trials, 9 for each error type: lexical, logical and
syntactic.[HLL+13] Debugging C 2 programs with 100 LoC, one iterative and the
other recursive, each had three semantic or syntac-tic bugs.
[TFSL14] Debugging C++ andPython
10 codes, five in C++ and five in Python, each sub-ject was tested on either C++ or Python programsbut not both.
[WSSK14] Traceability N/A N/A.[Loh14] Program Comprehen-
sionJava 1 source code of the Apache River project.
[FBM+14] Program Comprehen-sion
C# 8 codes out of 10 comprehension tasks (2 warm-upnot considered).
[DSLS+14] Comprehension UML diagram Class diagrams of 2 different programs: JTable andJFreeChart.
[BSS+14] Program Comprehen-sion
Java 1 program that calculated the area of a rectangle.
[ASGA15] Traceability Java 6 pieces of code with varying lengths.[ASB+15] Program Comprehen-
sionPseudocodeand Flowchart
2 algorithms, one presented in a pseudocode andthe other a flowchart.
[SUGGR15] Comprehension Graphics 1 program: JHotDraw.[MD15] Program Comprehen-
sionC++ 4 short codes
[MGRB15] Collaborative pro-gramming
Java 1 program.
[RLMM15] Program Comprehen-sion
Java 67 methods from 6 different applications.
[BBB+15] Program Comprehen-sion
NLT and Java 17 natural language trials and 101 source-code tri-als from novices, and 21 Java trials from experts.
[JF15] Program Comprehen-sion
N/A 2 programs from the image processing domain.
[BdP16] Program Comprehen-sion
.NET snippets of code were presented either in black-and-white, or in colour
[GWMP16] Debugging RequirementsDocuments
2 documents, one was 11 pages seeded with 30 re-alistic faults and the other 14 pages with 34 faults
[LWH+16] Debugging C 2 programs, one iterative and the other recursive.Each program has three bugs.
[MDPVRDVI16]Program Comprehen-sion
N/A
[NHMG16] Debugging C 8 short codes, each have 15 lines[PLS+16] Debugging Java 2 Java programs seeded with bugs[BSL+17] Debugging Java N/A[DB17] Collaborative pro-
grammingC# N/A
[MNH+17] Debugging Java N/A[PIS17] Program Comprehen-
sionNLT and C++ 7 Source codes and 3 natural language text
[PSGJ17] Program Comprehen-sion
Scratch N/A
Table 10: Details of participants used
Paper Participants Size Split Split Details Gender[CS90] S & FM 19 Novice VS. Experi-
enced10 low-experience, 9 high- ex-perience
N/A
[CSW02] S & FM 19 Novice VS. Experi-enced
9 novice, 10 experienced N/A
[RCdBL02] S & P 5 Experienced program-mers
4 Students, 1 professional N/A
[RLCdB02] S 49 Less experienced VS.More experienced
N/A N/A
[BT04a] S & FM 10 Programming experi-ence varied
N/A 1 F, 9 M
[BT04b] S & FM 18 Programming experi-ence varied
N/A 3 F, 15 M
[NS04] S 12 Programming experi-ence varied
N/A 4 F, 8 M
[SB04] P 10 Professional program-mers
4 for the first phase, 6 for thesecond
1 F, 9 M
[NS05] S 12 Students N/A 5 F, 7 M
43

[NS06] S 16 Animation group VS.Static group
N/A 5 F, 11 M
[BMST06a] S 18 Novice VS. Intermedi-ates
8 novice, 8 intermediates 3 F, 13 M
[AC06] S 15 N/A N/A N/A[Gu’06] S 12 N/A N/A N/A[UNMM06] S 5 N/A N/A N/A[BT07a] S & FM 18 Novice VS. Experi-
enced6 novices, 8 experts N/A
[BT07b] S & FM 19 Novice VS. Experi-enced
10 novices, 8 experts 3 F, 15 M
[YKM07] S & FM 12 Performance 3 UADA, 1 UEDI, 3 UEDKand 5 UEDE
N/A
[Dub09] S 12 N/A N/A N/A[PBT09] N/A 2 Pair of programmers N/A N/A[JGSH09] S 24 Students 7 post-graduate, 17 graduate
studentsN/A
[PG10] S 24 N/A N/A N/A[SM10b] S & FM 15 Novice VS. Experi-
enced7 novices, 8 experts 2 F, 13 M
[SM10a] S & FM 15 Identifier Styles 6 camel-case, 7 underscore and2 had no preference
N/A
[BSB11] S 15 Programming experi-ence varied
N/A N/A
[ASGA12] S 26 N/A N/A 7 F, 19 M[SFM12] S 15 Novice VS. Experi-
enced8 expert, 1 excluded and 7novice
2 F, 12 M
[JN12] S 82 Pair programmers 40 pairs N/A[HN12] S 19 Programming experi-
ence varied10 High, 10 Low 2 F, 17 M
[SSGA12] S 24 Gender 7 camel-case, 17 underscore 9 f, 15 M[SSVdP+12] S & P 21 Novice VS. Experi-
enced12 students, 9 practitioners 1 F, 20 M
[Bed12] S & FM 18 Novice VS. Experi-enced
6 novices, 8 experts N/A
[BDL+13 ] S & FM 15 Identifier Styles 40% camel-case, 47% under-score and 13% no preference
2 Female
[CTKT13] P 4 N/A N/A N/A[DcI13] P 13 N/A 5 control group, 8 experiment
groupN/A
[SMS+13] S 28 N/A N/A 12 F, 16 M[SJAP13] S 20 Novice VS. Experi-
enced10 novices, 10 experts N/A
[CL13] S 9 N/A N/A 2 F, 7 M[HLL+13] S 25 Gender 12 female, 13 male 12 F, 13 M[TFSL14] S 38 Experience and pro-
gramming languageC++ group (17 novice, 8expert), Python group (10novice, 3 expert)
N/A
[WSSK14] S & FM 8 N/A 4 expert developers N/A[Loh14] S & P & P 30 N/A N/A N/A[FBM+14] P 15 N/A N/A 1 F, 14 M[DSLS+14] S & P 23 N/A N/A N/A[BSS+14] P 2 N/A N/A N/A[ASGA15] S 14 N/A N/A N/A[ASB+15] S 26 Effectiveness 13 effective, 13 non-effective 30 F, 73 M[SUGGR15] S & P 20 Experience 4 novice, 10 intermediate and
6 expert6 F, 14 M
[MD15] N/A 3 N/A N/A N/A[MGRB15] S 10 Pair programmers 5 pairs N/A[RLMM15] P 10 N/A N/A N/A[BBB+15] S& P 20 Novice Vs. Expert 14 novice students, 6 profes-
sional8 F, 12 M
[JF15] S & FM 20 N/A N/A 3 F, 17 M[BdP16] S & P 38 Representation and
Experienceblack-and-white 14, and colour17 and 4 experts
N/A
[GWMP16] S 13 N/A N/A N/A[LWH+16] S 38 Performance and pro-
gram typeIterative (10 high performance,28 low performance), recursive(12 high performance, 26 lowperformance)
16 F, 22 M
[MDPVRDVI16] S 19 Representation style 13 Experiment1 static repre-sentation, 6 Experiment2 dy-namic representation
N/A
44

[NHMG16] S 24 Experience 15 novice and 9 experts N/A[PLS+16] S 20 N/A N/A N/A[BSL+17] S 56 N/A N/A 10 F, 46 M[DB17] P 2 N/A N/A 1 F, 1 M[MNH+17] S 20 N/A N/A N/A[PIS17] S 33 Experience novice and non-novice 15F, 18M[PSGJ17] S 44 Age kids and teens 12F ,32M
Table 11: Details of the eye-tracking devices used in each experiment
Paper Tracker Specifications Duration[CS90] ASL N/A N/A[CSW02] ASL N/A N/A[RCdBL02] RFV A modified version RFV N/A[RLCdB02] RFV N/A 10 minutes debugging session
for each program.[BT04a] RFV and Tobii
1750Sampling-rate set to 30Hz for Tobii 10 minutes debugging session
for each program.[BT04b] RFV and Tobii
1750Sampling-rate set to 30Hz for Tobii 10 minutes debugging session
for each program.[NS04] Tobii 1750,
ASL 504 andASL 501
ASL 504 and ASL 501 Head MountedOptics, used with PlanAni animator
N/A
[SB04] ISCAN RK-726PCI
N/A 10 minutes debugging sessionfor each program.
[NS05] Tobii N/A N/A[NS06] Tobii 1280x1024 Resolution display with
PlanAni animatorAround two hours session forthe experiment
[BMST06a] Tobii 1750 Sampling rate 50Hz, 17” TFT displayresolution of 1024x768 and using Jeliot3
N/A
[AC06] ASL N/A One hour or less.[Gu’06] EyeLink II N/A N/A[UNMM06] EMR-NC EMR-NC with sampling rate of 30Hz,
a 21” LCD with resolutions set at1024x768
A 5 minutes review session, orthe subject finds all the defects
[BT07b] RFV 2.1 andTobii 1750
Restricted Focus Viewer (RFV) 2.1and Tobii 1750 with sampling rate of30 Hz on 17” display resolution of1280x1024
Ten minutes to debug the pro-gram
[BT07a] RFV 2.1 andTobii 1750
Same setup from [BT07b] Ten minutes
[YKM07] Tobii 1750 Sampling rate of 50MHZ and less than0.5 degrees error rate
Between 10 and 20 minutes
[Dub09] Tobii 1750 N/A Between 45 minutes and onehour
[PBT09] ASL 504 andTobii 1750
Complex setup of a system to captureeye movement data of pair program-mers
N/A
[JGSH09] EyeLink II N/A An experiment took about onehour for each subject
[PG10] EyeLink II A high resolution EyeLink II and fastdata rate of 500 samples per second
between 12 and 15 minutes
[SM10b] Tobii 1750 Temporal resolution was set at 50 Hz,on a 17” TFT-LCD screen resolution1024x768
The study was designed to becompleted in 20 minutes or less
[SM10a] Tobii 1750 Temporal resolution was set at 50 Hz,on a 17” TFT-LCD screen resolution1024x768
The experiment took 13 min-utes on average
[BSB11] Tobii T120 Sampling rate of 120 Hz, with TobiiStudio 2.0.6
N/A
[ASGA12] FaceLAB Two 27” LCD monitor, one with screenresolution 1920x1080
Average 20 minutes, includingsetting up eye-tracking system
[SFM12] Tobii 1750 17” LCD screen, resolution was set to1024x768
5 minutes or less
[JN12] Tobii 1750 Two synchronized 50Hz Tobii eye-trackers
Approximately 45 minutes
[HN12] Tobii T60 XL With 60Hz sampling rate and TobiiStudio 2.1 software
A 15 minutes time limit
[SSGA12] FaceLAB Screen resolution is 1920x1080, andTaupe system to analyse the collecteddata
25 minutes in average, 11 hourstotal time of eye-tracking
[SSVdP+12] EyeLink II With Taupe system to analyse the data N/A
45

[Bed12] Tobii 1750 Sampling rate of 50 Hz N/A[BDL+13] Tobii 1750 Temporal resolution was set at 50 Hz,
on a 17” TFT-LCD screen resolution1024x768, and ClearView software
N/A
[CTKT13] Tobii 50 Hz sampling rate, on a 17” monitorwith a resolution of 1024x728
N/A
[DcI13] Tobii 1750 N/A N/A[SMS+13] FaceLAB Two 27” LCD monitors 10 minutes for each session.
Total eye-tracking time was2.85 hours
[SJAP13] Tobii X60 60 Hz sampling rate, a 24” monitor and1920x1080 screen resolution
All tasks were selected to besolved in approximately half anhour
[CL13] Tobii T60 N/A N/A[HLL+13] Eyelink 1000 Screen resolution was 1024x768 N/A[TFSL14] Mirametrix S2 An average accuracy of 0.5 to 1.0 de-
grees with 60Hz rateN/A
[WSSK14] Tobii X60 24” LCD monitor N/A[Loh14] SMI iView X
Hi-Speed 1250Using a scan rate of 500 Hz About 90 minutes per subject
[FBM+14] Tobii TX300 Using a 300 Hz tracking frequency, and96 dpi 1920x1080 23” monitor
1.5 hour experiment
[DSLS+14] FaceLAB N/A N/A[BSS+14] SMI RED-m 120Hz eye-tracker using the Ogama
tracking softwareN/A
[ASGA15] FaceLAB Same setup from [ASGA12] N/A[ASB+15] SMI iView
X Hi-Speed500/1250
With 500Hz time resolution, and theSMI BeGaze 2.4 software to analysethe data
N/A
[SUGGR15] Tobii T60 XL Sampling rate of 60 Hz, on a 24” flat-panel screen
7 to 23 minutes to complete theexperimental tasks
[MD15] Tobii X2-30 at 30 samples/sec N/A[MGRB15] Tobii X60 With Tobii Studio 3.0.2 software Time limited to 15 minutes for
the session[RLMM15] Tobii T300 Sampling rate 120Hz, and a resolution
of 1920x1080A one hour session
[BBB+15] SMI RED-m Sample rate set at 120Hz, and Ogamatool to record the data
N/A
[JF15] Eye Tribe Sampling rate of 60Hz, 9 points cal-ibration process and Ogama tool torecord the data on a 1280x1024 screenresolution
N/A
[BdP16] Tobii TX300 sampling rate of 300Hz, with TobiiStudio
N/A
[GWMP16] Eyelink 1000 using sampling rate of250Hz, N/A[LWH+16] Eyelink 1000 Sampling rate set at 1000 Hz, on a 22”
LCD monitor with 1024x768 resolutionTime limited to 10 minutes forthe session
[MDPVRDVI16] N/A N/A N/A[NHMG16] SMI sampling rate 250Hz between 20-45 minutes[PLS+16] Tobii X60 20 minutes to debug the pro-
gram[BSL+17] GazePoint
GP3on 24-inch monitor with 1920x1080pixels, and using GP3 software
N/A
[DB17] Tobii TX300and TobiiEyeX
TX300 on 23” and 1920x1080 mon-itor, and Tobii EyeX on a 24” and1920x1200 with sampling rate 30Hz
15 miuntes for each task
[MNH+17] Tobii EyeX on a EyeInfo Framework, with accu-racy error ¡ 0.4 degrees
participants spent 15 minutesto debug 2 programs
[PIS17] Tobii X60 with Tobii studio V2.3 N/A[PSGJ17] SMI RED 250
and Tobii mo-bile
4 SMI trackers, and one Tobii withsampling rate 60hz
N/A
Table 12: All variables listed by the study papers
Paper Dependent Variables Independent Variables Mitigating Variables[CS90] Number of fixations and
fixation timeSubjects’ experience N/A
[CSW02] Performance and time Expertise and line number N/A[RCdBL02] Debugging performance N/A N/A
46

[RLCdB02] Accuracy, fixation timeand switching frequency
Visualization modality (textual orgraphical), visualization perspec-tive (data structure or control-flow), type of error (data struc-ture or control-flow) and program-ming experience (less experiencedor more experienced)
N/A
[BT04a] Accuracy, fixation timeand switching frequency
N/A N/A
[BT04b] Debugging performance,fixation time and switchingfrequency
RFV restricting condition andmeasuring tool
N/A
[NS04] Accuracy and time The eye-tracking device used N/A[SB04] Debugging performance N/A N/A[NS05] Performance and gaze loca-
tionVisualization tool N/A
[NS06] Performance and gaze loca-tion
Visualization tool N/A
[BMST06a] Number of fixations, fixa-tion time and number ofswitches
Experience
[AC06] Accuracy and number oflines
Algorithm type: recursive andnon- recursive
Expertise
[Gu’06] N/A N/A N/A[UNMM06] Scan time and defect detec-
tion timePresence of defects N/A
[BT07b] Debugging performance,fixation time and switchingfrequency
RFV restricting condition andlevel of experience
N/A
[BT07a] Fixation time and switch-ing frequency
N/A N/A
[YKM07] Accuracy, response timeand effort
Layout (Orthogonal, Three-clusterand Multiple-cluster)
N/A
[Dub09] Performance and time Code density and presence or ab-sence of grounding hints
N/A
[PBT09] Accuracy Type of eye-tracker N/A[JGSH09] Effort, Number of fixations
and fixation timeDesign (no pattern, canonical pat-tern and modified pattern) andtask (program comprehension taskand modification task)
UML Knowledge and de-sign patterns Knowledge
[PG10] Fixation time Representations of variables andTasks
JHotDraw Knowledge anddesign pattern Knowledge
[SM10b] Accuracy, time, Relevanceand visual effort
Reading behaviour N/A
[SM10a] Accuracy, Find Time andVisual Effort
Identifier style (Style) with twotreatments: camel-case or under-score
Reading Time, Expe-rience, Phrase Length,Phrase Origin and StylePreference
[BSB11] Fixation time, regressionrate, number of charactersand number of elements
Natural language or source code,and categories of words withinsource code
N/A
[ASGA12] Accuracy and fixation time Source code entities (SCEs), e.g.,class names, method names
Level of study and pro-gramming experience
[SFM12] Scan time, defect detectiontime, accuracy, and visualeffort
Defects Experience
[JN12] Speech, Selection and Gazecross-recurrence
Selection sharing N/A
[HN12] Gaze time and switchingpatterns
Programming experience, familiar-ity with jGRASP and debuggingperformance
N/A
[SSGA12] Accuracy, time (Speed),and Visual Effort
Gender and identifiers style Study level and Style pref-erence
[SSVdP+12] Accuracy, time and effort Status(practitioner, student) andExpertise (expert, novice)
Question precision (Preciseor Not precise)
[Bed12] Debugging performance,fixation time, switchingfrequency and type ofswitches
Expertise N/A
[BDL+13] Performance, time and Vi-sual Effort
Identifier Style Experience
[CTKT13] Performance and defect de-tection difficulty
Search pattern N/A
47

[DcI13] Accuracy and task comple-tion time
Visualization tool N/A
[SMS+13] Accuracy, time and effort Representation type (Graphic VS.text)
Level of study, level ofexperience in object- ori-ented modelling, level ofUML knowledge, Englishlanguage proficiency; andlinguistic distance
[SJAP13] Effectiveness (accuracy),efficiency (time), andvisual effort
3D visualization tool (SeeIT 3D,No- SeeIT 3D)
Expertise(novices and ex-perts), University (X, Y,and Z)
[CL13] Debugging performance(accuracy and reactiontime), eye gaze andmouse cursor behaviour(frequency and duration)
N/A N/A
[HLL+13] Gaze sequences Gender (male, female) and prob-lem type (Iterative, Recursive)
N/A
[TFSL14] Effectiveness (accuracy),efficiency (time), andvisual effort
Programming language (C++,Python)
Expertise
[WSSK14] Performance N/A N/A[Loh14] Performance and time Comprehension skill, expression
type, activation of the target re-lation and type of comprehensionquestions
N/A
[FBM+14] Time and effort Task difficulty N/A[DSLS+14] Time and accuracy Different variants of design pattern N/A[BSS+14] Fixation time N/A N/A[ASB+15] Number of fixations and
fixation timePerformance (effective and thenon-effective) and type of represen-tation (flowchart or pseudocode )
The content of the task(the instruction) and theanswer (selection)
[SUGGR15] Performance, accuracy andresponse time
Expertise, and type of repre-sentation( Scatter plot, Treemap,Hierarchical Dependency Graph(HDG))
N/A
[MD15][MGRB15] Inspection time and num-
ber of fixationsLevel of knowledge and Level ofpractical experience
N/A
[RLMM15] Gaze time, fixation, and re-gression counts
N/A N/A
[BBB+15] Fixation order, fixationtime and fixation location
Experience level (novice and ex-pert) and materials (natural lan-guage text or source code)
N/A
[JF15] Accuracy, completion time,and visual effort
Regularity of code(Regular vs.Non-Regular)
N/A
[BdP16] Time, Viewing Pattern syntax highlighting N/A[GWMP16] Time, Performance, Visual
EffortN/A N/A
[LWH+16] Visual attention, gazepaths
Program type (Iterative and recur-sive) and Performance (Low andhigh)
N/A
[MDPVRDVI16] Time, Performance, VisualEffort
Experience , knowledge N/A
[NHMG16] Time, Performance, VisualEffort
Experience N/A
[PLS+16] Time, Viewing Pattern Performance, Bug type N/A[BSL+17] Performance Knowledge of the language, Ex-
perience, and Familiarity with thetype of error
N/A
[DB17] Time, Viewing Pattern N/A N/A[MNH+17] Time, Performance, View-
ing PatternProgram variability (With orWithout)
N/A
[PIS17] Time, Viewing Pattern Experience , Representations(NLT or SC)
N/A
[PSGJ17] Time, Viewing Pattern Age (Kids or Teenager) N/A
48

Appendix B: Mapping Study papers[AC06] Christoph Aschwanden and Martha Crosby. Code scanning patterns in program
comprehension. In Proceedings of the 39th Hawaii International Conference on System Sci-ences, 2006.
[ASB+15] Magdalena Andrzejewska, Anna Stoli’nska, Wladyslaw Blasiak, Pawel Pkeczkowski,Roman Rosiek, Bozena Rozek, Miroslawa Sajka, and Dariusz Wcislo. Eye-tracking verificationof the strategy used to analyse algorithms expressed in a flowchart and pseudocode. InteractiveLearning Environments, pages 1–15, 2015.
[ASGA12] Nawazish Ali, Zohreh Sharafl, Y Gueheneuc, and Giuliano Antoniol. An empiricalstudy on requirements traceability using eye-tracking. In 28th IEEE International Conferenceon Software Maintenance (ICSM), pages 191–200. IEEE, 2012.
[ASGA15] Nasir Ali, Zohreh Sharafi, Yann-Ga”el Gu’eh’eneuc, and Giuliano Antoniol. Anempirical study on the importance of source code entities for requirements traceability. Empir-ical Software Engineering, 20(2):442–478, 2015.
[BBB + 15] Teresa Busjahn, Roman Bednarik, Andrew Begel, Martha Crosby, James H Pa-terson, Carsten Schulte, Bonita Sharif, and Sascha Tamm. Eye movements in code reading:relaxing the linear order. In Proceedings of the 2015 IEEE 23rd International Conference onProgram Comprehension, pages 255–265. IEEE Press, 2015.
[BDL+13] Dave Binkley, Marcia Davis, Dawn Lawrie, Jonathan I Maletic, Christopher Mor-rell, and Bonita Sharif. The impact of identifier style on effort and comprehension. EmpiricalSoftware Engineering, 18(2):219–276, 2013.
[BdP16] Tanya Beelders and Jean-Pierre du Plessis. The influence of syntax highlighting onscanning and reading behavior for source code. In Proceedings of the Annual Conference of theSouth African Institute of Computer Scientists and Information Technologists, page 5. ACM,2016.
[Bed12] Roman Bednarik. Expertise-dependent visual attention strategies develop overtime during debugging with multiple code representations. International Journal of Human-Computer Studies, 70(2):143–155, 2012.
[BMST06a] Roman Bednarik, NIKO Myller, ERKKI Sutinen, and MARKKU Tukiainen.Analyzing individual differences in program comprehension with rich data. TECHNOLOGYINSTRUCTION COGNITION AND LEARNING, 3(3/4):205-232, 2006.
[BSB11] Teresa Busjahn, Carsten Schulte, and Andreas Busjahn. Analysis of code readingto gain more insight in program comprehension. In Proceedings of the 11th Koli Calling Inter-national Conference on Computing Education Research, pages 1–9. ACM, 2011.
[BSL + 17] Titus Barik, Justin Smith, Kevin Lubick, Elisabeth Holmes, Jing Feng, EmersonMurphy-Hill, and Chris Parnin. Do developers read compiler error messages? In Proceedingsof the 39th International Conference on Software Engineering, pages 575-585. IEEE Press, 2017.
[BSS + 14] Teresa Busjahn, Carsten Schulte, Bonita Sharif, Andrew Begel, Michael Hansen,Roman Bednarik, Paul Orlov, Petri Ihantola, Galina Shchekotova, Maria Antropova, et al. Eye
49

tracking in computing education. In Proceedings of the tenth annual conference on Interna-tional computing education research, pages 3–10. ACM, 2014.
[BT04a] Roman Bednarik and Markku Tukiainen. Visual attention and representationswitching in Java program debugging: A study using eye movement tracking. In Proceed-ings of the 16th annual workshop of the Psychology of Programming Interest Group, pages159–169, 2004.
[BT04b] Roman Bednarik and Markku Tukiainen. Visual attention tracking during programdebugging. In Proceedings of the third Nordic conference on Human computer interaction,pages 331–334. ACM, 2004.
[BT07a] Roman Bednarik and Markku Tukiainen. Analysing and interpreting quantitativeeye-tracking data in studies of programming: Phases of debugging with multiple representa-tions. In Proceedings of the 19th Annual Workshop of the Psychology of Programming InterestGroup (PPIG’07), Joensuu, Finland, pages 158–172. Citeseer, 2007.
[BT07b] Roman Bednarik and Markku Tukiainen. Validating the restricted focus viewer: Astudy using eye-movement tracking. Behavior research methods, 39(2):274– 282, 2007.
[CL13] Monchu Chen and Veraneka Lim. Eye gaze and mouse cursor relationship in a debug-ging task. In HCI International 2013-Posters’ Extended Abstracts, pages 468–472. Springer,2013.
[CS90] Martha E Crosby and Jan Stelovsky. How do we read algorithms? a case study.Computer, 23(1):25–35, 1990.
[CSW02] Martha E Crosby, Jean Scholtz, and Susan Wiedenbeck. The roles beacons playin comprehension for novice and expert programmers. In 14th Workshop of the Psychology ofProgramming Interest Group, pages 58–73, 2002.
[CTKT13] Nergiz Ercil Cagiltay, Gul Tokdemir, Ozkan Kilic, and Damla Topalli. Performingand analyzing non-formal inspections of entity relationship diagram (erd). Journal of Systemsand Software, 86(8):2184–2195, 2013.
[DB17] Sarah D’Angelo and Andrew Begel. Improving communication between pair pro-grammers using shared gaze awareness. In Proceedings of the 2017 CHI Conference on HumanFactors in Computing Systems, pages 6245-6290. ACM, 2017.
[DcI13] Haci Ali Duru, Murat Perit cCakir, and Veysi Icsler. How does software visualizationcontribute to software comprehension? a grounded theory approach. International Journal ofHuman-Computer Interaction, 29(11):743–763, 2013.
[DSLS + 14] Benoit De Smet, Lorent Lempereur, Zohreh Sharafi, Yann-Ga”el Gu’eh’eneuc,Giuliano Antoniol, and Naji Habra. Taupe: Visualizing and analyzing eyetracking data. Sci-ence of Computer Programming, 79:260–278, 2014.
[Dub09] Gilles Dubochet. Computer code as a medium for human communication: Areprogramming languages improving? In Proceedings of the 21st Working Conference on thePsychology of Programmers Interest Group, number LAMP-CONF-2009-001, pages 174–187.
50

University of Limerick, 2009.
[FBM + 14] Thomas Fritz, Andrew Begel, Sebastian C M”uller, Serap Yigit-Elliott, andManuela Z”uger. Using psycho-physiological measures to assess task difficulty in software de-velopment. In Proceedings of the 36th International Conference on Software Engineering, pages402–413. ACM, 2014.
[Gu′06] Yann-Ga”el Gu’eh’eneuc. Taupe: towards understanding program comprehension.In Proceedings of the 2006 conference of the Center for Advanced Studies on Collaborativeresearch, page 1. IBM Corp., 2006.
[GWMP16] Anurag Goswami, Gursimran Walia, Mark McCourt, and Ganesh Padmanab-han. Using eye tracking to investigate reading patterns and learning styles of software require-ment inspectors to enhance inspection team outcome. In Proceedings of the 10th ACM/IEEEInternational Symposium on Empirical Software Engineering and Measurement, page 34. ACM,2016.
[HLL + 13] T.-Y. Hou, Y.-T. Lin, Y.-C. Lin, C.-H. Chang, and M.-H. Yen. Exploring thegender effect on cognitive processes in program debugging based on eye movement analysis.In CSEDU 2013 - Proceedings of the 5th International Conference on Computer SupportedEducation, pages 469–473, 2013.
[HN12] Prateek Hejmady and N Hari Narayanan. Visual attention patterns during programdebugging with an IDE. In Proceedings of the Symposium on Eye Tracking Research and Ap-plications, pages 197–200. ACM, 2012.
[JF15] Ahmad Jbara and Dror G Feitelson. How programmers read regular code: a con-trolled experiment using eye-tracking. In Proceedings of the 2015 IEEE 23rd InternationalConference on Program Comprehension, pages 244–254. IEEE Press, 2015.
[JGSH09] Sebastien Jeanmart, Yann-Gael Gueheneuc, Houari Sahraoui, and Naji Habra.Impact of the visitor pattern on program comprehension and maintenance. In Proceedings ofthe 2009 3rd International Symposium on Empirical Software Engineering and Measurement,pages 69–78. IEEE Computer Society, 2009.
[JN12] Patrick Jermann and Marc-Antoine Nussli. Effects of sharing text selections on gazecross-recurrence and interaction quality in a pair programming task. In Proceedings of theACM 2012 conference on Computer Supported Cooperative Work, pages 1125–1134. ACM,2012.
[Loh14] Sebastian Lohmeier. Activation and the comprehension of indirect anaphors in sourcecode. Proceedings 25th Annual Workshop of the Psychology of Programming Interest Group,(2007), 2014.
[LWH + 16] Yu-tzu Lin, Cheng-chih Wu, Ting-yun Hou, Yu-chih Lin, Fang-ying Yang, andChia-hu Chang. Tracking students’ cognitive processes during program debugging – an eye-movement approach. IEEE Transactions on Education, 59(3):175-186, 2016.
[MD15] Sayani Mondal and Partha Pratim Das. An ide-agnostic system to capture readingbehavior of c++ programs using eyegaze tracker. In Computer Vision, Pattern Recognition,
51

Image Processing and Graphics (NCVPRIPG), 2015 Fifth National Conference on, pages 1-4.IEEE, 2015.
[MDPV RDV I16] Ana I Molina-D’ıaz, Maximiliano Paredes-Velasco, Miguel A Redondo-Duque, and Jes’us Angel Vel’azquez-Iturbide. Evaluation experiences of the representationtechniques of greedy programs: Application to the greedex tool. IEEE Revista Iberoamericanade Tecnologias del Aprendizaje, 11(3):179-186, 2016.
[MGRB15] Ana Isabel Molina, Jes’us Gallardo, Miguel ’Angel Redondo, and CrescencioBravo. Assessing the awareness mechanisms of a collaborative programming support system.Dyna, 82(193):212–222, 2015.
[MNH + 17] Jean Melo, Fabricio Batista Narcizo, Dan Witzner Hansen, Claus Brabrand,and Andrzej Wasowski. Variability through the eyes of the programmer. In Proceedings of the25th International Conference on Program Comprehension, pages 34-44. IEEE Press, 2017.
[NHMG16] Markus Nivala, Florian Hauser, J’urgen Mottok, and Hans Gruber. Developingvisual expertise in software engineering: An eye tracking study. In Global Engineering Educa-tion Conference (EDUCON), 2016 IEEE, pages 613-620. IEEE, 2016.
[NS04] Seppo Nevalainen and Jorma Sajaniemi. Comparison of three eye-tracking devices inpsychology of programming research. 6th Annual Psychology of Programming Interest Group,pages 170–184, 2004.
[NS05] Seppo Nevalainen and Jorma Sajaniemi. Short-term effects of graphical versus tex-tual visualisation of variables on program perception. 17th Annual Psychology of ProgrammingInterest Group Worskhop, pages 77–91, 2005.
[NS06] Seppo Nevalainen and Jorma Sajaniemi. An experiment on short-term effects ofanimated versus static visualization of operations on program perception. In Proceedings ofthe Second International Workshop on Computing Education Research, ICER ’06, pages 7–16,New York, NY, USA, 2006. ACM.
[PBT09] Sami Pietinen, Roman Bednarik, and Markku Tukiainen. An exploration of sharedvisual attention in collaborative programming. In 21st Annual Psychology of ProgrammingInterest Group Conference, PPIG, 2009.
[PG10] Gerardo Cepeda Porras and Yann-Ga”el Gu’eh’eneuc. An empirical study on theefficiency of different design pattern representations in uml class diagrams. Empirical SoftwareEngineering, 15(5):493–522, 2010.
[PLS + 16] Fei Peng, Chunyu Li, Xiaohan Song, Wei Hu, and Guihuan Feng. An eye track-ing research on debugging strategies towards different types of bugs. In Computer Softwareand Applications Conference (COMPSAC), 2016 IEEE 40th Annual, volume 2, pages 130-134.IEEE, 2016
[PIS17] Patrick Peachock, Nicholas Iovino, and Bonita Sharif. 2017. Investigating Eye Move-ments in Natural Language and C++ Source Code - A Replication Experiment. AugmentedCognition. Neurocognition and Machine Learning: 11th International Conference, AC 2017,Held as Part of HCI International 2017, Vancouver, BC, Canada, July 9-14, pages 206-218,
52

Springer International Publishing, 2017.
[PSGJ17] Sofia Papavlasopoulou, Kshitij Sharma, Michail Giannakos, and Letizia Jaccheri.Using eye-tracking to unveil differences between kids and teens in coding activities. In Pro-ceedings of the 2017 Conference on Interaction Design and Children, pages 171-181. ACM, 2017.
[RBCL03] Pablo Romero, Benedict Boulay, Richard Cox, and Rudi Lutz. Java debuggingstrategies in multi-representational environments. Psychology of Programming Languages In-terest Group, pages 1–14, 2003.
[RCdBL02] Pablo Romero, Richard Cox, Benedict du Boulay, and Rudi Lutz. Visual atten-tion and representation switching during Java program debugging: A study using the restrictedfocus viewer. In Diagrammatic Representation and Inference, pages 221–235. Springer, 2002.
[RLCdB02] P. Romero, R. Lutz, R. Cox, and B. du Boulay. Co-ordination of multiple exter-nal representations during Java program debugging. In Human Centric Computing Languagesand Environments, 2002. Proceedings. IEEE 2002 Symposia on, pages 207–214, 2002.
[RLMM15] P. Rodeghero, Cheng Liu, P.W. McBurney, and C. McMillan. An eye-trackingstudy of Java programmers and application to source code summarization. Software Engineer-ing, IEEE Transactions on, 41(11):1038–1054, Nov 2015.
[SB04] Randy Stein and Susan E. Brennan. Another person’s eye gaze as a cue in solvingprogramming problems. In Proceedings of the 6th International Conference on MultimodalInterfaces, ICMI ’04, pages 9–15, New York, NY, USA, 2004. ACM.
[SFM12] Bonita Sharif, Michael Falcone, and Jonathan I. Maletic. An eye-tracking study onthe role of scan time in finding source code defects. In Proceedings of the Symposium on EyeTracking Research and Applications, ETRA ’12, pages 381–384, New York, NY, USA, 2012.ACM.
[SJAP13] B. Sharif, G. Jetty, J. Aponte, and E. Parra. An empirical study assessing theeffect of seeit 3d on comprehension. In Software Visualization (VISSOFT), 2013 First IEEEWorking Conference on, pages 1–10, Sept 2013.
[SM10a] B. Sharif and J.I. Maletic. An eye-tracking study on camel-case and under scoreidentifier styles. In Program Comprehension (ICPC), 2010 IEEE 18th International Conferenceon, pages 196–205, June 2010.
[SM10b] B. Sharif and J.I. Maletic. An eye-tracking study on the effects of layout in under-standing the role of design patterns. In Software Maintenance (ICSM), 2010 IEEE InternationalConference on, pages 1–10, Sept 2010.
[SMS + 13] Z. Sharafi, A. Marchetto, A. Susi, G. Antoniol, and Y.-G. Gueheneuc. Anempirical study on the efficiency of graphical vs. textual representations in requirements com-prehension. In Program Comprehension (ICPC), 2013 IEEE 21st International Conference on,pages 33–42, May 2013.
[SSGA12] Z. Sharafi, Z. Soh, Y. Gueheneuc, and G. Antoniol. Women and men- differentbut equal: On the impact of identifier style on source code reading. In Program Comprehension
53

(ICPC), 2012 IEEE 20th International Conference on, pages 27–36, June 2012.
[SSV dP + 12] Z. Soh, Z. Sharafi, B. Van den Plas, G.C. Porras, Y. Gueheneuc, and G. An-toniol. Professional status and expertise for uml class diagram comprehension: An empiricalstudy. In Program Comprehension (ICPC), 2012 IEEE 20th International Conference on, pages163–172, June 2012.
[SUGGR15] M. Sami Uddin, V. Gaur, C. Gutwin, and C.K. Roy. On the comprehension ofcode clone visualizations: A controlled study using eye-tracking. In Source Code Analysis andManipulation (SCAM), 2015 IEEE 15th International Working Conference on, pages 161–170,Sept 2015.
[TFSL14] Rachel Turner, Michael Falcone, Bonita Sharif, and Alina Lazar. An eyetrackingstudy assessing the comprehension of c++ and python source code. In Proceedings of theSymposium on Eye Tracking Research and Applications, ETRA ’14, pages 231–234, New York,NY, USA, 2014. ACM.
[UNMM06] Hidetake Uwano, Masahide Nakamura, Akito Monden, and Ken-ichi Matsumoto.Analyzing individual performance of source code review using reviewers’ eye movement. In Pro-ceedings of the 2006 Symposium on Eye Tracking Research & Applications, ETRA ’06, pages133–140, New York, NY, USA, 2006.ACM.
[WSSK14] Braden Walters, Timothy Shaffer, Bonita Sharif, and Huzefa Kagdi. Capturingsoftware traceability links from developers’ eye gazes. In Proceedings of the 22Nd InternationalConference on Program Comprehension, ICPC 2014, pages 201–204, New York, NY, USA,2014. ACM.
[Y KM07] S. Yusuf, H. Kagdi, and J.I. Maletic. Assessing the comprehension of uml classdiagrams via eye-tracking. In Program Comprehension, 2007. ICPC ’07. 15th IEEE Interna-tional Conference on, pages 113–122, June 2007.
AcknowledgementThe authors would like to thank the reviewers and associate editor for their comments whichimproved this manuscript. This work is supported by the University of Malaya and Ministryof Higher Education, Malaysia, under grants, FP062-2014A and RP030C-14AET.
ReferencesNasir Ali, Zohreh Sharafi, Yann-Gael Gueheneuc, and Giuliano Antoniol. 2015. An empirical
study on the importance of source code entities for requirements traceability. EmpiricalSoftware Engineering 20, 2 (2015), 442–478.
Lorin W Anderson, David R Krathwohl, and Benjamin Samuel Bloom. 2001. A taxonomy forlearning, teaching, and assessing: A revision of Bloom’s taxonomy of educational objectives.Allyn & Bacon.
Magdalena Andrzejewska, Anna Stoli’nska, Wladyslaw Blasiak, Pawel Pkeczkowski, RomanRosiek, Bozena Rozek, Miroslawa Sajka, and Dariusz Wcislo. 2016. Eye-tracking verifica-
54

tion of the strategy used to analyse algorithms expressed in a flowchart and pseudocode.Interactive Learning Environments 24, 8 (2016), 1981–1995.
Stuart Charters Barbara Kitchenham. 2007. Guidelines for performing systematic literaturereviews in software engineering. Technical Report. Keele University and Durham UniversityJoint Report.
Roman Bednarik, Teresa Busjahn, and Carsten (Eds.) Schulte. 2014. Eye movements in pro-gramming education: Analyzing the expert’s gaze. Technical Report. University of EasternFinland, Joensuu, Finland.
Roman Bednarik, Niko Myller, Erkki Sutinen, and Markku Tukiainen. 2005a. Applying eye-movememt tracking to program visualization. In Visual Languages and Human-Centric Com-puting, 2005 IEEE Symposium on. IEEE, 302–304.
Roman Bednarik, Niko Myller, Erkki Sutinen, and Markku Tukiainen. 2005b. Effects of expe-rience on gaze behaviour during program animation. In 17th Annual Psychology of Program-ming Interest Group Workshop. 49–61.
Roman Bednarik, Niko Myller, Erkki Sutinen, and Markku Tukiainen. 2006a. Analyzing indi-vidual differences in program comprehension. Technology, Instruction, Cognition and Learn-ing 3, 3/4 (2006), 205.
Roman Bednarik, Niko Myller, Erkki Sutinen, and Markku Tukiainen. 2006b. Program visual-ization: Comparing eye-tracking patterns with comprehension summaries and performance.In Proceedings of the 18th Annual Psychology of Programming Workshop. 66–82.
Roman Bednarik and Markku Tukiainen. 2004a. Visual attention and representation switchingin Java program debugging: A study using eye movement tracking. In Proceedings of the 16thannual workshop of the Psychology of Programming Interest Group. 159–169.
Roman Bednarik and Markku Tukiainen. 2004b. Visual attention tracking during programdebugging. In Proceedings of the third Nordic conference on Human-computer interaction.ACM, 331–334.
Roman Bednarik and Markku Tukiainen. 2005. Effects of display blurring on the behaviorof novices and experts during program debugging. In CHI’05 Extended abstracts on humanfactors in computing systems. ACM, 1204–1207.
Roman Bednarik and Markku Tukiainen. 2006. An eye-tracking methodology for characterizingprogram comprehension processes. In Proceedings of the 2006 symposium on Eye trackingresearch & applications. ACM, 125–132.
Roman Bednarik and Markku Tukiainen. 2007a. Analysing and Interpreting Quantitative Eye-Tracking Data in Studies of Programming: Phases of Debugging with Multiple Representa-tions. In Proceedings of the 19th Annual Workshop of the Psychology of Programming InterestGroup (PPIG’07), Joensuu, Finland. Citeseer, 158–172.
Roman Bednarik and Markku Tukiainen. 2007b. Validating the restricted focus viewer: Astudy using eye-movement tracking. Behavior research methods 39, 2 (2007), 274–282.
Roman Bednarik and Markku Tukiainen. 2008. Temporal eye-tracking data: evolution ofdebugging strategies with multiple representations. In Proceedings of the 2008 symposium onEye tracking research & applications. ACM, 99–102.
55

Mordechai Ben-Ari, Roman Bednarik, Ronit Ben-Bassat Levy, Gil Ebel, Andres Moreno, NikoMyller, and Erkki Sutinen. 2011. A decade of research and development on program an-imation: The Jeliot experience. Journal of Visual Languages & Computing 22, 5 (2011),375–384.
Alan F Blackwell, Anthony R Jansen, and Kim Marriott. 2000. Restricted focus viewer: a toolfor tracking visual attention. In Theory and application of diagrams. Springer, 162–177.
Crescencio Bravo, Rafael Duque, and JesuS Gallardo. 2013. A groupware system to supportcollaborative programming: Design and experiences. Journal of Systems and Software 86, 7(2013), 1759–1771.
Teresa Busjahn, Roman Bednarik, Andrew Begel, Martha Crosby, James H Paterson, CarstenSchulte, Bonita Sharif, and Sascha Tamm. 2015a. Eye movements in code reading: relaxingthe linear order. In Proceedings of the 2015 IEEE 23rd International Conference on ProgramComprehension. IEEE Press, 255–265.
Teresa Busjahn, Roman Bednarik, and Carsten Schulte. 2014a. What influences dwell timeduring source code reading?: analysis of element type and frequency as factors. In Proceedingsof the Symposium on Eye Tracking Research and Applications. ACM, 335–338.
Teresa Busjahn, Carsten Schulte, and Andreas Busjahn. 2011. Analysis of code reading to gainmore insight in program comprehension. In Proceedings of the 11th Koli Calling InternationalConference on Computing Education Research. ACM, 1–9.
Teresa Busjahn, Carsten Schulte, Bonita Sharif, Andrew Begel, Michael Hansen, Roman Bed-narik, Paul Orlov, Petri Ihantola, Galina Shchekotova, Maria Antropova, et al. 2014b. Eyetracking in computing education. In Proceedings of the tenth annual conference on Interna-tional computing education research. ACM, 3–10.
Teresa Busjahn, Carsten Schulte, Sascha Tamm, and Roman (Eds.) Bednarik. 2015b. EyeMovements in Programming Education II : Analyzing the Novice’s Gaze. Technical Report.Freie Universitat Berlin, Department of Mathematics and Computer Science, Berlin, Ger-many. 1–41 pages.
Zoya Bylinskii, Michelle A Borkin, Nam Wook Kim, Hanspeter Pfister, and Aude Oliva. 2015.Eye fixation metrics for large scale evaluation and comparison of information visualizations.In Workshop on Eye Tracking and Visualization. Springer, 235–255.
Martha E Crosby and Jan Stelovsky. 1990. How do we read algorithms? A case study. Computer23, 1 (1990), 25–35.
Sarah D’Angelo and Andrew Begel. 2017. Improving Communication Between Pair Program-mers Using Shared Gaze Awareness. In Proceedings of the 2017 CHI Conference on HumanFactors in Computing Systems. ACM, 6245–6290.
Benoit De Smet, Lorent Lempereur, Zohreh Sharafi, Yann-Ga”el Gu’eh’eneuc, Giuliano Anto-niol, and Naji Habra. 2014. Taupe: Visualizing and analyzing eye-tracking data. Science ofComputer Programming 79 (2014), 260–278.
Fadi P Deek and James A McHugh. 1998. A survey and critical analysis of tools for learningprogramming. Computer Science Education 8, 2 (1998), 130–178.
56

Tore Dyba, Torgeir Dingsoyr, and Geir K Hanssen. 2007. Applying systematic reviews to diversestudy types: An experience report. In Empirical Software Engineering and Measurement,2007. ESEM 2007. First International Symposium on. IEEE, 225–234.
Joseph H Goldberg and Xerxes P Kotval. 1999. Computer interface evaluation using eye move-ments: methods and constructs. International Journal of Industrial Ergonomics 24, 6 (1999),631–645.
Anabela Gomes and Antonio Jose Mendes. 2007a. An environment to improve programmingeducation. In Proceedings of the 2007 international conference on Computer systems andtechnologies. ACM, 88.
Anabela Gomes and Antonio Jose Mendes. 2007b. Learning to program-difficulties and solu-tions. In International Conference on Engineering Education–ICEE, Vol. 2007.
Yann-Gael Gu’eh’eneuc, Huzefa Kagdi, and Jonathan I Maletic. 2009. Working session: Us-ing eye-tracking to understand program comprehension. In Program Comprehension, 2009.ICPC’09. IEEE 17th International Conference on. IEEE, 278–279.
Victor Henning and Jan Reichelt. 2008. Mendeley-A Last. fm For Research?. In eScience, 2008.eScience\’08. IEEE Fourth International Conference on. IEEE, 327–328.
Ahmad Jbara and Dror G Feitelson. 2015. How programmers read regular code: a controlledexperiment using eye tracking. In Proceedings of the 2015 IEEE 23rd International Conferenceon Program Comprehension. IEEE Press, 244–254.
Tomoko Kashima, Shimpei Matsumoto, and Shuichi Yamagishi. 2014. Proposal of a Methodto Measure Difficulty Level of Programming Code with Eye-Tracking. In Human-ComputerInteraction. Advanced Interaction Modalities and Techniques. Springer, 264–272.
Barbara Kitchenham and Pearl Brereton. 2013. A systematic review of systematic reviewprocess research in software engineering. Information and software technology 55, 12 (2013),2049–2075.
Barbara A Kitchenham, Shari Lawrence Pfleeger, Lesley M Pickard, Peter W Jones, David C.Hoaglin, Khaled El Emam, and Jarrett Rosenberg. 2002. Preliminary guidelines for empiricalresearch in software engineering. IEEE Transactions on software engineering 28, 8 (2002),721–734.
Tomasz Kocejko, Jacek Ruminski, Adam Bujnowski, and Jerzy Wtorek. 2016. The evaluationof eGlasses eye tracking module as an extension for Scratch. In Human System Interactions(HSI), 2016 9th International Conference on. IEEE, 465–471.
Martin Konopka. 2015. Combining eye tracking with navigation paths for identification of cross-language code dependencies. In Proceedings of the 2015 10th Joint Meeting on Foundationsof Software Engineering. ACM, 1057–1059.
Meng-Lung Lai, Meng-Jung Tsai, Fang-Ying Yang, Chung-Yuan Hsu, Tzu-Chien Liu, SilviaWen-Yu Lee, Min-Hsien Lee, Guo-Li Chiou, Jyh-Chong Liang, and Chin-Chung Tsai. 2013. Areview of using eye-tracking technology in exploring learning from 2000 to 2012. EducationalResearch Review 10 (2013), 90–115.
Iain Milne and Glenn Rowe. 2002. Difficulties in learning and teaching programming—viewsof students and tutors. Education and Information technologies 7, 1 (2002), 55–66.
57

David Montano, Jairo Aponte, and Andrian Marcus. 2009. Sv3D meets Eclipse. In VisualizingSoftware for Understanding and Analysis, 2009. VISSOFT 2009. 5th IEEE InternationalWorkshop on. IEEE, 51–54.
IT Chan Mow. 2008. Issues and difficulties in teaching novice computer programming. In Inno-vative techniques in instruction technology, e-learning, e-assessment, and education. Springer,199–204.
Gail C Murphy, Mik Kersten, and Leah Findlater. 2006. How are Java software developersusing the Elipse IDE? Software, IEEE 23, 4 (2006), 76–83.
Seppo Nevalainen and Jorma Sajaniemi. 2004. Comparison of three eye tracking devices inpsychology of programming research. In 16th Annual Psychology of Programming InterestGroup Workshop. Citeseer, 151–158.
Christopher Palmer and Bonita Sharif. 2016. Towards automating fixation correction for sourcecode. In Proceedings of the Ninth Biennial ACM Symposium on Eye Tracking Research &Applications. ACM, 65–68.
Oren Patashnik. 8 February 1988. BibTeXing. documentation for general BibTeX users. Elec-tronic document accompanying BibTeX distribution (8 February 1988).
Patrick Peachock, Nicholas Iovino, and Bonita Sharif. 2017. Investigating Eye Movements inNatural Language and C++ Source Code - A Replication Experiment. Springer InternationalPublishing, Cham, 206–218. https://doi.org/10.1007/978-3-319-58628-1_17
Kai Petersen, Robert Feldt, Shahid Mujtaba, and Michael Mattsson. 2008. Systematic MappingStudies in Software Engineering.. In EASE, Vol. 8. 68–77.
Kai Petersen, Sairam Vakkalanka, and Ludwik Kuzniarz. 2015. Guidelines for conductingsystematic mapping studies in software engineering: An update. Information and SoftwareTechnology 64 (2015), 1–18.
Razvan Petrusel and Jan Mendling. 2013. Eye-tracking the factors of process model compre-hension tasks. In Advanced Information Systems Engineering. Springer, 224–239.
Sami Pietinen, Roman Bednarik, Tatiana Glotova, Vesa Tenhunen, and Markku Tukiainen.2008. A Method to Study Visual Attention Aspects of Collaboration: Eye-tracking Pair Pro-grammers Simultaneously. In Proceedings of the 2008 Symposium on Eye Tracking Research& Applications (ETRA ’08). ACM, New York, NY, USA, 39–42. https://doi.org/10.1145/1344471.1344480
Sami Pietinen, Roman Bednarik, and Markku Tukiainen. 2010. Shared Visual Attention inCollaborative Programming: A Descriptive Analysis. In Proceedings of the 2010 ICSE Work-shop on Cooperative and Human Aspects of Software Engineering (CHASE ’10). ACM, NewYork, NY, USA, 21–24. https://doi.org/10.1145/1833310.1833314
Gerardo Cepeda Porras and Yann-Ga”el Gu’eh’eneuc. 2010. An empirical study on the effi-ciency of different design pattern representations in UML class diagrams. Empirical SoftwareEngineering 15, 5 (2010), 493–522.
Keith Rayner. 1998. Eye movements in reading and information processing: 20 years of research.Psychological bulletin 124, 3 (1998), 372.
58

Keith Rayner. 2009. Eye movements and attention in reading, scene perception, and visualsearch. The quarterly journal of experimental psychology 62, 8 (2009), 1457–1506.
V Renumol, S Jayaprakash, and D Janakiram. 2009. Classification of cognitive difficulties ofstudents to learn computer programming. Indian Institute of Technology, India (2009).
Mitchel Resnick, John Maloney, Andres Monroy-Hernandez, Natalie Rusk, Evelyn Eastmond,Karen Brennan, Amon Millner, Eric Rosenbaum, Jay Silver, Brian Silverman, et al. 2009.Scratch: programming for all. Commun. ACM 52, 11 (2009), 60–67.
Paige Rodeghero and Collin McMillan. 2015. An Empirical Study on the Patterns of EyeMovement during Summarization Tasks. In Empirical Software Engineering and Measure-ment (ESEM), 2015 ACM/IEEE International Symposium on. 1–10. https://doi.org/10.1109/ESEM.2015.7321188
Paige Rodeghero, Collin McMillan, Paul W. McBurney, Nigel Bosch, and Sidney D’Mello. 2014.Improving Automated Source Code Summarization via an Eye-tracking Study of Program-mers. In Proceedings of the 36th International Conference on Software Engineering (ICSE2014). ACM, New York, NY, USA, 390–401. https://doi.org/10.1145/2568225.2568247
Pablo Romero, Benedict Boulay, Richard Cox, and Rudi Lutz. 2003. Java debugging strategiesin multi-representational environments. In 15th Annual Psychology of Programming InterestGroup Workshop. 421–435.
Md. Sami Uddin, Varun Gaur, Carl Gutwin, and Chanchal K. Roy. 2015. On the comprehensionof code clone visualizations: A controlled study using eye tracking. In Source Code Analysisand Manipulation (SCAM), 2015 IEEE 15th International Working Conference on. 161–170.https://doi.org/10.1109/SCAM.2015.7335412
Zohreh Sharafi. 2011. A Systematic Analysis of Software Architecture Visualization Techniques.In Program Comprehension (ICPC), 2011 IEEE 19th International Conference on. 254–257.https://doi.org/10.1109/ICPC.2011.40
Zohreh Sharafi, A. Marchetto, A. Susi, G. Antoniol, and Yann-Gael Gueheneuc. 2013. Anempirical study on the efficiency of graphical vs. textual representations in requirementscomprehension. In Program Comprehension (ICPC), 2013 IEEE 21st International Confer-ence on. 33–42. https://doi.org/10.1109/ICPC.2013.6613831
Zohreh Sharafi, Zephyrin Soh, and Yann-Gael Gueheneuc. 2015. A systematic literature reviewon the usage of eye-tracking in software engineering. Information and Software Technology67 (2015), 79–107.
Zohreh Sharafi, Zephyrin Soh, Yann-Gael Gueheneuc, and G. Antoniol. 2012. Women and men-Different but equal: On the impact of identifier style on source code reading. In ProgramComprehension (ICPC), 2012 IEEE 20th International Conference on. 27–36. https://doi.org/10.1109/ICPC.2012.6240505
Bonita Sharif, Michael Falcone, and Jonathan I. Maletic. 2012. An Eye-tracking Study on theRole of Scan Time in Finding Source Code Defects. In Proceedings of the Symposium onEye Tracking Research and Applications (ETRA ’12). ACM, New York, NY, USA, 381–384.https://doi.org/10.1145/2168556.2168642
Bonita Sharif, G. Jetty, J. Aponte, and E. Parra. 2013. An empirical study assessing theeffect of seeit 3D on comprehension. In Software Visualization (VISSOFT), 2013 First IEEEWorking Conference on. 1–10. https://doi.org/10.1109/VISSOFT.2013.6650519
59

Bonita Sharif and Huzefa Kagdi. 2011. On the Use of Eye Tracking in Software Traceability. InProceedings of the 6th International Workshop on Traceability in Emerging Forms of SoftwareEngineering (TEFSE ’11). ACM, New York, NY, USA, 67–70. https://doi.org/10.1145/1987856.1987872
Bonita Sharif and Jonathan I Maletic. 2010a. An Eye Tracking Study on camelCase and un-der score Identifier Styles. In Program Comprehension (ICPC), 2010 IEEE 18th InternationalConference on. 196–205. https://doi.org/10.1109/ICPC.2010.41
Bonita Sharif and Jonathan I Maletic. 2010b. An eye tracking study on the effects of layoutin understanding the role of design patterns. In Software Maintenance (ICSM), 2010 IEEEInternational Conference on. 1–10. https://doi.org/10.1109/ICSM.2010.5609582
Kshitij Sharma, Patrick Jermann, Marc-Antoine N”ussli, and Pierre Dillenbourg. 2013. Under-standing collaborative program comprehension: Interlacing gaze and dialogues. In ComputerSupported Collaborative Learning (CSCL 2013).
Judy Sheard, S Simon, Margaret Hamilton, and Jan Lonnberg. 2009. Analysis of research intothe teaching and learning of programming. In Proceedings of the fifth international workshopon Computing education research workshop. ACM, 93–104.
Dag IK Sjøberg, Jo Erskine Hannay, Ove Hansen, Vigdis By Kampenes, Amela Karahasanovic,N-K Liborg, and Anette C Rekdal. 2005. A survey of controlled experiments in softwareengineering. IEEE transactions on software engineering 31, 9 (2005), 733–753.
Zephyrin Soh. 2011. Context and Vision: Studying Two Factors Impacting Program Compre-hension. In Program Comprehension (ICPC), 2011 IEEE 19th International Conference on.258–261. https://doi.org/10.1109/ICPC.2011.37
Zephyrin Soh, Zohreh Sharafi, Bertrand Van den Plas, Gerardo Cepeda Porras, Yann-GaelGueheneuc, and Giuliano Antoniol. 2012. Professional status and expertise for UML classdiagram comprehension: An empirical study. In Program Comprehension (ICPC), 2012IEEE 20th International Conference on. 163–172. https://doi.org/10.1109/ICPC.2012.6240484
Koji Torii, Ken-ichi Matsumoto, Kumiyo Nakakoji, Yoshihiro Takada, Shingo Takada, andKazuyuki Shima. 1999. Ginger2: an environment for computer-aided empirical softwareengineering. Software Engineering, IEEE Transactions on 25, 4 (Jul 1999), 474–492. https://doi.org/10.1109/32.799942
Rachel Turner, Michael Falcone, Bonita Sharif, and Alina Lazar. 2014. An Eye-tracking StudyAssessing the Comprehension of C++ and Python Source Code. In Proceedings of the Sym-posium on Eye Tracking Research and Applications (ETRA ’14). ACM, New York, NY, USA,231–234. https://doi.org/10.1145/2578153.2578218
Hidetake Uwano, Akito Monden, and Ken-ichi Matsumoto. 2008. DRESREM 2: An AnalysisSystem for Multi-document Software Review Using Reviewers’ Eye Movements. In SoftwareEngineering Advances, 2008. ICSEA ’08. The Third International Conference on. 177–183.https://doi.org/10.1109/ICSEA.2008.49
Hidetake Uwano, Masahide Nakamura, Akito Monden, and Ken-ichi Matsumoto. 2007. Ex-ploiting eye movements for evaluating reviewer’s performance in software review. IEICETransactions on Fundamentals of Electronics, Communications and Computer Sciences 90,10 (2007), 2290–2300.
60

Johannes Zagermann, Ulrike Pfeil, and Harald Reiterer. 2016. Measuring Cognitive Load usingEye Tracking Technology in Visual Computing. In BELIV’16: Proceedings of the Sixth Work-shop on Beyond Time and Errors on Novel Evaluation Methods for Visualization. 78–85.
61