a survey of the nigerian middle class - fastest billion · a survey of the nigerian middle class ....
TRANSCRIPT

StrategyNigeria
Thematic research26 September 2011
Important disclosures are found at the Disclosures Appendix. Communicated by Renaissance Securities (Cyprus) Limited, regulated by the Cyprus Securities & Exchange Commission, which together with non-US affiliates operates outside of the USA under the brand name of Renaissance Capital.
Charles Robertson+44 (207) [email protected]
Nothando Ndebele+27 (11) [email protected]
Yvonne Mhango+27 (11) [email protected]
A survey of the Nigerian middle class

2
Renaissance Capital A survey of the Nigerian middle class 26 September 2011
Executive summary 3
Investment implications 8
Nigeria: Basic facts 11
Sample distribution 12
Households 13
Profile: The Nigerian middle class 15
Finances 23
Lifestyle 30
Consumer patterns 33
Media 34
Disclosures appendix 35
Contents

3
Renaissance Capital A survey of the Nigerian middle class 26 September 2011
Nigeria‟s GDP rose fivefold from $46bn in 2000 to $247bn in 2011, according to IMF
estimates, while the population has increased by over a third over the same period,
from 119mn to 160mn. The magnitude of the increase in Nigeria‟s population
between now and 2016 is the equivalent of adding another Romania; while, based
on cautious IMF forecasts, the increase in Nigeria‟s GDP in five years will be
equivalent to the addition of another Vietnam or Bangladesh. Nigeria‟s per capita
GDP at market exchange rates has already increased from $390 in 2001 to $1,541
in 2011 based on IMF figures, and will reach nearly $2,000 in 2016 if the pessimistic
IMF forecasts are accurate, or $2,500 in our more benign scenario. This tremendous
growth story has encouraged us to conduct a survey of the booming Nigerian middle
class, and we hope you find the results as interesting as we do.
This study was conducted with 1,004 middle-class Nigerians, of which 70% were
aged 40 or younger. The participants resided in the cities of Lagos, Abuja and Port
Harcourt. Our findings about the Nigerian middle class are summarised below:
Their average monthly income is in the range NGN75,000-100,000 ($480-
645, or roughly $6,000-7,000 pa).
The middle class make up about 23% of the Nigerian population, according
to African Development Bank (AfDB) data.
They are well educated – 92% have obtained post-secondary education or
have studied at an institution of higher learning. Educating their children
well is a top priority, and over half send their children abroad to complete
their education.
A sizeable 76% of our sample work in the public sector; of those working in
the private sector, 38% run their own businesses.
Most live in leased/rented accommodation (68%) with an average
household size of 3.7 people. The average number of children in each
household is 1.6 (excluding those away at school) vs a national average
that is closer to 3; larger families are more common in rural areas.
Nearly half have no immediate plan to move house, 18% are planning to
move to a newly completed self-owned apartment and 8% are planning to
move to another rented apartment.
The average number of cars per middle-class household is 0.8 (around one
third of middle-class Nigerians have a car that is less than five years old);
5% of homes have two cars. Car ownership remains well below levels seen
in Zimbabwe, among others.
The Nigerian middle class have a culture of saving, they care little about
the deposit rate and don‟t expect to borrow from a bank. If they had the
funds, they would rather invest in land/property than shares or bonds. Most
do not have mortgages (which represent approximately 1% of GDP) or
credit cards, though many expect to apply for the latter. As in many
emerging markets, the consumer lending sector is woefully
underdeveloped.
Executive summary

4
Renaissance Capital A survey of the Nigerian middle class 26 September 2011
Their principal sources of information are TV and radio. Forty-eight percent
have internet access, but only 2% shop online at least once a month. There
is huge scope for internet shopping, if logistics allow.
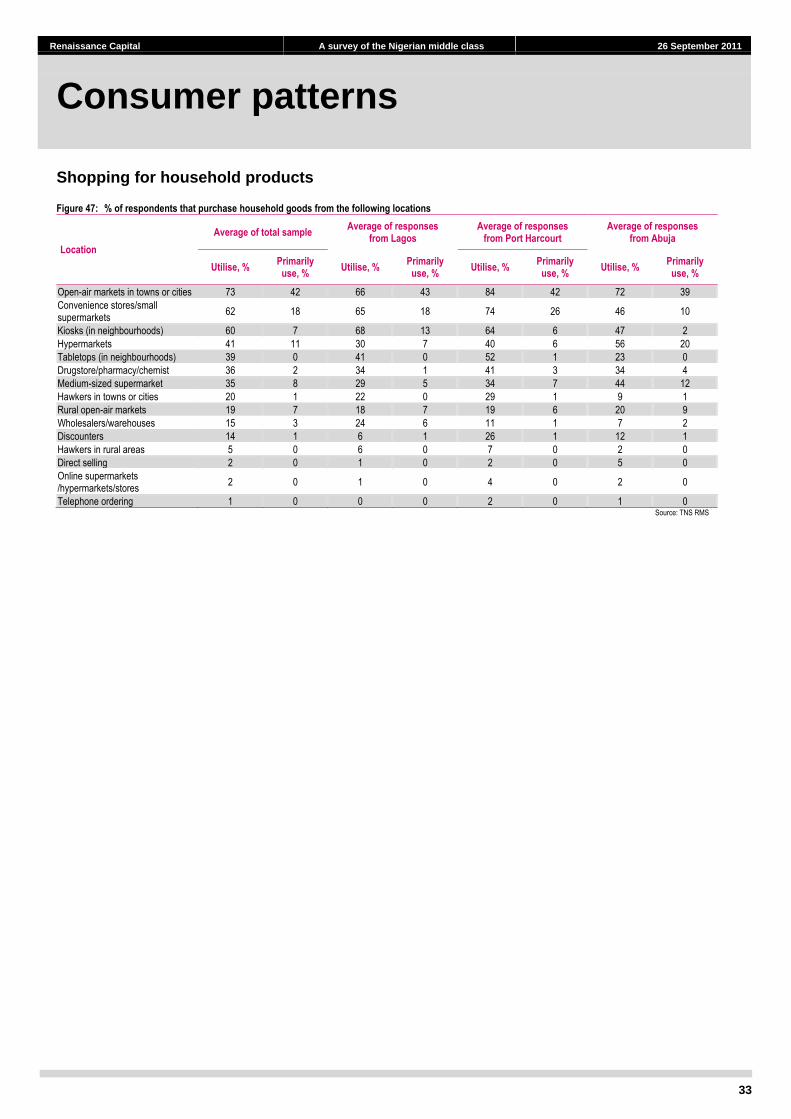
The majority shop at open-air markets (73%), as well as use convenience
stores (62%). Twenty percent dine out at least once a week.
Only 15% have travelled abroad; 35% of households have at least one
person with an international passport. The UK is the most favoured travel
destination.
Their key areas of concern over the next 12 months are the supply of
electricity and unemployment, with between 19-23% citing these as
concerns; while crime (5%) and corruption (3.5%) are seen as far less
concerning.
Three-quarters are optimistic about the future of Nigeria.
A startling 96% of respondents are religious, and the third most cited
reason for optimism about Nigeria‟s future is that God will make it better.
The Macro backdrop
The Nigerian boom has seen the economy quadruple in size since 2000. Growth
has averaged 8.6% over 2000-2011. In line with typical economist forecasts, the IMF
assumes a modest slowdown towards 6.0% growth by 2015-2016, and they expect
nominal naira GDP growth to half from 23% over 2000-2011 to just 12% over 2012-
2016. These (somewhat pessimistic, in our view) forecasts suggest GDP will have
nearly doubled from $203bn in 2010 to $359bn by 2016.
Figure 1: GDP % change and GDP per capita ($) in current prices; arrows represent our more benign scenario
Source: IMF, Renaissance Capital estimates
-
500
1,000
1,500
2,000
2,500
0%
5%
10%
15%
20%
25%
2000
2001
2002
2003
2004
2005
2006
2007
2008
2009
2010
2011
2012
2013
2014
2015
2016
GDP % pc GDP per capita

5
Renaissance Capital A survey of the Nigerian middle class 26 September 2011
Figure 2: Using Japan urbanisation data for 1950-2010, we can see how others countries compare
Source: UN
We disagree with the IMF forecast. Nigeria‟s urbanisation rate is now at around
50%, which is halfway through the period when GDP growth tends to be at its most
rapid (from 40-60%). We think the plans to improve electricity generation and
transmission could help GDP growth accelerate in the coming years. We would not
be surprised if Nigeria is achieving double-digit real GDP growth on a sustained
basis, and nominal GDP growth of 15-25%, by 2015-2016. A $247bn economy in
2011 could be a $460bn economy by 2016, assuming nominal GDP growth of 20%
and a naira/dollar exchange rate of NGN155/$1. The opportunities this provides to
investors are dramatic.
Per capita GDP at market exchange rates has already soared from just $361 in
2001 to $1,541 by 2011, based on IMF data. The population has boomed too, from
119mn in 2000 to 160mn in 2011, and the IMF expects this to rise to 184mn by
2016. Based on the IMF‟s pessimistic numbers, per capita GDP will rise by another
third to $1,957 over the next five years, but we forecast a rise to $2,500 in 2016
under our more positive scenario.
0%
10%
20%
30%
40%
50%
60%
70%
80%
90%
1855
1860
1865
1870
1875
1880
1885
1890
1895
1900
1905
1910
1915
1920
1925
1930
1935
1940
1945
1950
1955
1960
1965
1970
1975
1980
1985
1990
1995
2000
2005
2010
Japan Sth Korea 1950-2010 Vietnam 1950-2010 Philippines 1950-2010
China 1950-2010 India 1950-2010 Turkey 1950-2010 Nigeria 1950-2010
Kenya 1950-2010 Ethiopia 1950-2010 Ghana 1950-2010

6
Renaissance Capital A survey of the Nigerian middle class 26 September 2011
Figure 3: GDP ($bn; lhs) and population (mn; rhs); arrow represents our forecast scenario
Source: IMF, Renaissance Capital estimates
A collapse in global commodity prices would invalidate both our and the IMF
forecasts, but with oil at $110/bbl over the course of 2011, even with US and EU
growth that is as anaemic as it is today, and EM demand now responsible for nearly
60% of global oil demand, we cannot make this our base case.
There are also upside risks. Nigeria today is one of the least indebted nations on the
planet. With its virtually zero external or public sector debt and very low levels of
private sector debt, any change in consumer and corporate demand for loans would
allow for a dramatic borrowing increase, which may fuel consumption and
investment growth that is faster than we forecast.
Figure 4: Private sector (household and corporate) debt as % of GDP, 2009
Source: IMF( 42d refers to a broader measure of banks due to specific country exceptions)
110
120
130
140
150
160
170
180
190
0
50
100
150
200
250
300
350
400
2000
2001
2002
2003
2004
2005
2006
2007
2008
2009
2010
2011
2012
2013
2014
2015
2016
GDP $bn Population
020406080
100120140160180200220
Uni
ted
Kin
gdom
Spa
in
Net
herla
nds
Uni
ted
Sta
tes
42d
Por
tuga
l
Japa
n 42
d
Chi
na
Ger
man
y
Fra
nce
Latv
ia
Sou
th K
orea
Bel
gium
Tha
iland
Gre
ece
Chi
le
Sou
th A
fric
a
Ukr
aine
Hun
gary
Lith
uani
a
Cro
atia
Cze
ch R
epub
lic
Pol
and
Kaz
akhs
tan
Indi
a
Bra
zil
Slo
vaki
a
Rus
sia
Rom
ania
Nig
eria
Tur
key
Phi
lippi
nes
Ken
ya
Indo
nesi
a
Mex
ico
42d
Arg
entin
a
(% o
f GD
P)
High debt in Asian and rich countries
Emerging European debt was heading towards eurozone levels
Latam, African and CIS countrieshave low debt levels

7
Renaissance Capital A survey of the Nigerian middle class 26 September 2011
Figure 5: Total public debt as % of GDP, 2010
Source: Renaissance Capital, Eurostat, IMF, Bloomberg
Figure 6: External debt as % of GDP, 2010
Source: Renaissance Capital, Bloomberg, national sources
How should investors attempt to tap this growth boom? One route is via the products
and services that the growing Nigerian middle class will be purchasing.
0
50
100
150
200
250
Est
onia
Kaz
akh
Rom
ania
Gha
na
Sth
Afr
Tur
key
Latv
ia
Indo
nesi
a
Ken
ya
Pol
and
Phi
lippi
nes
Egy
pt
Indi
a
Fra
nce
Eur
ozon
e
Por
tuga
l
Irel
and
Italy
Japa
n
0
20
40
60
80
100
120
140
160
Nig
eria
Bra
zil
Gha
na
Sou
th A
fric
a
Mex
ico
Ken
ya
Tha
iland
Indo
nesi
a
Rus
sia
Sth
Kor
ea
Tur
key
Cze
ch R
ep
Pol
and
Mal
aysi
a
Rom
ania
Ukr
aine
Hun
gary
Countries with most attractive ratios

8
Renaissance Capital A survey of the Nigerian middle class 26 September 2011
The data suggest a number of investment implications:
Consumer sector
Consumer lending retail formats – We see great scope here, as white-
goods ownership is still low: only 42% of the middle class own a fridge
freezer, and only 8% a washing machine. This may be influenced by
availability and affordability. If retail chains can offer 12-36-month credit for
white-goods purchases, we would expect an increase in white-goods
ownership. There is potential for consumer finance businesses to thrive.
White-goods retailers – Between 20-25% of our respondents plan to buy
microwave ovens, washing machines and dishwashers in the coming 12
months, and another 20-25% plan to do so within five years. Nigerians
have a tremendous capacity to consume imported goods, given the low
level of manufacturing in the country. We think there are good opportunities
for retail, particularly in consumer goods. This is likely to benefit companies
such as Walmart (through its Game stores).
Lifestyle/leisure – Participation in leisure/lifestyle activities is low. Only a
third of the middle class go to movies, and even less participate in physical
activity, few travel abroad.
Formalised retailing – The majority still shop in open-air markets.
Formalised retailing is still in its infancy in Nigeria, which we see as positive
for Shoprite, Walmart and others. As noted above, 48% of the population
has internet access, so internet shopping also has potential.
Home ownership/home improvement
Housing developments – Many of the Nigerian middle class aspire to own
their homes. The growing population and rising levels of wealth both have
positive implications for housing developments and the supply of building
materials and equipment; unsurprisingly, we see Dangote Cement as
having good prospects.
Home improvement – Those companies that sell home improvement
products, to cater for the many Nigerians who eat and entertain at home,
should prosper, in our view.
Home ownership – Very good potential for investment, in our view;
however, mortgage levels are very low. We think there is pent-up demand
for affordable loans, both secured and unsecured, to fund future housing
needs.
Investment implications
9
Renaissance Capital A survey of the Nigerian middle class 26 September 2011
Telecoms
Mobile phone penetration is still just 53% according to MTN, vs 74% in
Ghana, for example. Admittedly this figure is nearing saturation point for
adults, but we see a threefold rise in revenues per adult. A fast-expanding
middle class implies higher spending in the medium term. Mobile
telecommunications dominate the sector, but internet penetration is
increasing quickly – opening up Nigeria‟s online leisure and information
market to the rest of the world.
Higher education
Given a lump sum to spend immediately, 67% of Nigeria‟s middle class
would purchase land/property, but 36% also said they would spend it on
education (double the 18% that would purchase a car or electronics, or the
15% that would purchase a vacation). The high level of interest in overseas
education among the Nigerian middle class presents opportunities for those
planning to establish local campuses, as well as for strategic partnerships
with home-grown institutions.
Banks and financial markets
The banks with the best reputation are First Bank (76% have a favourable
impression), Zenith Bank (72%) and GTB (60%).
In contrast with the pretty low opinion of their banks many in the West now
have, 78% of Nigerians trust their banks and 80% see them as their ideal
financial services provider. But we think there is still scope for competition
and innovation, as 28% say it is hard to withdraw money, 60% say it is not
possible to borrow small amounts and 70% say it requires a lot of
documentation to open an account. Naturally, 78% say the interest charged
on loans is very high, which is probably true in any country, but just 31%
say this about micro-finance institutions.
Mortgages – Home ownership is low, hence we think this should be an
interesting space for banks. The current drawbacks include: 1) concerns
over property rights; and 2) the duration of banks‟ funding. Most banks are
funded by cheap deposits with durations of less than one year. It‟s difficult
to grant a 20-year mortgage given this asset-liability mismatch; a challenge
that many others from Turkey to Russia and Brazil have had to confront,
and when solved allows for a private sector debt boom.
Banking penetration is very high among the Nigerian middle class (93%
have a bank account), but far more Nigerians see banks as a place to store
money, rather than as a source of loans. Eighty-one percent say that
saving money is the reason to hold a bank account, while only 17%
highlight the benefit of earning interest. It is little wonder then that banks
can pay such low interest rates on deposit accounts.
84% of Nigerians have never applied for a loan, and at present 75-80% of
our sample had no intention of applying for a loan on either a one- or five-
year horizon. Just 20% see banks as being there to provide loans. This

10
Renaissance Capital A survey of the Nigerian middle class 26 September 2011
may reflect the perception of high interest rates, but we think it also
represents an opportunity for banks to transform the marketplace.
Nigerian banks argue retail lending is difficult due to identification issues,
and 74% of our respondents agreed that it‟s necessary to have a
permanent address in order to get a bank account. Curiously, only 48% say
this is necessary for insurance companies, and 43% for micro-finance
banks. It implies to us that the model could be altered to make banking
easier for the population.
Banks‟ microfinance divisions – basically, we believe any unsecured retail
lending products, be it credit cards or personal loans, should do well.
Ninety-one percent of our sample has never used a credit card, but 42%
intend to apply for one in the future. Most investors will be aware of the
eventual dangers of rapid and excessive credit card growth, as in South
Korea 10 years ago, but today we think it is a clear opportunity in Nigeria.
Financial markets have room to grow. Given a large sum of money, 89%
would deposit it in a bank, 32% would invest in land or property, only 19%
would invest in stocks and shares, 5% would invest in government bonds
and 4.5% would invest in FX. Turkish banks have ATM facilities that allow
consumers to buy bonds directly, and we think this could be a growth
sector in Nigeria; but one that banks may be reluctant to push, as it might
force up deposit rates.
Strong economic growth is fostering an entrepreneurial culture. When our
sample was asked what investments they have planned in the next 12
months, more cited “starting a business” (19%) than any other answer;
though investing in land came a close second at 17%, with purchasing a
property following at 15%. When asked what they currently invest in, the
greatest response was in their “own business” (48%).

11
Renaissance Capital A survey of the Nigerian middle class 26 September 2011
Population in 2011: 160.3mn (IMF)
Projected population by 2025: 237mn1
Projected population by 2050: 433mn (third after India and China)1
GDP in 2011: $247bn (IMF)
GNI per capita in 2010 (PPP dollars): $2,160 (world average $11,058)2
Urban population: 51%1
Natural pa population increase: 2.5%1
Population aged <15: 43%1
Population aged 65+: 3%1
Mobile telephones in use in 2011: 53% penetration (source MTN)
Internet users in June 2010: 44mn (28.3% penetration)3
There were fewer than 50 passenger cars per 1,000 people in 2007,
compared with nearly 200 in South Africa and 130 in Zimbabwe4
The middle class: 34.5mn in 2008, or 23% of the population based on
AfDB‟s classification (per capita daily consumption levels of $2 or more).
5.7mn or 3.8% in the upper-middle class, with per capita consumption
levels of $10-20 per day4
1 Population Reference Bureau, http://www.prb.org 2 World Bank, http://siteresources.worldbank.org/DATASTATISTICS/Resources/GNIPC.pdf 3 Internet World Stats, http://www.internetworldstats.com 4 African Development Bank, http://www.afdb.org/fileadmin/uploads/afdb/Documents/Publications/The%20Middle%20of%20the%20Pyramid_The%20Middle%20of%20the%20Pyramid.pdf
Nigeria: Basic facts
12
Renaissance Capital A survey of the Nigerian middle class 26 September 2011
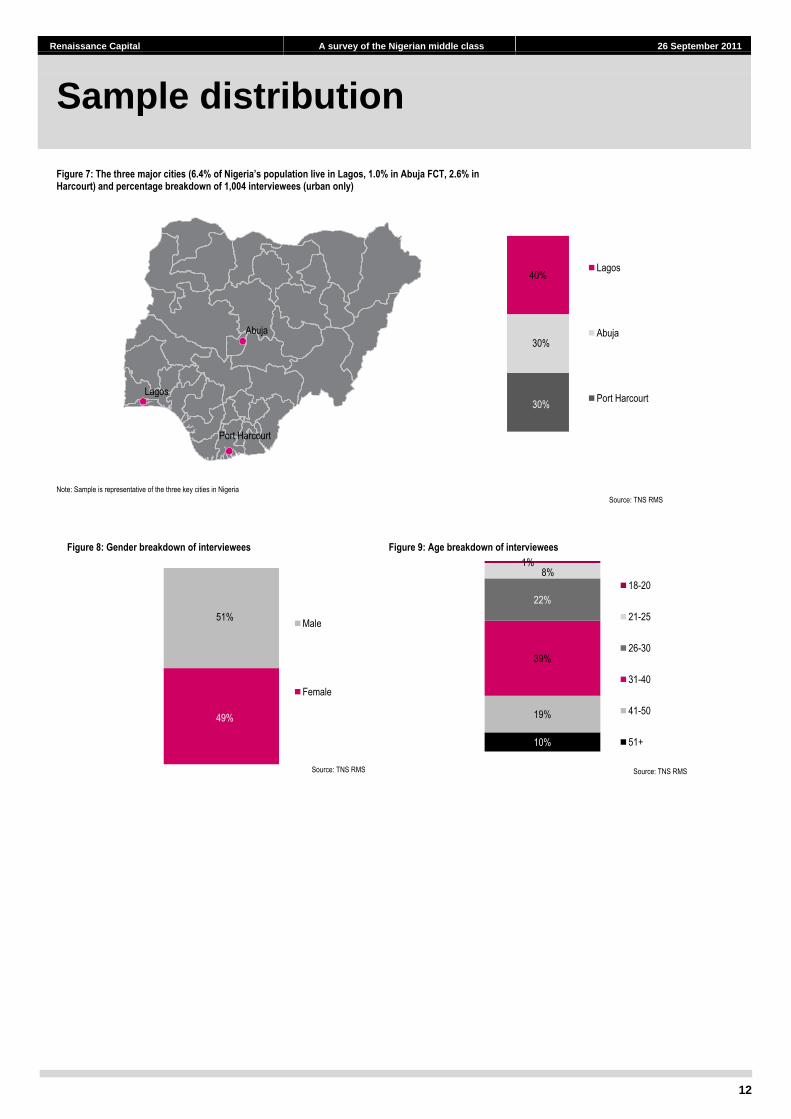
Figure 7: The three major cities (6.4% of Nigeria’s population live in Lagos, 1.0% in Abuja FCT, 2.6% in Harcourt) and percentage breakdown of 1,004 interviewees (urban only)
Note: Sample is representative of the three key cities in Nigeria
Sample distribution
Abuja
Port Harcourt
Lagos
Source: TNS RMS
30%
30%
40%Lagos
Abuja
Port Harcourt
Figure 9: Age breakdown of interviewees
Source: TNS RMS
10%
19%
39%
22%
8%1%
18-20
21-25
26-30
31-40
41-50
51+
Figure 8: Gender breakdown of interviewees
Source: TNS RMS
49%
51%Male
Female
13
Renaissance Capital A survey of the Nigerian middle class 26 September 2011
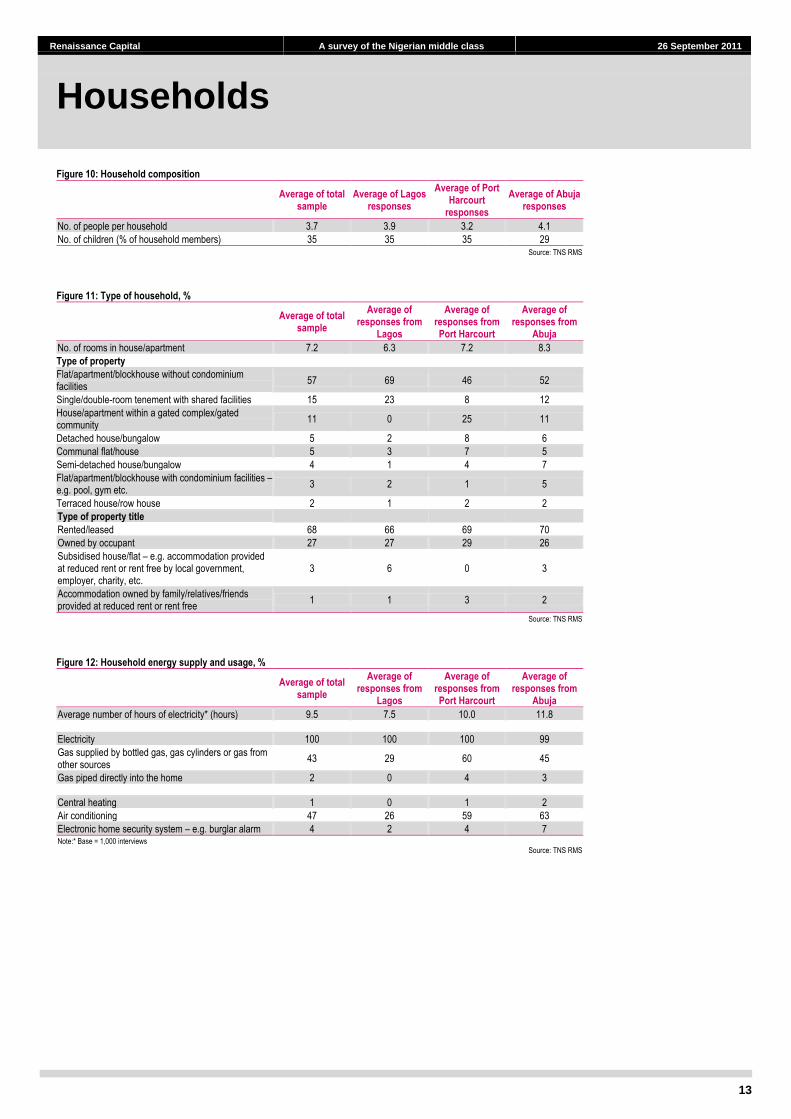
Figure 10: Household composition
Average of total
sample Average of Lagos
responses
Average of Port Harcourt
responses
Average of Abuja responses
No. of people per household 3.7 3.9 3.2 4.1
No. of children (% of household members) 35 35 35 29 Source: TNS RMS
Figure 11: Type of household, %
Average of total
sample
Average of responses from
Lagos
Average of responses from Port Harcourt
Average of responses from
Abuja
No. of rooms in house/apartment 7.2 6.3 7.2 8.3
Type of property
Flat/apartment/blockhouse without condominium facilities
57 69 46 52
Single/double-room tenement with shared facilities 15 23 8 12
House/apartment within a gated complex/gated community
11 0 25 11
Detached house/bungalow 5 2 8 6
Communal flat/house 5 3 7 5
Semi-detached house/bungalow 4 1 4 7
Flat/apartment/blockhouse with condominium facilities – e.g. pool, gym etc.
3 2 1 5
Terraced house/row house 2 1 2 2
Type of property title
Rented/leased 68 66 69 70
Owned by occupant 27 27 29 26
Subsidised house/flat – e.g. accommodation provided at reduced rent or rent free by local government, employer, charity, etc.
3 6 0 3
Accommodation owned by family/relatives/friends provided at reduced rent or rent free
1 1 3 2
Source: TNS RMS
Figure 12: Household energy supply and usage, %
Average of total
sample
Average of responses from
Lagos
Average of responses from Port Harcourt
Average of responses from
Abuja
Average number of hours of electricity* (hours) 9.5 7.5 10.0 11.8
Electricity 100 100 100 99
Gas supplied by bottled gas, gas cylinders or gas from other sources
43 29 60 45
Gas piped directly into the home 2 0 4 3
Central heating 1 0 1 2
Air conditioning 47 26 59 63
Electronic home security system – e.g. burglar alarm 4 2 4 7 Note:* Base = 1,000 interviews
Source: TNS RMS
Households

14
Renaissance Capital A survey of the Nigerian middle class 26 September 2011
Figure 13: Household bathroom facilities, %
Average of total
sample
Average of responses from
Lagos
Average of responses from Port Harcourt
Average of responses from
Abuja
Seated flushing toilet; without heating/washing system 56 51 76 43
Seated flushing toilet; with heating/washing system 30 32 19 37
Seated/non-seated manually flushed toilet – e.g. water bucket
9 10 6 11
Non-seated flushing toilet – e.g. squat toilet 4 3 2 8
Pit toilet 4 5 0 6
Blair toilet (a specialised pit toilet) 1 1 0 3 Source: TNS RMS
Figure 14: Where can you access household water from, % (multiple answers possible)
Average of total
sample
Average of responses from
Lagos
Average of responses from Port Harcourt
Average of responses from
Abuja
Municipal utility supplies water to taps inside home 68 66 69 70
Bore well inside home/courtyard with electric pump 27 27 29 26
Communal tap/hand pump 3 6 0 3
Open well inside home/courtyard 1 1 3 2
Natural sources – e.g. stream/river/lake 10 8 10 12
Bore well inside home/courtyard with hand pump 100 100 100 99
Communal rain storage tanks/communal well 47 26 59 63
Bottled water/jerry cans 43 29 60 45
Tanker or other water delivery to your home 4 2 4 7
Other 2 0 4 3 Source: TNS RMS

15
Renaissance Capital A survey of the Nigerian middle class 26 September 2011
Education and work
Figure 15: Education
Source: TNS RMS
Figure 16: Profession
Note: Base = 994 interviewees
Source: TNS RMS
3.1% 1.3%
28.3%
0.9%
47.2%
15.5%
3.2%
0%
5%
10%
15%
20%
25%
30%
35%
40%
45%
50%
Sec
onda
ry s
choo
l -co
mpl
eted
Sec
onda
ry s
choo
l -fa
iled
to c
ompl
ete
Col
lege
/uni
vers
ity g
radu
ate
Col
lege
/uni
vers
ity -
faile
d to
co
mpl
ete
Pos
tgra
duat
e st
udie
s -
com
plet
ed
Pos
tgra
duat
e st
udie
s -
faile
d to
com
plet
e
Ref
used
to a
nsw
er
33.5%
8.6%
18.9%
6.8% 7.5%4.1%
2.2%
9.2%7.5%
0.5%
0%
5%
10%
15%
20%
25%
30%
35%
40%
Pro
fess
iona
l
Bus
ines
s ow
ner
-w
ith s
ix
or m
ore
staf
f
Bus
ines
s ow
ner
-fiv
e or
fe
wer
sta
ff
Pet
ty tr
ader
Sen
ior
man
ager
Mid
dle/
juni
or m
anag
er
Cle
rical
/oth
er n
on-m
anua
l ro
le
Man
ual w
orke
r/ap
pren
tice
Far
m o
wne
r
Oth
er
Profile: The Nigerian middle class

16
Renaissance Capital A survey of the Nigerian middle class 26 September 2011
Figure 17: Occupation – sector breakdown*
Note: *Base = 994 interviewees Source: TNS RMS
Ninety-two percent of middle-class Nigerians have a post-secondary
education or have studied at higher institutions of learning. Ninety-nine
percent of our sample has one or more members of their household in full-
or part-time work.
The majority (76%) work in the public sector, while 22% work in the private
sector. Only 2% of the middle-class population is employed in other forms
of work or is part of a non-governmental organisation.
About half of the middle-class population are skilled professionals in paid
employment, while 38% own their own businesses.
Public76%
Private22%
NGO1%
Others1%

17
Renaissance Capital A survey of the Nigerian middle class 26 September 2011
Attitudes
Figure 18: Children’s education, %
Source: TNS RMS
Middle-class Nigerians are concerned about the welfare and upbringing of
their children and the values they grow up with, hence the overall sentiment
that children must complete high school in a Nigerian institution.
More than half aspire to send their children overseas to complete their
university education.
Figure 19: Desired professions for children when they grow up, %
Source: TNS RMS
Thirty-five percent of middle-class Nigerians would like their child to
become an engineer and 34% would like them to become a doctor.
63.5%68.6%
41.7% 44.5%
34.2%29.5%
55.8% 53.6%
1.5% 1.5% 1.6% 1.5%
0%
10%
20%
30%
40%
50%
60%
70%
80%
Female Male Female Male
High school University
Completed in Nigeria Completed overseas Unsure
7.0%
1.0%
1.7%
1.8%
3.0%
5.4%
5.4%
6.1%
7.8%
10.9%
12.7%
19.1%
20.1%
34.0%
35.3%
0% 10% 20% 30% 40%
Unsure/cannot say
Social worker
Teacher
Skilled manual worker
Politician
Work abroad
Business owner
Journalist
IT/computer specialist
Work in the oil/gas industry
Banker
Accountant
Lawyer
Doctor
Engineer

18
Renaissance Capital A survey of the Nigerian middle class 26 September 2011
Figure 20: Key concerns
Source: TNS RMS
Figure 21: Answers to the question: Are you optimistic about the future of Nigeria?
Source: TNS RMS
Figure 22: Reasons to be optimistic/pessimistic
Reasons % optimistic
Reasons % pessimistic
I believe things will be better 19 Because of bad politicians/corrupt leaders 5
Things are better under the new government 19 Things will remain the same/will continue to get worse 4
I believe God will make it better 13 Because everybody is corrupt/greedy 2
If we continue to have free and fair elections like the last one/reform within the Electoral Commission
5 Fast growth in the level of corruption/bribery 1
If there is a good administration 2 Crime rate is increasing 1
If economic standards are high/good resources management 3 They are not giving the right people the chance to rule 1
Because of the plans of the present leader 2 The government is now autocratic 1
Because of credible transparency 2 Lack of economic growth/development 1
If corruption is eradicated 2 Other 2
The public/masses are becoming more librated/informed 2
If politicians change their attitude/become transparent/embrace change 1
Other 4 Source: TNS RMS
4.1%
2.3%
27.0%
4.0%
2.6%
2.6%
2.9%
3.0%
3.5%
3.6%
4.7%
5.4%
5.6%
6.0%
8.8%
19.3%
22.8%
6.1%
6.1%
25.0%
12.0%
4.7%
2.0%
2.5%
4.5%
2.5%
4.6%
7.0%
5.6%
18.4%
13.7%
0% 5% 10% 15% 20% 25% 30% 35% 40% 45% 50% 55%
Unsure
Nothing
Other
Economic/infrastructural …
Lack of good governance
Lack of progress in life/business
High petroleum prices
Not having a good family
Corruption
Poverty
Crime rate (kidnapping; terrorism)
Bomb blasts/Boko Haram …
Low quality of education
Lack of security
Poor roads
Unemployment
Supply of power
Next 12 months Next five years
Yes76%
No17%
Don't know7%
19
Renaissance Capital A survey of the Nigerian middle class 26 September 2011
Fixed assets
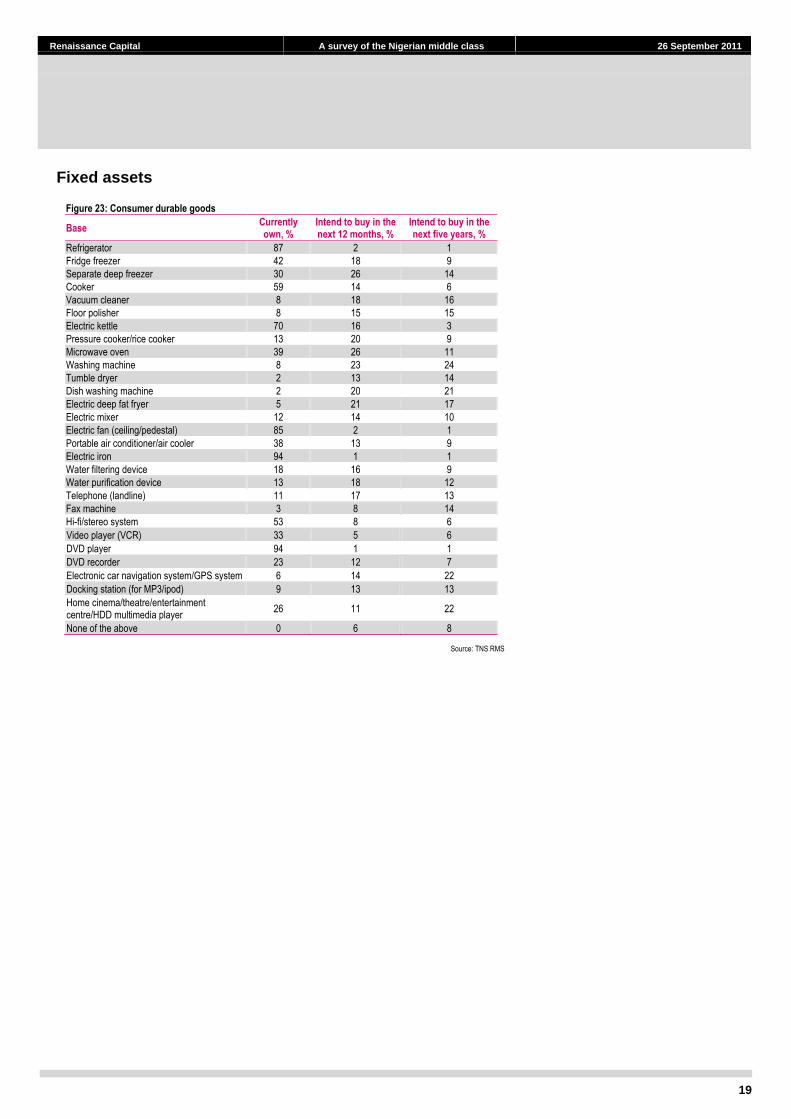
Figure 23: Consumer durable goods
Base Currently own, %
Intend to buy in the next 12 months, %
Intend to buy in the next five years, %
Refrigerator 87 2 1
Fridge freezer 42 18 9
Separate deep freezer 30 26 14
Cooker 59 14 6
Vacuum cleaner 8 18 16
Floor polisher 8 15 15
Electric kettle 70 16 3
Pressure cooker/rice cooker 13 20 9
Microwave oven 39 26 11
Washing machine 8 23 24
Tumble dryer 2 13 14
Dish washing machine 2 20 21
Electric deep fat fryer 5 21 17
Electric mixer 12 14 10
Electric fan (ceiling/pedestal) 85 2 1
Portable air conditioner/air cooler 38 13 9
Electric iron 94 1 1
Water filtering device 18 16 9
Water purification device 13 18 12
Telephone (landline) 11 17 13
Fax machine 3 8 14
Hi-fi/stereo system 53 8 6
Video player (VCR) 33 5 6
DVD player 94 1 1
DVD recorder 23 12 7
Electronic car navigation system/GPS system 6 14 22
Docking station (for MP3/ipod) 9 13 13
Home cinema/theatre/entertainment centre/HDD multimedia player
26 11 22
None of the above 0 6 8
Source: TNS RMS
20
Renaissance Capital A survey of the Nigerian middle class 26 September 2011
Planning for the future: Housing
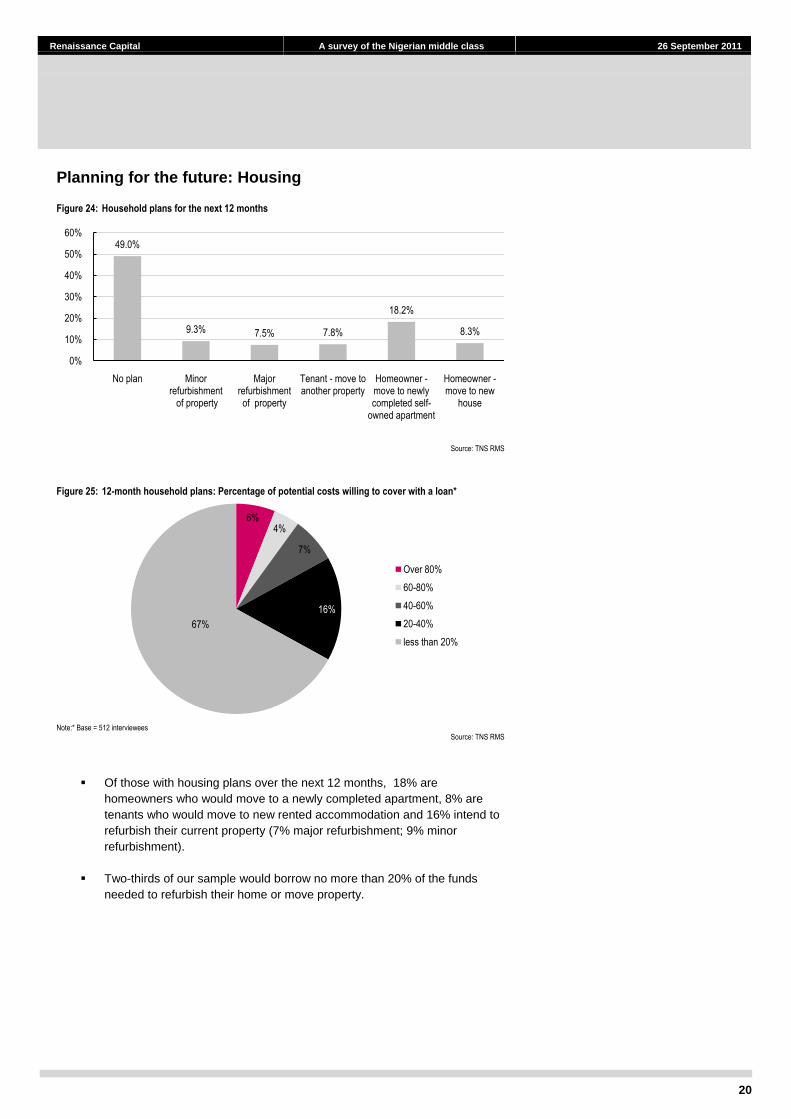
Figure 24: Household plans for the next 12 months
Source: TNS RMS
Figure 25: 12-month household plans: Percentage of potential costs willing to cover with a loan*
Note:* Base = 512 interviewees Source: TNS RMS
Of those with housing plans over the next 12 months, 18% are
homeowners who would move to a newly completed apartment, 8% are
tenants who would move to new rented accommodation and 16% intend to
refurbish their current property (7% major refurbishment; 9% minor
refurbishment).
Two-thirds of our sample would borrow no more than 20% of the funds
needed to refurbish their home or move property.
49.0%
9.3% 7.5% 7.8%
18.2%
8.3%
0%
10%
20%
30%
40%
50%
60%
No plan Minor refurbishment
of property
Major refurbishment of property
Tenant - move to another property
Homeowner -move to newly completed self-
owned apartment
Homeowner -move to new
house
6%4%
7%
16%
67%
Over 80%
60-80%
40-60%
20-40%
less than 20%

21
Renaissance Capital A survey of the Nigerian middle class 26 September 2011
Car ownership
Figure 26: Breakdown of car ownership per household
Source: TNS RMS
Figure 27: Car brands by country of manufacture*
Note: *Base = 512 interviews; respondents were not asked about Korean cars
Source: TNS RMS
Figure 28: Age of cars owned (x-axis = no. of years)
Source: TNS RMS
2%
5%
10%
38%
45%
More than three
Three
Two
One
None
0%
10%
20%
30%
40%
50%
60%
Japan Germany America Russia France Unsure
0.6%
13.3%
18.0%
12.2%
10.2%
7.3%
4.9%
2.4%
4.9%
6.6%
4.9%
1.5% 1.3% 0.7% 0.6%
11.0%
0%
2%
4%
6%
8%
10%
12%
14%
16%
18%
20%
0 1 2 3 4 5 6 7 8 9 10 11 12 13 14 15+
22
Renaissance Capital A survey of the Nigerian middle class 26 September 2011
The average number of cars per middle-class household is 0.8.
45% of middle-class Nigerian households do not own a car.
Most of the cars owned by the Nigerian middle class are manufactured in
Japan (60%). German-manufactured cars are the second most popular
among the middle class, accounting for 25%. Note we did not ask about
Korean cars which may show up under the Japan answer; KIA and
Hyundai have been winning market share recently.
The average car is eight years old. More than half of the cars owned by the
Nigerian middle class are less than five years old.
23
Renaissance Capital A survey of the Nigerian middle class 26 September 2011
Opinions about financial institutions
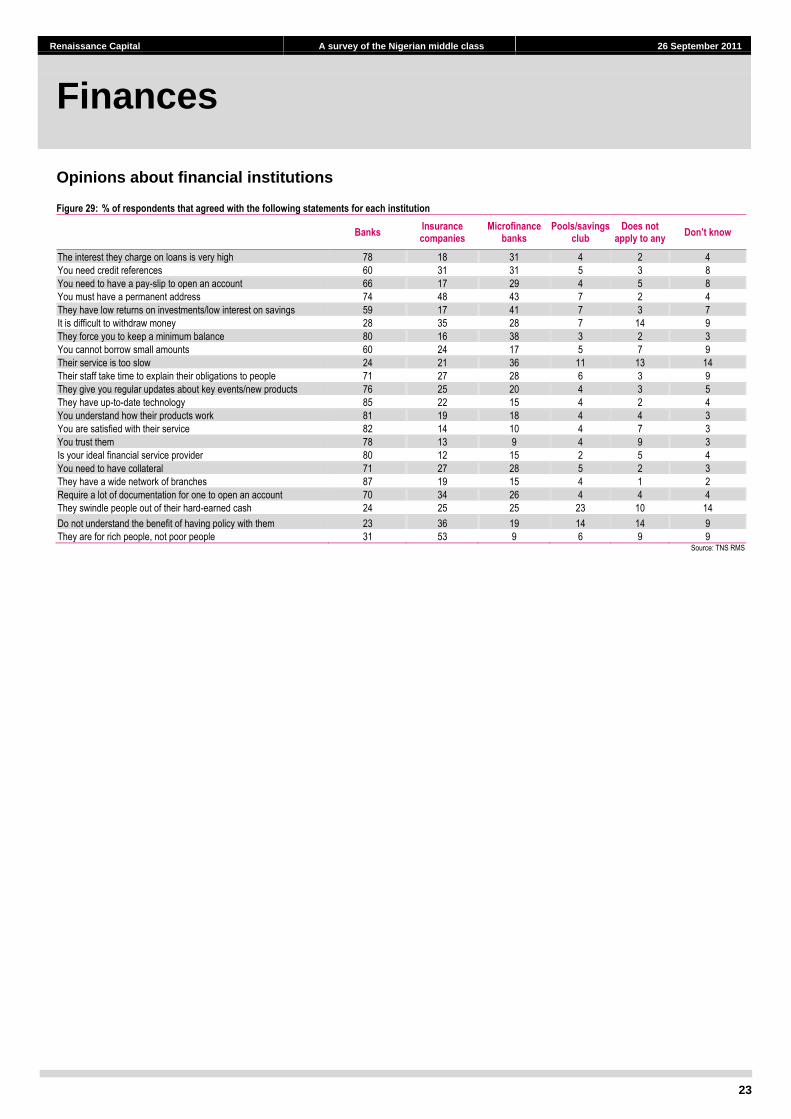
Figure 29: % of respondents that agreed with the following statements for each institution
Banks
Insurance companies
Microfinance banks
Pools/savings club
Does not apply to any
Don’t know
The interest they charge on loans is very high 78 18 31 4 2 4
You need credit references 60 31 31 5 3 8
You need to have a pay-slip to open an account 66 17 29 4 5 8
You must have a permanent address 74 48 43 7 2 4
They have low returns on investments/low interest on savings 59 17 41 7 3 7
It is difficult to withdraw money 28 35 28 7 14 9
They force you to keep a minimum balance 80 16 38 3 2 3
You cannot borrow small amounts 60 24 17 5 7 9
Their service is too slow 24 21 36 11 13 14
Their staff take time to explain their obligations to people 71 27 28 6 3 9
They give you regular updates about key events/new products 76 25 20 4 3 5
They have up-to-date technology 85 22 15 4 2 4
You understand how their products work 81 19 18 4 4 3
You are satisfied with their service 82 14 10 4 7 3
You trust them 78 13 9 4 9 3
Is your ideal financial service provider 80 12 15 2 5 4
You need to have collateral 71 27 28 5 2 3
They have a wide network of branches 87 19 15 4 1 2
Require a lot of documentation for one to open an account 70 34 26 4 4 4
They swindle people out of their hard-earned cash 24 25 25 23 10 14
Do not understand the benefit of having policy with them 23 36 19 14 14 9
They are for rich people, not poor people 31 53 9 6 9 9 Source: TNS RMS
Finances
24
Renaissance Capital A survey of the Nigerian middle class 26 September 2011
Bank relations
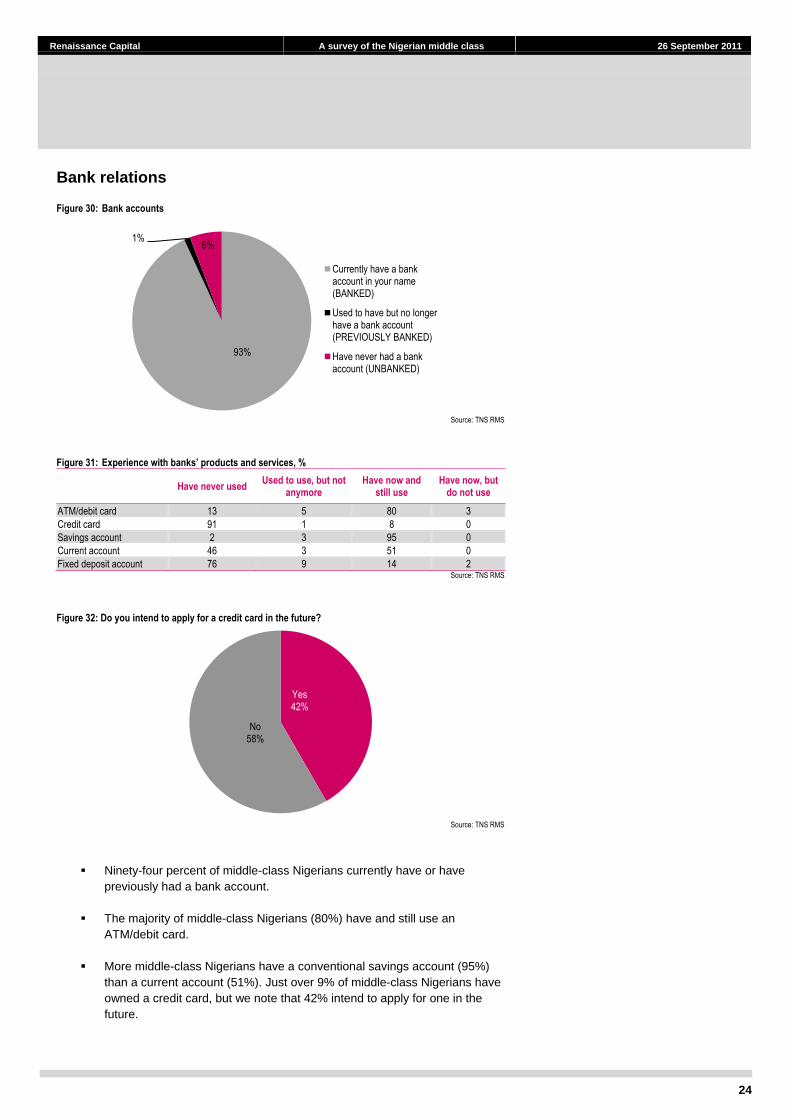
Figure 30: Bank accounts
Source: TNS RMS
Figure 31: Experience with banks’ products and services, %
Have never used
Used to use, but not anymore
Have now and still use
Have now, but do not use
ATM/debit card 13 5 80 3
Credit card 91 1 8 0
Savings account 2 3 95 0
Current account 46 3 51 0
Fixed deposit account 76 9 14 2 Source: TNS RMS
Figure 32: Do you intend to apply for a credit card in the future?
Source: TNS RMS
Ninety-four percent of middle-class Nigerians currently have or have
previously had a bank account.
The majority of middle-class Nigerians (80%) have and still use an
ATM/debit card.
More middle-class Nigerians have a conventional savings account (95%)
than a current account (51%). Just over 9% of middle-class Nigerians have
owned a credit card, but we note that 42% intend to apply for one in the
future.
93%
1%6%
Currently have a bank account in your name (BANKED)
Used to have but no longer have a bank account (PREVIOUSLY BANKED)
Have never had a bank account (UNBANKED)
Yes42%
No58%

25
Renaissance Capital A survey of the Nigerian middle class 26 September 2011
General impressions about banks
Figure 33: % of respondents that agreed with the following reasons for having a bank account*
Note: *Base = 935 interviews
Source: TNS RMS
The key reason to have a bank account among the Nigerian middle class is
to save money (81%). Other major reasons are to withdraw money when
you need it (42%) and to keep money in a safe place (40%).
Figure 34: Impression of Nigerian banks among the Nigerian middle classes
Have a mostly favourable
impression of banks Neither favourable nor unfavourable
Have a mostly unfavourable impression of banks
Access 41 45 14
Afribank 28 49 22
Bank PHB 28 49 22
Diamond 42 43 15
Eco bank 31 48 20
ETB 22 50 28
FCMB 32 48 19
Fidelity 27 50 22
FirstInland 24 53 23
First Bank 76 19 4
GTB 60 31 8
IBTC 22 50 28
IMFB 15 50 35
Intercontinental 54 33 13
Oceanic 49 38 13
Skye 44 44 11
Spring 23 51 26
Stanbic Bank 23 49 28
Standard Chartered 19 54 26
Sterling 23 50 27
UBA 59 32 8
Union Bank 33 40 26
Unity Bank 27 47 26
WEMA 25 50 25
Zenith Bank 72 25 3 Source: TNS RMS
Respondents were most favourably disposed to First Bank (76%), followed
by Zenith Bank (72%) and GTB (60%).
2.7%
3.1%
3.4%
5.8%
9.2%
16.7%
19.2%
20.0%
28.3%
34.9%
40.0%
42.0%
81.2%
0% 10% 20% 30% 40% 50% 60% 70% 80% 90%
To join the class of people who use banks
To pay for insurance
To pay loans
To access a business loan
To pay bills
To earn interest
To pay in your salary
To access loans to acquire assets
To deposit money from your business
To send and receive money safely
To keep money in a safe place
To withdraw money when you need it
To save money
26
Renaissance Capital A survey of the Nigerian middle class 26 September 2011
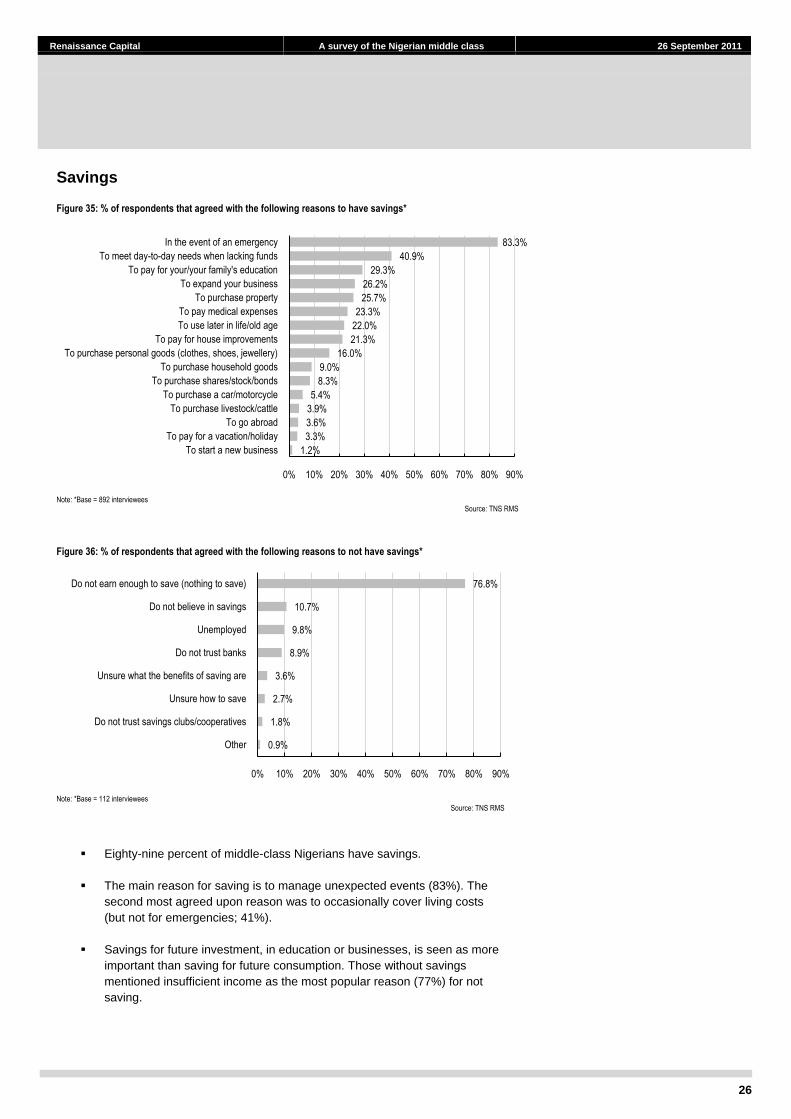
Savings
Figure 35: % of respondents that agreed with the following reasons to have savings*
Note: *Base = 892 interviewees
Source: TNS RMS
Figure 36: % of respondents that agreed with the following reasons to not have savings*
Note: *Base = 112 interviewees
Source: TNS RMS
Eighty-nine percent of middle-class Nigerians have savings.
The main reason for saving is to manage unexpected events (83%). The
second most agreed upon reason was to occasionally cover living costs
(but not for emergencies; 41%).
Savings for future investment, in education or businesses, is seen as more
important than saving for future consumption. Those without savings
mentioned insufficient income as the most popular reason (77%) for not
saving.
1.2%
3.3%
3.6%
3.9%
5.4%
8.3%
9.0%
16.0%
21.3%
22.0%
23.3%
25.7%
26.2%
29.3%
40.9%
83.3%
0% 10% 20% 30% 40% 50% 60% 70% 80% 90%
To start a new business
To pay for a vacation/holiday
To go abroad
To purchase livestock/cattle
To purchase a car/motorcycle
To purchase shares/stock/bonds
To purchase household goods
To purchase personal goods (clothes, shoes, jewellery)
To pay for house improvements
To use later in life/old age
To pay medical expenses
To purchase property
To expand your business
To pay for your/your family's education
To meet day-to-day needs when lacking funds
In the event of an emergency
0.9%
1.8%
2.7%
3.6%
8.9%
9.8%
10.7%
76.8%
0% 10% 20% 30% 40% 50% 60% 70% 80% 90%
Other
Do not trust savings clubs/cooperatives
Unsure how to save
Unsure what the benefits of saving are
Do not trust banks
Unemployed
Do not believe in savings
Do not earn enough to save (nothing to save)

27
Renaissance Capital A survey of the Nigerian middle class 26 September 2011
Spending habits
Figure 37: Answers to the question: What would do with a large sum of money that you do not intend to spend immediately?
Note:*A „wonder „ bank is a fraudulent organisation offering very high short-term returns Source: TNS RMS
Figure 38: Answers to the question: What would do with a large sum of money that you intend to spend immediately?
Source: TNS RMS
Conservatively, 89% of the Nigerian middle classes would deposit a large
sum of money that they do not intend to spend immediately in a bank.
On the contrary, when the large sum of money is to be spent immediately,
67% would purchase land/build a house, suggesting a great deal of
potential demand for real estate.
0.5%
0.5%
0.5%
2.3%
3.0%
4.4%
4.5%
4.9%
5.5%
6.6%
6.7%
18.4%
19.4%
31.8%
88.7%
0% 10% 20% 30% 40% 50% 60% 70% 80% 90% 100%
Unsure
Other
Deposit it with a wonder bank*
Give it to someone for safekeeping
Deposit it with an insurance company
Deposit it with a cooperative society
Convert it to foreign currency
Invest it in government bonds
Keep it at home
Place it with an asset management company
Deposit it with an informal savings club
Invest it in agriculture/business
Invest it in stocks and shares
Purchase land/property
Deposit it with a bank
2.5%
1.0%
1.1%
8.5%
10.8%
11.4%
13.6%
15.3%
18.0%
20.6%
24.4%
35.6%
67.1%
0% 10% 20% 30% 40% 50% 60% 70% 80%
Unsure
Other
Business
Invest in government bonds
Pay debts
Do something charitable
Pay bills
Purchase a vacation for yourself/family
Purchase items, e.g. car, electronics
Invest in agriculture/livestock/trading
Invest in stocks and shares
Spend it on education for yourself/family
Purchase a large item, e.g. property/land

28
Renaissance Capital A survey of the Nigerian middle class 26 September 2011
Investments
Figure 39: % of respondents that agreed with the following statements for each type of investment [
Have never invested in
Used to have an investment in
Currently invest in
Intend to invest in over the next 12 months
Expect to have invested in over the
next five years
Another house/property to rent out 53 5 16 15 10
Land 35 7 31 17 11
Farm land 67 5 15 10 4
Cattle or livestock 78 2 8 8 4
Mutual funds 75 4 8 10 4
Shares on the stock exchange 54 8 23 10 5
Own business 30 8 48 10 4
Another business 69 4 16 7 5
Collectables, such as jewellery 64 3 20 9 3
Offshore investments 77 3 8 7 6
Savings club/pools/informal societies 74 4 12 6 4
Buying or making goods to sell 46 7 32 11 4
Starting a business 37 8 30 19 7
Lending money to other people with interest/a return 72 4 7 9 8
Savings policies, endowments or life insurance 72 2 9 9 9
Improving your home 45 2 34 13 6
Voluntary contributions to a pension scheme 73 2 9 8 9 Source: TNS RMS
Loans
Figure 40: Bank loans
Source: TNS RMS
Currently have a loan in my name; 7%
Used to have a loan in my name, but no
longer do; 9%
Have never applied for a loan; 84%
29
Renaissance Capital A survey of the Nigerian middle class 26 September 2011
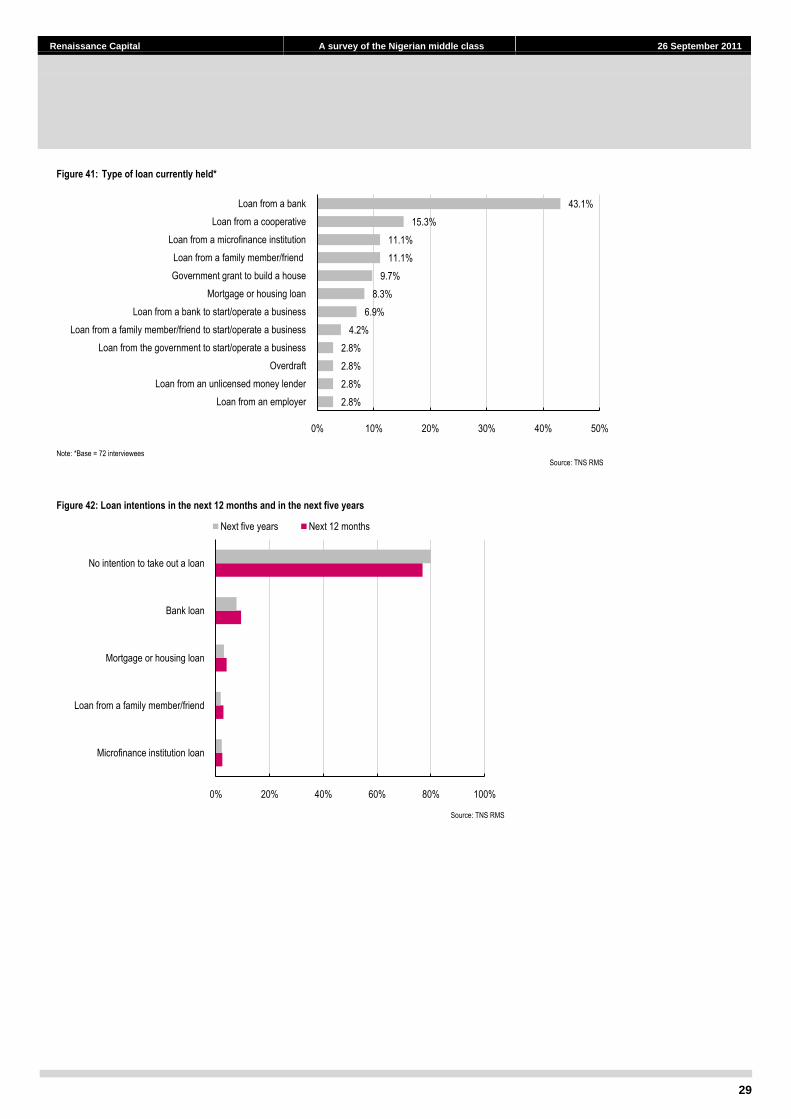
Figure 41: Type of loan currently held*
Note: *Base = 72 interviewees
Source: TNS RMS
Figure 42: Loan intentions in the next 12 months and in the next five years
Source: TNS RMS
2.8%
2.8%
2.8%
2.8%
4.2%
6.9%
8.3%
9.7%
11.1%
11.1%
15.3%
43.1%
0% 10% 20% 30% 40% 50%
Loan from an employer
Loan from an unlicensed money lender
Overdraft
Loan from the government to start/operate a business
Loan from a family member/friend to start/operate a business
Loan from a bank to start/operate a business
Mortgage or housing loan
Government grant to build a house
Loan from a family member/friend
Loan from a microfinance institution
Loan from a cooperative
Loan from a bank
0% 20% 40% 60% 80% 100%
Microfinance institution loan
Loan from a family member/friend
Mortgage or housing loan
Bank loan
No intention to take out a loan
Next five years Next 12 months

30
Renaissance Capital A survey of the Nigerian middle class 26 September 2011
Figure 43: % of respondents that participate in the following activities, and frequency of participation
No. of respondents
that participate
% of respondents
that participate
Frequency of participation
Every day/ most days
Once a week
Once a month
Less than once a month
Never
Eat meals at home with other members of the household 984 98 83 6 4 6 1
Eat a sit-down meal in a restaurant 783 78 17 20 19 42 2
Eat out in a restaurant that serves foreign food 435 43 7 15 26 46 6
Eat a takeaway meal from a takeout outlet/roadside stall/street vendor
740 74 6 22 29 41 3
Consume a drink/snack in cafe/pub 776 77 11 29 22 36 2
Shop for groceries 913 91 7 36 37 19 1
Shop for clothes/fashion accessories 887 88 1 9 43 45 1
Shop for pleasure/browsing/window shopping 498 50 6 13 30 48 4
Attend a club/association/society meeting 683 68 1 22 41 34 2
Attend a place of worship/take part in religious activities/regularly pray at home
963 96 37 53 5 5 0
Help others/volunteer for social work 614 61 9 14 28 46 3
Recycle household rubbish/waste (separate out any of your household rubbish/waste for recycling)
469 47 16 31 17 27 8
Take photos – digital or otherwise 773 77 4 10 22 63 1
Read books 804 80 37 24 16 22 1
Listen to music 972 97 67 19 6 8 1
Cook 890 89 62 11 6 18 3
Play electronic games, including video games 333 33 12 22 17 35 14
Watch live sports or sports programmes on TV 639 64 17 33 20 24 6
Exercise to keep fit 376 37 14 24 19 37 6
Attend a gym/health club 295 29 7 22 25 34 12
Participate in sports that require significant expenditure on equipment or to participate (e.g. golf, horse riding)
205 20 10 21 24 27 18
Play organised team sports 213 21 5 25 21 28 21
Play informal team sports (e.g. football in the park) 196 20 4 24 23 30 20
Participate in outdoor activities or nature-oriented sports (e.g. hiking)
204 20 7 27 23 27 16
Participate in some other kind of exercise (e.g. walking) 659 66 41 21 15 20 3
Attend classes for leisure to gain skills or knowledge (e.g. dance, arts and crafts, flower arranging, languages etc.)
320 32 5 20 26 40 9
Visit a public library 409 41 6 24 24 38 8
Have a day out (e.g. go sightseeing) 443 44 6 21 26 41 6
Go to the cinema 311 31 3 16 25 44 11
Attend sporting events 298 30 2 18 26 44 9
Attend concerts/stage performances 289 29 2 12 25 52 9
Visit a disco/nightclub/karaoke bar 279 28 1 16 25 42 15
Attend celebrations/parties 833 83 1 15 32 49 2
Visit a beauty parlour/hair salon 816 81 3 51 35 10 1
Diet to lose weight 291 29 15 14 21 35 15
Entertain friends at home 930 93 14 31 27 27 1
Entertain friends away from home 789 79 10 22 28 38 2
Chat on the phone or over the internet with friends 488 49 39 23 15 16 6
Spend time with children or grandchildren at home or elsewhere
699 70 46 22 14 14 3
Clean or perform other household chores 813 81 47 23 11 16 3
Visit a health spa 448 45 7 12 25 54 2 Source: TNS RMS
Lifestyle

31
Renaissance Capital A survey of the Nigerian middle class 26 September 2011
Travel
Figure 44: No. of trips abroad, %
Source: TNS RMS Figure 45: Number of visits abroad to certain countries, based on those who have travelled abroad
Note: * Base = 112 interviewees
Source: TNS RMS
85.2%
8.4%4.1%
1.7% 1.0%
0%
10%
20%
30%
40%
50%
60%
70%
80%
90%
Never travelled abroad
One trip Two trips Three trips More than three trips
4.2
4.6
0.9
0.6
2.5
1.9
3.0
0.9 1.0
0.0
0.5
1.0
1.5
2.0
2.5
3.0
3.5
4.0
4.5
5.0
US UK France Spain South Africa
Ghana Dubai Israel Saudi Arabia

32
Renaissance Capital A survey of the Nigerian middle class 26 September 2011
Figure 46: Passport ownership among household members
Source: TNS RMS
Only 15% of the Nigerian middle class have travelled abroad. Favoured
travel destinations are the UK, the US and Dubai.
The majority of middle-class Nigerians has never travelled abroad (85%);
however, 35% of households have at least one household member who
has an international passport.
6.1%
28.8%
65.0%
0%
10%
20%
30%
40%
50%
60%
70%
All Some None
33
Renaissance Capital A survey of the Nigerian middle class 26 September 2011
Shopping for household products
Figure 47: % of respondents that purchase household goods from the following locations
Location
Average of total sample Average of responses
from Lagos Average of responses
from Port Harcourt Average of responses
from Abuja
Utilise, % Primarily use, %
Utilise, % Primarily use, %
Utilise, % Primarily use, %
Utilise, % Primarily use, %
Open-air markets in towns or cities 73 42 66 43 84 42 72 39
Convenience stores/small supermarkets
62 18 65 18 74 26 46 10
Kiosks (in neighbourhoods) 60 7 68 13 64 6 47 2
Hypermarkets 41 11 30 7 40 6 56 20
Tabletops (in neighbourhoods) 39 0 41 0 52 1 23 0
Drugstore/pharmacy/chemist 36 2 34 1 41 3 34 4
Medium-sized supermarket 35 8 29 5 34 7 44 12
Hawkers in towns or cities 20 1 22 0 29 1 9 1
Rural open-air markets 19 7 18 7 19 6 20 9
Wholesalers/warehouses 15 3 24 6 11 1 7 2
Discounters 14 1 6 1 26 1 12 1
Hawkers in rural areas 5 0 6 0 7 0 2 0
Direct selling 2 0 1 0 2 0 5 0
Online supermarkets /hypermarkets/stores
2 0 1 0 4 0 2 0
Telephone ordering 1 0 0 0 2 0 1 0 Source: TNS RMS
Consumer patterns

34
Renaissance Capital A survey of the Nigerian middle class 26 September 2011
Figure 48: % of respondents who use the following sources of information
Source: TNS RMS
Figure 49: Frequency of internet access per week*
Note: *Base = 492 interviewees
Source: TNS RMS
Figure 50: Locations where internet is accessed, %
Source: TNS RMS
Television and radio are the most popular sources of information for
middle-class Nigerians.
People watch TV and listen to the radio every day of the week.
Almost half of the respondents access the internet at least twice a week.
78.0%
95.0% 98.0%
48.0%
0%10%20%30%40%50%60%70%80%90%
100%
Newspaper Radio Television Internet
8.4%
13.4% 14.2% 13.4% 13.4%
6.7%
29.7%
0%
5%
10%
15%
20%
25%
30%
35%
One day Two days Three days Four days Five days Six days Seven days
0% 5% 10% 15% 20% 25% 30%
Home
Work
Internet cafe
Mobile device
Other (e.g. friend's house, hotel)
Media

35
Renaissance Capital A survey of the Nigerian middle class 26 September 2011
Analysts certification
This research report has been prepared by the research analyst(s), whose name(s) appear(s) on the front page of this document, to provide background information about the issuer or issuers (collectively, the “Issuer”) and the securities and markets that are the subject matter of this report. Each research analyst hereby certifies that with respect to the Issuer and such securities and markets, this document has been produced independently of the Issuer and all the views expressed in this document accurately reflect his or her personal views about the Issuer and any and all of such securities and markets. Each research analyst and/or persons connected with any research analyst may have interacted with sales and trading personnel, or similar, for the purpose of gathering, synthesizing and interpreting market information. If the date of this report is not current, the views and contents may not reflect the research analysts‟ current thinking.
Each research analyst also certifies that no part of his or her compensation was, or will be, directly or indirectly related to the specific ratings, forecasts, estimates, opinions or views in this research report. Research analysts‟ compensation is determined based upon activities and services intended to benefit the investor clients of Renaissance Securities (Cyprus) Limited and any of its affiliates (“Renaissance Capital”). Like all of Renaissance Capital‟s employees, research analysts receive compensation that is impacted by overall Renaissance Capital profitability, which includes revenues from other business units within Renaissance Capital.
Important issuer disclosures
Important issuer disclosures outline currently known conflicts of interest that may unknowingly bias or affect the objectivity of the analyst(s) with respect to an issuer that is the subject matter of this report. Disclosure(s) apply to Renaissance Securities (Cyprus) Limited or any of its direct or indirect subsidiaries or affiliates (which are individually or collectively referred to as “Renaissance Capital”) with respect to any issuer or the issuer‟s securities.
A complete set of disclosure statements associated with the issuers discussed in the Report is available using the ‘Stock Finder’ or ‘Bond Finder’ for individual issuers on the Renaissance Capital Research Portal at: http://research.rencap.com/eng/default.asp
At the time of publication, Renaissance Capital was not aware of any actual, material conflict of interest with any issuers and this report.
Investment ratings
Investment ratings may be determined by the following standard ranges: Buy (expected total return of 15% or more); Hold (expected total return of 0-15%); and Sell (expected negative total return). Standard ranges do not always apply to emerging markets securities and ratings may be assigned on the basis of the research analyst‟s knowledge of the securities.
Investment ratings are a function of the research analyst‟s expectation of total return on equity (forecast price appreciation and dividend yield within the next 12 months, unless stated otherwise in the report). Investment ratings are determined at the time of initiation of coverage of an issuer of equity securities or a change in target price of any of the issuer‟s equity securities. At other times, the expected total returns may fall outside of the range used at the time of setting a rating because of price movement and/or volatility. Such interim deviations will be permitted but will be subject to review by Renaissance Capital‟s Research Management.
Where the relevant issuer has a significant material event with further information pending or to be announced, it may be necessary to temporarily place the investment rating Under Review. This does not revise the previously published rating, but indicates that the analyst is actively reviewing the investment rating or waiting for sufficient information to re-evaluate the analyst‟s expectation of total return on equity.
If data upon which the rating is based is no longer valid, but updated data is not anticipated to be available in the near future, the investment rating may be Suspended until further notice. The analyst may also choose to temporarily suspend maintenance of the investment rating when unable to provide an independent expectation of total return due to circumstances beyond the analyst‟s control such as an actual, apparent or potential conflict of interest or best business practice obligations. The analyst may not be at liberty to explain the reason for the suspension other than to Renaissance Capital‟s Research Management and Compliance Officers. Previously published investment ratings should not be relied upon as they may no longer reflect the analysts‟ current expectations of total return.
If issuing of research is restricted due to legal, regulatory or contractual obligations publishing investment ratings will be Restricted. Previously published investment ratings should not be relied upon as they may no longer reflect the analysts‟ current expectations of total return. While restricted, the analyst may not always be able to keep you informed of events or provide background information relating to the issuer.
Where Renaissance Capital has not provided coverage of an issuer for a period of 12 months, coverage shall be deemed discontinued.
Where Renaissance Capital has not expressed a commitment to provide continuous coverage and/or an expectation of total return, to keep you informed, analysts may prepare reports covering significant events or background information without an investment rating (Unrated).
Your decision to buy or sell a security should be based upon your personal investment objectives and should be made only after evaluating the security‟s expected performance and risk.
Renaissance Capital reserves the right to update or amend its investment ratings in any way and at any time it determines.
Disclosures appendix

Renaissance Capital research team
Head of Equity Research David Nangle +7 (495) 258-7748 [email protected] Deputy Head of Equity Research Milena Ivanova-Venturini +7 (727) 244-1584 [email protected] Research COO Ben Carey +44 (207) 367-8224 [email protected] Head of South African Research Gerhard Engelbrecht +27 (11) 750-1454 [email protected] Head of Turkish Equity Research Yavuz Uzay +44 (207) 367-7982 [email protected] Head of Sub-Saharan African Research Nothando Ndebele +27 (11) 750-1472 [email protected]
Name Telephone number Coverage Name Telephone number Coverage Equity Strategy Metals and mining Charles Robertson +44 (207) 367-8235 Global Rob Edwards +44 (207) 367-7781 Global Ovanes Oganisian +7 (495) 258-7906 Russia Boris Krasnojenov +7 (495) 258-7770 x4219 Russia/CIS Herman van Papendorp +27 (11) 750-1465 South Africa Andrew Jones +44 (207) 367-7734 Russia/CIS Nothando Ndebele +27 (11) 750-1472 Sub-Saharan Africa Ekaterina Gazadze +7 (727) 244-1581 Central Asia Jim Taylor +44 (207) 367-7736 South Africa Macro and Fixed income research Vasiliy Kuligin +7 (495) 258-7770 x4065 Russia/CIS Charles Robertson +44 (207) 367-8235 Global Christina Claassens +27 (11) 750-1460 South Africa Ivan Tchakarov +7 (495) 258-7770 x7400 Russia/CIS Emma Townshend +27 (21) 794-8345 South Africa Mert Yildiz +44 (207) 367-7735 CE3/Turkey Leavitt Pope +852 3972-3832 Asia-Pacific Vladlen Andryushchenko +7 (495) 258-7770 x4908 Russia/CIS Matthew Whittall +852 3972-3835 Asia-PacificIlya Zhila +7 (495) 258-7770 x4582 Russia/CIS Anastasiya Golovach +38 (044) 492-7382 Ukraine Media/Technology/Real estate Mikhail Nikitin +7 (495) 258-7789 Russia/CIS David Ferguson +7 (495) 641-4189 Russia/CIS, Africa Rita Tsovyan +7 (495) 258-7770 x4516 Russia/CIS Anastasia Demidova +7 (495) 258-7770 x4040 Russia/CIS, Africa James Lewis +7 (495) 258-7770 x4427 Russia/CIS Johan Snyman +27 (11) 750-1432 South Africa Natalia Suseeva +7 (495) 258-7770 x4082 Russia/CIS Adriana Benedetti +27 (11) 750-1452 South Africa Elna Moolman +27 (11) 750-1462 South Africa Busi Radebe +27 (11) 750-1473 South Africa Telecoms/Transportation Mamokete Lijane +27 (11) 750-1471 South Africa Alexander Kazbegi +7 (495) 258-7902 Global Yvonne Mhango +27 (11) 750-1488 Sub-Saharan Africa Ivan Kim +7 (495) 258-7770 x5620 Russia/CIS, Africa Ernest van der Merwe +27 (11) 750-1462 South Africa Alexandra Serova +7 (495) 258-7770 x4073 Russia/CIS Johan Snyman +27 (11) 750-1432 South Africa Banking Dmitry Kontorshchikov +7 (495) 258-7770 x4438 Russia/CIS David Nangle +7 (495) 258-7748 EMEA Milena Ivanova-Venturini +7 (727) 244-1584 Central Asia Utilities Svetlana Kovalskaya +7 (495) 258-7752 Russia Derek Weaving +44 (207) 367-7793 Russia/CIS Armen Gasparyan +7 (495) 258-7770 x4964 Russia Vladimir Sklyar +7 (495) 258-7770 x4624 Russia/CIS Kirill Rogachev +7 (495) 258-7770 x4015 Russia Ilan Stermer +27 (11) 750-1482 South Africa Luxury goods and tobacco Naeem Badat +27 (11) 750-1431 South Africa Rey Wium +27 (11) 750-1478 Global/South Africa Nothando Ndebele +27 (11) 750-1472 Sub-Saharan Africa Ryno Truter +27 (11) 750-1497 South Africa Adesoji Solanke +234 (1) 448-5300 x5384 Sub-Saharan Africa Chemicals/Engineering/Building materials Quantitative analysis Mikhail Safin +7 (495) 258-7770 x7550 Russia/CIS Renda Rundle +44 (207) 367-8240 South Africa Consumer/Retail/Agriculture Paper Natasha Zagvozdina +7 (495) 258-7753 Eastern Europe, Russia/CIS Adriana Benedetti +27 (11) 750-1452 South Africa Ulyana Lenvalskaya +7 (495) 258-7770 x7265 Eastern Europe, Russia/CIS Konstantin Fastovets +38 (044) 492-7385 x7125 Ukraine Medium cap/Transport/Construction/Building materials Robyn Collins +27 (11) 750-1480 South Africa John Arron +27 (11) 750-1466 Africa Richard Ferguson +44 (207) 367-7991 Global Umulinga Karangwa +27 (11) 750-1489 Sub-Saharan Africa Umulinga Karangwa +27 (11) 750-1489 Sub-Saharan Africa Roman Ivashko +7 (495) 258-7770 x4994 Russia/CIS Regional research Jeanine Womersley +27 (11) 750-1458 South Africa Mbithe Muema +254 (20) 368-2316 East Africa Anthea Alexander +263 (772) 421-845 Southern Africa Oil and gas Ruvimbo Kuzviwanza +263 (7) 88-317 x8795 Southern Africa Daniel Barcelo +7 (495) 258-7770 x4824 Global Yavuz Uzay +44 (207) 367-7982 Turkey Ilya Balabanovsky +44 (207) 367-7905 Russia/CIS Ildar Davletshin +7 (495) 258-7770 x4971 Russia/CIS Dragan Trajkov +44 (207) 367-7941 Africa, MENA Gerhard Engelbrecht +27 (11) 750-1454 South Africa Farid Abasov +44 (207) 367-7983 Central Asia Jenny Wong +852 3972-3800 x3836 Asia-Pacific
Renaissance Capital research is available via the following platforms: Renaissance research portal: research.rencap.com Bloomberg: RENA <GO> Capital IQ: www.capitaliq.com

Renaissance Capital (Hong Kong) Ltd. Hong Kong T +852 3972 3800
Renaissance Capital Moscow T + 7 (495) 258 7777
Renaissance Capital Ltd. London T + 44 (20) 7367 7777
Renaissance Securities (Cyprus) Ltd.Nicosia T + 357 (22) 505 800
Renaissance Securities (Nigeria) Ltd. Lagos T +234 (1) 448 5300
Renaissance Capital Nairobi T +254 (20) 368 2000
Renaissance Capital Ukraine Kyiv T +38 (044) 492-7383
Renaissance Capital Almaty T + 7 (727) 244 1544
NewWorld Renaissance Securities LtdRenaissance Partners Accra T +233 (302) 660163
Renaissance Capital Johannesburg T +27 (11) 750 1400
Renaissance Capital Harare T +263 (4) 788336
Pangaea Renaissance Securities Ltd.Lusaka T +260 (21) 123 8709
© 2011 Renaissance Securities (Cyprus) Limited, an indirect subsidiary of Renaissance Capital Holdings Limited ("Renaissance Capital"), which together with other subsidiaries operates outside of the USA under the brand name of Renaissance Capital, for contact details see Bloomberg page RENA, or contact the relevant office. All rights reserved. This document and/or information has been prepared by and, except as otherwise specified herein, is communicated by Renaissance Securities (Cyprus) Limited, regulated by the Cyprus Securities and Exchange Commission (License No: KEPEY 053/04). The RenCap-NES Leading GDP Indicator is a model that seeks to forecast GDP growth and was developed by and is the exclusive property of Renaissance Capital and the New Economic School (e-mail: [email protected]).
This document is for information purposes only. The information presented herein does not comprise a prospectus of securities for the purposes of EU Directive 2003/71/EC or Federal Law No. 39-FZ of 22 April 1994 (as amended) of the Russian Federation "On the Securities Market". Any decision to purchase securities in any proposed offering should be made solely on the basis of the information to be contained in the final prospectus published in relation to such offering. This document does not form a fiduciary relationship or constitute advice and is not and should not be construed as an offer, or a solicitation of an offer, or an invitation or inducement to engage in investment activity, and cannot be relied upon as a representation that any particular transaction necessarily could have been or can be effected at the stated price. This document is not an advertisement of securities. Opinions expressed herein may differ or be contrary to opinions expressed by other business areas or groups of Renaissance Capital as a result of using different assumptions and criteria. All such information and opinions are subject to change without notice, and neither Renaissance Capital nor any of its subsidiaries or affiliates is under any obligation to update or keep current the information contained herein or in any other medium.
Descriptions of any company or companies or their securities or the markets or developments mentioned herein are not intended to be complete. This document and/or information should not be regarded by recipients as a substitute for the exercise of their own judgment as the information has no regard to the specific investment objectives, financial situation or particular needs of any specific recipient. The application of taxation laws depends on an investor’s individual circumstances and, accordingly, each investor should seek independent professional advice on taxation implications before making any investment decision. The information and opinions herein have been compiled or arrived at based on information obtained from sources believed to be reliable and in good faith. Such information has not been independently verified, is provided on an ‘as is’ basis and no representation or warranty, either expressed or implied, is provided in relation to the accuracy, completeness, reliability, merchantability or fitness for a particular purpose of such information and opinions, except with respect to information concerning Renaissance Capital, its subsidiaries and affiliates. All statements of opinion and all projections, forecasts, or statements relating to expectations regarding future events or the possible future performance of investments represent Renaissance Capital’s own assessment and interpretation of information available to them currently.
The securities described herein may not be eligible for sale in all jurisdictions or to certain categories of investors. Options, derivative products and futures are not suitable for all investors and trading in these instruments is considered risky. Past performance is not necessarily indicative of future results. The value of investments may fall as well as rise and the investor may not get back the amount initially invested. Some investments may not be readily realisable since the market in the securities is illiquid or there is no secondary market for the investor’s interest and therefore valuing the investment and identifying the risk to which the investor is exposed may be difficult to quantify. Investments in illiquid securities involve a high degree of risk and are suitable only for sophisticated investors who can tolerate such risk and do not require an investment easily and quickly converted into cash. Foreign-currency-denominated securities are subject to fluctuations in exchange rates that could have an adverse effect on the value or the price of, or income derived from, the investment. Other risk factors affecting the price, value or income of an investment include but are not necessarily limited to political risks, economic risks, credit risks, and market risks. Investing in emerging markets such as Russia, other CIS, African or Asian countries and emerging markets securities involves a high degree of risk and investors should perform their own due diligence before investing.
Excluding significant beneficial ownership of securities where Renaissance Capital has expressed a commitment to provide continuous coverage in relation to an issuer or an issuer’s securities, Renaissance Capital and its affiliates, their directors, representatives, employees (excluding the US broker-dealer unless specifically disclosed), or clients may have or have had interests in the securities of issuers described in the Investment Research or long or short positions in any of the securities mentioned in the Investment Research or other related financial instruments at any time and may make a purchase and/or sale, or offer to make a purchase and/or sale, of any such securities or other financial instruments from time to time in the open market or otherwise, in each case as principals or as agents. Where Renaissance Capital has not expressed a commitment to provide continuous coverage in relation to an issuer or an issuer’s securities, Renaissance Capital and its affiliates (excluding the US broker-dealer unless specifically disclosed) may act or have acted as market maker in the securities or other financial instruments described in the Investment Research, or in securities underlying or related to such securities. Employees of Renaissance Capital or its affiliates may serve or have served as officers or directors of the relevant companies. Renaissance Capital and its affiliates may have or have had a relationship with or provide or have provided investment banking, capital markets, advisory, investment management, and/or other financial services to the relevant companies, and have established and maintain information barriers, such as ‘Chinese Walls’, to control the flow of information contained in one or more areas within the Renaissance Group of companies to which Renaissance Capital belongs, into other areas, units, groups or affiliates of the Renaissance Group.
The information herein is not intended for distribution to the public and may not be reproduced, redistributed or published, in whole or in part, for any purpose without the written permission of Renaissance Capital, and neither Renaissance Capital nor any of its affiliates accepts any liability whatsoever for the actions of third parties in this respect. This information may not be used to create any financial instruments or products or any indices. Neither Renaissance Capital and its affiliates, nor their directors, representatives, or employees accept any liability for any direct or consequential loss or damage arising out of the use of all or any part of the information herein.
Bermuda: Neither the Bermuda Monetary Authority nor the Registrar of Companies of Bermuda has approved the contents of this document and any statement to the contrary, express or otherwise, would constitute a material misstatement and an offence.
EEA States: Distributed by Renaissance Securities (Cyprus) Limited, regulated by Cyprus Securities and Exchange Commission, or Renaissance Capital Limited, member of the London Stock Exchange and regulated in the UK by the Financial Services Authority (“FSA”) in relation to designated investment business (as detailed in the FSA rules). Cyprus: Except as otherwise specified herein the information herein is not intended for, and should not be relied upon by, retail clients of Renaissance Securities (Cyprus) Limited. The Cyprus Securities and Exchange Commission Investor Compensation Fund is available where Renaissance Securities (Cyprus) Limited is unable to meet its liabilities to its retail clients, as specified in the Customer Documents Pack. United Kingdom: Approved and distributed by Renaissance Capital Limited only to persons who are eligible counterparties or professional clients (as detailed in the FSA Rules). The information herein does not apply to, and should not be relied upon by, retail clients; neither the FSA’s protection rules nor compensation scheme may be applied.
Ghana: Distributed through NewWorld Renaissance Securities Ltd, a licenced broker dealer in Accra and an affiliate of Renaissance Capital.
Hong Kong: Distributed to professional investors (as defined in the Securities and Futures Ordinance and its subsidiary legislation) by Renaissance Capital (Hong Kong) Limited, regulated by the Hong Kong Securities and Futures Commission.
Kazakhstan: Distributed by Renaissance Capital Investments Kazakhstan JSC, regulated by the Agency for the Regulation and Supervision of the Financial Market and Financial Organizations.
Kenya: Distributed by Renaissance Capital (Kenya) Limited, regulated by the Capital Markets Authority.
Nigeria: Distributed by RenCap Securities (Nigeria) Limited, member of The Nigerian Stock Exchange, or Renaissance Securities (Nigeria) Limited, entities regulated by the Securities and Exchange Commission.
Russia: Distributed by CJSC Renaissance Capital, LLC Renaissance Broker, or Renaissance Online Limited, entities regulated by the Federal Financial Markets Service.
South Africa: Distributed by Renaissance BJM Securities (Proprietary) Limited, regulated by the Johannesburg Stock Exchange. Ukraine: Distributed by Renaissance Capital LLC, authorized to perform professional activities on the Ukrainian stock market.
United States: Distributed in the United States by RenCap Securities, Inc., member of FINRA and SIPC, or by a non-US subsidiary or affiliate of Renaissance Capital Holdings Limited that is not registered as a US broker-dealer (a "non-US affiliate"), to major US institutional investors only. RenCap Securities, Inc. accepts responsibility for the content of a research report prepared by another non-US affiliate when distributed to US persons by RenCap Securities, Inc. Although it has accepted responsibility for the content of this research report when distributed to US investors, RenCap Securities, Inc. did not contribute to the preparation of this report and the analysts authoring this are not employed by, and are not associated persons of, RenCap Securities, Inc. Among other things, this means that the entity issuing this report and the analysts authoring this report are not subject to all the disclosures and other US regulatory requirements to which RenCap Securities, Inc. and its employees and associated persons are subject. Any US person receiving this report who wishes to effect transactions in any securities referred to herein should contact RenCap Securities, Inc., not its non-US affiliate. RenCap Securities, Inc. is a subsidiary of Renaissance Capital Holdings Limited and forms a part of a group of companies operating outside of the United States as "Renaissance Capital". Contact: RenCap Securities, Inc., 780 Third Avenue, 20th Floor, New York, New York 10017, Telephone: +1 (212) 824-1099.
Zambia: Distributed through Pangaea Renaissance Securities Ltd, a licenced broker dealer in Lusaka and an affiliate of Renaissance Capital.
Zimbabwe: Distributed by the representative office in Harare of Renaissance Africa (Mauritius) Limited, part of the Renaissance Group.
Other distribution: The distribution of this document in other jurisdictions may be restricted by law and persons into whose possession this document comes should inform themselves about, and observe, any such restriction.
Additional information (including information about the RenCap-NES Leading GDP Indicator) and supporting documentation is available upon request.