a survey of public attitudes towards energy and environment in great
TRANSCRIPT
A Survey of Public Attitudes
towards Energy & Environment
in Great Britain
March 2005
MIT LFEE 2005-001 WP
Prepared by: Thomas E. Curry, David M. Reiner, Mark A. de Figueiredo & Howard J. Herzog
Massachusetts Institute of Technology Laboratory for Energy and the Environment
77 Massachusetts Avenue Cambridge, MA 02139-4307
http://lfee.mit.edu/publications/
Publication No. LFEE 2005-001 WP
Sponsored by: Alliance for Global Sustainability
http://globalsustainability.org

Table of Contents
1. Introduction....................................................................................................................... 1
2. Survey Design and Methodology ..................................................................................... 1
3. Public Attitudes toward Environmental Issues.............................................................. 2
4. Public Attitudes toward Global Warming...................................................................... 5
5. Public Understanding of Carbon Dioxide Sources ........................................................ 8
6. Public Understanding of CCS........................................................................................ 10
7. Public Attitudes toward Climate Change-Mitigation Technologies .......................... 13
8. Willingness to Pay to Solve Global Warming............................................................... 15
9. Response to Information ................................................................................................ 16
10. Summary.......................................................................................................................... 18
Appendix A: Demographics of UK Survey Panel .................................................................... 19
Appendix B: UK Survey Questions and Answers.................................................................... 20

A SURVEY OF PUBLIC ATTITUDES TOWARDS ENERGY AND ENVIRONMENT IN GREAT BRITAIN
Thomas E. Curry, David M. Reiner, Mark A. de Figueiredo, and Howard J. Herzog
1. Introduction
In September 2004, the Laboratory for Energy and the Environment (LFEE) at the Massachusetts Institute of Technology (MIT), in conjunction with the Judge Institute of Management at the University of Cambridge, conducted a survey of attitudes towards energy and environmental issues amongst the British public. This survey parallels one undertaken in late September and early October 2003 of U.S. public attitudes on energy use and environmental concerns.1 Goals of the surveys included collecting information about attitudes toward global warming and climate change-mitigation technologies; levels of public understanding of global warming and the carbon cycle; and awareness of carbon dioxide capture and storage (CCS). This report summarises the results of the British survey. It explores public attitudes toward the environment in general and then, more specifically, toward global warming and global warming-mitigation technologies (Sections 3, 4 and 7). Sections 5 and 6 explore public understanding of sources of carbon dioxide and a climate change-mitigation technology called carbon dioxide capture and storage (CCS). Section 8 reports responses to a question about willingness of respondents to pay to solve global warming and Section 9 looks at the effect of information on technology preferences. 2. Survey Design and Methodology
The survey consisted of twenty closed-ended questions, with seventeen of the questions addressing environmental issues and three of the questions addressing specific demographic topics. Four of the survey questions on environment referred specifically to carbon dioxide capture and storage or carbon sequestration, an emerging climate change-mitigation technology.2 The British survey was distributed by YouGov, an online polling company based in the United Kingdom. YouGov uses Internet polling, rather than traditional polling methods and recruits its
1 Curry, T., Reiner, D.M., Ansolabehere, S. and Herzog, H.J., “How Aware Is The Public Of Carbon Capture And Storage?” in Rubin, E.S., Keith, D.W. and Gilboy, C.F. (eds.) Proceedings of the International Conference on Greenhouse Gas Control Technologies: vol.1: Peer-reviewed papers and plenary presentations (7th), 5-9 September 2004, Vancouver, Canada. Cheltenham: IEA Greenhouse Gas Programme, available at: http://uregina.ca/ghgt7/PDF/papers/peer/137.pdf. For the full questionnaire and a detailed discussion, see Curry, T.E., Public Awareness of Carbon Capture and Storage: A Survey of Attitudes toward Climate Change Mitigation, M.I.T. Masters Thesis (June 2004), available at http://sequestration.mit.edu/research/survey.html. 2 Appendix B includes survey questions and responses. Additional information on carbon dioxide capture and storage is available at http://sequestration.mit.edu.
1
panel over the Internet. 3 YouGov maintains a panel of 46,000 electors in the United Kingdom, recruited via non-political websites through invitations and pop-up advertisements.4 Respondents are provided a monetary incentive for each survey in which they participate.5 Results are weighted based on demographic information provided by the panelists to YouGov.6 The survey of the British public received 1,056 responses out of 2,640 panelists selected, or a response rate of about 40%. Table 2.1 shows summary statistics for the survey; Appendix A provides additional demographic information.
Table 2.1 Summary Statistics of Survey on Energy and the Environment
Number of participants 1,056 Number of participants solicited 2,640 Response rate 40% % Male / % Female 47.6 / 52.4% Average age 40 to 49 years old7
3. Public Attitudes toward Environmental Issues
As a baseline for analysis of other responses, the early survey questions asked the respondent to choose priorities from a given list. The first question asked about general priorities. Respondents were asked to choose the three most important issues facing the UK from the twenty-five listed in Table 3.1. As shown in the table, 13 percent of respondents ranked the environment as one of the top three concerns. Environment ranked eighth out of the 25 issues. Throughout this report, the 13 percent of respondents who included the environment in their top three are considered “concerned about the environment”.
3 Proponents of traditional survey methods argue that biases in sampling may be introduced if the panel is selected over the internet (access to those that are more technologically aware, away from the poor or those employed in certain jobs). Online polling firms can point to flaws in traditional surveys such as: telephone surveys are biased towards those who are home at the right time; telephone surveys exclude those who use mobile phones as their main telephone; definitions of social class have lagged behind social change, and people tend to conceal responses when traditional survey methods are used. See Kellner, P., “Can Online Polls Produce Accurate Findings?” Int. J. Market Res. 46(3) (2004), available at http://www.yougov.com/yougov_website/asp_besPollArchives/pdf/YOU_internal1.pdf. The Economist has compiled a comparison of the final polls from a number of outlets to the final results and the findings show that online polling is equal to or better in predicting the final election results. See http://www.economist.com/media/pdf/YGrecord.pdf. Concerns over a pro-technology bias or a bias towards those that are technologically literate is the biggest concern in the present context. 4 Kellner (2004). 5 Monetary incentives range from 50p to £1 per survey, which builds up in a YouGov account. Once the account reaches £50, the panelist receives a cheque. Id. 6 Id. 7 YouGov provided categorical variables for age.
2
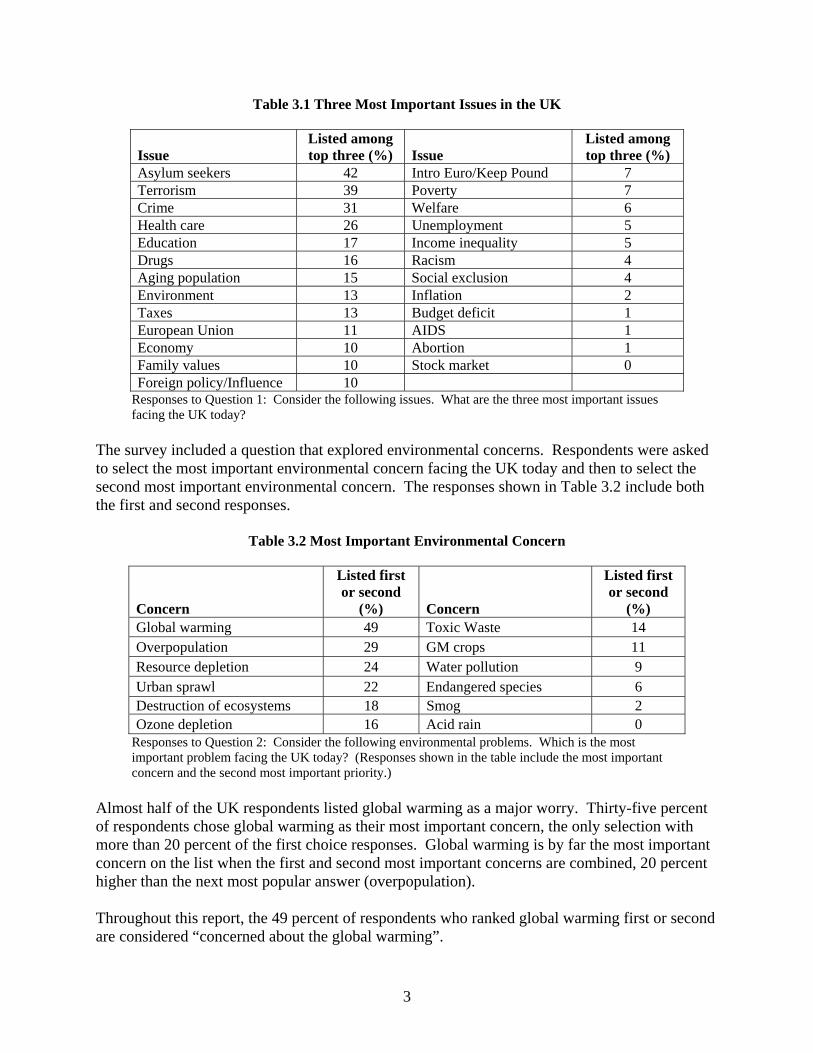
Table 3.1 Three Most Important Issues in the UK
Issue Listed among top three (%) Issue
Listed among top three (%)
Asylum seekers 42 Intro Euro/Keep Pound 7 Terrorism 39 Poverty 7 Crime 31 Welfare 6 Health care 26 Unemployment 5 Education 17 Income inequality 5 Drugs 16 Racism 4 Aging population 15 Social exclusion 4 Environment 13 Inflation 2 Taxes 13 Budget deficit 1 European Union 11 AIDS 1 Economy 10 Abortion 1 Family values 10 Stock market 0 Foreign policy/Influence 10
Responses to Question 1: Consider the following issues. What are the three most important issues facing the UK today?
The survey included a question that explored environmental concerns. Respondents were asked to select the most important environmental concern facing the UK today and then to select the second most important environmental concern. The responses shown in Table 3.2 include both the first and second responses.
Table 3.2 Most Important Environmental Concern
Concern
Listed first or second
(%) Concern
Listed first or second
(%) Global warming 49 Toxic Waste 14 Overpopulation 29 GM crops 11 Resource depletion 24 Water pollution 9 Urban sprawl 22 Endangered species 6 Destruction of ecosystems 18 Smog 2 Ozone depletion 16 Acid rain 0
Responses to Question 2: Consider the following environmental problems. Which is the most important problem facing the UK today? (Responses shown in the table include the most important concern and the second most important priority.)
Almost half of the UK respondents listed global warming as a major worry. Thirty-five percent of respondents chose global warming as their most important concern, the only selection with more than 20 percent of the first choice responses. Global warming is by far the most important concern on the list when the first and second most important concerns are combined, 20 percent higher than the next most popular answer (overpopulation). Throughout this report, the 49 percent of respondents who ranked global warming first or second are considered “concerned about the global warming”.
3
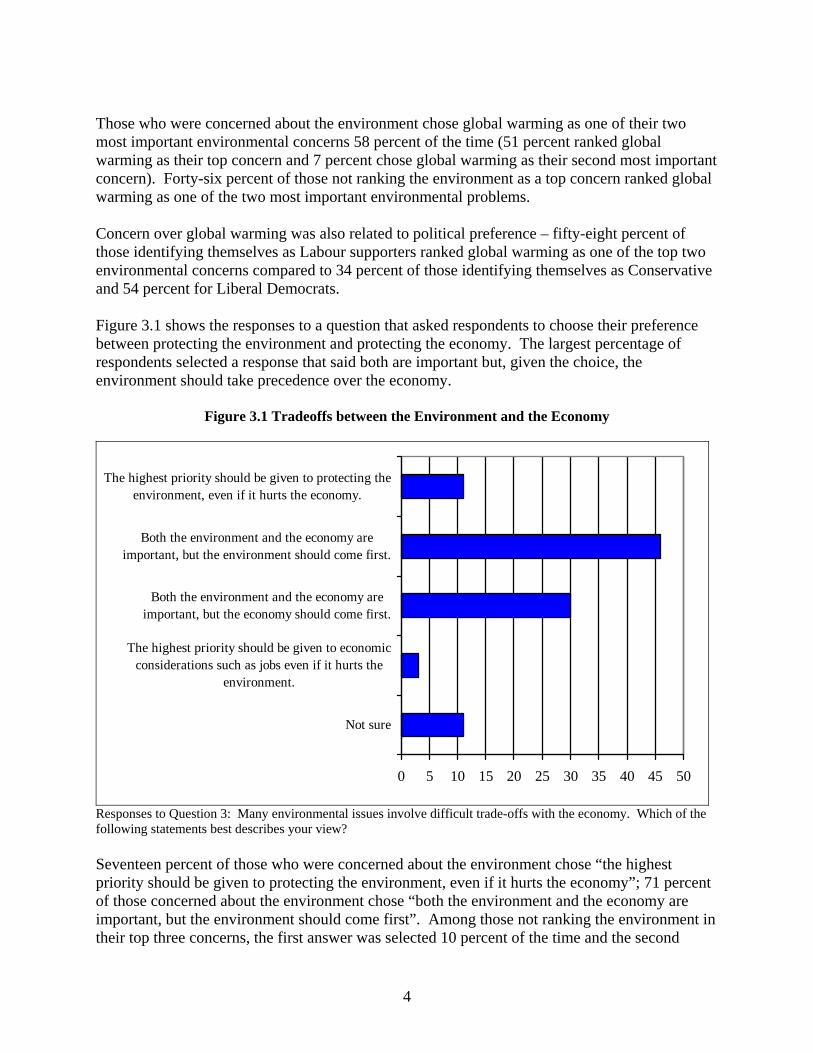
Those who were concerned about the environment chose global warming as one of their two most important environmental concerns 58 percent of the time (51 percent ranked global warming as their top concern and 7 percent chose global warming as their second most important concern). Forty-six percent of those not ranking the environment as a top concern ranked global warming as one of the two most important environmental problems. Concern over global warming was also related to political preference – fifty-eight percent of those identifying themselves as Labour supporters ranked global warming as one of the top two environmental concerns compared to 34 percent of those identifying themselves as Conservative and 54 percent for Liberal Democrats. Figure 3.1 shows the responses to a question that asked respondents to choose their preference between protecting the environment and protecting the economy. The largest percentage of respondents selected a response that said both are important but, given the choice, the environment should take precedence over the economy.
Figure 3.1 Tradeoffs between the Environment and the Economy
0 5 10 15 20 25 30 35 40 45 50
Not sure
The highest priority should be given to economicconsiderations such as jobs even if it hurts the
environment.
Both the environment and the economy areimportant, but the economy should come first.
Both the environment and the economy areimportant, but the environment should come first.
The highest priority should be given to protecting theenvironment, even if it hurts the economy.
Responses to Question 3: Many environmental issues involve difficult trade-offs with the economy. Which of the following statements best describes your view? Seventeen percent of those who were concerned about the environment chose “the highest priority should be given to protecting the environment, even if it hurts the economy”; 71 percent of those concerned about the environment chose “both the environment and the economy are important, but the environment should come first”. Among those not ranking the environment in their top three concerns, the first answer was selected 10 percent of the time and the second
4

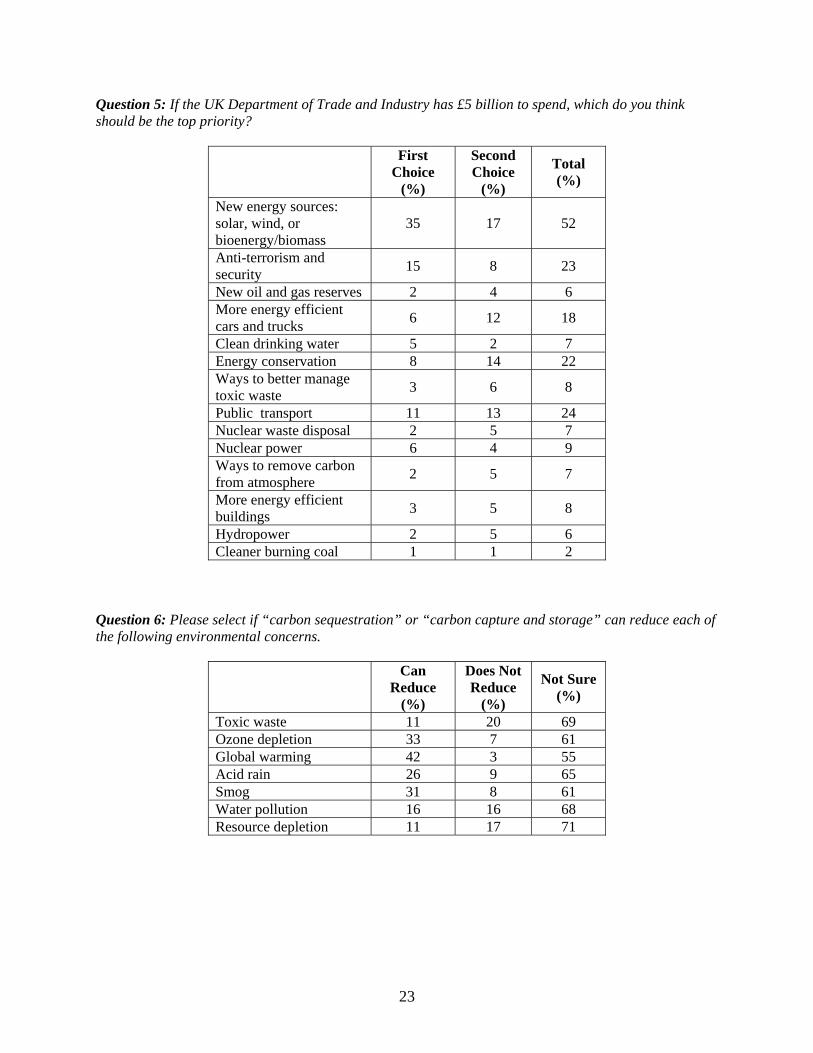
answer was selected 42 percent of the time . Six percent of those concerned about the environment said both are important but the economy should have priority, compared to 34 percent of the remaining population. None of those concerned about the environment said the economy should have the highest priority but 6 percent answered “not sure”. Twelve percent of those not concerned about the environment chose “not sure” and 3 percent said the economy should be the highest priority, even at the expense of the environment. Concern about global warming did not appear to shift responses to this question. Respondents were asked to choose a top priority for the UK Department of Trade and Industry (DTI) and were asked a follow-up question about the next most important priority. Table 3.3 shows the responses.
Table 3.3 Priorities for the Department of Trade and Industry
Priority
Listed first or second
(%) Priority
Listed first or second
(%) New energy sources: solar, wind, or bioenergy/biomass 52 Ways to better manage toxic
waste 8
Public transport 24 Clean drinking water 7 Anti-terrorism and security 23 Nuclear waste disposal 7
Energy conservation 22 Ways to remove carbon from atmosphere 7
More energy efficient cars and trucks 18 New oil and gas reserves 6
Nuclear power 9 Hydropower 6 More energy efficient buildings 8 Cleaner burning coal 2
Responses to Question 5: If the Department of Trade and Industry has £5 billion to spend, which do you think should be the top priority? (Responses shown in the table include the top priority and the second priority.)
Over half of respondents listed new energy sources, defined as a selection of renewable energy sources, as a top priority for DTI. About a third, 35 percent, selected new energy sources as their first choice. Aside from renewable energy, four other priorities – public transport, anti-terrorism and security, energy conservation and energy-efficient cars – received roughly 20 percent support, whereas the remaining nine alternatives, including “ways to remove carbon from the atmosphere” and “cleaner burning coal”, two selections that could include development of CCS, received support from less than 10 percent of respondents. 4. Public Attitudes toward Global Warming
Two survey questions explored general attitudes toward global warming. Figures 4.1 and 4.2 show the results.
5
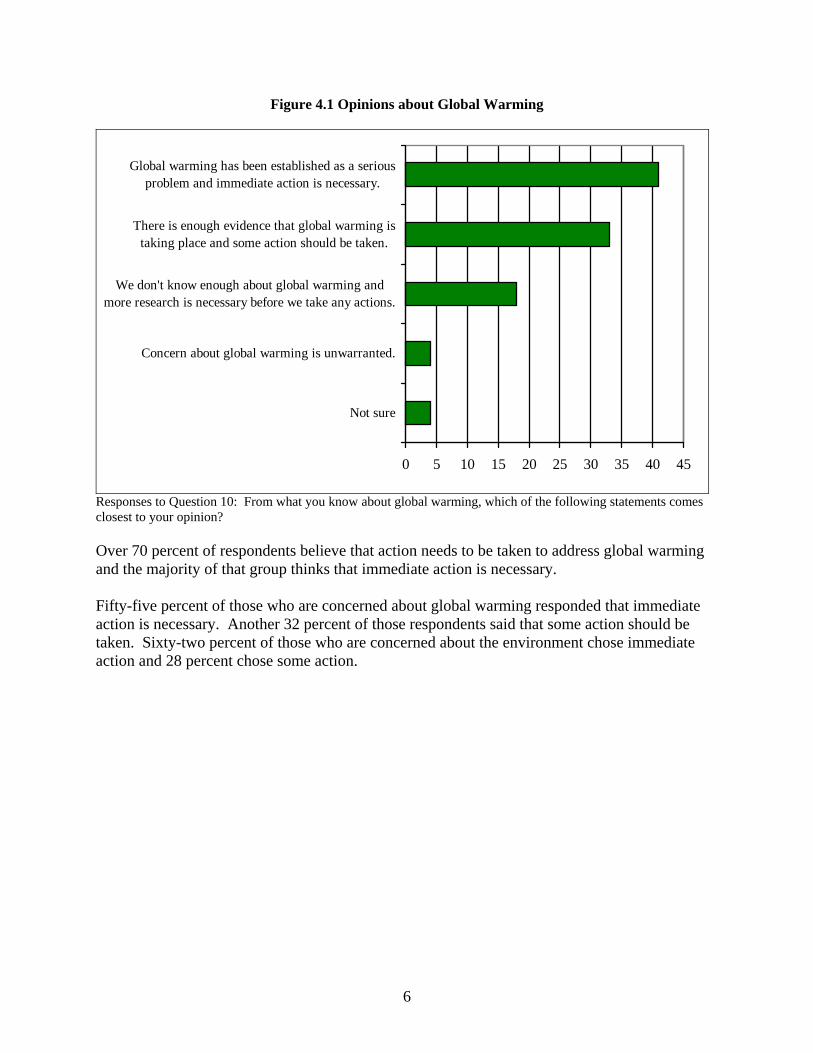
Figure 4.1 Opinions about Global Warming
0 5 10 15 20 25 30 35 40 45
Not sure
Concern about global warming is unwarranted.
We don't know enough about global warming andmore research is necessary before we take any actions.
There is enough evidence that global warming istaking place and some action should be taken.
Global warming has been established as a seriousproblem and immediate action is necessary.
Responses to Question 10: From what you know about global warming, which of the following statements comes closest to your opinion?
Over 70 percent of respondents believe that action needs to be taken to address global warming and the majority of that group thinks that immediate action is necessary. Fifty-five percent of those who are concerned about global warming responded that immediate action is necessary. Another 32 percent of those respondents said that some action should be taken. Sixty-two percent of those who are concerned about the environment chose immediate action and 28 percent chose some action.
6
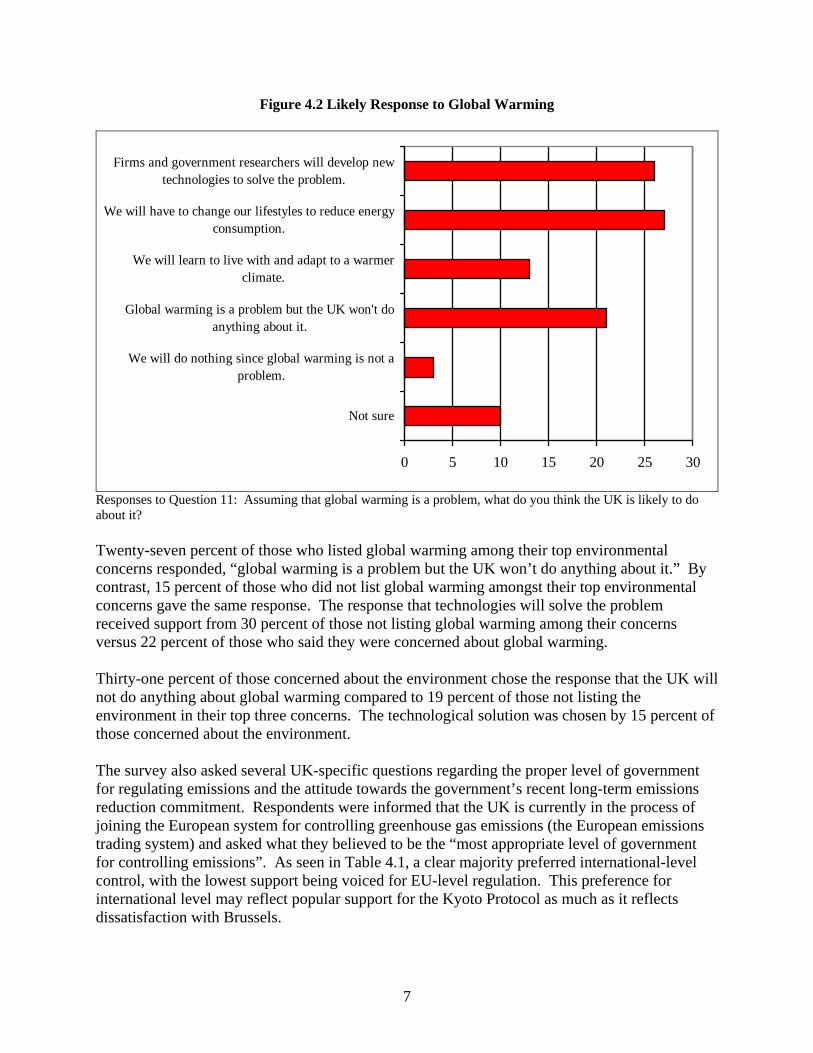
Figure 4.2 Likely Response to Global Warming
0 5 10 15 20 25 30
Not sure
We will do nothing since global warming is not aproblem.
Global warming is a problem but the UK won't doanything about it.
We will learn to live with and adapt to a warmerclimate.
We will have to change our lifestyles to reduce energyconsumption.
Firms and government researchers will develop newtechnologies to solve the problem.
Responses to Question 11: Assuming that global warming is a problem, what do you think the UK is likely to do about it? Twenty-seven percent of those who listed global warming among their top environmental concerns responded, “global warming is a problem but the UK won’t do anything about it.” By contrast, 15 percent of those who did not list global warming amongst their top environmental concerns gave the same response. The response that technologies will solve the problem received support from 30 percent of those not listing global warming among their concerns versus 22 percent of those who said they were concerned about global warming. Thirty-one percent of those concerned about the environment chose the response that the UK will not do anything about global warming compared to 19 percent of those not listing the environment in their top three concerns. The technological solution was chosen by 15 percent of those concerned about the environment. The survey also asked several UK-specific questions regarding the proper level of government for regulating emissions and the attitude towards the government’s recent long-term emissions reduction commitment. Respondents were informed that the UK is currently in the process of joining the European system for controlling greenhouse gas emissions (the European emissions trading system) and asked what they believed to be the “most appropriate level of government for controlling emissions”. As seen in Table 4.1, a clear majority preferred international-level control, with the lowest support being voiced for EU-level regulation. This preference for international level may reflect popular support for the Kyoto Protocol as much as it reflects dissatisfaction with Brussels.
7

Table 4.1 Appropriate Level of Government for Controlling Emissions
Level Percent UK 15 EU 8 International 54 Not sure 23
In its recent Energy White Paper, the UK government recently committed to reducing greenhouse emissions by 60% by 2050.8 The target itself evoked little dissension; only 4% of the British public deemed such a commitment “not desirable”. Amongst those with a favourable view, there was a relatively even division between those that felt such a target was “reasonable”, and those who believed an aim to be “impractical.” This reflects divisions over trust in government. Fifty-five percent of those who identify with the Conservative party said that the target was "desirable but impractical", whereas 40 percent of those identifying themselves as Labour supporters and 36 percent of Liberal Democrats voiced a skeptical view. Thirty-two percent of those supporting the Conservative party answered "desirable and reasonable" compared to 47 percent of Labour and Liberal Democrat respondents. The target was seen as "undesirable" by 4 percent of Conservatives and 7 percent of Liberal Democrats, but only 1 percent of Labour supporters.
Table 4.2 Views on UK Government’s 60% Emissions Reduction Target
Level Percent Desirable and reasonable 40 Desirable but impractical 43 Not desirable 4 Not sure 13
5. Public Understanding of Carbon Dioxide Sources
Forty-nine percent of respondents to the survey selected global warming as one of their two most important environmental concerns (as shown in Table 3.2). To see if people understood the drivers of global warming, the survey asked about sources of carbon dioxide. The question (as shown below in Table 5.1) said, “there is growing concern about increasing levels of carbon dioxide” but did not suggest that carbon dioxide was a cause of global warming.
8 UK Department of Trade and Industry, Our Energy Future - Creating a Low Carbon Economy (HMSO, 2003).
8
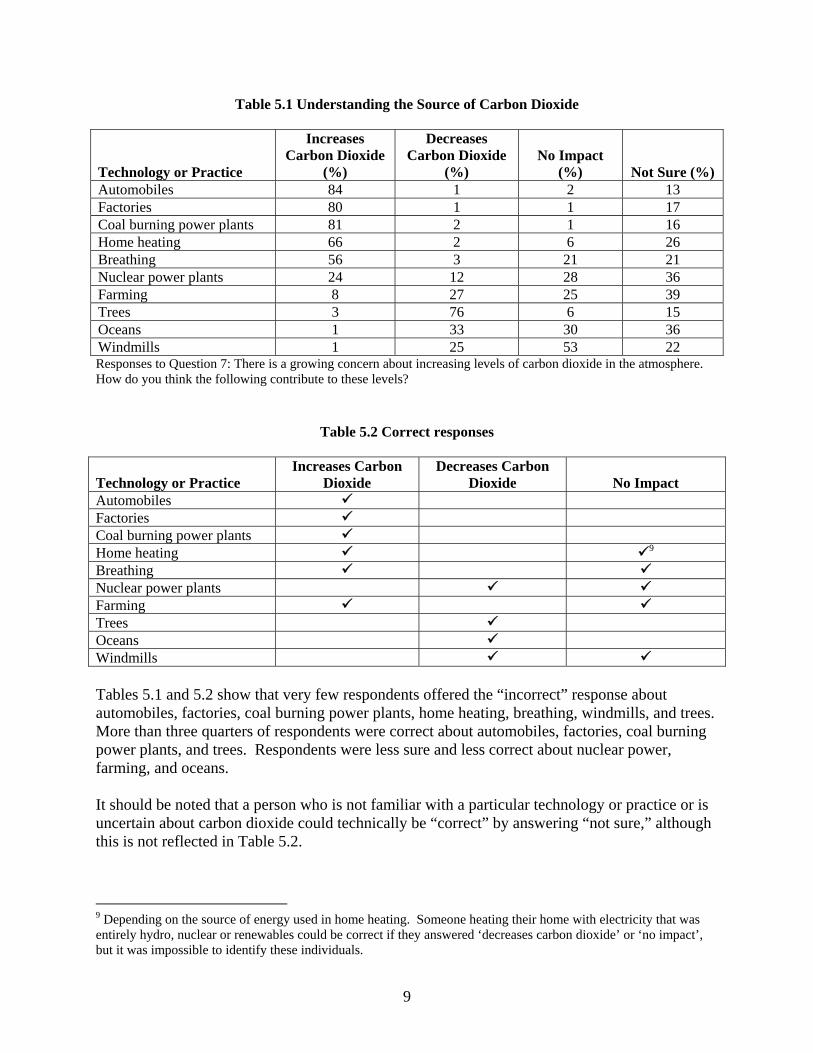
Table 5.1 Understanding the Source of Carbon Dioxide
Technology or Practice
Increases Carbon Dioxide
(%)
Decreases Carbon Dioxide
(%) No Impact
(%) Not Sure (%) Automobiles 84 1 2 13 Factories 80 1 1 17 Coal burning power plants 81 2 1 16 Home heating 66 2 6 26 Breathing 56 3 21 21 Nuclear power plants 24 12 28 36 Farming 8 27 25 39 Trees 3 76 6 15 Oceans 1 33 30 36 Windmills 1 25 53 22 Responses to Question 7: There is a growing concern about increasing levels of carbon dioxide in the atmosphere. How do you think the following contribute to these levels?
Table 5.2 Correct responses
Technology or Practice Increases Carbon
Dioxide Decreases Carbon
Dioxide No Impact Automobiles Factories Coal burning power plants Home heating 9
Breathing Nuclear power plants Farming Trees Oceans Windmills Tables 5.1 and 5.2 show that very few respondents offered the “incorrect” response about automobiles, factories, coal burning power plants, home heating, breathing, windmills, and trees. More than three quarters of respondents were correct about automobiles, factories, coal burning power plants, and trees. Respondents were less sure and less correct about nuclear power, farming, and oceans. It should be noted that a person who is not familiar with a particular technology or practice or is uncertain about carbon dioxide could technically be “correct” by answering “not sure,” although this is not reflected in Table 5.2.
9 Depending on the source of energy used in home heating. Someone heating their home with electricity that was entirely hydro, nuclear or renewables could be correct if they answered ‘decreases carbon dioxide’ or ‘no impact’, but it was impossible to identify these individuals.
9
Technologies or practices generally associated with emissions (automobiles, factories, and coal burning power plants) are also associated with a release of carbon dioxide, thus it is impossible to tell if respondents made the explicit connection to carbon dioxide or whether they simply associated these technologies with air emissions or pollution more generally. It is interesting to note that in spite of efforts by proponents to portray nuclear energy as a climate-friendly energy source, over half of respondents do not know that nuclear power does not emit carbon dioxide, including almost a quarter of respondents who mistakenly believe that nuclear power is a source of carbon dioxide by. This misunderstanding is found amongst both those who listed global warming as a top concern and those who did not, 27 percent of those concerned about global warming said that nuclear power plants increase carbon dioxide while 22 percent of those not concerned about global warming said that nuclear power plants increase carbon dioxide. However, there seems to be greater understanding of nuclear energy among those concerned about the environment. Forty-four percent of those concerned about the environment responded that nuclear power plants have “no impact” on carbon dioxide levels; another 10 percent responded that nuclear power plants decrease carbon dioxide. Nineteen percent were incorrect, saying that nuclear power increases carbon dioxide and 27 percent said they were not sure. Among those not concerned about the environment, 37 percent said they were not sure, 26 percent said nuclear power had no impact, 12 percent said it decreases carbon dioxide, and 25 percent said it increases carbon dioxide. These results actually offer a somewhat more positive view of nuclear power than that found in a 2002 Eurobarometer survey, where 45% of the UK public believed that nuclear power contributed significantly to “global warming or climate change” compared to 27% who disagreed and 28% that did not know.10 These figures are almost identical to the overall EU average (47% agree, 27% disagree, based on the 15 member states at the time of the survey). 6. Public Understanding of CCS
One goal of the survey was to establish a baseline for assessing public understanding of geologic carbon dioxide capture and storage. Researchers and government officials refer to geologic CCS as “carbon sequestration” or “carbon capture and storage.” Both terms were included in the survey.
10 European Commission, DG-Research, Special Eurobarometer 169, Energy: Issues, Options and Technologies Science and Society, p. 45, Table 5 (December 2002).
10

Table 6.1 Percent of Respondents who have Heard of or Read about Technologies in the Past Year
Technology Percent Wind energy 69 Solar energy 55 More efficient cars 53 More efficient appliances 40 Nuclear energy 39 Hydrogen cars 26 Bioenergy/biomass 10 Carbon capture and storage 5 Carbon sequestration 2 Iron fertilisation 1 None of these 21
Question 4: Have you heard of or read about any of the following in the past year?
Table 6.1 shows that very few people have heard of or read about carbon capture and storage or carbon sequestration. Even fewer have heard of iron fertilisation. Those who ranked the environment as one of their three most important concerns were more likely to have said that they had heard of each of the technologies listed in Table 6.1. Ranking global warming as a primary environmental concern did not, however, result in a similar increase. Those who gave a high ranking to the environment were also less likely to say that they had heard of none of the technologies (7 percent compared to 23 percent of people not concerned about the environment) while those who gave a high ranking to global warming were actually more likely to say that they had not heard of any of the technologies (26 percent compared to 17 percent of those not concerned about global warming).
11
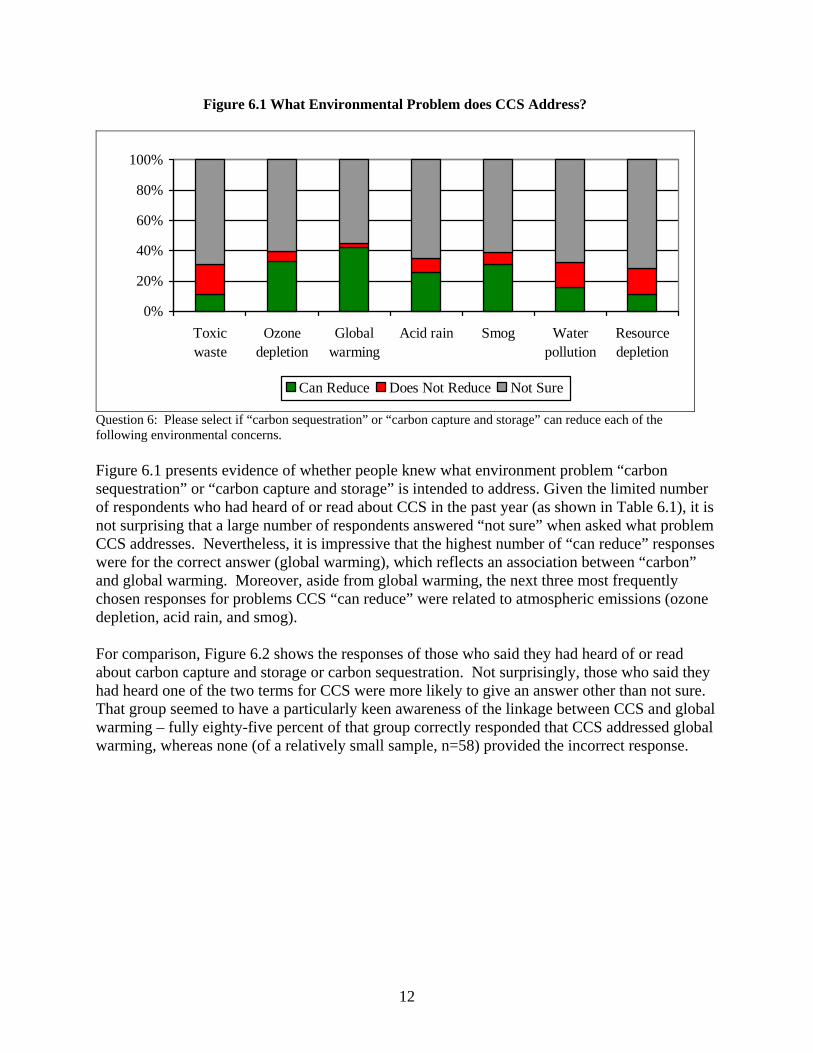
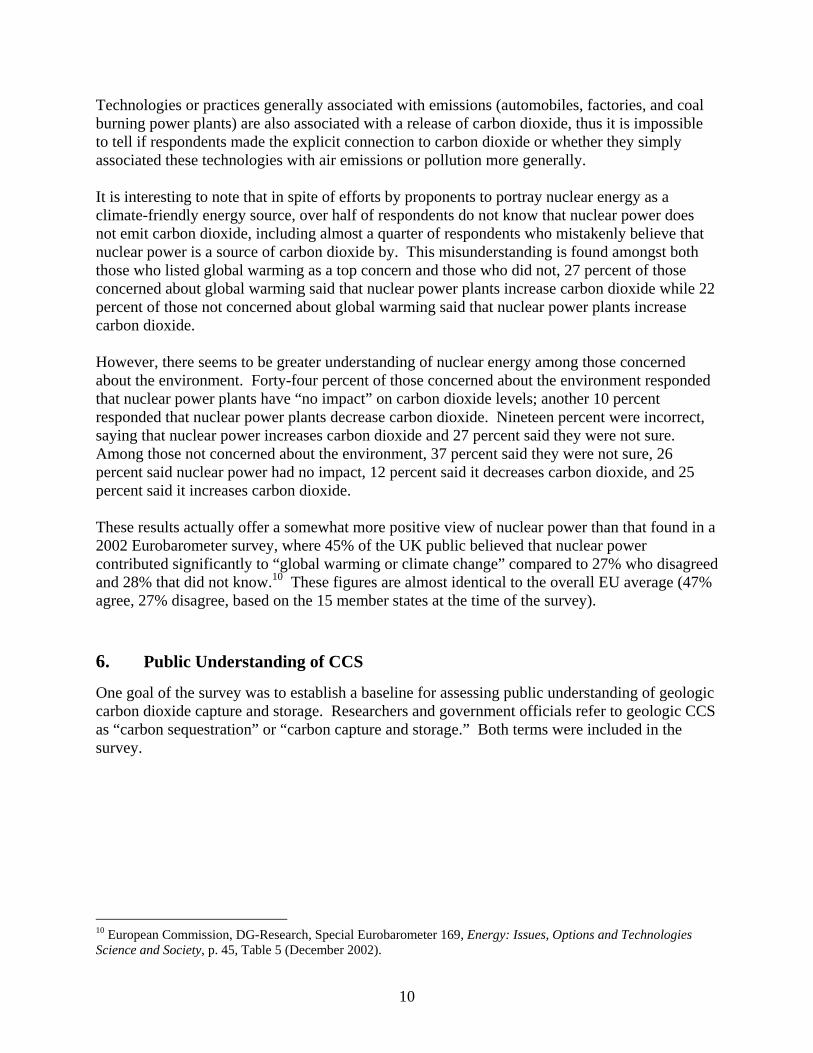
Figure 6.1 What Environmental Problem does CCS Address?
0%
20%
40%
60%
80%
100%
Toxicwaste
Ozonedepletion
Globalwarming
Acid rain Smog Waterpollution
Resourcedepletion
Can Reduce Does Not Reduce Not Sure
Question 6: Please select if “carbon sequestration” or “carbon capture and storage” can reduce each of the following environmental concerns. Figure 6.1 presents evidence of whether people knew what environment problem “carbon sequestration” or “carbon capture and storage” is intended to address. Given the limited number of respondents who had heard of or read about CCS in the past year (as shown in Table 6.1), it is not surprising that a large number of respondents answered “not sure” when asked what problem CCS addresses. Nevertheless, it is impressive that the highest number of “can reduce” responses were for the correct answer (global warming), which reflects an association between “carbon” and global warming. Moreover, aside from global warming, the next three most frequently chosen responses for problems CCS “can reduce” were related to atmospheric emissions (ozone depletion, acid rain, and smog). For comparison, Figure 6.2 shows the responses of those who said they had heard of or read about carbon capture and storage or carbon sequestration. Not surprisingly, those who said they had heard one of the two terms for CCS were more likely to give an answer other than not sure. That group seemed to have a particularly keen awareness of the linkage between CCS and global warming – fully eighty-five percent of that group correctly responded that CCS addressed global warming, whereas none (of a relatively small sample, n=58) provided the incorrect response.
12
Figure 6.2 What Environmental Problems does CCS Address? (Those who say they have heard of or read about carbon capture and storage or carbon sequestration)
0%
20%
40%
60%
80%
100%
Toxicwaste
Ozonedepletion
Globalwarming
Acid rain Smog Waterpollution
Resourcedepletion
Can Reduce Does Not Reduce Not Sure
7. Public Attitudes toward Climate Change-Mitigation Technologies
The survey asked respondents to select the technologies they would consider using to address global warming. Each technology was followed by a definition to provide the respondents with information about what they were selecting. This question appeared late in the survey and is the first time information was included. The entire list of technologies and definitions is included here.
• Bioenergy/biomass: Producing energy from trees or agricultural wastes. • Carbon sequestration: Using trees to absorb carbon dioxide from the atmosphere. • Carbon capture and storage: Capturing carbon dioxide from power plant exhaust and
storing in underground reservoirs. • Iron fertilisation of oceans: Adding iron to the ocean to increase its uptake of carbon
dioxide from the atmosphere. • Energy efficient appliances: Producing appliances that use less energy to accomplish the
same tasks. • Energy efficient cars: Producing cars that use less energy to drive the same distance. • Nuclear energy: Producing energy from a nuclear reaction. • Solar energy: Using the energy from the sun for heating or electricity production. • Wind energy: Producing electricity from the wind, traditionally in a windmill.
Figure 7.1 shows the responses.
13

Figure 7.1 Technological Preferences to Address Global Warming
0% 10% 20% 30% 40% 50% 60% 70% 80% 90% 100%
Iron fertilisation ofoceans
Carbon capture andstorage
Nuclear energy
Bioenergy/biomass
Carbon sequestration
Wind energy
Solar energy
Energy efficientappliances
Energy efficient cars
Definitely/Probably Use Definitely/Probably Not Use Not sure
Question 13: The following technologies have been proposed to address global warming. If you were responsible for designing a plan to address global warming, which of the following technologies would you use? Respondents strongly supported the use of bioenergy/biomass, carbon sequestration (defined in this case as using trees to absorb carbon dioxide.), solar energy, wind energy, and energy efficient appliances and cars. No respondents opposed the use of energy efficient cars or appliances and only a small percentage voiced any opposition to this set of technologies (although wind energy did elicit the largest negative response at 7%). By contrast, the public was more evenly divided on the question of nuclear energy, CCS and iron fertilisation, although for the latter two technologies, over fifty percent of respondents were unsure. Carbon capture and storage (defined here as storage in underground reservoirs) received a slightly net favourable response, whereas nuclear energy and iron fertilisation were viewed more negatively.
14

Those concerned about the environment were twice as likely as those not listing the environment as a primary concern to answer they would “definitely not use” nuclear energy (33 percent versus 17 percent). 8. Willingness to Pay to Solve Global Warming
Table 8.1 shows the respondent estimates of their previous month’s electric bill.
Table 8.1 Monthly Electricity Bill
Question 8: How much was your electric bill last month?
Amount Percent Under £10 2
£10-19 15 £20-39 42 £40-59 15 £60-79 4 £80-99 4
£100-149 3 More than £150 2
Don’t know 13
The largest percentage of respondents reported an electric bill between 20 and 40 pounds. Although most British households received electric bills on a quarterly basis, which might introduce some errors in reporting, these results are consistent with recent DTI data on electricity prices.11
Table 8.2 Willingness to Pay
Expressed Willingness to Pay Percent
Less than £5 22 £5 to £9.99 36
£10 to £19.99 26 £20 to £39.99 11 £40 to £59.99 3 £60 to £99.99 1
£100 or greater 2 Question 9: If it solved global warming, would you be willing to pay ___ more per month on your electricity bill?
Whilst a large percentage of people responded that that they would pay an additional £5 to £20 pounds on each month’s electric bill, willingness to pay drops off quickly above £20.
11 UK Department of Trade and Industry, Quarterly Energy Price Report, p. 13 (December 2004), available at http://www.dti.gov.uk/energy/inform/energy_prices/qep_dec04.pdf.
15
9. Response to Information
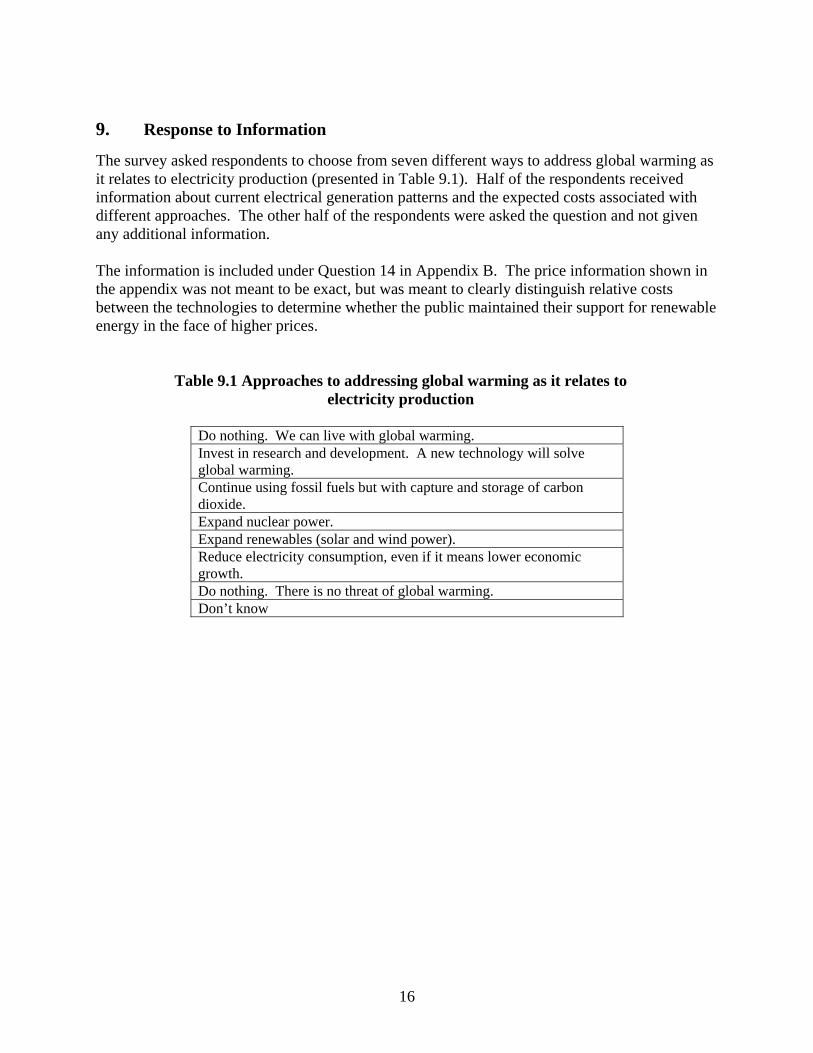
The survey asked respondents to choose from seven different ways to address global warming as it relates to electricity production (presented in Table 9.1). Half of the respondents received information about current electrical generation patterns and the expected costs associated with different approaches. The other half of the respondents were asked the question and not given any additional information. The information is included under Question 14 in Appendix B. The price information shown in the appendix was not meant to be exact, but was meant to clearly distinguish relative costs between the technologies to determine whether the public maintained their support for renewable energy in the face of higher prices.
Table 9.1 Approaches to addressing global warming as it relates to electricity production
Do nothing. We can live with global warming. Invest in research and development. A new technology will solve global warming. Continue using fossil fuels but with capture and storage of carbon dioxide. Expand nuclear power. Expand renewables (solar and wind power). Reduce electricity consumption, even if it means lower economic growth. Do nothing. There is no threat of global warming. Don’t know
16
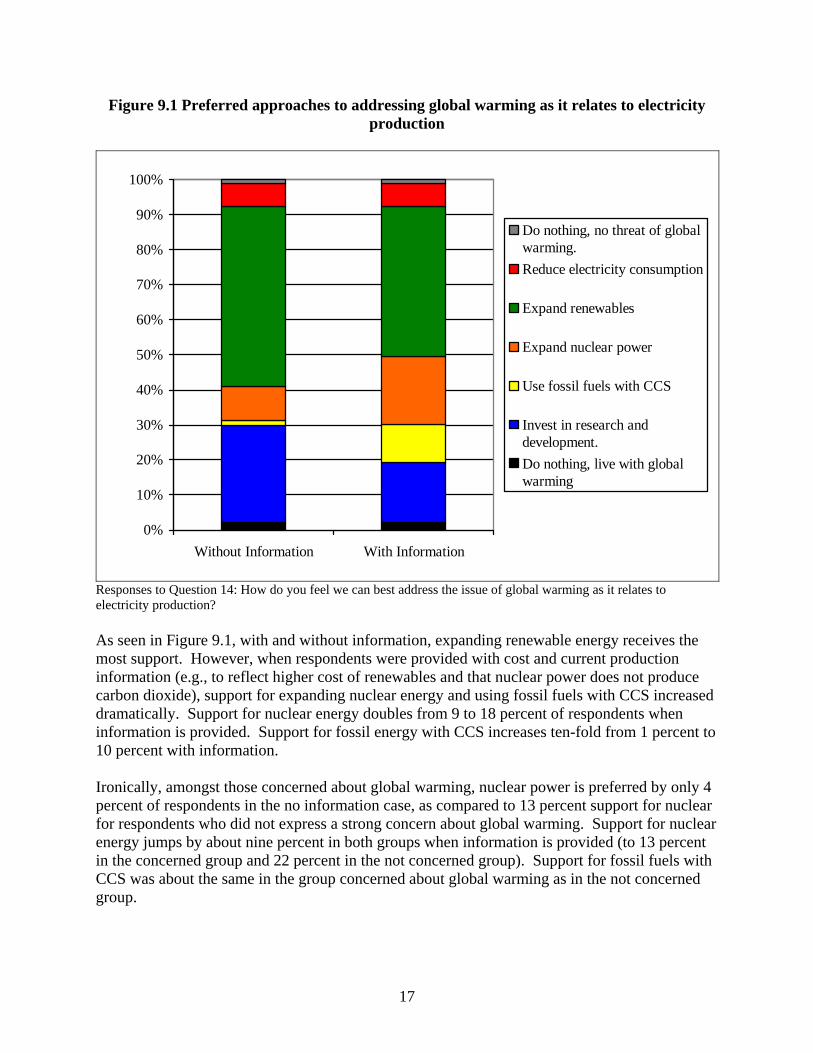
Figure 9.1 Preferred approaches to addressing global warming as it relates to electricity production
0%
10%
20%
30%
40%
50%
60%
70%
80%
90%
100%
Without Information With Information
Do nothing, no threat of globalwarming.Reduce electricity consumption
Expand renewables
Expand nuclear power
Use fossil fuels with CCS
Invest in research anddevelopment.Do nothing, live with globalwarming
Responses to Question 14: How do you feel we can best address the issue of global warming as it relates to electricity production? As seen in Figure 9.1, with and without information, expanding renewable energy receives the most support. However, when respondents were provided with cost and current production information (e.g., to reflect higher cost of renewables and that nuclear power does not produce carbon dioxide), support for expanding nuclear energy and using fossil fuels with CCS increased dramatically. Support for nuclear energy doubles from 9 to 18 percent of respondents when information is provided. Support for fossil energy with CCS increases ten-fold from 1 percent to 10 percent with information. Ironically, amongst those concerned about global warming, nuclear power is preferred by only 4 percent of respondents in the no information case, as compared to 13 percent support for nuclear for respondents who did not express a strong concern about global warming. Support for nuclear energy jumps by about nine percent in both groups when information is provided (to 13 percent in the concerned group and 22 percent in the not concerned group). Support for fossil fuels with CCS was about the same in the group concerned about global warming as in the not concerned group.
17
10. Summary
The survey suggests that whilst the environment is not a pressing concern for the majority of the public, a large fraction believes action should be taken to address global warming. The public strongly supports the use of renewable energy to address global warming and as a target of future research. Offering cost and usage information results in a small (6 percent) shift away from renewable energy towards nuclear energy and fossil fuel combustion with carbon capture and storage, but even with cost information renewable energy maintains a strong following. When asked to rank environmental concerns, global warming is by far the top environmental concern (especially among those who are concerned about the environment). Over 70 percent of respondents believe that action needs to be taken to address global warming; over 40 percent thinks that immediate action is necessary. When asked the importance of the economy compared to the environment, over 50 percent of respondents chose the environment. Eleven percent said the environment should be given a priority over the environment even if it hurts the economy. However, respondents moved away from the most expensive way to address global warming (renewable energy) when they were presented with cost information. In addition, although a large percentage of people responded that that they would pay an additional £5 to £20 on each month’s electric bill, willingness to pay dropped off quickly above £20. Nuclear energy continues to be confused as a greenhouse gas emitter and the technology attracts both strong support and opposition. Very few people in the UK have heard of CCS but those who have do seem to know what environmental concern it addresses. Support for CCS is mixed although most of public has neither a positive nor a negative opinion of the technology; with additional information, however, support for CCS does increase noticeably. As reflected in preferences for DTI priorities, individual technologies and global warming strategies, the strength of public support for renewable energy as the preferred approach to addressing global warming is quite robust.
18

Appendix A: Demographics of UK Survey Panel
Mean Age (Years) 40 to 49 Newspaper Male 47.6% The Express 4.1%Female 52.4% The Daily Mail / The Scottish Daily Mail 13.0% The Mirror / Daily Record 17.1%Region The Daily Star / of Scotland 1.1%North East 5.1% The Sun 21.0%North West 9.5% The Daily Telegraph 9.5%Yorkshire and the Humber 9.5% The Financial Times 0.9%East Midlands 7.3% The Guardian 7.1%West Midlands 11.4% The Independent 1.4%East of England 9.4% The Times 5.2%London 8.7% The Scotsman 0.4%South East 17.2% The Glasgow Herald 0.3%South West 8.0% Other local daily morning newspaper 2.9%Wales 4.7% Other newspaper 3.9%Scotland 9.4% None 12.2%Northern Ireland 0.0% Age 18 to 24 11.2% 25 to 29 8.9% 30 to 34 10.5% 35 to 39 9.2% 40 to 49 13.6% 50 to 59 19.7% 60 + 26.9%
19
Appendix B: UK Survey Questions and Answers
Question 1: Consider the following issues. What are the three most important issues facing the UK today?
Issue Listed among top three (%)
Asylum seekers 42 Terrorism 39
Crime 31 Health care 26 Education 17
Drugs 16 Aging population 15
Environment 13 Taxes 13
European Union 11 Economy 10
Family values 10 Foreign policy/Influence 10 Intro Euro/Keep Pound 7
Poverty 7 Welfare 6
Unemployment 5 Income inequality 5
Racism 4 Social exclusion 4
Inflation 2 Budget deficit 1
AIDS 1 Abortion 1
Stock market 0 Distribution of responses listing issue as one of the three most important
Question 2: Consider the following environmental problems. Which are the most important problem and second most important problem facing the UK today?
First
Choice (%)
Second Choice
(%)
Total (%)
Water pollution 2 7 9 Destruction of ecosystems 7 11 18
Toxic Waste 6 7 14 Overpopulation 16 13 29 Ozone depletion 7 9 16 Global warming 35 14 49 Urban sprawl 9 13 22 Smog 1 1 2 Endangered species 2 4 6 Acid rain 0 0 0 Resource depletion 12 12 24 GM crops 3 7 11
Total defined as those listing environmental problem as a first or second choice
Question 3: Many environmental issues involve difficult trade-offs with the economy. Which of the following statements best describes your view?
Statement Percent The highest priority should be given to protecting the environment, even if it hurts the economy. 11
Both the environment and the economy are important, but the environment should come first. 46
Both the environment and the economy are important, but the economy should come first. 30
The highest priority should be given to economic considerations such as jobs even if it hurts the environment.
3
Not sure 11
21

Question 4: Have you heard of or read about any of the following in the past year? Check all that apply.
Technology or Energy Source Percent More efficient cars 53 Solar energy 55 Nuclear energy 39 Wind energy 69 More efficient appliances 40 Hydrogen cars 26 Bioenergy/biomass 10 Carbon capture and storage 5 Carbon sequestration 2 Iron fertilisation 1 None of these 21
22
Question 5: If the UK Department of Trade and Industry has £5 billion to spend, which do you think should be the top priority?
First
Choice (%)
Second Choice
(%)
Total (%)
New energy sources: solar, wind, or bioenergy/biomass
35 17 52
Anti-terrorism and security 15 8 23
New oil and gas reserves 2 4 6 More energy efficient cars and trucks 6 12 18
Clean drinking water 5 2 7 Energy conservation 8 14 22 Ways to better manage toxic waste 3 6 8
Public transport 11 13 24 Nuclear waste disposal 2 5 7 Nuclear power 6 4 9 Ways to remove carbon from atmosphere 2 5 7
More energy efficient buildings 3 5 8
Hydropower 2 5 6 Cleaner burning coal 1 1 2
Question 6: Please select if “carbon sequestration” or “carbon capture and storage” can reduce each of the following environmental concerns.
Can
Reduce (%)
Does Not Reduce
(%)
Not Sure (%)
Toxic waste 11 20 69 Ozone depletion 33 7 61 Global warming 42 3 55 Acid rain 26 9 65 Smog 31 8 61 Water pollution 16 16 68 Resource depletion 11 17 71
23

Question 7: There is a growing concern about increasing levels of carbon dioxide in the atmosphere. How do you think the following contribute to these levels?
Technology or Practice
Increases Carbon Dioxide
(%)
Decreases Carbon Dioxide
(%) No Impact
(%) Not Sure (%) Automobiles 84 1 2 13 Factories 80 1 1 17 Coal burning power plants 81 2 1 16 Home heating 66 2 6 26 Breathing 56 3 21 21 Nuclear power plants 24 12 28 36 Farming 8 27 25 39 Trees 3 76 6 15 Oceans 1 33 30 36 Windmills 1 25 53 22
Correct responses
Technology or Practice Increases Carbon
Dioxide Decreases Carbon
Dioxide No Impact Automobiles Factories Coal burning power plants Home heating 12
Breathing Nuclear power plants Farming Trees Oceans Windmills
12 Depending on energy source of home heating. Someone heating their home with electricity that was entirely hydro, nuclear or renewables could be correct if they answered ‘decreases carbon dioxide’ or ‘no impact’, but it was impossible to identify these individuals
24
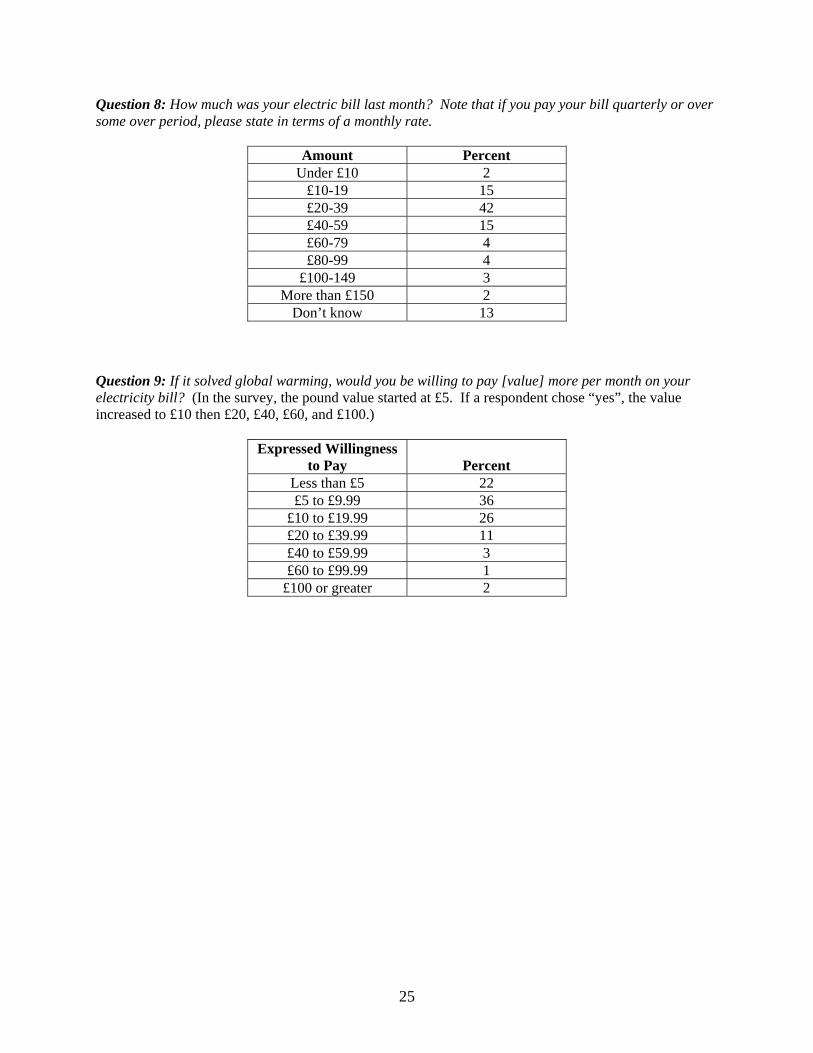
Question 8: How much was your electric bill last month? Note that if you pay your bill quarterly or over some over period, please state in terms of a monthly rate.
Amount Percent Under £10 2
£10-19 15 £20-39 42 £40-59 15 £60-79 4 £80-99 4
£100-149 3 More than £150 2
Don’t know 13 Question 9: If it solved global warming, would you be willing to pay [value] more per month on your electricity bill? (In the survey, the pound value started at £5. If a respondent chose “yes”, the value increased to £10 then £20, £40, £60, and £100.)
Expressed Willingness to Pay Percent
Less than £5 22 £5 to £9.99 36
£10 to £19.99 26 £20 to £39.99 11 £40 to £59.99 3 £60 to £99.99 1
£100 or greater 2
25

Question 10: From what you know about global warming, which of following statements comes closest to your opinion?
Opinion Percent Global warming has been established as a serious problem and immediate action is necessary. 41
There is enough evidence that global warming is taking place and some action should be taken. 33
We don’t know enough about global warming and more research is necessary before we take any actions. 18
Concern about global warming is unwarranted. 4 Not sure 4
Question 11: Many scientists believe that human activities, such as burning fossil fuels to drive cars and generate electricity, are causing the earth's atmosphere to warm somewhat. There are many ways that the UK may respond to this situation. Which of following statements comes closest to your opinion?
Likely Action Percent I believe that firms and government researchers will develop new technologies to solve the problem. 26
I believe we will have to change our lifestyles to reduce energy consumption. 27
I believe we will learn to live with and adapt to a warmer climate. 13
I believe global warming is a problem but the US won't do anything about it. 21
I believe we will do nothing since global warming is not a problem. 3
Not sure 10
26

UNITED KINGDOM SPECIFIC
Question 12a: The UK is currently in the process of joining a system for controlling greenhouse gas emissions run by the European Commission. Do you believe that the most appropriate level of government for controlling emissions is:
Level Percent UK 15 EU 8 International 54 Not sure 23
Question 12b: The UK government recently committed to reducing greenhouse emissions by 60% by 2050. Do you believe that such a target is:
Level Percent Desirable and reasonable 40 Desirable but impractical 43 Not desirable 4 Not sure 13
27
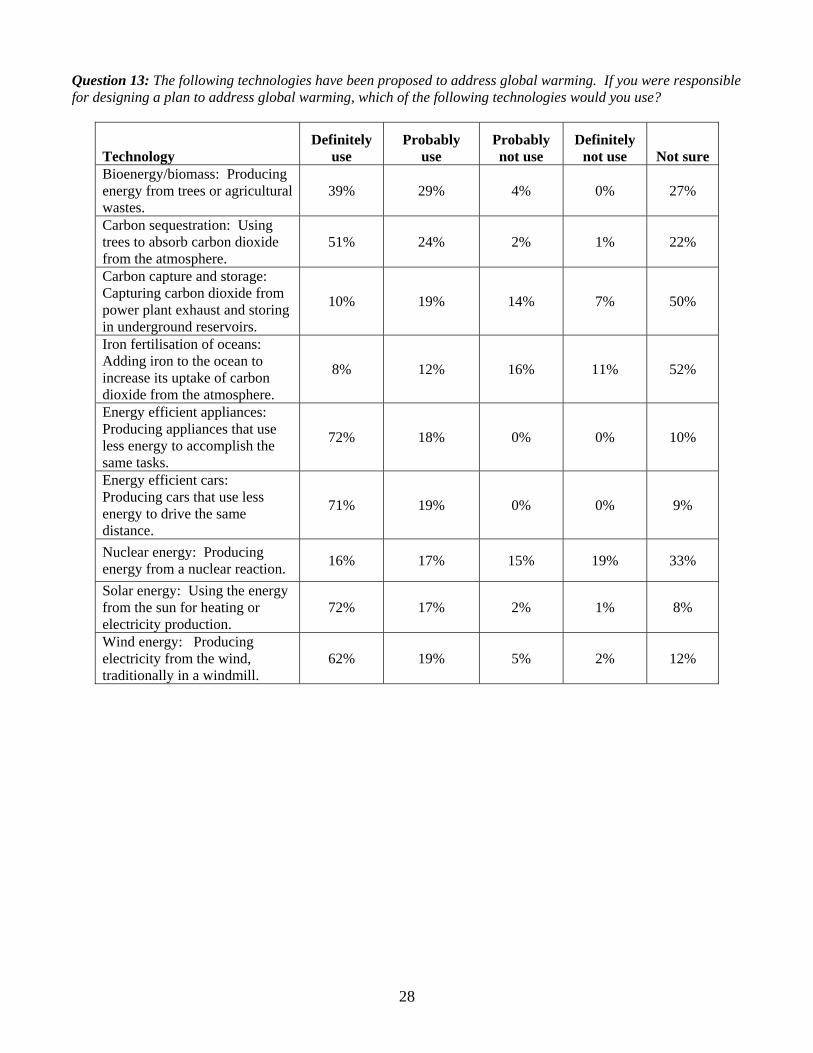
Question 13: The following technologies have been proposed to address global warming. If you were responsible for designing a plan to address global warming, which of the following technologies would you use?
Technology Definitely
use Probably
use Probably not use
Definitely not use Not sure
Bioenergy/biomass: Producing energy from trees or agricultural wastes.
39% 29% 4% 0% 27%
Carbon sequestration: Using trees to absorb carbon dioxide from the atmosphere.
51% 24% 2% 1% 22%
Carbon capture and storage: Capturing carbon dioxide from power plant exhaust and storing in underground reservoirs.
10% 19% 14% 7% 50%
Iron fertilisation of oceans: Adding iron to the ocean to increase its uptake of carbon dioxide from the atmosphere.
8% 12% 16% 11% 52%
Energy efficient appliances: Producing appliances that use less energy to accomplish the same tasks.
72% 18% 0% 0% 10%
Energy efficient cars: Producing cars that use less energy to drive the same distance.
71% 19% 0% 0% 9%
Nuclear energy: Producing energy from a nuclear reaction. 16% 17% 15% 19% 33%
Solar energy: Using the energy from the sun for heating or electricity production.
72% 17% 2% 1% 8%
Wind energy: Producing electricity from the wind, traditionally in a windmill.
62% 19% 5% 2% 12%
28

Question 14: How can we best address the issue of global warming? (In the survey, half of the sample was provided with information on cost and current use and half of the sample was provided with no additional information. The information is included here.) Now we would like to present some facts on electricity production and prices. The following chart shows our reliance on fossil fuels (coal, oil and natural gas) for producing electricity.
Coal
Oil and Other
Natural gas
Nuclear
Renewables
Based on published studies, we can summarise the electricity production costs as follows:
• Current electricity production costs are in the 2-3p/kWh range. • New nuclear plants would cost 3-4p/kWh and would emit no carbon dioxide. • New fossil fuel plants that capture and store carbon dioxide would reduce carbon
dioxide emissions by 90% and cost 3-4p/kWh. • While some opportunities for wind exist at 3p/kWh, significant expansion of
renewables (solar and wind power) would cost more than 5p/kWh. Considering these facts, how can we best address the issue of global warming as it relates to electricity production?
29
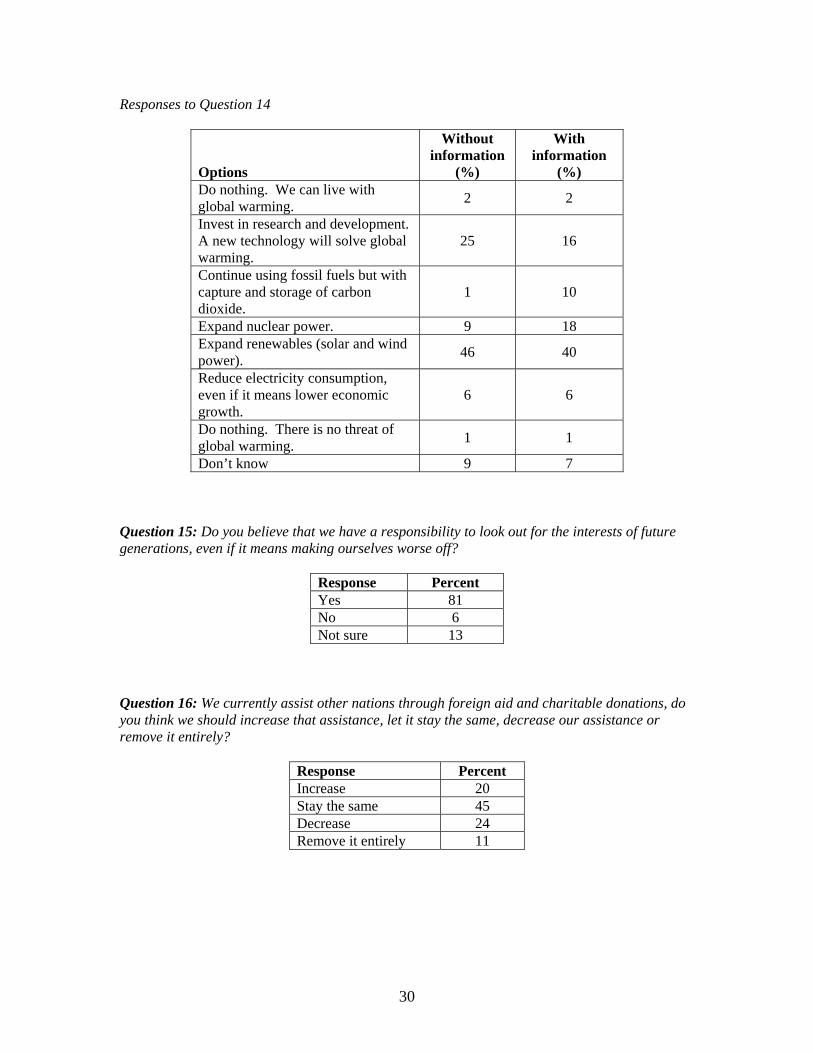
Responses to Question 14
Options
Without information
(%)
With information
(%) Do nothing. We can live with global warming. 2 2
Invest in research and development. A new technology will solve global warming.
25 16
Continue using fossil fuels but with capture and storage of carbon dioxide.
1 10
Expand nuclear power. 9 18 Expand renewables (solar and wind power). 46 40
Reduce electricity consumption, even if it means lower economic growth.
6 6
Do nothing. There is no threat of global warming. 1 1
Don’t know 9 7 Question 15: Do you believe that we have a responsibility to look out for the interests of future generations, even if it means making ourselves worse off?
Response Percent Yes 81 No 6 Not sure 13
Question 16: We currently assist other nations through foreign aid and charitable donations, do you think we should increase that assistance, let it stay the same, decrease our assistance or remove it entirely?
Response Percent Increase 20 Stay the same 45 Decrease 24 Remove it entirely 11
30

Question 17: How do you heat your home?
Response Percent Oil 3 Electricity 20 Natural Gas 72 Wood 1 No Heating 1 Don't know 1 Other 2
Questions 18: How would you describe your overall point of view in terms of the political parties? Would you say you would usually support Labour, Conservative, Liberal Democrats, a regional party (SNP, Plaid Cymru), or other parties?
Party Percent Labour 36 Conservative 27 Liberal Democrat 15 Regional party (SNP, Plaid Cymru) 2 Other 3 I don't tend to support any political party 13
Not sure 4 Questions 19: How often do you attend a place of worship, such as a church, mosque, or temple?
Response Percent At least once a week 6% Almost every week 3% About once a month 3% Seldom 46% Never 43%
31

Questions 20: How many children do you have under the age of 18?
Number of Children Percent 0 73 1 12 2 11 3 3 More than 4 <1
32