a survey of capital budgeting practices for insurance
TRANSCRIPT

A SI KVF.V OF CAPITA! IWDUETINC PRACTICES FOR INSURANCEC(>MPANIF.S IN KENYA
BY
( ; i . \ P v s m a t in d u r a o y a r o
D61/70286/2008
A MANAGEMENT U FsFA U rn PROJECT Sl itMI I I I I ) IN PARTIAL FULFILMENT OF t h e REQUIREMENT FOR THE DEGREE OF M ASTER
OF BUSINESS u )m ,>ISTRATION. UNIVERSITY OF NAIROBI
OCTOBER 2009

DECLARATION
I declare lhal this is my original work and has noi been submitted to any other college,
institution or university for an award o f a degree
S ig n ed ___________________D u e : ___ 0 5 ™ (JcvEn'BW aeroG L A D Y S M A T I W H R A O Y A R O
1 )61 /70286 /2008
This project has been submitted for examination with my approval as university supervisor.
Signed Date
IIERICK ONDICiO

DEDICATION
I his research is dedicated to (jod for the good health and strength throughout the study
period and all my MBA colleagues for their moral support.
I dedicated this research work to my Dad. Mum and Damaris indeed you both inspired
me to have a reason to study.
iii

This research work has come out as an upshot of massive support from assorted
individuals. My initial and leading acknowledgement goes to the almighty God for his
blessings and graciousness for enabling me reach this point.
I would like to acknowledge my supervisor Mr. Ilcrick Ondigo for his advice and tireless
efforts in the supervision during my research work and writing of this project. I hanks to
my moderator Mr. Odipo for the guidance. I also wish to thank all my lecturers
throughout the programme period for the solid foundation
I am indebted to the University o f Nairobi, School of Business for providing favourable
space that has enabled me to achieve this type of knowledge.
I appreciate the efforts of my parents for taking me to school and for sacrificing a lot lor
my sake. I greatly appreciate (heir financial support to pay for my education I also
extend my gratitude to my brothers and sister Moses, Evans and Damans. Their
unconditional love, support and understanding could not go unobserved.
AC KNOWEFDG EM ENT
I will not forget the intellectual and moral support of the following classmates o f the
MBA Finance (2008 * 2009) class and friends: Alec. Julia. Maggie and Ali for their
encouragements. It's incredible to mention by names all those who assisted me. however,
to all of you I am deeply obliged and feel privileged.
iv

TABLE OF COM ENTS
DECLARATION....................................................................................................................... ii
DEDICATION.......................................................................................................................... iii
ACKNOWLEDGEMENT........................................................................................................iv
LIST OF TABLES................................................................................................................... vii
LIST OF FIGURES................................................................................................................viii
ABSTRACT............................................................................................................................... ix
CHAPTER O NE......................................................................................................................... I
1.0 INTRODUCTION................................................................................................................I
I . | Background o f the study............................................................................................... I
1.1.1 The Insurance Companies in Kenya.......................................................................31.2 Statement o f the problem................................................................................................6
1.3 objective o f the study...................................................................................................... 7
1.4 Importance o f the study.................................................................................................. 7
CHAPTER TW O........................................................................................................................9
2.0 LITERATURE REVIEW................................................................................................... 9
2.1 Introduction.....................................................................................................................9
2.2 Capital budgeting...............................................................................................................9
2.2.1 Net present value...................................................................................................... 92.2.2 Internal rate of return............................................................................................. 122.2.3 Equivalent annuity method....................................................................................132.2.4 Real options............................................................................................................ 132.2.5 Ranked Projects......................................................................................................142.2 6 Advantages and Disadvantages of IRK and NPV.............................................15
2.3 Other Techniques Used By Insurance companies...................................................... 15
2.3.1 Capital Allocation...................................................................................................152.3.2 Recognition o f risk..................................................................................................16
2.3.3 Real options and capital budgeting........................................................................... 16
2.3.4 Business risk and economic capital ................................................................... 192.3.5 Measurement criteria............................................................................................... 20
2.3.6 Analogue company approach'peer group analysis............................................. 212.3.7 Statistical methods................................................................................................. 22
2.3.8 Pricing Insurance Contracts. Risk Management Costs, and Equity Capital......23
2.4 | mpirical studies on Optimal Capital Budgeting practices.......................................24
2.5 Capital Budgeting and Performance............................................................................ 25
v

2.6 Conclusion:..................................................................................................................27
Cl IAPTUR THRF.F.................................................................................................................. 28
3.0 RESEARCH METHODOLOGY................................................................................... 28
3.1 Introduction.................................................................................................................... 28
3.2 Research design............................................................................................................. 28
3.3 Population...................................................................................................................... 28
3.4 Data collection...............................................................................................................28
3.5 Data analysis.................................................................................................................. 29
CHAPTER FOUR.................................................................................................................... 30
DATA ANALYSIS AND INTERPRETATIONS................................................................ 30
4.1 Introduction..................... - ........................................................................................... 30
4.2 General Information...................................................................................................... 30
4.3 Capital Budgeting and Net Present Value.................................................................. 34
4.4 Capital Budgeting Techniques and Performance........................................................36
4.4 Capital Budgeting Techniques and Performance........................................................36
CHAPTER FIVE......................................................................................................................39
DISCUSSIONS. CONCLUSIONS AND RECOMMENDATIONS................................. 39
5.1 Introduction.................................................................................................................... 39
5.2 Discussions.................................................................................................................... 39
5.3 Conclusions.................................................................................................................... 40
5.4 Recommendations..........................................................................................................4 1
5.5 Limitations o f the Study................................................................................................ 4 1
5.6 Suggestions for further Research................................................................................ 41
References................................................................................................................................. 42
APPENDIX I: QUESTIONNAIRE........................................................................................50
VI

LIST OFTAHI.KS
Tabic I: Insurance Industry Performance in 2006................................................................. 4
I able 2: Duration That the Organizations Has Been In Operation in Kenya.................... 30
Table 3: Ownership o f the Organization................................................................................ 3 1
I able 4: Number o f Full I ime Lmployccs I hat the Organization Have............................32
Table 5: Duration I hat the Respondent Has Been Working In the Organization............33
Table 6: Budgeting Techniques That the Company Uses................................................... 34
I able 7: Applicability of the Formal Methods Used In Capital Budgeting...................... 35
Table 8: Relationship between Capital Budgeting Techniques and Firm Performance... 36
I able 9: Behavioural Outcomes of Capital Budgeting Process Lxperienced In the
Organizational Planning Process I hat AITect Performance............................................... 37
Table 10: Liquidity Ratios That Have Influenced Capital Budgeting...............................38
vii

LIST OF FIGURES
figure I: Duration I hat the Organizations Has Been In Operation in Kenya ................. 31
Figure 2: Ownership o f the Organization..............................................................................32
figure 3: Number of Full I ime Employees I hat the Organization H ave..........................33
f igure 4: Duration I hat the Respondent Hus Been Working In the Organization............ 34

ABSTRACT
The effect of ihe capital budgeting decision-making process will result in the generation
of more capital needed for company operations in the form o f retained earnings. I his
consequently lead to the pouring in of additional capital investments from new investors
because a positive rating gives investors confidence in the company’s operations and
ability to pay debts and claims in case o f insurance companies. It's difficult for
companies to make proper planning during the capital budgeting process if the cost of
capital is low or incapable of meeting its required financial budget such as acquiring a
new business. This study therefore sought to survey the relationship between C apital
Budgeting practices o! insurance companies in Kenya.
The study used descriptive study design. Ihe population of interest o f the study was one
employee selected from each ol the -12 insurance companies. Primary data was collected
using structured questionnaires which were the main data collection instruments. The
questionnaires had both close-ended and open ended questions. Data was analysed
quantitatively and descriptive statistics such as mean scores, frequencies and percentages
were used to analyse the data Data was then presented using frequency tables.
from the study, the researcher found that Capital Budgeting Techniques enhances
performance in insurance companies in Kenya. I his is because from the study, capital
budgeting techniques places a high importance on the budget-to-actual comparison for
performance evaluation purposes, being a standard for performance they are used to
evaluate managerial performance and they are used by insurance companies in Kenya for
setting goals and evaluating performance. The researcher therefore recommends that all
the insurance companies should fully embrace capital budgeting so as to increase
efficiency and effectiveness in their organizations.
ix

CHAPTER ONE
1.0 INTRODUCTION
1.1 Background of the study
A survey o f the capital budgeting practices of Insurance companies in Kenya is
important. I bis is because Insurance companies form part o f the financial System and
hence crucial to the economy as a whole.
Capital budgeting is the rational allocation o f financial resources among competing
multi-period projects. Brigham (1985) suggests that capital budgeting is the process ol
analysing planned expenditures on fixed assets. Schwarz (1987) suggests that capital
budgeting is un integral component of the organization’s strategy/plans.1 budgets process.
Capital budgeting is a process o f evaluating and selecting long term investments
consistent with the firm’s goal o f maximizing shareholders wealth (Investment
Appraisal).Capital budgeting has been widely utilized as a management and strategic
olanning tool by corporations. Chandra (1987) suggests that the budgeting process often
has many behavioural outcomes in the organizational planning process, such as enhanced
goal congruence and more universal participation. Currently, a majority of major
corporations make use of some type o f capital budgeting technique in their strategic
performance measurement process.
Capital budgets are used to evaluate managerial efficiency and effectiveness Srinivasan.
(1987). Similarly. Douglas (1994) used a case study approach and found that capital
budgeting techniques places a high importance on the budgct-to-actual comparison for
performance evaluation purposes both at the corporate and the subsidiary levels.
Anderson (199^) ulso supported this view, stating that in most IJS companies the
development of budget is still used as the main measurement system. The adoption of
capital budgeting models tends to be crucial for the success o f both Insurance and
^insurance companies in today's dynamic and outcome-oriented environment
Researchers in insurances companies suggest that members, regulators and other
stakeholders arc demanding more accountability and better performance from
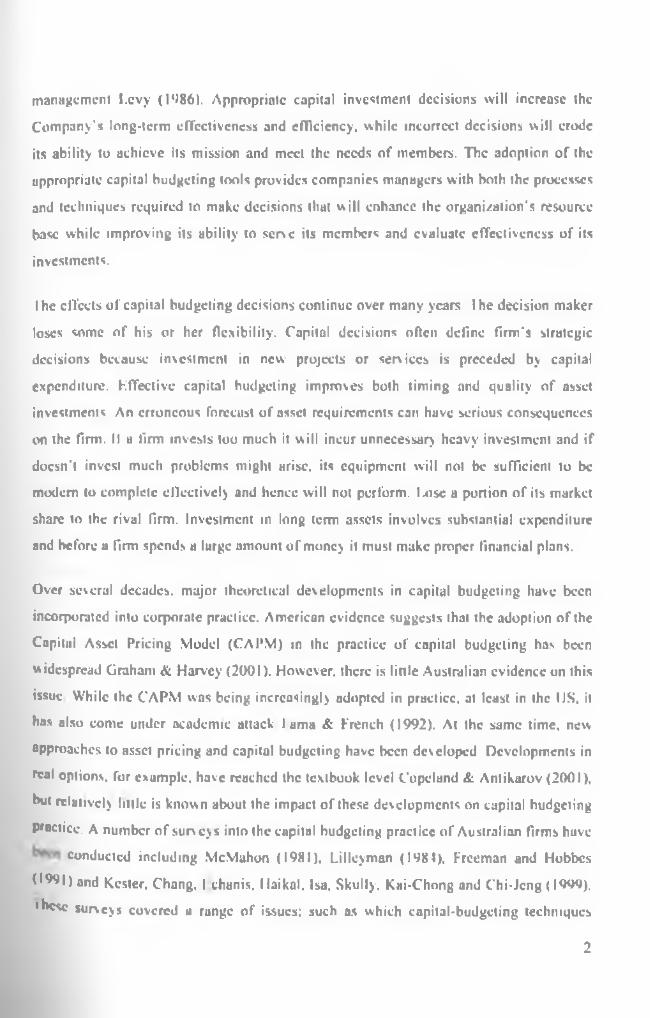
management Levy ( I ‘>86), Appropriate capital investment decisions will increase the
Company’s long-term effectiveness and efficiency, while incorrect decisions will erode
its ability to achieve its mission and meet (he needs of members. The adoption o f the
appropriate capital budgeting tools provides companies managers with both the processes
and techniques required to make decisions that will enhance the organization's resource
base while improving its ability to serve its members and evaluate effectiveness of its
investments.
I he effects of capital budgeting decisions continue over many years I he decision maker
loses some o f his or her flexibility. Capital decisions often define firm's strategic
decisions because investment in new projects or services is preceded by capital
expenditure. Lffective capital budgeting improves both timing and quality o f asset
investments An erroneous forecast of asset requirements can have serious consequences
on the firm. II a firm invests too much it will incur unnecessary heavy investment and if
doesn't invest much problems might arise, its equipment will not be sufficient to be
modem to complete ellectively and hence will not perform. Lose a portion of its market
share to the rival firm. Investment in long term assets involves substantial expenditure
and before a firm spends a lurge amount o f money it must make proper financial plans.
Over several decades, major theoretical developments in capital budgeting have been
incorporated into corporate practice. American evidence suggests that the adoption o f the
Capital Asset Pricing Model (CAIVM) in the practice of capital budgeting has been
widespread Graham & Harvey (2001). However, there is little Australian evidence on this
issue While the CAPM was being increasingly udopted in practice, at least in the IJS, it
has also come under academic attack l ama & French (1992). At the same time, new
approaches to asset pricing and capital budgeting have been developed Developments in
real options, for example, have reached the textbook level Copeland & . Antikarov (2001),
hut relatively little is known about the impact of these developments on capital budgeting
practice. A number of surv ey s into the capital budgeting practice of Australian firms have
conducted including McMahon (1981), Lillcyman (1981), Freeman and Hobbes
(•991) and Kester. Chang. I chanis. Ilaikal, Isa. Skully, Kai-Chong and Chi-Jcng (1999),
•hese surveys covered a range of issues; such as which capital-budgeting techniques
2

were used, how firms ranked Ihc importance of these techniques, und how discount rates
were determined.
Numerous capital budgeting surveys have been conducted overseas e.g. Gitman &
Mercurio ( I ‘>82): Block I W ; Gitman & Vandenberg (2000); Graham & llarvcy( 2001);
Arnold & Hal/opoulos (2000); Ryan A: Ryan (2002); Mcl.aney, Pointon. Thomas &
Tucker (2004); Brounen. Dc Jong & . Koedijk (2004); Payne. Heath & Gale (1900). These
surveys found that Discounted Cush flow based techniques Internal Rate of Return (IKK)
and Net Present Value (NPV) were dominant and the CAPM was the most popular
approach to estimating Ihc cost o f capital. IRR and NPV arc the most frequently used
capital budgeting techniques. Other techniques such as the payback period are less
popular, but are still being used by a majority of companies Graham and Harvey (2001).
Block (190?) found that the payback method was preferred by small firms. Despite being
advocated by academics as a method that could supplement and overcome the limitations
of discounted cash (low methods, real options techniques were relatively unpopular, they
ranked eighth among twelve techniques considered by Graham and Harvey. Kven so.
27% of respondents reported using real options techniques. Graham and I larvey found
that the CAPM was the most popular method of estimating the cost o f equity with 73% of
respondents rely ing mainly on the CAPM. Compared to two previous surveys o f US
companies. Gitman and Mercurio (1982) and Gitman and Vandenberg (2000), the CAPM
had increased in popularity. An increase in the alignment of the capital budgeting practice
ol US firms with academic prescriptions was also observed by Ryan and Ryan (2002)
1.1.1 The Insurance Companies in Kenya
Hie main players in the Keny an insurance industry arc: insurance companies, reinsurance-
companies. insurance brokers, insurance agents and the risk managers. The statute
regulating the industry is the insurance Act; Laws of Kenya, Chapter 487. The office of
the commissioner of insurance was established under its provisions to strengthen the
government regulation under the Ministry o f Finance There is also self-regulation of
insurance by the Association of Kenya Insurers (AKI). I he professional body of the
industry is the Insurance Institute of Kenya (UK), which deals mainly with truining and
Professional education. AKI; Insurance Statistics Report 2005
3

The performance in Ihc insurance companies has continued to improve The gross profit
before tux rose from KShs 4.32 billion in 2005 to KShs 5.80 billion in 2006 representing
a growth o f 35%.AKI mainly attributed the good performance to the overall economic
growth of 6.1% in the country . Over the same period, the total assets held by the industry
increased by 20.6% to KShs. 110.07 billion while the total liabilities incurred increased
by 17.3% to KShs. 82.67 billion. The net assets increased by 31.6% to KShs. 27.40
billion. The claims and total expenses (including net commissions) increased by 22.7%
and 15.4% to KShs. 21.20 billion and KShs. 14.77 billion respectively. I his information
is summarized in figure 1.4 below
Table I: Insurance Industry Performance in 2006
YKAR 2006 PERFORMANCE % change from 2005
Overall Economic Growth 6.1%
Total assets held by the
industry' (Billion KShs)
110.07 20 6% increase
I'otul Liabilities (Billion
KShs)
82.67 17.3% increase
Net Assets 27.40 31.6% increase
Claims 21.20 22.7% increase
Total expenses (including net
commissions)
14.77 15.4% increase
Source: Performance in Insurance Sector (AKI, 2006)
In 2007, there were 43 insurance companies and 2 locally incorporated reinsurance
companies licensed to operate in Kenya. O f the licensed insurance companies. 20 were
general insurers, 7 long term insurers and 15 were composite (both life and general)
insurers. In addition, there were 201 licensed brokers. 21 medical insurance providers
(MIPS). 2.665 insurance agents, 23 loss adjusters. I claims settling agent, 8 risk
managers. 213 loss assessors^'investigators and 8 risk managers in 2007.
Short term business continues to dominate the Kenyan market with its premiums making
•PProximutcly 70% of the o f gross written premium (including deposit administration
contributions) in 2007.
4

rhe gross written premium by ihc industry was Kshs 48.10 billion compared to Kshs
41.68 in 2006 representing u growth of 15.40%.
The gross written premium from General insurance was Kshs 32.95 billion (2006: Kshs
29.2 billion) while that from long term business was Kshs 14.44 billion (2006: Kshs
12.48 billion). I his is u ratio of about 70:30 in favour of general insurance. General
insurance premium grew by 12.8% while life insurance premium and contributions from
deposit administration business grew by 15.7%. The industry recorded growth over the
last six years as illustrated in table 2 below. The penetration of insurance computed as a
ratio of Gross Premium to Gross Domestic Product (GDP) was 2.65% compared to
2.54% in 2006. I ong term insurance recorded a penetration ratio of 0.83% while that of
general insurance was 0.83%
I he biggest players in Life insurance sub sector are Jubilee Insurance. CFC Life. British
American. Madison and Pan Africa insurance companies. On the other hand, the giants in
the general business arc American International Group (AIG). Blue Shield Insurance
Company. Heritage A.1.1. Insurance Company, and Insurance Company of Last Africa
(ICliA), Kenindia Assurance Company Ltd. and the Lion of Kenya Insurance Company
Ltd. AK1: Insurance Statistics Report 2005. The insurance sector is divided into two
broad sub sectors namely; General and Life insurance. I hc general insurance sector is by
far the larger of the two in terms of si/c and market penetration. The general insurance
penetration as a percentage o f GDP is 1.79% while that o f life is 0.78%. At the end of
2001, the gross premium written for the general business was over Kshs 16 billion. Ihc
figure had reached over Kshs 25 billion by the end of 2005. I hc corresponding figures
for the Life business were Kshs 7.3 billion and Kshs 11 billion respectively .
According to the Kenya Insurance Survey KPMG. (2004). the General insurance
industry in Kenya is mainly driven by four main lines of business: Motor- Commercial.
•re- Industrial and Engineering, Motor- Private and Personal Accident. I he life
insurance industry is mainly driven by two main lines o f business: Ordinary Life and
Superannuation, which includes Group Life Insurance and Deposit Administration. Ihc £
®y revealed that the General insurance business is lacing two major challenges.
5

The first challenge is to come up with a solution for companies whose viability is
threatened by their inability to meet policy holder claims. The second major challenge is
how to generate growth for an industry that has significant potential for growing as a
percentage of GDP but has been stagnant. In contrast to the General insurance business,
the life insurance business enjoyed a real cumulative average growth rate of K.6 per cent
between years 2000 and 200-1.
Capital budgeting (or investment appraisal) is the plunning process used to determine
whether a firm's long term investments such as new machinery-, replacement machinery,
new plants, new products, and research development projects arc worth pursuing. It is
budget lor major capital, or investment, expenditures Ryan (2002). Many formal methods
arc used in capital budgeting, including the techniques such as Net present value
.Profitability index .Internal rate of return .Modified Internal Rale of Return and annuity.
Ihcsc methods use the incremental cash Hows from each potential investment, or project
Techniques based on accounting earnings and accounting rules are sometimes used -
though economists consider this to be improper - such as the accounting rate of return,
and "return on investment." Simplified and hybrid methods are used as well, such as
pay back period and discounted pay back period.
1.2 Statement of the problem
I hc effect of the capital budgeting decision-making process will result in the generation
of more capital needed lor company operations in the form of retained earnings. This
consequently lead to the pouring in of additional capital investments from new investors
because a positive rating gives investors confidence in the company’s operations and
ability to pay debts and claims in ease of insurance companies. It’s difficult for
companies to make proper planning during the capital budgeting process if the cost of
capital is low or incapable of meeting its required financial budget such as acquiring a
new business. Capital budgeting relies on the money available for disposal. How much
die company can borrow from lenders or re-invest from retained earnings will help in its
final decision on investments. The survival of a company depends very much on its
ability to generate returns from its investments. Capital expenditures required in
Investment normally involve large sums of money and the benefits of the expenditures
6

may extend over the future. Utilising a systematic capital budgeting process would
enhance capital expenditures decisions. Capital budgeting can be defined as the process
of evaluating and selecting long term investments consistent with the firm owners* goal
of wealth maximization Gitman (1988). The process could be based mainly on managers'
judgement or based on quantitative analysis using scientific and analytical tools. Ik
instituting a systematic capital budgeting decision process introduces procedures to
mitigate some of the negative influences o f subjective capital expenditure decision
making.
Studies on the practice of capital budgeting in many countries have shown that over the
years, firms are increasingly employing more capital budgeting techniques for making
investment decisions Klammer (1973). Klammer & Walker (1984), Pike (1988). Kuhana
(1998). These findings have motivated researchers to study the relationship between the
capital budgeting practices and firm performance, in terms of profitability.
Local studies done in Kenya include Kadondi (2002) who conducted a survey of capital
budgeting techniques used by companies listed at the Nairobi Slock Lxchangc. To the
best of the researcher's knowledge, there is no study which has been done on the
relationship between capital budgeting practices and Insurance companies performance.
1.3 objective of the study
Lhe objective of the study was to survey the Capital Mudgeting practices for insurance
companies in Kenya.
1.4 Importance of the study
Kegulators- Provide the basis for regulatory policy in the case for the Insurance
companies it is the Association of Kenya Insurers (AKI).
Investors-Will help investors to understand the factors that influence the return on their
investment. I hey require more accountability and better performance by management
Potential and current scholars- This will expand their knowledge on capital budgeting
techniques and identify areas of further study.
7

Policy Makers- This will help policy makers of the Insurance sector such as Reinsurers
and the Ministry of Finance and (Manning among others with the development and review
of existing policies to achieve synergy with the existing circumstance.
8

CHAP I KK TWO
2.0 LITERATURE REVIEW
2.1 Introduction
This chapter summarizes the information from other researchers who have carried out
their research in the same study of capital budgeting. I he specific areas covered here are
capital budgeting techniques and the relationship between capital budgeting techniques
and performance of insurance companies in Kenya.
2.2 Capital budgeting
Capital budgeting (or investment appraisal) is the planning process used to determine
whether a firm's long term investments such as new machinery, replacement machinery,
new plants, new products, and research development projects arc worth pursuing. It is
budget lor major capital, or investment, expenditures Ryan (2002). Many formal methods
are used in capital budgeting, including the techniques such as Net present value
.Profitability index .Internal rate of return .Modified Internal Rale o f Return and
Equivalent annuity .These methods use the incremental cash Hows from each potential
investment, or project Techniques based on accounting earnings and accounting roles are
sometimes used - though economists consider this to he improper - such as the
accounting rate o f return, and "return on investment." Simplified and hy brid methods arc
used as well, such as payback period and discounted payback period.
2.2.1 .Net present value
Irving Fisher ( l ‘>30) put forward a separation theorem theory which suggests that a firm
will attempt to maximize its present value, no matter what the firm owners may think are
their personal objectives. The separation theorem hypothesizes that firm owners will
make decisions to first maximize the present value, and only then make decisions which
will bring them closer to reaching their personal goals.
9

Bach potential project's value should be estimated using a discounted cash flow (DCF)
valuation, to Find its net present value (NPV). First applied to Corporate Finance by Joel
(1951) on Fisher’s separation theorem. Williams (1947) I his valuation requires
estimating the size and timing o f all o f the incremental cash flows from the project. These
future cash flows arc then discounted to determine their present value. These present
values are then summed, to get the NPV. See also Time value o f money The NPV
decision rule is to accept all positive NPV projects in an unconstrained environment, or il
projects are mutually exclusive, accept the one with the highest NPV.The NPV is greatly
affected by the discount rate, so selecting the proper rate - sometimes called the hurdle
rate - is critical to making the right decision. I he hurdle rale is the minimum acceptable
return on an investment. It should reflect the riskiness o f the investment, typically
measured by the volatility of cash flows, and must take into account the financing mix.
Managers may use models such as the CAPM or the APT to estimate a discount rate
appropriate for each particular project, and use the weighted average cost of capital
(WACC) to reflect the financing mix selected.
A common practice in choosing » discount rate for u project is to apply a WACC that
applies to the entire firm, but a higher discount rate may be more appropriate when a
project’s risk is higher than the risk of the (irm as a whole An NPV calculation attempts
to determine the present value of a scries of cash flows from a project that stretches out
into the future. This present value is a measure o f how much the company is gaining at
today’s money by undertaking the project: in other words, how much more the company
itself will be worth by accepting the project. In risk analysis models, this uncertainty is
represented by the spread o f the distributions of cash flow for each period. In our
experience, NPV calculations performed in a risk analysis spreadsheet model arc usually
prevented as a distribution o f NPVs because the cash flow values selected in the NPV
calculations arc their distributions rather than their expected values, t heoretically, this is
incorrect. Since an NPV is the net present value, it can have no uncertainty. It is the
amount ol money that the company values the project at today. Theoretically correct
methods for calculating an NPV in risk analysis are discussed below, along with a more
Poetical, but strictly speaking incorrect, alternative
10

Theoretical approach I: Discount the cash flow distributions at the risk free rate
This produces .1 distribution o f NPVs at rf and ensures that the risk is not double-counted.
However, such a distribution is not at all easy to interpret since decision-makers will
almost certainly never have dealt with risk free rate NPVs and therefore have nothing to
compare the model output against.
Theoretical approach 2: Discount the expected value of each cash flow at the risk rate.
This is the application of the above formula. It results in a single figure for the NPV of
the project. A risk analy sis is run to determine the expected value and spread of the cash
flows in each period. I he discount rate is usually determined by comparing the riskiness
associated with the project's cusli flows against the riskiness ol other projects in the
company's portfolio. The company can then assign a discount rate above or below its
usual discount rale depending on whether the project being analyzed exhibits more or less
risk than the average. Some companies determine a range of discount rates (three or so)
Ihe major problems of this method are that it assumes the cash flow distributions arc
symmetric and that no correlation exists between cash flows. We have seen that
distributions oI costs and returns very often exhibit some form o f asy mmetry. In a typical
investment project, there is also almost always some form o f correlation between cash
flow periods: for example, sales in one period will be affected by previous sales, a capital
injection in one period often means that it doesn't occur in the next one (c.g. expansion of
u factory) or the model may include a time series forecast of prices, production rates or
sales volume that are auto correlated. If there is a strong positive correlation between
cash flows, this method will overestimate the NPV. Conversely, a strong negative
correlation between cash Hows will result in the NPV being underestimated. The
correlation between cash flows may take any number of, sometimes complex, forms. We
are not aware of any financial theory that provides a practical method for adjusting the
NPV to take account of these correlations.
Die practical approach:
The above two theoretical approaches are difficult to apply or interpret and beg an
•^tentative. In practice, it is easier to apply the risk-adjusted discount rate r to the cash
II
U N lV k K i» n V L .LOWER KAPETE library

How distributions to produce a distribution of NPVs. Ibis method incorporates
correlation between distributions automatically and enables the decision-maker to
compare directly with past NPV analyses.
2.2.2 Internal rate of return
I he internal rate of return (IRK) is defined as the discount rate that gives a net present
value (NPV) o f zero. It is a commonly used measure o f investment efficiency. The IKR
method will result in the same decision as the NPV method lor (non-mutually exclusive)
projects in an unconstrained environment, in the usual cases where a negative cash flow
occurs at the start o f the project, followed by all positive cash flows. In most realistic
eases, all independent projects that have an IKR higher than the hurdle rate should be
accepted McMahon (1981). Nevertheless, for mutually exclusive projects, the decision
rule of taking the project with the highest IKR - which is often used - may select a project
with a lower NPV.In some eases, several zero NPV discount rates may exist, so there is
no unique IRK. The IKK exists and is unique if one or more years of net investment
(negative cash flow) are followed by years o f net revenues. But if the signs o f the cash
flow's change more than once, there may be several IKKs. The IKR equation generally
cannot be solved analytically but only via iterations. One shortcoming of the IRK method
is that it is commonly misunderstood to convey the actual annual profitability of an
investment.
However, this is not the case because intermediate cash flows are almost never reinvested
at the project’s IRR; and. therefore, the actual rate o f return is almost certainly going to be
lower Accordingly, a measure called Modified Internal Rale of Return (MIRK) is often
used. Despite a strong academic preference for NPV. surveys indicate that executives
prefer IRR over NPV although they should be used in concert Lawrence (2000). In a
budget-constrained environment, efficiency measures should be used to maximize the
overall NPV of the firm Some managers find it intuitively more appealing to cvaluule
investments in terms of percentage rates of return than dollars o f NPV.The IRR o f a
Pfojcct is the discount rate applied to its future cash flows such that it produces a /cm
™PV. In other words, it is the discount rule that exactly balances the value o f all costs and
Avenues of the project. If the cash flows are uncertain, the IRR will also be uncertain and
12

therefore have a distribution associated with it. A distribution of the possible IRRs is
useful to determine the probability o f achieving any specific discount rate and this can be
compared with the probability other projects oiler o f achieving the target discount rate. It
is not recommended that the distribution and associated statistics of possible IRRs be
used for comparing projects because of the properties of IRRs discussed below.
2.2.3 Equivalent annuity method
The equivalent annuity method expresses the NPV as an annualized cash flow by
dividing it by the present value o f the annuity factor. Joel (1951) it is often used when
assessing only the costs of specific projects that have the same cash inflows. In this lorm
it is known as the equivalent annual cost (FAC) method and is the cost per year o f
owning and operating an asset over its entire lifespan. It is often used when comparing
investment projects of unequal lifespan. For example if project A has an expected
lifetime o f 7 years, and project B has an expected lifetime o f 11 years it would be
improper to simply compare the net present values (NPVs) of the two projects, unless the
projects could not be repeated. The use o f the FAC method implies that the project will
be replaced by an identical project. Alternatively the chain method can be used with the
NPV ineihtKJ under the assumption that the projects will be replaced with the same cash
flows each time I o compare projects o f unequal length, say 3 years and I years, the
projects are chained together, i.e. four repetitions o f the 3 year project are comparing to
three repetitions of the 4 year project. The chain method and the FAC method give
mathematically equivalent answers. I he assumption of the sume cash flows for each link
•n the chain is essentially an assumption of zero inflation, so a real interest rate rather
than a nominal interest rate is commonly used in the calculations
2-2.4 Real options
Hie term “real options" was first coined by Myers (1977) 30 years ago. Historically,
°ptions started in dealings of real properties. Copeland and Antikarov (2003) states that
because options provide investors with valuable operational flexibilities and risk
•^agem ent opportunities, the central issue of options analysis is the valuation of an
°Ption for such flexibilities and opportunities. However, proper valuation of options has
13

puzzled and eluded researchers lor centuries until 1970s Real options analysis has
become important since the 1970s as option pricing models have gotten more
sophisticated. I he discounted cash flow methods essentially value projects as if they
were risky bonds, with the promised cash flows known. But managers will have many
choices of how to increase future cash inflows, or to decrease future cash outflows. In
other words, managers get to manage the projects not simply accept or reject them Real
options analyses try to value the choices the option value that the managers will have in
the future and adds these values to the NPV.Real options capture the value o f managerial
flexibility to adapt decisions in response to unexpected market development. Companies
create shareholder value by identifying, managing and exercising real options associated
with their investments portfolio. Ihc real options method applies financial options theory
to quantify the value o f management flexibility in a world of uncertainty. If used as a
conceptual tool, it allows management to characterize and communicate the strategic
value of an investment project. Real options analysis is a valuation theory that views
projects as creating options for an uncertain future. I or example, a new factory carries
options to shut down, abandon, or expand, depending on market conditions. Project value
depends on the options created. The theory includes logic for computing project value
based on the market prices ol related assets Ihc real options method represents the new
state-of-the-art technique for the valuation and management o f strategic investments.
There are five types of real options: Waiting-to-Invest option. Growth option, flexibility
option. Lxit option and l.eaming option.
2.2.5 Ranked Projects
Hie real value o f capital budgeting is to rank projects. Most organizations have many
projecis that could potentially be financially rewarding. Once it has been determined that
a parti culur project has exceeded its hurdle, then it should he ranked against peer projects.
Ihc highest ranking projects should be implemented until the budgeted capital has been
upended this w ill lead to maximization ol'lhc shareholders wealth.

2.2.6 Advantage* and Disadvantages of IKK and NPV
A number of surveys have shown that, in practice, the IKK method is more popular than
the NPV approach. The reason may be that the IRR is straightforward, but it uses cash
flows and recognizes the time value of money, like the NPV. In other words, while the
IKK method is easy and understandable, it does not have the drawbacks o f the ARR and
the payback period, both o f which ignore the time value o f money Mun (2006) the main
problem with the IKK method is that it often gives unrealistic rates of return. Suppose
the cutoff rate is 11% and the IRR is calculated as 40%. An IRR of 40% assumes that a
firm has the opportunity to reinvest future cash flows at 40%. If pust experience and the
economy indicate that 40% is an unrealistic rate for future reinvestments, an IRR of 40%
is suspect Simply speaking, an IRK o f 40% is too good to be true' So unless the
calculated IKK is a reasonable rate for reinvestment of future cash Hows, it should not be
used as a yardstick to accept or reject a project .Another problem with the IRR method is
that it may give different rates o f return Suppose there arc two discount rates (two IRRs)
that make the present value equal to the initial investment. I he purpose is to let you
know that the IKK method, despite its popularity in the business world, entails more
problems than a practitioner may think.
2.3 O ther t echniques l \e d By Insurance companies
2.3.1 Capital Allocation
The usefulness of capital allocution methods can be assessed only in the context of the
company’s economic goals. Although this statement sounds so obvious, failure to
consider context is precisely the current state of uffairs in capital allocation discussion.
Articles about capital allocation typically begin by listing certain properties that an
allocation method should possess the most prominent o f which are: adding-up property,
no undercut, symmetry , und consistency Aumann and Shapley (1974). Capital allocation
'* supposed to be useful in accomplishing the goals of competitive pricing o f insurance
contracts and making optimal capital budgeting decisions, hut instead of analyzing
"Aether various allocation methods arc appropriate in certain situations, the literature
focuses almost exclusively on whether the proposed allocation methods encompass the
•^ve-listcd essential properties Billera and Heath (1988).
15

Myers and Read (2001) have proposed an important capital allocation method for
insurance companies They discovered "a unique und non arbitrary allocation method that
leads to an "adding-up" property: i.e.. the equity capital allocated to the single lines of
business "ads up" to the overall equity capital o f the insurance company . Using option
pricing techniques, the allocation depends on the marginal contribution o f a contract in a
single line of business to the default value of the whole firm. Myers and Read propose
using their capital allocation method in pricing insurance contracts. In particular, they
propose using it to determine correct loadings on fair premiums in cases where there arc
frictional costs of holding equity capital Billcra. and I leath (1081)
2.3.2 Recognition of risk
I he recognition of risk as an important component in capital budget decision making has
long been recognized. I he future is uncertain and inveslmeni/project appraisal techniques
that fail to recognize this fact will almost certainly lead to incorrect conclusions and
erroneous recommendations Scheffer (2001). It was shown how simulation methods will
help to identify the possible risks of project failure when using net present value (NPV)
What is often not recognized is that NPV. itself, can lead to erroneous conclusions in the
face of uncertainty even when the apparent range or distribution of (uncertain) outcomes
has been recognized What is needed is an “adjusted” NPV technique which properly
accounts for uncertainty, as experienced in a live environment which this article will
attempt to provide. Moreover, recognition of the “correct" NPV approach leads to some
surprising, perhaps counter-intuitive, results in which apparently unwelcome guests in
capital budgeting may turn out to be factors leading to competitive or strategic advantage
Saita (2004)
2.3.3 Real options ami capital budgeting
One of the first proponents of real option analysis was Myers (2001) who identified that
NPV incorrectly calculates the value of cash flows in an uncertain environment. His
observations concerned the fact that NPV analysis ignores tire time scries interactions
among contingent investments and that, consequently, delaying investing may accrue
extra benefits. In this sense, real option analysis recognizes the incremental (or
16

additional) value arising from flexibility. I he fact that flexibility gives rise to additional
value is recognition of the altered probability distribution of potential outcomes and its
impact on risk exposure. Underpinning this is the view that risk is critical to investment,
since without it the maximum return that could reasonably be expected from an
investment is the risk-free rate Monk house (l996).Thc formalization of the treatment of
risk in investment analysis is one of the principal benefits of the real option technique. In
particular, formalization involves recognition of the structure of probable outcomes over
time which can be exploited for strategic investment purposes. The probability
distribution of NPV. which incorporates the valuation of flexibility, is not symmetrically
distributed as in the certainty-equivalent NPV case. Consequently, the use of simple risk-
adjusted rates to assess investments in which there is flexibility will undervalue
investments
economic capital is the best-practice risk measurement methodology used in the financial
industry that relates the concept o f risk to the worst-ease loss that can arise due to that
particular risk I root and Stein(l998): Merton and Peroldf 1993): Myers and Kead(200l).
Hie worst-case scenario is defined by a certain high degree o f statistical confidence, e.g.
99.9 percent confidence level. The major advantage of this methodology is that different
risks can be measured identically, which in the end allows "apple to apple comparison."
Because risks are expressed in monetary units, managers can make a sensible trndc-off
between risk and reward, taking into account all relevant risks. As a result, economic
capital is used in budget cycles and other management control applications Froot and
Slcinf 1998); Saila( 1999); |)olT(2007).
Business risk is regarded as the risk that due to changes in margins and volumes, earnings
'vill fall below the fixed cost base." I.xamples arc changes in competitor behavior and
changes in customer preferences. Also banking supervisors upply this type of definition,
although at the moment it is excluded from the Pillar I capital requirements in Basel II
®CBS (2004). Kuritzkes and Schuermann (2006) state that "practitioners and
Policymakers know the most about market risk and the least about business risk.”).
17
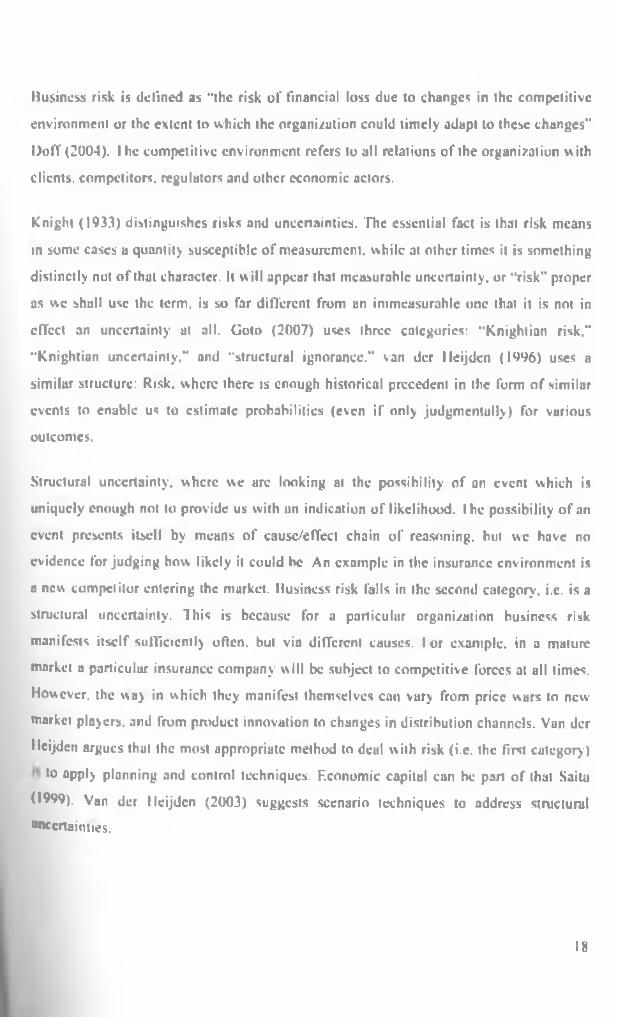
Business risk is defined as “the risk of financial loss due to changes in the competitive
environment or the extent to which the organization could timely adapt to these changes"
Doff (2004). I he competitive environment refers to all relations of the organization w ith
clients, competitors, regulators and other economic actors.
Knight (1933) distinguishes risks and uncertainties. The essential fact is that risk means
in some cases a quantity susceptible of measurement, while at other times it is something
distinctly not o f that character. It will appear that measurable uncertainty, or “risk" proper
as we shall use the term, is so far different from an immeasurable one that it is not in
effect an uncertainty at all. Goto (2007) uses three categories: “Knightian risk.”
“Knightian uncertainty,” and “structural ignorance." van der lleijdcn (19%) uses a
similar structure: Risk, where there is enough historical precedent in the form of similar
events to enable us to estimate probabilities (even if only judgmentally) for various
outcomes.
Structural uncertainty, where we are looking at the possibility of an event which is
uniquely enough not to provide us with an indication o f likelihood. I he possibility of an
event presents itself by means o f causc/effect chain of reasoning, but we have no
evidence forjudging how likely it could be. An example in the insurance environment is
a new competitor entering the market. Business risk falls in the second category, i.c. is a
structural uncertainly. This is because for a particular organization business risk
manifests itself sufficiently often, but via different causes. I or example, in a mature
market a particular insurance company will be subject to competitive forces at all times.
However, the way in which they manifest themselves can vary from price wars to new
market players, and from product innovation to changes in distribution channels. Van dcr
Hcljden argues that the most appropriate method to deal with risk (i.e. the first category)
to apply planning and control techniques. Economic capital can be part of that Salta
<*999). Van dcr lleijdcn (2003) suggests scenario techniques to address structural
uncertainties.
18

2.3.4. Liusiness risk and economic capital
An important indicator of the extent to adapt to changes is the variability of the cost
structure, also called operating leverage. Van Priest (2000) concludes that the degree of
operating leverage is not an independent business variable Rather, the degree of
operating leverage is a logical outcome of the strategy of the firm.
Permanent changes in the environment require a permanent change in the organization,
assuming the organization's objective to survive. To that extent, holding economic capital
to absorb financial losses can never be the primary instrument to address the business-
risk event. Other instruments in the field of strategic management and organizational
management ore much more appropriate Hamel and Prahulad (1994). Valeria (1998)
develops a typo logs focused on organizational flexibility required to cope with strategic
uncertainties Organizational flexibility as referred to here is often a useful mitigant to
ubsorb business risk.
Temporary changes such as an economic recession or a shon price war with u competitor
may be overcome without a permanent change in the organization, l or example, an ice
cream manufacturer may accept a certain amount of losses during a cold summer w ithout
drastic changes. However, it needs to have a certain mechanism to address these losses.
I his mechanism can be an economic-capital buffer, but the risk can also be hedged (e.g.
insurance, weather derivatives or invest in an umbrella factory) Gradual changes in the
competitive environment arc often better addressed by adapting the organization (i.c.
avoiding u financial loss) than by financing the loss via economic capital. In the case of
Assuming that costs arc cither fully fixed or fully variable is too crude, as costs may be
fully fixed, fixed within a certain interval, stepwise variable, or fully variable Drury
H995). Assessing the cost flexibility (operating leverage) should he made in reference to
a time horizon: on a one-day horizon, all costs arc fixed (and hence, non-controllablc).
whereas on a ten-year time horizon most costs arc variable. Most economic-capital
frameworks are based on a one-year time horizon, because that is consistent with the
management control cycle o f many banks (c.g. budgeting). In a one-year period, most
C0M Proponents in a banking P&l. arc relatively fixed, such as IT and (depending on
19
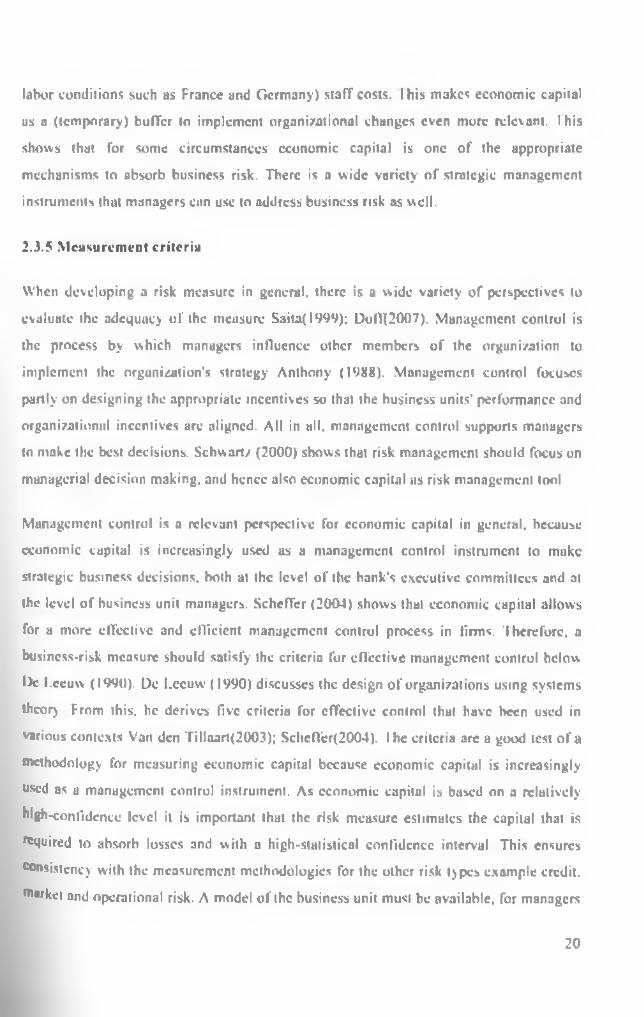
labor conditions such as France and Germany) staff costs. I bis makes economic capital
us u (temporary) buffer to implement organizational changes even more relevant. I bis
shows that for some circumstances economic capital is one of the appropriate
mechanisms to absorb business risk. There is a wide variety of strategic management
instruments that managers can use to address business risk as well.
2.3.5 M easurement criteria
When developing a risk measure in general, there is a wide variety o f perspectives to
evaluate the adequacy of the measure Saita(l999); Dolt(2007). Management control is
the process by which managers influence other members o f the organization to
implement the organization's strategy Anthony (1988). Management control focuses
partly on designing the appropriate incentives so that the business units' performance and
organizational incentives are aligned. All in all, management control supports managers
to nuke the best decisions. Schwartz (2000) shows that risk management should focus on
managerial decision making, and hence also economic capital as risk management tool
Management control is a relevant perspective for economic capital in general, because
economic capital is increasingly used as a management control instrument to make
strategic business decisions, both at the level of the hank's executive committees and at
the level of business unit managers. Scheffer (2004) shows that economic capital allows
for a more effective and efficient management control process in firms. Therefore, a
business-risk measure should satisfy the criteria for effective management control below
l)c l.ccuw (I W0). Dc Lecuw (1990) discusses the design o f organizations using systems
theory From this, he derives five criteria for effective control that have been used in
various contexts Van den Tillaart(2003); Scheffer(2004). I he criteria are a good lest of a
methodology for measuring economic capital because economic capital is increasingly
used as a management control instrument. As economic capital is based on u relatively
high-confidence level it is important that the risk measure estimates the capital that is
Squired to absorb losses and with a high-statistical confidence interval This ensures
consistency with the measurement methodologies for the other risk types example credit,
market and operational risk. A model of the business unit must be available, for managers
20

to understand the effect of their interventions. Information on the state o f business unit
and the environment must he available, such that managers know what controlling
measure to choose. I his should be element of a management control system and we
generally believe that such systems arc present in firms. Often, however, the information
becomes available with a certain time lag due to reporting frequency (c.g. quarterly or
monthly).Sufficicnt measures should be available to react to changes in the environment.
In other words, the model should be based on variables that can be influenced by
managers themselves. Solely using variables that are out o f the responsibility area (such
ns external parameters) violates this criterion. I he manager should have sufficient
information capacity to transform new information into an effective control
measure/intervention. In our context, this criterion relates to the management capabilities
of individual managers. In assessing the business-risk measurement methodology, we
must test the effectiveness independently o f individual managers that use the
methodology. Therefore, we do not test this criterion in detail.
2.3.6 Analogue company upproach/pt-vr group analysis
In this category o f methodologies, a bank estimates its business risk by analyzing other
institutions. In peer gmup analysis, the bank identifies the amount of business-risk
economic capital held by a number of identical banks or a specific set of monolme
companies Saita (2004). f rom this, the bank determines how much capital it needs to
cover its business risk
Van (2006). Ibis is a top-down method. I he major advantage is that the method is
relatively simple and can quickly yield results. This is because a bank cannot influence
the amount of economic capital by taking management actions. Also, peer group analysis
assumes that banks in the peer group have optimized the capital position for business
risks.
I he analogue company approach /aik(1996), IX>11(2004) estimates the amount of
business-risk economic capital by analyzing the equity capital of non-financial
companies. It is assumed that, because non-financial companies do not run financial risks
21

example credit and market risks and their equity capital exactly covers business and
operational risks By looking at the ratio o f equity capital und non-interest expenses
(mostly fixed costs), the amount of capital is adjusting for size of the organization. An
advantage o f the analogue company approach is that it is relatively simple and quickly
provides results. It is more advanced than peer group anal)sis because it takes into
account the cost structure of the hank. By adjusting the cost structure, a hank can partly
influence the economic capital.
2.J.7 Statistical methods
Most Insurance companies apply statistical methods to measure business risk. In these
methods, the business-risk economic capital is measured on the basis of fluctuations in
income and expenses that cannot be linked to any other risk category Schroeck(2002):
Aas t 2005) A variant o f this approach is to relate general economic conditions such as
GDP to the financial performance lor instance by regression techniques. A probability
function, such as lognormal, is assumed based on the volatility of earnings and costs Aas
(2005) . This is consistent with the economic-capital models for credit and market risks
which is the major advantage of this approach.
Whilst theoretically appealing, it is very hard to appropriately measure a bank's income
sta-ams that arc not linked to the other risk categories I his is because it is hardly
possible to “clean" the earning stream for the other risk types Schrocck (2002); Van
(2006) , For example, the client's credit rate is based on its credit quality, loan's maturity
(i.c the funding rate for the bank), a cost component and a profit margin. It is hard to
separate the part o f credit earnings that is based on the general economy and the business
model o f the hank from the credit risk part, fhc level o f the funding is influenced by the
maturity of the loan, the bank’s credit rating and the general state of the economy. To
identify these elements separately is hardly possible. In the ease o f a downturn of the
economy, not only may profit margins decrease, but also volumes decrease. I his volume
effect is certainly caused by business risk, but very hard to capture in the current
statistical models for business risk.
22

Perhaps, only lee-based earnings could be uniquely allocated to business risk. It is no
coincidence that the discussion on business risk sturted in the urea of non-risk
warehousing activities that are often fee-based businesses I root (2001).
Another disadvantage o f this approach is related to the reference class problem McGoun
(1995); Snitu(2004): is historical data still relevant to predict future earnings volatility? In
this aspect, business risk is different from the financial risks such as credit and market
risks: current clients'positions still form the majority o f the portfolio and a portfolio
changes only gradually. In business risk, the key issue is to look at fundamental changes
in the competitive environment that automatically make older data less relevant l ooking
at recent data, there is little data, which makes it impossible to estimate reliable
probability distributions. I he example of internet banking illustrates this problem the
advent o f successful internet banks has permanently decreased margins. Using historical
data from prior to the internet banking era to estimate future volatility would not be
appropriate. The reference class problem is even more relevant because data on
profitability is generally available (scmi-)annuully, quarterly or monthly, fo perform
sensible statistical analyses based on a sufficiently large dataset, the model would include
data that is already outdated. For example, to estimate a 99 percent confidence level at
least 100 data points are required (resulting in a model that is not sufficiently robust).
Based on monthly data. 8.3 years of data arc required. Estimating a 99.9 percent
confidence level using 1,000 data points. 83.3 years urc required. Extrapolation methods
(extreme value theory) may be required to estimate higher confidence levels based on a
smaller, more realistic data-set. However, care is required to guarantee the robustness of
these models.
2.3.H Pricing Insurance Contracts. Risk Management Costs, and Equity Capital
Hie theoretical basis of the Myers and Read (2001) cupilal allocation method is the
contingent claims approach for insurance pricing. In this framework, the fair insurance
price is determined by the claims payoff distribution, the arbitrage-free valuation
function, and the contract's safety level (measured by the value o f the default put option).
( Icarly, this method of calculating competitive insurance prices docs not depend on the
23

insurance company’s preexisting portfolio, which in turn means that it makes no
difference to the insurance price whether the company is a single- or multi-line insurer,
everything else being held equal. Thus, no allocation of equity capital to lines of business
or to single insurance contracts is necessary in making the pricing decision, To achieve a
desired safety level, the insurance company must establish certain risk management
measures, hquily capital is only one of these, and can be partially substituted by
reinsurance, alternative risk transfer, and other measures. The necessary risk management
costs are covered by the insurance premiums.
2.4 Empirical studies on Optimal Capital Budgeting practices
in addition to being used for pricing insurance contracts, capital allocation is often
utilized as a basis for determining the performance o f business segments, resulting in
capital budgeting decisions such as expanding or contracting lines of business, liven
though Myers and Read do not propose their allocation method for performance
measurement, other papers discussing the Myers and Read (20<H) approach clearly see
profit ranking of lines of business and capital budgeting decisions as appropriate fields of
application. The allocation of costs of equity capital to the existing lines o f business leads
to a common cost problem, liquity capital serves as safety capital for the company as a
whole rather than its individual parts, and if insolvency occurs, it is because liabilities
exceed assets for the entire company, not for any particular line. Ibis type of common
cost problem has been studied extensively in the economics literature for purposes of
pricing goods with common costs, such as those found in agricultural and chemical
industries According to the common cost literature, informational limitations leave no
any arbitrary common cost allocation for purposes of performance measurement and
pricing. Instead, the generally accepted response is to develop a set of desired properties
for the allocution process itself and proceed with the method that best satisfies these
properties. It is inherent in such a process; however, that whatever allocation method
used will result in distortions and the question future research ought to investigate is the
extent to which those distortions exist under various allocation methods, for example.
Billera and Heath (1981) referring to game-theoretical approachcs-suggcst in their well-
known article the properties "adding-up additivcly," and "fairness." If these properties are

fulfilled, the allocation of common costs is indeed unique. But. as Rillera. Heath, and
Verrecchia (1981), clearly state: "Although the results arc mathematically elegant, they
require the acceptance of a 'constitution.' or set of axioms, the full effect o f which may
not be entirely understood in terms of the problem at hand."
Defining the desired properties of an allocation method is also the procedure found in
recent capital allocation literature concerning financial firms. For instance. Valdc/. and
( hemih (200.)) with reference to cooperative game theory propose the properties of "no
undercut, symmetry and consistency. The alleged rationale for this again lies in
cooperative game theory where common costs arc allocated to single players o f a game in
a way that gives the players no incentive to abandon that coalitional game. However, this
strand o f capital allocation literature does not examine how the properties proposed arc
helpful in reaching the insurer's goals prioritizing new capital budgeting projects."
"deciding which lines of business to expand or to contract." and "fair assessment of
performance of managers of various business units.
2.5 Capital Budgeting and Performance
Capital budgeting has been widely utilized as a management and strategic planning tool
by corporations Klammer (1973). Gilman, and Forrester (1977). Schall cl al (1978).
Aggarwal. R. (1980). Kim. Farragher. (1981) and Jones. (1986) .Chandra, (1987),
suggests that the capital budgeting process often has many behavioural outcomes in the
organizational planning process, such as enhanced goal congruence and more universal
participation. C urrcntly, a majority o f major companies make use o f some type of capital
budgeting technique in their strategic planning process Cook and Rizzuto, (1989) and
Moore and Reichert (1989)..
Hie adoption o f capital budgeting models tends to be crucial for the success o f both
traditional and not-for-profit organizations in today’s dynamic and outcome-oriented
environment. Researchers in not-for-profit management suggest that sponsors, donors,
•Members, regulators and other stakeholders of non-profits are demanding more
•^countability and better performance from management While (1989). Appropriate
^ i t a l investment decisions will increase the company's long-term effectiveness and
25

efficiency, while incorrect decisions will erode the company's ability to achieve its
mission and meet the needs o f members. The adoption o f the appropriate capital
budgeting tools provides company managers with both the processes and techniques
required to make decisions that will enhance the organization’s resource base while
improving its ability to serve its members and evaluate effectiveness o f its investments.
Capital budgets being a standard lor performance are used to evaluate managerial
performance Srinivasan ( I^87). Similarly, Douglas (1994) used a case study approach
and found that capital budgeting techniques places a high importance on the budget-to-
actual comparison for performance evaluation purposes both at the corporate and the
subsidiary levels. Anderson (1993) also supported this view, staling that in most US
companies the development of budget is still used as the main performance measurement
system. Wciscnfcld and Tyson (1990), in u sample o f 68 IJS managers from two
companies, found that capital budgeting techniques and variance analysis can he positive
tools, if the accounting inlbrmation/communication process is functioning appropriately.
A total o f 90 percent o f the respondents indicated that variances were a good way to
measure their performance. All of them agreed that variance reports positively influenced
them to improve performance and increase their bonuses.
A study by Joyc and Blayncy (1990) found that capital budget techniques were used by
93 percent o f respondents for setting goals and evaluating performance by Australian
lirms. In a more recent study, Guilding ct ol. (1998) found that accountants in New
Zealand (NZ) and the UK tend to see capital budgeting techniques as being important,
and performance appraisal was based mainly on budget achievement. In n recent survey
of 250 respondents in the US. Blansficld (2002) found that only 14 percent o f companies
have a fully integrated planning process that combines long term and operational
planning, performance measures and reporting. The survey further underscored the fact
that financial executives still struggle with the need to synthesize financial and non-
financial data and performance measurements in u single system in which they can also
Perform planning, capital budgeting, forecasting, financial consolidation, reporting and
•talysis in real time.
26

2.6 Conclusion:
Most researches involve substantial use of published literature. I he literature review
helps in the selection and definition o f the research problem, specifies a conceptual
framework of a study that is try to understand the variables in the problem und coming up
with a possible relationship. Capital budgeting decisions arc crucial to a firm's success for
several reasons. First, capital expenditures typically require large outlays o f funds.
Second, firms must ascertain the best way to raise und repay these funds. I hird. most
capital budgeting decisions require a long-term commitment. Finally, the timing of
capital budgeting decisions is important When large amounts o f funds arc raised, firms
must pay close attention to the financial markets because the cost o f capital is directly
related to the current interest rate.
From the literature reviewed in this chapter it can be concluded that the capital budgeting
techniques adopted by a company have a direct impact on the performance o f the
company. I'hc literature however docs not review the capital budgeting practices in the
the insurance industry. Hence this study seeks to bridge the knowledge gap by focusing
on the insurance industry in Kenya.
27

CHAPTER I'll REE
3.0 RESEARC H METHODOLOGY
3.1 Introduction
I his chapter discusses the methodology that was used in gathering the data, analyzing the
data and reporting the results. I lere the researcher aims at explaining the methods and
tools used to collect and analyze data to get proper and maximum information rclutcd to
the subject under study.
3.2 Research design
This was a descriptive survey study aimed at establishing the Capital Budgeting practices
in insurance companies in Kenya. According to Donald and Pamela (1998). a descriptive
study is concerned with finding out the what, where and how o f a phenomenon.
3.3 Population
I he population of interest of this study was obtained from Insurance companies licensed
to operate in Kenya. There are forty two (42) insurance companies licensed by the
Insurance Regulatory Authority.
3.4 Data collection
In order to survey the Capital Budgeting practices in insurance companies in Kenya, self-
administered drop and pick questionnaires were distributed among sampled employees
currently employed by insurance companies in Kenya. Questionnaire was designed to
identify the Capital Budgeting practices used by insurance companies in Kenya.
One emplosec was selected from each of the 42 insurance companies and administered
'Vl’h the questionnaire. I he staffs in the insurance companies include managers and other
*talf in the ranks of management. This made it easier to get adequate and accurate
information necessary for the research.
The researcher used structured questionnaires as the main data collection instrument.
The questionnaires had both open and close-ended questions. I lie close-ended questions
28

provided more structured responses to facilitate tangible recommendations. The open-
ended questions provided additional information that may not have been captured in the
close-ended questions.
3.5 Data analysis
The completed questionnaires were edited for completeness and consistency. A content
analysis and descriptive analysis were employed. Ihe content analysis was used to
analyze the respondents' views about the operational budgeting. Quantitative was then
coded to enable the responses to he grouped into various categories. Descriptive statistics
was used to summarize the data This includes percentages and frequencies. Tables and
other graphical presentations as appropriate were used to present the data collected for
case of understanding and analysis.
29

CH A P TER FOUR
DATA ANALYSIS AND INTERPRETATIONS
4.1 Introduction
This chapter presents the data analysis and interpretation. From a study population o f 42
respondents. 29 respondents responded and returned the questionnaires comprising of
69% response rate.
4.2 General Information
Type of business that the organization undertakes
The study found that the organizations undertook general insurance, broker and agency,
life assurance, travel insurance type of businesses
Fable 2: Duration That the Organizations lias Been In Operation in Kenya
Frequency Percent1 -5 years 1 3.46-10 ycars 7 24.111-15 years 3 10.316 years and above 18 62.1fotal 29 100.0
Source: Research FindingsDie findings in table 2 show the duration that the organizations had been in operation in
Kenya I rom the study, most o f the businesses (62.1%) had been in operation in Kenya
for 16 years and above. 24.1% of the organizations had been in operation for 6-10 years,
10.3% had been in operation for 11-15 years, while a small proportion of organizations as
indicated by 3.4% had been in operation on Kenya for 1-5 years. I his information was a
dear indication that most o f the organizations (96,6%) were well versed with capital
budgeting techniques in their organizations us they had been in operation for a long
Period ol time i.c. 6 years and above. This information was also shown by figure I
30

Figure 1: Duration That the Organisations lias Been In Operation in Kenya
Duration I Imi the Organizations Has Been In Operation in Kenya
60 f SO40 jJO ;20 10 •
0 f1-Sycars 6-10ycars IM S 16years
yean and above
Table 3: Ownership o f the Organisation
Frequency Percentpredominantly local (51% or more) 12 41.4predominantly foreign (51% or more) X 27.6balanced between foreign and local (50/50) 9 31.0Total 29 100.0
Source: Author 2009
I he study also sought lo establish the ownership of the organisations According to the
findings, most of the organisations $ shown by 41.4% were predominantly local (51% or
more). 31% o f the organizations were balanced between foreign and loeal (50/50). while
predominantly foreign (51% or more), figure 2 was also used to present this information.
31

Figure 2: Ownership of Ihc Organization
Ownership «l ilu* Organization
■ picdom inanely total <51*Of nxvc)
■ predominantly foreign |>1 % or more)
■ balanced between foreign and focal (W/SO)
ruble 4: Number of Full Time Kmployccs Thai the Organization Have
Frequency Percent51-75 10 34.576-100 5 17.2101 employees and above 14 48.3
Total 29 100.0Source: Author 2009The study also required the respondents to indicate Ihc number o f full time employees
that their organizations had. From the study, most or the organizations had 101
employees and above as shown by 48.3%. 34.5% o r the organizations had 51-75
employees, while 17.2% of the respondents reported that their organizations had 76-100
employees. I his information shows that these organizations were large scale type of
organizations. Figure 3 wus also used to represent this information.

Figure 3: Number of Full Time Employees Thai Ihe Organization Have
Number of Full Time Employees Thai tin Organization Have
■ 51-7S
■ 76-100
■ J01 employees and above
Table 5: Duration Thai the Respondent Has Been W orking In the Organization
Frequency Percentbetween 1 and 5 years 7 24.1between 6 and 10 years 10 34.5between 11 and 15 years 7 24.116 years and above 5 17.2Total 29 100.0
Source: Research FindingsIn order to establish the respondents experience in the organizations, the respondents
were requested to indicate the number of years that they had been working in their
respective organizations. From the study, 34.5% of the respondents had been working in
the organization lor a period between 6 and 10 years, the respondents who had been
working in the organization for a period between I and 5 years were shown by 24 1%
each, while 17.2% o f the respondents had been working in their respective organizations
for lo years and above. I his information implies that most of the respondents (75.9%)
had been working in their respective organizations for 6 years and above and therefore
they were well versed with capital budgeting in their organizations Figure 4 was also
used to present this information.
33

Figure 4: Duration That the Respondent Mas Been Working In the Organi/ation
Duration That tin- Respondent lia s Been Working In the Organization
3530
25
2015
105
0
34 S
between 1 between 6 between 1 1 10 years and and 5 years and 10years and IS yean above
■ Frequency
■ Percent
4.3 Capital Budgeting and Net Present Value
I able 6: Budgeting I echniqucs I hat the Company Uses
Yes NoInternal rate o f return 483 51.7Net present value 96.6 3.4Payback period 3.4 96.6
Source: Author 2009I he findings in above table 6 show the budgeting techniques that the companies used.
According to the study, most o f the respondents (96.6%) said that their organizations
used net present value as their budgeting technique. 48.3% of the respondents said
internal rate o f return, while a small proportion o f respondent said that their organizations
also used payback period as their budgeting techniques.
34

Areas That the Capital Budget Focuses
The study also sought to establish the areas that the budgets focused Ofl. From the study,
the budgets focused on working capital turnover, quick ration, current ratios, net present
values, it encourages continuous improvements and internal rate of return
Table 7: Applicability of the Formal Methods Used In Capital Budgeting
Very much ap£licable
89.7
Muchapplicable
10.3applicable
Moderatelyapplicable
Notapplicable
Meanscore
Net present value 0 0 l.l! Internal rate of return 48.3 51.7 0 0 0 1.5
i v v • r t u i l l V I « m 7
In table 7. the respondents were requested to rate the formal methods used in capital
budgeting according to their applicability in the organizations From the study, net
present value was very much applicable in the insurance companies, while internal rate of
return was also much applicable as indicated in the table 7 above.
The study also found from all the respondents that these budgeting techniques had been
used b\ other insurance companies in the industry, they had been successful in other
insurance companies and also recognition of risk had been an important component in
capital budget decision making issue in the organizations.
L O W E R K A B E I c L i J R A R V
35

Table 8: Tabic Showing the Respondents’ Perception on the Relationship between
Capital Budgeting Techniques and Firm Performance
4.4 Capital Budgeting Techniques and Performance
Stronglyagree Agree
Moderatelyagree Disagree
Stronglydisagree Mean
capital budgeting techniques places a high performance on the budgct-to-aetual comparison for performance evaluation purposes
69.0 31.0 0 0 0 1.3
capital budgeting techniques being a standard lor performance are used lo evaluate managerial performance
31.0 69.0 0 0 0 1.7
capital budget techniques are used by insurance companies in Kenya for setting goals and evaluating performance
10.3 79.3 10.3 0 0 2.0
capital allocation methods can he assessed only in the context of the company's economic goals
20.7 37.9 37.9 3.4 0 2.2
Source: 2009I he respondents were also required to state their extent of agreement w ith the statements
in the above table in relation to the relationship between capital budgeting techniques und
firm performance. From the study, most of the respondents strongly agreed that capital
budgeting techniques places a high performance on the budgel-to-actual comparison for
performance evaluation purposes as shown by a mean score of 1.3. f urther, majority of
the respondents agreed that capital budgeting techniques being a standard for
performance are used to evaluate managerial performance shown by a menu score of 1.7,
capital budget techniques are used by insurance companies in Kenya for setting goals and
evaluating performance as shown by a mean score o f 2.0 and also capital allocation
methods can be assessed only in the context of the company's economic gouls as shown
by a mean score of 2.2.
36

Table 9: behavioural Outcomes of Capital Budgeting Process Experienced In the
Organizational Planning Process That Affect Performance
Very low extent
Lowextent
Moderateextent
Greatextent
Very great extent Mean
Enhanced goal congruence 13.8 34.5 34.5 17.2 0 2.8
More universal participation 0 10.3 3.4 86.2 0 3.8
Source: Author 2009
The study also sought to establish the extent that the behavioural outcomes of capital
budgeting process experienced in the organizational planning process in the above table
affected performance. I rom the study, more universal participation alTectcd performance
to a great extent as indicated by a mean score of 3.8. while enhanced goal congruence
affected performance to a moderate extent as shown by a score of 2.6.
W hether Appropriate Capital Investment Decisions Increases the Company’s Long
Term Effectiveness and Efficiency
I rom the study, all the respondents were in agreement that appropriate capital investment
decisions increase the company’s long term effectiveness und efficiency. This was
because appropriate capital investment decisions enhances controlled delivery of serv ice
within the budgetary framework, they provides processes and techniques required to
make decisions on organizations resource base, encourages continuous improvement, it
encourages flexibility, they minimizes cost, they provide the companies with enough
capital for long term investments, they encourage savings that cun be directed to the
budgetary systems lor effectiveness.
All the respondents were also in agreement that adoption of appropriate capital budget
tools provides company managers with both the processes and techniques required to
nuke decisions that will enhance the organizations resource base.
37

Tabic 10: Liquidity Ratios That Have Influenced Capital Budgeting
Verymuch Much Somehow Neutral
Not at all Mean
current ratio current assets /current liabilities 41.4 41.4 0 13.8 3.4 4.0
quick ratio cash and cash equivalents +■ short term investments *- net trade receivables /current liabilities
3.4 65.5 20.7 10.3 0 3.6
working capital turnover revenue working capital 3.4 48.3 37.9 10.3 0 3.4
days of cash 0 0 48.3 414 10.3 2.4Source: Author 2009
I he stud> also required the respondents to indicate the extent that the liquidity ratios in
the above table had influenced the capital budgeting. I rom the study, the liquidity ratios
that had much influenced capital budgeting were capital budgeting current ratio current
assets /current liabilities as shown by a score o f 4.0 and quick ration cash and cash
equivalents short term investments • net trade receivables/current liabilities. Working
capital turnover revenue.work mg capital somehow influenced capital budgeting, while
most of the respondents were neutral that davs of cush influenced capital budgeting as
shown by a score of 2.4
38

CHAPTER FIVE
DISCUSSIONS, CONCLUSIONS AND RECOMMENDATIONS
5.1 IntroductionI his chapter presents the discussions o f the findings (stimmar) of the findings), makes
conclusions and gives recommendations to the study bused on the objective o f the study
1 he objective o f this study was to survey the Capital budgeting practices o f insurance
companies in Kenya.
5.2 Discussions
front the findings (in chapter four), the study found that that the organizations undertook
general insurance, broker and agency, life assurance, travel insurance type of businesses.
Most of these organizations had been in operation in Kenya for 16 years and above was a
clear indication that they were well versed with the capital budgeting practices in their
organizations. Majority of these companies were predominantly local (51% or more) and
most o f them had 101 employees and above. The study also found that most of the
respondents had been working in their respective organizations for 6 years and above.
On capital budgeting and net present value, most organizations used internal rate of
return as their capital budgeting techniques and they focused on working capital turnover,
quick ration, current ratios, net present values, it encourages continuous improvements
and internal rate of return, f rom the study, the formal methods used in capital budgeting
techniques i.e. net present value was very much applicable, while internal rate of return
was much applicable in the organizations. Ihe study also found from all the respondents
that these budgeting techniques had been used by other insurance companies in the
industry, they had been successful in other insurance companies and also recognition of
risk had been an important component in capital budget decision making issue in the
organizations.
On the perceived relationship between budgeting techniques and performance, most of
the respondents strongly agreed that capital budgeting techniques places u high
performance on the budget-to-actual comparison for performance evaluation purposes,
39

while most o f the respondents agreed that that capital budgeting techniques being a
standard for performance are used to evaluate managerial performance, capital budget
techniques are used by insurance companies in Kenya for selling goals and evaluating
performance and also capital allocation methods can be assessed only in the context of
the company’s economic goals.
The study also established that behavioural outcomes o f capital budgeting process
experienced in the organizational planning process which is more universal participation
affected performance to a great extent, while enhanced goal congruence affected
performance to a moderate extent. The study also found that that appropriate capital
investment decisions increase the company's long term effectiveness and efficiency. This
was because appropriate capital investment decisions enhances controlled delivery of
service within the budgetary framework, they provides processes and techniques required
to make decisions on organizations resource base, encourages continuous improvement, it
encourages flexibility, they minimizes cost, they provide the companies with enough
capital for long term investments, they encourage savings that can be directed to the
budgetary systems lor effectiveness. It vs as also clear from the study that adoption of
appropriate capital budget tools provides company managers with both the processes.
According to the study, capital budgeting current ratio current assets /current liabilities
and quick ration and cash equivalents * short term investments + net trade receivables
/current liabilities had much influence on capital budgeting Working capital turnover
revenueWorking copitul somehow influenced capital budgeting, while most of the
respondents were neutral that days of cash influenced capital budgeting.
5.3 Conclusions
I he study concludes that the capital budgeting technique mostly used by most of the
insurance companies was net present value which was very much applicable, they had
been successful in these organizations.
I he study also concludes that Capital Budgeting Techniques enhances performance in
insurance companies in Kenya This is because from the study, capital budgeting
techniques places a high importance on the budgct-lo-actual comparison for performance
40

evaluation purposes, being a standard for performance they are used to evaluate
managerial performance, they arc used by insurance companies in Kenya for setting goals
and evaluating performance, and also adoption o f appropriate capital budgeting tools
provides the company managers with both the processes and techniques required to make
decisions that will enhance the organisation's resource base.
5.4 RecommendationsI he study therefore recommends that capital budgeting should he fully embraced in the
insurance companies us it helps these companies to place a high importance on the
budget-to-aetuul comparison lor efficiency and evaluation purposes, to evaluate
managerial performance, set goals, and also it provides the company managers withy
both the processes and techniques required to make decisions that will enhance the
organization's resource base. This will therefore improve the overall performance o f
these companies.
5.5 Limitations or the Study
5.6 Suggestions for Further Research
I he researcher therefore recommends that further research should be conducted in other
types of organizations to establish whether capital budgeting has any relationship with
performance in these other organizations.
41

ReferencesAas. k . (2005), Risk C a p ita l A ggrega tion , Norwegian Computer Centre, Oslo.
SAMBA/40/05.
Aggarwul, R. (1080), "C o rp o ra te use o f so p h is tica ted ca p ita l budgeting techniques a
strategic perspective and a critique o f surv ey results". Interfaces. Vol. 10 pp.31-4.
Alexander, ( ' (2005), "The p resen t a n d fu tu re o f f in a n c ia l r isk m anagem en t'’. Journal of
financial Econometrics. Vol. 3 No.l. pp.3-25.
Amit. Rand WemerfeH, I). (1990). "W hy d o f ir m s reduce business r is k ? ' Academy of
Management Journal. Vol. 33 No.3. pp.520-33.
Anders. U. (2003). "The fu ilh to o p era tiona l risk econom ic capital", in Alexander. C.
(I ds). O pera tiona l Risk Regulation. A na lysis a n d M anagem ent, Prentice-Hall. London.
Anderson. R.I .. (1993). "C an stage-ga te system s d e liv er the g o o d s? " f inancial
Executive. Vol. 9 pp.34-5.
Anthony. R.N. (19X8), I he M anagem ent C o n tro l F unction , Harvard Business School
Press. Boston. MA.
Aumann, R. J.. and I,. S. Shaploy, 1974, Value o f N on-A tom ic d a m e s (Princeton. NJ:
Princeton University Press).
B( IJS (2004). In terna tiona l C onvergence o f C a p ita l M easurem ent and C apita l
Standards: a R es ised F ram ew ork, Basel Supervision - BCBS. Basel, available at:
www.bis.org/bcbs,
Billera. I.. J., and D. C. Heath. 1981. A lloca tion o f S h a re d C o sts : A S e t o f Axiom s
Yielding a U nique Procedure. Mathematics of Operations Research. 7: 32-39.
42

13illcra, !.. J., I). C. Heath, and R. F.. Verrecchia, 1981, A U nique P rocedure fo r
A llo ca tin g C om m on C osts fr o m a P roduction Process, Journal o f Accounting Research,
19: 185-196.
Blansfidd. D. (2002), Comshar* S u rvey o f Top F inancia l Executives, Business
f inance'Comshare Executive Research Group, vvww.bfmag.com.
Block. S. 1997. '( a p ita l budgeting techn iques u sed by sm a ll business firm s ', Engineering
Economist, vol. 42. pp. 289-302.
Brucutigam, R. R., 1980. A n A na lysis o f C ully D istr ib u ted C ost P ricing in R egu la ted
Industries. Bell Journal o f Economics. II: 182-196
B realty, R„ Myers. S and & Allen. F. 2005. P rincip les o f C o rp o ra te F inance, McGraw-
Hill. New York.
Brennan. M. and Schwartz, K. 1985. 'E valuating na tu ra l resource investm ents'. Journal
of Business, vol. 58. pp. 135-57.
Brigham. I I . (1985). fu n d a m e n ta ls o f F inancia l M anagem ent. Dry den Press. Fort
Worth. IX.
Brouncn, D., I)c Jong. A. and koedijk. k . 2004. 'C orporate fin a n c e tn E urope:
( o n fron ting theory w ith p rac tice '. Financial Management (2000). vol 33. pp. 71-101.
Chandra. G. (1987). "The beh a v io ra l aspects o f budgeting", in Sweeny, H.W.A., Rachlin,
R (Eds),I landbook on Budgeting. John Wiley & Sons. New York. NY. pp.833-60.
Chandra. G. (1987). "The behaviora l aspects o f budgeting", in Sweeny, H.W.A.. Rachlin.
R (Eds).I landbook on Budgeting. John Wiley & Sons. New York. NY, pp.833-60.
Conine. I.E. (1982). "On the theoretica l re la tionsh ip betw een business risk a nd
sy stem a tic risk", Journal o f Business Finance & Accounting. Vol. 9 No.2. pp. 199-205.

Cook. IJ ., Ri/zuto. R.J. ( I ‘>89), "C apita l budgeting p ra c tices f o r R A D a su rvey a n d
a n a lysis o f B usiness W eek 's R A. 1) score h o a r d '. I he Engineering Economist. Vol. 34
No.4, pp.291-303.
Copeland, T.. Antikarov, V, (2003). Rea! O ptions A P ractitioner's G uide, Thompson,
l ampa, FI..
I>e Leeuvs. A.C.J. < I ‘>90). O rganiza tions M anagem ent. A nalyse. O n tw erp en
Verandering. 4th cd., Van Goreum, Asscn.
Dempsey, VI. and Partington, G. (2004). 'The co st o f ca p ita l eq u a tio n s u n d er the
A ustra lian im puta tion tax sy stem ' Accounting and Finance Association of Australia and
New Zealand Conference, Alice Springs.
Doff. R. (2004), “E conom ic C ap ita l e n R isicoheheer hi; B arken " , NIBE-SVV.
DolT. R. (2007), R isk M anagem ent fo r Insurers R isk C ontrol. Economic Capital and
Solvency II. Risk Books, London.
Douglas. B.R. (19S>4). "The budgeting p ro cess in a m u ltin a tio n a l f ir m " . Multinational
Business Review, Vol. 2 pp.59-63.
Ellis, B. (1966). B asic C oncep ts o f M easurement, Cambridge University Press,
Cambridge.
l ama. E. and French. K. 1992. "The cross-section o j exp ec ted stock re tu rn s’. Journal of
Finance, vol. 47. pp. 427-65.
Fenlon-O’Crcevy, M.. Soane. F. (2001). 7 V Sub jec tive In sc ha ttin g van Rlsico".
Mastering Risico. I inane ice I Dagblad, pp. 32-38 (in Dutch).
I reeman. \1. and Hobbes. G. 1991. 'C apita l budgeting Theory versus practice '.
Australian Accountant, vol. 61. pp. 36-41.
44

Frool, K.A., Stein. J.C. (1998). "Risk m anagem ent, ca p ita l budgeting, a n d capita l
structure p o lic y f o r fin a n c ia l institu tions an integrated approach". Journal of Financial
Economics. Vol. 47 pp.55-82.
Gilman I.J (1988) P rincip les o f M anageria l F inance, Harper & Row Mohd. /.ulkhairi
Mustapha and Susan I ho Lai Mooi 290 International. New York.
Gitman. I. and Mcrcurio. V. 1982. 'C ost o f ca p ita l techn iques u sed b y m a jor U S . f irm s:
S urvey a n d an a lysis o f F ortune's 1000', Financial Management, vol. 11. pp. 21-9.
Gitman. L.J.. Forrester. J.K. <1977), "A survey o f cap ita / budgeting techn iques u sed by
m ajor U S firm s" , Financial Management. Vol 6 pp.66-71.
Goto. S. (2007). "The bounds o j c la ssica l r isk m anagem ent a n d the im portance o f a
behavioura l approach". Risk Management and Insurance Review. Vol. 10 No.2. pp.267-
Graham, J. and Harvey, C. 2001, 'The th eo ry a n d p ra c tice o f corpora te fin a n ce: E vidence
horn the fie ld '. Journal of Financial l.conomics, vol. 60. pp. 187-243
Guilding. C.. Lamminmaki. I).. Crury, C. (1998). "b u d geting a n d s ta n d a rd costing
practice', in S e n Z e a la n d a n d the U nited K ingdom ", The International Journal of
Accounting. Vol. 33 No.5. pp.569-88.
Hamel. G and Prahalad. C' K. (1994). C om peting fo r the F uture. Harvard Business
School Press, Boston. MA.
Irving Fisher (1930) p u t fo r w a r d a separa tion theorem theory. Australian Accountant,
vol. 61. pp. 36-41
Jones. C J. (1986), " f in a n c ia l p la n n in g a n d co n tro l p ra c tices in UK com panies a
long itud ina l study". Journal of Business Finance and Accounting. Vol. 13 pp. 161-85.
45

Joyc. M .P . Blayncy. P. I. (1990), "C ost a n d m anagem ent a cco u n tin g p ra c tices in
A ustra lian m anufacturing com panies, su rvey results". I he Accounting and f inance
Foundation. University o f Sydney. Sydney, monograph.
Kadondi (2002) A S u rvey o f C apita l B udgeting Techniques U sed By C om panies L is ted at
S S E .
Kim. S.U., Farraghcr. E.J. (1981). "C urren t cup ita l budgeting p ra c tic es”, Management
Accounting, Vol. 62 pp.26-30.
Klammer I P & Walker MC (1984) The con tinu ing Increase in the Use o j Soph istica ted
C apita l B udgeting Techniques. California Management Review, Fall. 137-148.
Klammer IP (1973) The associa tion o f C apita l B udgeting a n d f i r m P erform ance. The
Accounting Review, (April), 353-364.
Klammer. I. 1973 ”lh v associa tion o f ca p ita l bud g e tin g a n d f ir m p er fo rm a n ce”. The
Accounting Review. April 1973. pp.353-64.
Kocdijk. K. 2004. 'Corporate finance in Europe: C onfron ting th eo ry w ith practice'.
I inancial Management (2000), vol. 33, pp 71-101.
Kurit/kes. A., and Schuermann, T. (2006). "W hat w e know, don 't know a n d can 't know
abou t insurance risk: a view fro m the tren ch es”, in Diebold. F.X., Herring. R.J. (l ids), I he
Known, the Unknown and the Unknowable in f inancial Risk Management Princeton
University Press. Princeton. N J ..
Lawrence. M. (2000). "M arking the cards a t A i \Z ”, Operational Risk Supplement. Risk
Publishing. London, November. pp.s5-sl2.
I.elyveld. I. (2006). in van (Eds) Economic C a pita l M odeling C oncepts. M easurem ent
a n d Im plem entation, Risk Books, I ondon
46

Levy. H.. Samat. M. (1986). C apita l Investm ent a n d F inancia l D ecisions. Prentice-Hall,
Englewood ('lift's. NJ,
Levy. H.. Samat. M. (1986). C apita l Investm ent a n d F inancia l D ecisions. Prentice-Hall.
Englewood Cliffs. N J ,.
Lllleyman. P. 1984. 'C apita l budgeting - curren t practices o f A ustra lian organiza tions'.
Australian Accountant, vol. 54. pp 130-3.
Molten, C. (2000), M anaging insurance C apita l. 2nd ed.. Wiley. New York. NY.
McLancy, E.. Pointon, J.. Thomas, M. and Tucker. J. 2004. 'P ractitioners' perspec tives
o n th e U K co st o f cap ita !' European Journal of finance, vol. 10. pp. 123-38
McMahon, R. 1981, 'The determ ina tion a n d use o f Investm ent hurd le rates in capita l
budgeting: A su rvey o f A u s tra lia n p ra c tice '. Accounting and hi nance, pp. 15-25.
Monkhouse. I*. 1993, T h e cost o f eq u ity under the A ustra lian d iv id en d im puta tion lax
system '. Accounting and Finance, vol. 33. pp. 1-18.
Monkhouse. P. 1996, T h e va lua tion o f p ro jec ts under the d iv id en d im puta tion tax
system '. Accounting and Finance, vol. 36. pp. 185-212.
Moore. J.S.. Reichert. A.K. (1989), "A m ultivaria te s tu d y o f firm p erfo rm a n ce a n d the use
o f m odern ana lytica l too ls a n d fin a n c ia l techniques". Interfaces. Vol. 19 No.3. pp.79-87.
Myers. S. (1977), "D eterm inants o f corpora te borrow ing". Jo u rn a l o f F inancia l
Econom ics. Vol. 5 No.November. pp. 147-75.
Myers. S.C., and Read. J.A (2001) "C apita l a lloca tion fo r insurance com panies". The
Journal of Risk and Insurance, Vol. 68 No.4, pp.545-80.
Officer. R. 1994. T h e cost o f cap ita l o f a com pany under a n im puta tion lax system '.
Accounting and Finance, vol. 34. pp. 1-36.
47

Payne. J.. Ilcaih. W. and Gale. I.. 1999. 'C om parative fin a n c ia l p ra c tice in the U S a n d
C a nada C ap ita l budgeting a n d risk assessm en t tech n iq u es’. Financial Practice and
Education, vol. 9, pp. 16-24.
Pike RH ( 1988) /I n E m pirica l S tu d y o f the A dop tion o f S o p h is tica ted ( 'apita l B u d yen n y
P ractices a n d D ecision M aking E ffectiveness Accounting and Business Research, 18
(Autumn), 341-351.
Rultana A (1998) M alaysian C ap ita l B udgeting M ethods Survey a n d A nalysis. In Annual
PACAPTMA Finance Conference on Asia Pacific Financial Market.
Ryan. P. and Ryan, (i, 2002, 'C apita l budgeting practices o f the Fortune 1000 H ow have
th ings changed? ' Journal o f Business and Management, vol. 8. pp. 355-64.
Saita. I . (1999). "A llocation o f risk cap ita l in fin a n c ia l institu tions". Financial
Management, autumn, pp.95-111.
Saita. F. (2004), "Risk aggrega tion the risk m anager's perspec tive" , paper presented at
European Financial Management Association Conference. June 30.
Schnll, I..D.. Sundcm. Ci.l... Geijsbeck, W.R. Jr (1978). " S u n v y a n d a n a lysis o f cap ita l
budgeting m ethods", I he Journal of Finance. Vol. 33 pp.281 -7.
Scheffer, S. (2(8)4). "M anagem ent con tro l o f cred it risk in the bank lend ing p ro cess"
I'wcnte University, Enschede. PhD thesis,
Schroeck. G. (2(8)2). Risk M anagem ent a n d Value C rea tion in F inancia l Institu tions,
Wiley, New York. NY.
Schwarz. FEW. (1987), "B udgeting a n d the m anageria l p rocess", in Sweeny. H.W.A..
Rachlin. R. (Eds). 11 and book on Budgeting. John Wiley & Sons. New York. NY. pp. 1-20
Srinivasan. U. (1987). C urren t B udgeting P ractices in U S Industry. Quorum Books. New
York. N Y ..
48

Van den Tillaart, and A.II.A.J. (2003), "M anaging o fu ra tin n a l risk concepts a n d
p ra c tices" , NIUL-SVV.
Van Tries!, S. (2000). I he C ost S tructure o f F irm s: M anag ing F ixed versus Variable
C osts. Twenlc University. Enschede.
Volbcrda, 11. (1998), The F lexible F irm H ow to R em ain C om petitive. Oxford University
Press. Oxford.
Wack, I*. (1985), "Scenarios unchartered w aters a h ea d ”, Harvard Business Review,
September/Ociobcr. pp. 73-89.
Wciscnfcld. I ., Tyson. T. (1990). "H ow to m ake accoun ting a positive to o l in
m a n agem en t's h a n d s”. Management Accounting (UK), No.Novcmher-Dccembcr. pp. 19-
20.
While, J.B.. Miles. M.P., Rohidcaux, D.S., Arnold. D R "An exploratory study into the
effect a f f i r m size on the u tiliza tion o f ca p ita ! budgeting tech n iq u es", Lander College
Business Review. Vol. 5 No.1989. pp.6-10.
Winfrey, F.L., and Budd, J.I.. (1997). "R efram ing stra teg ic r is k ", SAM Advanced
Management Journal. Autumn, pp. 13-21.
Zaik, E. (1996). “R A R O C a t bank o f A m erica fro m th eory to p ra c tic e”. Journal of
Applied Corporate Finance, summer, pp.83-92.
49

APPENDIX I: QUESTIONNAIRE
Instructions:
(a) Give brief answers in the spaces provided
(b) In the boxes given please tick appropriately
1. Please indicate the type o f business your organization
u n d e r t a k e s _______
2. For how long has this organization been in operation in Kenya? (Tick as
appropriate)
a. Less than I year | |
b. I to 5 years ( )
c. 6 to 10 ycurs l J
d. 11 to 15 Years | |
e. 16 years and above [ |
3. Please indicate the ownership of the organization using the categories below
(please tick one us appropriate)
a. Predominantly local (51% or more) | ]
b. Predominantly foreign (51% or more) | |
c. Balanced between foreign and local (50/50) | |
4. How many full time employees docs the organization have (Pleas tick as
appropriate)?
(a) Less than 25 I |
(b) 26 to 50 | |
(c) 5 1 to 75 [ J
d) 76 to 100 | |
(c) 101 employees and ubove | |
50

5. For how long have you worked in the organization? (Tick as appropriate)
Less than I year | |
Between I and 5 years ( 1
Between 6 and 10 years | 1
Between 11 and 15 years | |
16 years and above | |
SKCTION TWO: CAPITAL B1 DGK.TING AND CAPITAL Bl'DGKTING
TKCIINIQUKS6. Which kind of capital budgeting techniques does your company use?
(a) Internal Rate of Return 1 1(b) Net present Value ( ](c) Payback period 1 1(d) None of the above 1 1
7 What areas does your capital budget technique focus?
8 The following are formal methods used in capital budgeting, including the
techniques. Rate the methods according to their applicability within your company
Method Very much applicable
Muchapplicable
Applicable Moderatelyapplicable
Notapplicable
Net present value
Internal rate of return
51

9 * hve these techniques been used by other insurance companies in the industry.
Yes | |
No | |
11 Have these capital budgeting techniques been successful in other insurance
companies?
Yes | |
No | ]
12 lias recognition of risk been an important component in capital budget decision
making issue in your organization?
Yes | |
No | J
s K NON II1KEE: Capital Budgeting Techniques and Performance
13. To what extent do you agree with the following statements in relation to the
relationship between Capital budgeting techniques and firm performance? (Use a scale of 1*5 where i - strongly agree und 5 strongly disagree
Statement. 1 2 3 4 5Capital budgeting techniques places a high importance on the
budgct-to-actual comparison for performance evaluation purposes
( apital budgeting techniques being a standard Tor performance arc
used to evaluate managerial performance.
( apital budget techniques crc used by insurance companlcsTn “ -
Kenya for setting goals and evaluating performance.
( apital allocation methods can be assessed only jn the context of
the company's economic goals

14. To what extent do the following behavioural outcomes o f Capital budgeting process
experienced in your organizational planning process which alTccl your performance?
Behavioural outcomes Very low extent
Lowextent
Moderateextent
Greatextent
Verygreatextent
Fnhanccd goal congruence
More universal participation
15. Docs appropriate capital investment decisions increase the company’s long-term
effectiveness and efficiency?
Y « Q
No Q
16, If your answer to the question above is yes. in which ways
17. "Adoption of the appropriate capital budgeting tools provides company managers
with both the processes and techniques required to make decisions that will enhance the
organization’s resource base” to what extent do you agree with the statement?
Strongly agree□
Agree □
Neutral □
Disagree □ 1----1
Strongly disagree □
53

18 l isted below are some o f the liquidity ratios for the company. With respect to your
organisation, please indicate the extent to which each of the listed ratios has
inlluenced the capital budgeting.
Liquidity ratios that have influenced capital
budgeting
Response
Very
much
(5)
Much
(4)
Somehow
(3)
Neutral
(2)
Not at all
(1)
Current ratio current assets / current
liabilities
Quick ratio*cash and cush equivalents'
short term investments » net trade
receivables / current liabilities
Working capital turnover revenue/
working capital
Days of cash
54
