a surve oy f interna coordinatiol n public enterprises …
TRANSCRIPT

A SURVEY OF INTERNAL COORDINATION AND CONTROL SYSTEMS IN SELECTED
PUBLIC ENTERPRISES BY
AMELIA C. ANCOG
M P A/0- U-0*

i
ACKNOWLEDGEMENT
This study >011(1 not have been initiated without the active support and encouragonent of CQA Chairman Francisco S. Tantuico, Jr. whose in-terest in research has always been substantiated by his continuous assistance and moral support to innumerable research projects including this one. Many thank® are also due the Chairman of the Public Enterprise Team, Dr. Gabriel Iglesias who, In the monthly meetings of PET, cajoles its matters to undertake studies to contribute to policy making and administration; to Dr. Filologo Pante, Mr. Mario Feranil and Dr. Rosario Manasan and the Directors of the Board of the Philippine Institute for Development Studies for supporting this undertaking.
My gratitude is also due the officers of the Local Water Utilities Administration, Messrs. Carlos Leano and Ibarra Olgado, Mrs. Cynthia Esguerra, Mr. Hermilio Balucan, Mrs. Edna Balucan and Mrs. Bnerenciana Gueco, Corporate Auditor and her staff; the Farm Systems Development Corporation, particularly Messrs. Teodoro Rey and Venido Atienza, and Miss Gwen Torres; the Philippine Virginia Tobacco Administration, specifically Justice Federico Moreno, Atty. Florante Seril, and Messrs. Mario Sison and Jaime Senga; the Heme Financing Corporation, particularly Attys. Manuel Villa-Real, Jr., Florencio Ongkingko, Hector Inductivo, Mr. Juan Redoble, Atty. E^win Acevedo and General Feliciano Gacis, and to all the other officers and personnel of the above-mentioned corporations and of the personnel of the Carmission on Audit assigned therein, whose names are indicated in the Interviewees List, as well as Atty. Sofronio Ursal, Manager of the Corporate Audit Office, COA.
To Dr. Genielle Ranano, consultant in finance, Misses Cynthia Abis and Teresita Leano, research assistants, Mrs. Lita Morales, administra-tive assistant who devoted considerable hours to provide data and support to these research efforts to ccmplete the project on time, aid to my husband, Ednmndo S. Ancog, who edited the manuscript, my most heartfelt thanks.

ix Preface
Public enterprises are fascinating entities. They are characterized by a considerable degree of autonony, .social and economic orientation and relative flexibility in coping with the dynamic environment. Their role in development has been discussed in many forums; their participa-tion in bringing about economic improvenent and social well-being has been analyzed in classrocm discussions and international conferences.
For a country with limited resources and ccmpeting priorities, the Philippines has 167 public enterprises. The extent of their contribu-tions to national growth has yet to be assessed fully and exhaustively. To provide, directions in research on public enterprises, Chairman Francisco S. Tantuico, Jr. of the Carmission on Audit organized a small group of academicians, public administrators and researchers to form the Public Enterprise Team (PET) which can devote its energies to researches, forums and other related activities on public enterprises. This survey is a response to his active encouragement to PET - to look into public enterprises with a detached and objective perspective, ard to ascertain ways and means by which they can be assisted and mobilized to serve their clients most effectively.
This study has six parts. The first part contains the introduction, review of literature, conceptual framework, methodology and limitations. The second,, third, fourth and fifth parts pertain to the Local Water . Utilities Administration, the Hone Financing Corporation, the Farm Systans Development Corporation and the Philippine Virginia Ttobacco Administration, respectively. The period covered by the study is frcm 1980 to-1983.
Each corporate study has four subparts. The first refers to the corporate overview and organizational changes over the four-year period under review; the second covers the aspects of internal coordination and control; the third pertains to the financial highlights; and the fourth to the operational highlights or accamplishments. A brief summary follows after each corporate study. The sixth part contains the conclusion and recaimendations.
It is our hope that our modest study will scmehow contribute to the understanding of the operations, problems and concerns of the public enterprises.
November 14, 1984

- 1 -
A Survey of Internal Coordination and Control Systems in Selected
Public Enterprises Introduction
A unique development in Philippine public administration is the proliferation of public enterprises or government-owned or controlled corporations. As of December 1983, the Ccrrmission on Audit (COA) listed 117 of these government-owned or controlled corporations ccm-posed of 13 in the field of finance, 17 in infrastructure and public utilities, 21 in jyidus trial and area development, and 61 in agricul-tural, trading and promotional operations.
The seed money that these entities needed to start their opera-tions was provided by the government frcm taxes and other sources. Subsequently, however, sane of these institutions were able to generate funds frcm internal sources thru their operations, while others were able to source their funds fran international lending institutions or through the issuance of debt instruments, if allowed by their charter. But a majority of than depend, and continue to depend, on the government for their operational funds, particularly those whose functions are service-oriented. The massive amount of funds poured into these public enterprises poses a number of important policy and management issues, such as the extent of review and super-vision that external agencies may exercise over than, and the degree of accountability of corporate officers over the funds and property of these public enterprises.
Proper and effective use of resources is crucial in public enter-prises because of the scarcity of these resources and the canpetinq priorities that demand support. As a means of assuring effective use and managanent of resources, internal coordination and adequate con-trol systans beccme imperative. Effective coordination can be achieved in many ways. One of these is the integration of the policy formulation role with execution and administration at the highest organizational level; another is the installation of a control mechanism such as in-ternal audit and monitoring systons. Since public enterprises are governed by their respective charters and operate within an autonanous framework, the approaches to the irrp lamentation of a syston of controls are as diverse as £he functions of these firms.
This study intends to present a perspective of internal coordination and controls practised by 4 selected public enterprises. Specifically, it seeks (1) to assess the effectiveness of the dual role of a policy-maker concurrently performing the function of a supervising official, and (2) to assess the scope and effectiveness of the control systans in these 4 public enterprises.

- 2 -Significance of the Study
Under the Philippine Constitution, as supplemented by implementing Presidential Decrees, the Carroission on Audit has been mandated with basic control responsibilities pertaining to government funds and pro-perty. The CQA's powers include, among others, authority to examine, audit and settle, in accordance with law and regulations, all accounts pertaining to revenues, receipts, expenditures and. uses of funds and property of the government, its agencies and instrumentalities. The traditional contrqjl responsibility of the CQA has been exercised in the, nature of pre-audit of transactions by CQA. auditors assigned to these institutions- However, as will be taken up in more detail in a later section of this study, CQA has introduced control policy reforms making its function post-audit in character and gradually withdrawing resident auditors frcm institutions that have installed adequate in-ternal control systems within their organizations.^
In the light of the reforms adopted by the COA and their implica-tions on management autonomy, a survey of existing systems for internal control and coordination will be most timely and appropriate. The re-sults of the study can be used by policy-makers of public enterprises in formulating policies and guidelines consistent with the fiduciary nature or service-orientation of functions of these public enterprises and the positions of its officers and employees. The insights fran the study can also be used in evolving structural arrangements so that linkages between policy-makers and implementors can be forged to achieve tetter resource management.
Review of Literature
Acccuntabili ty
Inherent in the fiduciary trust given to a public officer managing or handling public funds is the concept of accountability. In public enterprises, this concept takes on three dimensions. First, account-ability is viewed fran a legal or penal standpoint v^ich emphasizes strict fidelity in the nianagonent and use of public property and funds. The Revised Penal Code of the Philippines has a whole chapter dealing on instances that art accountable officer may be held criminally liable and suffer the penalty of fine or imprisonment for acts either of can-mission or omission in the discharge of his duties, not only in those instances where he could benefit pecuniarily, but also in those instances where, though no benefit personally accrues to him, public funds or pro-perty are lost through his consent, abandonment or negligence.3 The second dimension as managerial accountability intrinsic to the nature of accountability itself, which includes, among others, such considerations

- 3 -
as check and balance, proper definition and separation of duties, authority and responsibility, and the availability and appropriate use of monitoring and reporting tools. This is amplified by the . Auditing Code which vests full fiscal responsibility in management. The third dimension is the service orientation of accountability, or service-delivery to clients, as caimonly applied to social services. The emphasis of this dimension is on quantity, quality, and timeliness in rendering services to the right clients or beneficiaries.
.. Part of. the accountability ccmponent of public enterprises is a review of the budget which, historically and traditionally, is part of the control system. Within this context, the Ministry of the Budget holds the view that as long as public enterprises receive funds fran the national government, the Ministry has the right to review the corporate budget. This view is based on the rationale that all funds of government-owned ana controlled corporations, whether from the national government or frcm external sources, are essentially part of the national funds or the entire government resources which, when utilized by these corporations, contribute to the gross national product. It is further contended that the funding frcm the national government partakes of the nature of subsidies or equity contribution; consequently, the national govern-ment has the right, through the instrument of budgeting, to review and inquire into how these subsidies or equity contributions were utilized by these corporations.^ This study, however, does net focus on „iccountabi 1 ity derived frcrn external budgeting, but rather on the .is; • of budgeting that is internal to the organization.
Tandon, in a well-written analysis of control systems, integrates control systans with accountability. He believes that as public enterprises grow and mature, control systems likewise develop into a "self-reliant and self-directing system" within a framework of accountability and as an independent part of the total public enter-prise system. He also believes that "accountability is an indivisible system that should serve equally the internal needs of the enterprise and the requirements of public authority."6
Similarly, Heath views accountability within the context of control systems. He asserts that accountability has three features: first, the possession of authority by a person to exercise discretion over the use of resources to carry out his assigns! duties; second, the obligation to render a report or statement of decisions and of the measured result; and third, the means of exercising discipline or control In the event that the tasks assigned have not been conducted sati sfactor ily.
- 4 -
Walsh has a wider perspective of controls. She observes: "We must go beyond a financial balance sheet and beyond statutory statanents of corporate mission to devise a framework within which to evaluate the performance of public authorities and to judge the organizational alternatives available to govern-ment. " "The decisions and purposes of public enterprises should Be judged on the basis of several costs arid benefits that go well beyond the legislative mission and financial record of a single agency. The con-duct of a public enterprise has political costs and benefits. Its decision making process must include consideration of caimitments and constituencies of elected officials, the perceived needs of local ccmnunities; the source of political support for the corporation itself; the maintenance of integrity that sustains public trust." 8
Her observations tie in quite neatly with the three dimensions of accountability and go beyond the corporate mission of the public enterprise as expressed in its charter. Accountability, as far as Walsh sees it, includes popular support, mandate of the public, and cannitment to public service. Coordination and Control Systems
This study focuses on coordination and control systems, which include planning, budgeting, auditing, monitoring, and coordinating. Consequently, the whole range of managerial and evaluative activities may be conceptually segregated into the af or orient ioned aspects for analytical purposes.
Coordination may be devised internally or externally. Internally, organizations are coordinated thru a hierarchy of positions as defined in the organizational chart. The details of duties and responsibilities are spelled out in a functional chart. The chief operating officer bears the ultimate responsibility of coordinating the operations of an organization.
The classic comparison often used to illustrate coordination in an organization is that of an orchestra composed of msnbers playing different instruments. Individually, a member would hardly make musical sense playing his part of the score by himself alone; nor is there any assurance that beautiful music would ensue if all the members were to play at their own leisure. Tone, rhythm and harmony are

- 5 -
obviously needed to blend, the otherwise disparate notes and ins-truments into a coherent and delightful amalgam of sounds we call music. This is the task of the orchestra's conductor, as it is also the task of the chief executive of an organization to coordinate, and scmetimes discipline, the various members of his "orchestra" to agree on a camion philosophy of service designed to direct their energies toward the mission of the enterprise.
In quite a number of cases, coordination is most effectively done through committees. However, the success of committee work depends on a positive synergy among the members — a situation that can be attained only if the behavioural qualities of the manbers individually, and the committee as a whole, interface harmoniously.
External coordination, on the other hand, exists when agencies ewer see or coordinate the public enterprise for certain reasons, such as for policy or budgetary purposes. In the Philippines, coordination by supervising ministries over public enterprises is well defined in Presidential Decree No. 1 which is more cannonly known as the Reorganization Act.
Planning Planning consists of such activities as developing objectives
and goals for the ccmpany; projecting economic conditions that will affect its future; formulating alternative courses of action to reach ihe goals; analyzing QQnsequences of the alternatives; deciding which programs are most feasible in the light of limited resources; and devising methods for measuring progress toward planned goals when a program has been chosen.®
The key members of the organization fulfill a crucial role in the planning exercise. Their skills at persuasion and negotiation, their grasp of facts and figures, their corraltment to philosophy of service - all these influence the planning exercise. Thus, negotiations, mutual give and take, reciprocal understanding of the requirorients of other groups or sectors, make target-setting and planning an exciting endeavor.
Planning can either be a top-to-bottcm or bottcm-to-top process. Approaches vary, depending on many factors present in the organization. However, the bottcm-to-top approach appears to enjoy the advantage of enhancing the ccrrmitment of the members of the organization to the successful implementation of the plan.
In this regard, it is often said that during times of crisis and when resources are very scarce, long range or even short range planning may no longer be relevant. However, the flexibility and responsiveness of management to the dynamic circumstances and events through the formulation of contingency plans will enable the organi-zation to attain same degree of stability and security during the crisis.

I'a* •• ..
'.mmmi ',.•,• ".""A '"'•I •Sfc-^V j>
V ;>i\ - , 'J..•,.".,". .6
tonti; - • •• - •••• • - -
ftsnce, priorities;
• "i.'C
• dc .. .-.v' .vf .i.j •Wt:
:, 'V Xt-
' ".•;••'' :!r • ••. ; V/f'-VV- '•,-•••-<>•'[• ,. • . Si ••• 1
a-, -i-' rv': } 7 ^ : .- j.
. / . V .
••V'l-'A.'V
-'. V •

- 7 -
He clearly states that for as long as public enterprises ask money frcm the government, the Ministry of the Budget will continue to look at corporate operations. He adds :
"Fiscal autonomy is rare in practice. While there are seme enterprises which have announced that they have gained sane measure of fiscal autonomy, this is mere fiction if we consider the extent of government resources which are forthcoming to support their operations..." 1 2
While this study will not look into the scope of review of the Ministry of the Budget over the budgets of public enterprises, we incorporated the relevant observations of its Minister for they are inputs to the internal budget system of the organization. As a tool for control, budgets ran be the basis for measuring extent of use or application of resources and eeoncmy in the spending practices of the corporation.
Auditing The innovations the OQA. formulated and implemented, have far
reaching implications on the structure and evaluation work of the government corporations. Before the implementation of the policy of withdrawal of external auditors, management could always rely on the audit undertaken by the CQA's representative. Mvice on accounting and auditing matters could readily be availed of within the corporation because the CQA's representative was in residence. In certain degree, the CQA's auditor "participates" in financial management.
With the implementation of the twin reforms - withdrawal of pre-audit of transactions and the withdrawal of resident auditors - initiated by Chairman Francisco S. Tantuico, internal self-audit activities have to be undertaken by management itself. In pursuit of these reforms, he suggests that internal control systems be improved, accounting systems be manualized, and competent staff be hired for accounting units. 1 3
The importance of internal control units as an organic part of the public enterprises was acknowledged by the International Congress of Supreme Audit Institutions in its 1974 Congress in Madrid, Spain. 14 It also defined the relationships that should exist between the Supreme Audit Institution and the internal control institution and proposed the following recarmendations :

_ 8 -
"1. "That the Supreme Audit Institutions pranote systematically and continuously the establishment and improvement of internal audit systems and audit units in the institutions subject to their control and attach special importance to the necessity that these units must be subordinated directly to the Director of the Institution; *
2. That the Supreme Audit Institutions formulate principles, elaborate general rules and regulations and impose or propose these to the institutions sub-ject to their control, in order to guarantee an efficient operation of the internal control system and insti-tutions;
3. That the internal control institutions include in their auditing activities the control of economic managenent and its results;
4. That the Supreme Audit Institutions in their respective report to Parliament sufcmit their evaluations as regard the volume and efficiency of internal control and its results, provided that this is compatible with national legis-lation. "15
The Auditing Code of the Philippines embodied sane concepts ^ ^ ^ a b o v e recordations. Thus, sections 123 and
. S 1 ^ ^erY clearly internal control systems and the require-ment that these be installed in all agencies, offices and units of government .16
A strong an$ adequate internal control system is one of the pre-requisites for the withdrawal of resident auditing. The other conditions are an operations manual or a set of written instruc-tions containing the operating and accounting systems and procedures ot the agency or corporation; and the establishment of an internal control unit or the designation of a responsible official to monitor and continually appraise the existing systems and procedures. 17

- 9 -
There are two phases in the withdrawal of a resident auditor. The first is the initial evaluation phase, where a team of COA auditors assess the internal control systarr of the agency or corporation. Weaknesses and strengths are identified and reccrtmend-ations are made to improve the control systems. The recommendations are transmitted to the corporate head so that he can monitor the changes and suggest improvements in the system. A post evaluation phase follows after six months or more frcm the date of initial evaluation to ascertain the readiness of management to undertake its own fiscal management without the presence of the auditor.1**
To date there%re about 23 public enterprises which no longer have resident auditors. The first to enjoy this privilege is the National Heme Mortgage Finance Corporation whose auditor was with-drawn in 1981. The OOA's plan of withdrawing resident auditing is continuously being implenented.
Parallel with the above discussed reform is the withdrawal of pre-audit. In the past, transactions were reviewed by the auditor before any disbursement was made. This practice was criticized be-cause transactions were delayed and also because it was perceived to be an intervention in what critics called a purely managenent decision of an enterprise in settling its own affairs. As the new leadership in CCA envisioned changes, managsnent was encouraged to develop its capability to handle its own transactions. A series of circulars were issued by COA, gradually reducing the pre-audit functions of the auditor. In Circular No. 82-195 dated September 15, 1982, only five activities are subject to pre-audit but are not pre-requisites to payment of claims. These include review of contracts for infrastructure, consultancy, documents relative to the acquisition of real property by the government for public use, evaluation of on-going infrastructure and other construction projects, and inspection of deliveries of inventories such as food stuffs, medicines, supplies, materials and the like.
Location of the Internal Audit Unit The internal audit unit must be custom-made to fit the needs of
the corporation or agency. However, the most essential criteria for locating it are access to the highest executive official and indepen-dence in the exercise of its functions. Sawyer succintly carments on this requirement in this manner :
"Independence is more than a slogan. It is a climate in which the auditing organization needs to live and breath and function. Internal auditing is a professional activity. Its task is to make professional judgements. It there-fore demands the highest type of detachment, integrity and objectivity."

- 10 -
These attributes atrophy in the absence of practical independence. Thus an independent reporting status that permits the maintenance of the objectivity removes the internal audi-tors from effective dependence upon the people whose activities they audit is utterly essen-tial. This desired result is caning to pass.^
" s h o u l f L ^ V ? ? ^ relation," he further elaborates, should be a^solid line to a top executive to assure consideration of audit recarmendations and access to all operaSSnsTSf prise; and the dotted line to the board to protect StSnal dS-pleasure on the part of the Chief Executive QfficL!"20
a u d i t o ^ f S l ^ S ^ ^ m D h a S i Z e t h e *** of the internal _ freely review and appraise licies, plans aid procedures t"t 1113 appraisal does not in any w^y relievTothS^S- ' S t a . 2 ^ o f the primary res^nsLliJS
In public enterprises in the Philippines, there is no specific practice or requirement regarding the location of tte LterSl audit unit Neither is there an? particular stScS?af^fSdn i s_ trative uniformity of the internal audit officeT^Ss n S S X to the evolving nature of this unit. Y
Monitoring
quantitative or rrplifafn-„„ activity steps or phases and
client to v,hinh the ^ t i S g i f ^ l L ^ ^ f " ^ ^ ^ 1
W a decisionmaking capability that exists within the

- 11 -
organization unit that will take action to bring the achievement level in line with planned level. 23
The desirability of having documents and reports for monitoring was emphasized by lABowe who asserts that for "the system to operate effectively, it is essential that management of enterprises prepare special reporting manuals or worksheets with a few selected vital performance indicators to provide itself with immediate signal areas requiring special attention. Variances in the execution of plans are red lights for imanagament action." 2 4
•J He further elaborates that predetermined information elements
are several but the most important ones include highlighting of essential key indicators, focusing on crucial problems and major opportunities, pointing out anticipation of a reaction to expected problans, representative quantitative data on trends in key ratios of performance that may be used for strategic decision, resource allocation and corrective decision. 25
The monitoring functions may be lodged in a corporate planning, financial services or internal audit unit. But the exercise of the monitoring function, may, frcm a wider perspective, be done from the first line of supervision to the succeeding levels. The more active the first line levels of supervision are in fulfilling monitoring, the lesser will be the burden of monitoring at the top level of manage-ment.
Methodology This research hopes to test the relationships of certain variables
which may influence or enhance internal coordination and control and the effective use of resources. A rather unique organizational as-pect in public enterprises in the Philippines is the role of the chief executive officer as a policy-maker since Republic Act #2254 specific-ally provides that the CEO should likewise be the Vice Cnairman of the Board. 26 Hence, this study will also examine the consequences of his dual roles.
The. following hypotheses will be tested: First, internal coordinaticn is effective when the policy-maker concurrently performs supervisory function over specific depart-ments, or group of departments; Second, internal coordination is facilitated by the presence of internal control systems ; Third, effective use of resources is enhanced by the existence and operation of control systems.

- 12 -
To attain this objective, a review and analysis of the structural and functional relationships of departments and units will be under-taken in the following areas: first, functional relationships between the director and supervising officer with the supervised departments; second, the functional relationships between the control units with line departments; and third, the functional relationships between the control units and the Chief Executive Officer and the Board.
Four public enterprises were chosen to represent the major sectoral groupings. These are: Local Water Utilities Administration (IWUA) and Farm Systems Development Corporation (FSDC) to represent the public uti-lities and infrastructure sector; Heme Financing Corporation (HFC) to represent the financial sector; and Philippine Virginia Tobacco Adminis-tration (FVTA.) to represent the agricultural, trading and promotional sector.
For purposes of analysis, we simplified the hypotheses in this manner: the dual roles of the chief executive officer as administrator and policy-maker facilitates internal coordination; and the presence and operation of internal control systems (units) facilitates super-vision and coordination and the effective use of resources. Since the research is principally exploratory, rigid methods of establishing causal relations will not be attsnpted.
Control units/systems will include planning, budgeting, auditing and monitoring. For this study, these are treated as structures. On the other hand, participation such as committee activities, conferences, communication and leadership style are considered processes. Results are outputs ensuing from the effective use of resources. The diagram of the relationships of the variables is shown below.
Intervening Independent Variable Variable Dependent Variable Dual role of policy-making and adminis- processes internal coordination tration Presence and opera- internal coordination & supea tion of control processes vision and effective use of systems (units) * resources
Effective use of resources are measured in terms of meeting of targets, reduction of operational expenses, profitability, and overall performance of the enterprise.
Cormittee type of activities, involvement in decision-making of the various levels of supervision, and leadership style are treated as intervening variables called processes which influence the results or outputs.

- 13 -
Sources of Data Data were obtained from annual reports, official documents and frcm
interviews of key officers based on an interview guide. Similarly, data inferred frcm observations were taken into account in analyzing the infor-mation gathered through formal methods. The reports for the years 1980 to 1983 of the public enterprises were used extensively and were supple-mented by Canmission on Audit reports. Analytical Tools
Comparison of changes in functions and structures frcm 1980 to 1983 were undertaken to ascertain improvements in the public enterprise. Analysis of the income statements and balance sheets as well as opera-tional data were madg to assess the overall performance of the public enterprises. Thus, a canparative, historical, and descriptive approach is used in evaluating the data. Limitations
This study is essentially an exploratory research. Empirical ex-periences in selected public enterprises were sought and documents were reviewed so that relationships between coordination and control systems and effective use of resources can be ascertained. However, since the survey covers only four years of the operations of the corporations chosen, analysis of relationships between independent and dependent variables were made generally through inferential analysis. Nevertheless, financial data were reviewed to assess financial performance and conse-quently, use of resources.
The rather abnormal econcmic factors which began in the early eighties, and which continue to prevail, were often mentioned by the administrators or chief executive officers as crucial constraints to high performance. These were taken into consideration in assessing corporate operations. Examples of these constraints are the reduction of subsidy or equity con-tributions by the national government to the public enterprises and other restrictive policies on the use of resources. Similarly, the high finan-cial charges on foreign and local borrowings also affected the available resources for operations. These circumstances were considered in the analysis of the data obtained in the survey.
The data-gathering efforts were hampered by the confidentiality of same reports, by the unavailability of seme key respondents, and by the reticence of a few to provide extensive information. Seme high officials were unavailable for interviews because of their busy schedules. Kence, sane information obtained fran lower officials were, to the extent possible, corroborated by documentary analysis.
While insights were drawn from the internal control evaluation reports of the Commission on Audit details from than were not incorporated in the study to preserve their confidentiality. However, related or complementary data on the results of internal control evaluation were obtained frcm in-terviews with management officials and documents provided by the public enterprises.

- 14 -FOOTNOTES
1 1983 Summary Annual Audit Report on Government-Owned and Controlled Corporations, Self-Governing Boards and Camaissions, Corporate Audit Office, Canriission on Audit, Quezon City, Philippines.
2 Thirty Years of Intosai, CQA Research and Development Foundation, Inc., Carmission on Audit, Quezon City, Philippines, 1983.
3 Article 217, Revised Penal Code, Philippines. 4 Section 4. Presidential Decree No. 898 as amended by PD No. 1445. "It is the declared policy of the state that all resources of the government shall be managed, expended or utilized in accord-ance with law and regulations, and safeguarded against loss or wastage through illegal or improper disposition, with a view to ensuring efficiency, economy and effectiveness in the operations of government. ^ e responsibility to take care that such policy is faithfully adfierecl to rests directly with the chief or head of the government agency concerned." (underscoring supplied)
5 Alba, Manuel, "State Review of Public Enterprise Budgets," State
Control Over Public Enterprises, COA Research and Development Foundation, Inc., Quezon City, Philippines, 1983, pp. 65-82.
® "Control Systons and Accountability on Public Enterprises," Control Systems for Public Enterprises in Developing Countries, Interna-tional Center for Public Enterprises in Developing Countries, Ljubljana, Yugoslavia, 1979, p. 140. 7 "Control Systems for Public Enterprises in Developing Countries: A Framework for Control Systems," Control Systems for Public Enterprises in Developing Countries, International Center for Public Enterprises in Developing Countries, Ljubljana, Yugoslavia, 1979, p. 78. g The public's Business, the Politics and Practices of Government Corporations, 3\tfentieth Century Fund, MIT, Cambridge, Mass.T U.S.A., 1978, p. 341.
9 Erwin David, "Corporate Planning at a Crossroad," Harvard Business Review, Ernest Frawlie, Mass., U.S.A, July-August, 1967, pp. 97-104.
10 Houck, Lewis Daniel, A Practical Guide to Budgetary and Management
Control Systems, D. D. Heath & Co., 1979, p. 217. 11 "Performance Evaluation of Public Enterprises," State Control Over
Public Enterprises, COA Research and Development Foundation, Inc., Quezon City, Philippines., 1983, p. 101. 12 Op. cit., p. 66.
13 ~~ 1982 Summary Annual Audit Report on Government-Owned and Controlled
Corporations, Self-Governing Boards and Camerassions, State Univer-sities and Colleges, Corporate Audit Office, Commission on Audit, Quezon City, Philippines, p. IX. 14 8th Intosai Congress, Thirty Years of Intosai, COA Research and Deve-lopment Foundation, Inc., Quezon City, Philippines, 1983, p. 79.

- 15 -
1 5 Ibid., pp. 79-80-16 presidential Decree No. 898 as amended by Presidential Decree No.
1445. 17 Bulletin No. 4, Corporate Audit Office, CQA, Philippines. 18 CQA Memorandum No. 84-372 dated January 12, 1984, Philippines. 19
The Practice of Modern Internal Auditing, Institute of Internal Auditing, Florida, U.S.A., 1981, pp. 540-541. 20 TU-J Ibid.
21 Auditing Principles and Procedures, Richard Irwin, Inc., U.S.A., 1971, p. 83.
22 The Theory and Practice of Managanesnt Control, AICPA, American Management. Extension Institute, U.S.A. ," 1976, p. 11.
23 Ibid., p. 3. 2 4 "A Systsn of Information and Control in Developing Countries with
Particular Reference to Tanzania," Control Systems in Public Enterprises in developing Countries, ICPE, Yugoslavia, 1979, p. 196.
25 D Ibid. Republic Act No. 2254.

- 16 -LOCAL WATERIJTILITIES ADMINISTRATION
Corporate Overview On May 4, 1971, the Presidential Economic Staff, entered into
an agreement with Wilson-Montgomery to undertake engineering and management services and to conduct provincial/research studies. Its output was entitled "Report on Proposed Institutional Deve-lopment in Support of Improved Urban Water Systems." The major finding in this report dated March 1973 was that most water utilities in the provinces were antiquated and badly in need of repairs ard maintenance and that without exception, they have not kept pace with subsequent coranunity growth.
Consequently, the report proposed a nationwide plan for long-range development of water and waste water systems, in provincial urban areas. The plan was "designed to encourage the future development of water utility system^ that are efficient, strong-ly managed and locally controlled."
In response to this recommendation, the Provincial Water Utilities Act of 1973, also known as Presidential Decree No. 198 was approved which declared as national policy the formation, maintenance and expansion of viable water supply and waste waster disposal system in urban areas and in the provinces. Subsequent amendments are contained in Presidential Decree Nos. 768 and 1479, enacted on August 15, 1975 and on June 11, 1978, res-pectively. The decree created the Local Water Utilities Adminis-tration and authorized the formation, at the option of residents, of self-reliant and locally-managed water districts to serve as conduits for the construction of modern and efficient water sinks and sewerage system.
Briefly, the functions of LWUA are as follows: 1. serve as a lending unit to water districts on
concessionary terms to expedite the improvement of capital facilities;
2. train water districts as well as LWUA personnel at all levels;
3. assist water districts on technical matters specifically on feasibility studies, designs, construction, utility operation, maintenance, management advisory services in institutional development; and,
4. review rates, provide standards concerning per-formance materials and equipment as well as operating guidelines, and monitor performance against these standards and ensure compliance with the same.

- 17 -
Organization Structure
Acting as the governing and policy-making body of LWUA is a Board of Trustees, composed of five members. The General Manager who is also ex-officio member of the Board exercises general supervision over three operating departments of LWUA. Under the 1980-1981 organizational structure of LWUA, the General Manager exercises supervision over: (1) Engineering Services; (2) Regulatory Services; (3) Leans and Prograrming Services and the staff offices attached to it, specifically (1) Public Affairs Office; (2) Office of Corporate Finance Officer; (3) Office of Corporate Legal Counsel; (4) Water Supply Training Center; (5) Management Staff; (6) Project Procurement Office and the major support department, the Administrative Service Department.
The Staff Services of the Office of the General Manage romi; Froiect Procurement Office (PPOf
The PPO's major function is the procurement of equipenent and other supplies for LWUA. It maintains and updates records of all purchases to assure compliance with LWUA's technical specification, ard performs liaison work between LWUA, the Water Districts suppliers and other government agencies. This office did not undergo any organizational changes from 1980-1983. It has two divisions, namely: the Procurement Division, and Monitoring and Inspection Division.
Transfer of PPQ In 1979, PPO was attached to the Administrative Services.
However, such a set-up did not prove to be effective due to the following reasons:
1. Since all documents pertaining to PPO go through 0GJ1, delays were incurred due to the long line of ccxiiaunica-tion from the Assistant General Manager to the Adminis-tration.
2. Procurement in LWUA involves highly technical and com-plicated specifications. These details call for a superior v;ho is an engineer.
3. The nature of the function is a highly sensitive one because the purchases involve substantial sums of money and annexing PPO i;o OGl-i will deter any connivance at the operating levels.^

- 18 -
Public Affairs Office (PAO) PAD performs the marketing function of IMUA. It undertakes
information and educational programs as well as other projects and campaigns and serves as the communication channel between LWUA and the Water Districts. It also serves as a conduit for dis sarinating information on government programs and water system development. The divisions under PAD are the Public Relations Division and Production Division. Hie PAO has not undergone any change in its set-up for the years 1980-83.
Office of Corporate Legal Counsel (OCLC) The OCLC handles legal matters and counselling, renders
opinions on legal natters, handles civil, criminal and adminis-trative cases, prepares contract documents and other agreanents. During the preliminary phases of water district development, it conducts investigations, and formulates recommendations regarding water district loan acquisition, rights of way and appropriation.
Change in name of OCLC divisions In 1980, there were two divisions under OCLC which were the a) Contract Admin. Division and b) Investigation & Research Division. With the 1982 revamp, however, a minor renaming of divisions occurred. The Contract Administration Division became the Contract Administration & Research, and the Investigation and Research became Litigation & Investi-gation. This structure continues to exist.
Water Supply Training Center (WSTC) In line with the need for adequate and continuous training
for Water District personnel at all levels of operations, the WSTC was created. Seminars, conferences and forums are conducted to achieve this goal. A separate building houses the WSTC and it is well-equipped with a complete but small-scale water sinks system, to provide hands-on training. There are also Regional Training Centers outside of Metro Manila. It also develops, designs and implements water supply engineering courses, cadet-ship training program, operator's certification program and other technical development courses for LWUA, Water Districts and other government entities. Local scholarship involving technical programs are also made available to the Water District's personnel. For the whole duration of the period under study 1980-1983, Water Supply Training Center was restructured.

- 19 -
Office of Corporate Finance Officers (OCFO)
The OCFO provides the agency with accounting arid controller-ship services like bookkeeping, financial reporting, budgeting and cash management.
It keeps the books of accounts in order and with the corres-ponding inputs, draw up financial reports to management and other offices. Requests and requisition for payment are pro-cessed by this office upon assurance that the supporting documents have been completed in accordance with the accounting and auditing procedures as well as managonent policies. Before this, however, OCFO obligates and commits funds and certifies to its availability. It is also entrusted with the task of consolidating the draft budget and reviewing budget estimates submitted by all departments. Based on this budget, final estimates for IMJA's projects are proposed and justified.
In 1980, a new department was created, namely: the Project Accounting Department (PAD). The PAD inherited the functions formerly performed in 1979 by the Accounting Department and Budget Operation Department. This department specializes in transactions involving the Water Districts including the following: 1) billing and collection; 2} project costing; 3) foreign loan accounting and payment of all project related claims. Transactions other than those pertaining to the Water Districts are under the General Accounting Division which takes care of financial reporting, disbursenent of funds for in-house operations, payroll preparation, paynent of office supplies and equipment and processing of travel claims. The Budget Operations Department ronained under the res-ponsibility of the Office of the Corporate Finance Officer in 1983.3
Transfer to Finance Services Department (FSD) In the reorganization in 1982, the Office of the Corporate Finance Officer was merged with the Loans and Programming resulting in the Financial Services Department. The corporate finance officer was retained and the two divisions, General and Project Accounting were combined under the Accounting Department with the two renamed as divisions. No further changes were made in 1983.
Management Staff The Management Staff studies the systens and procedures, conducts
operations audit, and recommend improvement in areas found deficient

- 20 -
or needing changes. Upon approval of the recommendations, it monitors the performance of the units concerned. It also prepares manuals. This department was originally formed in 1979 and remained as such until 1981.
Creation of the Internal Control Office When IMJA was reorganized in 1982, the Management Staff expand© its structure to include the Internal Control and Systems & Corputer Services Divisions. This was renamed as Managonent Office. The creation of the Internal Control Division is a response to the policy of COA, withdrawing resident auditors in public enterprises. While the Management Staff was vir-tually performing the internal control functions before 1982, the creation of a division specifically tasked with the function of reviewing the operations of LWUA was perceived to be necessary. Getting the right people to do the job proved to be a problsn. Moreover, the Management Staff personnel were too few, to assume a broader area of responsibility. Thus, a merger of Management Staff with another department which was capable of performing the internal control function was propose Before 1982, the Water District audit function was undertaken b the Advisory Services (Water District management audit was one of its divisions), and Analysis & Review Services (Fiscal moni-toring one of its divisions). The Officers of Regulatory Services argued that the audit of Water District should really be their responsibility since its foremost function is to make the Water Districts viable. The Analysis and Review Services, on the other hand, insisted that the sanctions that would enhance the effectivity of control systems were in their hands. The Regulatory Services' argument proved more convincing and was granted full jurisdiction over Water District audit. How-ever, this led to the transfer of Internal control functions to the Management Staff. In 1982, the Computer Services Divi-sion was created, although plans for computerization have been underway in earlier years. No changes occurred in 1983.4
Corplan It was only in 1982 that Corplan became a formal unit. However
since 1977, IWUA had corporate planning sessions among represent-atives frcm- each department. A trial Corplan was held in 1980. Each department suhmitted its plan for the year, with the corresporu estimates of expenses, resources, cash flow, and manpower requireme

- 21 -
Responsibility of Corplan Inasmuch as the emphasis of the Corplan sessions up to 1981 was on finance, specifically on the formulation of the budget, the responsibility ror the Corplan sessions was vested upon the Office of the Corporate Finance Officer with the budget division playing the most active part. The result of these corplan sessions were not always realistic and not unified because each department was concerned only with its own goals, although the group also worked out a corporate master plan. In addition to this, the CPO, as head of the Corplan Cormittee, was ful-filling two important functions on a concurrent capacity 5 With the implementation of 1982 reorganization, Corplan became^ separate unit reporting directly to the General
Operating Departments
Engineering Department The Engineering Department provides technical assistance
to Water Districts from the planning, design and construction First studies are undertaken on the feasibility of setting up Water District .in cities and municipalities. Upon identifica-tion of prospective areas, the state ot water supply facilities is assessed. With these outputs, the structural, architectural, and mechanical design of the proposed water District is made Based on these plans, the construction of water facilities is initiated.0
Abolition of sewerage am transfer of field opera i-im^
In 1980, 6 departments were under the Engineering Services, namely: 1) Water Resources; 2) Planning; 3) Design; 4) Construction Management; 5) Field Operations; 6) Sewerage. With the 1982 reorganization, sane changes were made and most prominent of these were the abolition of the Sewerage Department and the transfer of the Field Operations Department to the Regulatory Services. The Sewerage Department specialized in the disposal of waste water. However, this department did not generate a favorable response from the market, primarily because of the nature of its activities. Consequently, the department was scrapped.7'

- 22 -
On the other hand, the Field Operations Department was eventually transferred to the Regulatory Services- The transition was a most natural one because even before this move came about, field operations had been closely coordinating with the Regulatory Services, since it was concerned with the development of facilities, an activity that starts with a completed Water District. In this respect, the department rightfully belonged to the Regu-latory Services, which was also responsible for the post-construction phase of Water District formation.® In 1982, the Water Supply Design Department was renamed the Design Department, Water Resources became Water Resources Deve-lopment Department, and a new division was created under the planning department, the Special Projects Division. In 1983, no changes were made.
Regulatory Services The Regulatory Services works closely with the Water
District organization by enhancing its capability. The Water District is turned over to the Regulatory Services upon physical ccmpletion of the facilities by the Engineering Services. In effect, the Regulatory Services supplies management assistance as differentiated from the technical assistance. Furthermore, it takes charge of formulating measures on Water District opierations and monitoring and evaluation of Water District's performance. A more crucial function of the Regulatory Services is the recarmendation for approval or revision of the program of work, a requirorient for the granting of mini-loans. As early as 1980, three departments were under the Regulatory Services and the department had two divisions each. It is interesting to note that in the previous years, there were no divisions in the Depart-ment. Despite this arrangement, there was no backlog since only few Water Districts were formed during that time and the functions of the two divisions could be performed by a single division (departments were called divisions then) . However, with the increase of Water Districts proper delineation of functions became imperative to ensure efficiency of performance. Thus in 1980, the structure was as follows: a) District Formation Department with Water District Formation Division and Konitoring and Evaluation Division; b) Advisory Services Department with Water District Institutional Development Division and Water District Management Audit Division; c) Carraercial Systems Department with CPS Installation Division and Water Rate Review Division. On the whole, not many structural changes were effected in the Regulatory Services frcm 1980 to 1983 except the transfer to it

- 23 -
of field operations fran Engineering. As a result, its two divisions were renamed frcm Pumps and Machinery & Water Quality Control to Facilities Development & Water Safety Division, the Carmercial Systans Department simply became Water District Systems. All these changes occurred in 1982.
Loans and Programming Services (LPS) The Loans and Programning Services is primarily IMJA's
financial assistance aim to Water Districts. It acts on loan applications for Water Districts and monitors Water Districts' compliance with loan agreements as well as its own compliance with covenants with foreign lending institutions. Before a loan is granted to a Water District, the Loans and Programming Services also performs its own audit of the Water District to assess its financial standing and capacity to repay the loan. While the Regulatory Services performs a similar function, LPS concentrates on the financial aspect.
The Regulatory Services focuses on the managonent aspects. LPS formulates activities, evaluates the loan proposals of LWUA and sets the pace of lending.
Changes in Loans and Programming Services stmctnr-o; Result Of a merge
itoDng all the services, tne LPS has undergone the greatest changes because of a merger of two units effected during the 1982 reorganization. In 1980, three departments were under the LPS, namely: 1) loans operations; 2) analysis and review; and 3) programs. With the reorganization, the Analysis and Review Department was absorbed by the Management Staff, the Financial Studies Division was transferred to the I/pans Operations Department and the responsibility for fiscal monitoring was turned over to the Water District Management Audit of the Regulatory Services. Taking the place of Analysis and Review in the LPS, is the.Office of Corporate Finance Officer, which was also merged with LPS. Upon transfer of OCFO to LPS, the General Accounting and Project Accounting Departments were relegated to division levels under the Accounting Department. The Budget Operations Department was maintained and renamed Budgeting & Cost Control Department. These two departments remained under the super-vision of the intermediary officer, the Corporate Finance Officer. Programs Department was renamed Programs and Research and the LPS was renamed Financial Services. This was undertaken to streamline the functions of Corporate Finance Officer which in the first place performed functions closely related to those of the LPS.

- 24 -
Administrative Department The Administrative Department is considered IMJA's major
support department. It provides basic services like recruitment, payroll administration, benefit plans, performance evaluation, transport services, and typing and stenographic work. Records keeping and property managonent are centralized in this Services. The Medical and Dental Clinic is handled hy this Services. Structural Changes
Frcm 1980 to 1982, the departments under Administrative Services were 1) Personnel and Records Services; 2) Property Managgnent; 3) General Services; 4) Travel Services; and 5) Medical and Dental Clinic. The Personnel and Records Services constitutes a new department as of 1980. This set-up was implemented to centralize the task of records keeping since in the former structure, central records was handled by one department and personnel records by another. Clerical services under General Services Department is a merger of the reproduction division which was formerly under property managonent and typing and secretarial services under the General Services,, now forming the clerical services.9 In 1982, this set-up was altered even further. The Personnel & Records Department was split into the Personnel Department and Records was transferred to the General Services resulting in the Records and Office Services Departments. The divisions under Personnel Department are : 1) personnel; 2) medical/ dental divisions under the Personnel Services Department. Those under the Records and Office Services Department are: 1) secretarial and typing pool; 2) reproduction; and 3) cashiering. Since then, no other changes were made in the structure.
Area Supervisors : Decentralization Schane
Sane projects sustain losses after they beccme operational. While there are several possible causes of failure, the degree of supervision is sometimes thought of as one cause. A reliable respondent opined that the failure could stan from deficiencies on the organizational structure. He felt that ideally, one officer should oversee the project frcm the pre-development stage to post development. Each phase in the for-mation of a Water District is handled by a group of departments, and transferred to another group of departments, upon completion of the activities pertaining to each phase.

- 25 -
He also perceived that supervision is scmewhat fragmented resulting in the buckpassing of responsibilities among depart-ments. He suggested that a more responsive structure should be organized on a geographical or functional basis.
An organizational arrangsnent using geographical factor as basis for supervision presently exist on an experimental stage. Thus, under Office Order No. 271-83, positions of six area supervisors had been created. They are accountable for the attainment of perfonrence targets of Water Districts on his area. The duties of the Area Supervisor are :
a. Coordinate all IMJA activities in his area, and, in this connection :
1. Participate in feasibility study, design and project review meetings, and
2. Draw up an annual consolidated area plan detailing :
a. capital fund requirement b. schedule of facilities inprovanent c. yearly targets d. assistance needed fran other LWUA units
b. Supervise the management advisors under his carmand c. Regularly submit accanplishment report to the .Advisory
Services Department Manager .H
It is pro-nature to assess the effectiveness of the new structure for field supervision because the experiment is relatively recent. The Effect of the Reorganization of Loans and Proqrairrriinq_ Services
The Financial Services, created in 1982 through the reorgani-zation of the Loans & Programming Services and the Office of the Corporate Finance Office was intended to streamline the functions within one group. However, this has also resulted in the abolition of the Analysis and Review Department which was formerly under the LPS. The functions of the Department are extranely crucial. Simultaneous with the management audit performed by the Advisory Service Department of the Regulatory Services, the Analysis and Review Department also performs financial operations audit and monitors Water District compliance with loan covenants. A team report is completed based on the findings of both departments and appropriate courses of action are subsequently plotted. With

- 26 -
the 1982 reorganization, the operations audit function was transferred to the Advisory Services Department of the Regu-latory Services, thus eliminating tne counterchecking device provided by the Analysis and Review Department.
Developments in 1983 No changes in the organizational structure occurred in 1983.
Hiring was at a standstill because of an impending reorganization. The Ministry of Budget after its review of the structure and the staffing pattern, reccztmended the reduction of the number of departments, thereby leaving only two, .namely: the Operations Department and the Finance Department. A canpronise was reached and the most important changes were made in the Office of the General Manager with the reduction of the officers reporting to him, from four to two. The Public Affairs Office and the Water Training Center were transferred fran the Office of the General Manager to the Administrative Services Department. The other changes were the transfer of the Programs and Research Department frcm the Financial Services to Corplan. The Project Procurement Office was transferred frcm the Office of the General Manager to Financial Services as a division under Treasury. This structure is effective in April 1984.14

- 27
ASPECTS OF COOBDINATIOM & CONTROLS The following is a discussion of certain aspects of control systens,
the roles of the various units in controls and the participation of the chief executive officer in coordination and control.
Cormittees: Price_Escalation and Pre-Qualification Bidding and Awards Comiittees
TWD important ccnmittees which form part of IWUA's regular operations are the Price Escalation Connittee and the Pre-Qualification Bidding and Awards Committee (PREBAC). The Price Escalation Carmittee was created in 1977 to evaluate the prices presented by contractors. It acts as a reccnmend-atory body to the General Manager and the Board of Trustees. The members of the carmittee are the following : Manager of Construction Department, Manager of Design Department, Manager of the Project Procurement Office, Manager of the Management Services Office (MO), and a lawyer. The PREBAC has always been part of IMJA's organization since the start. It is part of the General Manager's staff. Its main function is to evaluate bids of contractors.
Executive Cormittee (EXEOQM)
The Executive Corroittee (EXECCM) is composed of the four Assistant General Managers with a representative frcm the Management Services Office (MO) acting as secretariat. It was created in early 1983 by the General Manager to "assist the Genera should concern itself with "issues that affect the -whole corporation." It was intended to act as a "premier body within LWUA next to the Board of Trustees." The regularity"of their meetings depend on the availability of the members and the scope of the matter to be discussed. Some issues that the EXBCGM was concerned with were the following: the 1984 organization structure, takeover of a water district, and the overseas training program. Management Advisory Council (MAC)
The Management Advisory Council (MAC) is a "union-like" group composed of the rank and file. It conducts periodic dialogues with the General Manager and the usual agenda are those pertaining to employee benefits and its interests. The officers of the MAC are selected among thenselves.
circle

- 28 -
Staff Meetings Staff meetings are held after Board meetings, usually every
>ther Thursday. All Assistant General Managers and heads of )fficers. under the General Manager meet as a carmittee with the General lanager. They discuss with him the status of their operations. These sessions also facilitate the sharing of information in the organization because any developments in Board meetings can easily be transmitted X) the officers.22
Planning and Monitoring: Corplan Staff Planning
Corplan's contribution to IM3A is very significant in that it has given direction to the corporation's efforts. Whereas before 1982 when a Corplan staff was not yet established, the Corplan sessions resulted in departmental plans, the Corplan staff produces an integrated plan.23This contains key result areas, or criteria by which their projects will be monitored. This achievanent is evidenced by the Corporate Plan 1982-1990.
In formulating goals, Corplan has adopted a systematic technique. Through a decision tree process, a set of al-ternatives is developed using as bases an assumed amount which it may receive as government infusion. Fran this flow another set of alternatives such as either strengthening an existing water district or forming a new one. Integrated in its system of formulating goals is their practice of scanning the environment ana its implications to IWJA's targets. 5
Monitoring
Corplan monitors LWUA's operations on a macro level, using as basis the reports of each operating service. It submits a quar-terly report to the General Manager and makes recommendations on problon areas.26
Mbnitoring by the Regulatory Services
Purpose of the Management Audit One of the irejor contributions of the Regulatory Services in
the attainment of LWOA's goals is its monitoring of Water District performance. The Regulatory Services performs managsnent audit of Water Districts in order to provide feedback on the "effective-ness and efficiency" of operations.27

- 29 -
Management audit is conducted for a number of specific reasons. In seme instances, such a move must be made to help solve a problem of that Water District, or it may be done as a preventive measure for these potential problems. These are usually financial in nature like decrease in revenue or a drop in "development points" manifested through the Development Indicators. Equally important are other factors like morale and the rate of decision-making. Through these field inspections, information frcrn financial and annual reports trananitted to LWUA are verified as to its reliability. In addition, conducting a yearly management audit of all Water Districts is an integral part of LWUA's operations as a regulatory agency. The following aspects are the focus of 'the yearly audit: "1) previous year's managerial performance; 2) compliance with Water District rules and regulations as well as institutional development guidelines and standards of IMJA; 3) feasibility of Water District's long range pi; and strategies; and 4) institutional development and financial status." Lastly, this audit program is done in accordance with loan agreements with foreign organizations like the Asian Development Bank in order to ascertain that the funds are being used as per the conditions upon whicl the two parties agreed.
The Managgnent Audit Team The audit is conducted by a team composed of representatives frcm
the Regulatory Services and a few fran the Financial Services. The group may take a week in accomplishing this task but the schedule may vary depending on the size of the district and the magnitude of work to be done. Institutional Development Indicators
The Institutional Development Indicators work as a guide for the growth of the District. Enumerating particular organizational operatioi conditions serves to focus the district's performance on the higher priority itans and achieve more in terms of positive results.
Phase I indicators pertain to new Water Districts while Phase II indicators are adopted 6 months before actual intensive reformation of the system. For each phase, a maximum 168 points can be attained. The rating system is divided into 4 stages representing the degree to which an indicator is being followed.
Phase I indicators are measured in the following manner. Regarding job description, a Water District should at least be able to formulate job description according to its organization chart as well as state the minimum qualification for each position. A more developed Water

- 30 -
District would be one where at least 90% of the staff meet the minimum qualifications and are carrying out their specific duties. Another indicator measures a Water District's capability to prepare a schedule for budget formulation and approval, and comply with this. Other measures include: 1) the number of customer accounts in arrears is not more than 10%; 2) the amount of bills paid in time is not less than 85% and 3) by the 10th working day of each month, the district manager should have received all financial statements and reports to be sufcmittec to IMJA.32
The succeeding statonents pertain to Phase II indicators. A Water District should have concrete basis for searching out and eliminating illegal connections through policies and programs and consequently implanent 'these. A Water District should have at least the basic tools and equipment needed to keep the systan in good operating condition and keep these maintained and closely controlled. Training in Water District can be measured through the training programs conducted and the incentive established and implemented. Another indicator is whether the water source complies with the "Philippine National Standard for Drinking Water." An indicator regarding records and data is the "accurate deter-mination and record of: 1) billing costs, 2) specific costs, 3) Meter maintenance costs, 4) production cost, 5) user consumption patterns, 6) water quality patterns, 7) personnel performance."-53
Budgeting The Budget and Cost Control Department (BCCD) has very strong ties
with Corplan because the Corplan staff starts the budgetary processes by identifying the goals for the year as well as projects based on the amount of funds available to the corporation. The BCCD, together with the other detpartments, abides with specific guidelines that Corplan has formulated. A variance analysis of each department's budget is prepared on a monthly basis. In this manner, the need for additional funds may be identified and a realginment of the budget can be arranged.3 First, the department concerned will have to write a rromo to the General Manager requesting for realignment and stating the reasons for such an appeal. Depending on the reasons presented and the availability of funds fran other departments, the General mnager approves or rejects the proposal.35 The BCCD should be credited with the significant achieve ment of exerting control over the budget, thereby assuring that the actua expenditures do not exceed the approved amount.

- 31 -
The Caimission on Audit (COA)
The Catttiission on Audit's policy of withdrawing resident auditors is implemented in agencies and corporations which have strong internal control systans. Thus, a pre-condition to the withdrawal of the auditor is COA's pre-evaluation and post-evaluation of the internal control systan (ICS) of the public enterprise.
In 1981, a team frcm COA assessed LWUA's internal control system. The team recormended seme improvotients in the organizational structure to eliminate overlapping of functions, strengthen check and balance and the accounting controls including the fixed asset and property and supplies management. Also mentioned in the evaluation report was the need for continuous updating of manuals.36 The General Manager assigned to the Management Office the responsibility of reviewing existing systems and formulating proposals with a view to implementing COA's recemmendatic
The Management Office (MO), later renamed as Management Services Office, reports regularly to top management, as well as COA, the progress of the implementation of the recommendations. The following are samples of the responses to CQA's reccnmendations:3 7
"The MO has started documenting, updating and improving the present office manual. Our initial study substan-tially covered the areas of collection, billing, dis-bursements and payroll procurement of fixed assets and materials and supplies systems, which were mentioned in your 1981 report. We expect to complete this by the end of the year. Starting 1983, we shall be going into systems studies of IKUA's operations to ccme up with operating manuals". "The overall systems for both fixed assets and materials and supplies were realigned, and appropriate assignment for segregation of responsibilities and functions between PMD and CAD were delineated to achieve the system's objectives including the integration of appropriate internal control".
In 1982 a second evaluation was undertaken by CQA, and a consider-able number of its recommendations were found already implemented. There were, of course, areas were continuing improverients were needed such as strengthening of accounting controls, proper documentation and ^ monitoring of consumption of supplies and fixed assets inventory taking.-
LWUA's response to the measures prepared by COA brought about a reorganization, a thorough system's review and the strenghtening of the Managenent Services Office. Computerization of systems was hastened. lb a large extent, the willingness of LWUA to make itself grow as a vibrant organization was a significant factor in the healthy relationship between itself and COA.

- 32 -
Management Services Office (MSO) Among the Management Services Office's first acccrnplisbments
was the Office Manual. This task required meticulous compilation of Board resolutions, office orders, memoranda and other office communication. Careful study of seme systems produced flowcharts. In 1982, when LWUA was reorganized, the nav MSO increased its activities and was active in the study and design of LWUA's systems as a basis for installing stronger control mechanisms. Accounting and financial systsns like the general accounting, billing and collections and fixed assets systans were installed but are still undergoing improvement. An MSO Briefing Manual was made by the department staff as guide in performing these activities. Also since 1982, the MSO has been performing the pre-audit function in view of the planned withdrawal of the resident auditor of the Commission on Audit. The responsibility for the dissemination of office orders and manuals is vested in this department.
*
The EDP division is also -under the Management Services Office. In 1982, MSO became active in the computerization program. A com-puterization of the data bank was initiated in 1982. A computerized billing and collections program was also started in the same year. Plans for the future include the computerization of the general accounting, payroll and fixed assets systems.
Monitoring and Information System
All departments submit monthly accomplishment reports to the Corplan staff and. to the Management Services Office. 1 Reports concerning Water District operations and financial aspects are important in the monitoring process and are fed into the data bank.
The LWUA Office Manual is a comprehensive compilation of policies on the following subjects: 1) for Engineering, those regarding fea-sibility studies, tendering, construction, and special projects; 2) for Regulatory, Water District Formation, Mini-loan administration, Mvisory Services, Water Rates Formulation and I-jonitoring, and water District Training and financial performance; 3) for Financial, loans operations, statistical research, budget formulation and cost control, accounting; and 4) for Administrative, general organization policies, personnel administration, office administration, and travel services. The Corporate Plan 1982-1990 is just as comprehensive and intensive, but a more unified than the Corporate Master Plan of 1980. Each year, a document entitled "Operating Budget" compiles all budgets of the departments in a single reference material. Human resources, aside from financial resources, are also budgeted.'2 Being the source document for the irrplamentation of policies, office orders are also vital in disseminating information because they can be speedily distributed.43 On the other hand, manuals take a longer time to compile. These office orders are ultimately integrated into the Office Manual.

- 33 -
These manuals and office orders serve as a vital component of a camiunication system to the more than 800 personnel of LWUA who must be properly informed about the developments in the organization. The General Manager : Chief Executive Officer and Policy-Maker
The General Manager undoubtedly exerts considerable influence in the corporation since he supervises directly two of the three units directly involved in monitoring corporate performance, namely : the Corplan Staff and the Managotient Services Office, and the most sensitive one in terms of cost control, the Project Procurorient Office.44 In addition, all purchase requests are coursed to him for approval, regardless of the amount. He prescribed the Action Weekly Journal through the Office Order Number 217-81, dated July 23, 1981, and the Travel Report.45 The Action Weekly Journal is similar to an accomplishment report to be submitted by Assistant General Managers and heads of offices. The Travel Report contains data obtained from field inspection trips. Under his watchful eye, no department would even dare perform below the high standards that UvUA is known for.
The General Manager has provided well for his personnel judging by the benefits available to the personnel. Facilities are well maintained which create a good working atmosphere. Seminars and scholarships are available to continuously upgrade the knowledge and skills of the personnel. His personal touch is reflected in the reading materials on rnanaganent which he distributes to the officers.
The leadership of the General Manager may be characterized as strong and fair. Steeped in the tradition of military discipline, he has in more ways than one, imparted the work ethic to a large number of personnel.
He uses quite effectively the information systan through the Action Weekly Journal and other methods of carmunication to disse-minate the policies of the organization. His accessibility to his officers contributes in no snail measure to his grasp of the issues and problems requiring immediate attention.
It is expected that the reorganization of 1984, while unsettling to some, will enhance IMJA's capacity to rufill its objectives. The future will undoubtedly be better for the corporation because of its ability to adapt to constraints and changes.

- 34 -
OPERATIONAL HIGHLIGHTS Measure of Performance
Management believes that the true measure of performance is in terms of the number of viable water districts formed. This is in line with their statement of corporate mission: "to pro-vide its dcmain with improved water service through the estab-lishment of independent, self-reliant and financially viable water districts" 6IMJA therefore exerts effort to be of service to far-flung places. Thus, the addition of even a single Fili-pino household to the growing population being benefited by the sources of water districts is their big concern.
Goals/Targets Prior to the Creation of Corplan
In 1980, prior to the creation of a Corporate Planning Unit, the managers prepared a Corporate Master Plan. This master plan is a consolidation of the goals and targets of the various operating departments. The following is a discussion of the specific plan of each department.
The Regulatory Services forms water districts and institu-tionalize then by extending advisory and other management/ technical services. It also formulates control measures and standards to improve the management and operation of local water systems. Executive Order No. 577, approved in early 1980 mandated the Regulatory Services to form Rural Water Associations in barangays of various municipalities with population of 20,000 or more as a prerequisite to the implementation of Rural Water Supply Projects of the President.
Table No. 1 shows the 4-year plans and programs of this Service. ^
TABLE NO. 1 4-YEAR PLANS AND PROGRAMS OF
THE REGULATORY SERVICE
1980 1981 1982 1983 Water Districts Formed 30 30 30 30 CCC To Water Districts 30 30 30 30 Barangay Water Associa-tion Formed 8,460 21,158 0 0
Poblacion Water Associa-tion Formed 0 0 204 408

- 35 -
As a technical arm of the Administration, the Engineering Services identifies project sites, prepares feasibility studies and detailed engineering designs and executes these projects.
The 1980s is considered a "water decade". This resulted in a shift frcm the capital intensive comprehensive projects which have capital cost of 30 million to less capital intensive, interim development program with a capital cost of j?5 million.
Lastly, the Loans and Programs Services is in charge of loan programming, analysis and review, arid loan operations. It undertakes research projects to prequalify contractors, conducts financial analysis of projects am processes loans.
Table NO. 2 presents tne four-year plans and programs of this Service.48
TABLE NO. 2 4-YEAR PLftNS AND PROGRAMS OF THE LOANS AND PROGRAMS SEWICE
I. LOAN PROGRAMMING . A. Research Projects B. Preparation of
Industry Average C. Preparation of
Capital Program D. Special Studies
II. LOAN ANALYSIS AND REVIEW A. Prequalifications B. Financial Analysis C. Operations Audit D. Loans Monitoring
III. LOAN OPERATIONS A. Project Preparation
Analysis and. Review 1. Preparation
1.1 Interim 1.2 Ccmprehensive
2. Review B. Loan Processing C. Loan Servicing
1980 iy8i TQft? ,1983
2 3 3 3 1 1 1 1 2 2 2 2 2 3 3 3
30 30 30 30 104 134 292 352 22 36 36 36 14 116 146 176
25 25 0 0 12 6 30 30 5 25 5 0 27 27 30 30 117 137 157 177

- 36 -
It will be noted that financial analysis, loans monitoring, and loan servicing are projected to increase substantially during the years 1980, 1981, 1982 and 1983.
In the case ot Capital Outlays, it is assumed that there will be a gradual decrease in requirements tor miscellaneous capital acquisition over the years. These requirements include building maintenance expense and other additional office equipment.
The forecasted decrease in the equity contribution of the National Government and a low working capital drastically affected the execution of several projects and meeting the obligations of ^ the Administration. These projects are presented in Table No. 3.
TABLE NO. 3 SHORTFALL DISTRIBUTION
(F000)
Building Construction RWS Projects Mini-Loan Projects Debt-Service Operating Expenses
1980 30,000 12,835 3,000 253
1981
5,000 5,282 14,454
1982
8,000 34,020 18,151
1983
12,000 45,150 9,y93
Lastly, the collection efficiency was computed frcm a low 58% up to 62% of accrued interest receivable net ot capitalized interest. Table No. 4 shows the rorecasted efficiency.
TABLE NO. 4 COLLECTION EFFICIENCY
1980 19bl 1982 1983 Accrued Interest Recei-vable 32,543 43,182 52,997 60,339
Actual/Projected Col- 49,810 lections 19,851 25,909 30,738 49,810 % Collection Efficiency 61 60 58 8*.5

- 37 -
Although the Corporate Master Plan is an extensive presentation of LWUA's goals and targets, it has one basic shortcoming. As stated by a reliable informant, managenent did not present an over-all Corporate goal, to which the targets of the different Services would be aligned. Secondly, the different Services did not coor-dinate with each other before formulating their own targets. This methodological deficiency could have been caused by the absence of a unit which could facilitate the planning activities of each department. Realizing the need for coordination, LWUA created the Corporate Planning Unit in 1982.
Corplan In 1982, the Corporate Planning Unit prepared a Corplan Manual.
Although a reliable respondent admitted that the manual was made hastily, it nevertheless discusses the accomplishments of LWUA in 1981 and the corporation's plans and targets for the coning years. Moreover, the present state of affairs was assessed.
In line with LWUA's corporate objectives, the Corplan presented the goals of the corporation based on assumptions of a set of acti-vities. These are activities which would be maintained, accelerated, or decelarated. Table No. 5 presents the broad objectives of LWUA.
TABLE NO. 5 BROAD ACTIVITIES
ACTIVITIES MAINTAIN PRtSENT PACE A(XRT,F.KATR 1 . Projects completed
yearly 30 - 40 60 - 80 2. Completion of 1st-
round improvenent for -all areas 18 yrs. after 10 yrs.
3. Resource Requirement - yearly capital investment F100-200M F200-300M
-- manpower - manpower is 650 at present producti-vity
- .peak level is 700-800 at increased producti-vity
- facilities - present - little addition
However, the choice of maintaining the present pace or accelera-ting it are open to constraints. Both o£ these alternatives should consider: (1) the viability of snail water districts; (2) receptive-ness of local officials; (3) complacency and lack of sense of urgency

- 38 -
of the staff; and, (4) optimizing productivity of staff. The difference lies in the fact that the latter alternative's constraints may occur in greater degree. But further analysis and evaluation of these alternatives showed that the first al-ternative does not keep pace with the national goal of accele-rating socio-econcmic growth in provinces while the second one keeps pace with the government priority on economic programs for the provinces. 52
Finally, the Corporate Planning Unit also prepared with a Project Implementation Plan for the years 1982 to 1990. How-ever, for purposes of this study, only the plans for the years 1982 to 1983 are presented in Table No. 6.
TABLE NO. 6 PROJECT IMPLEMENTATION PLAN
ACTIVITY 1982 1983 Water District Formation 64 80 Feasibility Studies 61 60 Design 52 68 Construction 19 60 Interim Improvement 4 4 Early Action Works 44 44 Pre-feasibility Studies 110 78
With regard to iWUA's financial plans, Corplan submitted an investment plan and projected cash flow. The former includes project funds for formed-up projects and the remaining water districts. These funds refer to the total loans ccmmitted by IWUA to the water districts. On the other hand, a cash flow statement determines the basis for corporate strategy formulation. Table No. 7 shows the projected cash flow for 1982 and 1983 only.
TABLE NO. 7 CASH FLCW
: 1982 : 1983 Ending Cash Balance (M) : P27 i P13 Collection Efficiency 85% : 85% LWUA Debt-Service Coverage : 2.35 : 1.50

- 39 -
In view of the uncertainties regarding the financial resources anticipated for 1983, the Corplan came up with a Corporate Plan for the years 1983 and 1984. For this study, only the Corporate Plan for 1983 will be presented.
Inasmuch as there were constraints in the resources, management decided to focus its concern on the short-term plan which were limited to two to three years. In addition, the corporate objectives were prioritized depending on the amount available. In this connec-tion, the corporation's priorities were identified as: (1) liquidity; and, (2) implementation of projects on the basis of available equity.
To realize the corporate objectives, Corplan developed three strategies, namely: (1) all activities will be implemented according to priority; (2) no promotion, no hiring; and (.3) cutting costs to minimum.
With regard to target-setting, Corplan developed four scenarios. Scenario A assumes that there will be no equity infusion and the payment of foreign loan obligations of ?50 million will be made. Scenario B, on the other hand, assumes an equity infusion of ?30 million and that the corporation will not be forced to pay foreign obligations. Scenario C assumes an equity infusion of J*60 million and the payment of 58 million foreign obligations. Finally, Scenario D assumes that the equity infusion will be ?80 million and the J?58 million obligation on foreign loans will be paid.
Table No. 8 presents the targets for 1983 based on the four different scenarios.
TABLE NO. 8
A.
B.
Water District Inst'l Dev't 1. Pre-Feasibility Studies 2. Water District Formation 3. CPS Installation 4. PR Assistance 5. Mini Loans 6. Advisory Services WD Facilities Improvement 1. Feasibility Studies
TARGETS FOR 1983 Scenario A Scenario B Scenario C Scenario D
50 30 60
100 20
50 50 none 30 30 30 60 60 60 100 100 100 20 20 20
—intensified-
C.
a. New none 5 0 57 b. On-going none 52 50 52 2. Design a. New none 25(Cebu) 25 25 b. On-going none 48 48 48
3. Construction a. New 8 19 19 19 b. On-going 63 63 63 63 4. Well-drilling a. New none 38 38 38 b. On-going none 25 25 25
Financial Viability 1. Collection £>50M ?50M . ?50M F50M 2. 1983 Ending Balance 0 0 0 ?11M 3. Payment of foreign oblig, 0 0 ?58M ?58M
a. b.
New - to be started '83 On-going - as of Dec. 82

- 40 -
Major Accomplishments Before discussing the corporation's major accomplishments,
the development cycle being followed will be discussed briefly. The first phase of the development cycle is the conduct of
the pre-feasibility study prior to the formation of a water district. The results of the pre-feasibility studies serve as a starting point for a more detailed and extensive studies called the feasibility study. This is undertaken to determine the amount of capital needed to finance the project, the size of the project to be constructed, and to ascertain how the project may be carried out with at the least possible cost.
The next phase involves the designing of the project. This does not merely involve plotting a pipeline frcm. a specific source to the distribution system but assures that the design will be efficient, practical, and economical. The third phase before the actual construction of the project is the project presentation. This involves consultation with the people regarding the over-all implication of the project. This is done by gathering cross-sectional representatives from the locality. LWUA officers present the complexities and financial requirements of the project. When the representatives of the locality agree on the project proposal including the monetary requirements, the contractors are pre-qualifiod. A bidding is held to choose the contractors who will build the facilities. Competent engineers see to it that the materials and execution of the engineering plans conform with the specified standards set by IMJA.
Prior to the loan availment, LWUA sets requirements to establish the water districts, one of Which is the adoption of a uniform accounting system patterned after the Commercial Practice System. A Conditional Certificate of Conformance is granted to water districts which signify compliance with to minimum requirenents set by the corporation. After which, assistance in the form of technical, financial, and managerial is given to a water district. Even after the construction of the water districts, the people are still consulted if and when the water districts decide to adjust its present water rate to meet its operation and maintenance costs. Such adjustment should not exceed 60% of the previous rate and is passed to LWUA for approval.

- 41 -
The major accomplishments of the corporation will be discussed by comparing the targets against the actual performance. Note that there are sane changes in the goals ot the corporation in sane years due to the reassessment anu re-evaluation made by the Corplan. This is especially true in iy81 and 198J.
Table No. 9 presents the accomplishments of the corporation vis-a-vis its goals for the years 1980 to 1983.
Table No. 9 indicates that the corporation was able to form more than the targeted number of water districts for the years 1980 to 1982. However, in 1983, uncertainties regarding the equity contribution fran the National Government and the over-all econanic condition of the country made it difficult for the corporation to meet its target.
A closer look at Table No. 9 shows that the corporation's performance in 1980 was above par. It is possible that the manage-ment had an optimistic estimate of the number of viable water dis-tricts to be formed during that year. Furthermore, there was no Corporate Planning Unit which could have defined the guidelines for target-setting. Nevertheless, the corporation was able to meet 150% of the target in 1980. Based on this performance, the targets for 1981 was re-evaluated and increased to 40 water districts to be formed. Of this target, the corporation was able to meet 107.50%. In 1982, a Corporate Planning Unit was organized. The Corplan re-evaluated the performance for the past years, analyzed the present scenario and made new goals and targets. During this year, LWUA attained 101.56% of the targeted number of water districts. However, the economic crisis in 1983 prompted the Corplan staff to review and reduce the target for 1983 to only 30 water districts principally because of limited funds.
Another activity of the corporation is the early action work program. This is an immediate rehabilitation which a water district usually undertakes upon its operation. This involves primarily the examination of the quality and quantity of existing water supply to determine and insure the potability and adequacy of the resource. Table No. 9 indicates an improving trend within the four-year period for the early action work on the water districts. This is primarily due to the increase in the number of water districts formed.
The various phases of the operations of the corporation include: (1) pre-feasibility study; (2) feasibility study; (3) design; and, (4) construction. Of these phases, the pre-feasibility study is the

- 42 -
least complex activity because it serves as a starting point for a more thorough study. This explains why the corporation was able to conduct pre-feasibility studies more than the number targeted for the years 198u to 198j.
The complexities of preparing feasibility studies, design and construction works contributed to rather low accomplishments in com-parison to the targets. However, in 1982, LWUA met the targeted number of construction projects.
The total amount of - funds which was expected frcm the National Government and foreign loans did not materialize. On the other hand, the projected accomplishments were optimistically based on the amounts which were tnought to be forthcoming. Consequently, seme targets were not met.
Regarding the loans granted and availed to the water districts, the trend was below target for 1981 and 1982. The main reason for this is the shortfall of the equity infusion of the National Government.
The shortfall in the collection efrorts or the corporation in 1980 was due to the inability of six projects to meet the 10% equity contribution due them in lieu of the interest. It was in 1981 when there was an increased collection effort on the part ot management which resulted in the efficiency of 87% which was above its target and acceptable norm of 85%. However, in 1982 and 1983, the collection efficiency was below the target and the efficiency attained in 1981. There were several causes for the shortfall. The first reason was the difficulty in collecting frcm the water districts specifically from smaller cities and municipalities. In addition, LWUA granted risk loans to the water districts. These loans were expected to be paid when these water districts were able to pay. The second reason for a low collection efficiency was the fact that increase in rates was resisted by water districts. Finally, some water districts had not been fully developed to make then financially viable. Consequently, collecting amortizations became difficult.
The billings are based on the amount of loan availments to the water districts. Since the loan availments that year were relatively small, billings were correspondingly low.

1930 1980 1930 GOALS ACCOM- VARIANCE
PLISH- (%) MEITES
PHYSICAL WD Formation, No. 30 45 150.00%
B. Wo. of WDs given GOC 30 30 100.00% C. WD Formation in Municipa-
lities without existing Water System (No. of Muni-cipalities) — 6
D. No. of RWfts Organized/ Registered Level I Level II Level III
E. WD under Early Action Program On-going/Undertaketi — 47 Completed 36 15 41.67%
F. Pre-feasibility Study G. Feasibility Stud/
On-going/Undertaken — 35 Completed 57
H. Design Works On-going/Undertaken — 24 Completed 28 9 32.14%
I. Construction On-going/Undertaken — 19 Cccnpleted Q
J. Well-Drilling On-going/Undertaken — 14 Completed 33 n 33.33%
TABLE MO. 9 MAJOR AtXaXPLISHTENTS
1981 1981 1981 1982 1982 1982 GGAIS ACCOM- VARIANCE GQAI£ ACCOM- VARIANCE PLISH- (%) PLISH- (%) MENTS MENTS
(%)
40 43 107.50% 64 65 101.56% 36 14. 51 115.91%
— — — — —
3,169 860 — 66 — — 165 —
— 5 —
36 44 42 42 100.00% 44 48 109.09% 75 92 122.67%. 110 146 132.73% 52 88 169.23% 63 38 40.86% 74 50 67.57% 61 28 45.90% 57 27 47.37% 8 __ __ 57 31 54.39% 52 32 61.54% 24 43 179.17% 75 __ 39 20 51.28% 19 19 100.00% 24 27 112.50% 59 35 59.32% 57 43 75.44% 46 32 65.31%

: NO. 9 MPLISHMENTS
1983 A 1983 A 1983 A GOALS ACCOM- VARIANCE
PLISH- , (%) MENTS
1983 B GOALS
1983 B ACCOM-PLISH-MENTS
1983 B VARIANCE
(%) -
1983 C 1983 C GOALS ACCOM-
PLISH-MENTS
1983 C VARIANCE
(%)
1983 D GOALS
1983 D ACCOM-PLISH-MENTS
1983 D VARIANCE
{%)
30 14 46.67% 30 14 46.67% 30 14 46.67% 30 14 46.67%
30 50
63 8
41 44
26
23
31
57
136.67% 88.00%
387.50%
30 50
52 5
48 25
63 19
25 38
41 44
26
23
31
136.67% 88.00%
520.00%
163.16%
30 50
50 0
48 25
63 19
25 38
41 44
26
23
31
57
136.67% 88.00%
92.00%
163.16%
30 0
52 57
48 25
63 1?
25 38
41 44
26
23
31
136.67%
45.61%
92.00%
163.16%

1980 GQ&LS
K. Pre-Feasibility Studies of Sewerage and Sanitation Systems On-going/Undcrtaken — 3 Completed — 3
L. Water Resarrces Evaluation M. Geophysical Surveys under-
taken for Water Districts M. Well Keliabi lifcation Projects — . —
I. H-JSTITUriCMAL DEVEXDH-EOT A. Advisory Services, WDs 115 B. Performance Audit, WDs C. Management Audit, WDs D. CPS Installation
CPS I CPS II CPS Follow-up
II. FINANCIAL (in millions) A. Capitalisation
1. Govt. Subscription 2. Availraents from Foreign Loans — Loans Granted to water Districts — B.
C. D.
Loan Avaii rents to WDs Collections 1. Interest 2. Principal
E. Collection Efficiency 1. Interest 2. Principal 3. Interest and Principal
F. Billings 1. Gross Interest 2. Capitalized Interest 3. Net Interest 4. Principal Billings
339
22.9
61 i
1980 1 980 A00CM- VARIANCE PLISII- {%>
32 19
37 11
27.83%
115 116 168 154.29 45.51%
3.97 88.22%
70% 76% 124.59%
40.69 22.37
5.28
1981 GOALS
1981 ACCOM-PLISH-MENTS
1981 VARIANCE
(%) 1982 1982 15 GOALS ACCOM- VARI
PLISH- : (% M E M S
— — — — —
— — — — —
— 8 — — 10 -
25 m~mm __ — 2 — — -
170 43 107.50% 202 212 104.<i5% — . — — 48 85 177.XX %
37 70 55 78.57% 88 15
40 —
120 145 120.83% 100 70 70. D 0% 172 163.1 94.82% 28.7 8.37 29.%% 256 131.6 51.41% 278 165 59.35 % 328 198.6- 60.55% 361 148.19 41 ,0&% 27 30.3 112.22% ^ 50 44.4 88.gi>% 5.8 3.3 56.90% 3.4 4.6 135.21%
88% _ ___ 79% — 75% — 67% 80% 87% 108.75% 85% 78% 91.%%
61.12 63.8 104.38% 86 74.1 27.50 28.1 102.18% 27 18.1 67.0s* % 33.70 35.1 104.15% 59 56 94.93% 7.2 4.4 61.11% 4.3 6.8 158.14

1983 A 1983 A GOALS ACCOM-
PLISH-MENTS
1983 A VARIANCE
(%)
1983 B GOALS
1983 B ACCOM-PLISH-MENTS
1983 B VARIANCE
<%)
8
60
241
31
24 13 31
60
241
31
24 13 31
0 0
50
85%
48 20.29 11.7 189.50
50.17 5.94
82% 72% 81%
87.44 18.74 60.91 8.21
30 0
50
95.29% 85%
48 160.00% 20.29 11.7 189.50
50.17 5.94
82% 72% 81%
87.44 18.74 60.91 8.21
95.29%
1983 C 1983 C 1983 C 1983 D 1983 D 1983 D GOALS ACCOM- VARIANCE GOALS ACCOM- VARIANCE
PLISH- (%) PUSH- (%> H5MTS I-IENTS
241
31
60 24 13 31
60 0
50
48 20.29 11.7
189.50
50.17 5.94
80.00%
85%
82% 72% 81%
87.44 18.74 60.91 8.21
95.29%
241
31
60 24 13 31
80 0
48 20.29 11.7
189.50
60.0(f
50 50.17 5.94
85%
82% 72% 81% 95.
87.44 18.74 60.91 8.21

- 45 -
Table No. 10
Financial Highlights 1980 - 1983
(amount in millions)
1980 1981 1982 1983 Resources p 829.4 P1,072.3 P1,275.0 P1,525.2 Gross Revenue 49.8 63.9 78.5 97.3 Operating Expenses 20.5 37.1 44.1 44.8 •Other Incane/Charges ( 14.1 ) ( 20.6) ( 21.6) ( 30.8) Net Income before Tax 15.2 6.2 12.8 21.7 Net Income after Tax 8.9 1.4 5.8 11,7 Current Assets 101.2 105.5 97.6 151.8 Current Liabilities 39.4 72.0 76.4 122.3 Total Liabilities 353.7 471.1 652.0 1,179.5 Total Equity 475.7 601.3 623.0 345.7
Financial Review-
Results of Operations
P?Q i n C ™ L i n 1983 crated to P52.5 million, frcm ifl*9R5 ^ " V 9 8 0 ' P26;8 m i l l i o n i n 1981, and P34.4 million rVrll' J ? n e t incc?e' however, after deducting other inccme/ charges and provision for inaxie tax amounted to P11.7 million in 1983 fran P8.9 million in 1980, P1.4 million in 198 , S million in 1982. '
Gross revenue rose from P49.8 million in 1980, P63 9 mil-li™in 1981, and P78.5 million in 1982 to P97.3 iillicn in 1983. teting Lnconie - interest and interest on Treasury Notes/Bills remained the most important items of revenue. Intereston Savings Deposits, however, rose substantially in 1983, except Service Income - Miscellaneous. p
_ T o t a l operating expenses expanded to P44.8 million in 1983 iron P20.5 million in 1980, P37.1 million in 1981, and P44.1 mil-lion m 1982. Personal Services rose to P16.9 million in 1983

- 46 -
fran PI0.5 million in 19-30, P15.4 million in 1981, and P15.9 mil-lion in 1982.
Financial Condition Total resources amounted to P1,525.2 million in 1933, from
P829.4 million in 1980, P1,072.3 million in 1981, and P1,275.0 million in 1982. Long-term receivables continued to account for the highest percentage of total resources of LWUA fran 71.15% in 1980, 74.33% in 1981, 76.31% in 1982 to 69.53% in 1983.
Total liabilities rose to PI,179.5 million, from P353.7 mil-lion in 1980, P471.1 million in 1981, and P652.0 million in 1982. Liabilities include Payables, Miscellaneous Trust Liabilities, Accrued Interest Payables, National Government Agencies—BIR, long-term liabilities, and Miscellaneous Payable.
Total equity decreased to P345.7 million in 1983, fran P475.7 million in 1980, P601.3 million in 1981, and P623.0 mil-lice in 1982. The decrease was due to the foreign currency va-luation difference in the amount of P4.6 million in 1980, P24.1 million in 1981, P75.8 million in 1982, and to P417.9 million in 1983.
Tools Used To Measure Hie Over-All Perfoip^p^ of r.wna Financial ratios and percentages, Cannon Size Analysis,
Index Analysis of Financial Statements, and Budget Variance Ana-lysis were the tools used in the study and analysis of the per-formance of LWUA frcm 1980 to 1983. To supplement these tools used to measure the over-all performance of LWUA, monitoring indicators, as set by the World Ban]' and the variance analysis of pro-forma income statement against the actual were likewise uti-lized.
Financial Ratios arid Percentages Tests of profitability and tests of liquidity were used in
analyzing the financial performance of LWUA frcm 1980 to 1983. Profit Ratio after Tax, Profit Ratio before Tax, and Return on Stockholders' Investment were computed to determine the profita-bility of LWUA. Liquidity of LT/ZUA was determined by canputing the Current Ratio, Acid-Test Ratio, Average Collection Period, Receivable to Income, equity Patio, and Debt-to-Net Worth Ratio. Results of Operations
Profit Ratio after Tax Table No. 11 shows' the Profit Patio after Tax of LWUA from
1900 to 1983.

- 47 -
Table No. 11 Profit Ratio after fax
1980 - 1983
Calendar Year Net Income Gross Income Profitability After Tax Rati0 (%)
1980 P 8,946,665.00 P49,757,287.00 17 98% 1981 1,409,155.00 63,898,840.00 2.20% 1982 5,792,832.00 78,464,439.78 7.38% 1983 11,716,702.01 37,303,795.80 12.04%
Analysis of the figures in Table No. 11 indicates the profitability of the operations of LWUA frcm 1980 to 1983. The corporation has operated profitably during the period considering
17'98% 1980' 2'20% i n 1981' 7-38% in 1982, and finally 12.04% in 1983. The Profit Ratio before Tax, however was very much higher in terms of profitability as shown in Table No. 12, hereunder:
Table No. 12 Profit Ratio before Tax
1980 - 1983 ~~ Calendar Year Net Inccrne Gross Inccme Profitability
Before Tax Rati0 (%) 1980 P15,143,838.00 P49,757,287.00 30.^4% 1981 6,189,331.00 63,393,840.00 9 69% 1982 12,787,634.12 78,464,439.78 16 30% 1983 21,719,233.86 97,303,795.80 22.32%
Return on Stockholders' Investment
Table No. 13 shows the return on Stockholders' investment using net income after tax figures in relation to average stock-holders equity frcm 1980 to 1983.
Table No. 13 Return on Stockholders' Investment
1980 - 1983 Calendar Year Net Inccrae Average Stock- Ratio (%)
After Tax holders' Equity J9S0 P 8,946,665.00 P511,425,267.50 1.75% 981 1,409,155.00 511,425,267.50 0.28% 982 5,792,832.94 511,425,267.50 1.13%
1983 11,716,702.01 511,425,267.50 2.29%

- 48 -
The return on stockholders' equity of LWUA rose from 1.75% in 1980, 0.28% in 1981, and 1.13% in 19S2 to 2.29% in 1983. The highest return of the funds and relationship of net income after tax to the average stockholders' equity vzas in 1983. Table No. 14 shows the return on stockholders' investment using net incane before tax against average stockholders' figures as the basis in arriving at the ratio fran 1980 to 1983.
Table No. 14 Return on Stockholders' Tnvg tmant ' : : 1980 - 1983
Calendar Year Net Income Average Stock- Ratio (%) Before Tax holders' Equity
1980 PI 5,143,838.00 511,425,267.50 2.96% 1981 6,189,331.00 511,425,267.50 1.21% 1982 12,787,634.12 511,425,267.50 2.50% 1983 21,719,233.86 511,425,267.50 4.25%
The above table indicates an increase in return on stockhol-ders' equity from 2.96% in 1980, 1.21% in 1981, 2.50% in 1982 to 4.25% in 1983. The increase was an indication of a favorable return on stockholders' investment which was brought by the steady increase of the net earnings of LWUA from 1930 to 1983. Financial Condition Current Ratio
Table No. 15 shows the current ratio from 1980 to 1933 of LWUA. Although the ratio decreased fran 2.57:1 in 1980, 1.46:1 in 1981, 1.28:1 in 1932 to 1.24:1, the corporation was still liquid.
Table No. 15 Current Ratio 1930 - 1983
(in millions) Calendar Year Current Assets Current Liabilities Liquidity (%]
1980 P101.2 39.4 2.57:1 1981 105.5 72.0 1.46:1 1982 97.5 76.4 1.28:1 1983 151.6 122.3 1 .24:1

- 49 -
Table No. 15 indicates that the corporation is still liquid arid can pay its obligation, should its liabilities as shown above be paid. The remaining balance will still be ,24 worth of as-sets.
Acid-Test Ratio
As shown in Table No, 16 hereunder, the LV7UA quick assets such as Cash, Receivables, and short terra investments in relation to current liabilities indicates liquidity of the corporation fran 1980 to 1983. The acid-test ratio decreased from 2.51:1 in 1980, 1.28:1, 1.17:1 in 1982 to 1.07:1 in 1983. However, should payments of current liabilities be immediately made at yearend 1983, the corporation will still have remaining assets balance of .07.
Table No. 1 6 Acid-Test Ratio 1980 - 1983
(in millions) Calendar Year Quick Assets Current Liabilities Ratio (%)
1980 P 38.9 P 39.4 2.51:1 1981 92.5 72.0 1.28:1 1982 89.6 76.4 1.17:1 1983 130.9 122.3 1.07:1
Average Collection Period Table No. 17 'shows an average collection period of 59 days
in 1980, 90 days in 1981, 104 days in 19G2, and 132 days in 1983. Table No. 17
Average Collection Period 1980 - 1983
Calendar Year Gross Incane No. of Work- Average Daily ing Days Income
1980 P49,757,287.00 250 P199,029.15 1981 63,298,840.00 250 255,595.36 1982 78,464,439.78 250 313,857.76 1983 57,303,795.80 250 389,215.18

- 50 -
Accounts Re-ceivables
Average Daily Inccrne
Days
1980 1981 1982 1983
P11,765,415.00 199,029.15 23,103,991.00 255,595.36 32,560,220.19 313,857.76 51,236,340.06 389,215.18
59 90 104 132
As shown in Table No. 17, the average collection period of LWUA gradually increased from 59 days in 1980 to 132 days in 1983. These figures can be related to the credit terms being offered by the corporation. It shews the days income on the bocks in relation to the accounts receivable which can Tse used in any credit policy or changes in collection of receivables.
Receivable to Income
Table No. 18 shows another way of expressing the same rela-tionship as expressed by the average collection period of LWUA from 1980 to 1983.
Calendar Year Accounts Receivable Gross Inccme Ratio (%)
In the same manner with the average collection period, the receivable to income gradually increased from 23.64% in 1980 to 52.66% in 1983. Equity Ratio
Table No. 19 shows the equity ratio from 1980 to 1983 of LWUA. The table indicates the proportion of total investment that is derived frcm stockholders (either directly, or indirect-ly as retained earnings).
Table No. 18 Receivable to Incane
1980 - 1983
1980 1981 1982 1983
P11,765,415.00 P49,757,287.00 23.64% 23,103,991.00 63,898,840.00 36.16% 32,560,220.19 78,464,439.78 41.50% 51,236,340.06 97,303,795.80 52.66%

- 51 -
Table Mo. 19
Equity Ratio 1980 - 1983
Calendar Year Capital Capital plus Non- Ratio (%) Current Liabilities
1980 P475,665,356.00 P 790,034,370.00 60.21% 1981 601,309,407.00 1,000,273,450.00 60.11% 1982 623,023,637.56 1,195,316,087.56 52.12% 1983 345,703,432.62 1,398,584,599.36 24.72%
The equity ratio decreased frcm 60.21% in 1980 to 24.72% in 1983. This reduction was brought about by the abrupt adverse ef-fect of the Foreign Currency Valuation difference of P417.9 mil-lien in 1983, fran P4.8 million in 1980, P24.1 million in 1981 and P75.3 million in 1982. While there was an apparent reduction in Equity during the four-year period, there was also a corres-ponding additions/increase in Foreign Loans Payable to P1,019.2 million in 1983 fran P280.1 million in 1980, P365.7 million in 1981 and P537.5 million in 1982.
Debt-to-Net Worth Ratio Table No. 20 shews the relationship of total debt of LWUA
in relation to Net Worth from 1980 to 1983. The debt-to-net worth ratio rose to 3.41:1 in 1983, frcm .74:1 in 1980, .78:1 in 1981 and 1.05:1 in 1982.
• Table No. 20 Debt-to-Net Worth Ratio
1980 - 1983 Calendar Year Total Debt Net Worth Ratio (%)
1980 P 353,723,979.00 P475,665,356.00 0.74:1 1981 470,983,394.00 601,309,407.00 0.78:1 1982 651,986,521.46 623,023,637.56 1.05:1 1983 1,179,514,673.56 345,703,432.62 3.41:1
The increase of the debt-to-net worth ratio was due to the increase in total debt and decrease in net worth. As stated earlier in previous analysis, foreign currency difference in valuation abruptly increased in 1983 to P417.9 million from P4.8 million in 1980. Loans Payable—Foreign, however, correspond-ingly increased from P280.1 million to PI,019.2 million in 1983.

- 52 -
Cantcn Size Analysis
Hie ccranen size- analysis • of the Income Statement is shown hereunder, as follows: Results of Operation
Table Noi 21 presents the percentages of the different components of- the gross revenue to its total.
Table No. 21 Qsaenan Size Analysis of Gross Revenue
1980 - 1983
1980 1981 1982 1983
Operating Revenae-int esfe r 83.62% 90.02% 92.45% 93.76% Interest oa:Treasury Bilis^ 14.99% 9.06% 5.55% 2.89% Interest orSavons-Deposit:-; 1.18% 0.62% 1.34% 3.33% Service InGGroe-MisGeilaneous- 6.21% 0.30% 0.36% 0.02%
The figures in Table No. 21 indicate that a large percen-tage of the corporation's total gross revenue resulted from the interest income—operating. This was followed by the interest on treasury bills, interest on savings deposits, and service income-miscellaneous, in that order.
As to the corporation's expenses, Table No. 22 presents the various components of the expenses as a percentage of the gross revenue.
Table No. 22 Common Size Analysis of Expenses
1980 - 1983 1980 1981 1982 1983
Personal Services 21 .11% 24, .03% 20. 30% 17 .34% Fringe Benefits 4 .46% 13 .66% 15. 47% 11 .64% Travel 7 .03% 7 .27% f D. 76% 3 .10% Supplies 0 .53% 0 .92% 0. 63% 0 .57% Gasoline and Oil 0 .10% 0 .16% 0. 11% 0 .08% Repairs and Maintenance 0 .18% 0 .57% 0. 52% 0 .48% Other Operating Expenses 7 .75% 11 .40% 12. ,43% 12 .84% TOTAL OPERATING EXPENSES 41 .16% 58 .01% 56. ,22% 46 .04%

- 53 -
The figures in Table No. 22 show that the total operating expenses of the corporation were, on the average, 50% of the total gross revenue. A look at these figures show that the total operating expenses exclude interest expense on foreign loans, witholding tax on interest revenue, provision for bad debts and extraordinary losses, among others. Further analysis of these figures show that a large percentage of the gross reve-nue goes to the personal services.
Adding/extracting the other income/expenses of the corpora-tion would result to the net income before and after tax, as presented in Table No. 23.
Table No. 23
Common Size Analysis of Net Income 1980 - 1983
1980 1981 1982 1983
Net Incone before tax 30.43% 9.68% 16.30% 22.82% Net Income after tax 17.98% 2.20% 7.39% 12.04%
Net income decreased in 1981 due to the tremendous increase in the operating expenses. But in 1982, the net incane started to increase. Despite the increase, net inccme after tax, as of 1983, was still a small percentage of the total gross revenue. The slight improvement in the net incane in 1982 and 1983 resulted frcm the combined efforts of the different control units in improving the whole LVJUA system.
Financial Condition Regarding the common size analysis of the balance sheet for
the years 1980 to 1983, Table No. 24 presents the percentage of the different components of the assets to its total.
Table No. 24 Common Size Analysis of Assets
1980 - 1983 1980 1981 1982 1983
Cash 3.34% 4.00% 2.26% 4.86% Disbursing Officer 0.01% 0.01% 0.02% 0.00% Other Officers 0.23% 0.20% 0.15% 0.14% Short-term Investments 7.20% 3.45% 2.63% 1 .57% Receivables-Trades/
Business 1 .27% 1.23% 1.75% 2.24%

- 54 -
Table No. 24 (contT) Ctorrmon Size Analysis of Assets
1980 - 1983 ^
1980 1981 1982 1983 Materials and Supplies
Inventory Prepayments Deposits on Letters of
0.00% 0.03% 0.03% 0.02% 0.00% 0.00% 0.00%
Credit Miscellaneous Receivables CURRENT ASSETS Special Fund Long-term Receivables Permanent Investment Fixed Assets (Net) Deferred Charges and
0.15% 0.92% 0.81% 1.11% 12.20% 9.84% 7.66% 9.95% 1-56% 0.95% 1.48% 1.02% 71.15% 74.38% 76.31% 69.53% 0.02% 0.01% 0.01% 0.01% 4.80% 5.27% 5.83% 4.53%
0.04%
Other Assets 10.27% 9.54% 8.70% 12.07%
Analysis of the figures in Table No. 24 shows that a large portion of the assets of the corporation comprises the long-term receivables. These include loans receivables frcm the water districts, receivables fran officers and employees, ard un-billed loans and account receivables fran the water districts. The loans receivables frcm the water districts are the 9% inte-rest on the loans extended to the water districts. These loans have a fifty-year repayment period. The next highest component of the total assets is the current assets. One of the components of the current assets, the advances to the water districts were classified under the other assets in 1980 and 1981, but were classified under the current assets in the succeeding years. The next highest component of the total assets is the deferred char-ges. This was followed by the fixed assets. The fixed assets account includes the new LWUA office building and training cen-ter, located in Balara, Quezon City.
The camion size analysis of the total liabilities is shown in Table No. 25.
Table No. 25 Corrtnon Size_Analysis of Liabilities
1980 - 1983
1980 1981 1982 1983 Payables Miscellaneous Trust
Liabilities 2.05% 2.43% 1.91% 1.04%
0.08% 0.23% 0.28% 2.43%

- 55 -
Table No. 25 (oont.) Camion Size Analysis of T.igli-ii-it-ipg
I 980 - 1983 . Creditors Unclaimed Balance 0. 49% 1, ,00% 1. .33% 1. .91% National Government Agencies 2. 12% 2. .10% 2. .38% 2. ,52% Miscellaneous Payable 0. 00% 0. ,96% 0, .09% 0. ,12% CURRENT LIABILITIES 4. 74% 6, .72% 5. .99% 8. ,02% Liability for Special Fund 3. 86% 2, .89% 2. ,56% 2. .04% Long-term Liabilities 34. 04% 34, .31% 42. .33% 66. .97% Deferred Credits/Inocsne 0. .26% 0. .30% TOTAL LIABILITIES 42. 64% 43. .92% 51. .14% 77. .33%
The figures in Table No. 25 shews that among the liabilities of the corporation, long-term liabilities account is the largest component. This figure is expressed as a percentage of the total assets. Comprising this account are loans frcm foreign and local sources. A closer look at this account shews that a substantial proportion of the long-term liabilities are those from the fo-reign sources. Included in these sources are USAID, DANIDA, AID and IBRD, among others. This is followed by the current liabili-ties account and the liability for special funds, respectively.
Table No. 26 shows the percentage of Equity to the total assets.
Table No. 26
Coniron Size Analysis of Equity 1980 - 1933
1980 1981 1932 1933
Capital Stock Paid Up 51 * 75% 53.55% 50.53% 45.39% Contingent Surplus 0.04% 0.03% 0.02% 0.02% Retained Earnings 4.40% 3.39% 3.13% 3.38% Donated Surplus 1 .74% 1.35% 1.13% 1.28% Foreign Currency Valuation
Difference ( 0.57%) ( 2.24%)( 5.95% )(27.40%) TOTAL EQUITY 57.36% 56.08% 48.86% 22.67%
The figures in Table No. 26 show that, in 1982 and 1983, there was a decrease in the capital stock infused by the National Government due to the distressed economic climate in the country. As a result of this, the corporation tightened its budget in order to continue its operations. The surplus account, showing a fluctuating trend, includes contingent surplus, retained earnings

- 56 -
and donated surplus. Regarding the foreign currency valuation difference, the amount is just a small percentage of the total assets for the years 1980 to 1982, but became a significant figure in 1983. This reflected the distressed economic situation which is beycod the control of the corporation.
Index Analysis As to the magnitude of change of the different components of
the Inccme Statement, the index analysis gives insights on this. Results of Operations
Table No. 27 presents sane selected canponents of the gross revenue as a percentage related to a base year, in this case, 1980.
Table No. 27 Index Analysis of Gross Revenue
1980 - 1983 1980 1981 1982 1983
Loans Receivables-Water Districts 100% 138.24% 174.90% 219.28%
Savings Deposit 100% 67.32% 179.10% 553.08% Treasury Bills/
Govt. Securities 100% 77.61% 58.37% 37.67% Gain fran Training
and Seminar fees 100% 188.22% - 47.54% Miscellaneous Incane 100% 819.50% 717.09% 1312.22% Dividend Income 100% 763.33% 658.67% 2669.39% TOTAL GROSS REVENUE 100% 129.36% 158.44% 199.32%
Using 1980 as a point of reference, the total gross revenue increased to 199.32% of the 1980 figure in 1983. The figures in Table No. 27 show that the increase in interest income from loans receivables-water districts are higher than the increase in total gross revenue. At first glance, there seems to be an increase in the number of viable water districts formed by the corporation. However, these figures are quite misleading in the sense that the increase in the number of water districts formed was actually less than the increase in the loans receivables, percentage-wise. Therefore, it may be advisable for LWUA to look into the credit terms of the loan as well as the collection efforts to improve its liquidity. As indicated in the figures in Table No. 27 , the increase in the loans receivables in 1 983 was tremendously high. But further analysis shows that the number of water ais-

- 57 -
tricts formed during that year was way below the number of water districts formed in 1980. Furthermore, the interest in-come from savings deposit decreased, in ,1981 but increased in 1982 and 1983. However, the interest income from treasury bills/government securities continued to decrease as a result of a decrease in investments in these securities. Such a decrease was the result of the policy of the corporation to augment LVJUA's lending operations since the releases of capital funds were not enough to meet the obligations incurred by the corporation. Hie miscellaneous inccroe and the dividend inoome, on the other hand, continued to increase.
Regarding the expenses of the corporation, Table No. 28 shows the magnitude of change of the different components of the expenses.
Table No. 28
Index Analysis of Expenses 1380 - 1983
1980 1981 1! 382 1983
Personal Services 100% 191. 31% 225, .39% 225. 03% Administrative and
General Expenses 100% 209. 09% 402 .50% 518. 32% Supplies, Materials
and Cannunication 100% 236. 52% 211 .19% 245. 00% Light, Fuel, and Water 100% 736. 76% 1124 .52% 1192. 69% Travelling Expenses 100% 132. 86% 151 .59% 86. 20% Discretionary and
29% Entertainment 100% 77. 15% 14 per. 25. 29% Other Expenses 100% 250. 74% 152 .76% 282. 68% Interest Expense-Loans 1 00% 121. 30% 157 .84% 214. 09% TOTAL EXPENSES 100% 168. 00% 190 .73% 223. .72%
Analysis of the figures in Table No. 28 indicates that the total expenses zoomed up in 1981. There are several factors attributed to this increase. First of all, there was an increase in manpower in 1981 by 15%. As a result of this, personal ser-vices increased by 191.31%. Furthermore, expenses such as light, fuel, and water; general and administrative expenses; supplies, materials and communication expenses; and, other expenses in-creased. due tc the increase in manpower coupled with the expenses related to the transfer of IMJA to a new building in Balara, Quezon City. Moreover,there was an increase in interest expense-loans due to the increase in loan availments. Such increase resulted to the need of the corporation for additional funding for its operations since the equity contribution of the National

- 58 -
Government was slashed. Further analysis of the above figures indicate that almost all of the expenses continued to rise except for discretionary and entertainment expenses which continued to decline due to the policy of cost reduction related to this expense. One significant expense, the personal services, in-creased in 1983 relative to the figure in 1980. However, a closer look at this account shows that the increase is lower than the increase in 1982, indicating that there was actually a decrease in the personal services in 1983. This is due to the fact that LWUA implemented a "freeze-hiring" policy coupled with the fact that there were a number of employees who left the corporation, as evidenced by a decrease in manpower.
Financial Condition Regarding the index analysis of the Balance Sheet of the
corporation for the years 1980 to 1983, with 1980 as the base year, Table No. 29 shows the magnitude of change of the diffe-rent components of the assets.
Table No. 29 Index Analysis of Assets
1980 - 1983 1980 1981 1982 1983
Current Assets 100% 104.23% 96.45% 150.00% Special Funds 100% 79.08% 145.60% 120.51% Long-term Receivables 100% 135.17% 164.88% 179.71% Permanent Investment 100% 102.56% 102.56% 102.56% Fixed Assets 100% 142.06% 186.85% 173.59% Deferred Charges and
Other Assets 100% 120.05% 130.30% 216.25% TOTAL ASSETS 1 00% 129.29% 153.73% 183.90%
There was a slight increase in the total assets of the corporation in 1981 in spite of the decrease in net income of the corporation, _which presumably affects the balance sheet accounts. The current assets and special funds account showed a fluctuating trend, as compared to the base year figure while the other ac-counts showed an increase frcm the 1980 figure. The permanent investment account showed a slight increase in 1981 and remained constant thereafter. Included in this account are investments m PLOT, Meralco, and in the Metropolitan Theater Foundation. The latter investment represented the membership fee of the LWUA General Manager as art patron of Manila. The long-tern receiva-bles account displayed an upward trend, indicating the corpo-ration's reliance to foreign loans to finance its operations.

Presented in Table No. 30 is the index analysis of the Liabilities account of the corporation.
Table No. 30
Index Analysis of Liabilities 1930 - 1983
1980 1981 1982 1983
Current Liabilities 100% 183.00% 194.17% 310.87% Liability for Special
Funds 100% 96.79% 101.76% 97.35% Long-term Liabilities 100% 130.33% 191.16% 361.77%
The current liabilities continued to increase at a faster rate than that of the current assets. This explains why the corporation became less liquid as years went by. Liability for special funds fluctuated. Fran the figures in Table No. 30, it is evident that the long-term liabilities increased at an in-creasing rate. Comprising this account are the loans payable fran both the foreign and local sources. Further analysis shewed that the corporation's loans payable frcm local sources remained constant while those frcm the foreign loans increased. Such borrowings are needed by the corporation to finance its relending operations.
Finally, Table No. 31 shows the magnitude of change in the Stockholders' Equity.
Table No. 31
Index Analysis of Equity 1980 - 1983
1980 1981 1982 1983
Capital Stock Paid Up 100% 133.78% 150.09% 161.28% Surplus 100% 99.91% 106.66% 139.40% Foreign Currency Valuation
Difference 100% 505.63% 1592.40% 8777.63% TOTAL CAPITAL 100% 130.17% 145.46% 158.94%
The figures in Table No. 31 show that the capital stock paid up continued to increase at a decreasing rate. As mentioned earlier, this resulted frcm the decline in the capital contri-buted by the National Government. The surplus account, on the

- 60 -
other hand, declined in 1981 as a result of a decrease in the net income. However, this increased in 1982 and 1983. Such increases resulted frcm the measures implemented by the different control units. Such measures include the cost reduction policy initiated by the Management Office, the working knowledge of the different operating units on the over-all corporate goals, and the strict supervision of the General Manager, among others. The tremendous increase in the foreign currency valuation difference at an increasing trend reflects the distressed economic climate of the country where the peso was devaluated. Such situation is beyond the control of the corporation and does not reflect the effect-iveness of the different control units.
Variance Analysis of Projected Incatie Statement Actual
The pro-forraa income statements are projections of the fi-nancial condition and performance of the corporation. Shewn in Table No. 32 is the projected revenue for the years 1980 to 1982. Note that there is no projected income statement for 1983 due to the unavailability of information.
Table No. 32 Projected Gross Revenue
1980 - 1982 1980 1981 1982
(in thousands)
Interest Revenues Loans Reoeivables-WDs P52,694 P65,100 P85,899 Savings Deposit 500 Government Securities 6,503 9,000 4,530
Revenue frcm Seminar and Training 2,243 60 100
Miscellaneous Income 120 968 TOTAL GROSS REVENUE P61,560 P75,128 P91,029
From the figures above, coiranon size analysis-shows that a large percentage of gross revenue ccmes fran the interest reve-nues fran loans receivables fran the water districts. This is followed by interest revenues fran government securities, revenue frati seminar and training, miscellaneous incone and interest earnings frora savings deposit, in that order. Table No. 33 presents a summary of the percentage of the individual compo-nents of projected gross revenue to its total.

- 61 -
Table No. 33
Cargnon Size Analysis of Projected Grrar, RWPDUP 1980 - 1982
1 980 1981 1982
Interest Revenues Loans Receivables-WDs 85.60% 86.65% 94.36% Savings Deposit - - 0.55% Government Securities 10.56% 11.98% 4.98%
Revenue frcm Seminar and Training 3.64% 0.08% 0.11%
Miscellaneous Incane 0.20% 1.29%
A comparison of the projected revenues against the actual shows that the corporation did not meet its projected revenues. Table No. 34 shows the variance of actual revenues fran the projected.
Table No. 34
Variance Analysis of Gross Revenue 1980 - 1982
1980 1981 1932
(in thousands)
Interest Revenue Loans Receivables-WDs (P11 ,086) (P 7,580) (P44 ,291 ) Savings Deposit 585 395 550 Government Securities 957 3,210 ( 175)
Revenue fran Seminar and Training ( 2 ,140) ( 134) ( 100)
Miscellaneous Income ( 55) ( 431) 236 Other Income 26 8 486
Over-all, LWUA met only 80.98% of the projected revenue in 1980, 35.42% in 1981, and a low 52.49% in 1983. Of the total gross revenues, the interest revenue fran the loans receivables — water districts is the most significant. Analysis shows that the corporation met only 78.96% of the projected revenue in 1980, 88.36% in 1981, and 84.72% in 1983.
Regarding the expenses of the corporation, Table Wo. 35 presents the various canponents of the expenses based on the projected income statements.

- 62 -
Table No. 33
Projected Expenses 1980 - 1982
1980 1980* 1980** 1 981 1982 (in thousands)
Operating Expenses Personal Expenses Fringe Benefits Supplies and Materials Repairs, Maintenance and Improvements
Other Services OQA Expenses Travel Other Expenses Fixed Charges
TOTAL OPERATING EXPENSES Financial and Non-Budge-
tary Expenses TOTAL EXPENSES
9,172 3,088
688
96 4,356 300
6,275
220 24,195 24,782 84,977
9,172 4,585
688
96 4,366 300
6,275
220
10,707 4,651 528 96
3,418 255
5,065
202
13,463 11,291 1,073 736
4,242 472
10,466
185
15,948 13,552 1,600
1,040 5,819 500
11,001 2,944 980
25,702 24,922 41,928 53,386 24,782 24,766 21,289 23,779 50,484 49,688 63,217 80,109
Note that there are three sets of expenses of the corpora-tion for 1980. The first column was extracted from the original projected income statement of the corporation. The second column was actually from the revised projected income statement, which was submitted together with the Supplemental Budget No. 1. Sup-plemental Budget No. 1 was submitted in connection with the additional appropriation of PI,507,000 which would cover the funding of the following activities: (1) Co-sponsorship of work-shop entitled "Appropriate Methods of Treating Water and Wastewa-ter in Developing Countries" (2) For the establishment of "LWUA Hospitalization" in partial implementation of LOI 97 per Corporate Compensation Circular §2 ; and, (3) For implementa-tion of amelioration and meal subsidy allowances in partial implementation of LOI 97.54 T h e t h i r d columnf o n ^ o t h e r j j ^ was fran another revision of the projected income statement, which was submitted with Supplemental Budget §2 in connection with the additional - - appropriations of the following purposes: (1 ) implementation of full adjustments in basic salaries of LWUA employees effective May 1, 1980 in furtherance of LOI 97, Corpo-rate Compensation Circular if2 and LOI 976; and, (2) adjustments in Cost of Living Allowances of the General Manager and Assistant General Managers at the rate of P1,400 and P1,100 monthly, res-pectively, effective May 1, 1980.'

Table No. 36 presents the common size analysis of the projected expenses of the corporation.
Table No. 36 Common Size Analysis of Projects Fvpan^PB ~ — : 1980 - 1982
1980 1980* 1980** 1981 1982
Operating Expenses Personal Expenses 14 .90% 14 .90% 17.39% 17. 92% 17.52% Fringe Benefits 5 .02% 7 .45% 7.56% 15. 03% 14.89% Supplies & Materials 1 .12% 1 .12% 0.86% 1. 43% 1.76% Repairs, Maintenance & Improvement 0 .15% 0 .15% 0.15% 0. 98% 1.14%
Other Services .7 .07% 7 .09% 5.55% ' 5. 64% 6.39% 00A Expenses 0 .49% 0 .49% 0.41% 0. 63% 0.55% Travel 10 .19% 10 .19% 8.23% 13. 93% 12.09% Fixed Charges 0 .36% 0 .36% 0.33% 0. ,25% 1.08% Other E>:penses - 3.23%
TOTAL OPERATING EXPENSES 39 .30% 41 .75% 40.48% 55. 81% 58.65% Financial and Non-budge-
tary Expenses 40 .26% 40 .23% 40.23% 28. ,34% 26.12% TOTAL EXPENSES 79 .56% 81 .98% 80.71% 84. 15% 84.77%
The total expenses comprise a substantial percentage of the total gross revenue. If the total operating expenses were the only expenses considered, then only approximately half of the total gross revenues goes to these expenses, thus, realizing a net income of 50% of gross revenue. However, the financial and non-budgetary expenses add significantly to the corporation's total expenses. These expenses include depreciation, amortiza-tion of deferred charges, interest expense on foreign loans payable, and provision for bad debt.
A comparison of the above expenses against the actual expenses is shown in Table No. 37.
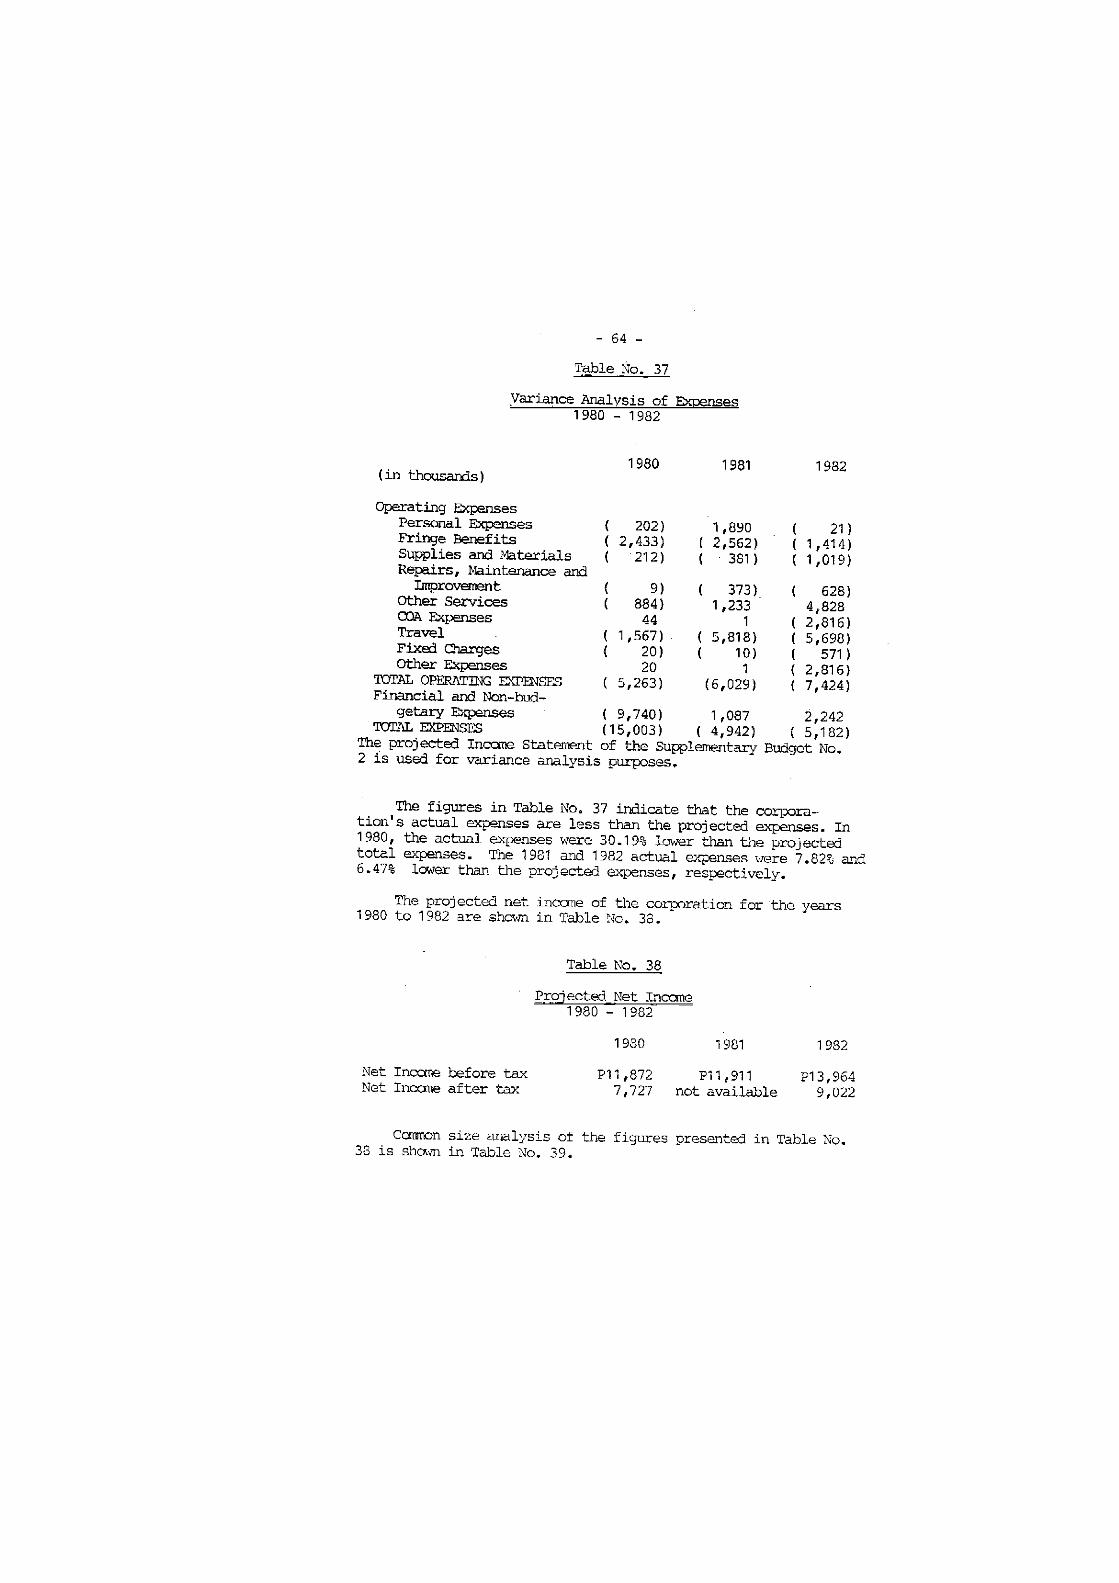
- 64 -Table No. 33
Variance Analysis of Expenses 1980 - 1982
(in thousands)
Operating Expenses Personal Expenses Fringe Benefits Supplies and Materials Repairs, Maintenance and Improvement
Other Services CQA Expenses Travel Fixed Charges Other Expenses
TOTAL OPERATING EXPENSES Financial and Non-bud-
getary Expenses TOTAL EXPENSES
The projected Income Statement __ ___ 2 is used for variance analysis purposes.
1980 1961 1982
( 202) 1,890 ( 21) ( 2,433) ( 2,562) ( 1,414) ( 212) ( 381 ) ( 1,019) { 9) ( 373) ( 628) ( 884) 1,233 4,828
44 1 ( 2,816) ( 1,567) ( 5,818) ( 5,698) ( 20) ( 10) ( 571) 20 1 ( 2,816) ( 5,263) (6,029) ( 7,424) ( 9,740) 1,087 2,242 (15,003) ( 4,942) ( 5,182)
The figures in Table No. 37 indicate that the corpora-tion's actual expenses are less than the projected expenses. In 1980, the actual expenses were 30.19% lower than the projected total expenses. The 1981 and 1982 actual expenses were 7.82% and 6.47% lower than the projected expenses, respectively.
The projected net income of the corporation for the years 1980 to 1982 are shown in Table No. 38.
Table No. 38 Projected Net Income
1980 - 1982 1980 1981 1982
Net Income before tax P11 ,872 P11,911 P13,964 Net Income after tax 7,727 not available 9,022
Cannon size analysis of the figures presented in Table No. 38 is sham in Table No. 39.

- 65 -Table No. 33
Common Size Analysis of Projected Net Income 1980 - 1982
1980 1981 1982
Net Income before tax 19.28% 15.85% 15.23% Net Income after tax 12.55% - 9.91%
Table No. 39 shows that the corporation's net inccme is just a small percentage of the total gross revenue. Comparing the figures in Table No. 38 with the actual net income shows that the net incctne before and after tax in 1980 is higher than the projected net income as contrasted to that of 1 981 and 1982 where the actual net income is lower. Table No. 40 shows the suimary of this variance.
Table No. 40 Variance Analysis of Net Income
1980 - 1982 1980 1981 1982
{in thousands)
Net Income before tax 3,272 (5,722) (1,076) Net Income after tax 1,220 - (3,229)
In spite of the fact that the actual expenses of the corpo-ration for the years 19S0 to 1983 were lower than the projected expenses, the actual net income is lower than the projected net income. Analysis shows that it was only in 1980 when the corpo-ration realized 115.79% of the projected net income after tax, whereas in 1982, the corporation realized only 64.21% of the projected net income after tax. Tne 1981 net income before tax only 51.96% of the projection, indicating the corporation's net income after tax for that year was way below the projection.
Budget Variance Analysis The control of expenses is seen on the variance analysis of
the budget. The Budget Division makes sure that each department would operate within the approved spending budget, and not the approved budget. Although the latter was already approved by the Board, once submitted to the Ministry of Budget, the approved budget would be slashed again.

- 66 -
In 1980, the budget submitted by the Board to the Ministry was slashed by 0.27%, affecting the following accounts: (1) budget for fringe benefits and travel were slashed by 1.92% and 1.29%, respectively; and (2) budget for sundry expenses was increased by 2.09%. In controlling the expenditures of the corpo-ration, the budget is constantly being realigned wherein the budget for certain accounts are transferred to another, de-pending on the need and urgency of such expenditure. As a result of the realignment, the total expenses of the corporation for this year was 17.05% lcwer than the approved spending budget. Analysis shows that LVJUA overspent in the following areas: (1) personal services; (2) special projects; and (3) CQA expenses. However, the actual expenses of the other canponenents were way below the approved spending budget. Table No. 41 presents the budget variance analysis for 1980.
The budget for 1981, which was approved by the Board was cut-off by the Ministry of Budget by 13.16%, affecting all operating expenses. In spite of overspending in same areas, the overall expenditures of the corporation for this year was 1.41 % below the approved spending budget. Analysis of the actual expen-ses vis-a-vis the approved spending budget shows that the corporation was able to save fran the following areas: (1) fringe benefits by 11.62%; (2) supplies and materials by 10.42%; (3) repairs and maintenance by 43.07%; and, (4) travel by 38.51%. Part of the savings fran these areas were realigned to cover the expenses for personal services, sundry expenses and CQA expense. Table No. 42 sumaarizes the budget variance analysis for 1981.
In 1982, the Ministry of Budget slashed the budget of the corporation by 12%. Again, all the areas of the operating expen-ses were affected. During this year, the corporation was able to spend only 89.37% of the approved spending budget, cutting-off their expenditures in the following areas: (1) fringe benefits by 1.82%; (2) supplies and materials by 45.23%; (3) repairs and maintenance by 31.84%; (4) sundry expenses by 19.35%; (5) travel by 37.24%; and, (6) Special Projects by 16.96%. How-ever, the corporation overspent in the areas of personal services and COA expenses. Table Ho. 43 presents the budget variance analysis for this year.
As in the past years, the Ministry of Budget slashed the corporation's budget, this time by 6.47%. The total expenses of the corporation in 1983 was 98.57% of this budget. In realign-ing the budget, part of the corporation's savings from fringe benefits, repairs and maintenance, travel and COA expenses were transferred to the personal services, supplies and materials, and sundry expenses to cover the increases. Table No. 44 pre-sents the budget variance analysis for 1983.
The budget variance analyses for the period of four years indicate management's ability and strict compliance with their cost control measures.

Table No. 41
1980 Budget Variance Analysis
APPROVED APPROVED ACTUAL % CL, •O BUDGET SPENDING EXPEN-
BUDGET DITURES A ' B C (B/A) (C/B)
Personal Services P 9,669,882 P 9,669,882 P10,505,21 4 _ 8.64% Fringe Benefits 4,309,892 4,226,892 2,117,553 ( 1.92%) (49.90%) Supplies and
(49.90%) Materials 527,622 527,622 316,286 - (40.05%) Repairs and Main-tenance 120,000 120,000 86,559 — (27.87%) Sundry Expenses 3,961,181 4,044,181 2,817,810 2.09% (30.32%) Travel 4,922,964 4,859,520 3,498,401 ( 1.29%) (28.01%) Special Projects - - 20,002 - —
COA Expenses 255,000 255,000 298,927 - 17.23% TOTAL P23,766,541 P23,703,097 P19,660,752 { 0.27%) (17.05%)

Table No. 42 1981 Budget Variance Analysis
APPROVED APPROVED ACTUAL % % BUDGET SPENDING EXPEN-
BUDGET DITURES A B C (B/A) (C/B)
Personal Services P1 3,462,800 P12,693,374 PI 5,352,717 { 7.92%) 20.95% Fringe Benefits 11,163,500 10,525,064 9,301,435 { 5.72%) (11.62%) Supplies and
Plater ials 1,072,500 772,500 692,001 (27.97%) (10.42%) Repairs and Main-
tenance 736,000 638,500 363,490 (13.25%) (43.07%) Sundry Expenses 4,555,000 3,820,452 5,077,426 (16.13%) 32.90% Travel 10,466,000 7,559,229 4,647,998 (27.77%) (38.51%) Special Projects - - 782 - -
COA Expense 472,000 401,200 461,271 (15.00%) 14.97% TOTAL P41,927,300 P36,410,319 P35,897,120 (13.16%) ( 1.41%)

Table No. 42 1982 Budget Variance Analysis
APPROVED APPROVED ACTUAL o, "O o, 'O BUDGET SPENDING EXPEN-
BUDGET DITURES A B C (B/A) (C/B)
Personal Services P15,948,160 P15,218,098 P15,927,231 ( 4.58%) 4.66% Fr inge Eenef i ts 13,545,901 12,367,240 12,142,654 ( 8.70%) ( 1.82%) Supplies and
Materials 1,200,000 900,200 492,996 (24.98%) (45.23%) Repairs and Main-
tenance 1,040,000 605,000 412,384 (41.83%) (31.84%) Sundry Expenses 7,359,800 6,645,918 5,359,281 (10.19%) (19.36%) Travel 11,001,689 8,450,284 5,303,307 (23.19%) (37.24%) Special Projects - - 825 - -
COA Expense 500,000 500,000 415,178 - (16.96%) TOTAL P51,041,750 P44,916,740 P40,142,220 (12.00%) (10.63%)

Table No. 44 1983 Budget Variance Analysis
APPROVED APPROVED ACTUAL % -B BUDGET . SPENDING EXPEN-
BUDGET DITURES A B c (B/A) (C/B)
Personal Services P1 4,875,000 P16,057,000 P16,884,130 7.95% 5.15% Fringe Benefits 12,158,747 12,070,000 11,176,361 ( 0.73%) ( 7.40%) Supplies and
Materials 620,000 597,000 609,363 ( 3.71%) ( 2.07%) Repairs and Main-
tenance 600,000 687,000 465,354 0.14% (32.26%) Sundry Expenses 6,577,890 4,116,000 4,549,379 (37.43%) (10.53%) Travel 4,947,110 3,634,000 3,010,102 (26.54%) (17.17%) COA Expenses 653,000 653,000 577,682 - (11.53%) TOTAL P40,431,747 P37,814,000 P37,272,371 ( 6.47%) ( 1.43%)

- 71 -
Monitoring Indicators
The monitoring indicators were set by the World Bank, one of the foreign creditors of the corporation. These indicators give insight on the efficiency of operations vis-a-vis utilization of resources.
These monitoring indicators were computed by LWUA for the years 1980 to 1981 only. However, these were not fully utilized as a measure of performance. Nevertheless, Table No. 45 shows the monitoring indicators.
Table No. 45 Monitoring Indicators
1980 - 1981 1980 1981
I. As a Percentage of Average Total Assets Total Income 6.7% 6.6% Financial Expenses 1.6% 1.5% Gross Profit 5.1% 5.1% Administrative Expenses 2.6% 3.7% Net Income before Provisions 2.5% 1.4% Provisions 0.4% 0.8% Net Income before Income Tax 2.0% 0.6% Income Tax 0.8% 0.5% Net Income after Incane Tax 1.2% 0.1%
II. Net Income as a % of Average Equity 2.1% 0.2% III. Interest on Loan as a % of Average
Loan Portfolio 8.7% 8.7% IV. Financial Expense as a % of Average
Borrowings 4.8% 4.5% V. Gross Spread (III - IV) 3.9% 4.2% VI. Provision for Bad Debts as a % of
Year-End Portfolio 1.5% 2.0% VII. Long-term Debt to Equity .59:1 .61:1 VIII. Current Ratio 2.60:1 1.50:1 IX. Percentage Increase in Total Assets 28.0% 29.3%
However, the analysis of the above figures could not be made since the the standards supposedly set by the World Bank were not available.

- 73 -FOOTNOTES
LWUA Office Manual, 2"Justification for 1980 Organizational Changes," LWUA
Operating Budget 1980. 3Xbid. 4 Interview with Edna Balucan, Division Manager, Manage-
ment Services Division, June 1984. 5Ibid. 6"Implementation of CY 1984 QBM-tfadified LWUA Reorgani-
zation Structure," Office Order No. 75-84, April 2, 1984. 7 Interview with Manny Yoingco, Assistant Department Manager
Loans Operations Department, June 1984. p Interview with Mario Quitoriano, Department Manager, Fielc
Operations Department, June, 1984. ^"Organizational Changes," op. cit. 10 Interview with Celso Razal, Officer-in-Charge, Monitoring
Division, June, 1984. . 11 Ibid. 12 "Area Supervisors," Office Order No. 271-83. September 12,
1983. 13 Interview with Manny Yoingco. 14 Interview with Celso Razal, 15 "Reorganization," op. cit. 16 Interview with Cynthia Esguerra, Department Manager,
Management Services Office, September, 1984. 17 Minutes of EXEOOM meetings, 1983. Ibid. 19 Ibid,
20Ibid. 21 Ibid. 22 Interview with Cynthia Esguerra. 23x, . . Ibid. 24 Interview with Edna Balucan. 25Corporate Plan 1982-1990. 1932. 2 6 ' Interview with Celso Razal. 27Ibid. 28 Institutional DBvelopment of Water Utilities in f-h
Philippines, '1982.

- 74 -
"Ibid. Ibid.
31 TV -Ibid. 32 Ibid. 33 . Ibid. 34 Ibid. 35 Interview with Guillermo Bantugan, Department Manager,
Budget and Cost Control Department, June, 1984. 36 Interview with Cynthia Esguerra. 37 Internal Control Evaluation Report, 1982. Ibid.
39Ibid. 40 Interview with Edna Balucan. 41 Ibid. 42 Ibid. 43 LWUA Operating Budget, 1981. 44 Interview with Cynthia Esguerra, 45 "Action Xveekly Journal and Travel Reports," Office
Cteder No. 217-81 , July 23, 1981. Corplan Manual, 1982, pp. cit.
47 ' ' J Corporate raster Plan, 1 S30 ' :.• i".
z'.q ""Ibid. 50
- —
51 Lid. plan Manual, 1932, op. cit.
"""'Beard Resolution Mo. 12, January 13, 1930. JBoard solution No. 35, February 20, 1S30 '.ooard solution rio. 45, iiarch 12, 1930.
c?

- 75 -
HOME FINANCING OORFORATICM Corporate Overview
The Hone Financing Corporation was initially known as the Home Financing Commission tasked with the functions of operating a mortgage insurance program, encouraging, aiding and initiating the organization and incorporation of building and loan associa-tions and promoting the home building and land ownership of indi-viduals. Capitalized at ten million pesos, of which 6.5 millon was paid up, the HFC undertook the guarantee of housing loans extended to GSIS, SSS and some private banks to home borrowers.
The clamor for more housing units by the low income and middle income families and the mushrooming of squatter colonies in Metro Manila, are but two of the factors that stimulated the policy makers to review the incentives for housing development. To spur more investments in real estate projects, including low-cost mass housing, the HFC charter was reviewed, and gaps were identified. The analysis of the old charter revealed that low capitalization, limited ceilings for loan guarantee and payment in the form of bonds for cases of defaults, were not conducive to the active participation of the corrmercial banks and other finan-cial institutions in the low-cost mass housing programs.
It was also realized that there was no central body which coordinated the various offices directly or indirectly involved in housing; such gap resulted in seme overlapping of functions and seeming disparate and disjointed approach to housing develop-ment.
Executive Order Number 535 was issued on May 3, 1979 which renamed the Home Financing Commission to the Home Financing Corporation. It also broadened its powers considerably to enable it to mobilize resources from the private sector. Among the salient features of the law are: (1) increase in capitalization fran 10 million to 1 billion pesos; (2) inclusion of private development banks, savings banks, rural banks and savings and loan associations in the guarantee program; (3) increase in the ceiling for loan guarantee; (4) transfer of the supervision and registration of the building and loan association frcm the Secu-rities and Exchange Conroission to HFC; (5) empowering the Board to create and manage affiliates and subsidiaries; (6) making the Ministry of Human Settlements ex-officio Chairman of the Board; (7) designating the Vice-chairman/President of the Corporation; (8) designating the General Manager/Executive Vice President of the Corporation.
Significantly, HFC was mandated by the Executive Order to "coordinate its policies, places, projects and regulations with those of the Ministry of Human Settlements and all other agencies of the government involved in housebuilding and development and

- 76 -
q mortgage financing."
In line with its new charter, the HFC has expanded its operations to.include funds generation, project supervision and controller ship, project development through ventures and other related financing arrangements to facilitate participation of the private sector in housing development.
Structure In 1980 HFC focused- its attention on two product lines which
were: (1) mortgage insurance and credit management; and, (2) investment- services and project management. Hie Credit Insurance Department handles the first mentioned functions. The clients of the department were well-established real estate developers who needed nortege"insurance c^erage aj^
On the other hand, the Investments Department took care of investment services and project management. Its target clients were new real estate developers with little or no experience in soureiag funds or marketing the housing units that had been cons-tructed. In addition, it offered these services: (1) land deve-lopment and housing design; (2) project planning development; (3) funds sourcing and underwriting.; (4) works engineering and project management; - and, (5) marketing and take-out facilities.
Credit Insurance Department" The two major functions of the Credit Insurance Department
were: (1) inspection, appraisal and loan evaluation; and, (2) marketing of HFC's guarantees. An evaluation process is underta-ken to ascertain project compliance with technical requirements and financial viability. These were handled by the Inspection, Appraisal and Loan Evaluation Service, and Insurance Marketing and Financial Relations Service. This department was abolished in 1981.
Investment Department The Investment Department was tasked with the responsibility
of providing know-how in production, marketing, distribution and housing management to clients of the corporation. Specifically, it fulfilled the following function: (1) develop a realistic product package on heme development; (2) prepare the necessary structural and architectural designs of shelter and home package; (3) identify, evaluate and recommend potential sources of heme development funds.
The Project Planning Service undertakes the planning func-tion for the construction activity. The Project Implementation Services directs, manages and controls the housing construction,

- 77 -
development and distribution of housing units, after completion. Simultaneous with the implementation of the housing development and distribution is the adoption of control measures by the Project Control Service. This- division ascertains the allocation of funds for the project, releases the funds and undertakes periodic review. This Department was abolished in 1981.
Credit Supervision and Business Development Group;
The thrust in the late seventies was "marketing of insurance services of the corporation." However, with the acceptance by private banks of the role of HFC in guaranteeing real estate loans, reorganization was initiated to enable the corporation to meet the resource requirements needed to service its clients. The Investment Department was converted in 1981 to the Credit Supervision and Business Development Group with three departments specifically: Counselling and Assistance, Architectural and Engineering and the Project Control arid Monitoring Department. A fourth department was created in 1 983 to take responsiblity for the acquired assets; thus it was named the Acquired Assets Department.
Project and Financial Evaluation Group
With the reorientation of the HFC from marketing to evalua-tion and funds generation, the Investment Department was reorga-nized into the Project and Financial Evaluation Group (PFEG). Essentially, the PFEG provides top management 'with a thorough analysis of the viability of the project proposal prior to the approval of guarantee facility to applicant firms/institutions. Thus, PFEG determines the competence and reliability of the proponent to undertake projects.
The Appraisal Department of PFEG assesses the technical and credit aspects of proposals, while the Funds Generation Depart-ment is responsible for the issuance of bonds, debentures, secu-rities collateral and other debt instruments, in foreign curren-cies; and for the administration, management and investment in equity or shares in public or private establishments.
Relationship of the Two Departments Conceptually, the Credit Supervision and Business Develop-ment Group (CSBDG) was the implementing arm of the PFEG. However, an apparent overlap existed because both groups have an appraisal unit doing appraisal work. This resulted in a conflict of jurisdiction. Nevertheless, a knowledge-able respondent revealed, that there is an imaginary cut-off between the boundaries of responsibilities of the two groups. Before approval of a project by the Board, PFEG has jurisdiction through the Appraisal Department; after appro-

- 78 -val, CSBDG through the Architecture and Engineering Depart-ment has responsibility.
In practice, CSBDG assumes initial responsibility for the re-evaluation of a project but Project and Financial Eva-luation Group may be asked for an opinion. Should there be a difference in decision, both position:' shall be presented to the Management Committee. To resolve this overlap, deli-neation guidelines were formulated which are as follows:
1. CSBDG shall undertake re-evaluation and processing of all requests for extension of guarantee of not more than a year;
2. PFEG shall undertake the re-evaluation and processing of requests for increase in the amount of guarantee ngt exceeding 20% of the original loan. The 20% ceiling is cumulative and therefore not a ceiling for each and every request for increase in guarantee amount;
3. PFBG shall undertake the re-evaluation and processing of requests for extensions requiring terms beyond one year; and finally,
4. Beyond 20% limit, PFBG shall evaluate with CSEDG providing the technical support.
Estate Management Group The Estate Management Group which was created in 1980 is
responsible for managing the different programs of the homeowners and community associations and building and latin rssociations. This is staffed by personnel from the Human Settlements Regulato-ry Commission, who fulfills additional tasks for HFC. The group is headed by a Vice President.
Special Projects Group
The Special Projects Group was created in 1981 to develop and implement new projects. It is responsible for the Housing Program of the Ministry of Human Settlements and provides admi-nistrative support to the Maunlad Savings and Loan Association (MSLA). This Association was acquired by HFC for P11,020,000 in August 1982. MSLA is situated in Angono, Rizal.11
Land Investment Trust (LIT) Program
The LIT is a program which is synonymous with the Special Projects Group and is often called a "corporation within a corpo-ration". It has its own personnel, project management evaluation and finance units which operate autonomously.

- 79 -
Internal, _Audit and Information- Systens (IfiT.q) Tfoe Internal Audit ai^-Information Systems: (IAIS); .was created
by thfe BoaaDd pursuant.: to the-reetaintendatiBo of the Caranission on Audit- (OQA) in the evaluation: report dated November 23, 1981. The GQA identified the weaknesses -in the-internal control system of the <xirparatian and advised-management- :© strengthen the organization and institute appropriate-systems and controls. In 1982,-a~division chief-was appointed on a contractual basis to the Internal-Audit Office as -the sole staff member. Thecontract was renewed for six .roorrfchsfiGtn January-1- to June 30, 1983. A manager was appointed, in May 1983 to head the TATS. Presently, it has a ccmplsnent of 8°personnel, sevai of m t o are certified public accountants' and headed by a manager.
There are two divisions in IAIS, which are the Financial Compliance Division and the Performance Appraisal Division. As defined in its functional chart, 1AIS is responsible for determin-ing the adequacy and-soundness of the accounting, financial and operating systems, policies, procedures and control; ascertaining caiplianoe with-the . policies> plans and control measures; re-viewing and assessing the efficiency and effectiveness of the operating activities as well as personnel performance. It en-sures the proper accounting and safeguarding of all monies, properties and physical resources of the corporation. It ascer-tains the reliability of accounting records and other important documents. It reviews financial statements and submits reccmmen-dation for operations improvement. It also coordinates with COA on audit matters. As an additional function, it develops the management information system for the corporation.
Corporate Planning Office (Corplan) In 1983, a Corporate Planning Office was approved by the
Board but no staffing was undertaken. However, in Novsnber of the same year, a consultant was hired to provide advice on corporate planning. He also serves as policy adviser on budget formulation and target-setting. For practical purposes, the Corplan is a one-man unit which the consultant heads-.
As "head" of the unit, the consultant prepares two regular reports to the President: the annual performance and the updated corporate plan. Other special reports are submitted by him to the President- as cirenmstanoes warrant. The thrust for 1983 is in policy and operations-research;
Corplan Unit "has not prepared- a f ormal planning document because of-the rather: peculiar: arrangement in the organization. In a sense,-a"_icorporate planning system; has yet to be installed and implemented in the corporation.

Aspects of Coordination and Control Carraittee
Management Corcmittee Like other public enterprises, HFC has a conrnittee composed of senior officers which evaluates and reccraiends policy proposals to the Board. This is the Management Committee or Mancom chaired by the Vice-Chairman/President and composed of the Executive Vice-President/General Manager and heads of groups. The Mancom serves as a forum for discussing budget proposals, projects which need guarantee support, and innovations policy approach or changes in the organi-zational system.
Planning In the absence of a corporate planning body, the group
heads, managers with the senior officers comprise the "planning body". Each year, a 3-day planning seminar is held to assess the past year's performance and prepare the programs for the ensuing year. A consultant who reports directly to the President and who undertakes policy review for the President, provides technical assistance in the planning sessions.
Unlike F£DC, LV7UA, or PVTA which have formal units for plan-ning, HFC's planning functions are diffused among the group heads. A planning unit lias teen proposed in trie previous year's reorganization and a structure duly approved, by the Board but im-plsnentation has been deferred because of budgetary reasons. Moreover, sore key officers are of the view that the present arrangement is satisfactory.
In the £ii"inual planning sessions, status reports are present-ed and discussed, problems and issues are analyzed, and specific reconTCeridations arrived at. These forums serve as useful venues for problem solving. A substantial number of policy chang^ are discussed and propo.als to the Board, initially developed.
Monitoring There are three apprcacb.es in the monitoring of HFC gua-
ranteed accounts. The first is the monitoring of accounts called bank warranties. This is undertaken by the Project and Financial Evaluation Group which monitors on a post-audit basis the com-pliance by batiks availing of guarantees with the policies and regulations of MFC. The second is the monitoring through the supervision of '/crks Engineers of projects which need special attention such as those requiring supervision on technical speci-fications or those projects which are for low income families and

- 81 -
therefore have to be constructed at trie most economical price without sacrificing minimum standards for livability. The third is the monitoring by controllership which is essentially a pre-audit function and accounting performed by the Credit Supervision and Business Development Group.
An approach which supplements the above discussed monitoring approaches is the "account managers" concept by which officers of HFC starting with the rank of division chiefs up to the senior levels are assigned a number of projects for their supervision. The account managers prepare a monthly status report on the technical, financial, and marketing developments of the projects based either on actual visit or ocular inspection of the sites, or if this is not feasible, based on the reports sent by the project proponent/banks to HFC. Attached as Appendix A is the form which is presently used by the Account Manager.
A review of the reports in the previous year indicate the findings on: deviation from approved plans, non-completion of required housing units or underdevelopment of the project, slip-page or delay in construction, inadequate water or sewerage facilities, low sales or delay in turnover of units to purchasers. The reports are intended to provide control points which serve as signals to HFC's guarantee operations.
Budgeting
In the absence of an integrated corporate plan, budgets are based on the projects of each department. These are consolidated at the division level and submitted to the AVP-Finance for eva-luation. The consolidated budget is forwarded to the Management Committee for an internal budget hearing and final review before being passed on to the Board for approval. Variance analysis is done on a monthly basis by comparing the actual departmental ex-penses with the budgeted expenses. All disbursements pass through the Budget Division, thus expenses are monitored and controlled. Preprogramming of the budget is allowed after appro-val by the Vice-Chairman/President. The requisitioning depart-ment is required to submit a formal letter to the Executive Vice-President/General Manager who refers the issue to the Finance De-partment through the Gener^ Counsel and Administrative Group for review and recommendation. Internal Audit
The function of internal monitoring is the responsibility of the Internal Audit and Information Systems (IAIS). One of the first accomplishments of the unit is the completion of the opera-tions and financial procedures manuals with the technical assis-tance fran COA. These are used by the IAIS to monitor and eva-luate the compliance by the departments with the prescribed

- 82 -systems and procedures. They are also continuously updated.19
The operating departments are expected to submit monthly reports to the IAIS as inputs to the management information system. The IAIS generates the monthly and quarterly operations report which are submitted to the Vice-Chairman/President. This unit is privileged with a direct reporting relationship with the Vice-Chairman/President who refers their reccmmerdations to the Executive Vice-President/ General I'janager for implementation.
Commission on Audit
As earlier discussed, the Internal Audit and Information Systems is a relatively new unit, having been fully staffed only in 1983. Its creation was recommended by COA which fielded a team in 1982 to evaluate the internal control system of the cor-poration. Among its other important reccmiTendations in addition to the establishment of an internal audit unit were codification of a manual for the Credit Insurance- Department, strengthening of controls over cash, proper recording of receivables, improvements in the fixed assets accounting and correction of the deficiencies noted in the control system.
The post-evaluation in 1983 by COA revealed that HFC com-plied with a substantial number of recommendations and that the few weaknesses still existing were not material to hinder the withdrawal of the resident auditor. The COK withdrew its audi-tor in 1983.
Very significant reforms were undertaken in HFC because of the recornmendations of COA. This HFC experience attests that autonomy in fiscal management is attainable for as long as the internal control systems is viable and top management responds positively to COA's recommendations.
The President as Policy--&ker (Vice-Chaiman of the_ Board) and fidmini s trator
There are two points of view regarding the dual role of the Chief Executive as £.;ol icy-maker and adniriistrator. One view maintains that execution and implementation should be divorced from policy making so that full attention can be given to the tremendous task of implementation. Policy making is regarded as a function solely exercisable by a group of men who are con-cerned with fashioning general rules and criteria for broad de-cision making, akin to the powers of a mini-legislative laxly.
On the other hand,- the other view upholds the right of the' policy-maker to implement his policies, so that deviations frcm intent can .e-a averted. One "vantage l:clicvo to i .ri.froi.i this arrar.jorait is the prtsu:<ec." crwaren&Si anc~ full .aiov/ledgc of

- 83 -the policy-raher/acT::inistrator of the real spirit of the LJolicy as well as the iriplicatior.s which will result frav; its implement-ation, thereby minimizing, if riot completely avoiding itfiwarrejitecl departure of intent from action.
The HFC charter adopts tlie latter view, a conclusive proof that the merger of the roles of policy-maker ana administrator is conducive to effective management.
Th President who is both Vice-G airnian of the Board mid Chief Executive Officer is not only responsible for the overall administration of the organization hiv';. also directly supervises the Corporate Planning Office, the Internal Audit Department and the Special Projects Department. He chairs the ISanagement Com-mittee which is composed of senior officers svjecifical.lv the Executive Vice President/General Manager, Senior Vice President and Vice Presidents. This Ccramittee acts as a review group of executive and vital matters, requiring board action. It is also a very active group which formulates proposals to the Board, prior to actual policy approval.
The relationships between the President and the offices which he directly oversee had been characterized by a number of knowledgeable respondents, as formal but close. There is also an increasing perception that he has delegated and reasonably subs-tantial powers to the General Ilanager in the general su rvi:.'! :-of the other departments of the organization.

- 84 -
Operational Highlights
Measure ofPerformance The measure of performance of HFC, according to management,
is the number of participating banks and the anount invested. However, due to the unavailability of data, the discussion on the corporation's operational highlights will be limited to the amount of mortgage insurance coverage, investments, franchising and ccmnunity associations arid Land Investment Trust (LIT) pro-jects.
Major Programs
Basically, HFC is a mortgage insurance firm. However, with the tremendous housing demands and requirements for massive capi-tal for housing developments, it blossomed into a project-orient-ed public enterprises. In addition to its insurance programs, it has at the present time, five types of investment programs, such as: (1) joint-venture programs where the landowner provides the land and HFC takes care of design and finance; (2) trusteeship where HFC functions as attorney-in-fact empowered to develop the land into a viable project; (3) project management where it manages a housing project; and, (4) pass thru arrangement where it acts as a conduit between fund user and fund source while earning a spread in the process.
HFC is also actively involved in fund generation activities. It taps pension and trust funds, individual endowment funds, foundations, credit unions, and industrial arri sectoral funds. Maj or Accomplishments
Mortgage Guarantee In 1980, HFC approved applications for guarantee mortgage leans amounted to P215,775,934.00. Of this total anount, P46,075,934.00 represented individual loans while P169,700,000.00 represented developmental loans. Only 80% of the approved applications for guaranteed mortgage loans were availed of. The individual loans amounted to P40,199,234.00 while developmental loans amounted to P127,379,000.00. On the other hand, it was observed that there was a growing awareness and demand for mortgage insu-rance coverage as a vital tool towards land and housing development. It was also during this year when HFC adopted two policy changes to encourage the participation of finan-cial institutions in its mortgage guarantee program. The first major policy change implemented was the shift from bond guarantees to cash guarantees on its credit insurance program. This move encouraged more financial institutions to lend for real estate activities since the borri guarantee

was considered one reason for the reluctance of sane finan-cial institutions to lend. The second major policy change involved the emphasis on cash flow analysis instead of the availability of collaterals to determine the viability of a project. This made the package more acceptable and attrac-tive. In 1981, insurance coverage amounted to P562 million, re-gistering an increase of 160% over the 1980 figure of P216 million. Of the total amount, 75% represented developmental loans, which amounted to P419 million while the balance of P143 million represented individual loans. On the other hand, the major policy changes implemented by HFC was met with immediate acceptance. This was evidenced by the fact that by yearend 1981, 33 financial institutions availed of the HFC guarantee compared to the 14 financial institutions recorded prior to the incorporation of HFC with the Ministry.
Insurance coverage for 1982 amounted to P3,019 million, representing an increase of 437% over the 1981 figure of P562 million. Of the total amount, 54% represented develop-mental loans, showing an increase of 292% over the 1981 figure of P419 million. The balance of PI,251 million represented individual loans which registered an increase of 775% over the 1981 figure of P1 43 million and P125 million for bond flotation. It was also during this year when the number of financial institutions that availed the HPC gua-rantee increased to 64 compared to the 1981 figure of 33. In 1983, the mortgage insurance coverage amounted to P5,041 million. Of this amount, P2,309 represented developmental loans, showing an increase by P667 million. Individual loans for this year amounted to P1,766 million, showing an increase by P51 5 million. The balance of P966 million represented the NKMFC accounts. .By yearend 1983, 80 finan-cial institutions availed the HFC guarantee.
Various Housing Projects As of yearend 1980, one on-going project of HFC was the Ipil-Ipil Heights situated at Alabang, Muntinglupa, Rizal. Without equity from HFC, this project falls within HFC's project management, and controllership program. This housing project has 1,124 housing units and involves a total project cost of P132 million. There were four other projects in progress, as of yearend. These were: (1) Victory Heights Subdivision; (2) Pasig Properties; (3) PAG-IBin sa BLISS; and, (4) Modem Village SuMivision. 7dl these projects had an aggregate project cost of P213 million. The targeted number of housing projects that would be made

available to the public once the projects undertaken in 1980 and 1981 were completed will be more or less 5,000 units. As of yearend 1982, the number of housing projects that will be made available to the public once these projects were completed was down to 3,865 units. Moreover, one of the principal innovations adopted by HFC in relation to its role in the National Shelter Program was the accreditations of several prestigious lending institutions. Under this prog-ram, these lending institutions were given automatic insu-rance coverage up to P500 million per entity for housing loans granted by them. Total camnitment for housing finance both frcm private financiers and HFC reached P11 billion, thus, insuring the conmitment of MHS to build 100,000 hous-ing units every year.
Under the developmental projects, there were 92 projects with 40,237 units. As of yearend 1983, there were 5,472 completed units. Under the individual project, there were 14,045 units completed at the end of 1983.
Franchising and Canmunity Association The total number of registered homeowners' association in 1980 was 125. From February 2, 1980 to June 30, 1981, HFC francliised and registered 164 homeowners1 association si-tuated in the 12 regions of the country. The Community Association, as a corporation, once registered and fran-chised by HFC enjoys the credit insurance, technical ser-vices, tax shelter, and many more. Review of operations showed that the corporation contributed in the government's efforts to promote and provide hcmeownership through the various activities undertaken.
In 1982, HFC franchised and registered 653 homeowners' asso-ciation situated in the 12 regions of the country. The information on the number of franchised and registered ha'neowners1 association for 1983 was not yet available as of the date of data-gathering.
Investments Investments of HFC represented those made by the corporation of its idle funds not otherwise needed in its day-to-day operations. In 1980, total investments amounted to P6,206,173.71, ex-cluding those in savings account. Of this amount, P4,200.00 were invested in PLOT preferred shares; P100,000.00 in I-iani-la Building and Loan Association; P3,727,980.00 in trust

- 87 -
deposits in Philippine Veterans Bank; and, P2,373,933.71 in a housing project in Cebu City. The savings account of HFC, which also earn interest, amounted to P856,956.66. As of yearend 1981, total investments amounted to P94,635,744.33. The trust deposits which amounted to P73,556,109.38 includes re-invested and accrued interest but net of tile 20% tax imposed by the law on witholding tax. The time deposits of HFC for that year amounted to PI8,000,000.00. Another investment during this year was the housing project in Cebu City, representing Phase 1. Tnis project was actually a joint project with the Cebu Caritas under Cardinal Rosales. The proceeds fran this project will be re-invested in yet another project also with the Cebu Caritas, called Phase 2.
In 1982, total idle funds amounted to P143,640,788.43. This amount was invested on high yielding investments scheme such as: PI® time deposits—P18,000,000.00; PNB trust deposits— P93,416,242.60; Development Bank of the Philippines trust deposits—P16,113,030.80; Philippine Veterans Bank trust deposits—P3,095,485.43; Maunlad Savings and Loan Associa-tion, whose entire stock was bought by HFC—P11,020,000.00; Philippine Long Distance Telephone shares—P4,200.00; Baha-yan Certificates issued by NHMFC—P1,911,829.60; and, Manila Building and Loan Association—PI00,000.00. The interest earnings of these investments can be determined monthly or yearly based on the rates stated in the contract and/or certificates with the exception of the Maunlad Savings and Loan Association wherein the entire holdings of the former owners were acquired by HFC.
Acquisition of a Subsidiary Bank In 1982, HFC accquired the entire ownership of the Maunlad Savings and Loan Association, Inc. thru purchase in the amount of P11.02 million. The bank's main office is located in Angono, Rizal, with branches at Binangonan, Cainta and Antipolo.
Land Investment Trust (LIT) Projects At the end of December 1933, LIT had S on-going projects, with total projects funding of P342,691,000.00. The total housing units amounted to 2,094. Of this amount, 940 units were townhouse type; 522 units vjere social houses; 459 units were single detached; and, 173 units were duplex-type. Land Investment Trust (LIT) Certificate In September 9, 1983, an agreement between the Manila and

Makati Stock Exchanges and the Ministry of Human Settlements to trade LIT certificates was signed at Malacanang Palace. Table No. 1 presents the issues which iiad been listed and consequently traded at these two stock exchanges:
Table No. 1 No. of Shares Value
BF Balikbahay 32,674,000 P32,674,000.00 Pasig Kapitolyo 2,304,000 2,304,000.00 Mintcor Southrow 2,400,000 2,400,000.00 TOTAL 37,378,000 P37,373,000.00
The I-IFC, through its change in marketing strategy by grant-ing cash guarantee instead of bond guarantee to insured lending institutions, widened the client-coverage. Thru this scheme, resources for housing were mobilized, swelling the housing units available to low and middle income fa-milies.

- 39 -
Table No. 2 Financial Highlights
1980 - 1983 (amount in millions)
1980 1981 1982 1983 Resources P 70.4 P100.3 PI 71.0 P243.3 Gross Revenue 5.9 14.4 30.6 50.6 Expenses 5.89 7.5 11.0 17.2 Net Income (Loss) 0.01 6.9 19.6 33.4 Current Assets 62.8 4.4 19.8 51.0 Current Liabilities 0.6 5.0 1.6 40.7 Total Liabilities 3.4 9.0 10.0 52.4 Total Equity 66.9 91.4 161.0 191 .0
Financial Review Results of Operations
Operating inccme in 1983 amounted to P33.4 million, from P0.01 million in 1980, P6.9 million in 1981, and P19.6 million in 1982.
Gross revenue rose from P50.6 million in 1983, fran P5.9 million in 1980, P14.4 million in 1981, and P30.6 million in 1982.
Total operating expenses expanded to P17.2 million in 1983, frcm P5.9 million in 1980, P7.5 million in 1981, and P11.0 mil-lien in 1982.
Financial Condition Total resources amounted to P242.3 million in 1983, frcm
P70.4 million in 1980, P100.3 million in 1981, and PI71.0 mil-lion in 1982.
Total liabilities rose to P52.4 million in 1983, frcm P3.4 million in 1980, P9.0 million in 1981, and P10.0 million in 1982.

- 90 -
Total equity rose to P191.0 million in 1983, frcn P66.9 million in 1980, P91.4 million in 1981, and P161.0 million in 1982. Table No. 2 above shows the Financial Highlights of HFC frcm 1980 to 1983. Tools Used To Measure The Over-All Financial^pT-Formp^^a n f m r
For the study of this corporation, only three tools will be used in analyzing its financial performance frcm 1980 to 1983. These are: (1) financial ratios; (2) cannon size analysis of financial statements; and, (3) index analysis of financial state-ments. Financial Ratios
Test of profitability and test of liquidity were utilized in analyzing the financial performance of HFC from 1980 to 1983. The ratios and percentages are shown in Table Nos. 3 to 11 repre-senting results of operations and financial condition. Results of Operations Profit Ratio
Table No. 3 shows the Profit Ratio fran 1980 to 1983 of HFC as a measure of the over-all profitability of the operations of the corporation.
Table No. 3 Profit Ratio 1980 - 1983
Calendar Year Net Income Gross Income Profitability Ratio (%)
1980 P 11,152.70 P 5,881,815.98 0.19% 1981 6,933,050.34 14,447,477.84 47.99% 1982 19,630,041.57 30,582,169.06 64.19% 1983 33,399,527.11 50,633,210.24 65.96%
As shewn in Table No. 3, the profitability of the corpora-tion rose to 65.96% from 0.19% in 1980, 47.99% in 1981, and 64.19% in 1982. These ratios indicate profitable operations from 1980 to 1983. Return on Stockholders' Investment
Table No. 4 shows the return on stockholders' equity fran

0.01% in 1930, 5.43% in 1981 and 15.39% in 1982 to 26.18% in 1983.
Table No. 4 Return^ on Stoc'rjiolders' Investment
1980 - 1983 Calendar Year Net Income Average Stock- Ratio (%)
holders' Equity
1980 1981 1982 1983
P 11,152.70 P127,572,396.50 0.01% 6,933,050.34 127,572,396.50 5.43% 19,630,041.57 .127,572,396.50 15.39% 33,399,527.11 . 127,572,396.50 26.18%
As shown in Table No. 4, the return on stockholders' equity frcrn 1980 to 1983 indicates an increasing trend. The return of the funds gradually increased due to the corresponding increase of net income during the four-year operations.
Return on Total Investraent Table No. 5 shows the return on total investment of the cor-
poration from 1980 to 1983 with an increasing trend of the return of funds invested. Fran 1980, the ratio rose to 16.48% in 1983, frcm 0.02%. This increase was brought by the corresponding and yearly increase of pre-tax inccne plus bond interest of the cor-poration fran 1980 to 1983.
Table No. 5 Return on Total Investment
1980 - 1983 Calendar Year Pre-Tax Incane Capital Plus Ratio
Plus Bond Interest Fixed Liabilities (%) 1980 1981 1982 1983
6,933,050.34 19,630,041.57 33,355,527.11
11,152.70 P 65,534,756.95 0.02% 95,351,747.71 7.27% 169,399,787.20 11.34% 202,700,455.40 16.48%
Financial Condition
Current Ratio As shown in Table Ko. 6, the corporation was very liquid in

- 92 -
1980 with a ratio of 106.42:1. This was to a very high current assets against the current liabilities wliich was quite low. This ratio decreased in 1981 to 0.89:1 and increased to 12.10:1 in 1982. In 1983, however, the corporation's liquidity reduced again to 1.26:1 in view of the abrupt increase of current liabi-lities fran PI.6 raillion in 1982 to P40.7 million in 1983.
Table No. 6 Current Patio 1980 - 1983
Calendar Year Current Assets Current Liabilities Liquidity (%}
1980 P 62,852,202.83 1981 4,455,263.75 1982 19,819,163.22 1983 51,029,772.64
P 590,594.16 4,973,557.96 1,638,130.60 40,655,615.65
106.42:1 0.39:1
12.10:1 1.26:1
With the exception of the year 1981 , the corporation was very liquid in 1980 and quite liquid in 1982 and 1983. Acid-Test Ratio
Table No. 7 shows the acid-test ratio of 106.34:1 in 1980, 0.83:1 in 1981, 12.05:1 in 1932, and 1.25:1 in 1983.
Table No. 7 Acid-Test Patio 1900 - 19S3
Calendar Year Quick Assets Current Liabilities Ratio (%} 1930 P62,304,934.24 P 590,594.16 105.34:1 1981 4,407,361.97 4,978,557.96 0.88:1 1982 19,741,486.96 1,633,130.60 12.05:1 1983 50,352,409.96 • 40,655,515.65 1.25:1
With the exception of the calendar year 1901, the corpora-tion was vary liquid in 1280 and 1S82. In 19G3, hcwever, its liquidity cropped to 1.25:1 fran 12.05:1 in 1982. In 1983, therefore, should the creditors demand for mediate pay,rent, the corporation will still be liquid by C.25 worth of im-.vscliately convertible to cash assets or PI.02 million remaining quid; assets.

- 93 -
Average Collection Period Table No. 3 shows the average collection period of the
corporation frcm 1980 to 1983 fran 2,622 days to 223 days in 1983.
Table No. 8
Average Collection Period 1980 - 1983
Calendar Year
1980 1981 1982 1983
Gross Income
P 5,881,815.98 14,447,477.34 30,582,169.06 50,633,210.24
No. of Work-ing Days 250 250 250 250
Average Daily Incctne
P 23,527.26 57,789.91 122,328.68 202,532.84
Accounts Re-ceivables
Average Daily Inccme
Days
1980 1981 1982 1983
P61,699,135.78 3,358,833.54 18,006,565.83 45,189,821 .21
P 23,527.26 57,789.91 122,328.68 202,532.84
2,622 58 147 223
The average collection period frcra 1980 to 1983 as shovm above, can be related to the credit terms offered by the corpo-ration. It shows the day's income on the books in relation to the accounts receivables which can be used in any credit policy or changes in collection of receivables. Calendar year 1980 as presented in Table No. 8 shows a very high average collection period due to a very high accounts receivable of P61.7 million in relation to the average daily income of only P23,527.26. In 1981, however, there was an abrupt reduction of the average col-lection period frcm 2,622 days to 58 days due to the improvement in collection by P58.3 million. In 1982 and 1983, the receivable of the corporation increased to P18.0 million and P45.2 million with that of 1981. However, the average daily inccme of the cor-poration correspondingly increased. Receivable to Inccme
Table No. 9 shows another way of expressing the same rela-tionship as expressed by the average collection period.

- 94 -
Table No. 9
Receivable to Incctne 1980 - 1983
Calendar Year Accounts Receivable Gross Inccme Ratio (%) 1980 P61,699,135.78 P 5,881,815.98 1,048.98% 1981 3,358,833.54 14,477,477.34 23.25% 1982 18,006,565.83 30,582,169.06 58.88% 1983 45,189,821.21 50,633,210.24 89.25%
As shown in Table No. 9, the best ratio of receivable to in-come was in the year 1981, with 23.25%. This can be related to 58 days average collection period as shown in Table No. 8. .The receivable to income ratio decreased to 89.25% in 1983, fran 1j048.98% in 1980, 23.25% in 1981 and 58.88% in 1982.
Equity Ratio Table No. 10 shows the equity ratio of the corporation of
96.14% in 1980, 95.80% in 1981, 95.06% in 1982, and 94.20% in 1983.
Table No. 10 Equity Ratio 1980 - 1983
Calendar Year Capital Capital plus Non-Current Ratio (%) Liabilities
1980 P 66,949,423.21 P 69,634,756.95 96.14% 1981 91,352,515.15 95,351,747.71 95.80% 1982 161,032,768.14 169,399,787.20 95.06% 1983 190,954,879.27 202,700,455.40 94.20%
Table No. 10 indicates the proportion of total investment that is derived fran stockholders (either directly, or indirectly as retained earnings). The equity ratio decreased by 1.94% in 1983 with that of 1980. This minimal reduction was brought about by the corresponding increases of Capital frcm 1980 to 1983 with that of the capital plus non-current liabilities.
Debt-to-Net Worth Ratio Table No. 11 shows the relationship of total debt of HFC in
relation to Net Worth from 1980 to 1983. The debt-to-net worth

ratio of the corporation rose to 0.27:1 in 19S3, frcm 0.05:1 in 1980, 0.10:1 in 1981, and 0.06:1 in 1932.
Table No. 11
Debt-to-Net Worth Ratio J 1980 - 1983
Calendar Year Total Debt Net Worth Ratio (%) 1980 P 3,427,048.24 P 66,949,423.21 0.05:1 1981 8,977,790.52 91,352,515.15 0.10:1 1982 10,005,149.66 161,032,768.14 0.06:1 1983 52,401,191.76 190,954,879.27 0.27:1
The increase of the ratio was brought about by the increase of net worth fran P66.9 million in 1980 to P190.9 million in 1983, in relation to the increase of total debt from P3.4 mil-lion in 1980 to P52.4 million in 1983. Oarroan Size Analysis
The cannon size analysis, also known as percentage analysis, of HFC fran 1980 to 1 9S3 will be discussed in accordance with the Corporation's results of operations, such as Gross Revenue, Ex-penses and Net Incctr.e (Loss) and Financial Condition, such as Resources, Current Assets, Fixed Assets, Current Liabilities, Long-term Liabilities and Equity. Results of Operation
Percentage Analysis of Income and Expense Statement of the corporation from 1 580 to 1983 are as follows:
Table No. 12 presents the percentages of the different sources of revenue to the total gross revenue.
Table No. 12 Camron Size Analysis of Gross Revenue
1930 - 1963
1380 1981 1932 1983
insurance Premium 77.51% 41.15% 41.45% ^,09% Application/Inspection Fees 7.49% 7.63% 10.03% 15.28% Interest on Trust/Time De-
posits 12.84% 50.54% 48.27% 33.38%

- 96 -Table No. 12 (cant.)
Cannon Size Analysis of_Gross Revenue 1980 - 1983
1980 1981 1982 1983 Project Management Fees Others Gain/Loss on Sale of Acquired
2.46 % 0.55% 0.16% 0.25% 0.25%
Assets ( 0.30%)( 0.04%)
Throughout the four-year period under study, income from insurance pranium remained to be a substantial portion of the total gross revenue. In 1980, 77.51% of the corporation's total income came fran insurance premium. This was due to the imple-mentation of two major policy changes which encouraged the par-ticipation of financial institutions in the mortgage guarantee program. These policy changes were: (1) shift from bond guaran-tees to cash guarantees since the former was considered an impor-tant reason for the reluctance of financial institutions in lend-ing for real estate activities; and, (2) emphasis was placed on the cash flow analysis rather than the availability of collate-rals to determine the viability of the project. Although HFC1 s income generated from insurance coverage in 1981 was lower than that of 1980, interest incane frcm investments more than tripled that of 1980, frcm 12.24% to 50.54%. In 1982, on the other hand, there was a boon in the construction industry. Insurance pre-miums amounted to 41.45% of the total gross revenue, showing a slight increase frcm 41.16% of the previous year. Although there was an increase in the peso value of interest on trust and time deposits, as a percentage of gross revenue, there was a decrease frcm 50.54% to 48.27%. HFC's performance in 1983 showed an upward trend. Incane frcm insurance premium increased from 41.45% to 45.09% and application and inspection fees increased frcm 10.03% to 16.28% of the total gross revenue. Although there was a decrease on the interest earnings on trust and time depo-sits as a percentage of the total incane, the corporation's over-all performance was improving.
Regarding the expenses of the corporation, Table No. 13 presents the percentages of the different components of the expenses to its total

Table No. 13
Canmon_size Analysis of Expenses 1930 - 1983
1980 1981 1982 1983 Personal Services 58.27% 32.10% 23.62% 21.39% Discretionary Expenses 5.51% 2.05% 1.12% 1.92% Representation Expenses 3.67% 2.38% 0.34% 0.24% Travelling Expenses 4.69% 2.54% 1.53% 1 .32% Office Rental 8.33% 3.45% 1.93% 1.38% Extraordinary Expense 4.10% 1.06% —
Business Promotions 0.25% 2.16% 1.22% 1.04% Supplies/Materials 1 .35% 0.68% 0.40% 0.52% Auditing Services 3.93% 1.50% 1.00% 0.60% Depreciation Expenses 5.18% 1.61% 0.78% 0.60% Interest Expense — — 2.26% 3.87% Others 4.53% 2.48% . 1.61% 1.16% TOTAL EXPENSES 99.31% 52.01% 35.81% 34.04%
Throughout the four-year period under study, the personal services remained the largest expense. However, there was a decreasing trend in the personal services account, as a percent-age of total gross revenue. Generally, the total expenses of the corporation from 1980 to 1933 were substantial portion of the total gross revenue. In fact, in 1930, total expenses amounted to 99.31% of the total gross revenue. Nevertheless, there was a decreasing trend in the total expenses, as a percentage of total gross revenue.
Inasmuch as the expenses of the corporation were great, HFC made an almost break-even operations in 1580, generating 0.19% of the total gross revenue. Fran the years 1981 to 1983, however, there was a great improvement in the corporation's net incane. Table No. 14 presents the net income from 1980 to 1983 as a per-centage of total gross revenue.
Table No. 14 Corxion Size Analysis_of Net Income
1980 - 1303
1980 1981 '1982 1983 Net Income 0.12% 47.99% 54.19% 65.96%
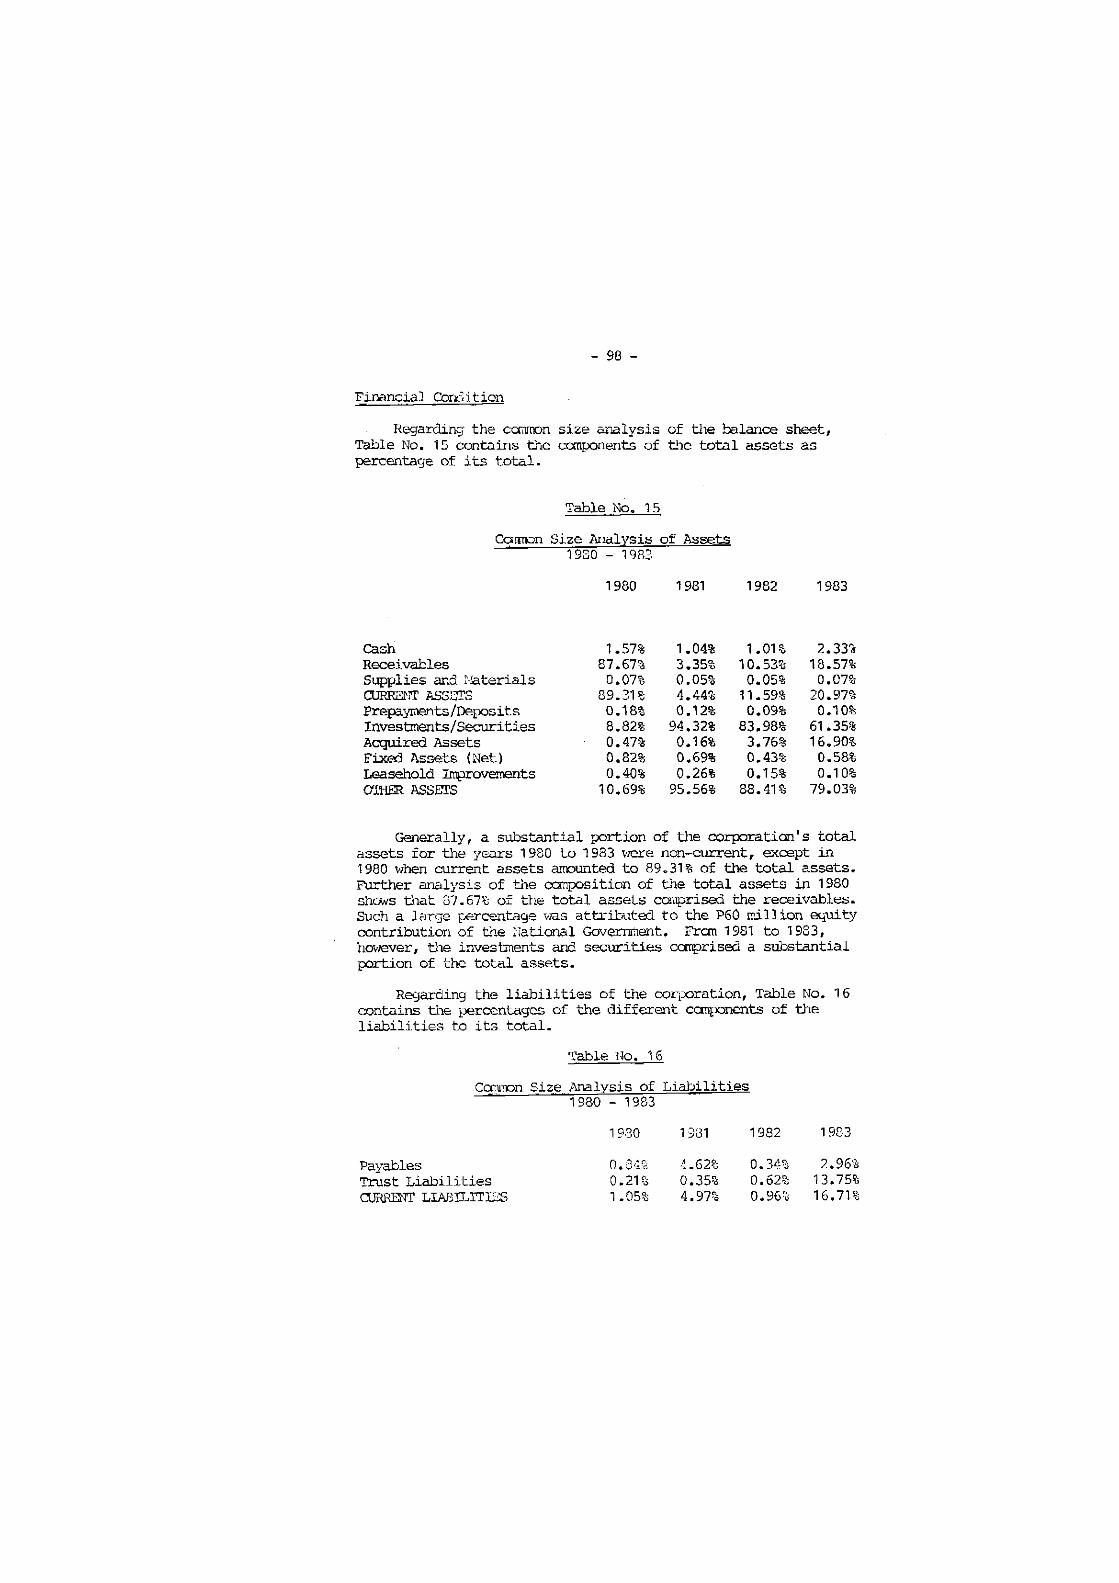
- 98 -
Financial Condition
Regarding the common size analysis of the balance sheet, Table No. 15 contains the components of the total assets as percentage of its total.
Table No. 15 CosTmon Size Analysis of Assets
1930 - 1983 1980 1981 1982 1983
Cash 1.57% 1.04% 1.01% 2.33% Receivables 87.67% 3.35% 10.53% 18.57% Supplies and Materials 0.07% 0.05% 0.05% 0.07% CURRENT ASSETS 89.31% 4.44% 11.59% 20.97% Prepayments/Deposits 0.18% 0.12% 0.09% 0.10% Investments/Securities 8.82% 94.32% 83.98% 61.35% Acquired Assets 0.47% 0.16% 3.76% 16.90% Fixed Assets (Net) 0.82% 0.69% 0.43% 0.58% Leasehold Improvements 0.40% 0.26% 0.15% 0.10% OTHER ASSETS 10.69% 95.56% 88.41% 79.03%
Generally, a substantial portion of the corporation's total assets for the years 1 980 to 1983 were non-current, except in 1980 when current assets amounted to 89.31% of the total assets. Further analysis of the composition of the total assets in 1980 shows that 37.67% of the total assets comprised the receivables. Such a large percentage was attributed to the P60 million equity contribution of the National Government. Frcm 1981 to 1933, however, the investments and securities comprised a substantial portion of the total assets.
Regarding the liabilities of the corporation, Table No. 16 contains the percentages of the different components of the liabilities to its total.
Table No. 16 Ccmmon Size Analysis of Liabilities
1980 - 1983 1930 1931 1982 1983
Payables 0.84% 4.62% 0.34% Trust Liabilities 0.21% 0.35% 0.62% CURRENT LIABILITIES 1.05% 4.97% 0.96%
2.96% 13.75% 16.71%

_ oo _
Table Mo. 16 (cont.)
Cccimon Size Analysis of Liabilities 1980 - 1983 '
1980 1981 1982 1983 Deferred Liabilities TOTAL LIABILITIES
3.82% 4.87%
3.99% 8.96%
4.89% 5.85%
4.83% 21.54%
There was a fluctuating trend in the corporation's liabili-ties, as a percentage of total assets. Nevertheless, total lia-bilities remained to be a small percentage of total assets, except in 1983 when this amounted to 21.54%.
Table No. 17 contains the specific components of the equity as percentages of the total assets.
Table No. 17
Camion Size Analysis of Equity 1980 - 1983
1980 1981 1982 1983
Capital Stock 94.14% 83.97% 78.49% 55.16% Surplus 0.99% 7.07% 15.66% 23.30% TOTAL EQUITY 95.13% 91.04% 94.15% 78.46%
Of the total equity, the capital stock, which includes the equity infusion of the National Government remained to be a large percentage of the total assets. The surplus account, on the other hand, was just a small percentage of the total assets. However, further analysis of the figures in Table Ho. 17 shows that the capital stock, as a percentage of the total assets, was decreasing throughout the four-year period while the surplus account was increasing. Index Analysis Results of Operation
Table No. 18 presents the magnitude of change of the dif-ferent components of the gross revenue fran the base year, 1980.

- 100 -
Table No. 1G
-Ind€S-;_ Analysis of Gross Revenue 1930 - 1983
1980 1981 1982 1983 Insurance Premium 100% 130.45% 278.04% 500.69% Application/Inspection Fees 100% 250.28% 696.26% 1372.14% Interest on Trust/Time
Deposits 100% 966.70% 1954.32% 2572.59% Project Management Fees Gain/Loss on Sale of
Acquired Assets 100% 15.97% 53.51% 89.16% GROSS REVENUE 100% 245.63% 519.94% 860.84%
Analysis of the figures in Table No. 18 indicates that the total gross revenue during the four-year period under study were increasing each year. In fact, the total gross revenue from 1981 to 1983 increased as compared to the 1930 figure. Further analy-sis of the figures in Table No. 18 shows that the different sources of income, except the gain/loss on sale of acquired as-sets, increased each year.
Regarding the expenses of the corporation, Table No. 19 shows the magnitude of change of the specific accounts.
Table No. 19 Index Analysis of Expenses
1980 - 1S '83 1980 1 QR1 _< U I 1982 1933
Personal Services 100% 135 210.76% 315.96% Discretionary Expenses 100% 91 .30% 106.02% 299.96% Representation Expenses 100% 159 .21% 47.62% 56.30% Travelling Expenses 100% 133 .08% 168.89% 241.77% Office Rental 100% 101 .90% 120.57% 142.97% Extraordinary Eicpense 100% 63 .52% — —
Business Predictions 100% 2.123 .70% 2539.30% 3588.35% Supplies/Materials 100% 123 .02% 154.06% 327.50% Auditing Services 100% 93 tzpo. • OO'o 132.02% 131.79% Interest Expenses — — — —
Depreciation Expense 100% 76 .15% 78.55% 99.91% Others 100% 134 .53% 184.88% 220.19% TOTAL EXPOSES 100% 12C • 00fj 1oS.56% 293.56%

- 101 -
The total expenses of the corporation from 1930 to 1933 increased at an increasing trend. In 1981, total expenses in-creased to 128% as compared to the 1 980 figure due to the addi-tional personnel. In 1982, the total expenses also increased but at a lesser magnitude than the increases in the total income. Finally, the total expenses in 1933 increased to 293.56% as compared to the 1980 figure.
The magnitude of change in the gross revenue and total expenses resulted to a higher net income as compared with the 1980 figure. Table No. 20 contains the percentage increase in the net income frcm 1980.
Table No. 20 Index Analysis of Net Income
1980 - 1983 1980 1981 1982 1983
Net Income 100% 62614.77% 176011.56% 299474.81%
Table No. 20 indicates that the net income frcm 1981 to 1983 increased tremendously as compared to the 1980 figure. This could primarily be attributed to the greater increase in gross revenue than the increase in total expenses. Financial Condition
Regarding the index analysis of the accounts in the balance sheet, Table No. 21 presents the magnitude of change of the specific assets fran the base year, 1930.
Table No. 21 Index Analysis of Assets
1980 - 1983
1980 1981 1982 1983
Cash 100% 94, .86% 156. 88% 512, .06% Receivables , 100% 5, .44% 29. 18% 73. .24% Supplies and Materials 100% 100 .39% 164. 50% 375, .62% CURRENT' ASSETS 100% 7 .09% 31. 53% 81 .19% Prepayment/Depos its 100% 100 .00% 130. 15% 192 .56% Investments/Securities 100% 1524 .86% 2314. 48% 2405, .76% Acquired Assets 100% 47 .12% 1954. 50% 12508 .74% Fixed Assets (Net) 100% 120 .62% 126. 70% 243 .21% Leasehold Improvements 100% 91 .66% 89. 19% 82 .64% OTHER ASSETS 100% 1274 .21% 2009. ,75% 2556 .08% TOTAL ASSETS 100% 142 .56% 243. .03% 345 .79%

- 102 -
Table No. 21 indicates that the total assets increased each year. A close look at these figures shows that the current assets for the years 1SS1 to 1333 decreased as compared to the 1980 figure. This could be attributed to the decrease in the accounts receivables of the corporation since the 1930 figure included, the P60 million equity contribution of the National Go-vernment. Further analysis shows that the investments increased tranendously. Likewise, the acquired assets increased substan-tially as catipared to the 1980 figure, except in 1981 when there was a decrease by 52.38%.
Table No. 22 shows the magnitude of change of the various components of the liabilities.
Table No. 22
Index _Analysis of Liabilities 1980 - 1983
1980 1981 1982 1983
Payables 100% 784 .02% 98 .49% 1218 .40% Trust Liabilities 100% 100 .00% 303 .42% 9610 .00% CURRENT LIABILITIES 100% 671 220 .86% 5481 .30% Deferred Liabilities 100% 148 .93% 311 .58% 437 .40% TOTAL LIABILITIES 100% 261 .97% 291 .95% 1529 .05%
Total liabilities for the years 1981 to 1983 increased as compared to.the 1930 figure. A close look at the figures in Table Mo. 22 shows that trie accounts payable in 1981 increased to 784.02% while the deferred liabilities increased to just 148.93%. In 1932, the accounts payable was only 98.49% of the 1980 figure but the trust account increased to 303.42% and the deferred liabilities increased to 311.34%. The accounts payable in 1983 increased to the tuna of 1,213.40% of the 1930 figure while the trust account increased further to 9,610%. Deferred liabilities, likewise, increased to 437.40%.
Table No. 23 shows the magnitude of change of the various components of the Government Equity.
Table No. 23 Index Analysis of Equity
1900 - 1933 1930 19 SI 1932 1933 100% 127.17% 202.64% 202.54% 100% 1015.43% 3329.25% 8107.33% 100% 136.45% 240.53% 235.22%
Capital Surplus TOTAL EQUITY

- 103 -
Analysis of the figures in Table No. 23 indicates that the total equity increased at a fluctuating trend. A close look at these figures shows that the paid-in capital in 1981, reflecting the National Government's equity contribution increased to 127.14% of the 1980 figure while the surplus account registered an increase of 1,015.48%. In 1982, paid-in capital increased to 202.64% of the 1980 figure while the surplus account increased to 3,829.26%. As in the previous years, paid-in capital in 1983 amounted to 202.64% of the 1930 figure. The surplus account increased to 8,107.33%.
Sur.Tnary
The financial operations of Heme Financing Corporation for the four-year period under review were generally sound in spite the abrupt decrease of trie current ratio and acid-test ratio in 1981 by 105.53% and 105.46% respectively. 1981 showed a below, par performance due to the increase of current liabilities in re-lation to the current assets.
Over-all performance of the corporation, however, for four years was favorable. Shown in Table No. 24 is the Summary of the Financial Performance of HFC frcm 1980 to 1933.
Table No. 24
Summary of Financial Performance 1980 - 1983
1930 1981 1932 1983 Results of ©Derations
Profit Ratio 0.19% 47.99% 64.13% 65.96% Return on Stockholders' Equity- 0.01% 5.43% 15.39% 26.13% Return on Total'Investment 0.02% 7.27% 11.53% 16.43%
Financial Condition Current Ratio 106.42:1 0.09:1 12.10:1 1 .26:1 Acid-test Ratio 106.34:1 0.88:1 12.05:1 1.25:1 Average Collection
Period (days) 2,622 53 147 223 Receivable to Incooe 1 ,048.98% 23.25% 5S. '6G-o 69.25% Equity Ratio 96.14% 95.80% 95.06% 94.20% Debt-to-Ket Worth Patio 0.05:1 10.00:1 0.06:1 0.27:1

- 105 -
1COA Audit Report, 1982. 2Ibid.
"Republic Act 580. T3FC Charter, "'ibid. DIbid. ^Ibid. 8Ibid. ^Ibid.
Minutes of i-iancom Meetings. 11OOA Audit Report, 13S3. 12 Interview with Corazon Corpuz, Assistant Division Chief,
Performance Appraisal Division, October, 1934. 13 Interviev; with Albert Euenviaje, Senior Vice-President, Spe-
cial Projects Group, May, 1934. 14.. , i'iinuTies of Annual Planning Session, 19S3. 15 Interview with Feliciano Gacis, Corplanner/Consultant,
Oo l-O.ogjt i 1 9 0 • 1 interview with Juan Redoble, Assistant Vice-President, Fi-
nance Depart;vent, October, 1934. 17 Project Status Analysis, 1933. 13 Interviev; with Corazon Corpuz. 19 . . J-UJLCI . 20 Ibid.
71 ~ Internal Control I valuation, 1932.

- 106 -
FARM SYSTEMS DEVELOPMENT CORPORATION
Corporate Overview The goal of the National Government to increase food produc-
tion can not be achieved without the cooperation of the farmers. To attain this objective, the Farm Systems Development Corpora-tion (FSDC) was created under Presidential Decree No. 681. Its main purpose is to promote the organization of and assist all irrigation associations and farm-based related activities. Ini-tially attached to the Office of the President, FSDC is presently attached to the Ministry of Public Works, Transportation and Conrnunication, a change effected by Presidential Decree No. 1595. The same amendatory decree expanded its functions and encompasses activities designed to improve methods and develop entrepreneu-rial capabilities in the areas of resource managsnent, farming, fishing, forestry, agro-industrial production, processing, mar-keting, drainage, rural raterworks, and land reclamation for agricultural production.
The policy-making body of FSQC is the Board of Adminis-trators. As of 1980, it was composed of the Minister of Public Works, Transportation and Commu; dcation, the President of the Development Academy of the Philippines, the Executive Director of the National Food and Agricultural Ccmmission, the Administrators of the National Irrigation Authority, the National Grains Autho-rity, the National Electrification Authority, and the Administra-tor of FSDC as ex-officio member.4 This same set up exists up to the present.
In 1980, the Office of the Administrator had the following departments under his supervision: 1) Office of the Depjuty Admi-nistrator; 2) Corporate Legal Office; 3) Internal Audit Services; 4) Security Affairs Service; 5) Management Services Department; 6) Research and Development Department; 7) Supply Management Office; 8) Programs Development Department; 9) Special Projects Department; 10) Engineering Department; 12) Finance Department; and, 13) Area Offices.
Characteristics of the Organization Organizations may either be centralized or decentralized in
structure. Nevertheless, the formal structure may be "altered" by the leadership style of the head of the organization. Thus, lines of command may be defined in the organizational chart, specifying the flow of authority, but practices may differ in real situations in the corporation. Such is the case in FSDC.
All departments, including all Area Offices, are directly

- 107 -
supervised by the Administrator. At first glance, it would seem that authority is centralized. However, in practice, operations are decentralized. The Deputy Administrator supervises financial matters rather than the programs. Consequently, he has a dis-tinct set of functions compared with this counterparts in similar organizations.
Changes in Organization The 1980 structure, approved by the Ministry of Budget, was
the same structure in 1981. That same year marked a transition period for FSDC. Under Presidential Decree No. 1595, it was granted expanded powers to include activities aside from rice farming.^ Change did not core abruptly, however. Task forces, which were an acceptable mechanism in the corporation, were created to facilitate smooth transition. • Despite the major chan-ges, it is possible to trace the evolution of the 1983 structure frcm 1980. The following is a discussion of the various depart-ments in 1980.
Corporate Legal Office (CLO) The Corporate Legal Office provides legal services not only
to the Central Office but also to the Integrated Services Asso-ciations (ISAs) and the Kalipunan ng mga ISAs (KAISA). This department ascertains the legality of documents and proceedings both in the Central Office and ISAs and KAISAs. It also hears a well as files cases involving the corporation. Foreign loan contracts including procurement of equipment from foreign source are reviewed by it.
Security AffairsService (SAS) The SAS was created in compliance with Presidential Decree
No. 51 which requires all government corporations to have a security unit that will take charge of the security of the emplc yees, "installations, classified documents, and materials."7
Internal Audit Service (IAS) The Internal Audit Service has been part of FSDC ever since
the corporation was created in 1975. This unit pre-audits all disbursements. As per the 1980 organization manual, the follow-ing transactions are not being pre-audited by the Conmission on Audit:
"1. payment for consumable items below P10,000 2. payment for non-consumable items and services
below P20,000

- 108 -
3. partial payments for development projects (construction, irrigation systems, etc.) ex-cept the first and last payment
4. payment to government agencies."® Initially, the IAS pre-audited the above-mentioned transactions as well as the disbursements of the Area Offices. However, undei the present CQA policies, most transactions are post-audited.9 This is performed by the Field Service Division. Loan releases to ISAs and KAISAs are also audited by the IAS. it is also involved in performance appraisal of departments to ensure effi-ciency and effectiveness. It is likewise assessing areas requir-ing improvement, which, are brought out during Regular Management Caimittee meetings. This department did not undergo any change during the four-year period covered by the survey. Supply Management Office (SMO)
The Supply Management Office provides the equipment and sup-plies requirements of the Central Office, Area Offices, and projects. Likewise, it is responsible for transporting and ware-housing equipment.
This department has always functioned as an independent unit except during the year 1 982 when it was transferred as a division of the Management Services Department.10 This change was not mad because of similarity of functions, but due to the fact that the Director of the Management Services Department was also concur-rent Head of the Supply Management Office. An assistant director was thus created so that an officer can closely supervise the office. In 1983, the Supply Management Office regained its position as a separate unit.
Management Services Department (MSP) The Management Services Department is a very important coor-
dinating arm of the corporation because it serves as a link between management ana other units, FSDC and Area Offices, and even FSDC with the external environment, especially foreign-lending institutions. The MSD formulates planning guidelines which are the basis for the preparation of work programs and budgets of all departments and Area Offices. By using the work programs, the MSD is able to monitor the corporation's perfor-mance. Systems evaluation and improvement is continually being undertaken by the MSD in coordination with other units.

- 109. -
Change in Structure
The Management Services Department has undergone sane inter-nal changes over the years although its basic functions have remained the same. Xn 1980, the divisions under it were the following: 1) Corplan; 2) Cotrmunication Services; 3) Corporate Information Systems; 4) Operations Control. MSD was designated as a task force on the Modified Barangay Irrigators' Services Association (EISA) Program in 1981 while retaining the same set-up. In 1982, a substantial reorganization of departments was undertaken. The Supply Management Office was put under MSD while the corporate planning function was transferred to the newly created Plans and Research Department. The other division under the MSD was the Management Information and Systems. Finally, in 1983, the Plans and Research Department was abolished and merged with the Management Services Department. The new divisions undei it are the following: 1) Corplan; 2) Systems Development Divi-sion; 3) Project Monitoring and Evaluation Division; 4) Research and Development; and, 5) Conmunication and Training Services.
Administrative Department (AD) This department was vested with the responsibility of provi-
ding administrative support services to the different corporate units. Fran 1980 up to 1981, this task was carried out through its two divisions, namely: 1 ) Human Resources Division; and, 2) General Services. Finance Department (FD)
The Finance Department handled the sourcing, obtaining, dis-bursing, and protecting corporate resources. Its activities did not only revolve around in-house financial needs, but also pro-ject financing. It functioned as project team for loans in 1981. Its function was to study FSDC's loan management system with the aim of formulating a new one. Finance and Administrative Department (FRA1
Fran 1980 to 1981, Finance and Administrative operated as two different units. In 1982, the two were merged since both performed support functions. The divisions under the department are the following: 1) Human Resources Division; 2) General Ser-vices; 3) Cash Management; 4) Finance and Loan Management; and, 5) Corporate Accounting Division. This set-up existed until 1983.

- 110 -
Special Projects Department (SPD) The Special Projects Department was one of the four operating
departments in 1980 and 1981. As the name implies, the SPD controlled the projects which were not part of the regular prog-ram of the corporation. As of 1980, the SPD was in charge of the Small Water Impounding Projects (SWIP) and the Samar Integrated Rural Development Project (SIRDP). Ttie SPD was abolished in 1982. Its tasks were transferred into the Lowland Area Directo-rate in 1982 and to the ISA Development Department in 1983.
Research and Development Department (R and D) In the years 1 980 and 1981, the Research and Development
Department was considered as an operating department. It was responsible for preparing new technologies needed for the deve-lopment of farm systems. Not only did it "package" the technolo-gy, but it also disseminated any new findings to the departments. R and D, Engineering Department, Special Projects Department, and Programs Development Department were closely related but delinea-tion of functions were defined in the manual in the following manner:
1. The Special Projects Department concentrated on ex-ternal while the Research and Development Department handled internal projects.
2. The Engineering Department dealt with technical as-pects of FSDC1s operations, while the Research and Development Department provided inputs on new tech-nologies to be integrated into the program of FSDC.
3. Research and Development Department was clearly tech-nology-oriented while the Programs Development De-partment was in charge of institutional development.
Programs Development Department (PEP) The primary concern of the Programs Development Department
was institutional development with the farmers and fishermen as beneficiaries through the Integrated Services Associations (ISAs) and Kalipunan ng mga ISAs (KAISAS). In 1981, the PDD was as-signed as the task force on the KAISAs. This was abolished in the 1982 reorganization.
Engineering Department (ED) The Engineering Department provided technical support and
assistance to FSDC's Area Offices. It was actively involved in the review of designs and feasibility studies to ensure that

before the project merits final approval by the Board of Adminis-trators, it should conform to FSDC's standards and requirements. Inspection and testing of equipment were also the responsibili-ties of this department. In 1981, it was assigned to conduct research on adaptive farm technology and development. In 1982, it suffered the same fate as the rest of the operating depart-ments of the 1980-1981 structures.
Change in Thrust The year 1982 was a turning point for FSDC because it launch-
ed its new programs in line with Presidential Decree No. 1595, dated June 11, 1978, which expanded FSDC's coverage into more diversified areas other than rice fanning.14 The 1981 organiza-tion was then deemed inadequate to fully respond to the corpora-tion's thrusts. Some of the departments in 1981 were retained because those were mainly support departments and the change in thrusts would only require additional effort fran the personnel and seme changes in systems. On the other hand, those directly involved in the projects were restructured to accorrmodate the widened scope of the corporation's programs. Taking the place of Research and Development, Programs Development, and Engineering Departments were new departments which perform most of the origi-nal functions of the abolished departments including new func-tions in line with Presidential Decree No. 1595.
Planning: ara3 Research Department (PRDJ The Planning and Research Department performed research and
corporate planning functions which was handled by one division. The other division was the Market Development Division which assisted Kalipunan ng mga ISAs (KAISAs) on finding markets for products of KAISA's enterprises. This department was abolished in 1983.
Institutional Development Department (IDD) The Institutional Development Department was originally the
Programs Development Department. It was tasked with training and development of leaders of the KAISA. It existed only in 1982. Area Directorates
A major change in the 1982 structure was the establishment of the three Area Directorates which concentrated on project coordination. These operating units were restructured with the 1983 reorganization.

- 112 -
lowland Area Development Directorate
The Lowland Area Development Directorate concerned itself with irrigation and other types of assistance to rice farmers, but also with the development of other enterprises like agro-livestock and cottage industries.
Upland Area Development Directorate The Upland Area Development Directorate focused on the Tree
Resources for Energy and Enterprise (TREE) project which harnes-sed the potentials of tree farmers to achieve the same degree of success as the corporation did with its lowland projects.
Coastal Area Development Directorate
The Coastal Area Development Directorate also aimed to pene-trate the fishing villages and organize the fishermen into Inte-grated Services Associations (ISAs) and Kalipunan ng mga ISAs (KAISAs) as FSDC did in its other projects. Financial Assistance for fishing gear provided the entry point for their projects
Changes in 1983 The year 1983 brought with it more changes in structure.*
The three area directorates were restructured into two depart-ments which were classified not according to area (i.e., lowland, upland, coastal) but according to the two major classification of associations which served as channels for their programs. These are the Integrated Services Associations (ISAs) and the Kalipunan ng mga ISAs (KAISAs). This structure evolved because of the need to centralize functions and avoid the duplication among the three directorates which all performed similar tasks in a different manner.1J
KAISA Development Department (KDD)
The KAISA Development Department is active in after "harvest" operations for the lowland, upland, and coastal projects. Through the KAISA, farmers can find suitable markets for their goods while also engaging in other related enterprises. The KDD is primarily involved in Institutional Development. Actually, the KDD is a new name for the former Institutional Development Department.
ISA Development Department (HDD)
It is the ISA Development Department through which the bene-

- 113 -
ficiaries obtains the specialized services pertaining to planning and evaluation, technical, equipment and other forms of project assistance. The Lowland, Coastal, and Upland Enterprises Deve-lopment Divisions are centralized under this department. Area Offices
The Area Office is a miniature FSDC located in the provincial regions nationwide. Actual implementation of projects is handled by the Area Offices coordinating with all ISAs and KAISAs falling within the authorized boundaries. Area Offices are structured in the same manner as the Central Office. Each Area Office has the following units: 1) Internal Audit Service; 2) Management Ser-vices Division; 3) Enterprise Development Division; 4) Finance and Administrative Division; 5) Engineering Services Division; and 6) 00A (only for the bigger Area Offices). There are six Area Offices, one for every two regions.

- 114 -
Aspccts of Control and Coordination The following is a discussion of certain aspects of control
systems, the roles of various units in controls and the parti-cipation of the chief executive officer in coordination and control. Task Forces and Committees
Procurement Committee FSDC is a relatively young organization; the median age of its personnel is thirty. The Administrator is also compara-tively young and a strong believer in participative management. In the past four years, the corporation underwent organiza-tional changes; however, a' vital mechanism for its dynamism is the task forces and caimittees which fulfill functions requiring speedy implementation.
In 1931, five task forces were formed to facilitate the corporate transition with'the expanded functions embodied in the amendatory decree. These are the following: Task Force on Modified Barangay Integrated Services Association (BISA) Program Approach (Farm Family Approach), Task Force on Tree Resources for Energy and Enterprise (TTJIE), and the Task Force on Training and Canr.iunication. The membership of the task forces cut across departmental lines and brings toge-ther expertise necessary to complete specific tas3:s. In addition to task forces, cammittees were likewise created to carry out essential functions. One example is the Pro-curement Cbmmittee which handles the acquisition of equip-ment, materials and suppli.es involving amounts greater than P5,000. This is chaired hy the Head of the Corporate Legal Office, and the members are representatives from the Finance and Administrative Department, Supply Managetrient Office, Internal Audit Service, and the Engineering Department. The member from the Engineering Department stayer;, on with the Committee even after the abolition of the department. This Committee existed as early as 1975 when FSDC was created.
Management Committee The Management Committee is composed of all heads of offices and departments. It handles matters affecting tlie opera-tions of the corporation, such as analysing anc evolving solutions 'l:cr prchta'is ascertain!! resource retirements v/hich offices . • _/ nee" for the various projects v iich are undertaken in the provinces. In E. sense, it functions as mi informal corplan, monitoring and evaluation group.

- 115 -
During the presentation of the progress of programs and problems attendant to their implementation, its members elicit feedback which serve as inputs to the Corporate plan. Consequently, it is an aid to the formulation of the plan-ning and budgeting guidelines, thereby assuring a realistic perception of the projects. Likewise during the meetings, the needs for systems improve-ment surface thereby alerting the director of the Manage-ment Services Department to areas which must be looked into. The Deputy Administrator is the Chairman of the Committee; however, it is temporarily headed by the Director of the Management Services Department because the chairman is out of the country. Another important role of the Management Conmittee is to serve as a conduit for information. Its meetings which are held every Monday, occasionally coincide with the Board meetings. Update on new policies or revisions of existing ones are discussed during these meetings. This practice is consistent with one of the Twelve General Directives in the corporation which states that all employees should knew the developments in the corporation.*' Executive Council
The Executive Council is composed of senior directors as well as other officers who are full time members. It con-tributes to idea generation and consultancy servicesJ® While the Management Corrnittee concerns itself with policy issues and existing projects, the Executive Council involves itself in conceptualizing projects which are germane to FSDC's objectives. As a Think Tank, it conceptualized the Hyacinth Products Enterprise Resource Development Corpora-tion (HYPER). One of its members considers the Administra-tor as a major source of new ideas and innovations, which the Council is tasked to flesh out as projects. It has 11 members, 2 are directors, 5 are division heads, 2 area managers, and 2 senior program officers. 19 Area Managers' Workshop Every quarter, all area managers and directors meet in the Central Office of FSDC. As a matter of practice, a three-day workshop is held where performance on projects, as well as problems are discussed and resolved. Targets are reas-sessed and compared with accomplishments. Reasons for short-falls are identified. Programs are prioritized for the succeeding quarter. An assessment of the environment is

- 116 -
also nacie. For instance, in one workshop, the participants discussed whether FSDC projects were still vzithin the 5-point program of the Government. ® To a large extent, the Area Managers' Workshop is a fomni which fulfills the functions of planning, evaluation and monitoring during the discussions and deliberations on pro-jects, accomplishments, targets, shortfalls and revisions of targets. However, elevation of problens is, not delayed by reason of the quarterly schedule of the workshop. Since a voice-to-voice radio system is available in the corporation, iGFctediate consultation and advice can be elicited by area managers and field officers.^
Planning arri Monitoring: Management Services Department Planning and Researh On the third quarter of the year, the Management Services Department formulates planning guidelines which are distri-buted to all departments. This task is undertaken by the Corplan division which also prepares the Environmental As-sessment Report. This contains a scan of developments in the country and other sectors of the government. It also identifies opportunities to which FSDC can respond with innovations. In one instance, it reviewed and assessed the changes within and expansion of the Ministry of Agriculture and its implications to the operations of the corporation.^^
The Corplan division is also responsible for gathering data and studies on local sources for financing. One of those identified applies to FSDC's rice trading activities through its MAISAs. These are: ventures capital, ccr.imercial banks and the quedans of trie National Food Authority.
It is interesting to note that critical research outputs are initiated by this division. The comprehensiveness of envi-ronmental scan and specific studies applicable to FSQC's needs enhances its capability to innovate and respond to changes.23
Monitoring and Information System The departments submit monthly and quarterly accomplishment reports to tiie Project jonitoring and Evaluation Division (PMED) which compiles them and analyzes the accomplishments vis-a-vis their targets. The information is compiled and updated in tlie central data bases of the corporation. Sum-maries of the accomplishments with analysis fire periodically given to the Board and to the Administrator tlirough t uarter-

- 117 -
ly Poarcl of Adr:iiiistr:itcrs P.cport and the nonthly Integrated Corporate Performance Assessment Report. In addition to these- activities, the Project Ilanayement and Information System {?: 23) v;as jointly developed by PI DID an;: tlie Systems Development Division (SDD); the former providing the data base. On the other hand, the SDD develops the systems and procedures for the organization. In keeping with the participative management style pervading in FSDC, other departments are encouraged to initiate changes in the systems, where such modifications are warranted by the re-quirements of each department. Trie two major on-going programs of the SDD are the computerization of the data bases and the general ledger system.
Sane of the manuals which are used by the corporation are: Auditing ana Accounting Manual, the Coastal Area Enterprise (CAPS), Mountainside Development Program (MODEL) and the Barangay Integrated Services .Association (3ISA) Program. Both tile FSDC Policies and Procedures Manual and the Project Management Information Systems Manual are being updated. These manuals were developed, by the Systems Development Division (SDD) in coordination with the operating units.
To recapitulate, planning and monitoring- in FSDC are a continuing and joint undertaking cf the Administrator and the' ranagement team. This may he described as a "toa;n effort of the Ifcurcxgeraarit and the irrplcnGT-tors". The processes which brought about a concerted and participative system of planning anc! monitoring can be attributed to the style of leadership of the .dnistrator and the interactions among the nanagencnt tea:"":.
Budgeting
The budgeting activity, like all activities in "d* <\, involve all departments resulting in a financial plan that is accepted by key officerc.
An aid to the forrrulation of depart" icntal budgets is the budgeting guidelines vdiich are ... y dy the Finance and Ijoan Jismgement Division (FiAD) of the Finance one! Administrative Department (FAD).
Since all disbursements are revie-ted by FU-D, monitoring of expanses becomes easy. On the : ; r.i: of this, vnriimcc analysis is done. deathly and. quarter ly manage: reports -* r\ rixltte-c.
map redout dor n • • • n . o:: the :,u'"'get, '\.v .- net justi-fications are presented and found ao:xg.t:.lu.e, ;md for as long as savings from other departments are available. As coon as the

- 121 -
need for reprogramming of the budget arises, a memorandum request with justifications is prepared by the department. This is evaluated by the FLMD and presented to the Administrator for his consideration and decision.
Internal Audit The Internal Audit Service (IAS) has been a part of FSDC's
organizational structure ever since the establishment of the corporation in 1975. To guide its staff in audit work, three manuals are used; these are: the Field Examiner's Manual, Audi-ting Manual on Disbursements and the Cash Elimination Manual. These manuals were all made by the Internal Audit Staff. Its emphasis is on financial audit.
In coordination with the representatives of the Commission on Audit, the Finance and Administrative Department and the Supply Management Office, it conducts an annual inventory of property. Cash examination and pre-audit of dis-bursements are also performed, a function which had earlier been undertaken by the 00A personnel. As a contribution to systems development, IAS participates in formulating recommendations with the Systems Development Division. Cortnision on Audit (COA)
In 1982, COA evaluated the internal control system of FSDC. Some of the recommendations made by OOA include strengthening of the aspects of controls on collection, disbursements, supplies and materials, and records inventory of fixed assets, A salient recctrcnendation refers to' the functions of the Internal Audit Service which , according to COA, should not be limited to the audit of disbursements, invoice, and loan releases, and review of accounting records and inspection of deliveries. It emphasized that the audit program must also be centered on the review appraisal on a continuing basis of the functions provided in the 1982 Organizational Plan.
The 1933 post-evaluation of COA of the internal control system of FSDC revealed that a substantial number of the recom-mendations of C30A were implemented as in the reduction of the operational fund from P70,000 to P35rC00 with more frequent replenishment and timely recording of transactions. The scope of audit of the Internal Control Service was found to extend to the review and evaluation of the internal control system of this corporation, audit of FSDC's lean beneficiaries such as KAISAS and ISAs, cash examination of Special Disbursing Officers, inspection of deliveries and sane duties assigned by the Admi-nistrator.

- 119 -
A significant development in 1903 was the decision of the OOA to withdraw the resident auditor from FSDC, which is a re-flection of the capability of the corporation to itself.
The Administrator: Chief Executive Officer ard Policy-^ker One of the most interesting and significant insight which
one can derive from a study of FSDC is the benefits of a partici-pative style of leadership. The present Administrator is energe-tic, dynamic and innovative. His strong commitment to the insti-tution and its clients, as well as deep concern for the growth of professionalism in the corporation have in nore ways than one produced a corps of officers whose morale is high and r./hose service orientation is enviable.
Manifesting a strong faith and confidence in his officers, he hardly'presides formally in meetings. Pie merely sets the tone, allows his officers free discussions and encourages the exchange of ideas. He makes decisions after all ideas have been sifted, analyzed and tested.^^
The institutionalization of the value of commitment to ser-vice by FSDC personnel begins during recruitment. Kewly-hired employees are required to attend orientation sessions on the goals, objectives, policies and programs of FSDC and examinations are given to ensure that these were clearly understood.^
The process does not end with the examination. Through field visits, the employees meet the client-farmer and fisher-men. Initially, the Administrator planned to bring all personnel on scheduled visits to the farras and projects, so that they can have direct experience with the conditions in the areas which the corporation serves. However, because of budgetary constraints, this plan was deferred.
In the main office, the presence of the Administrator is felt, even if he is on field visit or physically elsewhere. Every floor of the building which houses FSDC has a poster which lists the 12 General Directives stating the following:
"1. All FSDC personnel must completely understand the FSDC program.
2. All personnel especially those in the area of pro-vincial offices must gain an understanding of local situations and develop an appreciation of the values of the local population.
3. Discussion and criticisri should !?c encouraged ir. the organization but should be confined within the orga-nization.

- 1 -
4. Decisions should be based not .only on what the majo-rity feels but on what is essentially correct and proper.
5. Decisions made at the level of organization must be carried out without delay and hesitation.
6. Directives from higher levels of authority must be immediately communicated to lower levels in the organization.
7. t?here decisions or directions are to be carried out, sufficient time should be provided for inplementors to determine the best way to carry out the decision.
8. Competence of everyone should be continuously deve-loped.
9. A positive attitude is necessary for effective per-formance of our work.
10. All efforts and resources must be concentrated on FSDC's objective to accelerate rural development.
11. Self-reliance must be developed. 12. Abuse of authority is obnoxious to the principles
to which FSDC adheres." To enhance and cncourage ccriTiitment to these directives, a
representative from a pre-designatec division chooses one frcm the 12 General Directives and speaks cn what it means to him. This is done before the flag cerafiony and retreat held on Mondays and Fridays, respectively.. This unique exercise has produced a strong sense of unity and comnitrr-ent a iong the corporate person-nel.

- 121 -
OPERATIONAL HIGHLIGHTS
Measure of Performance For FSDC, the ultimate indicator of the achievement of the
corporate program objective is the self-reliance of the farmers. This encompasses the farmers farm productivity, ability to manage the ISAs and the capacity to meet financial obligation. This can be achieved thru the ISAs where the farmers are involved in various activities such as construction and maintenance of irri-gation system and the adoption of new farm technologies and innovations in the management of farm enterprises, among others. Eventually, FSDC hopes that the farmers will be able to provide for their own needs specifically that relating to farming re-quirements and credit facilities. However, it is very difficult to attain self-reliance since there are external factors affect-ing the self-reliance of the farmers and the effectiveness of the corporation. Goals and Targets
The Corplan Division, under the Management Services De-partment, issues planning guidelines which are based on direc-tions and thrusts for the caning years. But the specific goals and targets of the various operating units are the result of the combined efforts of the Area Offices and the Central Office units. The Finance and Loan Management Division (FLMD) deter-mines the financial requirements of the work program and compares these to the financial resources of the corporation. Then, it coordinates with the Corplan Division v/hich finalizes the entire corporate's work program.
Table No. 1 presents the goals and targets of the corpora-tion from 1980 to 1983.
TABLE NO. 1 Targets
1980 1981 I. INSTITUTIONAL DEVELOPMENT
A. No. of ISAs Organized 547 385 230 B. No. of KAISAs Organized 63
II. LOWLAND AREA DEVELOPMENT A. Irrigation Development
1. Construction of Pump and Communal Irrigation Sys-tems a. No. of Projects 260 167 94 45 b. Area Coverage 13,000 10,000 10,000 5,200

- 122 -
TABLE NO. 1 (cont. )
Targets
1580 12£1 13L2 lQ?n
2. Rehabilitation and Up-grading of Puinp and Communal Irrigation Systems a. No. of Projects 222 228 201 130 b. Area Coverage 14,334 17,389 16,000 12,992
3. Gasifier Conversion a. No. of Projects — — 210 290 b. No. of Units — — 242 300
B. Adaptive Farm Technology 1. Farm Mechanization
a. No. of Projects — 100 120 60 b. No. of Units — — 371 153
2. Farm Animal a. No. of Projects — 415 49 37 b. No. of Heads — — 265 164
3. Innovation Packages — 784 4. IWUD (No. of Packages) — 857
C. Special Projects 1. SVJIP
a. No. of Projects 3 7 b. Area Coverage 429 700
2. PRIP a. No. of Projects — 12 b. Area Coverage — 1,505
3. SZRDP a. No. of Projects b. Area Coverage
4. KA33AKA a. No. of Projects — 6 b. Area Coverage — 230
III. UPLAND AREA DEVELOPMENT A. TREE Component
No. of Projects (Area Planted) __ __ 10,768 13,410
B. diarcoal Development Component (No. of Kilos)
IV. COASTAL AREA DEVELOPMENT A. ICE Plant Component
Mo. of Projects — — 7 B. FISH Capture Component — — — 14 A. LLCDP (Mo. of Cooperatives)

- 123 -
TABLE ID. 1 (cont.) Targets
1930 m i "l9R? ' iQfff VI. ENTERPRISE DEVELOPI-'IEMT
A. Establishment of KAISA Enterprise 1. Feedmill 6 6 2. Tending 3. Fabrication Shop — __ 5 4. RICE 16 5 4 5. Livestock Center — 6 3 6. Integrated Rice/Feedmill -- 6 3 7. Charcoal Production —• __ 12
Major Thrusts and Programs The following is a discussion of the thrusts and programs of
the corporation frcm 1980 to 1933.
Ever since FSDC was created, the farm systems concept is used wherein the utilization of farm resources is optimized. This was achieved through the Barangay Irrigators' Service Association (BISA) Program. Under this program, the farmer is involved in various phases of activities—institution building, construction and maintenance of irrigation systems, adoption of new farm technologies and innovations and in the management of farm enter-prises. All these were channeled through the organization of farmers called the Irrigators' Service Associations (ISAs). The provincial federations of ISAs or Kalipunan ng mga ISAs (KAISAs) are organized to prepare each ISA for a higher level throuoh self-management and economic integration. In 1980, FSDC con-centrated its efforts on lowland area development which consisted of three areas, namely: (1) irrigation development; (2) adaptive farm technology; and, (3) special projects. The irrigation deve-lopment opens the door to the BISA Program in lot/land agricultu-ral areas. It is the key to the transformation of farmlands into productive farm systems and implements viable enterprises by farm families, ISAs and KAISAs. The adaptive farm technology, on the other hand, are farming schemes introduced to ISAs to maximize farm productivity. These inputs include farm machinery and equipment, farm work animals, and innovation padtages. Finally, the special projects are multi-agency projects of the National Government wherein FSDC has been tapped to do institutional development activities. These include Philippine Rural Infra-structure Project (PRIP), Samar Integrated Rural Development Project (SIRDP), and Small Water Lmpounding Projects (SWIP).

- izk -
In 1981, the faming system was developed. The farm enter-prise development, one step of developing farm system, was intro-duced. FSDC, likewise, emphasized the enterprises as the life-blood of the farm systems. Moreover, the corporation aimed to develop and enhance the entrepreneurial skills of the fanner-member and his family that they rray transcend traditional roles to become entrepreneurs as well. The farm families of the ISAs, now the Integrated Services Association, are engaged in active production of farmlot and homelot enterprises such as livestock raising, vegetable farming, azolla culture and fish production. The BISA Program, on the other hand, was redefined as the Baran-gay Integrated Services Association Program to expand the areas of responsibility which include management, fishing, forestry, agro-industrial production, processing, marketing, drainage, rural waterworks, and land reclamation for agricultural produc-tion, aside fran farming and irrigation. These programs are part of the lowland area development program which encompasses irriga-tion developrent, adaptive farm technology, and special projects. Another special project, aside from those implemented the pre-vious year, is the Rainfed Agriculture Development Project or KABSAKA. It was also during this year when the Tree Resources for Energy and Enterprise (TREE) project was introduced. This involves energy development, reforestration, and gasifier conver-sion.
In 1982, the thrusts of the corporation were divided into three major rural sectors, namely: (1) lowland agricultural areas; (2) upland regions; and, (3) coastal and marshland areas. FSDC organizes lowland farmers, upland tillers and subsistence fishermen with their families into the ISA. And as an exercise in higher level of self-management, the KAISAs are engaged in income-generating enterprises such as ricemilling, feedrrdlling, trading and transport, livestock centers, vegetable dealership, and fabrication shops. These projects are undertaken aside fran the other various projects in the areas of lowland area development and upland area development.
Due to the economic crisis in 1SG3, the BISA Program had to limit its field operations and; thereby affecting the various programs of the ISAs, KAISAs, and trie far;:, families. The opera-tions in the lowland areas are geared towards the improvement of existing infrastructures and technical services. On the contra-ry, upland activities expanded in terms of areas covered. I lean-while, coastal activities were just piloted this year. Thus, FSDC continued to reach out to upland farmers and kaingeros with its Tree Resources for Energy and Enterprise (TREC) Program. One component of the TRdE program is the charcoal development compo-nent. This vsas converted fra.v the ipil-ipil -drees which v?ero planted about three years ago and harvested only this year.

- 125 -
These charcoals are used to power gasifier units which holds a great potential in fuelling motorized bancas, jeepneys, ice plants and ricemills, among others. With regards to small fi-shermen in coastal villages, the corporation operationalized pilot fishing projects through its Coastal Area Resources and Development (CARE) Program. One unexpected event in 1983 which altered the general mood of restraint in program operations is the appointment of Administrator Teodoro Rey, Jr. to head the Laguna Lake Development Authority (LLDA)„ Through this, FSDC drew up a money-earning venture called Program UNLAD promoting polyculture or the raising of high-value species in Laguna Lake. This program, which targets the foreign market for its fish production, will be started early 1984. Finally, another special project of FSDC is the Laguna Lake Cooperative Development Prog-ram (LLCDP) which seeks to promote the livelihood of small far-mers .
Major Acccmplishirents
Table No. 2 presents the accanplishments of the corporation vis-a-vis its targets for the years 1980 to 1983.
Table No. 2 indicates that the number of ISAs organized from 1980 to 1983 were decreasing and below the targets. This was primarily due to the fact that the organization of ISAs depended basically on the feasibility and viability of the irrigation system to be developed in an area. However, there were cases when the irrigation project was found to be technically feasible but not financially and economically viable. In this event, in spite of expenses already incurred in pre-development costs, FSDC looked for substitute projects to be undertaken. Viability, in this case, is measured in terms of the benefit-cost ratio and supported by the cost per hectare35 (for irrigation projects only). In cases when the cost per hectare of the project is still below the standard costs, the Board of Administrators normally approves this for implementation. However, in cases when the cost per hectare exceeded the price ceiling for the project, the Board of Administrators asks for additional data which may prove the project's viability. Such is the case when the benefit-cost ratio is above the allowable ratio. Sometimes, though, the ISAs had already been organized when FSDC finds out that a certain project is not financially and economically viable. In this event, the project is not pushed through in spite of the organi-zation of the ISAs. As a result, there were more ISAs than the number of irrigation projects. However, there were also cases when ISAs were organized even without undertaking an irrigation project in that area. This happens when the farmers want to avail of the services extended by the KAISAs to farm associates.3

- 126 -
Regarding the number of FAISAs organized since 1980, Table Mo. 2 shews that FSDC met its target of 63 in 1S30, organized another KAISA in 1981, and no KAISAs were organized in 1932 and 1983. This was due to the fact that FSDC was able to organize all KAISAs.
There were three projects under the lowland area develop-ment. These are: (1) construction of pump and canmunal irriga-tion system; (2) rehabilitation/upgrading of pump and canrnunal irrigation systems; and, (3) gasifier conversion. Table Mo. 2 indicates that the projects under the construction of pump and communal irrigation systems, and the gasifier conversion were below the targets while the rehabilitation and upgrading of pump and ccromunal irrigation systems were above the targets. This was primarily due to the reprograraning and prioritizing of the work program which was necessary due to the budgetary constraints and delays in budgetary releases.3® It is also worth mentioning that since its initiation in 1981, the number of gasifier conversion projects increased, thus increasing the num-ber of ISAs enjoying substantial savings in their fuel costs.
Under the adaptive farm technology development are four projects, namely: (1) farm mechanization; (2) farm animal; (3) innovation packages; and, (4) Integrated Mater Use Development (IWUD) project. Generally, there was a fluctuating trend in terais of the accomplishments in these projects. This was dijg to the budgetary constraints and delays in budgetary releases.0 Nevertheless, FSDC continued to adciress itself to maximizing ISA farm productivity.
Usually no targets were made for the special projects since these are in cooperation with the other agencies of the govern-ment. Table Mo. 2 indicates a fluctuating trend in the comple-tion of these projects. Nevertheless, all these efforts com-plement the regular activities of the EISA Program.
The TREE project, which was initiated in 1381, involves energy development, reforestation, ana gasifier conversion, among others. Table Mo. 2 indicates a fluctuating trend in trie number of TREE projects implemented. Yet, FSDC continued to strengthen its institutional development activities with the addition of more upland-baned ISAs under the TISE project. On the other hand, FSDC had just piloted a charcoal production project, a component of the TREE project, in 1982.
The Coastal Area Resources and Enterprise (CARE) development program was initially launched in 1982. It was in 1983 when"* FSDC activated pilot projects in fishing communities. To date, five ice plants ware completed and fourteen coastal ISAs benefit-ted frot: the packaged assistance under the CAMS program.

- 127 -
FSDC implemented the Laguna Lake Cooperative Development Program (LLCDP) in May 1983 following the instructions from the President. A total of sixteen cooperatives were already orga-nized.
Finally, under the enterprise development are seven pro-jects, namely: (1) feedmill; (2) tending; (3) fabrication shop; (4) RICE; (5) livestock center; (6) integrated rice/feedmill; and, (7) charcoal production. Most of these projects were implemented only in 1982. Although there was no general trend in the accomplishments of these projects due to budgetary cons-traints and delays in budgetary releases, FSDC continues to develop agriculture-based and agriculture-related enterprises.

TAStg':;;o. 2
lajop. Aco>gr,iSt£Kns 1980 1980 1930 ~ 1981 1981 1981 GO/i£ ACGCK- VSSIATXS .GOALS ACOCK- VAP.IAIKL
PLISH- (%) PLIffl- {%) rains
EJsrmnraoN&L DEVELQHSI;T A. No. of ISAs Organized E. Mo. of KAISAs Organized i/DVILAi© AREA DEVEDDRS JT A. Irrigation Development 1. Construction of Punp and Contnunal Irrigation Sys-tems a. No. of Projects b. Area Coverage
2 . Rehabilitation and Up-grading of Pizrra artd OccriTunal Irrigation Systens
• a . Mo. of Projects b. Area Coverage
3. Gasifier Conversion a . No. of Projects b. Ho. of Units
547 63
260 13,000
222 14,334
439 63
165 14,156
151 16,131
SC.26% 100,00%
63.46% 108.89%
63.02% 112.96%
385 363 1
94.29%
167 91 54.49% 10,000 6,360 53.50%
228 252 110.53% 17,389 25,237 145.13%
23
1982 1982 1982 1983 1983 1 982 GOALS ACQCfi- VARIANCE GOALS ACCOM- VARIANCE
PLISH- (%) PLISH- !°o> 57SS tEJJH
230 T73 75.22%"
94 47 50.00% 45 32 71.11% 10,000 4,363 43.63% 5,200 4,836 93.00%
201 240 119.40% 130 196 150.77% 16,000 22,425 140.16% 12,992 20,570 153.33%
210 87 41.43% 290 158 54.48% 242 106 43.80% 300 180 60.00%

TABL3HO. 2 (cont.) laJDR ACOCCTIJSHMKNTS
1S80 1930 1980 1981 1981 1991 1982 1982 1932 1D33 1333 1533 GOALS ACOCK- VARIPa-KS GOALS ACCOM- VARIANCE GOBLS ACCOM- VAKIAIKE GOALS ACCOM- VARIAMG::
PLISM- (%) PUSH- (%) PLISH- (%) PUSH- (%) METIS idNTS MzKTS f'ESJTS
I I I . UPLAMD AREA DEVELOPMENT A. TREE Ccrponent
Area Planted 3 . Charcoal Development
Opponent (ilo. of Kilos) IV. COfSTAL AFEA DEVELOP: B37T
A. ICE Plant Ccr.iponent Mo. of Projects
B. FX3II Capture Component V. CTHS3 PKOJimS
A. LLCDP of Cooperatives) vr . ensHPRisM DLVHLCKIEKT
A. Establishment of KAISA Enterprise 1. F e e & i l l 2. Tending 3. Fabrication Shop 4. RICJ 5 . Livestock tenter 6. Integrated Rice/Feedraill 7 . Charcoal Production
10,768 4 ,43? .7 41.79% 13,410 2 ,249 .8 16.78C
12
7 14 5 14 100.00-;
16
9 2 1 10 2
150.005;
16.57% 200.00S
33.33% 125.00i,

TABIE MO. 2 (cont. 1
B. Adaptive Farm Technology k 1. Fam Mechanization
a . No. of Bru}ects b. No. of Units
2 . Farm Animal a . No. of Projects b. No. of Heads
3. Innovation Packages 4. IWUD [No. of Packages)
C. Special Projects 1. SS-JIP
a . No. of Projects b. Area Coverage
2 . PRIP a. Ho. of Projects b. Area Coverage
3. SIKDP a . No. of Projects b. Area Coverage
4 . KftBSAKA a . No. of Projects b. Area Coverage
MAJOR flCCOt'PLISHMEr-res 1 9 8 0 1 9 8 0 1980 1981 19C1 1981 fooj 1985 Tqfl? Tort 75^5 Goais AOC®- vmmxx GCKS AOM- variance G® £ ACCCH- VARIANCE GOSS A S I i
S " ( P L I 5 " <%> - ^ S H - (%) PLISH- U) ; HEHTS MHMTS
33 445
206 203
100
415
784 857
50 322
50.00%
8.19% 34 248 786 100.26% 997 104.67%
120 371
49 265
20 151
87 326 533 207
16.67% 40.70%
177.55% 123.02%
60 168 37
164
21 54
12 74
298
35.00% 32.14%
32.43% 45.12%
3 429
2 240
13 2,597
17 1,451
66.67% 55.94%
7 700
12 1 ,505
6 230
1 14.28% 107.5 15.36%
11
1,435
5 1,481
15 750
91.67% 95.35%
250.00% 326.09%
1,250
14 446
4 365
9 1,558
38
2 195

- 131 -
(amount in millions)
Resources Gross Revenue Expenses Net Income (Loss) Current Assets Current Liabilities Total Liabilities Total Equity
Financial Review
Results of Operation
Table No. 17
Financial Highlights 1980 - 1983
1980 1981 P266.7 P381.8 28.7 85.0 40.1 38.9
( 11.4) 46.1 141 .5 182.7 58.1 49.4 155.3 177.2 111.4 204.5
1982 1983 P478.6 P582.0 28.9 30.4 27.3 29.6 1.6 0.8
178.3 94.4 75.1 98.2 233.4 306.8 245.1 274.7
During the calendar years 1980 to 1983, FSDC realized a net income of P46.1 million in 1981, P1.6 million in 1982 and P.8 million in 1383. The corporation, however, incurred a loss in 1980 in the amount of P11.4 million.-
Total income rose by P30.4 million, frcm P28.7 million in 1980. .Analysis of the figures indicates that the gross revenue in 1981 was almost three times higher than the revenue in 1980. This was attributed to the change in treatment of account frcm expenses related to KAISA development to the income-generating institutional development loans. However, in 1982 and 1983, the gross revenue slightly increased to P28.9 million and P30.4 mil-lion respectively. This can be partly attributed to the opera-tionalization of the set of agricultural enterprises management by the provincial-wide federation of ISAs, the Kalipunan ng mga ISAs or KAISA as several KAISA run enterprises were established.
Total expenses decreased to P29.6 million in 1983, from P40.1 million in 1980 or by 26%. The total expenses of the cor-poration for the years 1 981 to 1 903 were lower than the total expenses in 1980.

- 132 -
Financial Condition
Total assets at year-end 1983 amounted to P582.0 million, an increase of 12% over the 1980 level. Investments representing interest and non-interest loans granted to various ISAs and KAISAs and investment in shares of stock of GEMCDR, a subsidiary corporation engaged in the manufacture of gasifier equipment continued to account for an average of 46% of total assets. As shown in Table No. 4, the percentage to total assets in 1980 was 40%, 45% in 1981, 51% in 1982 and 49% in 1983.
Table No. 4 Calendar Year Percent to Total Assets (%)
1980 40% 1981 45% 1982 51% 1983 49% Total 185% Average 46%
Total liabilities increased by P306.7 million in 1983, fran P155.3 million in 1980, or by 97%. Liabilities include long-term indebtedness to domestic or foreign creditors, such as loans with USAID, Danish, German and National Irrigation Administration.
Total equity rose fran P111.4 million to P274.7 million or by 147%. The increase -was brought about by the corresponding increases in Capital Stock, Donated Surpus, Contingent Surplus and Retained Earnings. Tools Used To Measure The Over-All Performance Of FSDC
For the study of this corporation, only four tools will be used in analyzing its financial performance from 1980 to 1983. These are: (1) financial ratios; (2) canmon size analysis of financial statements; (3) index analysis of financial state-ments; and, (4) budget variance analysis. These tools are li-mited to the availability of information.
The first three tools are commonly used in analyzing most corporations. For this purpose, ho/ever, an additional tool is used to measure the cost control systems of the FSDC. The bud-get variance analysis is based on the approved budget against the actual disbursement.

- 133 -
Financial Ratios
Hie analysis of the financial ratios of FSDC was grouped in three categories, such as: tests of liquidity; test of profitabi-lity; and, market tests, that, is tests used primarily by stock-holders and bondholders. The results of operation was analyze! by the use of profit ratio, return on Stockholders' investment and return on total investment while the financial condition was analyzed by the use of current ratio, acid-test ratio, average collection period, receivable to income, debt-to-net worth ratio, and public debt to total liabilities. Under market tests catego-ry, only equity ratio was utilized, considering that other ratios were not applicable under the study.
Results of Operations
Profit Ratio Hie ratio of net income to gross income is used as a measure
of the over-all profitability of the operations of FSDC from 1980 to 1983. The profit ratio of the corporation are presented in Table No. 5.
Table No. 5
Profit Ratio 1980 - 1983
Calendar Year Net Income Gross Income Profitability Ratio (%)
1980 (PI 1,361,826) P28,749,279 (39.00%) 1981 46,038,532 85,004,832 54.00% 1982 1,524,737 28,856,848 5.28% 1983 740,378 30,356,524 2.40%
Analysis of the figures in Table No. 5 indicates that the profit ratio in 1981 abruptly increased to 54% frcm a negative ratio of 39%. This could be attributed to the expansion of the operational activities of the corporation, such as additional areas of responsibility that cover resource management, fishing, forestry, agro-industrial production, processing, marketing, drainage, rural waterworks, and land reclamation for agricultu-ral production, aside fran farming and irrigation. It was also during the year 19J31 that the change in treatment of account frcm expenses related to the KAISA development to the income-generat-ing institutional development loans was implemented. With the exception of the year 1980, the corporation has been operating profitably during the years 1981 to 1983.

- 13^ -
Return on Stockholders' Investment Stockholders' investment is taken to mean stockholders'
equity (i.e. Capital) as shown by the balance sheet, or total assets less liabilities. As shown in Table No. 6, the return on Stockholders' investment from 1980 to 1983 was used in order to determine the highest possible return of the funds and the rela-tionship of net income to the funds invested. Table No. 6 indi-cates the ratio frcm 1980 to 1983 of the Investment by consider-ing the net income in relation to the average stockholders' equity for four years.
Table No. 6 Return on Stockholders' Investment
1980 - 1983
Calendar Year Net Inccme Average Stock- Ratio (%) holders' Equity
1980 (P11,361,326) P208,937,746 ( 5.44%) 1981 46,038,532 208,937,746 22.03% 1982 1,524,737 208,937,746 0.73% 1983 740,378 208,937,746 0.35%
Return on Total Investment This ratio was used to measure the income earned by the
total permanent funds invested in FSDC. Considered were the per-manent funds consisting of stockholders' equity plus noncurrent liabilities in relation to pre-tax incane. Table No. 7 hereunder shews how well funds supplied by the stockholders' have been uti-lized frcm 1980 to 1983. It indicates also how well management of FSDC has used all the permanent funds entrusted to the corpo-ration.
Table No. 7 Return on Total Investment
1980 - 1983
Calendar Year Pre-Tax Income Capital Plus Ratio Plus Bond Interest Fixed Liabilities (%)
1980 (P11,361,826) P208,596,024 ( 5.45%) 1981 46,038,532 332,400,733 13.85% 1982 1,524,737 403,498,240 0.38% 1983 740,378 483,238,591 0.15%

- 135 -
Financial Condition Current Ratio
The current ratio was used in order to treasure the margin of safety that FSDC management maintains to allow for the inevitable unevenness in the flow of funds through the current asset and liability accounts. The current ratio of FSDC fran 1980 to 1983 are presented in Table No. 8
Table No. 8 Current Ratio 1980 - 1983
Calendar Year Current Assets Current Liabilities Liquidity (%) 1980 PI 41 ,533,026 P58,086,516 2.44:1 1981 182,708,977 49,368,923 3.70:1 1982 178,317,216 75,053,908 2.38:1 1983 94,444,748 98,195,876 0.96:1
Although the current ratios during the four-year period under study were fluctuating, the corporation in general remained liquid, except in 1983. As shown in Table No. 8, the current assets and current liabilities during the four-year period were fluctuating. It is evident that the current assets in 1 983 decreased tremendously. This was due to the change in the classification of one account, Miscellaneous Assets and Deferred Charges. Frcm 1980 to 1982, this account has been the largest canponent of the current assets. However, in 1983, this account was re-classified under another account title, Other Assets.
Acid-Test Ratio The quid-: assets, such as Cash and Receivables of FSDC was
used in measuring the extent to which liquid resources are imme-diately available to meet current obligations. Table No. 9 indi-cates the ratio of FSDC quick assets in relation to current lia-bilities.

- 136 -
Table No. 17
Acid-Test Ratio 1980 - 1983
Calendar Year Quick Assets Current Liabilities Ratio (%) 1980 P72,672,732 P58,036,516 1.25:1 1931 63,719,165 49,368,923 1.29:1 1982 64,406,944 75,053,908 0.36:1 1983 77,301,198 98,195,S76 0.73:1
Average Collection Period
Average Collection period was used in analyzing the receiva-ble of FSDC in order to relate roughly the collection period to the credit terms offered by the corporation. Table No. 10 con-tains the average daily income of the corporation in relation with Income and the number of working days. It also shows the days' sales/income on the bocks by considering the average daily income in relation to the accounts receivable.
Table Mo. 10 Average Collection Period
1980 - 1983 Calendar Year Gross Incane No. of Work- Average Daily
ing Days Income 1330 P28,749,279 250 P114,997.11 1931 35,004,332 250 340,019.32 1332 23,356,843 250 115,427.39 1333 30,356,524 250 121,426.09
Accounts Re- Average Daily - Days ceivables Income
1380 P35,552,313 PIT 4,997.11 309 1381 25,333,354 340,019.32 75 1332 37,251,449 115,427.39 323 1933 49,212,550 121,426.09 405
Table Mo. 10 shows a fluctuating collection period of the Accounts Receivable of FSDC fran 19G0 to 1933. The ratio for prior years m y indicate either significant shifts in credit po-licy or changes in FSDC's ability to collect its receivable.

- 137 -
Receivable to Income
Table No. 11 shows another way of expressing the same rela-tionship as expressed by the average collection period of FSDC. Fran 1980 to 1983, the ratios for FSDC are as follows:
Table No. 11 Receivable to_ Income
1980 - 1983 Calendar Year Accounts Receivable Gross Incone Ratio (%)
1980 P35,552,313 P28,749,279 123.66% 1981 25,338,854 85,004,832 29.81% 1982 37,251,449 28,856,848 129.09% 1983 49,212,550 30,356,524 162.12%
Equity Ratio Table No. 12 shows FSDC stockholders' equity expressed as a
percentage of stockholders' equity plus non-current liabilities.
Table No. 11 Eciuity Ratio 1980 - 1983
Calendar Year Capital Capital plus Non-Current Ratio (%) Liabilities
1980 P111,358,724 P208,596,024 53.38% 1931 204,533,554 332,400,733 61.53% 1982 245,136,872 403,498,240 60.75% 1983 274,721,832 483,238,591 56.85%
Table No. 12 shows the proportion of total investment that is derived frcm stockholders (either directly, or indirectly as retained earnings). Debt-to-Net Worth Ratio
The debt-to-net worth ratio fran 1 980 to 1983 is contained in Table No. 13

- 138 -
Table No._ 13
Debt-to-Net Worth_Ratio 1980 - 1983
Calendar Year Total Debt Net Worth Ratio (%) 1980 P155,323,816 P111,358,724 1.39:1 1981 177,236,102 204,533,554 0.89:1 1982 233,415,276 245,136,872 0.95:1 1983 307,284,390 274,721,832 1.12:1
The debt-to-net worth ratio frctn 1980 to 1983 was fluctua-ting. Although no hard and fast rules exist, the debt-to-net worth ratio measures the relative risk exposure of the corpora-tion.
Analysis of the major components of the debt-to-net worth ratio shows that the increase in total debt was greater than the increase in the corporation's net worth, except in 1981 when there was an increase in the National Government appropriation and retained earnings. Further analysis shows that FSDC relied on equity and public debt to finance its credit program. Public debt consists of long-term indebtedness to domestic and foreign creditors. Table No. 14 shows the percentage of the public debt to the total liabilities.
Table No. 14 Public Debt to Total Liabilities
1980 - 1983 Calendar Year
1980 1981 1982 1983
Public Debt P 97,237,300 127,863,235 158,357,936 208,475,022
Total Liabilities
P155,323,816 177,236,102 233,415,276 307,284,310
Ratio (%) 62.60% 72.14% 67.84% 67.84%
Of the total debt, a substantial percentage comprised the foreign loans such as USAID, Danish, and German Loans. These loans carry an interest rates ranging fran 2% to 3%, except for German Loan which is interest free.
The debt-to-net worth ratio, of the corporation fran 1 980 to 1983 indicates a problem of future viability since the amount of the appropriations from the National Government is uncertain.

- 139 -
CoiTroon Size Analysis ' ii —
The common size analysis, also knoi-7n as percentage analysis, of FSDC frcm 1930 to 1983 will be discussed in accordance with the Corporation's results of operations, such as Gross Revenue, Expenses and Net Income (Loss) and Financial Condition, such as Resources, Current Assets, Fixed Assets, Current Liabilities, Long-term Liabilities and Equity. Results of Operation
Percentage Analysis of Income and Expense Statement of the corporation frcm 1980 to 1983 are as follows:
Table No. 15 presents the percentages of the different components of the total expenses to the gross revenue.
Table Mo. 15 Cantion Size Analysis of Expenses
1980 - 1983
1930 1981 1982 1983
Personal Services 79.98% 24.67% 50.06% 34.57% Travelling Expenses 14.94% 4.29% 1.43% 2.12% Repairs and Maintenance 3.73% 3.40% 1 C-3C.. * u 2.40% Freight and Shipping Costs 0.91% 0.56% 0.17% 0.13% Supplies ana Materials 4.44% 1.45% 2.06% 1.64% Rentals and Utilities 8.10% 2.74% 6.95% 8.62% Other Services 13.96% 6.27% 16.60% 27.95% Depreciation/Amortization of Deferred Charges C.46% 2.45% 13.o 20.03%
TOTAL EXPENSES 139.52% 45.83% 94.71% 97.56%
Throughout the four-year period under study, the personal services remained the largest expense, however, in 1931, it is evident that there was a tremendous decrease in the personal services as a percentage of gross revenue. This was attributed to the fact that there was a great increase in gross revenue coupled with a slight decrease in the personal services. Gene-rally, the total expenses of the corporation, as a percentage of gross revenue, tlrroughout the four-year period were a substantial portion of 'the gross revenue, except in 1981 when there was a significant increase in gross revenue and a slight decrease in expenses.

- 140 -
Inasmuch as the expenses of the corporation were great, the corporation experienced a loss in 1960. But due to the increase in the gross revenue in 1981, the net income resulted to 54.17% of the gross revenue. However, this decreased in 1982 and 1983 to 5.89% and 1.87% respectively in spite of the cost reduction measures as evident in the actual decrease in total expenses.
Financial Condition Regarding the common size analysis of the balance sheet,
Table No. 16 contains the caaponents of the total assets as percentage of its total.
Table No. 16
Common Size -Analysis of Assets 1980 - 1983
1980 1981 1982 1983
Cash 13. 92% 10. .05% 5 .67% 4. .83% Receivables 13. 33% 6 .64% 1 .78% ri o .46% Inventories 7. 17% 5 .10% 3 .53% 2 .94% Miscellaneous Assets and De-ferred Qiarges 18. 55% 26 .07% 20 .27% 22 .94%
CURKS1T £3. 07% 47 .86% 37 .25% 16 .23% Contingent Assets 0. .04% 0 .02% 0 .04% 0 .07% Investments 40. ,44% 44 .84% 51 .06% 45 .10% Fixed Assets 6. ,45% 7 .28% 11 .64% 11 .66%
46. ,93% 52 .14% 62 .74% 33 .71%
Table ...... 15 slices that tie investments remained to be a substantial portion of the total assets. This account includes interest andf non-interest bearing loans granted to various ISAs_ and I'OISAs and investments in shares of stock of ai-lOOR, a subsi-diary corporation engaged in the manufacture of gasifier equip-ment. On' the other ':.rr- , the current assets, as a jpercentage of total assets, decreased throughout the four-year period. This was attributed to the decrease in o receivables, an miscel-laneous accounts, as percentages of total assets. Although the miscellaneous assets and deferred charges fluctuated, this re-mained to be the largest component of the current assets and the second largest component of the total assets.
Regarding 'the specific components of the total liabilities, Table V;o. 17 re-onts : :•. i rceatavo:.- cf r xscific liabilities re its total.

- 141 -
Table No. 17 Common Size Analysis of Liabilities
1980 - 1983
Payables Trust Liabilities Depository Liabilities Miscellaneous Liabilities and Deferred Credit
CURRENT LIABILITIES Public Debt Contingent Liabilities OTHER LIABILITIES TOTAL LIABILITIES
1980 1981 1982 1983 10.68% 6.55% 11.69% 11.47% 9.77% 6.10% 3.86% 5.38% 0.07% 0.03% 0.02% 0.02% 1.26% 0.25% 0.11% 0.10% 21.78% 12.93% 15.68% 16.87% 36.46% 33.49% 33.09% 35.82%
— 0.00% 0.00% 0.01% 36.46% 33.49% 33.09% 35.83% 58.24% 46.42% 48.77% 52.70%
Generally, the total liabilities from 1980 to 1983 were approximately 50% of the total assets. Of the total liabilities, the public debt comprised the largest. This account includes domestic and foreign loans used to finance the operations of the corporation. On the other hand, the current liabilities, as a percentage of total assets, fluctuated. This was attributed to the fluctutatians in the payables and trust liabilities.
Table No. 18 contains the specific components of the equity as percentages of the total assets.
Table No. 18 Common Size Analysis of _Ec,mtv
1980 - 1983
1980 1981 1982 1983 Capital Stock 50.62% 47.64% 47.14% 43.91% Donated Surplus 0.23% 0.16% 0.13% 0.12% Contingent Surplus 0.03% 0.02% 0.02% 0.01% Retained Earnings ( 9.12%) 5.76% 3.94% 3.16% TOTAL EQUITY 41.76% 53.58% 51.23% 47.30%
Of the total equity, the capital stock, which includes the equity infusion of the National Government remained to be a large percentage of the total assets. The retained earnings, on the other hand, wis just a small percentage of the total assets.

- U 2 *
Index Analysis Results of Operation
Due to the limited financial data available, only the index analysis of the total gross revenue can be computed instead of the specific sources of income. Table No. 19 presents the magni-tude of change of the gross revenue frcm the base year, 1980.
Table Mo. 19 Index Analysis of Gross Revenue
. 1980 - 1983 1980 1981 1982 1933
GROSS REVENUE 100% 295.68% 100.37% 105.59%
Analysis of the figures in Table No. 19 indicates that the gross revenue in 1981 almost tripled the amount in 1980. This was attributed to the change in treatment of account frcm expenses related to the KAISA development to the income-generating insti-tutional development loans. However, in 1982 and 1983, the gross revenue slightly increased by 100.37% and 105.59%, respectively. This was due to the adjustments on interest rates and repayment period.
Regarding the expenses of the corporation, Table No. 20 shows the magnitude of change of the specific accounts.
Table Mo. 20 Index Analysis of Expenses
1980 - 1983 1930 1981 1982 1983
Personal Services 100% 91 , .19% 62. 82% 45. 64% Travelling Expenses 100% 84 .98% 10. 03% 15. 01% Repairs and Miaintenance 100% 115 .17% 40. 57% 28. 99% Depreciation/Amortization of Deferred Charges 100% 85 .71% 164. 23% 250. 44%
Freight and Shipping Costs 100% 182 .79% 19. 22% 20. 73% Supplies and Materials 100% 96 .60% 46. 58% 39. 14% Rentals and Utilities 100% 100 .21% 86. 12% 112. Other Services 100% 132 .75% 119. ,40% 211. "i "J TOTAL EXPENSES 100% 97 .14% 63. 1 4% 73. c r> o.

- 1^3 -
Over-all, the total expenses of the corporation for the years 1981 to 1983 were lower than the total expenses in 1980. This is due to a change in the treatment of account fran expenses to institutional development loans. Likewise, the strict cost control measures adopted contributed to an over-all decrease in the total expenses. Another factor which contributed to the decrease in expenses was the decrease in the total manpower of the corporation. In spite of the increases in seme expenses as compared with the 1980 figure, the total expenses were lower due to the reprogramming of the budget.
The magnitude of change in the gross revenue and total expenses resulted to a higher net income as compared with the 1980 figure. Table No. 21 contains the percentage increase in the net income fran 1980.
Table No. 21 Index_Analysis of Net Inccme
1980 - 1983 1980 1981 1982 1983
Net Income 100% 605.20% 213.42% 206.52%
Table No. 21 indicates that the net income fran 1981 to 1983 was greater than the 1980 figure. A close look at these figures shows that the net inccme in 1981 was six times the net income of the previous year. This was due to a substantial increase in gross revenue coupled with a slight decrease in total expenses. Although the net inccme in 1 982 and 1983 was actually higher than that in 1980, the net income actually showed a decreasing trend since 1981. This was primarily due to the decrease in the total gross revenue.
Financial Condition Regarding the index analysis of the accounts in the balance
sheet, Table No. 22 presents the magnitude of change of the specific assets fran the base year, 1980.

»
Table No. 22
Index Analysis of Assets 1980 - 1983
1980 1981 1982 1983 Cash 100% 103 .39% 73 .16% 75. 67% Receivables 100% 71 .27% 104 .78% 138. 42% Inventories 100% 101 .89% 88 .31% 89. 62% Miscellaneous Assets and
Deferred Charges 100% 200 .07% 195 .08% 268. 42% CURRENT ASSETS 100% 129 .09% 125 .05% 66. 73% Contingent Assets 100% 100 .00% 183 .20% 426. 12% Investments 100% 158 .74% 226 .57% 265. 00% Fixed Assets 100% 161 .36%' 323 .73% 394. 38% OTHER ASSETS 100% 159 .06% 239 .90% 106. 98% TOTAL ASSETS 100% 143 .15% 179 .45% 218. 24%
Table No. 22 indicates that the total assets increased each year. A close look at these figures shows that the current assets and the other assets fluctuated. Further analysis shows that the increase in the other assets was greater than the in-crease in the current assets. This was attributed to the subs-tantial increase in all the assets classified under the other assets account. On the other hand, there were decreases in the cash and inventories accounts in 1982 and 1983 as compared with the 1980 figure. Furthermore, in spite of the substantial in-crease in the miscellaneous assets and deferred charges in 1983, the re-classification of this account under the other assets account contributed to the decrease in the current assets for 1983.
Table No. 23 shows the magnitude of change of the various components of the liabilities.
Table No. 23 Index Analysis of Liabilities
1980 - 1983 1980 1 981 1982 1983
Payables 100% 87.74% 196.30% 234.31% Trust Liabilities 100% 89.44% 70.90% 120.20% Depository Liabilities 100% 66.77% 58.46% 59.20% Miscellaneous Liabilities
and Deferred Charges 100% 28.03% 15.98% 17.05% CURRENT LIABILITIES 100% 84.99% 129.21% 169.05%

- 1^5 -
Table No. 23 (cont.) Index Analyis of Liabilities
1930 - 1933 Public Debt 100% 131.50% 162.36% 214.40% Contingent Liabilities OTHER LIABILITIES 100% 131.50% 162.86% 214.44% TOTAL LIABILITIES 100% 114.11% 150.23% 197.33%
Analysis of the figures in Table No. 23 shows that the total Liabilities for the years 1931 to 1983 were greater than the 1930 figure. Furthermore, the total liabilities increased at an in-creasing rate. Although the current liabilities fluctuated, the corporation remained liquid, except in 1983 when the increase in die current liabilities was coupled with a decrease in the cur-rent assets. The public debt, on the other hand, increased, rhis was primarily due to the increase in the foreign loans at an increasing rate. The domestic loans, on the other hand, were just a small percentage of the public debt. This was created by virtue of the Memoranda of Agreement with the National Irrigation Administration and Ministry of Human Settlements to finance the various projects of the corporation.
Table No. 24 shows the magnitude of change of the various components of the Government Equity.
Table No. 24 Index Analysis of Equity
Capital Stock Donated Surplus Contingent Surplus Retained Earnings TOTAL DTUITY
1980 1931 1982 1983 100% 134.71% 167.08% 139.31% 100% 100.00% 100.14% 112.55% 100% 100.00% 100.00% 100.00% 100% 190.21% 177.46% 175.44% 1 00% 133.67% 220.13% 246.70%
Analysis of the figures in Table Mo. 24 indicates that the total equity increased at a decreasing rate. A close look at these figures shows that the various components of the government equity, except the contingent surplus, increased as compared with the 1 SCO figure. Further analysis shows that the retained earn-ings increased at a decreasing rate. This was due to the dec-rease in the total gross revenue for the years 1932 and 1933. Moreover, it was in 1981 when the corporation reached its pea]-: in

- 146 -
terms of net income and the equity contribution of the National Government.
Budget Variance Analysis Due to the limited financial information available, the
budget variance analysis is confined to the total amount of the regular budget, special appropriations, and capital outlay. The appoved budget in these components will be compared against the actual disbursement.
Table No. 25 contains the budget variance analysis for 1380.
Table No. 25
Approved Actual Budget Disbursement Variance
Total Regular Budget 50,091,530 44,945,443 (10.27%) Special Appropriation 24,329,317 16,061,687 (33.98%) Capital Outlay 1,500,000 1,497,363 ( 0.18%) TOTAL 75,920,847 62,504,493 (17.67%)
Table No. 25 indicates that the actual disbursements was actually lower than the approved budget. This reflects the strength of the control measures of the corporation especially those pertaining to the expenses.
The budget variance for 1981 is contained in Table No. 26.
Table No. 26 Approved Actual Budget Disbursement Variance
Total Regular Budget 40,400,000 39,355,871 ( 2.58%) Special Appropriation 22,861,073 19,489,505 (14.75%) Capital Outlay 1,500,000 1,341,524 (10.56%) TOTAL 64,761,078 60,186,900 , ( 7.06%)
The actual disbursements for 1981 were lower than the ap-proved budget although the balance was lower than the 1980 fi-gure. Nevertheless, the corporation was able to save more on special appropriation and capital outlay than on the regular budget.
Table Ho. 27 presents the budget variance for 1982.

- 147 -
Table No. 27 Approved Actual Budget Disburesrnent Variance
Total Regular Budget 45,000,000 37,826,296 . (15.94%) Special Appropriation 8,525,229 5,132,912 (39.79%) Total 53,525,229 42,959,208 (19.74%)
In 1982, no budget was appropriated for capital outlay. The total expenses for this year were lower than the approved budget and the actual expenses in 1980 and 1981. This resulted to a savings of 19.74%.
Table No. 28 contains the budget variance for 1983.
Table No. 28
Approved Actual Budget Disbursement Variance
Total Regular Budget 47,000,000 37,411,606 (20.40%)
In 1S83, no budget was appropriated for special proj ects and capital outlay. The actual disbursements for this year were only 79.50% of the approved budget. This reflected the strict measures exercised by the corporation in controlling the expenses in view of the uncertainties in the equity contribution of the National Government.
The over-all performance is not measured in terms of the net income generated since the corporation is more service-oriented than profit-oriented. Nevertheless, there is a move to be an income-generating corporation to continue its operations. The first step was to grant institutional development loons to the KAISAs instead of carrying these as an expense of the corpora-tion. The second step was to operate v/ithin a limited budget and adhere to strict measures in controlling the operating expenses of the corporation.

- 150 -
FOOTNOTES 1P.D. 631 . 2P.D. 1595. 3Ibicl. ^Ibid. 5 Interview with Venido Atienza, Director, Management Services
Department, July, 1984. 6P.D. 1595. 7 1930 Organization Manual.. SIbid. 9P.D. 1445.
10 Interview with Edna Yambao, Director, Supply Management
Office, July, 1984. 11 P.D. 15S5. 12 Interview with Venido Atienza. 13 ""Interview with Flerida Marco, Division Chief, Human Resources
Division, July, 1984. 14 Ibid. 1 0 Interview with Margarita Uyao, Division Chief, Internal Audit
Service, July, 1934. 16Ibid. 17 Interview with Gwendolyn Torres, Director, Finance and Admi-
nistrative Department, August, 1984. 18 Interview with Valentin Guanio, Member, Executive Council,
August, 1984. 1 9 Ibid. 20 "Interview with Gwendolyn Torres.
21 Interview with Valentin Guanic. 22 Interview with Venido Zvtienza.

24 Interview with Raul Flores, Division Chief, Systems Develop-ment Division, October, 1984.
25 Interviev; with Veniao Atienza. 26 Annual Planning i-ianual. 27 Interview with Cecil Jose, Division Chief, Finance arid Loan
wanagement Division, August, 1984. 28 'Interview with Domingo Cunanan, Division Chief, Field Service
Division, September, 1984. 29 Interviev; v/ith Liargarita Uyao. -J Q
Interview with Manuel Gaspay, Area I>Sanager, July, 1934. 31 Interview with Flerica I-Iarco. 32 Interview with Gwendolyn Torres. 33 Interviev; with Veniao Atiensa. 34 *The allowable benefit-cost ratio is 1.4:1. 35 The price ceiling for the cost per hectare is P5,000. Interviev; with Venico Atiensa. 37 Interviev; with Jairne 1-iillan, Director, ISA Development De-
partment , July, 1984. "'"'intervievr with Venido Atienza. 39 Ibid.

- 152 -
PHILIPPINE VIRGINIA TOBACCO ADMINISTRATION
Corporate Overview
One of the major foreign exchange earners of the Philippines is Virginia tobacco. For the years 1980 to 1984, the country's exports reached to about ?713 million. This substantial earnings may be attributed to the active role of the Philippine Virginia Tobacco Administration in enhancing the production arri trading of Virginia tobacco. It is estimated that around 12.2 million people owe their livelihood to the Virginia and aranatic tobacco industry. Likewise, tobacco contributes billions of pesos to the government in the form of specific taxes, corporate taxes, duties and license fees and other charges.
Created by Republic Act No. 2265 which was enacted on June 19, 1979, PVTh is tasked with the functions of promoting, developing, and sustaining Virginia tobacco as an industry.2 Specifically, it is entrusted with the functions of pranoting the effective merchandising of Virginia tobacco, establishing a balanced production and consumption- of tobacco to ensure stable prices so that reasonable profit may be earned by dcmestic ana foreign markets; creating, establishing, maintaining and operating, processing, warehousing and marketing facilities in suitable centers; supervising the selling and buying of tobacco to assure the farmers reasonable profits; and prescribing the rules and regulations governing grading, classiying, and inspecting Virginia tobacco.
PVTA has, since its creation, embarked upon a number of projects, including financing, training, research, scholarships, and demons-tration farms to fulfill its mission. To ascertain the problems of the tobacco industry and to develop appropriate solutions to identi-fied problens, it initiated regular dialogues with tobacco fanners, cigarette producers and manufacturers and traders. Presidential Decree No. 1143 expanded its jurisdiction to Turkish and Burley tobacco.3

- 153 -
Organization 1980-1983
The Board of Directors is the policy-making body of FVTA which is ccmposed of a Chairman and six directors- Each tobacco producing region is represented in the Board. Secretarial, administrative services, and technical assistance are provided by the Office of the Corporate Secretary.
Directly under the Board of Directors is the General Manager vfoo oversees the operations of the corporation. The organization also provides for the position' of an Assistant General Manager.
From 1980 to 1983, the staff units under the General Manager are as follows : (1) Research and Development Coordinator (2) Security and Intelligence Unit; and, (3) Public Relations Staff. The Research and Development Coordinator supervises the activities of the Research and Extension and Technical Services Departments.
In compliance with Presidential Decree No. 51, the Security and Intelligence Unit is tasked with safeguarding the assets and personnel of the corporation. The Public Relations Staff formulates and executes public relations programs in order to disseminate information about PVTA's policies, goals, objectives and operations.
The following is a discussion of the departments in PVTA. Administrative Department
The Administrative Department formulates and impl orients personnel policies and programs pertaining to recruitment, payroll administration, promotions and transfers. It is also responsible for procurement of supplies, materials and equipment; acts as custodian of corporate property: maintains records for easy and orderly retrieval and provides transportation, janitorial, medical and dental services to the corporate personnel. For the years 1980-1983, no struc-tural changes in the department were made.
Finance Department The Finance Department's structure from 1980 to 1983 was not modified. It processes payrolls, vouchers and other disbursements; acts as treasurer of corporate funis; pre-pares the budget, disbursement and collection reports.

- 154 -
Legal Department
Legal services to the Board and to management is provided by the Legal Department. It also handles legal cases and legal problans such as those arising fran the application and inter-pretation of trading rules. No changes were effected in the structure of this department fran 1980 to 1983.
Plans and Programs Department
The Plans and Programs Department prepares short and long range plans for FVTA. The environment, corporate resources such as manpower and financial resources are considered in the formation of the plans. PPD monitors the progress of projects and programs implemented in the field offices to ascertain the technical and econanic viability of the plans.
The Management Audit Division undertakes management audits. It is also tasked with the responsibility of evaluating the corporate internal control system. No restructuring was made in PPD fran 1980 to 1983.
Research Department
The Research Department conducts extensive studies in the production and processing of Virginia, Bur ley and Turkish tobacco through its research stations. It is also involved in research projects on "varietal improvement, culture manage-ment, crop protection, crop processing, leaf classification and grading chemistry and by-product utilization." RD had joint research projects on tobacco with the College of Agri-culture of the University of the Philippines and other research agencies. No changes were made in its structure frcm 1980 to 1983.
Extension and Technical Services Department The Extension and Technical Services Department is concerned with the development of an over-all extension program. Such a program entails various activities such as dissemination of information on new techniques on production and classification of aranatic tobacco, through its radio program, publication of scientific papers and brochures, field saninars, and training classes for farmers. The ETSD's structure was not amended for the years 1980 to 1983.

- 155 -
Market Development and Regulation Department The Market Development and Regulation Department undertakes researches and studies on the trends in the danand and supply of tobacco, prices, standards and concepts for the formulation of rules and regulations that will apply to trading of tobacco. Its activities are focused on factors in the external environ-ment such as international patterns of supply and dsnand and prices for tobacco. Like the other departments, no changes in the structure has been made for the years 1980 to 1983.
Provincial Offices The Provincial or Field Offices implarient the plans and programs conceptualized and approved in the central office. They super-vise the trading centers and apply the rules and regulations pertaining to trading. Each provincial office has four division: namely: tl) Personnel (2) Field Extension (3) Trading Regulation and (4) Finance.

- 156 -
Aspects of Coordination and Control
Carmittees
Committees are useful for coordinating, planning and the execution of programs. Ihey are venues where consensus can be reached and involve-ment of individuals representing different departments is enhanced. Such involvarient will often result in a higher degree of commitment towards the accomplishment of corporate objectives.
In PVTA, there are three major carmittees which function as coor-dinating, planning, problem solving and review groups. These are the: Management Coordinating Staff (Macostaff), the Departmental Review Committee and the Inter-Depar-tmental Planning and Review Carrnittee.
Management Coordinating Ccmnittee (Macostaff)
The Management Coordinating Committee evolved frcm the staff meetings that have always been a part of FVTA's activities. It was only around 1980 when the term Macostaff was coined. In the past, it held its meetings every Monday. However, in 1983, meetings are called when there are issues and problans needing special attention. The Manager of the Legal Department presides over its meetings in his capacity as Over-all Operations Coordinator. This designation was made by the Officer-in-Charge to enable the Legal Counsel to act as the second managing head of the corporation. Managers, assistant managers and division chiefs comprise this Cormittee.^
Departmental Review Committee (PRC) The Departmental Review Committee acts as the first level screening group of concept papers and projects proposals. Composed of representatives of the various departments, the DRC also reviews proposals which will later on be elevated to the Inter-Departmental Planning and Review Committee.
Inter-Departmental Planning and Review Carmittee (XPRC) The Inter-Departmental Planning and Review Ccmnittee evaluates the project proposals which will be integrated into departmental programs. After the IPRC's review of the proposals, the same is submitted to the Over-all Operations Coordinator. The Plans and Programs Department acts as secretariat of the IPRC.6

- 157 -
Planning
The development plans are prepared by the Plans and Programs Department, which was revitalized in 1981, with the appointment of key officers who had extensive experience in development planning. PPD prepared the corporate five-year plan. In 1983 it has five major concerns: Strategic Planning, Monitoring and Evaluation, Systems Development, Support Services and External Relations.
It spearheaded the Industry Assessment Conference and the Conference on Support Systens for Tobacco Development in 1982.
Since one of the major clients of the corporation are the manu-facturers, exporters of tobacco, a conference was held in 1982 among these sectors and FVTA. The output of this conference was an Industry Assessment Report which discusses the state of development of the arcmatic tobacco industry, the problems faced by it, the specification of the quantity and quality dananded and the potentials of the tobacco industry.
The conference was significant because it strengthened the linkage between the private sector-clients and the PVT&. This was followed by a second conference which continued the assessment of the conditions, programs and support systems for tobacco development. Identified as major areas of concern were: technology development, dissonination, extension services, farmers organization, research and development and development planning,' coordination and energy" development.
One unique function of PPD is its assistance to other departments in the preparation of their respective plans. Its intervention and involvement is determined by the specific needs of each department. To enhance the field units' capability to undertake activities related to planning, support services are also extended to the Extension and Technical Services Department so that planning skills can be trans-ferred to all levels in the organization."7
Budgeting
The budget process is closely linked to planning. The Budget Management Division formulates guidelines mainly in the form of standard costs. The estimates submitted by the departments are evaluated against these guidelines.

- 158 -
As the projects are being implemented, departments are informed of their financial status every quarter by the Finance Department. The departments' individual worksheet on the status or level of funds which are maintained in the Finance Department are open and accessible to the departments at any time. Should a department be low in funds, the Budget Managanent Division informs the manager concerned of the critical status of his appropriation. In this case, such department may request for a reprograirming of funds. This will be granted only after due deliberation by the Inter-Departmental Planning and Review Ccnmittee. The carnriittee sufcraits the final recaimerdatian to the Over-all Operations Coordinator who forwards than to the Officer-in-Charge.8
Monitoring
Monitoring in the corporation has two aspects: the monitoring of internal operations and the monitoring- of external operations." The monitoring functions are performed by PPD. The Management Audit Division which is temporarily supervised by PPD is currently under-taking review of systans and procedures. On the other hand, PPD prepared a manual containing the following topics: orientation, mandate, programs and projects and organization.
Monitoring of external operations was systematized in 1S83 thru the Modified Systan for the Over-all Management of Trading Operations. Its major components are as follows: reclassification of trading centers, mobilization of the Trading Regulations Unit and Mobilization of the Provincial Advisory Carrrittee.
To effectively deploy and supervise FVTA personnel at trading centers and to effectively monitor trading operations, trading centers are classified according to volume of acceptances totalling 1,500,000 kilograms, or more as Category A. Those with acceptances of 500,000 kilograms or more but less than 1,500,000 kilograms, belong to Category B. Category C are the trading centers with acceptances of 200,000 while Category D are those with less than 200,000 kilograms.
The Trading Regulation Units were organized in the provinces. The provincial branch managers supervise the TRUs and are responsible for the coiipliance with all the requirements prescribed by the central office. TRUs are also responsible for monitoring trading operations, recording collation and submission of reports to the main office.
The Provincial Advisory Carmittee is a link, between FVTA and other agencies directly or indirectly involved in tobacco trading. It is composed of the FVTA Branch Manager who serves as its Chairman, and the PC Provincial Ccmnander, Provincial Fiscal and President of the Federation of Virginia Tobacco Growers' Associations as members. The

- 159 -
PAC performs the following functions: (1) apprehend and prosecute erring parties in trading activities; (2) field PVTA personnel at establishments of wholesale tobacco dealers and redrying plants; and (3) conducts training/orientation seminars on trading operations.
Auditing
Since pre-audit functions had been withdrawn by CQA, transactions are presently pre—audited by the Finance Department. The Management Audit Division does not perform, this function inasmuch as it is in-volved in systans, review and evaluation.
• In 1983, CQA evaluated the corporation's internal control system. The team which undertook the evaluation recognized the existence of manuals on operations, finance and accounting, property management and administrative and personnel management. It, however, recatniended that the manuals be submitted to COA for review and approval, to canply with existing policy.
CQA favorably carraented on the creation of the Management Audit Division, and encouraged it to conduct a continuous evaluation of the internal control system. It identified several areas such as those pertaining to budgetary controls, collection system and supplies and property managanent system which needed improvements. It identified specific measures so that its internal control systan can be strengthen
PVTA is presently pursuing steps to ccmply with the recommendation of CQA.
Coordination and Management Style
The Officer-in-Charge of PVTA is also the Chairman and Corporate Secretary of the Board. This unique arrangorient gives the Officer—in— Charge ample opportunities to irmiediately implonent policies as soon as they are approved by the policy-making body and at the same time give immediate feedback to the Board on operational matters requiring policy decision.10
The present leadership believes in strengthening the ties between the corporation and its various clients: the farmers, the tobacco producers, manufacturers ana the traders. The conference held last year between the private sector groups and the PVTA, as earlier stated, resulted in an Industry Assessment Report, a document which was used as basis for planning and decision-making.

- 160 -
He is open to new Ideas and innovations. Thus -m 1 qni to energize the corporation and to spur rSorS S T
^ 41,6 ^ o a c r t h e ^ u a S z a t i c ot operations, policies and procedures and the infusion of partici-' situations would nofSve
t ^ T ™ i ' ^ ^ ^ stron9* support of the Officer-in^harge C h a n g e S h o v m * ^ ^ ^ o had been in the o r S S a -
S t S t T n S ^ T d e CS! S / W a £ g r a d U a 1 1^ by acceptance and trust in new systems, because of the visible support and aS^r-S ^ ^ c S ^ ^ t h e whi^^ere initiated
O^ficer-guironents of FVTA's clients. Thus, to the farmers^ t S ^ A ^Ses available scholarships for their children; to t h r f ^ s f ^ e S v e s v S S ^ f ^ ^ 8 ^ n e W will r e S S T ^ S S f " ' yields of tobacco; and to the manufacturers, the corporaSon sefa S S S i e T f Q C C°ntlllUOUS o f inputjPfor S e l f
- 161 -
OPERATIONAL HIGHLIGHTS
The over-all performance of PVTA may be assessed in terms of its contribution to the economy of the country through the development of the Virginia and Aromatic Tobacco Industry. On the other hand, the development of the tobacco industry can be measured by the extent to which it contributes to the tobacco growing carmunities, farmers ana private sectors. There are two ways of measuring its contribution. The first is through the use of economic indices such as sales, profits, and revenues among others. The second is in social terms such as : (1) equitable distribution of costs and benefits of its development; (2) increase of access to government assistance and service; (3) increase income opportunities; and, (4) increase of leadership and participation in problon-solving and decision-making on matters affec-ting their welfare.
Programs ana Projects Before discussing the major accomplishments, the nature of operations
will be taken up first. The discussion will be limited to the major pro-grams and projects.
Trading
One of the distinct activities of FVTA is the trading operations. Throughout the four-year period under study, the corporation implemented the trading center concept. This involves the establishment of trading centers at strategic places in the Virginia and Burley tobacco provinces. These trading centers are licensed by PVTA to accept the farmers' produce and pay than in accordance with floor prices set by the government for each grade of leaf tobacco. It is intended to spare the farmers frcm dealing with unscrupulous middlemen. In 1982, however, innova-tions on trading activities, particularly in the policies and procedures, were adopted and for implementation during the 1983 tobacco trading operations. The first innovation was the modified syston for the over-all managonent of trading operations. This was implanented to upgrade the manpower and institutional capabilities in order to bring about a more efficient, effective, and economical system of supervision and monitoring of trading activities. As earlier discussed, the modifications in the trading operations were the following: (1) reclassification of trading centers depending on the volume of tobacco acceptance; (2) creation of trading regulation units under the supervision of the Provincial Branch Manager; and, (3) organization of provincial advisory carmittee which serves as the link between FVTA and other concerned agencies.

- 162 -
The second innovation was the supplemental rules and regulations on trading of locally grown Virginia leaf tobacco. This provided the licensing of trading centers and issuance of Permit to Purchase to End-buyers and Wholesale Tobacco Dealers and Permit to Redry to Redriers. The third innovation was the revised rules and regulations governing the registration of farmers and trading of locally grown bur ley tobacco. This provided the issuance of Permit to Purchase or Permit to Redry to Wholesale Tbbacco Dealers and End-buyers, and to Redriers, respectively.
In relation to the trading operations, FVTA determines the floor prices of the flue-cured and air-cured leaf tobacco for approval of the President. However, one of its problems in setting the floor prices was the lack of reliable data on cost and return of production. To solve this, FVTA. with the involvement of the Virginia Tobacco Growers' Association (VTGA), Burley Tobacco Growers' Association (BTGA) and Philippine Aromatic Tobacco Development Association (PATDA) , started in 1981 to conduct studies on the actual cost and return of production for both types of tobacco. This was a two-year project conducted in the Virginia and Burley tobacco provinces to: (1) provide accurate data on cost and return of production that are acceptable to both the sellers' and buyers' groups represented by the VTGA and BTGA, and PATDA respectively; and, (2) determine on farm trials the profitability of raising these types of tobacco using the FVTA-packaged technology. The result of this study served as the bases for determining the floor prices of the tobacco crops.
Demonstration Farms
Another activity was the establishment of demonstration farms. In 1980, the corporation undertook the FVTA-PPI Dovonstration Project. This project demonstrated the effects of using varying amounts of fertilizer. It was actually in 1981, however, when FVTA initiated the establishment of dononstration fanti project in both the Virginia and Burley tobacco-growing provinces. This project, popularly known as the "FVTA-Assisted Farmer Danons-tration Farm" project, intended to speed up the dissanination of the new packages of tobacco technology to the farmer level thru the active participation of FVTA farm management technicians. These technicians saw to it that the needed assistance were extended to the farmer-cooperators. Such assistance covers the period frcrn the production to the marketing the farmers' produce. Other objectives of this project include the creation of awareness among tobacco farmers of the wise utilization of credit and the

- 163 -
development of a harmonious working relationship between the farmers ana the farm management technicians. The project was continued in 1982 because of its initial success. The results of the first two years of implementation proved the profitabi-lity and adaptability of the reccmnended technologies. In 1933, in addition to this project, variable demo-farm sizes were used to determine the most effective size for technology demonstra-tion and dissemination. Virginia and Burley Tobacco Growers of the Year Contest During the four-year period covered by this study, the Virginia Tobacco Growers of the Year contest was held annually. This is a joint project of FVTA, Philippine Jaycees and Philippine Virginia Tobacco Board to encourage the active participation of Virginia tobacco farmers in the development of the industry, strengthen the politico-socio-economic ties between the farmers, government and the private sector, and give due recognition to the contribution of these farmers to nation-building. In 1981, a Burley Tobacco Grower of the Year contest was initiated. This contest had the same contest objectives as that of the Virginia Tobacco Growers of the Year contest. This was likewise held annually.
Scholarships
Since the children of farmers also participate actively in farm operations, a pilot project linking the program of burley tobacco technology transfer to educational institutions was initiated in 1982. This project was conducted in high schools to teach the children of Burley tobacco farmers the tobacco technology which included basics of the tobacco culture and research-oriented package of technology frcm seed-bedding to post-harvest operations. These are taught by EVTA farm management technicians during the Practical Arts class held twice a week.
Research and Information Services
To promote academic and institutional interests in tobacco among students and faculty members of agricultural schools, PVTA imple-mented the research and management development program. This was imploviented through scholarships, grants-in-aids, or student assistanceships, preferably for children of tobacco farmers. This is actually a long-range plan which aims to attract qualified ana deserving Ilocanos into the folds of PVTA. Another continuing activity of PVTA is the disssnination of vital information to acquaint the public of its policies, programs and activities. This was achieved through the print and broadcast media. A regular feature of the information drive is the School-Qn-The Air radio program dubbed "Qras Ni Mannalon Iti Tabako" (Hour of the Tobacco Farmer) . This was aired for an hour per week,

- 164 -
in cooperation with the Philippine Tobacco Research and Training- Center (PTRTC) .
Another important activity of FVTA was the conduct of researches in various field of crop production. These studies, conducted at the different research stations, were about crop improvsnent, soil and plant nutrition, crop protection, post-harvest and processing technology on Virginia and Bur ley tobacco, among others.
Lending Program
A lending program known as the Integrated Agricultural Financing (IAF) Program was adopted and implsnented to uplift the living conditions of tobacco farmers and their families and accelerate countryside development. Under this program, liberal credit facilities were extended to leaf farmers for operational expenses and for the purchase of farm inputs which are expected to improve leaf yield and qualityr thereby increasing incane frcm production.
Camplsnentary to the IAF Program was the Arcoatic Tobacco Trading loan Fund (ATTU?) Program which provides sufficient and cneap funds for robacco trading in an effort to stabi-lize the trading of Virginia flue-cured and bur ley air-cured leaf tobacco. This program ensures profitable trading tor farmers, exporters, manufacturers, trading centers and redrying plant operators and ensures a continuous flow of funds for tobacco trading even during the peak of the buying season. This program is for the benefit of the tobacco farmers.

- 165 -
Major Accomplishments
Although PVTA is engaged in various programs and projects, Table l' presents the accomplishments in the trading operations of the Virginia Tobacco which resulted frcm the canbined achievements of the projects discussed earlier.
Table 1 Trading Operations of Virginia Ttobacco 1980 1981 1982 1983
Total no. of kilos purchased at tra-ding centers 39,604,752.65 37,962,079.85 47,421,069.40 49,484,276.£ Purchase value, f ?310,203,969.035 332,572,458.805 493,155,785.67 ?461,182,365.'!
Distribution, by grade
A 30.25% 33.21% 34.19% 25.00% B 14.56% 14.17% 15.47% 16.52% C 12.77% 12.53% 15.08% 14.57% D 10.39% 10.52% 11.22% 12.73% E 10.13% 9.73% 9.36% 11.64% GR 10.91% 11.00% 8.64% 10.55% PR 10.99% "8.84% 6.06% 8.99%
TOTAL 100.00% 100.00% 100.00% 100.00% Table 1 shows that the quantity of the Virginia tobacco purchased
at trading centers increased throughout the four-year period under study, except in 1981 when there was a slight decrease. However, the various projects of PVTA are geared towards the improvorient of the quality of tobacco, regardless of the quantity produced.
A clear indicator of the improvement in the leaf quality is the ratio of high-grade tobacco purchases in relation to the total production. High-grade tobaccos are those which are classified under grades A,B, and C. The higher the ratio, the better the leaf quality of tobacco produced.
In 1980, the high-grade tobacco constituted 57.58% of the total purchases. It was also during this year when the floor prices for aromatic tobacco were increased so the farmers can be assured of a reasonable profit for their investment. However, the Virginia tobacco were bought at trading centers at prices higher than these floor prices. As a result, the total purchase value of the Virginia tobacco in 1980 was ?310,203,969.035.

- 166 -
There was a slight decrease by 4.15% in the quantity of Virginia tobacco purchased in 1981 as compared with the 1980 figure. However, in spite of the fact that the floor prices for Virginia tobacco was the same as those in 1980, the total value of the Virginia tobacco purchased at trading centers increased by 7.21%. This can be attri-buted to the increase in the production of better quality of leaf tobacco or the exportable grades. As seen in Table 1, the high-grade tobacco constituted 59.91% of the total production compared to only 57.58% in 1980.
In 1982, the total number of kilos of Virginia tobacco purchased at trading centers increased by 24.92% as ccmpared with the 1981 figure. Moreover, the total value of the tobacco increased by 48.28%. This can be attributed primarily to the improvement in the quality and leaf yield of the Virginia tobacco. Table 1 shows that 64.74% of the total pro-duction constituted the high-grade tobacco compared to only 59.91% in 1981. However, there were several other factors which contributed to the increase in the purchase value of the Virginia tobacco. The first factor was the increase in the floor prices of the tobacco to provide the farmers a fair return. Moreover, the actual buying prices of the Virginia tobacco were even higher than the floor prices set by the government. The second factor which contributed to the increase in the total purchase value of Virginia tobacco was the carmituent of the end-users to purchase the Virginia tobacco at the trading centers. This purchase commitment vss signed by PVTA and the buyers' group which was represented by the Philippine Aromatic Tobacco Development Association (PATDA) before the 1982 trading season started. The third factor was the modifications on the over-all management of the tobacco trading operations and the imple-mentation of rules and regulations governing tobacco trading. The fourth factor which contributed to the significant increase in the purchase value of the Virginia tobacco was the slump in the production of tobacco of China, one of the largest tobacco trading suppliers of the world. Finally, the release of more than PI 3 million loan from the Arcmatic Tobacco Tradinc Loan Fund (ATTLF) to the operators of the trading centers and the end-users contributed to the increase in the cruantitv and quality of leaf purchases in 1982.
In spite of the increase in the volume of Virginia tobacco purchased at trading centers in 1983, the total purchase value decreased by 6.48% as compared with the 1982 figure. Moreover, the ratio of high-grade Virginia tobacco to the total production was only 56.09%, which registered a decrease frcm the ratios.attained from 1980 to 1982. This can be attri-buted to the decrease in the actual buying prices of the Virginia tobacco. A purchase commitment was signed again by PATDA to ensure a ready market for the farmers' produce. In 1983, the purchase commitment amounted to 40 million kilos of flue-cured Virginia tobacco.
Regarding the Burley tobacco, Table 2 presents the summary of its trading operations from 1980 to 1983.

- 167 -
Table 2 Trading Operations of Hurley Tobacco
Total no. of kilos purchased at tra-ding centers
Purchase value
Distribution, by grade
A B C D E F R
TOTAL
F R
TOTAL
1980
6,687,415.5
y 41,768,669.5
52.06% 12.88% 9.55% 6.85% 6.76% 8 . 0 2 % 3.88%
100.00%
1981
12,767,521.1
3? 72,922,767.85
42.31% 11.31% 11.38% 9.46% 8.86% 14.11% 2.57%
100.00%
1982
12,783,772.5
? 77,308,390.8
1983
13,148,210
f 87,370,301
Seni Sani Air- Air- Air- Air-cured cured cured cure 30.89% 35.30% 48.53% 45.7 18.85% 19.58% 23.72% 16.4, 14.68% 13.88% 20.08% 11.9 17.64% 17.41% 5.04% 15.3 17.94% 13.83% 2.63% 10.5
100.00% 100.00% 100.00% 100 .0 Sun-cured
and Rejects 31.27% 78.73% 100.00%
52.00% 48.00%
100.00%
Table 2 shows a fluctuating trend in terras of the volume of Burley tobacco purchased at trading centers. It was actually in 1982 when the total number of kilos of Burley tobacco was the greatest. As in the Virginia tobacco, the quality of tobacco is more important than the quan-tity produced.
In 1980, the high-grade Burley tobacco constituted 74.49% of the total production. The floor prices of these tobacco were likad.se increased so the farmers can enjoy a reasonable margin of profit. As in the case of the Virginia tobacco, the Burley tobacco were bought at trading centers at prices higher than the floor prices, resulting to a total purchase value of P41,768,669.50.
There was a substantial increase by 90.92% in the volume of Burley tobacco purchased in 1981 as compared with the 1980 figure. The floor prices however, were the same as those set in 1980. As a result, the increase in the total purchase value was lower than the increase in the quantity purchase at trading centers. Table 2 shows that there was a decrease to 65% in the ratio of high-grade tobacco to the total production, resulting to a total purchase value of P72,922,767.85.

- 168 -
The total volume of Burley tobacco in 1982 registered a slight increase fran 12,767,521.1 kilos in 1981 to 12,783,772.5 kilos in 1982. Of this total, 87.90% canprised the semi-air-cured tobacco, 11.37% .sun-cured and rejects, and a mere 0.73% air-cured tobacco. It is also worth mentioning that a little over 90,500 kilos were produced in areas not under the burley tobacco zone. The increase in the quantity purchased resulted from the improved tobacco technology and fair weather conditions during the entire tobacco season.
In 1983, the total volume of Burley tobacco produced was 13,148,210 or 2.85% higher than the 1982 figure. Of this amount, 86.28% constituted the semi-air-cured, 3.83% air-cured, 5.14% sun-cured, and 4.75% rejects. The floor prices for the air-cured Burley were increased while the floor prices for the sani-air-cured were not. Nevertheless, the buying prices for the Burley tobacco were actually higher than the floor prices set by the government. Thus, the total purchase value of the Burley tobacco in 1983 shewed a significant increase to P87,370,301.34 frcm P77,308,390.£ in 1982. This can be attributed to the increase in the production of high grade tobacco leaves. Likewise, a purchase agreement was also signed by PATDA involving 10 million kilograms.
Another type of tobacco produced is the Oriental or Turkish tobacco. Table 3 presents the trading operations of Oriental tobacco.
Table 3 Trading Operations of Oriental Tobacco 1980 1981 1982 1983
Total no. of kilos purchased at tra-ding centers 199,556 197,286 233,271 175,391 Purchase value, ? 223,992.15 219,502.55 pl,574,853.00 71,350,403 Distribution, by grade
A 8.83% 12.07% 11.54% 27.47% B 31.64% 31.62% 32.16% 32.20% C 28.47% 25.73% 30.53% 23.15% D 17.60% 20.18% 16.83% 13.10% E 5.08% 0.86% 0.83% 0.10% F 0.47% 0.02% 0.28% 0.54% R 7.91% 9.52% 8.53% 3.49%
TOTAL 100.00% 100.00% 100.00% 100.00%
Table 3 shows a fluctuating trend in both the quantity and quality of Oriental tobacco purchased at trading centers. It is also worthwhile to mention that no floor prices were set for Oriental tobacco.

- 169 -
In 1980, a total of 199,556 kilos of Oriental tobacco with a purchase value of PI,223,992.15 was purchased at trading centers. Of the total volume produced, 68.94% constituted the high-grade tobacco leaves. As stated earlier, high-grade tobacco consists of grades A, B and C. Table 3 shows that most high-grade Oriental tobacco leaves were those classified under grades B and C.
The total volume of Oriental tobacco purchased in 1981 decreased by 1.14% as canpared to the 1980 figure. But there was a slight increase in the ratio of high-grade tobacco leaves to the total production. In 1981, 69.42% of the total production constitute the high-grade tobacco leaves compared with the 68.94% in 1980. Moreover, the actual buying prices of Oriental tobacco slightly increased as ccmpared to the buying prices in 1980. However, the total purchase value of the tobacco was only PI,219,502.55 compared with PI,223,992.15 in 1980.
The accomplishments in the trading operations of Oriental tobacco wer noteworthy. To begin with, the total volume of Oriental tobacco purchased at trading centers increased frcm 197,286 kilos in 1981 to 233,271 kilos in 1982 or registering an increase of 18.24%. Furthennore, a very clear indicator of the improvement in the quality of the tobacco leaves was the ratio of high-grade quality to the total production. In 1982, 74.23% cons tituted high-grade Oriental tobacco. The buying prices likewise increased resulting to a total purchase of Oriental tobacco of PI,574,853.00 or an increase of 29.14% as ccmpared with the 1981 figure.
In 1983, the total volume of Oriental tobacco purchased at trading centers decreased frcm 233,271 kilos in 1982 to only 175,391 kilos. In spite of this, the ratio of high-grade tobacco leaf increased significantl to 82.82%. Moreover, the buying prices of Oriental tobacco increased, resulting to a total purchase value of PI,350,403.55.
All these developments in the tobacco industry resulted to positive contributions to the over-all economy of the country. It is worthwhile to note that the tobacco industry contributed to the export earnings of the country. Table 4 summarizes the tobacco exports frcm 1980 to 1983.
Table 4 Tobacco Exports
A. Virginia Tobacco Calendar Year
(CY) Quantity (Kilos)
Value (Pesos)
1980 1981 1982 1983
9,197,250 12,376,282 14,400,444 9,541,735
^129,746,492.93 188,558,656.96 251,441,671.20 143,715,368.16

- 170 -
B. Burley Tobacco Calendar Year
CCY) Quantity (Kilos)
Value (Pesos)
1980 1981 1982 1983
1,226,600.00 1,705,688.23 1,354,500.00 1,050,113.62
713,428,331.27 25,044,674.09 26,589,897.97 25,050,266.27
Table 4 shows that the volume of Virginia and Burley tobacco exports increased throughout the four-year period under study, except for the tobacco exports in 1983 which showed a decrease in the total number of kilos.
In 1980, the exports of Virginia tobacco totalled $17,098,967.98 consisting of export shipments to 14 traditional export markets with a total volume of 9,197,250 kilos. Regarding the Burley tobacco, 1,226,600 kilos amounting to P13,428,331.27 were exported to the United States of America, the only export market in 1980. Note that the local market requirsnents shcud be satisfied first before entering the export markets.
The total volume of both the Virginia and Burley tobacco exports increased in 1981. Moreover, there was an increase in the number of foreign markets for both the Virginia and Burley tobacco. In 1981, 12,376,282 kilos of Virginia tobacco, amounting to P188,558,656.96 found its way to 19 foreign markets while 1,705,688.23 kilos of Burley tobacco, amounting to P25,044,674.09 were exported to 7 countries.
In 1982, there was an increase in the exports of Virginia tobacco while a decrease in the volume of Burley tobacco exports was evident, as presented in Table 4. In spite of the decrease in the quantity exported, the total purchase value of Burley tobacco exports actually increased. In 1982, 14,400,444 kilos of Virginia tobacco, amounting to P251,441,671.20 found its way to 16 foreign markets while 1,354,500 kilos of Burley tobacco were exported to 5 foreign markets. The total, volume of exports in Virginia and Burley tobacco comprised approximately 26.16% of the total production for the year.
In 1983, only 9,541,735 kilos of Virginia tobacco with a value of P143,715,368.16 were shipped to 18 foreign markets while the Burley tobacco exports amounting to 1,050,113.62 kilos with a value of P25,050,266.27 was exported to 5 countries. The decrease in the total volume of exports was primarily due to the decrease in the total production of tobacco.
All these accomplishments would not be fully realized without the implementation of various programs and projects of PVTA which are geared towards the improvement of the leaf yield and quality of the tobacco leaves.

- 171 -
Demonstration Farms
One of the significant projects of FVTA was the establishment of . dsnonstration farms. In 1980, 20 dsnonstration farms were established to denonstrate the effects of using different amounts of fertilizers. In 1981, to facilitate the transfer of new technology to the farmer level, FVTA initiated the establishment of 233 dsnonstration farm projects in both the Virginia and Burley tobacco-growing provinces. Financial assistance, amounting to P3,727.83 per hectare for Virginia tobacco and P2,617.90 per hectare for Burley tobacco were extended to farmers to encourage than to join the project. The financial assist-ance was given for the purchase of farm inputs such as insecticides, fertilizers, gasoline, oil and firewood. The project was continued in 1982 with the participation of sane 233 famer-cooperators. The project was a success as evidenced by the increase in the yield per hectare amounting to as high as 3,200 kilograms as compared with only 929 kilo-grams during the previous years. A total of 412 dsnonstration farms of three various sizes were established in 1983. Furthermore, financial assistance which were extended to the farmers amounted to P6,000 per hectare for Virginia tobacco anc P4,000 per hectare for Burley tobacco.
Integrated Agricultural Financing Program
Another program of FVTA was the Integrated Agricultural Financing CIAF) program with the aim of providing operating funds for the exporter cigarette manufacturers and trading center operators so as to have a profitable trading for all. In 1980, a total of P8,914,577.65 was extended as direct loans to the farmers. The total amount of loan released in 1981 decreased to P4,560,656.00 or a decrease by almost 50%. Moreover, the total number of borrowers for both the Virginia and Burley tobacco farmers showed a sharp decline fran 5,543 in 1980 to only 2,042 in 1981. The revised guidelines of the IAF program stated that Virginia farmers using the new FVTA technology can avail of a maximum of P6,000 production loan provided that the average production per hectare is 1,450 kilos of good quality tobacco, while those whose expected output is only 1,000 kilos of good quality tobacco can borrow as much as P4,000 On the other hand, Burley farmers can borrow up to P3,250 per hectare. In 1982, the total loan granted amounted to P12,543,429 with 43 banks participating in the IAF program. The program was able to generate total earnings of P3,612,141.72 during this year. In 1983, the IAF program generated an income of P4,953,706.11 or an increase of 37.14% as canparec to the 1982 figure. About 37 rural banks participated in the program.
Another important accomplishment of FVTA revolved around the iirtpleraei ation of another financing program, the Ararctic Tobacco Trading Loan Fui (ATTLF) program, which canplanented the IAF program. This program aimed to stabilize the purchase of tobacco by providing wholesale buyers with sufficient funds. However, this program was limited to certified Virgin] and Burley tobacco trading centers while only the leaf expuicers and

- 172 -
cigarette inanufacturers who have carmitments to PVTA to purchase specified amounts of flue-cured or Burley tobacco are eligible to borrow under this financing program. In 1980, a total of P12,319,000 was extended as loans to various trading centers. Approximately P28,800,000 was extended in 1981, or an increase of 133.78%. In 1982, the total releases from the ATTLF amounted to more than P13 million, or approximately 54.86% less than the amount released in 1981 although there were more beneficiaries during this year. Finally, Central Bank reported that the ATTLF program was able to generate an inccrte of P5,139,722.71 in 1983. Likewise, there was a substantial increase in the release of fund which amounted to P35,240,000 compared to only P13,056,000 in 1982, or an increase of 146.94%.
Lastly, all the other programs contributed in a way to the major accomplishments of the tobacco trading operations. Among these are the scholarship program which aimed to promote interests among students and faculty msnbers; the Virginia-Bur ley Tobacco Grower of the Year Contests which aimed to encourage the farmers to participate in the development of the tobacco industry; the various research which aimed to test the effects of various farm inputs; and the education and information program which aimed to acquaint the public of the policies and programs of PVTA.

- 173 -
FINANCIAL REVIEW
Table 5 Financial Highlights
1980-1983 (Amount in Million £)
1980 1981 1982 1983 Resources Gross Revenue Expenses Met Inccrne (Loss) Current Assets Current Liabilities Total Liabilities Total Equity
•0 291.3 p 293.1 ? 283.4 ? 296.1 23.8 28.6 22.1 41.5 22.5 28.5 31.7 32.6 1-3 0.1 ( 9.6) 8.9
156.4 155.9 145.1 165.8
3.7 3.6 287.6 289.5
3.7 3.6 3.4 3.4
280.0
4.2 4.2
291.9 Financial Highlights
Results of Operations
Net earnings in 1333 amounted to £8.9 million, fran pi.3 million and £0.1 million in 1980 and 1981. The corporation, however, incurred a loss in 19S2 in the amount of £9.6 million.
Gross revenue rose fron £23.8 million in 1980, £28.6 million in 1981 and £22.1 million in 1982 to £41.5 million in 1983. Operating and Service Income and Incane from Public Enterprises/Investment remained 'the most important itons of revenue. Other sources of inccme rose substantially, due primarily to the sale of an asset in 1981 in the amount of £4.5 million and in 1983, the extraordinary receipts - .Subsidies from National Government in the amount of £25.8 million.
Total operating expenses expanded to £32.6 million in 1983, from £22.5 million in 1980, £28.5 million in 1981 and £31.7 million in 1982. Personal services rose to £24.3 million frcm £14.2 million in 1930, £17.8 million in 1981 and £21.6 million in 1982.
Financial Condition
Total assets amounted to £296.1 million, from £291.3 million in 1980, £293.1 million in 1981 and £283.4 million in 1982. Receivable and Investments continued to account for the highest percentage of total assets.

- 174 -
Total liabilities rose to ?4.2 million in 1983, frcm ?3.7 million in 1980, ?3.6 million in 1981 and 73.4 million in 1982. Liabilities includes Payables, Trust Liabilities and Depository Liabilities.
Total equity rose to ?291.9 million, frcm 7287.6 million in 1980, 7289.5 million in 1381 and 7280.0 million in 1982. The increase was due to the corresponding increase in Excess of Incane over Expenses, Contingent Surplus Account and Capital Equity Account. Table 1 shows the Financial Highlights from 1980 to 1983 of the Philippine Virginia Tbbacco Administration.
Tools Used to Measure the Over-all Performance of the Phi 1 -fppine Virginia Tobacco Administration (PVTA)
Financial ratios> cannon size analysis, index analysis of financial statements and budget variance analysis were the tools utilized in the study and analysis of the performance of the PVT2V from 1980 to 1983.
Of these four tools used in analyzing- the financial performance of the corporation, three tools have been carmonly used while the other o is used in this study for purposes of measuring the cost control syste of the PVTA. This refers to the Budget Variance Analysis which is bas on the approved budget against the actual disburssnent.
Financial Ratios
Tests of profitability and tests of liquidity were utilized in analyzing the financial performance of the Philippine Virginia Tobacco Administration fran 1980 to 1983. The ratios and percentages are show in Table 6 to12 representing results of operations and financial condi tions ratios. Profit Ratio
Table 6 shows the Profit Ratio fran 1980 to 1983 of the Philippine Virginia Tobacco Administration as a measure of the over-all profitabi lity of the operations of the corporation.
Table 6 Profit Ratio 1980-1983
Profitability Calendar Year Net Incane Gross Incane Ratio (%)
1980 71,263,339.03 723,756,352.91 5.32% 1981 57,828.34 28,570,286.57 0.20% 1982 ( 9,617,634.96) 22,055,167.67 (43.61%) 1983 8,906,184.12 41,475,120.44 21.47%

- 175 -
With the exception of the year 1982, the corporation has operated profitably fran 1980 to 1983 as the profitability ratio rose frcm 5.32 per cent to 21.47 per cent.
Return on Stockholders' Equity
As shown in Table 7, the return on stockholders' equity of the corporation rose fran 0.44 per cent in 1980 to 3.10 per cent in 19S3, except the year 1982 with a negative ratio of 3.35 per cent.
Table 7 Return On Stockholders' Equity
1980-1983 Average Stockholders'
Calendar Year Net Income Equity Ratio (%)
1980 263,339.03 p287,256,402.30 0.44% 1981 57,828.34 287,256,402.30 0.02% 1982 ( 9,617,634.96) 287,256,402.30 ( 3.35%) 1983 8,906,184.12 287,256,402.30 3.10%
The highest return of the funds and the relationship of net incane to the average stockholders' equity was in 1983, and the lowest was in 1982 with a negative ratio of 3,.35 per cent.
Current Ratio
The corporation has been very liquid considering the average Current Ratio of 41.77:1. Although FVTA's current ratio decreased in 1983 by 3.09 with that of 1980, the corporation was still very solvent and liquid at year-end 1983. In 1983, should the creditors demand for irrmediate liquidation or payment frcm the corporation, the ranaining assets will still be 38.12.
Table 8 Current Ratio 1980-1983
Current Calendar Year Assets Current Liabilities Liquidity {'
1980 pl56,396,630.51 ?3,705,277.56 42.21:1 1981 155,902,887.08 3,599,075.86 43.32:1 1982 145,120,444.29 3,419,385.21 42.44:1 1983 165,806,599.10 4,238,235.14 29.12:1

- 176 -
Acid-Test Ratio As shown in Table 9, the corporation has been very liquid despite
consideration of quick assets and current liabilities fran 1980 to 1983 in arriving at the ratio. The table shows the acid-test ratios of 41.77:1 in 1980, 42.88:1 in 1981, 41.96:1 in 1982 and finally 38.74 in 1983.
Table 9 Acid-Test Ratio 1980-1983
Calendar Year Quick Assets Current Liabilities Ratio (%) 1980 £154,775,063.90 £5,705,277.56 41.77:1 1981 154,345,933.57 3,599,075.86 42.88:1 1982 143,475,443.30 3,419,385.21 41.96:1 1983 164,169,042.32 4,238,235.14 38.74:1
Average Collection Period
Table 10 shows the average collection period of the Philippine Virginia Tobacco Administration frcm 1980 to 1983, from 222 days to 330 days.
Table 10 Average Collection Period
1980-1983 Average
Calendar Year Gross Incane No. of Working Days Daily Income 1980 £23,756,352.91 250 £ 95,025.41 1981 28,570,286.57 250 114,281.15 1982 22,055,167.67 250 88,220.67 1983 41,475,120-44 250 165,900.48
Accts. Receivable Average Daily Incane Days 1980 £21,075,550.88 £ 95,025.41 222 1981 36,040,925.03 114,281.15 315 1982 37,627,928.31 80,220.67 427 1983 54,692,659.96 165,900.48 330
The average collection period fran 1980 to 1983 as shown above can be related to the credit terns offered by the corporation. It shows the days income on the books in relation to the accounts receivable which can be used in any possible shifting of credit policy or changes in the procedures of collecting receivables.

- 177 -
Receivable to Inccme Table 11 shows another way of expressing the same relationship as
expressed by the average collection period of the FVTA. frcm 1980 to 1983.
Table 11 Receivable To Income
1980-1983
Calendar Year Accounts Receivable Gross Income
1980 1981 1982 1983
Debt to Net Worth
721,075,550.88 36,040,925.03 37,627,928.31 54,692,659.96
723,756,352.91 28,570,286.57 22,055,167.67 41,475,120.44
Ratio (%)
0.89 1 .26
1.71 1.32
Table 12 shows the Debt to Net Worth ratio fran 1980 to 1983 of the FVTA' fran .013:1 to .014:1, an increase of only .001.
Table 12 Debt To Net Wbrth
1980-1983 Calendar Year
1980 1981 1982 1983
Total Debt
73,705,277.56 3,599,075.86 3,419,385.21 4,238,235.14
Net Worth Ratio
7287,630,271.08 .013:1 289,480,002.74 .012:1 280,014,258.10 .012:1 291,901,076.70 .014:1
The above debt to net worth, ratio indicates favorable exposure of the corporation in terms of relative risk exposure. Carman Size Analysis
The cannon size analysis of financial statsnents will be discussed in accordance with the corporation's results of operations and financial condition.

- 178 -
Results of Operations
The ccrnmon size analysis of the gross revenue will be discussed first. Table 13 presents the percentages of the various aspects of incane to the gross revenue.
Table 13 Cannon Size Analysis of Gross Revenue
1980-1983 1980 1981 1982 1983
Operating and Service . Inccme 21.08% 19.08% 30.29% 13.54%
Income fran Public Enterprises/ Investments 78.90% 80.87% 69.69% 24.12%
Miscellaneous Incane 0.02% 0.04% 0.02% 0.02% Extraordinary Receipts-Subsidies fran the national Government - - - 62.32%
Capital Revenue - 0.01% Generally, PVTA relied on incane from public enterprises and invest-
ments, except in 1983 when incane generated fran these sources was only 24.12% of the total gross revenue. On the other hand, the operating and service incane throughout the four-year period under study was just a snail percentage of eht toal gross revenue. It was only in 1983 when FVTA received subsidies fran the National Governroent. Such subsidy was a substantial part of the total gross revenue, without which the corporation could have suffered a great loss.
Table 14 presents the percentages of the different canponents of the expenses to the total gross revenue. However, since these expenses were so detailed, only a number of significant expenses will be presented.
Table 14 Cannon Size Analysis of Expenses
1980-1983 1980 1981 1982 1983
Personal Services 59 .64% 62 .38% 97. 84% 58 .95% Other Services 3 .15% 3 .16% 0. 97% 0 .78% Rent 2 .40% 1 .99% 3. 84% 2 .32% Grants 3 .87% 2 .20% 1. 92% 0 .45% Iossess/Depreciation 2 .91% 2 .42% 2. 76% 0 .88% Maintenance of Motor Vehicles
used for Official Business 1 .41% 2 .29% 2. 57% 0 .29% Auditing1 Services 2 .52% 3 .12% 4. 21% 2 .39% Discretionary Expenses 2 .50% 2 .98% 4. 90% 3 .27% Trading/Production Expenses 8 .56% 13 .05% 13. 20% 0 .42% Other Expenses-Miscellaneous 2 .59% 0 .21% 1. 87% 0 .88% TOTAL EXPENSES 94 .68% 99 .80% 143. 61% 78 .53%

- 179 -
Throughout the four-year period under study, the personal services account remained to be the largest expense. This was attributed to the fact that PVTA engages in labor-intensive operations. All the other expenses were just small percentages of the total gross revenue. Never' theless, Table 14 indicates that the total expenses of the corporation, as a percentage of the gross revenue throughout the four-year period were a substantial portion of the gross revenue. In fact, the total expenses amounted to more than the gross revenue generated by the corporation.
Tfcble 15 contains the percentage of the net incane to the total gross revenue.
Table 15 Cannon Size Analysis of Net Incane
1980-1983 1980 1981 1982 1983
Wet Incane 5.32% 0.20% (43.61%) 21.47%
Generally, the net Incane, as a percentage of gross revenue, was small. In fact, PVTA suffered a great loss in 1982 when the total expenses amounted to 43.61% more than the total gross revenue. However due to the increase in gross revenue, specifically fran the subsidies fran the National Government, in 1983, PVTA experienced a net incane of 21.47% of the gross revenue.
Financial Condition
Regarding the caiman size analysis of the balance sheet, Table 16 contains the components of the total assets as percentages of its total.
Table 16 Carmon Size Analysis of Assets
1980-1983 1980 1981 1982 1983
Cash 45. 89% 40 .37% 37 .34% 36 .97% Receivables 7. 23% 12 .30% 13 .28% 18 .47% Inventories 0. 56% 0 .52% 0 .58% 0 .55% CURRENT ASSETS 53. 68% 53 .19% 51 .20% 55 .99% Other Assets 15. 54% 15 .66% 16 .24% 15 .56% Investments and Fixed Assets 30. 78% 31 .15% 32 .56% 28 .45% TOTAL ASSETS 100. 00% 100 .00% 100 .00% 100 .00% Table 16 shows that the current assets ronained to be a substantial
portion of the total assets. This account can be subdivided into three, namely: (1) cash; (2) receivables; and, (3) inventories. The cash account remained to be the largest component of the current assets. The receivables account, on the other hand, increased throughout the

- 180 -
four-year period under study. Meanwhile, the inventories account ranai to be only a minute portion of the total assets. The second largest ca ponent of the total assets was the investments and fixed assets account The investments account includes interest and non-interest bearing loan On the other hand, the fixed assets account includes acquired assets, land and land irnprrovanent, building and structures, various equipment, and other fixed assets. Finally, the other assets account rgrained to ] a small portion of the total assets. This includes deferred charges arv deposits, among others.
Regarding the specific components of the total liabilities, Table 1 presents the percentages of specific liabilities to its total.
Table 17 Cannon Size Analysis of liabilities
1930-1983
1930 Payables 1.10% Trust Liabilities 0.07% Depository Liabili-ties - Guaranty Deposits 0.02%
Deferred Credits -Miscellaneous 0.08%
TOTAL LIABILITIES 1.27 %
1981 1982 1983 0.97% 0.96% 1.22% 0.17% 0.17% 0.15%
0.01% 0.01% 0.01%
0.07% 0.07% 0.05% 1.22% 1.21% 1.43%
Throughout the four-year period under study, the total liabilities are classified as current liabilities. Nevertheless, this account remained to be a minute portion of the total assets. This supports the unbelievably high current ratios of FVTA fran 1980 to 1983.
Table 18 contains the specific components of equity as percentages of the total assets.
Table 18 Cannon Size Analysis of Equity
1980-1983
1980 1931 1982 1983 Retained Earnings Capital Equity
Account TOTAL EQUITY
(213.02%) (210.88%)
311.51% 309.66% 98.73% 93.78%
(221.57%) (211.95%)
320.36% 306.62% 98.79% 98.57%

- 181 -
Of the total equity, the capital equity account rattained to be the largest component, as a percentage of the total assets. However, because of the negative figure of the retained earnings account, the total equity resulted to a lower percentage of the total assets. But further analysis shows that the total equity consistently ronained a substantial percentage of the total assets. Index Analysis
The index analysis of FVTA frcm 1980 to 1983 will likewise be discussed in accordance with the corporation's results of operations and financial condition.
Results of Operations
Table 19 contains the percentage increase ±n the specific components of the gross revenue frcm the base year, 1980.
Table 19 Index Analysis of Gross Revenue
1980-1983
1980 1981 1982 1983
Operating and Ser-vice Income 100% 108.83% 133.39% 112.16% Income from Public Enter-prises/Invest-ments 100% 123.26% 82.00% 53.36% Miscellaneous Income 100% 292.40% 120.36% 195.62% Extraordinary Receipts -Subsidies from the National Gov't - - - -Capital Revenue -Sale of Assets - -TOTAL GROSS REVENUE 100% 120.26% 92.84% 174.58% Generally, the total gross revenue increased as compared to the 1980
figure, except in 1982 when there was a slight decrease. Further analys shows that the decrease in the total gross revenue in 1982 was. attribute to the subsidies from the National Government which was not present in the previous years.

- 182 -
Regarding the expenses of the corporation, Table 20 contains sane significant expenses of the corporation, as percentages of the base year figure.
Table 20 Index Analysis of licenses
1980-1983
1980 1981 1982 1983 Personal Services 100% 125 .79% 152 .31% 171 .70% Other Services 100% 120 .71% 28 .48% 43 .26% Rent 100% 99 .65% 149 .01% 169 .10% Grants 100% 68 .41% 46 .11% 20 .48% Losses/Depreciation 100% 100 .02% 87 .90% 52 .86% Auditing Services 100% 148 .70% 154 .95% 165 .20% Maintenance of Motor Vehicles Used for Official Business 100% 194 .92% 168 .65% 35 .95% Discretionary Expenses 100% 144 .66% 182 .30% 228 .60% Trading/Producticn Expenses 100% 183 .45% 143 .21% 8 .64% Miscellaneous Expenses 100% 9 .96% 66 .92% 59 .03% TOTAL EXPENSES 100% 126 .76% 140 .81% 144 .80% Over-all, the total expenses of the corporation for the years 1981
to 1983 were greater compared to the base year figure. In fact, the total expenses continued to increase each year. Further analysis of Table 20 indicates that the personal services continued to increase throughout the four-year period under study. This could be attributed to the increase in the number of regular work force. Although Table 20 shows a decrease in sane expenses, the increase in other expenses was not offset as evidenced by the continuous increase in total expenses.
The magnitude of change in the gross revenue and total expenses resulted to a lower net income as compared to the 1980 figure, except in 1983 when it registered a substantial increase. Table 21 contains the percentage increase In the net inccme fran the base year, 1980.
Table 21 Index Analysis of Net Inccme
1980-1983
1980 1981 1982 1983 Income 100% 4.58% (761.29%) 704.97%

- 183 -
The figures in Table 21 indicates that the net inccme from 1981 to 1932 was lower than the 1930 figure. In fact, in 1982, FVTA suffered a great loss. It was actually only in 1983 when the net incane was about seven times of the 1980 figure in spite of the increase in total expenses. This could be attributed to the substan-tial increase in gross revenue Wnich resulted frcm the subsidies frcm the National Government.
Financial Condition Regarding the index analysis of the balance sheet frcm 1980 to
1983, Table 22 contains the magnitude of change of the specific com-ponents of the total assets frcm the base year, 1980.
Table 22 Index Analysis of Assets
1980-1983 1980 1981 1982 1983
Cash 100% 88.48% 79.17% 81.88% Receivables 100% 171.01% 173.54% 259.51% Inventories 100% 96.02% 101.44% 100.99% CURRENT ASSETS 100% 99.68% 92.79% 106.02% Other Assets (Deferred Charges and Deposits) 100% 101.41% 101.68% 101.81% Investments and Fixed Assets 100% 101.78% 102.91% 93.95% OTHER ASSETS , 100% 101.66% 102.50% 96.59% TOTAL ASSETS 100% 100.60% 97.29% 101.65% Table 22 indicates that the total assets slightly increased each
year, except in 1982 when the total assets decreased. A close look at these figures showed that the current assets continued to decrease although in a slight degree only, except in 1983 when this account increased by 6.02% as ccmpared to the 1980 figure. Further analysis of the current assets account showed that the cash account in 1981 to 1983 decreased as ccmpared to the 1980 figure while the inventories account in 1982 and 1983 slightly increased. It was only the receiva-bles account which showed a substantial increase throughout the four-year period under study. The other assets account which includes deferred charges and deposits showed a very slight increase as compared to the 1980 figure. Similarly, the investments "and fixed assets accounts showed a slight increase in 1981 and 1982 but decreased in 198;
Regarding the magnitude of change of the liabilities, Table 23 contains the percentage increase or decrease of the specific components of the liabilities.

- 184 -
Table 23 Index Analysis of Liabilities
1980-1983
1980 1981 1982 1983
Payables 100% 88.53% 85.30% 112.88% Trust Liabilities 100% 237.69% 224.78% 209.29% Depository Liabi-lities - Guaranty Deposits 100% 58.19% 36.47% 36.47% Deferred Credits -Miscellaneous 100% 95.92% SO.61% 67.32% TOTAL LIABILITIES 100% 97.13% 92.28% 114.38% All the liabilities of FVm were classified under the current
liabilities. Table 23 shows that the total liabilities, as ccmpared to the base year, decreased except In 1983 when it registered an increase. A close look at Table 23 shows that the depository liabi-lities decreased tranendously frcm IS81 to 1983. The deferred credits, on the other hand, decreased each year. Similarly, the payables accoun decreased as ccmpared to the 1980 figure, except in 1933 when there was an increase. It was only the trust liabilities account of PVTA which showed a tranendous increase throughout the four-year period under stud;
Regarding the magnitude of change in the equity account of PVTA, Table 24 shows the percentage increase of the different components of the total equity.
Table 24 Index Analysis of Equity
1980-1983
1980 1981 1982 1983
Retained Earnings 100% 99.70% 98.21% 99.39% Capital Equity Account 100% 100.00% 100.05% 100.05%
TOTAL EQUITY 100% 100.64% 97.35% 101.48% Table 24 shows that the total equity for the years 1981 to 1983 was
slightly greater than the 1980 figure, except in 1982 when there was a decrease by 2.65%. Furthermore, the retained earnings account, as ccmpared to the 1980 figure, decreased. It was only the capital equity account which registered a slight increase for the years 1982 and 1983 while the amount in 1981 did not change.

- 185 -
Budget Variance Analysis
Because of the detailed list of expenditures available, the discussion of the budget variance analysis will be limited to the aggregate anoint of the personal services, maintenance and other operating expenses, and the capital outlay.
Table 25 contains the budget variance analysis for 1980.
Table 25 1980 Budget Variance Analysis
AotUS.1 Proposed Budget Expenditure Variance Personal Services 722,794,500.00 714,377,660.91 (36.92%) Maintenance and Other Operating Expenses 6,775,144.00 7,423,951.06 9.58% Capital Outlay 4,600,000.00 561,531.71 (87.79%) TOTAL BUDGET 34,169,644.00 22,363,143.68 (34.55%) ifcble 25 indicates that the actual expenses of FVTA were 34.55%
lower than the proposed budget. Further analysis shows that the actual expenditures on the personal services were lower than the proposed budget but the expenditures on the maintenance and other operating expenses were slightly higher by 9.53%. The actual expen-ditures on capital outlay, on the other hand, registered a substan-tial decrease from the proposed budget.
Table 26 shows the budget variance for 1981.
Table 26 1981 Budget Variance Analysis
Actual Proposed Budget Expenditure Variance
Personal Services 721,021,000.00 718,137,465.96 (13.72%) Maintenance and Other Operating Expenses 8,625,000.00 9,683,419.66 12.27% Capital Outlay 1,140,000.00 560,086.18 (50.87%) TOTAL BUDGET 30,786,000.00 28,380,971.80 (7.81%)

- 186 -
Ifcble 26 Indicates that the actual expenditures of FVTA was slightly lower than the proposed budget. A close look at the figures in Table 26 shows that the actual expenditures on personal services were lower than the proposed budget by 13.72% while the actual expenditures on maintenance and other operating. expenses were higher than the proposed budget by 12.27%. It was on capital outlay whereFVIA was able to save 50.87% of the proposed budget.
The budget variance for 1982 is contained in Table 27
Table 27 19S2 Budget Variance Analysis
Actual Proposed Budget Expenditure Variance
Personal Services ?25,071,102.87 721,579,717.91 (13.92%) Maintenance and Other Operating Expenses 9,700,435.75 9,435,304.68 ( 2.73%) Capital Outlay 1,378,322.00 842,501.20 (38.87%) TOTAL BUDGET 36,149,860.62 31,907,523.79 (11.74%)
Table 27 shows that the total expenditures for 1982 were lower than the proposed budget by 11.74%. Actually, all the other aggre-gate anoint of the expenditures were lower than the proposed budget with only varying degrees.
Finally, Table 28 contains the budget variance for 1983.
Table 28 1983 Budget Variance Analysis
Actus1 Proposed Budget Expenditure Variance
Personal Services 730,016,344.34 724,326,265.06 (18.96%) Maintenance and Other Operating Expenses 11,239,391.98 7,877,176.66 (29.91%)
Capital Outlay 2,597,417.35 196,926.81 (92.42%) TOTAL BUDGET 43,853,153.67 32,400,368.53 (26.12%)
The figures in Table 28 shows that the total expenditures for 1983 were lower than the proposed budget by 26.12%. A close look at these figures show that the aggregate amounts of the different accounts were actually lower than the proposed budget. It was the capital outlay which registered the greatest savings of 92.42% of the proposed budget.

- 189 -
FOOTNOTES
1 PVTA. Organization Manual 1983. 2 Ibid. 3 Ibid. 4 Jaime Senga, Manager, Plans & Programs Department, August 1984. 5 Ibid. 6 Ibid. 7 Ibid, g Mario Sison, Manager, Finance Department, August, 1984.
9 Organization Manual, op. cit. 10 Federico Moreno, Officer-in-Charge, PVTA, August, 1984.