a study on the impact of the interventions made for gender
TRANSCRIPT

A Study on the Impact of the Interventions made for Gender Mainstreaming under the Extension Reforms Scheme
July 2015
Dr. K. Uma Rani Dr. N. Balasubramani
Ms. Swati Shah
NATIONAL INSTITUTE OF AGRICULTURAL EXTENSION MANAGEMENT
(An organization of Ministry of Agriculture, Gov. of India)

CONTENTS
S .No Details Page No
1 List of Tables and Figures I - III
2 Introduction 1 - 5
3 Review of Literature 6 - 13
4 Methodology 14 - 23
5 Results and Discussion 24 - 74
6 Conclusion and Recommendations 75 - 81
7 References 82 – 84
8 Annexures
I. Profile of the sample districts 85 – 91
II. Photographs of the respondents in action 92 – 93
III. Tables related to dimensions of impact index 94 – 112
IV. Interview Schedules 113 - 131

1
I. Introduction
Rural women, mainly farmers, number at least 1.6 billion worldwide, represent more
than a quarter of the total world population. Nearly half of the world’s farmers are women
and women comprise most of the agricultural workforce in developing countries. Women
produce on average more than half of all the food that is produced (up to 80% in Africa, 60%
in Asia; and 30 to 40 % in Latin America and Western countries).
The nature and extent of women’s involvement in agriculture varies greatly from
region to region. Even with in a region, their involvement varies widely among different
ecological subzones, farming systems, caste, classes and stages in the family cycle. But
regardless of these variations, there is hardly any area in agriculture where women are not
involved. Almost 94.0 percent of the labor force is constituted by female workers in crop
cereal production, 53.0 percent in sericulture, 47.0 percent in tea plantations, 46.84 percent
in cotton cultivation, 45.43 percent growing oil seeds, 39.13 percent in vegetable production,
21.0 percent in fisheries, 24.0 percent fish farmers and 3.72 percent were engaged in fruits,
nuts, beverages, and spice crops while 16.0 percent are involved in livestock rearing (CTDHBF,
2009). In addition, women own high stake in dairying where they account for 93.0 per cent of
total employment in dairy production (UN WOMEN, 2012).
Paradoxically, rural women’s contribution to building social and economic capital
remains concealed because they are invisible in plans and programs thereby denying them
access to resources which could enhance their socio-economic contribution to society.
Therefore women own only 2% of the land, and receive only 1 % of all agricultural credit,
while only 5 % of all agricultural extension resources are directed towards them. The
extremes of poverty and marginalization that the inequitable access to resources exposes
women to means that they are disproportionately exposed to “shocks” such as illness, death,
floods and drought.
Rural poverty is deeply rooted in imbalance between what women do and what they
have. Statistics show that almost 70% of economically active women in low-income food–

2
deficit countries are employed in the agricultural sector and, therefore, play crucial roles in
assuring food security. Despite this, rural women battle hunger and poverty on increasingly
marginal land with meager resources and their voices are seldom heard among decision
makers (FAO, 2007).
The rural-to-urban migration of men in search of paid employment and their rising
mortalities are said to be leading to increased numbers of female-headed households in the
developing world and in India this figure is around 11.0 percent (Census, 2011). This
‘feminization of agriculture’ has placed a considerable burden on women’s capacity to
produce, provide and prepare food in the face of considerable obstacles.
Despite the fact that women are the world’s principal food producers and providers,
they remain ‘invisible’ partners in development. Lack of gender disaggregated data means
that women’s contribution to agriculture in particular is poorly understood and their specific
needs ignored in development planning. This extends to matters as basic as the design of farm
tools. But women’s full potential in agriculture must be realized if the goal of the 1996 world
food summit - to have the number of hungry people in the world by 2015 – is to be achieved.
Agricultural extension programmes ensure that information on new technologies,
plant varieties and cultural practices reaches farmers. However, in the developing world it is
common practice to direct extension and training services primarily towards men. A recent
FAO survey showed that female farmers receive only five percent of all agricultural extension
services worldwide and that only 15 percent of the world's extension agents are women.
Studies on agricultural extension have highlighted a number of weaknesses in reaching
rural women. Traditionally, most extension services have been devoted to farmers who own
land and who are willing and able to obtain credit and invest it in inputs and technological
innovations. Since women often lack access to land or access to other collateral with which
to obtain credit, extension services, unintentionally, bypass women.
For too long, policies have been based on the assumption - proved wrong by studies -
that information conveyed to the male head of a household would be passed on to its female
members. But men do not necessarily discuss production decisions with their wives or

3
transfer extension knowledge to them. Furthermore, policy-makers fail to recognize that men
and women are often responsible for different crops, livestock, tasks and income-generating
activities and that their extension needs consequently differ.
Extension services usually focus on commercial production rather than on subsistence
crops, which are the primary concern of women farmers and also the key to food security in
developing countries. Extension agents will often choose to work with a few farmers judged
to have a progressive attitude, while neglecting the resource-poor and landless, including
women. To compound the problem, extension meetings are often scheduled at times when
women farmers are unable to attend because of their other household responsibilities.
As rural women are a vital link in agricultural development, it is essential that they
take their place alongside men as full participants in and beneficiaries of extension
programmes.
Extension Reforms
On the basis of experience gained during the implementation of the Extension
Reforms scheme from 2005 to 2009 the Government of India has revised the ongoing
Centrally Sponsored Scheme “Support to State Extension Programmes for Extension Reforms”
by modifying and strengthening the earlier Scheme.
The revised scheme provides for dedicated specialist and functionary support to take
up training and extension initiatives at State, District and Block level. Besides this,
improvement in extension outreach right down to the village level is expected to be achieved
through Farmer Friend.
The cost norms of selected ongoing activities have also been revised and some new
need-based activities have been introduced under ATMA Cafeteria, 2010.
As per the revised guidelines at least 50% beneficiaries must be small and marginal
Farmers and 30% beneficiaries should be women farmers / farm women. Minimum 30% of
resources meant for programmes and activities are required to be allocated to women
4
farmers and women extension functionaries. Specific documentation of expenditure on
women farmers activities and performance is also expected to be maintained by the
implementing authorities.
The guidelines have also made a provision for involvement of women farmers in all
decision making bodies of ATMA. The ATMA Governing Board (GB) is a policy making body
which provides guidance reviews and steers the progress and functioning of the ATMA. As
per the guidelines there should be thirty per cent of women farmer representatives on the
Governing Board of ATMA to ensure that their interests are fully represented. The ATMA
Management Committee (AMC) would be responsible for planning and execution of day-to-
day activities of ATMA. The composition of AMC is basically of all the heads of the
departments in the district, representatives of farmer’s organizations, NGO, bank and Project
Office of DRDA. A provision has been made to include two progressive farmers as committee
members out of which one should be a woman. The Block Farmers Advisory Committee
(BFAC) shall consists of 20-25 members covering different categories of farmers within the
given Block, with due representation to women farmers.
Objectives of the Extension Reforms Scheme
The revised scheme focuses on the following key extension reforms.
Providing innovative, restructured and autonomous institutions at the state/ district/
block level.
Encouraging multi-agency extension strategies involving Public/ Private Extension
Service Providers.
Ensuring an integrated, broad-based extension delivery mechanism consistent with
farming system approach.
Adopting group approach to extension in line with the identified needs and
requirements of the farmers in the form of Commodity Interest Groups (CIGs) and
Farmers Interest Groups (FIGs)
Facilitating convergence of programmes in planning, execution and implementation.
Addressing gender concerns by mobilizing farm women into groups and providing
training to them.
Moving towards sustainability of extension services through beneficiary contribution.

5
Need for the study Since the revised guidelines (2010) are under implementation for more than 4 years
with specific provision for women farmer’s activities, it is felt that there is a need to assess
the impact of ATMA’s initiatives on women farmers. In view of this “An impact study on
Interventions made for Gender Mainstreaming under the Extension Reforms Scheme” is
proposed to study various field/extension activities undertaken by ATMAs to empower
women in agriculture and allied sectors, identify the constraints in implementation of
activities for the target group and suggest measures for improving extension services for the
women in agriculture and allied activities.
Objectives of the study: The objectives of the study are as follows:
The overall objective is to assess the impact of the ATMA interventions on women
farmers.
The specific objectives are:
To identify the activities implemented under ATMA, using the 30 % fund allocated.
To understand the processes adopted for identifying the women farmers’/ women
groups’ needs and corresponding activities
To examine the role-played by women farmers’ representatives in decision making
bodies, ex; Block Farmers Advisory Committee (BFAC) and Governing Board (GB) of
ATMA.
To analyze the impact of ATMA activities on women farmers
To suggest appropriate measures so as to improve the effectiveness of the scheme
further.

6
II. Review of Literature
1. Status of Women in Agriculture and Allied Activities
Out of the twelve practices studied men were involved more than women in eight
practices and vice-versa in the remaining four practices, the study conduct by Suguna and
Subramanyan (2000) revealed that farm operations are sex specific. The tasks assigned to
men were demanding greater physical power and skill for performance whereas the tasks
assigned to women were demanding less physical power, lower skills and monotonous.
Gupta and Kaur 2008 conducted a study on role of women in the economically
vulnerable households with special reference to dairying in Biejapuri block of Agra district,
Uttar Pradesh and reported that women’s participation was 100 per cent in milk processing,
making cow dung cakes and feeding young calves and cleaning sheds, 70.00 per cent in
milking of buffaloes/cow and in soaking and boiling concentrates, 50.00 per cent in cleaning
and bathing the buffaloes, offering the concentrate mixture and harvesting and bringing of
fodder from fields, 40.00 per cent in feeding fodder and 20.00 per cent in sale of milk and
grazing of buffaloes/ cows. It can be observed from the above studies that majority of the
farm women participated in those activities that were carried outside the public domain.
Singh and Sengupta, 2009 reported that 94.0% of the female agricultural labor force
involved in cereal production, while 1.40% worked in vegetable production, and 3.72% were
engaged in fruits, nuts, beverages, and spice crops. Further women's participation rate in the
agricultural sectors is about 47.0% in tea plantations, 46.84% in cotton cultivation, 45.43%
growing oil seeds and 39.13% in vegetable production.
Chayal, 2010 conducted a study in Bundi district of Rajasthan to analyze the
participation of women in agriculture found that cutting, picking, cleaning of grains, drying of
grains, storage and processing are the major farm operations wherein women participation
was 100 percent. In winnowing, weeding, gap filling, grading, shifting produce to threshing
floor and cleaning the participation of women was more than 75.0 percent. The tasks in which
women participation was varied between 50.0-75.0 percent were thrashing, raising nursery
for seedlings and thinning. The results also show that 25 to 32.5 percent of sowing, manure

7
application and irrigation were performed by women. Least involvement of farm women was
found in ploughing of field (2.0%) and in fertilizer application (1.0%). There was no
participation of women reported in marketing and plant protection measures.
Nain and Kumar, 2010 revealed that extent of women involvement was maximum in
operations like weeding and harvesting (96.66%) followed by transplanting (93.33%),storage
(71.66%),threshing (45%) and arranging seeds (43.33%). There was a least involvement of
farm women in field preparation (38.33%), marketing (23.33%), sowing and irrigation (20%)
and application of fertilizers (11.66%). The farm women face constraints like non-availability
of inputs on time (88.33%), low price of produce (86.66%) and less involvement in decision
making (76.66%). Farm women also reported heavy drudgery level in operations like field
preparation, threshing and marketing.
FAO, 2011 reported that during 2010 India constituted 48.4 percent of female
population and among these 69.9 percent were residing in the rural areas. Further 28.6
percent of the female were economically active and their agriculture share was 61.8 percent.
It was also found that from the economically active population the total agriculture share was
54.4 percent and among which 32.4 percent comes from women workers.
UN WOMEN, 2012 reported that 79.0 per cent of rural female workers are still in
agriculture, 60.0 percent women in fisheries and higher proportion of women (16.0 per cent)
relative to men (3 per cent) are involved in livestock.
Chittedi and Dommati, 2012 in their study showed that female work participation rate
has declined and season wise irrigation facility is the main factor that determines the
employment and wages of the agricultural women labor. In Andhra Pradesh, male
participation was more in categories of cultivators and other workers whereas, female
participation rate was more for the category of agricultural laborers and household industry,
but the rate was less in the case of cultivators and other workers.
Borkakoty, 2013 reported that all farm women were involved in operation like cutting,
picking, drying of grains, cleaning of grains, storage and processing. More than 75.0 percent
women were involved in operation like cleaning of field, weeding, gap filling, shifting

8
production to threshing field, winnowing and in grading. Women participation varied
between 50 – 75.0 percent in operations like raising nursery, thinning and threshing. The
result also showed that operations like sowing, manure application and irrigation were
performed on field by 25 to 32.5 percent women. Further it was revealed that only 1.92
percent of farm women involved in ploughing of field followed by fertilizer application (1.0%),
plant protection measure (0.72%) and in marketing (0.72%).
2. Role Played by Women in Decision Making in Farm Related Activities
Gupta et al.1999 analyzed the data regarding the participation of women in decision
making related to agriculture and allied activities in Uttar Pradesh and reported that only 13.0
percent women were consulted for preparation of land and only 10.0 percent of these
opinions were considered. The overall pattern of decision making showed that 62.0 percent
of the decisions were took by husband alone and women participation was only 10.50
percent.
Saikia in 1999 conducted a study in Assam to assess the involvement of women in
decision making process and found that in male headed households, 15.0 to 34.0 percent of
the female played major roles in decision making where their decisions were accepted in
regard to farm production activities, 33 to 47 percent of them played an equal role along with
the males and 18.0 to 52.0 percent of them had only a minor role. The proportion of females
playing a major or equal role was highest in the selection of crop variety, while financial
matters, the involvement of females was relatively less.
Singh and Singh, 1999 conducted a study to analyze the impact of women participation
in agriculture work and their role in decision making process about economic and household
matters in Chamoli and Almora districts of Uttrakhand. The study revealed that though the
women performed more than four- fifth of the agricultural work, their decisions were
accepted only in less than one – third of the cases. The power to take or influence the
decisions by farm women were found to be high in the matters related to seed selection (29.0
%), purchase of agricultural implements (30.0%) and sale and purchase of livestock (34.0%).
Tuteja, 2000 based on the study in Haryana state concluded that decision making of
farm women about sales and purchase of land was positively related to farm size i, e. higher

9
the size of farm better the involvement. Farm women of the big households involved in the
decision on farm credits (61.54%) and on sale and purchase of animals (77.0%). The
participation of female labourers in decision making was poor in those fields where women
had low exposure such as variety to be sown, farm credits and marketing of products.
Parveen, 2007 conducted a study in three villages of Mymensingh, Bangladesh to
study the farm women’s participation in agricultural decision-making. The results showed that
the farm women’s the participation in decision-making on agricultural aspects was limited.
Decisions regarding selling agricultural products were ranked first followed by technology
adoption, land acquisition.
Gowda and Gowda, 2010 revealed that majority of dairy farmwomen took decisions
jointly with the husband / male member regarding dairy management practices. Among the
decisions taken by the farmwomen, 31.90 per cent of the farmwomen were taking decision
to sell the quantum of milk after keeping for home consumption followed by area under green
fodder (13.40%) and quantity of feed and roughages (11.70%).
Chayalet al. 2013 in her study found the very low involvement of farm women in
decision making in agriculture. Results indicated that marketing of agri-inputs and farm
produce (9.17%), manure/ fertilizer selection (10.0%) and manure/ fertilizer application
(12.5%) were the activities wherein involvement was minimum whereas it was 51.17 percent
in harvesting operations and 40.83 percent in preparation of the fields. Illiteracy, little
knowledge about the latest techniques of farming, dominance by males and restricted
mobility due to several cultural taboos were the main factors involved in the low decision
making of women in agriculture.
3. Impact of Extension Programmes / Services on Women in Agriculture Kumari 2004 assess the impact of mutually aided cooperatives and found that there
was a significant increase in income generating activities and preferred activities for income
generation were in the field of business, animal husbandry and other trade categories like
farming and agribusiness activities. Apart from this there was an increase in their personal
savings and family social development.

10
Ministry of Foreign Affairs, 2004 in their report evaluated the impact of four major
training programmes in India on women in Madhya Pradesh, Karnataka, Orissa and Tamil
Nadu. In all the projects it was found that after participating in training projects more farm
women were involved in technical farming matters, marketing and decision making in farm
related operations. Besides this they joined women groups which resulted in more social
contacts, widening of the opportunities and positive change in their self-perception. Most of
these women groups involved in savings and credits, thus addressed practical needs of
women which has boosted their self-respect, sense of group belongingness and the respect
they won from bank and local officials.
Karkaret al., 2007 in their paper “Farm women’s behavior to agricultural entre-
preneurship on improved mango cultivation” indicated that three fourth (80.0%) trained farm
women belong to medium social participation and untrained (68.0%). Further extension
participation was also studied and found that 72.0 percent trained farm women had extension
contact whereas it was 68.0 percent for untrained farm women. Suggestions given for making
training more effective these were, training venue should be Farmers Training Centre (FTC),
time should be during- slack season, training method should be lecture with practical followed
by lecture with discussion and demonstration and field visits and preferred female teacher
for training.
Kripa and Surendranathan, 2008 studied the social and women empowerment in
Kerala through Mussel farming in Kerala. It was revealed that for adopting any technology
only training is not sufficient, there is also requirement of credit supply and group formation
(SHG’s), because of this only more than 3,000 women becoming owners of mussel farms,
which helped women overcome social inhibitions and prove their competence.
Nain and Kumar, 2010 studied the information sources use and the preferences of the
women for agricultural purposes. It was found that majority of them were relied either on
their husband (85%) or other members of the family (61.67%). Other women of the village
also seemed to be valid source of information and used by 31.67 per cent of the respondents.
Interaction with other agricultural professionals like university/KVK scientists (30.00 %), input
dealers (21.67 %) and extension staff of the state line department (11.67 %) was also
reported. Other than this it was noticed that radio and TV was being utilized by 32.0 percent

11
and 25.0 percent illiterates respectively whereas only 5.0 percent literate women utilize
printed material. Whereas women farmer did not perceive the importance of the information
sources as they used them, TV, radio, University/KVK scientists, extension staff of the line
department and input dealers were perceived as important source of information regarding
farm management
Gowda and Gowda, 2010 they surveyed the extension workers in Karnataka to find
out the most commonly used extension method by them and it was found that group
discussion method was most frequently used extension method to educate the farm women
in the village situation. Whereas dairy farm women expressed restrictions at home, suitability
of time, lack of women groups in the villages and pressure of household work were the major
constraints faced by them in participating group discussions.
Shankaraiah et al. 2012 studied the dissemination of the farm related information
through Mobile Message Service (MMS) in a rural area of Karnataka and indicated that
indicated that agricultural technologies on crop management(52.5%), marketing (80.0%),
Horticultural technologies on tissue culture (55.0%), floriculture (50.0%), veterinary
technologies on dairy (70.0%), poultry (52.50%) and others on weather information (77.50%)
were rated as more relevant technologies disseminated through the MMS network.
Singh and Jha, 2012 studied the impact of ATMA model in Bihar, and observed that
there was13.0 percent increase in the yield of crop along with an increase of farm income of
14.0 percent due to the adoption of new technologies, enhanced awareness, capacity and
development of skills about the modern production technologies and improved research-
extension-farmer linkage. It has also played an important role in empowerment of rural
women by imparting trainings to more than13.5 thousand women for enhancing their skills
and technical capabilities women in various relevant areas like cultivation of high-value crops
(vegetables, mushroom, medicinal and aromatic plants, etc.), modern technologies of dairy
farming, small-scale value addition e.g. sattu making, (floor of roasted chickpea, cereals, etc.),
mother & child care, etc. Overall there was improvement in the quality of life and
empowerment of farming community, including women leading to the sustainability of the
approach/ system and equity.
12
4. Strategies for reaching out Women Farmers Haffis and Reddy, 2000 suggested that intensive training programmes at village
panchayat level through a farmer’ training Centre not only produce an employment effect but
also bring empowerment to the farm women and surely resulted to better livelihood to all,
particularly for farm women.
Ministry of Foreign Affairs, 2004 that village based training should be organized
instead of institutional trainings and there should be follow-up training for both female
farmers and extension staff, to mainstream gender in general extension services, training
sessions, workshops and a course in ‘gender issues’ should be conducted for male staff at all
levels and special provisions should be made for farm women and very poor farmer in the
market driven and privatized extension services.
ZarQuresh 2005 has mentioned in his paper “Role of Rural Women” that role of
women in agriculture sector is as important as men, therefore, women should educate
themselves in agriculture particularly in floriculture and food preservation.
Tiwari, 2010 based on the findings of the study conducted in Uttar Pradesh
recommended that farm women should have availability of agriculture inputs at reasonable
cost and at right time, convenient availability of sufficient loans, equal remuneration and
adequate training in the technological area related to farming so that the capabilities of farm
women will enhance.
Dewanganet al. 2011 in their study “Socio-Economic Empowerment of Tribal Women
through Sericulture” a Study of Lailunga Block of Raigarh District, Chhattisgarh, reported that
among the different activities performed by the women sericulture is the only activity in
which major part is done by women alone. And thus to make women economically
independent and empowered there is a need to focus on women friendly technologies,
training cum study visits to women and facilities for husbands to participate, create “Women
Development Fund” and provide interest subsidies on credit.
13
Anonymous 2012, in the global conference of women in agriculture it was discussed
that gender inequalities run right through agricultural system and action is required at all
levels from household and community up to national and international level. Thus priorities
were determined and these were collective advocacy to raise awareness of women needs in
agriculture, generating the evidence base to show the impact and values of addressing
women needs, spurring collective action and leadership among women to develop
programmes that directly meet women needs, addressing discrimination and women’s right
and measures to promote women’s ownership and control of resources.
Chittedi and Dommati, 2012 in their study made some suggestion to have gender
equity in agriculture. They said there should be equal pay for men and women for equal work,
equal rights to property and to common resources, agricultural rural women should be
considered as client of agricultural research and development programs or as users of
improved technology, irrigation facilities should be provided in un-irrigated areas. As gender
equity depends on how much rights women have over resources because of the position of
women in different spheres.
Sandu, et al, 2012 studied the barrier to finance experienced by female farmers. Due
to the feminization of agriculture government have to address the financial needs of farm
women especially the marginal farm women. They suggested, to realize the full potential of
women in agriculture, government, policy makers and financial institutions need to recognize
the emerging female customer and a greater need for education and information to enable
lending mangers to understand the needs of female farmers, especially in the absence of
collateral.
Sreelata and Naomi, 2012 suggested that for mainstreaming the women in agriculture
there is a need to build up women friendly tools and make them available to women farmers
at cheaper rates so that not only there is ending of invisibility of women contribution in
agriculture but also eliminating the drudgery that blights the lives of millions of working
women in agriculture around the world.

14
III. Methodology
Selection of the state
As per the information available with the Ministry of Agriculture, Government of India,
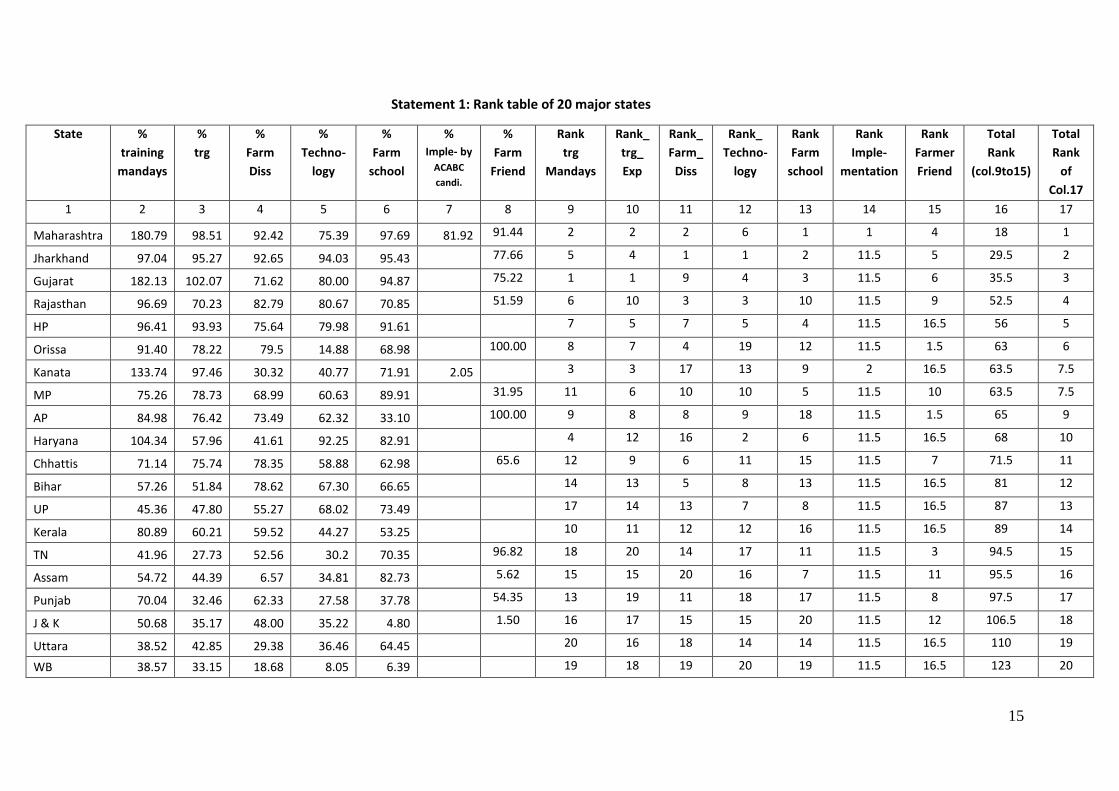
out of 20 major states in the country where ATMA was implemented, six states were selected.
The criterial being both physical and financial performance indicators of the scheme during
2012-13. In all, seven such indicators (as given below), were considered and all the 20 major
states were ranked based on each of the indicators and finally based on the overall rank, all
the 20 states have been arranged and classified into three groups viz., high, medium and low
performance groups and from each group two states have been randomly chosen giving due
weightage to the regions. The states so selected are Assam (North East), Andhra Pradesh
(South), Jharkhand (East), Madhya Pradesh (Central), Maharashtra (West) and Uttarakhand
(North). (Statement-1 showing the rank position of 20 major states based on the composite
rank is at the end of this section).
Physical achievement of farmer oriented activities,
Financial achievement of farmer oriented activities,
Financial achievement of farm information dissemination activities,
Financial achievement of agriculture technology refinement activities,
Financial achievement for farm school,
Financial achievement for implementing extension activities through agri-
entrepreneur and
Financial achievement for recruiting farmer friend.
Selection of the District and Block
One district from each selected state and three to six blocks/mandals from each
selected district were selected randomly for the study. Two cover the required sample size
two districts were selected in Andhra Pradesh. The names of the blocks/mandals covered in
the study are given in statement-2
15
Statement 1: Rank table of 20 major states
State %
training
mandays
%
trg
%
Farm
Diss
%
Techno-
logy
%
Farm
school
%
Imple- by
ACABC
candi.
%
Farm
Friend
Rank
trg
Mandays
Rank_
trg_
Exp
Rank_
Farm_
Diss
Rank_
Techno-
logy
Rank
Farm
school
Rank
Imple-
mentation
Rank
Farmer
Friend
Total
Rank
(col.9to15)
Total
Rank
of
Col.17
1 2 3 4 5 6 7 8 9 10 11 12 13 14 15 16 17
Maharashtra 180.79 98.51 92.42 75.39 97.69 81.92 91.44 2 2 2 6 1 1 4 18 1
Jharkhand 97.04 95.27 92.65 94.03 95.43 77.66 5 4 1 1 2 11.5 5 29.5 2
Gujarat 182.13 102.07 71.62 80.00 94.87 75.22 1 1 9 4 3 11.5 6 35.5 3
Rajasthan 96.69 70.23 82.79 80.67 70.85 51.59 6 10 3 3 10 11.5 9 52.5 4
HP 96.41 93.93 75.64 79.98 91.61
7 5 7 5 4 11.5 16.5 56 5
Orissa 91.40 78.22 79.5 14.88 68.98 100.00 8 7 4 19 12 11.5 1.5 63 6
Kanata 133.74 97.46 30.32 40.77 71.91 2.05
3 3 17 13 9 2 16.5 63.5 7.5
MP 75.26 78.73 68.99 60.63 89.91 31.95 11 6 10 10 5 11.5 10 63.5 7.5
AP 84.98 76.42 73.49 62.32 33.10 100.00 9 8 8 9 18 11.5 1.5 65 9
Haryana 104.34 57.96 41.61 92.25 82.91
4 12 16 2 6 11.5 16.5 68 10
Chhattis 71.14 75.74 78.35 58.88 62.98 65.6 12 9 6 11 15 11.5 7 71.5 11
Bihar 57.26 51.84 78.62 67.30 66.65
14 13 5 8 13 11.5 16.5 81 12
UP 45.36 47.80 55.27 68.02 73.49
17 14 13 7 8 11.5 16.5 87 13
Kerala 80.89 60.21 59.52 44.27 53.25
10 11 12 12 16 11.5 16.5 89 14
TN 41.96 27.73 52.56 30.2 70.35 96.82 18 20 14 17 11 11.5 3 94.5 15
Assam 54.72 44.39 6.57 34.81 82.73 5.62 15 15 20 16 7 11.5 11 95.5 16
Punjab 70.04 32.46 62.33 27.58 37.78 54.35 13 19 11 18 17 11.5 8 97.5 17
J & K 50.68 35.17 48.00 35.22 4.80 1.50 16 17 15 15 20 11.5 12 106.5 18
Uttara 38.52 42.85 29.38 36.46 64.45
20 16 18 14 14 11.5 16.5 110 19
WB 38.57 33.15 18.68 8.05 6.39
19 18 19 20 19 11.5 16.5 123 20

16
Statement 2: Coverage of Sample
S.N
o State District Block(s)
No. of
Women
farmers
covered
No. of women
farmer
representatives
No. of
Extension
Functionaries
1 Jharkhand
East
Singhbum
Potka
80
7
7 Chakuliya
Ghatsila
2 Maharashtra
Satara
Phaltan
80
7
7 Satara
Koregaon
Karad
3 Madhya
Pradesh
Hoshanga
bad
Kesla
80
7
7 Hoshangabad
Seonimalwa
4
Andhra
Pradesh
East
Godavari
Ramchandrapuram
40
7
7 P.Gannavaram
Pitapuram
Alamuru
West
Godavari
Elluru
40
7
7 Tadepallegudem
Bhimavaram
Chintalapudi
5 Assam
Darrang
Bechimari
70
7
7 Pub Mangaldoi
Dalgaonsilamari
6
Uttarakhand
Dehradun
Raipur
67
7
7
Vikanagar
Doiwala
Sahaspur
Kalsi
Total 457 37 37

17
Respondents for the Study:
For the purpose of the study, three different groups of respondents such as, women farmers
engaged in ATMA activities; women farmer representatives on the Governing Body of ATMA,
DFAC and BFAC; and extension officials implementing ATMA.
Sample selection: The procedure followed for selection of each respondent group is spelt out
below:
a. Selection of women farmers: From each selected block a list of women farmers who
have been exposed to the ATMA interventions during 2012-13 was prepared. From
these lists 65-80 women farmer beneficiaries were selected randomly for collection of
the data through personal interviews. Though the sample size for each district was
fixed at 65-80 women farmers, this number could not be reached in some districts
due to the variations in the coverage of women farmers in ATMA activities.
b. Selection of Women Farmer Representatives: From each district a total of six women
farmers, representing the Governing Board (GB) of ATMA, District Farmers’ Advisory
Committee (DFAC) and Block Farmers’ Advisory Committee (BFAC) were selected
randomly. A total of 36 women farmer representatives were interviewed for the
study.
c. Selection of the Extension Officials: From each state, six extension officials were
selected for the interviews and they included Project Director (ATMA), BTM,
Programme Coordinator of KVK and the officials of allied department involved in
implementation of extension activities for women farmers under ATMA. A total of 36
officials were interviewed for the study. Statement-2 gives the details of the samples
selected.

18
STATES SELECTED FOR THE STUDY
1
2
3
1
4
5
4
6

19
DISTRICTS SELECTED FOR THE STUDY
(East Singhbum, Jharkhand)
(Satara,Maharashtra)
20
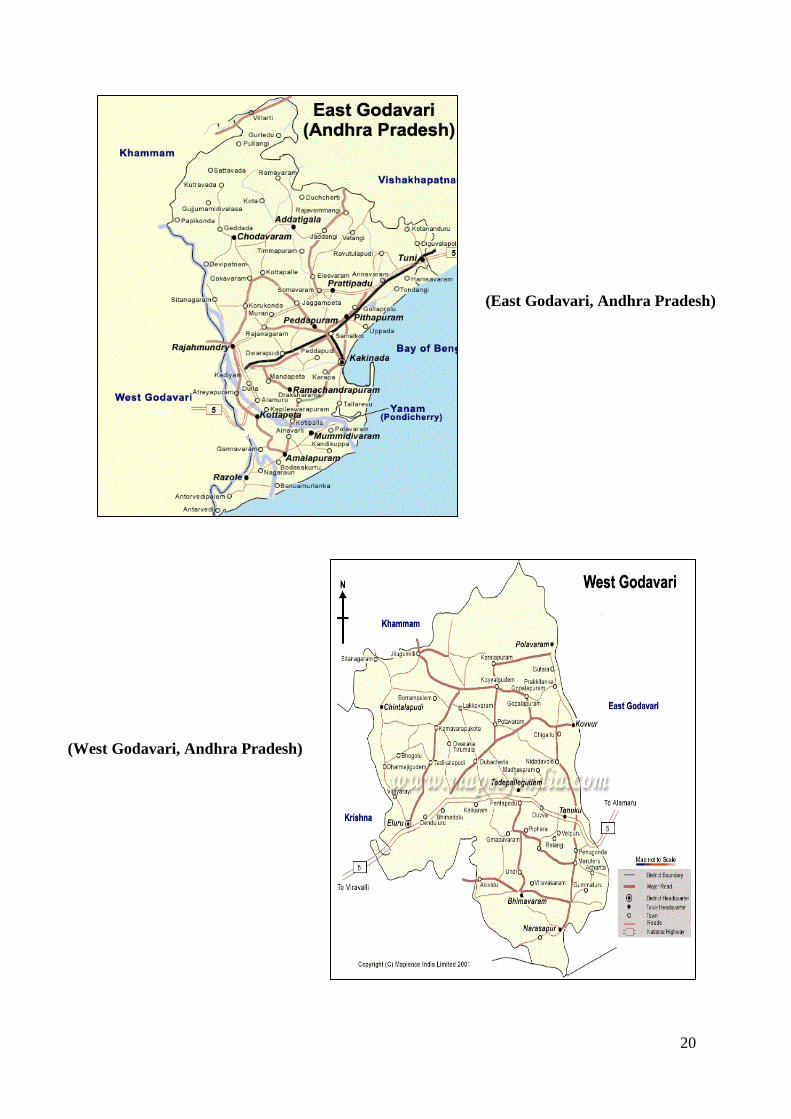
(East Godavari, Andhra Pradesh)
(West Godavari, Andhra Pradesh)

21
(Hoshangabad, Madhya Pradesh)
(Dehradun, Uttarakhand)

22
(Darrang, Assam)
Data collection:
Separate interview schedules were prepared for the women farmers, women farmer
representatives of the committees and extension officials of ATMA. These interview
schedules were pretested in the field which helped to fine-tune the questions. Besides
personal interviews, ‘Focus Group Discussions meetings ' were conducted wherever possible.
Secondary data concerning ATMA were collected from various records and
registers maintained at district and state levels of the study states.
A team of research staff comprising Research Fellow and three field Investigators- with
experience in data collection at community level and well versed in local language
participated in data collection along with the faculty of MANAGE. Thorough training was given
to the field investigators on the concepts used in the schedules, before they were put on the
job of data collection.

23
Data analysis
The socio-economic particulars of sample women farmers and others are discussed
using simple percentages. For capturing the status/ reactions of the respondents on/ to
various impact dimensions including social participation, technological/ skill upgradation
etc. a three- point scale was adopted consisting of cues like unfavourable, neutral and
favourable with scores of 1, 2 and 3 respectively. To facilitate discussion, average scores
are computed of respondents on each dimension for each state. However, as the data related
to the samples only, randomly drawn from the (respective populations), a statistical test-
Analysis of Variance, was carried out to test whether all the states (sample women farmers)
are on the same footing on a given dimension or they differ. The five dimensions that were
considered for analysis include social participation, technological and skill upgradation,
economic impact, psychological and managerial impact and improvement in extension
services. Appropriate statistical inferences were drawn based on the value of F-ratio
computed in respect of each dimension.
24
IV. Results and Discussions
In accordance with the objectives, the results have been presented under various sections:
1. General profile of the respondents
2. Activities implemented
3. Process adopted for identifying needs and activities
4. Role-played by women farmers’ representatives in decision making bodies
5. Impact of ATMA on women farmers
1. GENERAL PROFILE OF THE RESPONDENTS
A. Profile of the women farmers:
Table 1 reveals the socio-economic profile of the women farmer respondents. A total of 457
respondents were covered in the study and it was found that the majority of the women
farmer respondents age was about 38 years. It was found from state wise analysis that the
mean age ranges from 33 to 41 years. Looking at the education parameter data shows that
most of the respondents (30.9%) were having an education up to high school and a similar
pattern was found in Assam (50.0), Maharashtra (38.8%) and Andhra Pradesh (33.8%).
Whereas the largest number of illiterate respondents were found in Madhya Pradesh (62.5%)
followed by Jharkhand (23.8%) as most of the respondents were belonging to the tribal
population. More than half (62.4%) of the respondents belong to nuclear families. In all the
states proportion of respondents belonging to nuclear and joint families was almost equal,
but in states like Assam (87.1%), Andhra Pradesh (76.2%) and Jharkhand (60.0%) majority of
the respondents were from joint families. The difference was found very high in case of Assam
this might be, because in the selected district, for many years government has been running
many programmes for education and family planning which lead to significant adoption of
the birth control methods (S. Rezia, 2013). It was also found that majority of the respondents
were married and only 6.12 percent were unmarried, widow and divorced.
Parameters like household income, land holding and women ownership to land were
considered in assessing the economic status of the respondents. It was found that the average
annual income of the households of sample states was Rs 94,350 where a major proportion
of the income was coming from farm activities (Rs.84,844) in comparison to non-farm
activities (Rs 34,890). In Andhra Pradesh, Assam and Maharashtra the annual income

25
Table 1: Socio economic profile of the women farmers
S No State
Parameter
Andhra Pradesh (n=80)
Assam (n=70)
Jharkhand (n=80)
Madhya Pradesh (n=80)
Maharashtra (n=80)
Uttarakhand (n=67)
Total (N=457)
1 Mean Age (years) 37 33 36 40 41 41 38
2 Education
Illiterate 16 (20.0) 10 (14.3) 19 (23.8) 50 (62.5) 10 (12.5) 02 (3.0) 107 (23.4)
Able to read Write 03 (3.8) 01 (1.4) 07 (8.8) 04 (5.0) 02 (2.5) 03 (4.5) 20 (4.4)
Primary 18 (22.5) 20 (28.6) 25 (31.2) 19 (23.8) 13 (16.2) 23 (34.3) 118 (25.8)
High school 27 (33.8) 35 (50.0) 23 (28.8) 7 (8.8) 31 (38.8) 16 (23.9) 139 (30.4)
Intermediate 09 (11.2) 04 (5.7) 03 (3.8) 0 (0) 15 (18.8) 12 (17.9) 43 (9.4)
Diploma 01 (1.2) 0 (0) 02 (2.5) 0 (0) 0 (0) 0 (0) 03 (0.7)
Graduate and above 06 (7.5) 0 (0) 01 (1.2) 0 (0) 09 (11.2) 11 (16.4) 27 (5.9)
3 Mean Income (Rs)
Total income 1,01,525 1,36,799 44,256 88,850 1,30,263 64,933 94,350
Farm income 89,450 1,01,293 39,641 72,381 1,52,688 50,007 84,844
Non-farm income 37,152 69,039 14,200 21,442 61,000 25,897 34,890
4 Family type
Joint 19 (23.8) 9 (12.9) 32 (40.0) 40 (50.0) 43 (53.8) 29 (43.3) 172 (37.6)
Nuclear 61 (76.2) 61 (87.1) 48 (60.0) 40 (50.0) 37 (46.2) 38 (56.7) 285 (62.4)
5 Marital Status
Married 75 (93.8) 66 (94.3) 71 (88.8) 77 (96.2) 75 (93.8) 61 (91.0) 425 (93.0)
Unmarried, Widow Divorced 05 (6.25) 04 (5.71) 05 (6.2) 03 (3.75) 05 (6.25) 06 (8.95) 28 (6.12)
6 Household land holding mean (acres)
Wet land owned 6.2 2.1 1.7 5.0 4.2 1.2 3.3
Wet land leased 3.7 1.1 2.6 3.8 2.8 1.1 2.9
Wet land operational 6.0 2.1 1.8 5.0 4.4 1.2 3.4
Dry land owned 3 1.2 1.6 4.1 2.6 2.6 2.5
Dry land operational 3 1.5 1.6 3.8 2.4 2.0 2.3
7 Land owned by women (acres)
Number of women owning land 23 (28.75) 13 (18.57) 09 (11.25) 19 (23.7) 27 (33.75) 6 (8.95) 97 (21.22)
Average land holding 2.72 0.75 1.56 3.7 1.3 0.56 2.0
8 Farming experience (years) 15 10 17 18 15 17 16
9 Social group
Member 72 (90.0) 60 (875.71) 54 (67.5) 49 (61.25) 64 (80.0) 56 (83.58) 355 (77.68)
Non member 08 (10.0) 10 (14.28) 26 (32.75) 31 (38.75) 16 (20.0) 11 (16.41) 102 (22.31)
26
was coming from farm activities (Rs.84,844) in comparison to non-farm activities (Rs 34,890). In
Andhra Pradesh, Assam and Maharashtra the annual income of the households was above one
Lakh whereas for Uttarakhand (Rs. 64,933) and Jharkhand (Rs. 44,256) it was found lowest. The
reason for having high annual income in Andhra Pradesh and Assam could be due to fertile lands,
good irrigation facility, low mechanization cost. In case of Maharashtra it was found that more
focus was on allied activities and irrigation facilities were increased during the past years. The
major reason for having low annual income in Jharkhand were irrigation problem, small land
holdings and low education level as most of them belong to tribal area, whereas in Uttarakhand
major cause of low annual income was high cost of mechanization or labour. On an average it
was found that 3.4 acres of wetland were operational which was slightly more than wetland
owned by the households which shows that a very less number of families were involved in the
leasing of land, whereas in spite of the irrigation problems, a major portion of dry land was found
operational to meet the economic needs of the families.
State wise data (Table 1) shows that families of Andhra Pradesh (6.2 acres) and Madhya
Pradesh (5.0 acres) were having more wetland as compared to the other states due to the
presence of Godavari and Narmada rivers respectively. In these states leasing of land was also
found more- Andhra Pradesh (3.7 acres) and Madhya Pradesh (3.8 acres). The least landholding
for the households were found in Assam and Uttarakhand this is due to the fragmentation of
the families. In Assam the wet and dry land owned by the families were found 2.1 acres and 1.2
acres and similarly in Uttarakhand it was 1.2 acres and 2.6 acres respectively. In spite of having
less land under the cultivation, the income of Assam households were found high because of
high cropping intensity by growing three crops in a year and cultivation of high value crops like
wheat, rapeseed, mustard, sugarcane, vegetables, spices and condiments are other major crops
grown throughout the year. Whereas, Uttarakhand belongs to the hilly region and rainwater is
the only major source for cultivation.
It was revealed from Table 1 that only 21.22 percent of the women farmer respondents
owned the land in their name. Looking at the state wise data it was found that Madhya Pradesh
was having the largest number (33.75 %) of women owning land in their name followed by
Andhra Pradesh (28.75%) and Jharkhand (23.7 %). A contributing factor for the situation was
strict implementation of laws, projects and schemes related to land right and ownership for the
women. Whereas, it was only 8.95 percent in case of Uttarakhand due to the fact that a most
of the families don’t go for registration even in the cases of male child, so, either the new land

27
purchased was in the name of the female or the very old women farmers who were inherited
land from their parents during their marriages.
Fig 1: Literacy level of the women farmers
Fig 2: Details of farm and non- farm income of women farmers
0
20
40
60
80
100
AndhraPradesh
Assam Jharkhand
MadhyaPradesh
Maharashtra
Uttarakhand
0verall
literacy 80 85.7 76.2 37.5 87.5 97 76.6
lite
racy
pe
rce
nta
ge (
%)
Literacy
0
20,000
40,000
60,000
80,000
100,000
120,000
140,000
160,000
AndhraPrades
h
Assam Jharkhand
Madhya
Pradesh
Maharashtra
Uttarakhand
0verall
farm income 89,450 101293 39641 72,381 152688 50,007 84,844
non farm income 37,152 69,039 14,200 21,442 61,000 25,897 34,890
Inco
me
in R
s
Income

28
Fig 3: Size of land holding of women farmers
Fig 4: Percentage of women farmers in groups
It was found that on an average 2 acres of land was owned in the name of women farmer
respondents where it was found highest in Andhra Pradesh (2.72 acres) followed by Jharkhand
(1.56). It was highest in Andhra Pradesh due to the practice of Streedhan for a long period, but
for the women farmer respondents in Jharkhand it was found that only 11.25 percent of the
women farmers own the land in their name. When farming experience of the women farmers
respondents was reported it was found that, most of the women farmer respondents have 16
0
0.5
1
1.5
2
2.5
3
3.5
4
AndhraPradesh
Assam Jharkhand
MadhyaPradesh
Maharashtra
Uttarakhand
0verall
land holding 2.72 0.75 1.56 3.7 1.3 0.56 2
Ave
rage
lan
dh
old
ing
by
wo
me
n in
acr
es
Land holding (acres)
0
10
20
30
40
50
60
70
80
90
AndhraPradesh
Assam Jharkhand
MadhyaPradesh
Maharashtra
Uttarakhand
0verall
member in group (%) 90 75.71 67.5 61.25 80 83.58 77.68
(%)
Membership in Group

29
years of experience, although it ranges from 10 years in Assam to 18 years in Madhya Pradesh.
In the selected district of Assam it was found less in comparison to the other states and due to
the reason that most of the women farmers were mainly involved in allied sectors in comparison
to main agriculture crops.
From the Table 2 it was found that 77.68 percent of the respondents were members of
one or the other social groups like Self Help Groups (SHG’s), Mahila Mandals, DWCRA, Fisheries
Society, etc. Among all the states, Andhra Pradesh has highest number of the respondents
(90.0%) who were members in DWACRA groups whereas in other states most of the women
were members in Self Help Groups (SHG’s).
Table 2: Activities performed by the women farmers in their respective social groups
S No
Subjects
Andhra Pradesh
n=80
Assam
n = 70
Jharkhand n = 80
Madhya Pradesh
n =80
Maharashtra
n = 80
Uttarakhand
n = 67
Total
N = 457
1 Savings and credit
67 (83.75)
57 (81.43)
51 (63.75)
47 (58.75)
61 (76.25)
54 (80.6)
337 (73.74)
2 Agriculture 01 (1.25)
04 (5.71)
37 (46.25)
26 (32.5)
09 (11.25)
48 (71.64)
125 (27.35)
3 Animal husbandry
02 (2.5)
21 (30.0)
- 07 (8.75)
21 (26.25)
10 (14.9) 61 (13.34)
4 Fisheries 03 (3.75)
01 (1.42)
02 (2.5)
- - - 06 (1.31)
5 Sericulture - 3 (4.28)
01 (1.25)
02 (2.5)
01 (1.25)
01 (1.5)
08 (1.75)
6 Processing & value addition
01 (1.25)
04 (5.71)
17 (21.25)
- 08 (10.0)
02 (3.0)
32 (7.0)
7 Farm equipment & machinery
03 (3.75)
- - - - - 03 (0.7)
8 Nonagricultural activities
04 (5.0)
06 (8.58)
05 (6.25)
16 (20.0)
02 (2.5)
03 (4.5)
36 (7.9)
Figures in parentheses indicate percentages; Multiple response
Table 2 shows the activities of women respondents in social groups. Savings and credit
was found the primary activity of these social groups, though women’s groups are involved in
multiple activities. The majority of the women's social groups (27.35%) were involved in
agricultural activities which mainly includes cultivation of horticulture, floriculture and cereal
crops. In many states like Jharkhand, Uttarakhand, Maharashtra farm women groups were
found who were involved in horticulture and floriculture activities. The cultivation of the crops
is done collectively and market the produce in the nearby markets.

30
In Assam (30.0%) and Maharashtra (21.0%) a good number of women groups were
involved in animal husbandry activities in which they were found mainly involved in poultry,
duckery and large ruminant rearing. Animal husbandry activities were found more in Assam due
to the socio- cultural conditions existing in the selected district where women were more
involved in indoor agriculture and allied activities, whereas in Maharashtra due to the climatic
changes and irrigation problems there is the emergence of these new groups to meet their
family expenses. Although in Andhra Pradesh, majority of the women respondents were
members of social groups, a very less number of social groups were performing agriculture and
allied activities. Most of them were only confined to savings and credits. The reason for their
non-involvement in agriculture and allied activities was the socio-cultural restrictions existing
among the people of high caste in the selected district, which hampers their participation in
outdoor agriculture and allied activities.
Table 3: Sources of information to the women farmers about ATMA
S No
State
Andhra Pradesh
n=80
Assam n = 70
Jharkhand
n = 80
Madhya Pradesh
n =80
Maharashtra
n = 80
Uttarakhand n = 66
Total N = 457
1 Block Technology Manager
48 (60.0)
52 (74.3)
25 (31.2)
24 (30.0)
56 (70.0)
19 (28.4)
224 (49.0)
2 Subject Matter Specialist
27 (33.8)
16 (22.9)
03 (3.8)
20 (25.0)
41 (51.2)
01 (1.5)
108 (23.6)
3 Farmer Friends 12 (15.0)
0 (0.0)
58 (72.5)
48 (60.0)
30 (37.5)
0 (0.0)
148 (32. 4)
4 Fellow Farmers/ Group Members
02 (2.5)
36 (51.4)
28 (35.0)
11 (16.2)
13 (16.2)
17 (25.4)
107 (23.4)
6 Other Extension Functionaries
64 (80.0)
49 (70.0)
23 (28.75)
49 (61.25)
62 (77.5)
52 (77.61)
300 (68.64)
Figures in parentheses indicate percentages; Multiple response
It is revealed from Table 3 that Block Technology Managers, Farmer Friend and other
extension functionaries from different departments played an important role in creating the
awareness among the respondents about ATMA scheme. It was found that more than half of
the respondents (68.64 %) came to know about ATMA scheme from other extension
functionaries working in other departments as in all the states the Project Director of ATMA was
holding the position of District Agriculture Officer /Chief Agriculture Officer. Among the ATMA
extension functionaries, Block Technology Managers (49.0%) and Farmer Friend (32.4%) were
found as an important source of information to the women farmers about ATMA Scheme. In
Jharkhand and Uttarakhand it was found that either BTM or SMS were not recruited which

31
resulted in less extension to the women farmers. One BTM is looking after two blocks like in
Assam and Jharkhand as a result they are overburdened with work. In all the six states under
study, BTM and SMS were not completely recruited for the ATMA scheme.
Table 3 also shows that in Assam and Uttarakhand no Farmer Friend was recruited due
to non-utilization of funds and the process of appointing the Farmer Friends was initiated in
these two states. In Andhra Pradesh Farmer friends were not appointed as the agriculture
department already has Model Farmers thus Andhra Pradesh didn’t feel the need for appointing
Farmer Friend. In Uttarakhand only BTM positions were filled. Therefore, for more than one-
third (77.61%) of the respondents source of information about ATMA was mainly BTT conveners
(Assistant Agriculture officers).
B. Profile of Women Farmer Representatives
Table 4 shows the profile of the women farmer representatives of ATMA different
committees who were selected for the study. Six women farmer representatives from each state
were covered except in Andhra Pradesh where seven representatives were covered as two
districts were selected for the study. It is observed from the table that, the average age of
women farmer representative was 40 years. It was found that almost all were educated, about
35 percent were intermediate followed by High school 27 percent and Graduation and above 24
percent. On an average selected women farmer representatives have three acres of land on
their name. About 80 percent of the sample women farmer representatives were members of
the Block Farm Advisory Committee (BFAC). Seven women farmer representatives were part of
the Governing Board, one from each selected district under the study. It was found that almost
equal percent of women farmer representatives were selected from agriculture (32.43%) and
horticulture sectors (30%).
Data shows that the majority (83.78%) of the women farmer representatives were
holding the position for more than two years, followed by one to two years (13.52%). It was
observed that in all the states there is no change in the members of the committees and in some
states, these positions were held by the women farmers who were from well off families which
results in the inability of the ATMA officials to change the members. Among all the states,
Uttarakhand is the only state where in they changed the women farmer representatives, once
in every two years. Further, it was also noticed that most of them were nominated by the Block
Development Council (27.0%) and extension officials from agriculture and allied departments
(24.3 %) in all the selected states.

32
Table 4: Profile of the women farmer representatives in different Committees
(N = 37)
S No Parameters Number Percentage
1 Age in years (mean) 40 years -
2 Education
Illiterate 01 2.7
Primary 04 10.8
High school 10 27.0
Intermediate 13 35.13
Graduation and above 09 24.3
3 Land holding (Mean) 3 acres -
4 Member in the Committee
Governing board 07 18.92
Block Farm Advisory Committee (BFAC) 30 81.08
5 Sector
Agriculture 12 32.43
Horticulture 11 30.0
Livestock 06 16.0
Sericulture 01 2.7
6 Time period for holding the position
One year 01 2.7
1-2 years 05 13.52
More than 2 years 31 83.78
7 Nominated by
BFAC/ DFAC member 03 8.10
By majority or consensus 05 13.5
By BTT/BTM 09 24.32
By Block Development Council 10 27.0
Extension officials 09 24.3
8 Orientation received
Yes 34 92.0
C. Profile of the Extension Functionaries
Table 5 is about the profile of the extension official respondents involved in ATMA /
extension activities. A minimum six extension official from each state/district engaged in the
implementation of the ATMA extension activities were interviewed for the study. It is evident
from the above table that the mean age of the officials was 42 years and more than half of the
officials (65.0%) were postgraduates followed by graduates (32.3%). Project Director was

33
interviewed in each selected district, however, in three states, namely Jharkhand, Assam and
Uttarakhand, District Agriculture Officer was given the additional charge of Project Director.
Other officials, who were covered in the study were from allied departments, about 35 per cent
followed by 24 per cent BTMs. The data revealed that more than half of the respondents i.e
about 57 per cent, were implementing activities in the entire district and about 43 percent of
the officials were looking after the block. It is found from the analysis of data that, BTM’s were
holding charge of more than one block in Jharkhand and Uttarakhand states due to inadequate
extension staff at the block level. On an average these officials were having a total of 18 years
of experience, and their experience with ATMA was three years.
Table 5: Profile of the extension functionaries (N=37)
S. No. Parameters Numbers Percentage
1 Age (Mean) 42 years
2 Education
Intermediate 01 2.7
Graduation 12 32.3
Post-graduation and above 24 65.0
3 Designation
Project Director 07 18.9
BTM 09 24.3
SMS 03 8.10
Officers from allied departments/BTT convenors 13 35.13
Any other (AAO,NGO’s) 05 13.5
4 Jurisdiction
Whole block 16 43.2
Entire district 21 56.8
5 Experience (Mean) 18 years
6 Experience with ATMA (Mean) 03 years
2. ACTIVITIES IMPLEMENTED USING 30 PERCENT FUND EARMARKED FOR THE ACTIVITIES OF WOMEN FARMERS
On an average all the states have utilized about 21 percent of fund (out of the total amount
spent on extension activities) towards women farmers on cafeteria of activities However the
proportion of funds spent on women farmers varies from state to state and it ranges from 6.27
to 37.0 percent. Assam being the state which spent the highest percent (37.0 %) of funds on
women farmers activities, the lowest percent (6.27 %) spent on women farmers was seen in
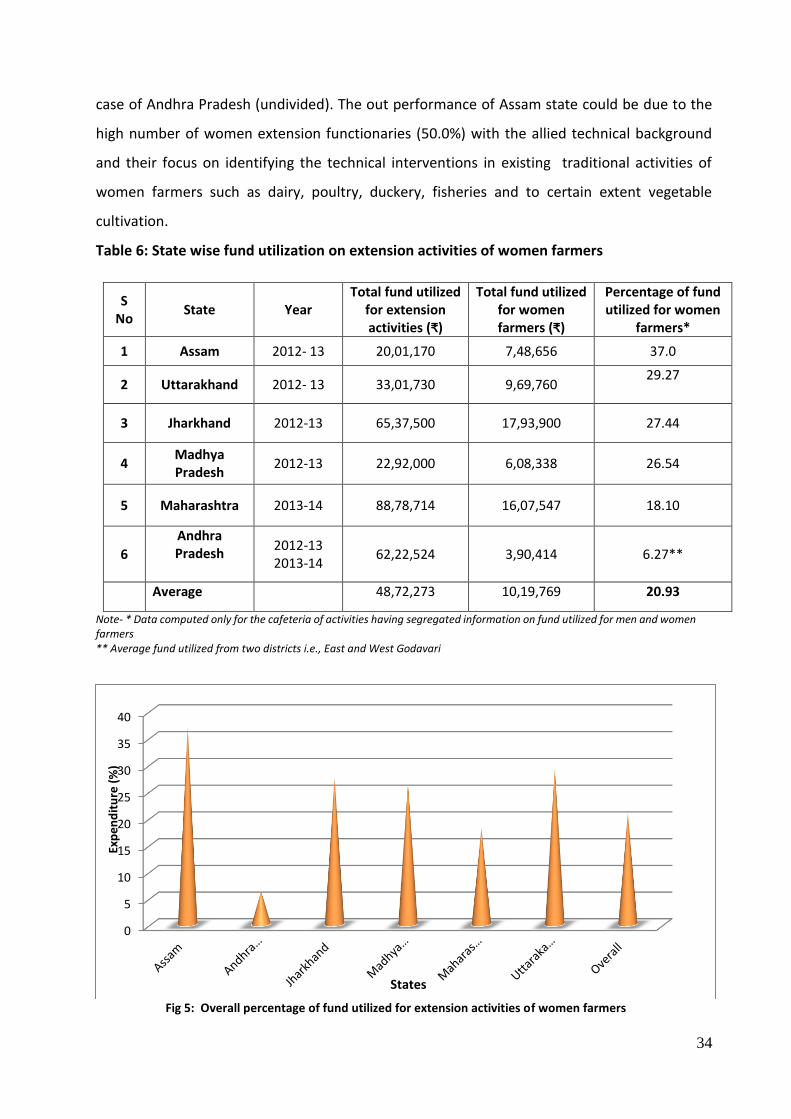
34
case of Andhra Pradesh (undivided). The out performance of Assam state could be due to the
high number of women extension functionaries (50.0%) with the allied technical background
and their focus on identifying the technical interventions in existing traditional activities of
women farmers such as dairy, poultry, duckery, fisheries and to certain extent vegetable
cultivation.
Table 6: State wise fund utilization on extension activities of women farmers
S No
State Year Total fund utilized
for extension activities (₹)
Total fund utilized for women farmers (₹)
Percentage of fund utilized for women
farmers*
1 Assam 2012- 13 20,01,170 7,48,656 37.0
2 Uttarakhand 2012- 13 33,01,730 9,69,760 29.27
3 Jharkhand 2012-13 65,37,500 17,93,900 27.44
4 Madhya Pradesh
2012-13 22,92,000 6,08,338 26.54
5 Maharashtra 2013-14 88,78,714 16,07,547 18.10
6 Andhra Pradesh
2012-13 2013-14
62,22,524 3,90,414 6.27**
Average 48,72,273 10,19,769 20.93
Note- * Data computed only for the cafeteria of activities having segregated information on fund utilized for men and women farmers ** Average fund utilized from two districts i.e., East and West Godavari
Fig 5: Overall percentage of fund utilized for extension activities of women farmers
0
5
10
15
20
25
30
35
40
Exp
en
dit
ure
(%
)
States

35
These women farmers were covered under the cafeteria of activities like training,
exposure visits, demonstrations, farm schools, etc. for intensification of existing activities in
which they were already involved. It is interesting to know from the study that though the
Assam state is classified as one of the lowest in overall fund utilization for the extension
activities, the state has spent the highest percentage of the fund towards women farmers.
This might be due to the fact that in the selected district of the Assam state, most of the men
farmers were involved in export oriented vegetable cultivation. Hence the ATMA officials
might have focused more on women farmers resulting in more coverage of women farmers
in extension activities under allied sectors such as dairy, poultry, goatry, fisheries, and
composite farming, whereas male farmers were more engaged with agriculture sector
activities. Due to the low budget in 2012-13, activities like allocation of seed money or
revolving fund, rewards and kisan mela were not organized and thus the unspent amount
which was earmarked for the community radio station was made available to the district to
organize the left over activities for the year 2012-13 and 2013-14.
Andhra Pradesh has spent lowest amount (6.27%) on women farmers and this could
be due to the fact that women from middle and upper caste don’t go to the farm and they do
not participate in the extension activities. The other reason may be due to the failure in the
planning process for incorporating women in different extension activities, as most of the
activities were planned only on those subjects where the participation of women is low like
farm mechanization.
Further, on the basis of gender segregated data, Uttarakhand State was ranked
second, which has utilized 29.27 percent of the fund on extension activities for women
farmers. The women farmers in this hilly region were more involved in agriculture and allied
activities than the male farmers. Both Jharkhand and Madhya Pradesh states ranked almost
equal based on the percentage of fund utilization on women farmers i,e 27.44 percent and
26.54 percent respectively. In both the states, number of women representatives in BFAC
were high i.e. 33 and 47 respectively and in both the states a large number of women farmers
belong to the tribal communities where women play a lead role in agriculture and allied
activities. It was also found that Jharkhand was having the largest number of women farmer
friends (17) compared to other states.

36
Due to non-availability of gender disaggregated data in Maharashtra for the year
2012-13, data for 2013-14 was considered for the study. It was found that 18.1 percent of the
fund was utilized on women farmers. This figure does not include the expenditure on women
farmers activities related to Farm School, capacity building of groups and Farmer awards.
However, to increase the participation of women farmers in extension activities, Maharashtra
is encouraging selection of women farmer friends, providing demonstrations to women's
groups etc. It is found that among all the states only Jharkhand, Madhya Pradesh, Assam and
Andhra Pradesh (West Godavari Dist.) has maintained the gender disaggregated data and thus
helped in computing the percentage of expenditure on women farmers.
Table 7 presents the percent of budget utilized on various extension activities for
women farmers listed in cafeteria of activities. The data shows that Andhra Pradesh has
utilized the lowest amount of budget on all the activities of the cafeteria because of the
existing socio- cultural barriers existing in the selected districts which resulted in less
participation of women in extension activities. Looking at the activity wise budget utilized
data, it is noticed that conducting trainings for women farmers highest amount was spent by
Uttarakhand with 46.8 percent, followed by Assam (37.8 %) and Jharkhand (26.2 %).

37
Table 7: Percentage of fund utilized for women farmer’s activities
(*) not separate, (-) no fund allocated
Activities Andhra Pradesh
(2012-13)
Assam (2012-13)
Jharkhand (2012-13)
Madhya Pradesh
(2012-13)
Maharashtra (2013-14)
Uttarakhand (2012-13)
A. Farm Oriented Activities
i. Training of women farmers
a. Outside the state - - 24.0 28.6 0.0 37.3
b. Within State 0.0 33.3 29.3 10.0 17.8 45.81
c. Within district level 2.25 42.4 25.6 23.5 23.9 48.5
Total 1.93 37.8 26.2 17.9 20.3 46.8
ii. Organizing demonstrations 9.66 42.4 25.9 23.5 22.2 21.8
iii. Farm school 2.59 36.5 0.0 33.3 * *
iv. Exposure visits of women farmers
a. Outside the State 6.13 20.8 20.8 - 0.0 29.9
b. Within the State 3.72 30.0 24.0 - 5.9 24.1
c. Within Districts 6.20 33.3 20.8 29.8 14.0 47.4
Total 5.83 24.8 22.5 29.8 5.7 31.52
v. Mobilization of women farmers groups/ FIGs etc
a. Capacity building, skill development and support services 1.49 47.8 37.7 68.57 * *
b. Seed money/ revolving fund 0.0 - 100.0 - - *
vi. Rewards and incentives- best organized women group 0.0 - 60.0 14.3 - -
vii. Women farmer awards - - 18.2 - 0.0 4.9
B. Farm Information Dissemination i. District level exhibitions, kisanmelas, fruits and vegetable
shows 11.63 - 25.0 6.0 38.4 15.35
C. Research- Extension- Farmer Linkages i. Farmer scientist interaction at district level 0.0 33.0 20.0 40.0 10.0 46.82
ii. Organization of field days and kisangoshtis 3.42 33.3 27.3 14.3 22.1 42.0

38
Uttarakhand was found successful in meeting the minimum 30.0 percent fund allocation in all
the categories of trainings outside the state (37.3%), within the state (45.8%) and within
district (48.5%) as most of the activities were organized on the activities related to
horticulture, animal husbandry etc. which was predominantly owned by the women farmers
in the selected district and also active women's groups were targeted to achieve the desired
results.
In Assam no money was spent on trainings outside the state due to insufficient funds,
whereas more than 30.0 percent of the fund was utilized for women farmers in trainings
within the state and within the district level. Most of the trainings were organized on animal
husbandry where women's participation was high. It was observed that in all the states more
fund was utilized on trainings within the district except Jharkhand where more fund was spent
on trainings within the state as these trainings were organized mostly on women oriented
activities eg. floriculture, lac cultivation, sericulture etc.
Fig 6: Overall percentage of fund utilized on training of women farmers
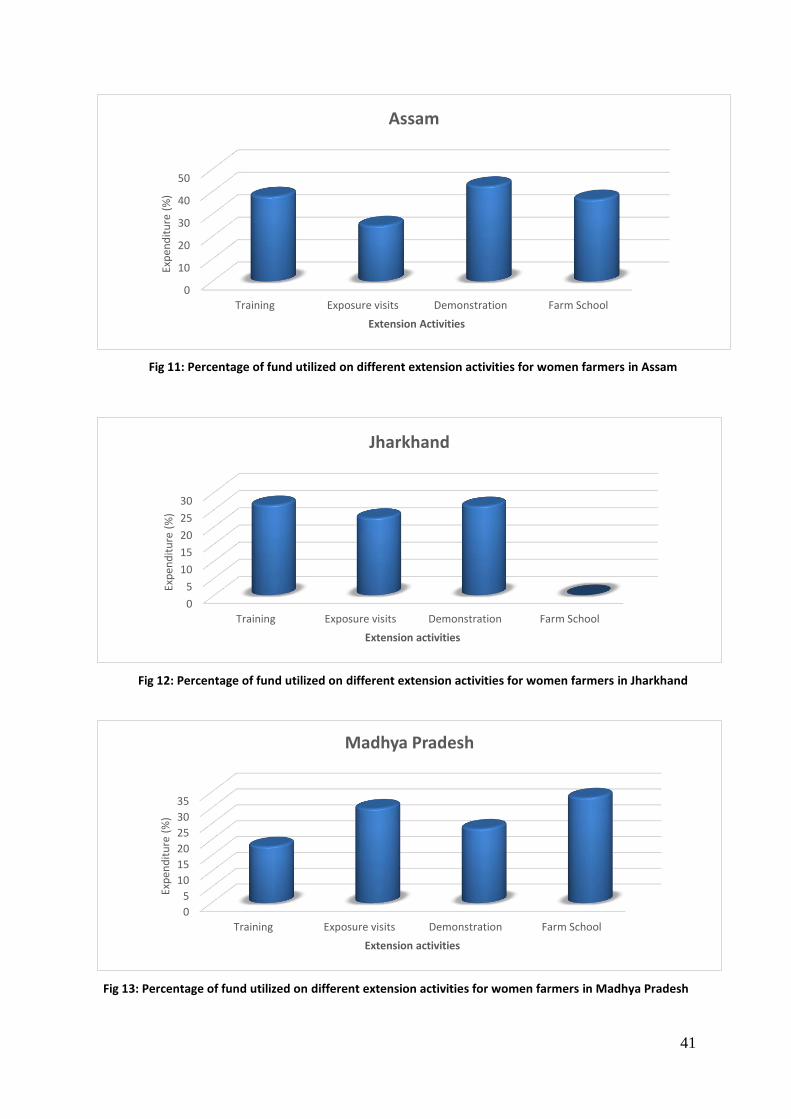
Assam ranked first in providing demonstrations to the women farmers and it was
found that more than 60 percent of the demonstrations were on animal husbandry and allied
areas as women farmers in the selected district were traditionally involved in these activities
and therefore, imparted technical knowledge to improve productivity. In other states,
demonstrations organized on agricultural crops covered more men farmers than women
farmers since very low per cent of women have ownership on land and subsequent role in
decision making on selection of crops for demonstration. Participation in fairs and Field Days
is considered to be an important activity wherein potential farmers get an opportunity to
observe the advantages in adoption of new inputs and improved practices which resulted in
0
10
20
30
40
50
AndhraPradesh
Assam Jharkhand MadhyaPradesh
Maharashtra Uttarakahnd
Exp
en
dit
ure
(%
)
States

39
higher production and returns to the farmers. This event also provides interaction and
exchange of thoughts among the lead farmer with the potential farmers attending field day.
It was found from the study that, Assam (33.0%) and Uttarakhand (42.0%) had spent the
highest amount on organizing field days and kisan goshtis for women farmers.
Fig 7: Overall percentage of fund utilized on demonstrations for the women farmers
Fig 8: Overall percentage of fund utilized for Farm Schools of women farmers
Farm schools are also one of the important activities of ATMA cafeteria to impart
technical knowledge and hands on experience to the farmers. It was found that Maharashtra
and Uttarakhand have not maintained the gender segregated data regarding the activity and
in Jharkhand no farm school was conducted for women farmers. From the available data,
Assam has used the largest portion of budget on farm schools which were mainly on the allied
areas of agriculture. In Madhya Pradesh also 33.3 percent of the women farmers were
0
5
10
15
20
25
30
35
40
45
AndhraPradesh
Assam Jharkhand MadhyaPradesh
Maharashtra Uttarakahnd
Exp
en
dit
ure
(%
)
States
0
5
10
15
20
25
30
35
40
AndhraPradesh
Assam Jharkhand MadhyaPradesh
Maharashtra Uttarakahnd
Exp
en
dit
ure
(%
)
States

40
achiever farmers of farm schools as PRADAN, an NGO has played an important role in
mobilizing women farmers to participate in farm schools for increasing their technical
knowledge regarding agriculture and allied activities.
Fig 9: Overall percentage of fund utilized for exposure visits of women farmers
In all the states exposure visits were conducted for the women farmers and among all
the states Uttarakhand and Madhya Pradesh has used 31.52 percent and 29.8 percent of the
fund on women farmers respectively. In all the states it was observed that most of the women
farmers have participated in the exposure visits which were organized within the district due
to their easy mobility. For mobilizing women farmer groups, trainings and seed
money/revolving funds was provided. From the available data it was found that Madhya
Pradesh has used 68.57 percent of their fund on forming and nurturing women farmer groups.
Fig 10: Percentage of fund utilized on different extension activities for women farmers in AP
0
5
10
15
20
25
30
35
AndhraPradesh
Assam Jharkhand MadhyaPradesh
Maharashtra Uttarakahnd
Exp
en
dit
ure
(%
)
States
0
2
4
6
8
10
Training Exposure visits Demonstration Farm School
Exp
end
itu
re (
%)
Extension activities
Andhra Pradesh
41
Fig 11: Percentage of fund utilized on different extension activities for women farmers in Assam
Fig 12: Percentage of fund utilized on different extension activities for women farmers in Jharkhand
Fig 13: Percentage of fund utilized on different extension activities for women farmers in Madhya Pradesh
0
10
20
30
40
50
Training Exposure visits Demonstration Farm School
Exp
end
itu
re (
%)
Extension Activities
Assam
0
5
10
15
20
25
30
Training Exposure visits Demonstration Farm School
Exp
end
itu
re (
%)
Extension activities
Jharkhand
0
5
10
15
20
25
30
35
Training Exposure visits Demonstration Farm School
Exp
end
itu
re (
%)
Extension activities
Madhya Pradesh

42
Fig 14: Percentage of fund utilized on different extension activities for women farmers in Maharashtra
Fig 15: Percentage of fund utilized on different extension activities for women farmers in Uttarakhand
Table 8 shows the number of women respondents selected for the study who have
attended different programmes of ATMA. A total of 457 respondents were selected for the
study among which 66.73 percent have participated in training, 36.32 percent in
demonstration, 23.9 percent in Farm schools, 37.2 percent in exposure visits and 13.34
percent in capacity building programs for the groups.
More than half (58.9) of the respondents were covered in the trainings organized
within the district as in all the states majority of women have participated in trainings within
district and a very few outside state and within the state trainings. Looking at the coverage of
women farmers in demonstrations among the states, majority of the respondents were from
Andhra Pradesh (55.0%) followed by Madhya Pradesh (48.75%) and Jharkhand (47.5%).
0
5
10
15
20
25
Training Exposure visits Demonstration Farm School
Exp
end
itu
re (
%)
Extension activities
Maharashtra
0
10
20
30
40
50
Training Exposure visits Demonstration Farm School
Exp
end
itu
re (
%)
Extension activities
Uttarakhand

43
Table 8: Activities carried out and coverage of women farmers by ATMA
Activities Andhra Pradesh (n=80)
Assam
(n=70)
Jharkhand
(n=80)
Madhya Pradesh (n=80)
Maharashtra
(n=80)
Uttarakhand (n=67)
Total
(N=457) Farm Oriented Activities
i. Training of women farmers* a. Outside the state 02 (2.5) 0 (0.0) 3 (3.75) 2 (2.5) 0 2 (3.0) 9 (2.0)
b. Within State 01 (1.25) 2 (2.9) 3 (3.75) 3 (3.75) 15 (18.75) 3 (4.5) 27 (5.9) c. Within district level 33 (41.25) 67 (95.7) 60 (75.0) 33 (41.25) 46 (57.5) 30 (44.8) 269 (58.9)
Total 36 (46.25) 69 (98.9) 66 (82.5) 38 (47.5) 51 (63.75) 35 (52.2) 305 (66.73) ii. Organizing demonstrations 44 (55.0) 18 (25.7) 38 (47.5) 39 (48.75) 13 (16.25) 14 (20.0) 166 (36.32) iii. Farm school achiever farmers 6 (7.5) 12 (17.14) - 8 (10.0) 2 (2.5) 6 (9.0) 34 (7.43) Farm school members 8 (10.0) 24 (24.3) - 13 (16.25) 20 (25.0) 10 (15.0) 75 (16.41)
Total 14 (17.5) 36 (51.4) - 21 (26.25) 22 (27.5) 16 (23.9) 109 (23.9) iv. Exposure visits of women farmers* a. Outside the State 3 (3.75) 0 (0.0) 2 (2.5) 5 (6.25) 1 (1.25) 2 (3.0) 13 (2.84) b. Within the State 1 (1.25) 8 (11.42) 6 (7.5) 6 (7.5) 6 (7.5) 16 (23.9) 62 (13.6) c. Within Districts 11 (13.75) 21 (30.0) 20 (25.0) 25 (31.25) 17 (27.5) 20 (29.9 95 (20.8)
Total 15 (18.75) 29 (41.42) 28 (35.0) 36 (46.25) 24 (30.0) 38 (56.71) 170 (37.2) v. Mobilization of women farmers groups/ FIGs etc* a. Capacity building, skill development and support services
14 (17.5) 4 (5.71) 8 (10.0) 5 (6.25) - 30 (44.8) 61 (13.34)
b. Seed money/ revolving fund 3 (3.75) 2(2.9) 25 (31.25) 4 (5.0) 5 (6.25) 29 (43.3) 68 (14.9) vi. Rewards and incentives- best organized women group
- - - - - - -
vii. Women farmer awards 2 (2.5) - 2 (2.5) - - 2(3.0) 6 (1.31)
*Multiple response

44
Less number of women farmers were interviewed from Assam and Uttarakhand due
to the geographical conditions and socio-cultural problems. Under the Farm school category,
7.43 percent of the respondents were covered from achiever farmers of Farm School and
16.41 percent were members of the Farm School. In Assam maximum number of respondents
were interviewed both in the category of achiever farmers (17.14%) and members of Farm
school (24.3%) as maximum budget i.e. 36.5 percent was spent on women Farm school in the
state. In Jharkhand there was no Farm School on the name of women farmer thus there was
no beneficiary interviewed. Under the exposure visit activity, 37.2 percent of the respondents
were covered and most of the respondents (20.8%) have attended exposure visits which were
organized within the district.
Fig 16: Proportion of women farmers in cafeteria of activities
About 13 percent respondents for capacity building activities and 15 percent for
whom seed /revolving fund was provided were interviewed as shown in Table-6. Two women
farmers each from Andhra Pradesh, Jharkhand and Uttarakhand were interviewed who
received the farmer awards under the Extension Reform Scheme.
In all the states, especially in Madhya Pradesh, Maharashtra and Uttarakhand due to
the non-availability of proper records about the beneficiaries, the research team was unable
to contact the beneficiaries for the year 2012-13, therefore respondents were selected from
the 2013-14 beneficiary list.
Trainings37%
Exposure visits21%
Demonstrations20%
Farm Schools14%
Capacity building to groups
8%
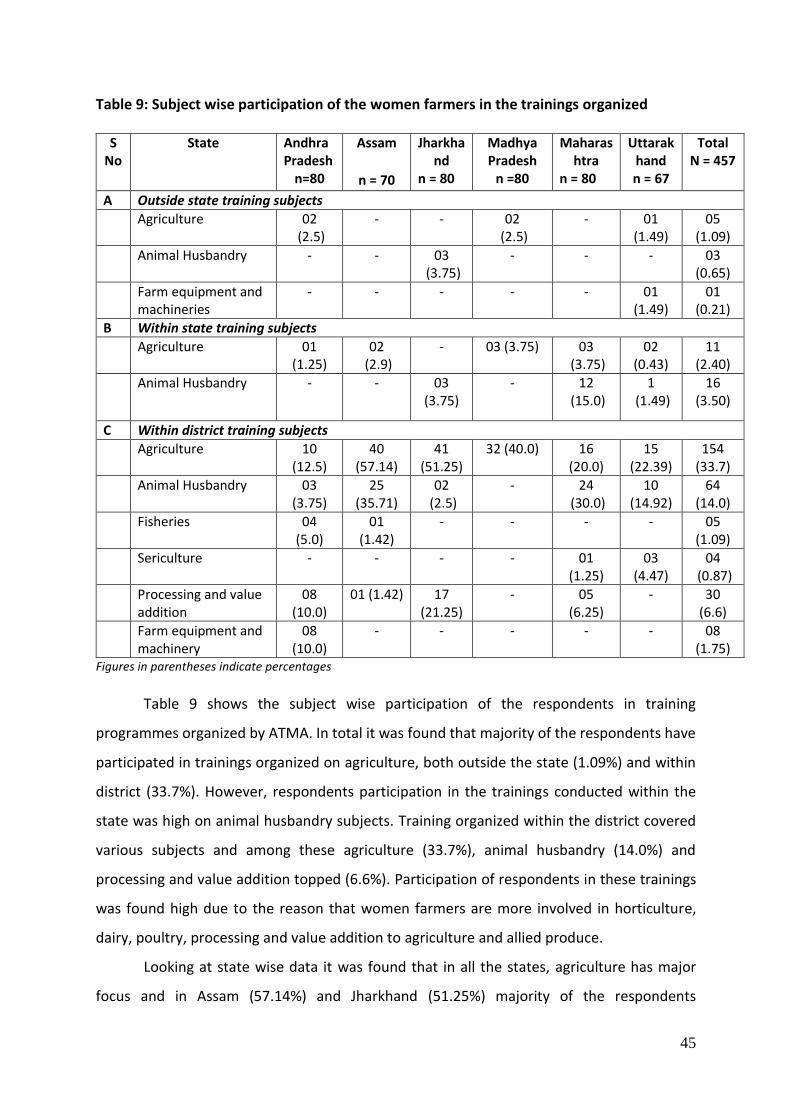
45
Table 9: Subject wise participation of the women farmers in the trainings organized
S No
State
Andhra Pradesh
n=80
Assam
n = 70
Jharkhand
n = 80
Madhya Pradesh
n =80
Maharashtra
n = 80
Uttarakhand n = 67
Total N = 457
A Outside state training subjects Agriculture 02
(2.5) - - 02
(2.5) - 01
(1.49) 05
(1.09)
Animal Husbandry - - 03 (3.75)
- - - 03 (0.65)
Farm equipment and machineries
- - - - - 01 (1.49)
01 (0.21)
B Within state training subjects
Agriculture 01 (1.25)
02 (2.9)
- 03 (3.75) 03 (3.75)
02 (0.43)
11 (2.40)
Animal Husbandry - - 03 (3.75)
- 12 (15.0)
1 (1.49)
16 (3.50)
C Within district training subjects Agriculture 10
(12.5) 40
(57.14) 41
(51.25) 32 (40.0) 16
(20.0) 15
(22.39) 154
(33.7) Animal Husbandry 03
(3.75) 25
(35.71) 02
(2.5) - 24
(30.0) 10
(14.92) 64
(14.0) Fisheries 04
(5.0) 01
(1.42) - - - - 05
(1.09) Sericulture - - - - 01
(1.25) 03
(4.47) 04
(0.87) Processing and value
addition 08
(10.0) 01 (1.42) 17
(21.25) - 05
(6.25) - 30
(6.6) Farm equipment and
machinery 08
(10.0) - - - - - 08
(1.75) Figures in parentheses indicate percentages
Table 9 shows the subject wise participation of the respondents in training
programmes organized by ATMA. In total it was found that majority of the respondents have
participated in trainings organized on agriculture, both outside the state (1.09%) and within
district (33.7%). However, respondents participation in the trainings conducted within the
state was high on animal husbandry subjects. Training organized within the district covered
various subjects and among these agriculture (33.7%), animal husbandry (14.0%) and
processing and value addition topped (6.6%). Participation of respondents in these trainings
was found high due to the reason that women farmers are more involved in horticulture,
dairy, poultry, processing and value addition to agriculture and allied produce.
Looking at state wise data it was found that in all the states, agriculture has major
focus and in Assam (57.14%) and Jharkhand (51.25%) majority of the respondents

46
participated in trainings organized within the district on agriculture subject. However, in both
these states focus within agriculture was different. In Jharkhand women farmers got trained
in SRI cultivation whereas in Assam it was on integrated and composite farming. In the animal
husbandry, Assam (35.71%) and Maharashtra (30.0%) were the states where majority of the
respondents have participated in the trainings organized within the district. In Assam women
farmers were found interested to learn about poultry, duckery as they are already involved in
these activities. During the trainings they have learnt about improved breeds of egg laying
birds (poultry and duckery), management of egg laying birds including vaccination, housing,
etc. Whereas in Maharashtra women farmers have more focus on large ruminant animals due
to the scarcity of water for irrigation they want to have an additional income source for their
families. Women farmers of Maharashtra have learnt about management of dairy animals
(vaccination, loose housing system, feeding), hydroponic and clean milking. The data revealed
that processing and value addition of the agriculture and allied products is focused more in
Jharkhand (21.25%) and Andhra Pradesh (10.0 %), where, on one hand women farmers in
Jharkhand have learnt about food processing and ornament making from Lac and on the other
hand, women farmers in Andhra Pradesh got trained in fish preservation, processing and
storage. Very less number of the respondents have participated in the trainings on fisheries
(1.09%), sericulture (0.87%) and farm equipment and machineries (1.75%). This is due to the
fact that sericulture and fisheries are not found predominantly in all the selected districts
whereas farm equipment and machineries are still found to be the subjects of male farmers
and thus women’s participation was found low.
Table 10 reveals that overall only 13.34 percent of the respondents have participated
in capacity building activities of FIG’s with maximum participation in agricultural activities
(7.9%) (Cereal crops, fruits and vegetables and floriculture) and the participation in allied
sectors such as sericulture, animal husbandry and fisheries was very minimal. This is due to
the fact that the allied sectors such as sericulture and fisheries are not predominant in the
districts selected for the study and thereby the number of FIG’s in these sectors were also
found to be very less. This could be due to inadequate manpower in the respective
departments and the existing extension functionaries are overloaded with various schemes
and programmes, as informed by the field functionaries.

47
Table 10: Details of participation of women farmers in capacity building activities of FIGs
S
No
Subjects
Andhra Pradesh
n=80
Assam n = 70
Jhar khand n = 80
Madhya Pradesh
n =80
Maharashtra
n = 80
Uttarakhand n = 67
Total
N = 457
1 Agriculture 04 (5.0)
- 05 (6.25)
02 (2.5)
- 25 (37.31)
36 (7.9)
2 Animal husbandry
- 02 (2.85)
- - - 02 (3.0)
04 (0.87)
3 Fisheries 03 (3.75)
- 02 (2.5)
- - - 05 (1.09)
4 Sericulture - 02 (2.85)
- - - - 02 (0.43)
5 Processing & value addition
- - 01 (1.25)
01 (1.25) - 01 (1.49)
03 (0.65)
6 Farm equipment & machinery
03 (3.75)
- - - - - 03 (0.65)
7 Group related activities
04 (5.0)
- - 02 (2.5)
- 02 (3.0)
08 (1.75)
Over all 15 (17.5)
4 (5.7)
8 (10.0)
5 (6.25)
- 30 (43.80)
61 (13.34)
Figures in parentheses indicate percentages
Uttarakhand has given more focus on capacity building activities of FIG’s (43.8%) and
Assam has given least focus (5.7%) for capacity building activities of FIG’s. This may be due
to the fact that in Uttarakhand, horticultural crops are predominant and the women farmers
are extensively involved both in production and marketing. Hence ATMA has mobilized the
women farmers into the CIG’s in horticulture crops and encouraged them to go for collective
procurement of agricultural inputs and also marketing their farm produce collectively. The
women farmers in the groups have participated in technological upgradation in agriculture
and allied sectors and also in other areas such as processing and value addition, farm
equipment and machinery and group related activities (book keeping, group dynamics, etc).
It was informed that the selected district of the Maharashtra state has not utilized the fund
from ATMA for capacity building of FIG’s during the year 2012-13. However, they have utilized
the fund from the other state government scheme i,e. “Shetkari Gat Samuh Sheti Yojna” for
the purpose and hence the respondents were not considered for data collection for this
particular activity.
From the Table 11, it was found that 26.69 percent of the respondents received
demonstrations on agriculture followed by animal husbandry (8.97%). It was found that in

48
Madhya Pradesh and Jharkhand, more than half of the respondents participated in agriculture
demonstrations.
It was found that, in Jharkhand agriculture demonstrations were provided on paddy
where women farmers have learnt about SRI technique whereas in Madhya Pradesh
demonstrations were on pulses, wheat, horticulture and cropping system and women farmers
were trained on System of Wheat Intensification (SWI), ridge and furrow method, new
varieties of seeds, seed rate and its treatment, etc.
Table 11: Subject wise participation of the women farmers in demonstrations
S No
Subject
Andhra Pradesh n = 80
Assam
n = 70
Jharkhand
n = 80
Madhya Pradesh
n =80
Maharashtra
n = 80
Uttarakhand
n = 67
Total
N = 457 1 Agriculture 22 (27.5) 04
(5.7) 40
(50.0) 42
(52.5) 04
(5.0) 10
(14.92) 122
(26.69) 2 Animal
husbandry 11
(13.75) 16
(22.85) - - 09
(11.25) 05
(7.5) 41
(8.97) 3 Fisheries 05 (6.25) - - - - 01
(1.5) 06
(1.35) 4 Sericulture 01 (1.25) - - - 05
(6.25) - 06
(1.31) 5 Processing and
value addition 04
(5.0) - - - - - 04
(0.87) 6 Farm equipment
&machinery 02
(2.5) - - - - - 2 (0.43)
Figures in parentheses indicate percentages
It is evident from the data that women farmers of Andhra Pradesh have received
significant number (27.5%) of demonstrations on agriculture and got trained on Integrated
Pest Management (IPM), Integrated Nutrient Management (INM), nursery preparation under
shade nets, zero tillage in maize, etc.
Maximum number of demonstrations on animal husbandry was organized in Assam
(22.85%) followed by Andhra Pradesh (13.75%) and Maharashtra (11.25%). The
demonstration provided in Assam was on poultry and dukery as women farmers were actively
involved in it. However in Andhra Pradesh women farmers were provided with
demonstrations on azolla, different types of fodder, poultry, etc. As women farmers of
Maharashtra were interested in large ruminant animals they were provided with the
demonstrations on hydroponics, azolla, silage making, etc. It was found that demonstrations
in the form of ice boxes for fish preservation were provided to the women farmers in Andhra

49
Pradesh. In Maharashtra, sericulture demonstrations were organized where women farmers
have learnt about plantation of mulberry and silkworm rearing. Andhra Pradesh was the only
state where women farmers have participated in the demonstrations on processing and value
addition (5.0%) and farm equipment and machinery (2.5%) where women farmer
respondents learnt about preparation of fish pickles and snacks and training on direct
transplantation by paddy drum seeder.
Interaction with the extension officials revealed that land should be on the name of
women in order to select women as a beneficiary for demonstration. However, it is felt by the
respondents that, it is not possible to fulfill this criteria as very less number of women farmer
have land on their name. Therefore, the extension functionaries provide agricultural
demonstration to the women who are actively involved in agricultural activities and have
significant role in decision making about the cultivation of crops. Whereas, other
demonstrations in animal husbandry, sericulture, etc were given to the landless women, as
land is not having much role to play in these activities.
Table 12: Perception of the women farmers about the demonstrations organized
S No
State
Parameters
Andhra Pradesh
n=80
Assam
n = 70
Jharkhand
n = 80
Madhya Pradesh
n =80
Maharashtra
n = 80
Uttarakhand n = 67
Total
N = 457
1 Cost of the Demonstration Aware of the cost 29
(36.25) 13
(18.6) 17
(21.25) 28
(35.0) 09
(11.25) 14
(20.9) 110
(24.1)
Not Aware 15 (18.75)
05 (7.14)
21 (26.25)
11 (13.75)
04 (5.0)
- 56 (12.25)
2 Demonstration inputs received in the form of: Inputs provided by
ATMA 44
(55.0) 20
(28.57) 40
(50.0) 42
(52.5) 18
(22.5) 15
(22.38) 179
(39.16) Cash deposited in
account 01
(1.25) - - - - 01
(1.49) 02
(0.43) 3 Fulfillment of the need of the demonstration Partially met 13
(16.25) 01
(1.42) 17
(21.25) 22
(27.5) 03
(3.75) 02
(3.0) 58
(12.69) Fully met 31
(38.75) 17
(24.28) 21
(26.25) 17
(21.25) 10
(12.5) 12
(17.91) 108
(23.63) Figures in parentheses indicate percentages
Most of the respondents (24.1 %) know about the cost of demonstration as they all were
provided with the receipt of the material at the time of the demonstration (Table 12). It was
found that in almost all the cases the inputs were procured by the officials and handed over

50
to the beneficiaries. Whereas, in some cases cash was deposited into the respondent’s
account.
Majority of the respondents (23.63 %) felt that the demonstration fully met their
needs and for 12.69 percent met partially. Demonstrations were found popular among the
women respondents as it provided practical hands on experiences, where they get knowledge
and technical skill upgradation by working in their fields.
It is evident from the Table 13 that a very less number of the respondents were taken
on exposure visits. Data revealed that a negligible number of the respondents have
participated in the exposure visits when organized outside state (2.19 percent in agriculture
and 1.09 percent in animal husbandry).However, it was found maximum number of the
respondents who have participated in exposure visits related to agriculture were from
Madhya Pradesh (6.25%) followed by Andhra Pradesh (3.75%) where they learnt about
management techniques in horticultural crops such as like nursery preparation, Integrated
Pest Management, grafting, cocoa production and post-harvesting techniques. Respondents
from Jharkhand (2.5%) and Maharashtra (1.25) have participated in exposure visits related to
animal husbandry where major focus was given on large ruminant animal management.
It was found that the majority (6.13%) of the respondents participated in exposure
visits organized within the state on agriculture related subjects, followed by animal husbandry
(2.19%) and processing and value addition (0.87%).
Among the states it was found that the majority of the respondents (13.43%) has
participated in agricultural exposure visits, however equal (6.25%) participation was found
from Jharkhand, Madhya Pradesh and Maharashtra. In Uttarakhand, Jharkhand and Assam
these exposure visits were organized on horticultural crops only where women farmers learnt
about nursery raising under shade nets, disease control in vegetable crops, jute cultivation,
lac cultivation, etc. However in Madhya Pradesh respondents learnt about SRI in paddy and
zero tillage in maize. Further, it was noticed that, more number of respondents (10.44%)
participated in the exposure visits related to animal husbandry in Uttarakhand as compared
to the other states.

51
Table 13: Subject wise participation of the women farmers in exposure visits organized
S No
State
Andhra Pradesh
n=80
Assam n = 70
Jharkhand
n = 80
Madhya Pradesh
n =80
Maharashtra
n = 80
Uttarakhand n = 67
Total
N = 457 A Exposure visit outside the state, subjects Agriculture 03
(3.75) - - 05 (6.25) - 02
(3.0) 10 (2.18)
Animal husbandry - - 02 (2.5)
- 01 (1.25)
- 03 (0.65)
B Exposure visit within the state, subjects Agriculture - 04
(5.7) 05
(6.25) 05
(6.25) 05
(6.25) 09
(13.43) 28
(6.13) Animal husbandry - - 01
(1.25) 01
(1.25) 01
(1.25) 07
(10.44) 10
(2.19) Sericulture 01
(1.25) - - - - - 01
(0.21) Processing &
value addition - 04
(5.7) - - - - 04
(0.87) C Exposure visit within the district, subjects Agriculture 01
(1.25) 12
(17.14) 19
(23.75) 23
(28.75) 04
(5.0) 11
(16.41) 70
(15.32) Animal husbandry - - - - 09
(11.25) 09
(13.43) 18
(3.93)
Fisheries 01 (1.25)
- - - - - 01 (0.21)
Sericulture - - - - 01 (1.25)
- 01 (0.21)
Processing and value addition
08 (10.0)
10 (14.29)
- 2 (2.5) 03 (3.75)
- 23 (5.03)
Farm equipment &machinery
01 (1.25)
- - - - - 01 (0.21)
Figures in parentheses indicate percentages
Participation of the respondents was found better in the exposure visits organized
within the district. It was observed that about 15 percent of the respondents were exposed
to agriculture followed by five percent in processing and value addition of agriculture and
allied products and animal husbandry about four percent. It was observed that respondents
from all the states have participated in agriculture related exposure visits and participation
was seen higher in Madhya Pradesh (28.75%) and Jharkhand (23.75%). In Jharkhand exposure
visits made women farmers to learn about cereal and horticultural crops, whereas in Madhya
Pradesh it also included pulses and millets. Another important exposure visit was on
processing and value addition where, respondents from four states have participated with
Assam (14.29%) and Andhra Pradesh (10.0%) having the largest number of the respondents.
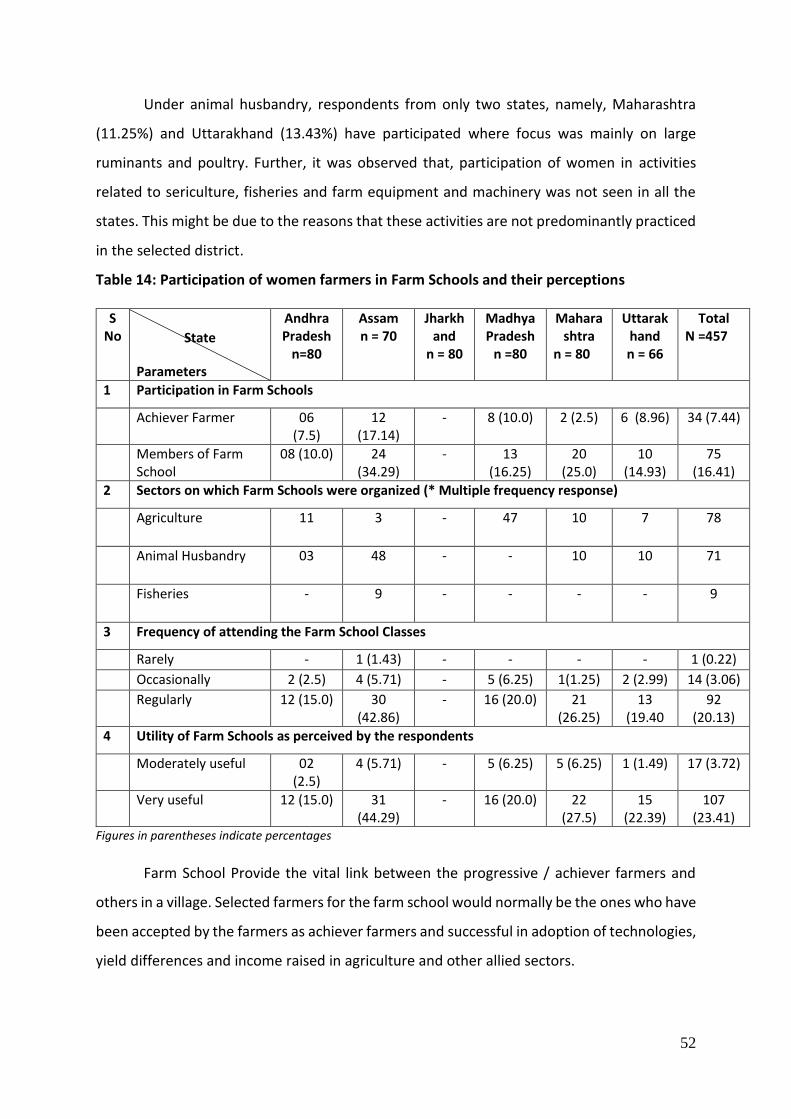
52
Under animal husbandry, respondents from only two states, namely, Maharashtra
(11.25%) and Uttarakhand (13.43%) have participated where focus was mainly on large
ruminants and poultry. Further, it was observed that, participation of women in activities
related to sericulture, fisheries and farm equipment and machinery was not seen in all the
states. This might be due to the reasons that these activities are not predominantly practiced
in the selected district.
Table 14: Participation of women farmers in Farm Schools and their perceptions
S No
State
Parameters
Andhra Pradesh
n=80
Assam n = 70
Jharkhand
n = 80
Madhya Pradesh
n =80
Maharashtra
n = 80
Uttarakhand n = 66
Total N =457
1 Participation in Farm Schools
Achiever Farmer 06 (7.5)
12 (17.14)
- 8 (10.0) 2 (2.5) 6 (8.96) 34 (7.44)
Members of Farm School
08 (10.0) 24 (34.29)
- 13 (16.25)
20 (25.0)
10 (14.93)
75 (16.41)
2 Sectors on which Farm Schools were organized (* Multiple frequency response)
Agriculture 11 3 - 47 10 7 78
Animal Husbandry 03 48 - - 10 10 71
Fisheries - 9 - - - - 9
3 Frequency of attending the Farm School Classes
Rarely - 1 (1.43) - - - - 1 (0.22)
Occasionally 2 (2.5) 4 (5.71) - 5 (6.25) 1(1.25) 2 (2.99) 14 (3.06)
Regularly 12 (15.0) 30 (42.86)
- 16 (20.0) 21 (26.25)
13 (19.40
92 (20.13)
4 Utility of Farm Schools as perceived by the respondents
Moderately useful 02 (2.5)
4 (5.71) - 5 (6.25) 5 (6.25) 1 (1.49) 17 (3.72)
Very useful 12 (15.0) 31 (44.29)
- 16 (20.0) 22 (27.5)
15 (22.39)
107 (23.41)
Figures in parentheses indicate percentages
Farm School Provide the vital link between the progressive / achiever farmers and
others in a village. Selected farmers for the farm school would normally be the ones who have
been accepted by the farmers as achiever farmers and successful in adoption of technologies,
yield differences and income raised in agriculture and other allied sectors.

53
During the study (Table 14), it was found that 7.44 percent of the respondents were
achiever farmers and 16.41 percent were the members of the Farm Schools. Among the states
it was found that the highest number (17.24%) of the achiever farmers was from Assam
followed by Madhya Pradesh (10.0 %). Similarly, majority of the member of the Farm Schools
were covered from Assam (34.29%) and Maharashtra (25.0%).
In all the states it was found that most of the farm schools were conducted on the
subjects namely integrated farming, composite farming, mixed farming, etc. covering
agriculture, animal husbandry and fisheries. Data revealed that most of the farm women
attended farm schools organized on agriculture (78) followed by animal husbandry (71) and
fisheries (9). In Madhya Pradesh maximum women farmers (47) attended farm schools in
agriculture, which covered horticulture, pulses, wheat, millets, oilseed, etc where they learnt
about mixed, inter and integrated cropping patterns. It was found that in Assam most (48) of
the women participated in animal husbandry where all most all farm schools were on poultry
and some on poultry cum duckry. Fisheries farm schools were found only in Assam where
they organized farm schools in the subjects of fisheries cum poultry cum duckry. From the
data it is also noticed that all most all the respondents has attended the Farm School classes
regularly in all the states and every member had found these farm schools useful.
3. PROCESS ADOPTED FOR NEED IDENTIFICATION
Table 15 indicates the ranks for the different procedures adopted by the extension
officials for identifying the needs of the women farmers. It was found that extension officials
have given priority to the interaction with women representatives in BFAC’s and interaction
with women farmer/groups for identification of needs which ranked first and second
respectively. Probing with officials further revealed that, women farmer representatives
working at the grassroot levels find out the need of the women farmers and give feedback to
the decision making body.

54
Table 15: Procedure adopted by the extension officials for identifying the needs of women farmers
S. No Procedure Score Rank
i. Based on gaps identified in SREP 3.85 V
ii. Interaction with women representatives in BFAC’s 2.07 I
iii. Interaction with the scientists/experts 3.20 III
iv. Based on past experiences 3.50 IV
v. Interaction with women farmer/groups 2.27 II
vi. Interaction with the PRI’s 4.33 VI
In many states, extension officials used interaction with active women groups during
extension events as a source for need identification of women farmers. The other methods
used for need identification includes interaction with scientists/experts, extension officials
past experiences, gaps identified in SREP and Interaction with the PRI’s ranked third, fourth,
fifth and sixth respectively. SREP is an important document to identify the needs of the
farmers, but from the observation it was found that it was rarely considered.
Table 16: Priorities considered by extension functionaries for allocation of funds for women farmers
S. No Priority Score Rank
i. To support small and marginal farm women 2.54 I
ii. To support women headed household 5.66 VII
iii. To motivate active women groups 2.98 II
iv. To impart knowledge to the women farmers 3.32 III
v. To bring changes in attitude and skill 3.50 IV
vi. Social mobilization and women group formation 5.08 VI
vii. To introduce income generating activities 4.38 V
viii. Linking women farmers to markets 8.54 VIII

55
Under ATMA scheme 30 percent of the fund is earmarked for the women farmers, it
is worth noting that how the selected districts prioritize the allocation of earmarked funds for
women farmers in their jurisdiction (Table 16). It is found that high priority was given to
support small and marginal farm women, motivate active groups and impart knowledge to
the women farmers. Whereas, the least priority was given for linking women farmers to the
markets. This might be due to the fact that market linking component is not present in the
ATMA’s cafeteria of activities, though it is an important activity.
Table 17: Consultations done by extension functionaries for organizing extension activities
S
No
State
Components
Andhra
Prades
h
n=80
Assam
n = 70
Jharkhan
d
n = 80
Madhya
Pradesh
n =80
Mahar
ashtra
n = 80
Uttarak
hand
n = 66
Total
N =457
1 Consulted the women farmers
Yes
64
(80.0)
68
(97.14)
69
(86.25)
48
(60.0)
48
(60.0)
50
(74.62)
347
(75.93)
No
16
(20.0)
02 (2.86) 11
(13.75)
32
(40.0)
32
(40.0)
17
(25.37)
110
(24.07)
2 Method of Consultation Informally 05
(6.25)
15
(21.43)
15
(18.75)
04
(5.0)
06
(7.50)
09
(13.43)
54
(11.81)
Through progressive
farmer/ Farmer
Friend/ women
representatives
29
(36.25)
23
(32.86)
12
(15.0)
08
(10.0)
10
(12.5)
09
(13.43)
91
(19.91)
During extension
events
26
(32.5
27
(38.57)
24
(30.0)
20
(25.0)
29
(36.25)
32
(47.76)
158
(34.57)
By organizing special
meetings
04
(5.0)
03
(4.29)
18
(22.5)
16
(20.0)
03
(3.75)
- 44
(9.63)
Figures in parentheses indicate percentages
Table 17 provides the picture of different ways through which extension officials
discuss about any extension programme with the women farmer respondents before
organizing them. It was revealed from the data that more than one third respondents (75.93
%) were consulted before organizing the extension programs, though in a very few cases
direct contact method or special consultation procedures were adopted by the extension
functionaries. Most of the respondents (34.57%) were consulted during the extension
activities in which respondents place their needs or demand. The other method popular for
consultation (19.91%) was through progressive farmer, farmer friend, women

56
representatives, where these leaders project needs and requirement of the women farmers
in ATMA Committees and accordingly extension activities were planned.
State wise data shows that large number of the respondents were consulted in Assam
(97.14%) and Jharkhand (86.25%). In Assam, it was found that more than 50 percent of the
extension officials (BTM and SMS) were women, who had regular contact with women
farmers and thus 38.57 percent of women were consulted during extension activities. Looking
into the case of Jharkhand it was found that extension functionaries have organized meetings
(22.5%) specially to identify needs of women farmers by looking at active participation of
women respondents in their groups. Maharashtra and Madhya Pradesh were among the
states where only 60 percent of women perceived that they were consulted by the ATMA
officials before organizing any extension programmes. In Madhya Pradesh, women farmers
were consulted during extension events (25%) and by organizing special meetings (20 %). It
was observed that in Madhya Pradesh interaction of the women farmers was less with ATMA
extension functionaries because of less man power and larger area, although ATMA is working
with PRADAN (NGO) which is playing a major role in identifying the needs of the women
farmers, especially tribal women by organizing special meetings (20%). Whereas in
Maharashtra most of the women were consulted during extension events (36.25 %) and only
12.5 percent of the women farmers were consulted by the women representatives. It was
found that in Uttarakhand about 75 percent of women farmers were consulted for identifying
their needs which is mostly done during the extension activities (47.76 %) this may be due to
the fact that in the hilly regions distance from one house to the other is more and probably
extension events are the only occasions where they all meet and discuss the issues.
4. ROLE PLAYED BY WOMEN FARMER REPRESENTATIVES
Participation of the women farmer representatives in the committees
Table 18 shows the participation of women farmer representatives in the committees
and at grass root level, which includes the frequency of meetings and their attendance,
constraints faced by them for not attending the meetings, ways of sharing the information
discussed in the meetings with the women farmers and perceived merits of having women
representatives seats reserved in the committees.
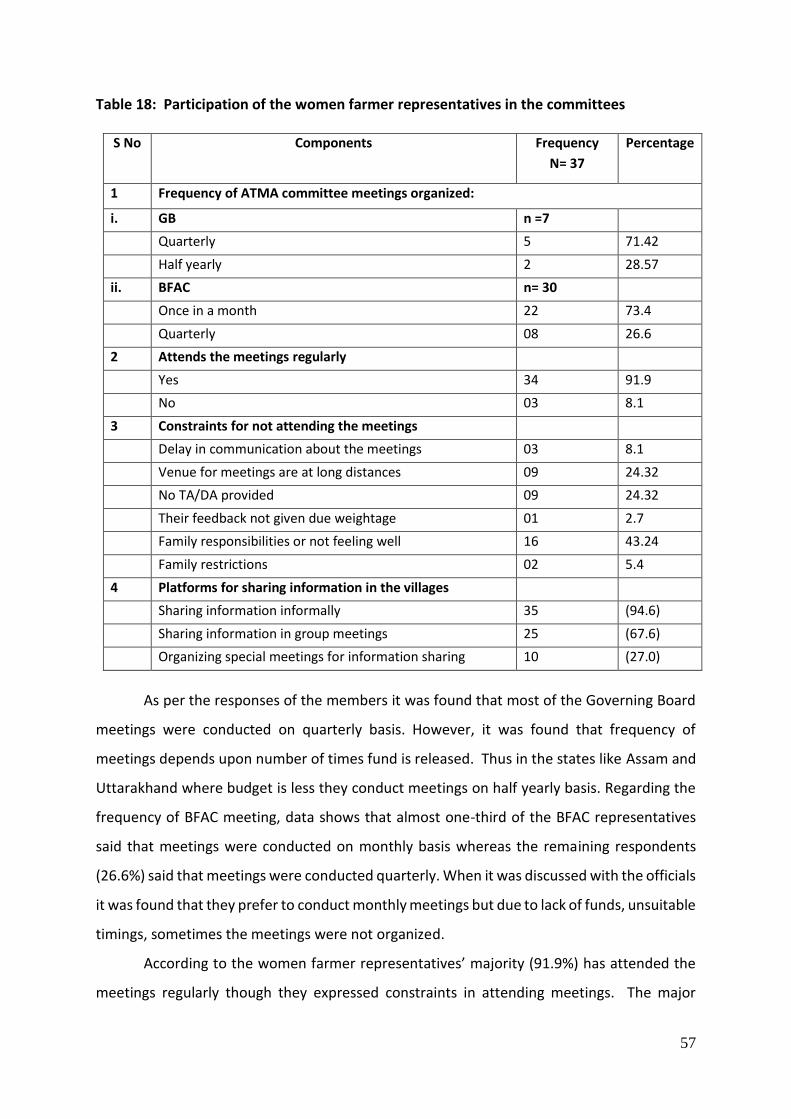
57
Table 18: Participation of the women farmer representatives in the committees
S No Components Frequency
N= 37
Percentage
1 Frequency of ATMA committee meetings organized:
i. GB n =7
Quarterly 5 71.42
Half yearly 2 28.57
ii. BFAC n= 30
Once in a month 22 73.4
Quarterly 08 26.6
2 Attends the meetings regularly
Yes 34 91.9
No 03 8.1
3 Constraints for not attending the meetings
Delay in communication about the meetings 03 8.1
Venue for meetings are at long distances 09 24.32
No TA/DA provided 09 24.32
Their feedback not given due weightage 01 2.7
Family responsibilities or not feeling well 16 43.24
Family restrictions 02 5.4
4 Platforms for sharing information in the villages
Sharing information informally 35 (94.6)
Sharing information in group meetings 25 (67.6)
Organizing special meetings for information sharing 10 (27.0)
As per the responses of the members it was found that most of the Governing Board
meetings were conducted on quarterly basis. However, it was found that frequency of
meetings depends upon number of times fund is released. Thus in the states like Assam and
Uttarakhand where budget is less they conduct meetings on half yearly basis. Regarding the
frequency of BFAC meeting, data shows that almost one-third of the BFAC representatives
said that meetings were conducted on monthly basis whereas the remaining respondents
(26.6%) said that meetings were conducted quarterly. When it was discussed with the officials
it was found that they prefer to conduct monthly meetings but due to lack of funds, unsuitable
timings, sometimes the meetings were not organized.
According to the women farmer representatives’ majority (91.9%) has attended the
meetings regularly though they expressed constraints in attending meetings. The major

58
(43.24%) constraints found was women are engaged in domestic responsibilities and health
problems. It was also found that in some states long distances to the venue of the meeting
and no TA/ DA for attending the meetings were significant constraints. In Uttarakhand and
Assam due to less /delayed budget release, Travelling Allowance (TA) was not provided on
time.
Few women farmer representatives mentioned that, delay in communication about
the meetings and these women representatives were engaged in other societies, living in far
off places were the reasons for not attending the meetings. However, in states like Madhya
Pradesh, Jharkhand, Assam they send letters about the meeting schedules two to three days
in advance and in some states meeting is organized on a prefixed date in every month and
this is mentioned in the annual plan.
It is evident from the table that almost all the women farmer representatives share
the information discussed in the meeting with the women farmers back home. However the
platform was found different. It was found that about 95 percent of the women farmer
representatives share information informally followed by sharing information in meetings of
women groups (67.6 %), whereas only 27 percent conduct special meetings for sharing the
information. Jharkhand is the state where most of these meetings were conducted with the
help of women farmer representatives in their respective villages.
Table 19: Role performed by the women farmer representatives as perceived by them
S No Roles Frequency
(N= 37) Percentage
i. Collecting information on the needs and problems of the
women farmers and giving feedback to committees
36 97.29
ii. Providing inputs as per the need of the women farmers 29 78.37
iii. Helping in preparing Block Action Plan/ District Action Plan 25 67.56
iv. Helping in formation and nurturing of FIG’s/ CIG’s 16 43.24
v. Creating awareness to women farmers about schemes and
programmes
11 29.72
vi. Facilitating in organizing extension activities 20 54.0

59
It is found from the study that (Table 19), almost all (97.29 %) women farmer
representatives have collected information on the needs and problems of the women farmers
and giving feedback to ATMA committees. Another important role was providing inputs for
the needs prioritized (78.37%) and helping in preparing Block Action Plan/ District Action Plan
(67.56%) by providing their important observations from the field. They are also significant
contributors for facilitating extension activities (54.0%) as all the women farmer
representatives were members in different groups. These women farmer representatives also
helped in formation and nurturing of FIG’s/ CIG’s (43.24%) and to get the technical and
economical benefits along with recognition in the society. Apart from this they are creating
awareness about different schemes and programmes (29.72%) running in their respective
blocks.
Table 20: Merits in participation of women farmer representatives in ATMA committee as perceived by them
N = 37 S No Role Number
Percentage
1 Facilitated to allocate more inputs to women 17 45.9
2 Helped in identifying women farmers needs 30 81.1
3 Helped in increasing the family income 14 37.8
4 Helped in getting the feedback from women farmers 29 78.4
5 Facilitated more participation of women farmers in
ATMA activities
26 70.3
6 Helped in strengthening and supporting women
groups
26 70.3
The merits of the participation of women representatives in the BFAC and
GB meetings were listed in Table 20. More than one third of the respondents mentioned that
it has become easy to identify the needs of women farmers (81.1%) and get feedback from
women farmers (78.4%), as women share their problems and needs freely with the women
farmer representatives of the committees. About 70 percent of the representatives found
that participation helped to facilitate more participation of women farmers in different
extension programmes, strengthened and supported the women groups by putting forward
their needs and finding solutions to these problems. Other important merits perceived by the
members were providing inputs to the women farmers (45.9) and in increasing the family

60
income (37.8%) by increasing women farmer active participation in agriculture and allied
activities.
Table 21: Role performed by the women farmer representatives in ATMA Committees as perceived by the extension functionaries
(N= 20) S No Roles Number Percentage
i Contributed feedback/inputs for preparation of
DAP /BAP
7 35
ii Helps in problem solving and decision making 12 60
iii Representing women farmers needs 5 25
iv Helps in selection of the villages and farmers 15 75
v Sharing information about various schemes 5 25
vi Formation and nurturing of the groups 13 65
vii Facilitating in organizing extension activities 13 65
Out of 37 officials interviewed for the study, 20 of them namely Project Director, BTT
conveners and BTM’s who were in different ATMA Committees formed the respondents.
Their perceptions about the role played by women farmer representatives presented in the
Table 21. It is seen from the table that, maximum percent (75%) of extension functionaries
perceived that women farmer representatives played a major role in selection of the villages,
farmers, followed by formation and nurturing of groups, facilitation in organizing extension
activities and providing feedback to solve identified problems encountered by farmers.
Women farmer representatives have minimal role in preparation of DAP/ BAP, as it is done at
the higher level.
5. IMPACT OF ATMA ON WOMEN FARMERS
Using a 3-point scale, an index was constructed and administered on the respondent
women farmers to study the impact of ATMA activities. The five dimensions which are
included in the index are Social participation of the women farmers, Technological and
skill up-gradation, Economic impact, Psychological and Managerial impact and Improvement
in extension services. All the 457 women farmers covered in the study responded to the
items in the index by way of giving their views to the scale item in the form of a cue.
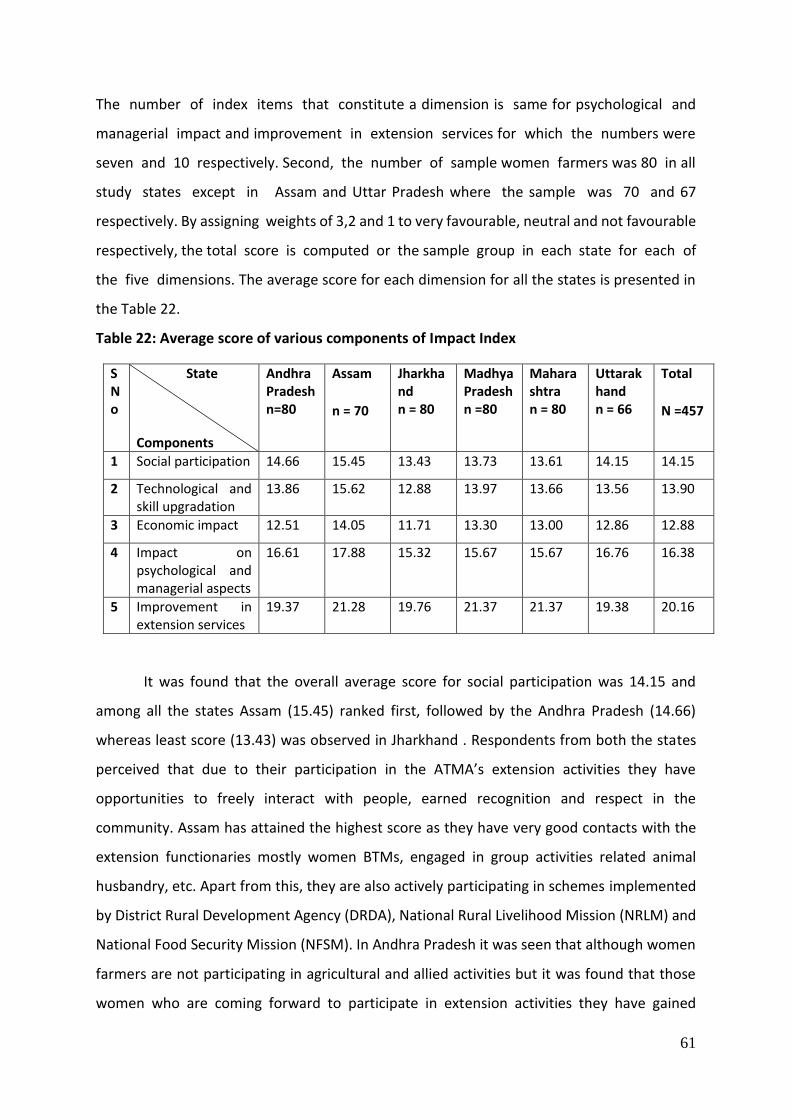
61
The number of index items that constitute a dimension is same for psychological and
managerial impact and improvement in extension services for which the numbers were
seven and 10 respectively. Second, the number of sample women farmers was 80 in all
study states except in Assam and Uttar Pradesh where the sample was 70 and 67
respectively. By assigning weights of 3,2 and 1 to very favourable, neutral and not favourable
respectively, the total score is computed or the sample group in each state for each of
the five dimensions. The average score for each dimension for all the states is presented in
the Table 22.
Table 22: Average score of various components of Impact Index
S No
State
Components
Andhra Pradesh n=80
Assam n = 70
Jharkhand n = 80
Madhya Pradesh n =80
Maharashtra n = 80
Uttarakhand n = 66
Total N =457
1 Social participation 14.66 15.45 13.43 13.73 13.61 14.15 14.15
2 Technological and skill upgradation
13.86 15.62 12.88 13.97 13.66 13.56 13.90
3 Economic impact 12.51 14.05 11.71 13.30 13.00 12.86 12.88
4 Impact on psychological and managerial aspects
16.61 17.88 15.32 15.67 15.67 16.76 16.38
5 Improvement in extension services
19.37 21.28 19.76 21.37 21.37 19.38 20.16
It was found that the overall average score for social participation was 14.15 and
among all the states Assam (15.45) ranked first, followed by the Andhra Pradesh (14.66)
whereas least score (13.43) was observed in Jharkhand . Respondents from both the states
perceived that due to their participation in the ATMA’s extension activities they have
opportunities to freely interact with people, earned recognition and respect in the
community. Assam has attained the highest score as they have very good contacts with the
extension functionaries mostly women BTMs, engaged in group activities related animal
husbandry, etc. Apart from this, they are also actively participating in schemes implemented
by District Rural Development Agency (DRDA), National Rural Livelihood Mission (NRLM) and
National Food Security Mission (NFSM). In Andhra Pradesh it was seen that although women
farmers are not participating in agricultural and allied activities but it was found that those
women who are coming forward to participate in extension activities they have gained

62
recognition and respect in the society. Jharkhand was found least and this might be because
of the tribal location, inability of the workers to reach the interior places due to language
problem, overloaded with work etc.
Fig 17: Impact on Social Participation (%)
Fig 18: Impact on technological and skill upgradation
The average score for technological and skill upgradation was 13.90 and Assam having
a much higher score than the overall average score i,e. 15.62. This may be due to the fact that
women farmers were trained on the activities in which they were already engaged i.e. Animal
65
70
75
80
85
90
(78.7 %)
Pe
rce
nta
ges
(%)
Social Participation
0
20
40
60
80
100(77.3%)
Pe
rce
nta
ge (
%)
Technological and skill upgradation
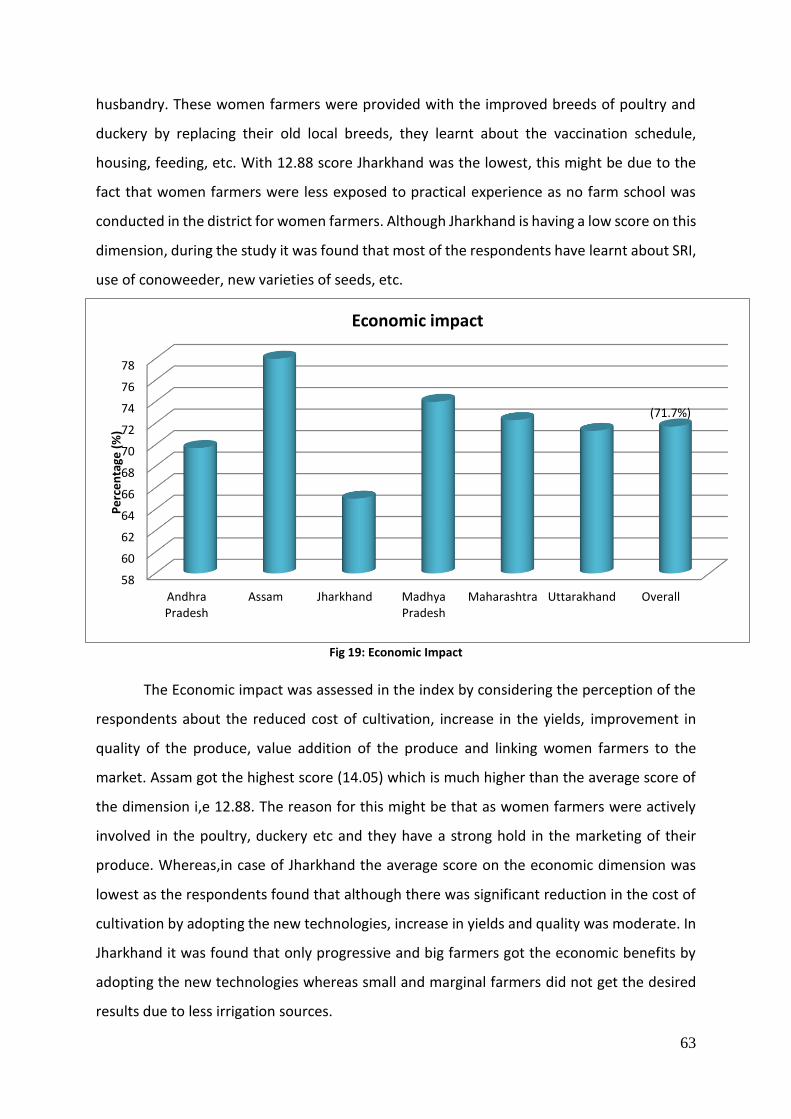
63
husbandry. These women farmers were provided with the improved breeds of poultry and
duckery by replacing their old local breeds, they learnt about the vaccination schedule,
housing, feeding, etc. With 12.88 score Jharkhand was the lowest, this might be due to the
fact that women farmers were less exposed to practical experience as no farm school was
conducted in the district for women farmers. Although Jharkhand is having a low score on this
dimension, during the study it was found that most of the respondents have learnt about SRI,
use of conoweeder, new varieties of seeds, etc.
Fig 19: Economic Impact
The Economic impact was assessed in the index by considering the perception of the
respondents about the reduced cost of cultivation, increase in the yields, improvement in
quality of the produce, value addition of the produce and linking women farmers to the
market. Assam got the highest score (14.05) which is much higher than the average score of
the dimension i,e 12.88. The reason for this might be that as women farmers were actively
involved in the poultry, duckery etc and they have a strong hold in the marketing of their
produce. Whereas,in case of Jharkhand the average score on the economic dimension was
lowest as the respondents found that although there was significant reduction in the cost of
cultivation by adopting the new technologies, increase in yields and quality was moderate. In
Jharkhand it was found that only progressive and big farmers got the economic benefits by
adopting the new technologies whereas small and marginal farmers did not get the desired
results due to less irrigation sources.
58
60
62
64
66
68
70
72
74
76
78
AndhraPradesh
Assam Jharkhand MadhyaPradesh
Maharashtra Uttarakhand Overall
(71.7%)
Pe
rce
nta
ge (
%)
Economic impact
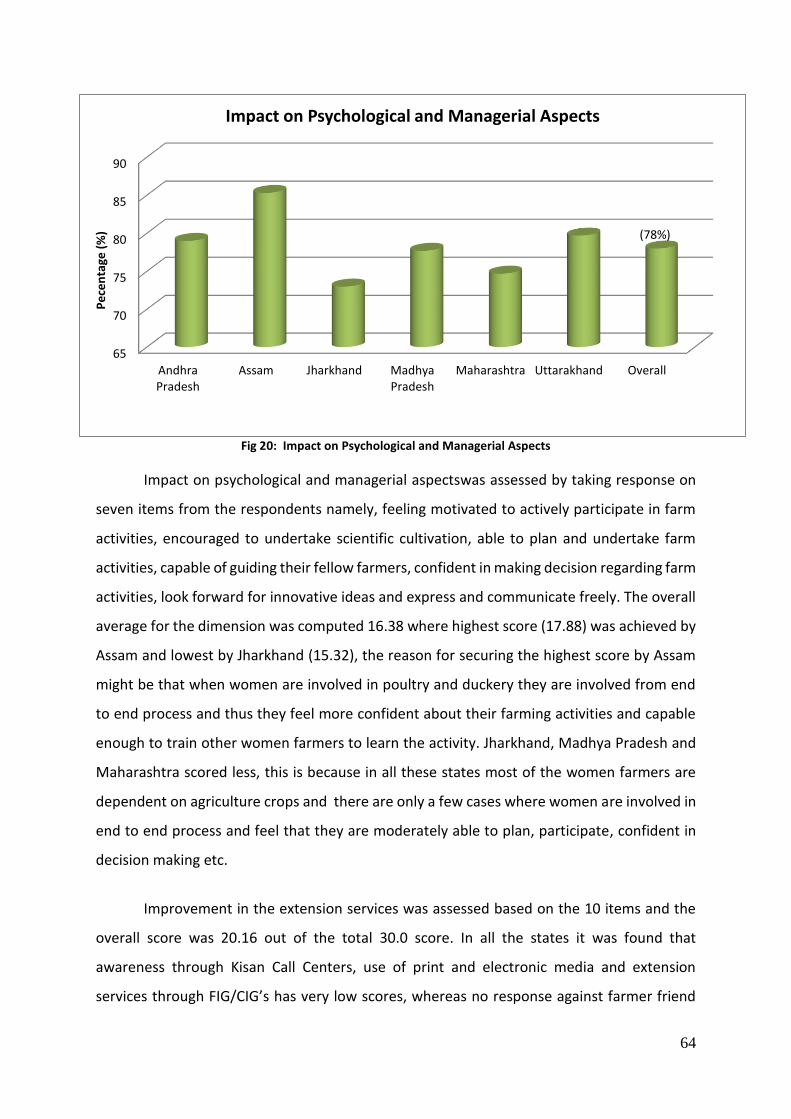
64
Fig 20: Impact on Psychological and Managerial Aspects
Impact on psychological and managerial aspectswas assessed by taking response on
seven items from the respondents namely, feeling motivated to actively participate in farm
activities, encouraged to undertake scientific cultivation, able to plan and undertake farm
activities, capable of guiding their fellow farmers, confident in making decision regarding farm
activities, look forward for innovative ideas and express and communicate freely. The overall
average for the dimension was computed 16.38 where highest score (17.88) was achieved by
Assam and lowest by Jharkhand (15.32), the reason for securing the highest score by Assam
might be that when women are involved in poultry and duckery they are involved from end
to end process and thus they feel more confident about their farming activities and capable
enough to train other women farmers to learn the activity. Jharkhand, Madhya Pradesh and
Maharashtra scored less, this is because in all these states most of the women farmers are
dependent on agriculture crops and there are only a few cases where women are involved in
end to end process and feel that they are moderately able to plan, participate, confident in
decision making etc.
Improvement in the extension services was assessed based on the 10 items and the
overall score was 20.16 out of the total 30.0 score. In all the states it was found that
awareness through Kisan Call Centers, use of print and electronic media and extension
services through FIG/CIG’s has very low scores, whereas no response against farmer friend
65
70
75
80
85
90
AndhraPradesh
Assam Jharkhand MadhyaPradesh
Maharashtra Uttarakhand Overall
(78%)
Pe
cen
tage
(%
)
Impact on Psychological and Managerial Aspects

65
services was found in Assam and Uttarakhand as there were no farmer friend. Among the
states, Madhya Pradesh and Maharashtra have secured top positions with equal score (21.37)
which was closely followed by Assam (21.28). Whereas, the lowest score was observed in
Andhra Pradesh (19.37) and Uttarakhand (19.38) this might be due to the reason that in both
the states reach to extension functionaries and services was low in Andhra Pradesh due to
socio-cultural factors which hinders in contacting the extension officials and in Uttarakhand
due to hilly terrain and inadequate extension staff.
Fig 21: Improvement in extension services
Among all the states Assam has secured highest score in creating the impact of ATMA
on women farmers whereas Jharkhand has the lowest score. However, as per the physical
and financial performance, Jharkhand was listed as high performing and Assam lowest
performing. This classification was based on the percent of the fund utilization during the
particular year, 2012-13. However, according to the data collected from the selected district,
Assam allocated the highest percent (37.0%) of the fund towards women farmers. From this,
it can be inferred that performance does not depend on the quantity of fund utilized but it is
the way available resources are put to use efficiently. In Assam, the needs of women farmers
were identified, made them technically sound by providing information related to the
60
62
64
66
68
70
72
AndhraPradesh
Assam Jharkhand MadhyaPradesh
Maharashtra Uttarakhhand Overall
(69%)
Axi
s Ti
tle
Improvement in extension services

66
activities they are already engaged in. Jharkhand was found to be low inspite of utilizing 27
percent fund towards extension activities and it might be due to the fact that women farmers
were trained on agricultural crops i.e. paddy or horticultural crops and during the field
investigation, it was found that merely adopting the new technologies does not assure the
best results. Apart from adoption of new technologies, size of land holding, type of soil,
availability of seeds at the right time, sources of irrigation, climatic conditions, affordability of
the farmers etc. affect the crops.
ANOVA (Analysis of Variance)
The analysis shows that the state-wise average scores on each dimension differ
among themselves (Table 23) and to confirm whether or not such a variation is noticed in the
populations of women farmers of each state (from which the samples have been drawn,
some Hypotheses have been postulated, as spelt out below, and tested using the Analysis of
Variance (ANOVA).
Table 23: Results of Analysis of Variance
Dimension Sum of
Squares df Mean Square F Sig.
Score on social
participation
Between Groups 218.070 5 43.614 6.449 .000
Within Groups 3049.899 451 6.763
Total 3267.969 456
Score on technological
and skill upgradation
Between Groups 303.661 5 60.732 9.852 .000
Within Groups 2780.103 451 6.164
Total 3083.764 456
Score on economic
improvement
Between Groups 232.116 5 46.423 7.798 .000
Within Groups 2684.737 451 5.953
Total 2916.853 456
Score on psychological
and managerial
improvement
Between Groups 302.066 5 60.413 6.142 .000
Within Groups 4436.152 451 9.836
Total 4738.219 456
Score on improvement in
extension services
Between Groups 317.627 5 63.525 5.542 .000
Within Groups 5169.734 451 11.463
Total 5487.361 456

67
Hypotheses: Dimension 1: Impact of social participation
Ho (null hypothesis): No significant difference occurs in the average scores of women
farmers in the populations of six study states on social participation
H1 ( Alternate hypotheses): Significant difference occurs in the average scores of women
farmers in the populations of six study states on social participation
To test the null hypothesis as postulated above, Analysis of variance is applied
wherein the average scores on social participation of sample women farmers of all the
six study states have been compared. As will be seen from Table 22, the average score
at the aggregate level for the six study states works out to 14.16 and across the study
states, Assam registers the highest at 15. 46 points while Jharkhand gets the lowest at 13.44
points. Thus, average scores show that the samples exhibit a pattern which is not uniform
in all the study states and hence the statistical testing which either confirms that what all
is observed in the sample average scores also gets reflected in the respective population
figures or not.
The testing through Analysis of Variance (ANOVA) involves computing ratio (F-ratio)
of mean sum of squares between groups to mean sum of squares within groups. The
ratio in the present case works out to 6.45 which is significant at 1 per cent level (at 5,
451 degrees of freedom). Based on this conclusion, we reject the null hypothesis and accept
the alternate hypothesis. Hence, the inference will be that whatever differences are noticed
in the sample average scores are also seen in average scores pertaining to populations. Thus,
the impact of ATMA on social participation of the women farmers is not uniformly the same
across all the study states but varies. The impact of ATMA is broadly seen in terms of moving
freely with people in the community, earning respect of people in the village, getting
recognition in the locality by the people etc.
Dimension 2: Impact of ATMA on Technological and skill upgradation:
Ho (null hypothesis): No significant difference occurs in the average scores of women
farmers in the populations of six study states on technological and skill upgradation.
H1 (Alternate hypotheses): Significant difference occurs in the average scores of women
farmers in the populations of six study states on technological skill upgradation.

68
The F-ratio of mean sum of squares of between groups to mean sum of squares within
groups results in 9.85, significant at 1 per cent level with 5,451 degrees of freedom. From this
analysis it can be inferred that all the study states do not exhibit similar pattern in so far as
the impact of ATMA on technological and skill upgradation is concerned. The Average
scores on the dimension in question do differ and in fact in this case too, Assam occupies the
first position. The impact of ATMA on technological and skill upgradation is the highest
at 15.63 points in this state and on the other end Jharkhand falls with a corresponding
score of 12.89 points. This dimension is composed of six components which include getting
access to improved technologies, learning new skills, adoption of new technologies etc.
Dimension 3: Economic Improvement Ho (null hypothesis): No significant difference occurs in the average scores of women
farmers in the population of six study states on economic impact
H1 ( Alternate hypotheses): Significant difference occurs in the average scores of women
farmers in the populations of six study states on economic impact.
This dimension consists of six components and they include adoption of new
technologies, ATMA has led to reduction in cost of cultivation, ATMA has resulted in increase
of yield rates, ATMA is responsible for improvement in the quality of produce, ATMA
facilitating better linkages to the markets etc. At the aggregate level this dimension yields
an average score of 12.88 points and Assam is found to be in the lead with an average
score of 14.06 points. Falling at other extreme is Jharkhand with 11.71 points (on an
average). The differences in average scores in the populations is confirmed by a significant
F-ratio of 7.80 (significant at 1 per cent level with 5, 451 degrees of freedom). Based on
the analysis it can be inferred that the economic impact of ATMA is felt more in relative
terms in Assam, followed by Madhya Pradesh and Maharashtra.
Dimension 4: Psychological and Managerial Improvement: Ho (null hypothesis): No significant difference occurs in the average scores of women
farmers in the populations of six study states on psychological and managerial impact.
H1 (Alternate hypotheses): Significant difference occurs in the average scores of women
farmers in the populations of six study states on psychological and managerial impact.
This dimension is measured by seven components and important among them include
feeling motivated to actively participate in farm related activities, encouraged to undertake
69
scientific cultivation, developing capacity to guide fellow farmers etc. The dimension yields
an average score on seven components of 16.39 points and across the study states, again
Assam is found to be ahead of other states with 16.89 points on an average and Jharkhand
occupies, as in the case of other dimensions, the lowest position with 15.32 points. Based
on the significant F-ratio of 6.14, the null hypothesis can be rejected and the alternate
hypothesis is accepted, implying that the average scores on this dimension vary significantly
across the six study states and Assam gets the 1st rank in this regard.
Dimension 5: Improvement in extension services: Ho (Null hypothesis): No significant difference occurs in the average scores of women
farmers in the populations of six study states on improvement in extension services
H1 (Alternate hypotheses): Significant difference occurs in the average scores of women
farmers in the populations of six study states on improvement in extension services.
Another visible impact of ATMA is in terms of improvement in the extension contact
of women farmers owing to frequent visit of extension staff, improvement in the contact with
line staff, enhanced awareness on the schemes and programmes of agriculture and allied
departments etc. (10 components constitute this dimension). For the entire sample of 457
women farmers, the average score on the dimension works out to 20.16 and two states
namely Assam and Maharashtra score higher averages than the score at aggregate level.
The differences are confirmed by a significant F-ratio of 5.54 (with 5, 451 degrees of freedom).
Thus, the populations in the study states (from which the samples are drawn) differ in so far
as this dimension is concerned and among the six states, Maharashtra is at the top notch,
closely followed by Assam.
The above analysis boils down to the following observations:
The populations comprising women farmers of ATMA scheme from which the
samples are drawn in six study states do differ on the all five dimensions under
consideration.
It can also be seen from the graphs drawn (given below) for each dimension,
Assam is ahead of other states as regards impact on social participation, impact
on technological upgradation, economic impact and psychological and
managerial impact while Maharashtra is in the lead regarding improvement in
extension services.

70
In the entire matrix of six states and five dimensions, ATMA made the lowest
impact (64.3 per cent) and this is in the area of improvement in extension
services in Uttarakhand. This calls for taking appropriate measures by the
authorities concerned.
Table 24: Correlation (r) between different dimensions of impact and independent variables
S. No
Dimensions
Variables
Social parti-
cipation
Technical & Skill
upgradation
Economic impact
Impact on Psycholo-gical and managerial aspects
Improve-ment in
Extension services
Overall Impact Index
1 Age (r) Sig N
-.07 .136 457
-.100* .033 457
-.072 .126 457
-.112* .017 457
-.086 .065 457
-.108* .021 457
2 Total income (r) Sig N
.181**
.000 457
.258**
.000 457
.212**
.000 457
.211**
.000 457
.168**
.000 457
.248**
.000 457
3 Farm income (r) Sig N
.111*
.018 457
.148**
.002 457
.077
.101 457
.125**
.008 457
.087
.064 457
.132**
.005 457
4 Nonfarm income (r) Sig N
.161* .020 209
. 162* .019 209
.081 .244 209
.056 .422 209
.094 .178 209
.130 .060 209
5 Wet operational land (r) Sig N
.065 .214 364
.132* .011 364
.137** .009 364
.106* .043 364
.088 .095 364
.126* .017 364
6 Dry operational land (r) Sig N
-.051 .281 443
-.092 .053 443
-.045 .346 443
-.070 .141 443
-.012 .797 443
-.056 .228 443
7 Land owned by women (r) Sig N
-.126 .220 97
-.061 .554 97
-.154 .131 97
-.199 .050 97
-.142 .165 97
-.164 .108 97
**Significant at 0.01 level * Significant at 0.05 level
Table 24 studies the correlation between the variables and different dimensions used
in the study for measuring the impact of ATMA on women farmers. Three measurable
variables, namely, age, income, household land and women owning land were used to study
the correlation. It was found that age is having negative relation with all the impact

71
dimensions. Further, it was found that age is having a significant relationship with the overall
impact of the ATMA (r=-.108) however, only technological and skill upgradation (r=-.100) and
psychological and managerial (r= -.112) was found to be significantly related with the age of
the respondents. The total income of the household is having a positive and highly significant
relationship with all the impact dimension which shows that farmers having high income have
gained more benefits from ATMA scheme. From the statistical analysis it was found that
wetland is having positive and dry land has created a negative impact on the respondents.
Overall wet land has created a positive and significant relationship (r=.126) with the impact
dimension, however, among the five dimensions, it was found significant only with technical
and skill upgradation (r= .132), economic (r= .137) and psychological and managerial (r= 106).
Although the increase in dry land shows the negative relationship with the impact of ATMA
but no dimension was found significantly related. Although land owning by the respondents
have no significant relationship with the impact of ATMA but a negative relationship was seen
from the statistical test between the two variables, this might be due to the reason that land
owned by the women farmers was found high in Andhra Pradesh and Maharashtra but the
women farmers participation in agricultural and allied activities was low. It was found that
women farmers who own land 0.51 to 1 acre have attained more score on all the dimensions
as compared to the other women owning less or more land than the given figure (Annexure
Table: ). Educational status is also an important variable for assessing the impact, as it cannot
be measured in quantitative term thus correlation is not worked out for this variable.
However on the basis of mean score it was found that women farmers who have high
education have secured highest score on all the impact dimension (Annexure Table : ).
The main extension activities of ATMA are trainings, exposure visits, demonstrations
and farm schools, and it is important to understand among these, which extension activities
are more suitable for women farmers. Table 25 shows the relationship between the
participation of the respondents in extension activities and the perceived impact on the five
dimensions. Although, all the respondents have participated in more than one activity, thus
the above relationship can be considered as an indicator.

72
Table 25: Relation between different dimensions of impact and extension activities
S. No
Average score of Dimensions
Extension activities
Mean &
Frequency
Social parti-
cipation
Technical & Skill up-gradation
Economic improve-
ment
Psycho- logical & Managerial
Improve-ment in
Extension services
1 Trainings
Outside state training
Mean 14.155 13.904 12.884 16.385 20.166
N 9 9 9 9 9
Within the state Mean 14.037 13.630 13.593 16.111 20.852
N 27 27 27 27 27
Within the district Mean 14.413 14.130 13.030 16.617 20.461
N 269 269 269 269 269
2 Exposure visits
Outside state Mean 12.846 13.385 12.154 15.308 18.000
N 13 13 13 13 13
Within the state Mean 14.129 14.355 13.645 16.839 20.694
N 62 62 62 62 62
Within the district Mean 14.747 14.158 13.305 17.053 20.600
N 95 95 95 95 95
3 Demonstration Mean 14.343 13.988 13.217 16.524 19.946
N 166 166 166 166 166
4 Farm School Mean 15.000 14.972 13.804 17.720 21.533
N 109 109 109 109 109
From the data it is evident that Farm Schools played an important role in creating the
overall impact on women farmers respondents. It is also evident that exposure visits within
the districts and within the states has also got high scores on three and four dimensions
respectively, this might be because most of the exposure visits were organized in combination
with trainings. As per the data it is found that demonstrations have also created a significant
impact on the respondents by securing good score in all the dimensions.

73
Table 26: Constraints faced by the extension functionaries to implement the activities for women farmers
S. No Constraints Score Rank 1 Poor cooperation of the women farmers 6.65 7 2 No ownership of the land 6.10 5 3 No family support to the women farmers 4.4 1 4 Cultural barriers existing in the society 4.61 2 5 Organizing program as per the convenience of
women farmers 6.94 8
6 Deciding venues of the programme 8.29 10 7 Lack of mobility 5.25 3 8 Gender sensitization 7.28 9 9 Less women/ extension workers 5.58 4 10 Lack/late release of funds 6.5 6
Lack of fund and late release of funds was noticed in Assam and Uttarakhand which
were selected from a low performing list as per the methodology of the study. Apart from
the late implementation of extension activities and delay in supply of inputs to the women
farmers, it was revealed that salaries of the contract extension workers namely BTMs and
ATMs were not provided on time, which has led to the low motivation levels of the extension
functionaries etc. Other constraints faced by the officials were poor cooperation of the
women farmers while implementing the extension activities, organizing program as per the
convenience of women farmers, lack of gender sensitivity among the officials and farmers.
Table 27 lists important suggestions made by women farmers, women representatives
and extension functionaries to provide better extension services to women farmers. There
are some common suggestions which came from all the three respondents such as training
to be provided on allied sectors, linking women farmers to the market, creating awareness
about the new schemes and technologies and need for more women extension workers. 125
women farmer respondents have expressed the need for a facility to improve access to inputs
and credit. 119women farmers preferred to have training venues in their villages, more
exposure visits within the state to improve access to extension services and participation of
women farmers in agriculture and allied sectors. It is interesting to note that women farmers
also felt the need for trainings on gender sensitization, at village level.
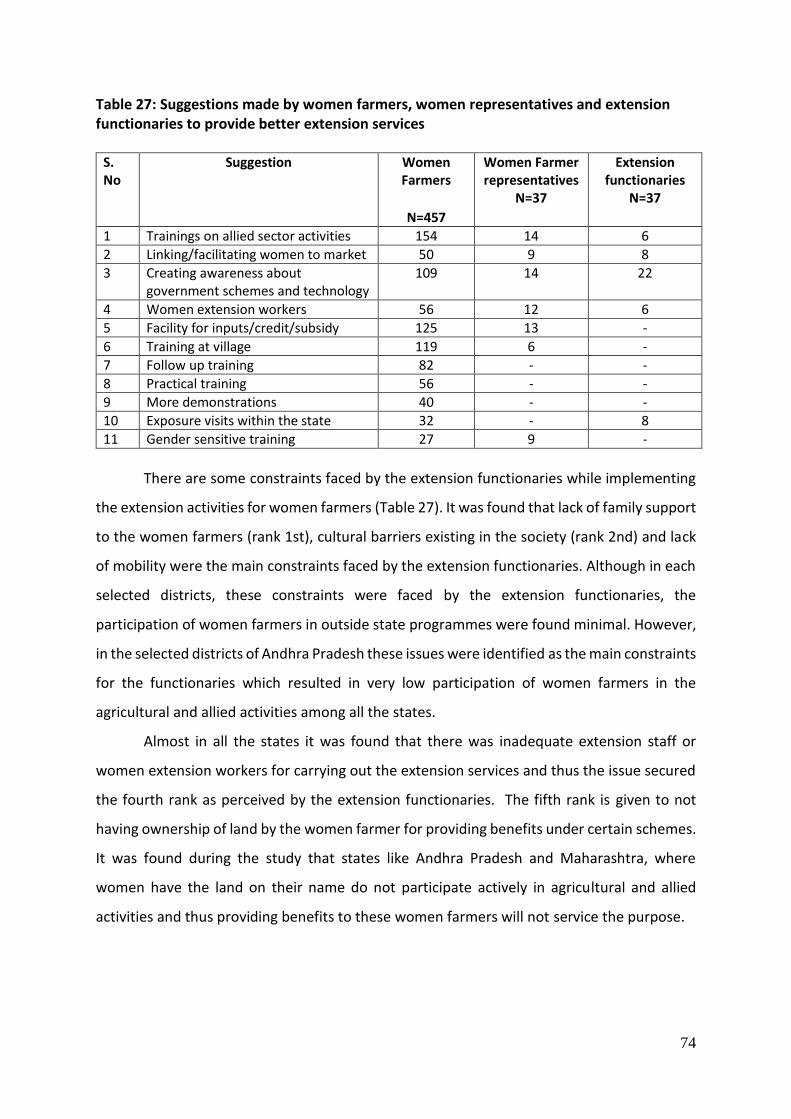
74
Table 27: Suggestions made by women farmers, women representatives and extension functionaries to provide better extension services
S. No
Suggestion Women Farmers
N=457
Women Farmer representatives
N=37
Extension functionaries
N=37
1 Trainings on allied sector activities 154 14 6 2 Linking/facilitating women to market 50 9 8 3 Creating awareness about
government schemes and technology 109 14 22
4 Women extension workers 56 12 6 5 Facility for inputs/credit/subsidy 125 13 - 6 Training at village 119 6 - 7 Follow up training 82 - - 8 Practical training 56 - - 9 More demonstrations 40 - - 10 Exposure visits within the state 32 - 8 11 Gender sensitive training 27 9 -
There are some constraints faced by the extension functionaries while implementing
the extension activities for women farmers (Table 27). It was found that lack of family support
to the women farmers (rank 1st), cultural barriers existing in the society (rank 2nd) and lack
of mobility were the main constraints faced by the extension functionaries. Although in each
selected districts, these constraints were faced by the extension functionaries, the
participation of women farmers in outside state programmes were found minimal. However,
in the selected districts of Andhra Pradesh these issues were identified as the main constraints
for the functionaries which resulted in very low participation of women farmers in the
agricultural and allied activities among all the states.
Almost in all the states it was found that there was inadequate extension staff or
women extension workers for carrying out the extension services and thus the issue secured
the fourth rank as perceived by the extension functionaries. The fifth rank is given to not
having ownership of land by the women farmer for providing benefits under certain schemes.
It was found during the study that states like Andhra Pradesh and Maharashtra, where
women have the land on their name do not participate actively in agricultural and allied
activities and thus providing benefits to these women farmers will not service the purpose.

75
VI. Conclusion and Recommendations
1. A total of 457 women farmer respondents were interviewed for the study. The mean
age of the women farmers range from 33 to 41 years. About 31 percent have
education upto high school. The average annual income of the household was found
Rs 94,350 where major income is coming from the farm activities. Average household
land holding in Andhra Pradesh and Madhya Pradesh was found 5 – 6.2 acres and the
least was found in Assam and Uttarakhand. However, inspite of low land holding in
Assam the income generated from the land is high because of the high cropping
intensity and fertile lands. On an average about 21 percent of women farmers owned
the land on their name. Further, about 77 percent of the women farmers were
members of one or the other social groups namely SHG, Mahila Mandals, Fisheries
society etc.
2. About 65 percent of the extension functionaries were post graduates followed by
graduates (32 %) and have an average 18 years of experience in the department. In
Jharkhand, Assam and Uttarakhand, the post of Project Director, ATMA is an
additional charge given to the districts heads of agricultural departments. It is also
found that in these districts where the department officials are holding the charge of
Project Director, ATMA were able to mobilize the extension staff and implement the
activities smoothly, as they have control over their departmental staff at the block
level and below. Further, it is also found that BTM’s were holding charge of more than
one block in Jharkhand and Uttarakhand states due to incomplete recruitment of
BTMs.
3. All the women farmer representatives were educated, about 35 percent were
intermediate followed by High School (27 %) and Graduate and above 24 percent. On
an average selected members have 3 acres of land on their name. About 84 percent
of women farmer representatives were holding the positions in the committees of
ATMA for more than 2 years.
4. Various activities carried out for women farmers under ATMA scheme included
trainings, demonstrations, farm schools, exposure visits and capacity building
activities. About 67 percent of the sample women have participated in training, 36

76
percent in demonstration, 24 percent in Farm schools, 37 percent in exposure visits
and 13 percent in capacity building programs for the groups.
5. Majority of women do not own land and these women are engaged more in allied
sector activities than activities related to agriculture. Therefore priority should be
given for organizing activities in allied sectors which includes livestock rearing, fodder
cultivation, sericulture, processing and value addition.
6. Under cafeteria of activities expenditure on demonstration was found less in
agricultural sector as it is linked to land ownership and many women respondents do
not own the land, they were not considered as beneficiaries for demonstrations. To
overcome the problem it is suggested that wherever women groups are working
successfully, by taking land on lease those women could be considered as beneficiaries
by ATMA.
7. It is recommended to organize more trainings at the village level to overcome the
socio –cultural barriers. In addition training on micro enterprises which can be
performed at household and group level are also recommended for economic
development of the women farmers. It is also found that there is a need for organizing
gender sensitization trainings at various levels.
8. On an average all the states have utilized about 21 percent of fund towards women
farmers activities enlisted in the cafeteria. However, proportion of funds spent on
women farmers varies from state to state. Assam has spent the highest percent on
women farmers’ activities; the lowest percent was seen in Andhra Pradesh
(undivided). The out performance of Assam state is due to the high number of women
extension functionaries (50%) with technical qualification in allied sectors and their
focus was on women farmers engaged in dairy, poultry, duckery, fisheries and to
certain extent vegetable cultivation. However, least priority was given for linking
women farmers to the markets.
9. Women farmers of Andhra Pradesh have received significant number (28%) of
demonstrations on agriculture and also got trained on Integrated Pest Management
(IPM), Integrated Nutrient Management (INM), nursery preparation under shade nets,
zero tillage in maize, etc. Andhra Pradesh was the only states where women farmers
have participated in the demonstrations on processing and value addition and farm

77
equipment and machinery where they learnt about processing of fish i.e fish pickles
and snacks preparation.
10. In all the states it was found that most of the farm schools were conducted on the
subjects namely integrated farming, composite farming, mixed farming, etc. covering
agriculture, animal husbandry and fisheries. Most of the farm women attended the
farm schools organized on agriculture (78) followed by animal husbandry (71) and
fisheries (9). In Madhya Pradesh maximum women farmers (47) attended farm schools
in agriculture, which covered horticulture, pulses, wheat, millets, oilseed, etc where
they learnt about mixed, inter and integrated cropping patterns. It was found that in
Assam most (48) of the women participated in animal husbandry where all most, all
farm schools were on poultry and some on poultry cum duckery. Fisheries farm
schools were found only in Assam where they organized farm schools in the subjects
of fisheries cum poultry cum duckery. Majority of the respondents have attended the
Farm School regularly in all the states and every one found these farm schools useful.
Therefore, it is recommended to involve more women farmers in conducting the Farm
Schools not only in agriculture but also in allied sectors where women have shown
good interest.
11. In few states the extension functionaries are found to be collecting information
related to the needs of the women farmers during their regular visits to villages for
conducting extension activities. Whereas in other states consultation with the women
farmers was not found so much for need assessment and finalizing the action plans.
To make the ATMA programs need based and to ensure effective utilization of fund it
is important to have more group discussions with women farmers and their
representatives to identify their priorities for allocation of funds.
12. Strategic Research and Extension Plan (SREP) is an important document to identify the
needs of the farmers, but from the observation it was found that it was rarely referred
to. It is suggested to refer the SREP before finalizing the action plan.
13. Out of thirty seven, thirty women farmer representatives were members of the Block
Farm Advisory Committee (BFAC). Seven women farmer representatives were part of
the Governing Board, one from each selected district under the study. According to
the women farmer representatives’ majority (92%) has attended ATMA meetings
regularly, though they expressed constraints in attending meetings.
78
14. Proper selection of women farmer representative at GB and BFAC level is very
essential in addressing issues. Wherever, women farmer representatives of BFAC are
active, in those districts more consultations have taken place with women groups for
identifying priorities and implementing activities. In view of this, it is recommended
that the official should focus on proper selection and orientation trainings to BFAC
women representatives about the Extension Reforms Scheme and their role in its
implementation, so that, these women can play an active role in mobilizing women
groups, identifying their needs, giving feedback in the meetings and ensuring that the
women farmer needs are incorporated in action plans and budgets are earmarked for
addressing these needs.
15. Merits of participation of women farmer representatives in BFAC and
GB meetings as perceived by the members were that it has become easy to identify
needs of women farmers and get feedback from them. About 70 percent of the
representatives felt that their participation in ATMA meetings and activities helped to
facilitate more participation of women farmers in different extension programs and
strengthening the women groups
16. It was found that, women farmer representatives played main role in selection of
villages, beneficiary women farmers followed by formation and nurturing of groups,
facilitation in organizing extension activities and providing feedback to solve identified
problems. This practice needs strengthening in all the blocks and states.
17. Majority (84%) of the women farmer representatives were holding position for more
than two years. It was observed that in all the states there is no change in the members
of the committees and in some states, these positions were held by the women
farmers who were from the influential families. It is suggested that, women
representatives of BFAC should be changed on completion of their tenure (2 years).
Wherever BFAC women representatives are not found active the official should
motivate them and ensure their participation regularly in the meetings.
18. Women groups are found to be working together successfully in Uttarakhand state
where they were procuring inputs and marketing the farm produce collectively.
Similarly in Andhra Pradesh women groups are actively involved in production of leaf
plates and cups, extraction of fiber from palm and manufacturing different items such
as door mats, ropes, baskets etc for household use. As the socio cultural and economic

79
status of the women varies so much across the sample states it is suggested that
location specific, need based activities have to be promoted among the women for
their economic upliftment.
19. It is found that, in Madhya Pradesh state, many women achiever farmers were
included in farm schools by PRADAN, an NGO which has played an important role in
mobilizing women farmers to participate in farm schools. It is suggested to encourage
more involvement of NGOs under PPP mode for implementation of extension
activities for achieving the desired results.
20. During trainings women farmers have learnt about improved variety of layers (poultry
and duckery), management of layers, including vaccination, housing, etc. Whereas in
Maharashtra women farmers have more focus on large ruminant animals due to
scarcity of water for irrigation they want to have an additional income source. Women
farmers of Maharashtra have learnt about management of dairy animals (vaccination,
loose housing system, feeding), hydroponic and clean milking. Processing and value
addition to agriculture and allied products was given more focus in Jharkhand and
Andhra Pradesh. Women farmers in Jharkhand have learnt about food processing and
ornament making from Lac whereas women farmers in Andhra Pradesh got trained in
fish preservation, processing and storage. It is also reported that women who
participated in extension activities have gained recognition and respect in the society.
21. Farmer friends were found to be an importance source of information for the women
farmers and felt that the farmer friend is easily accessible to them for any kind of help
or advice. These farmer friends are found be very effective in mobilizing the groups
and supporting the BTMs, ATMs and other line department field functionaries in
organizing the extension activities at the village level. It is recommended to build the
capacities of these farmer friends regularly on technical and managerial aspects
wherever they are appointed and in the states where there is a delay in appointing
the farmer friend, the process has to be initiated at the earliest.
22. Progressive women farmers were used as trainers (under Farmer to Farmer Extension
Concept) in Maharashtra, Madhya Pradesh etc. and found successful in reaching out
more women farmers. This practice can be replicated in other areas / states also.
23. Women friendly tools such as conoweeder, paddy drum seeder, palmray fibre
extractor, cocoa harvester, seed treatment drum, spiral soyabean separator etc. were

80
given to the women / women groups through ATMA in different states and the women
groups have felt that these technologies have benefitted them by reducing the
drudgery in handling the activity, saved time, improved the efficiency of the women
farmers. It is recommended to popularize these tools and technologies on a large
scale to benefit more number of women farmers by ensuring the compatibility of
these tools and technologies to the local conditions.
24. Most of the women farmers / their families are continuing with traditional crops
without taking into consideration the changes that have occurred in the agro-
ecological conditions. They should be sensitized through different programmes to go
for crop diversification and integrated farming, which will fetch them better results
and sustainability.
25. Group activities and collective marketing was done by few women groups in the study
area, which has benefitted the women. This practice has to be promoted further to
empower the small and marginal women farmers socially and economically.
26. Economic impact was assessed by considering perceptions of respondents about
reduced cost of cultivation, increase in yields, quality of the produce, value addition
to the produce and linking women farmers to market. Assam got the highest score
indicating realization of higher benefits from extension activities. Assam is ahead of
other states as regards to impact on social participation, impact on technological
and skill up gradation, economic impact and psychological and managerial impact
while Maharashtra is in the lead regarding improvement in access to extension
services.
27. Among all the states, ATMA in Uttarakhand State made the lowest impact with regard
to improvement in extension services. This calls for taking appropriate measures by
the authorities concerned.
28. Farm Schools played an important role in creating overall impact on women farmers.
Exposure visits within the districts and within states have also contributed to the
better impact as most of the exposure visits were organized in combination with
trainings. As per the data it is found that demonstrations have also created a
significant impact on the respondents. In view of this it is suggested that training
should be supported by practical sessions to have more impact.

81
29. Women farmers reported that information regarding the conduct of extension
programmes is given only 1 or 2 days before the programme or in the last minute. In
such cases, they have a difficulty in attending the programmes. The schedule of the
field extension activities should be informed to the women farmers in advance, so that
they plan their domestic and other works, which facilitates more participation of
women farmers in extension activities,.
30. It was noticed that, in most of the states gender disaggregated data was not
maintained properly and it is recommended that the State Nodal Officer and the
officials at the district should ensure maintenance of gender disaggregated data which
is essential for analyzing the fund allocation, utilization and impact.
31. BTM’s were holding charge of more than one block in Jharkhand and Uttarakhand
states due to inadequate extension staff at the block level. Wherever BTMs, ATMs and
women extension functionaries are appointed they are found to be delivering good
services at field level and most of the women farmers were able to recognize and
acknowledge their services. Therefore, it is recommended that wherever appointment
of BTMs , ATMs and women extension functionaries is incomplete the state should
give priority for completing the appointment of the BTMs and ATMs for effective
implementation of the scheme.
32. ATMA officials also felt that, delay in release of fund is one of the major constraint
affecting the implementation of activities under Cafeteria. Hence, they suggested
timely release of fund well before the crop seasons will have a better impact on the
program.
33. The socio-cultural issues being main barriers for the extension functionaries, it is
suggested to implement the extension activities through women groups. In addition,
to address this issue and gender inequalities, it is recommended to have gender
sensitization programmes for the officials as well as farmers.

82
References
Anomymous 2012.Women are key to agriculture and food security. Appropriate Technology, 39 (2): 60. Badigar, C. and Jutle, R., 2004, Participation of rural women in agricultural and animal husbandry activities.
Karnataka J. Agric. Sci., 17 (4): 893-898 Borkakoty, J. 2013. Involvement of women in agricultural & allied operations: A case study in golaghat district,
Assam, India. International Journal for Basic Sciences and Social Sciences, 2(2): 139-144. Chauhan, N. M. and Thakor, R. 2006. Participation of the tribal farm women in decision making. Gujarat J. Ext.
Edu., Anand. 16 (17):55-57. Chayal, K. ,Dhaka, B.L., Poonia, M.K., Tyagi, S. V. S and Verma, S.R. 2013. Involvement of farm women in
decision- making in agriculture. Stud Home Com Sci, 7(1): 35-37. CTDHBF (Centre for Trade and Development and Heinrich Boell Foundation). 2009. The EU India FTA in
Agriculture and Likely Impact on Indian Women. New Delhi, December, http://www.in.boell.org/downloads/Summaryagr.pdf
Chayal, K., Dhaka, B.L and Suwalka, R. L. 2010 . Analysis of role performed by women in agriculture. Women in
agriculture, Humanity & Social Science Journal, 5 (1): 68-72. Chittedi, K. Rand Dommati, D. 2012. Employment and wages of agricultural women labor: A case study of
Karimnagar district in Andhra Pradesh. The IUP Journal of Agricultural Economics, 9 (1): 45- 68. Dewangan, S. K., Sahu, K. R., Achari, K. V. and Soni, S. 2011. Socio-Economic Empowerment of Tribal Women
through Sericulture a Study of Lailunga Block of Raigarh District, Chhattisgarh, India. International Journal of Business and Management, 6 (12):297-302.
Food and Agriculture Organization of the United Nations (FAO). 2011. The state of food and agriculture 2010-
2011. Gale, C., Collett, K. and Freccero, P. 2013. Delivering extension services through effective and inclusive women’s
groups:The case of SEWA in India. City and Guilds Centre for Skills Development, MEAS Case Study #5. Urbana, USA:Modernizing Extension and Advisory Services (MEAS).
Gupta, K.R., Yadav, B. and Singh, S.R. 1999. Role of rural women in decision-making process in agriculture in
district sitapur (Uttar Pradesh). Indian Journal of Agricultural Economics. 54, 3:282. Gupta, M. and Kaur, P., 2008, Role of women in the economy of vulnerable households with special reference
to dairying - A case study of milk producers in Biejapuri block of Agra district (UP). Indian J. Agric. Market., 22 (2):145-151.
GoI, Planning Comssion.2007. Report of the Working Group on Horticulture, Plantation Crops and Organic
Farming for the XI Five Year Plan (2007-12) Gowda, P. M. S. and Gowda, N. K. 2010.Participation of farm women in group discussion meeting. Karnataka J.
Agric. Sci.,23 (3) : 431-433. Haffis.S. and Reddy, Y. V. R. 2000. Impact of technological change on women in dryland areas on Andhra
Pradesh. Proceeding of workshop held on November 9-10, 2000. Women in Agriculture and rural development.Indian socity of agriculture economics, 32-43.
Hird-Younger, M. and Simpson, B. 2013.Women extension volunteers: An extension approach for female farmers.
MEASCase Study # 2. Urbana, USA: Modernizing Extension and Advisory Services (MEAS).

83
International Livestock Research Institute (ILRI). 2014. Increasing access to agricultural extension and advisory
services: How effective are new approaches in reaching women farmers in rural areas? http://www.ilri.org/node/38984
Kaburire, L. and Ruvuga, S. 2006. Networking for agricultural innovation. The MVIWATA national network of
farmers’ groups in Tanzania.Dodoma, Tanzania: National network of farmers’ groups in Tanzania (MVIWATA).
Karkar, B. R., Dhaduk, M. C. Kalsariya, B. N. and Bharad, N. D.2007. Farm women’s behavior to agricultural
entrepreneurship on improved mango cultivation. Women and Entrepreneurship: issues and challenges. Editors Patil, A. and Mathu, A. Kalpaz Publications, New Delhi.
Khan, M., M. Sajjad, B. Hameed, M. N. Khan and A. U Jan. 2012. Participation ofwomen in agricultureactivities
in district Peshawar. Sarhad J. Agric. 28(1): 121-127. Kripa, V and Surendranathan, V.G. 2008. Social impact and women empowerment through mussel farming in
Kerala, India. Development, 51:199–204 Kumari A. P. 2004. Impact of mutually aided cooperative, thrift and credit societies of rural women in Andhra
Pradesh: A comparative study. PhD Thesis, ANGRAU, Andhra Pradesh. Lenin, V., Singh, B. and Vijayaragavan, K. 2012. Coordination among Agencies delivering Extension Services
under Agricultural Technology Management Agency.Journal of agricultural extension management. 13(2): 41-58.
Ministry of Agriculture (MoA). 2009. Evaluation & Impact Assessment of Central Sector Scheme of Women in
Agriculture report. Development & Research Services (DRS) Pvt. Ministry of Foreign Affarirs, Danida. May 2004. Evaluation- Farm women in Develoment: Impact study of four
training projects in India. Danish institute for international studies, Department of development research.
Nain, M. S and Kumar, P. 2010. A Study of Women Participation and Decision Making in Farm Management J.of
Community Mobilization and Sustainable Development, 5(1), 067-071. Neelima, K. 2005. Creative potential and performance of SHG’s in rural areas of Warangal district of Andhra
Pradesh. PhD Thesis, ANGRAU, Andhra Pradesh. Odurukwe, S.N., Matthews-Njoku, E.C. and Ejiogu-Okereke, N. 2006. Impacts of the women-in- agriculture
(WIA)extension programme on women’s lives; implications for subsistence agricultural production of women in ImoState, Nigeria. Livestock Research for Rural Development 18 (18).
Parveen, S. 2007. Participation of farm women in agricultural decision-making. Bangladesh J. Prog. Sci. & Tech.
5(1): 141-144.
Patki, A., Nikhade, D. M. and Thote, S. G., 2000, Role performance of rural women in animal husbandry practices. Maharashtra J. Ext. Edu., 19: 246-248.
Saikia, A.1999. Role of farm women in agriculture and their involvement in decision making: A study in Johrat
district of Assam. Indian Journal of Agricultural Economics, 54, 3; 301 Sandhu, N., Hussain, J. and Matlay, H. 2012. Barriers to finance experienced by female owner/managers of
marginal farms in India. Journal of Small Business and Enterprise Development, 19(4): 640-655. Savitha, S. S., 2004, Role of rural women in animal husbandry. M.Sc. (Agri.) Thesis, Univ. Agric. Sci., Dharwad.

84
Sendilkumar, R., Nair, R. G. and Thomas, M. I. 2012. Awareness and Utilization of Information and
Communication Technology (ICT) in Agriculture - Farmer’s perspective.Journal of Agricultural extension management, 13(2), 21-31.
Shankaraiah, N., NarayanaSwamy, B. K., Shashekala, S. G. and Ravikumar, P. 2012. Dissemination of Agricultural
Technologies through Mobile Message Service in Karnataka.Journal of Agricultural extension management, 13(2), 33-40.
Sikka, P. and Dixit, V. B., 2006, Perception of rural women on buffalo husbandry: a perusal. Agric. Ext. Rev., 35-
38. Singh, A.K. and Singh, G.P. 1999. Female work participation and involvement in decision making process: A study
in Uttrakhand, Indian Journal of Agriculture economics, 3: 300. Singh, K. M. and Jha, A. K. 2012. Innovative Approaches in Technology Dissemination: Experiences of ATMA
Model in Bihar. http://ssrn.com/abstract=2168646 Singh, R. and Sengupta, R. 2009. The EU India FTA in Agriculture and Likely Impact on Indian Women. Centre for
Trade and Development and Heinrich BoellFoundation,New Delhi, December, 2009. http://www.in.boell.org/downloads/Summary_agr.pdf
Sreelata, M and Naomi, A. 2012. Can technology rescue women farm workers from drudgery? Appropriate
Technology, 39, 2: 57. Self-Reliant Initiatives through Joint Action (SRIJAN).
http://srijanindia.org/index.php?option=com_content&view=article&id=76&Itemid=91 Sulaiman, R. and Hall, A. 2008. The fallacy of universal solutions in extension: Is ATMA the new T&V? LINK News
Bulletin (United Nations University), September, 1–4. <http://innovationstudies.org/index.php?option=com_docman &task=cat_view&gid=45&Itemid=99999999
Swanson, B. E, Bentz, R. P and Sofranko, A.J.1998. Improving agricultural extension. A reference manual. Food
and Agriculture Organization of the United Nations Tiwari, N. 2010.Economic and Technological Constraints facing Farm Women. International Journal of Rural
Studies (IJRS), 17, 1:5. Tuteja, S. 2000. Contribution of female agricultural worker in family income and their status in Haryana, Indian
journal of agricultural economics, 55 (2): 32-67. UN WOMEN (United Nation Entity for gender equality and the empowerment of the women). 2012.Women land
and agriculture in rural India. http://www.unwomensouthasia.org/assets/UNWomen_LandAgriculture_in_Rural_India.pdf
85
Annexure I
Profile of the Sample Districts
DARRANG (ASSAM)
Darrang is one of the 37 districts of Assam and situated at the center of the state,
which comes under North Bank Plain Zone (NBPZ) of Assam. The district is surrounded in the
north by Udalguri district, in the east Sonitpur district and in the west by Kamrup district. The
mighty Brahmaputra flows along the southern periphery of the district. Thus, the district is
also well connected with the water ways. Geographically it lies between longitudes 20º 09’N
to 26º95’N and latitudes 91º45’E to 92022’E. The major physiographic variation of the district
is in general considered to be plain except high land areas, flood prone areas, char lands and
swampy areas. Average annual rainfall is about 1762.63 mm. the district occupies a
geographical area of 1427.49 sq. km. There are six development blocks Viz. Sipajhar,
PachimMangaldai, Pub Mangaldai, Kalaigaon, Dalgaon-Sialmari and Bechimari. Further there
are 562 villages in darrang.
Total population of Darrang is 92.85 lacs among which 94.02 percent lives in
rural area and 5.98 lives in urban.
The average literacy rate of Darrang is 52.45 percent and it is reported 56.52
percent and 48.2 percent for male and females respectively.
The district sex ratio is 954 per 100 males.
Out of the total population 35 .0 percent is the working population among
which 33.08 percent are main cultivator and 14.29 percent agricultural
labourers.
The cultivable area is 73.40 percent of the total area of the district. At present,
83.7 percent of cultivable area is under cultivation. Major source of irrigation
in Darrang is pumpsets which is used to irrigate 40.31 percent area.

86
Major crops of the district are paddy, wheat, pulses, oilseeds, fibre, sugarcane,
vegetables banana, tea areca nut, coconut, spices and condiments. This district
is also rich in livestock and backyard poultry.
DEHRADUN (UTTARAKHAND)
Dehradun is one of the thirteen districts of Uttarakhand and also the provisional
capital. Dehradun town lies in the Dun Valley, on the watershed of the Ganga and Yamuna
rivers. Geographically, the location of Dehradun is in between 29° 58' and 31° 2'30'' north
latitudes and 77° 34'45'' and 78° 18'30'' east longitudes. Its altitude is 2100 ft above the sea
level. The average rainfall in the area varies 1646 mm (Sahaspur) to 2538mm (Musoorie) as
per the geographical location of the places in the district. The total area of the district is 3088
sq. km and the forest area accounts 43.70 percent of the district. Dehradun is divided in six
blocks vizChakrata, Kalsi, Vikas Nagar, Sahaspur, Raipur and Doiwala among which Kalsi and
Chakrata are hilly regions. The other details of the district are as follows:
In 2011, Dehradun had population of 16.97 lacs and on the basis of residence
55.9 percent of the population resides in urban area whereas 44.10 percent
reside in rural areas. The district has 21.2 percent of scheduled caste and
scheduled tribe population.
Average literacy rate of Dehradun in 2011 was 84.25 and if things are looked
out at gender wise, male and female literacy were 89.40 and 78.54
respectively.
The district has gender ratio of 902 against a state average of 963.
The net cultivated area is 46.0 percent of the district area which is mostly
irrigated by canals (58.3 %) followed by tube wells (41.7%).
Major agricultural crops are sugarcane, wheat, rice (basmati),barley, maize,
mustard, arhar, urd, whereas it is also very rich in the production vegetables
and various fruits like mango, guava, peach, grape, strawberry, litchi etc

87
EAST GODAVARI (ANDHRA PRADESH)
East Godavari is one of the thirteen districts of Andhra Pradesh and located in the
North coastal part of Andhra Pradesh. It is bounded by Visakhapatnam district on the north
and West Godavari district on the south, Bay of Bengal on the east and Khammam district on
the west. East Godavari lies between the 16 30’ to 18 20’ North latitude and 81 30’ to 82 36’
East longitude. The district is having moderate climate and average rainfall varies widely from
1000 mm at the northern part of the coast to 1400 mm at the extreme western parts of the
hills. The geographical area of the district is 10,807 Sq.mtrs. there are 60 Mandal and 1012
gram panchayats. This district is also known as rice bowls of Andhra Pradesh with lush paddy
fields and coconut groves.Fisheries, plywood unit, paper mill, sugar
factories, sugar and biofuel plants are the key industries that offer employment and source
of livelihood to the people. Being the largest part of the rich Godavari delta, agriculture and
aquaculture are major parts of the economy for this district.
According to the 2011 census East Godavari district has a total population of 51.51
lacs among which 25.49 percent live in urban and 74.51 percent in rural areas of east
godavari.
The literacy rate of the district is 71.35 percent and on gender basis, male and female
literacy was 74.91 percent and 67.82 percent respectively.
East Godavari has a sex ratio of 1005 females for every 1000 males.
The main economic activity of East Godavari is agriculture and 64.8 percent of
population is depended on agriculture. East Godavari contributes about 10.0 percent
of the total food gain production in the state
277800 hectare is the net irrigated area of the district and major source of irrigation
are canals (62.1%) followed by bore wells (22.0 %).
The district stands top in the state in production of paddy, banana and coconut. Paddy,
Castor, Pulses, Jowar, Maize, Ground Nut are the major crops grown in the district.

88
EAST SINGHBUM (JHARKHAND)
East Singhbum is one of the 24 districts of Jharkhand and situated at the extreme corner
of the southeast of Jharkhand. It is bounded by the district Midnapur of West Bangal in East,
Seraikela district in west, Mayurbhanj district of Orissa in South and Purulia district of West
Bangal in North. Geographically the district lies between longitudinal 86 04’ min to 86 54’ East
and latitudinal 22 12’ min to 23 01’ North. Generally the height of this area is 700 ft. to 3100
ft. above sea level. The climate of the district is temperate and average annual rainfall in the
district is 1200mm to1400mm. Suvernrekha and Kharkai are the major rivers of the district.
The total geographical area of the district is 3533 Sq.km. and 53.0 percent of the area is
covered with residual mountains and hills. There are eleven blocks in the district (Goluri-cum-
jugsalai,Potka, Patamda, Boram,Duuria, Musabani, Ghatsila, Dhalbhumgarh, Chakulia,
Baharagora and Gurabanda) and 231 gram panchayats. The district is rich in minerals and Iron
Ore, Copper, Uranium, Gold and Kynite are found aboundantly. Other details of the districts
are as follows:
Total population of the district is 22.93 lacs having almost same population in rural
(10.20 lacks) and urban (12.74 lacks) area. In the district 28.5 percent of the population
is tribal (Santhals, Oraons, Mundas, Hos etc.) Schedule Caste 4.85 percent and total
SC/ST population constitute 33.35 percent of the population
The total literacy rate of the district is 76.13 percent whereas for male it is 84.51
percent and for females it is reported 67.33 percent.
The sex ratio of the district (949) is found more than the average sex ratio (940) of
the country. (Census 2011)
The agriculture cultivable land is 165152 hectare and major land is under paddy
cultivation (126765 ha.), wheat (20538 ha.) and Pulse and oilseed (20538 ha.).
According to census 2001 total cultivators were 5.38 percent whereas 8.53 percent of
the population was agricultural labourers.
The total irrigated land area is 14731 Hectare and open wells and canals are the major
sources of irrigation in the district.
89
Major crops of Kharif season are Paddy, Maize, Arhar, Urd, Moong, Kulthi and Nise;
Rabbi season ,Wheat, Mustrad, Linseed, Gram, Pea, Lentil; and vegetable like
Cabbage, Cauliflower, Tomato, Brinjal, Potato, Pumpkin are grown in the district
HODSHANGABAD (MADHYA PRADESH)
Hoshangabad is among 51 districts of Madhya Pradesh and it lies in the central
Narmada valley and on the northern fringe of the Satupura Plateau. Hoshangabad district is
bounded by the districts of raisen to the north, Narsinghpur to the east, Chhindwara to the
southeast, Betul to the south, Harda to the west, and Sehore to the northwest.
Geographically it is located at 22 75’ North and 77 72’ East and has an average elevation of
912 feet. Climate of the district is normal with average rainfall 1340 mm. Narmada is the main
river of the district. The district has an area 5408.23sq.km out of which 2229.74 sq.km. comes
under forest area. There are seven blocks in the district (Bankehdi, Pipariya, Babai,
Hoshangabad, Kesla, SeoniMalwa) and 428 gram panchayats. The other details of the district
are as follows:
As per the census 2011, Hoshangabad had population of 12.41lacs and a large
proportion of population lives in rural areas (68.59 %) whereas only 31.41 percent of
the population lives in urban area.
Literacy rate of Hoshangabad is 75.29 percent and gender wise male and female
literacy is 83.35 and 66.45 respectively.
The sex ratio of the district is 912 for every 1000 males.
District Hoshangabad has long spread of fertile agriculture land and thus agriculture
the main source of the economy in this area. Around 22.61 percent of the population
of the district work contributes to the economy as cultivators and agricultural labours.
The net irrigated area of the district is 227795 hectares and 54.4 percent of the area
is irrigated by canals followed by open wells (19.8 %) and bore wells (19.0%).
The farmers employ rotation of crops and their major income depends on soya bean
and wheat crops in rabi and kharif season respectively whereas Jowar, Channa, Til,
Cotton, AlsiTuwar are other important crops.

90
SATARA (MAHARASHTRA)
Satara is one of the 36 districts of Maharashtra and located in the western part
of Maharashtra, completely landlocked being surrounded by Ratnagiri district on the
West, Sangli district on the south, Solapur on the west, Pune on the north and Raigad
on the North West. Most of the central Satara district’s area falls in the river Krishna
basin and limited area falls in the river Bhima basin. The district lies between 17 5’ to
18 11’ North latitude and between 73 33’ to 74 54’ East longitude. It has an average
elevation of 2434 feet and average rainfall in the area is 1426 mm. the district covers
10,480 sqkms of area. There are eleven blocks in the district namely Satara, Karad,
Wai, Mahabaleshwar, Phaltan, Man, Khatav, Koregaon, Patan, Jaoli and Khandala and
1509 gram panchayat. The other details of the district are as follows:
According to 2011 census the total population of the district is 30.04 lacs. Major
portion of the population lives in rural area (81.0 %) whereas only 19.0 percent of the
population lives in urban area.
The literacy rate in the district is 78.52 percent as against the state average of 76.2
percent. Male literacy is 88.45 percent and the female literacy is 68.71percent.
The average sex ratio of the district is 988 per 1000 males
The total working population in the district is 21.86 lakhs, which is 43.77 percent of
the total district population. Out of total working population, more than half of the
working population (50.88%) is engaged in agriculture and allied activities.
Total irrigated area is 2.32 lac hectares and major source of irrigation for the district
are open wells (149 lac hectare) and canals (45.8 lac ha.).
Major crops of the area are pearl millet, jowar, groundnut, paddy and Soyabean (kharif
season) and wheat, sugarcane, chickpea and jowar (rabbi season). Other crops like
strawberry, mangoes, banana etc. are also very famous.
WEST GODAVARI (ANDHRA PRADESH)
West Godavari is one of the 13 districts, in the Coastal Andhra region of Andhra
Pradesh, India. The district headquarters is located at Eluru. It is surrounded by Khammam
district on the north, Krishna district and the Bay of Bengal on the south and on the east by

91
river Godavari and Krishna district on the west. It lies between 16 15'-17 30' northern
latitudes and 80 55' and 81 55' eastern longitudes. The region mostly has a tropical climate
like the rest of the Coastal Andhra region with annual rainfall of 1076.2 mm. The district
occupies an area of 7742 sq.km and there are 47 mandals. In the district the total forest area
is 81,200 hectares, forming 10.49 percent of the total geographical area of the district. Further
82.80 percent of the area is covered by paddy, tobacco (4.86%), sugarcane (4.73%) and chilies
(1.29%). This district is also known as "the greenery of Andhra Pradesh".
According to the 2011 census West Godavari district has a total population of 39.36
lacs among which 20.54 percent live in urban and 79.46 percent in rural areas of East
Godavari.
The literacy rate of the district is 74.63 percent and on gender basis, male and female
literacy was 77.92 percent and 71.36 percent respectively.
East Godavari has a sex ratio of 1004 females for every 1000 males.
Above 70 percent of the workers are engaged in agriculture and allied actives and
nearly 37.0 percent of the population living in rural areas depends, upon agriculture
for its livelihood.
The district has net irrigated area of 364500 hectares and about 68.0 percent of the
irrigated area is mainly under canals. Tube wells and tank-g come next in the order of
source of irrigation.
The district is extremely fertile, getting water abundantly throughout the Cotton
barage built on the Godavari River at Dhavaleswaram. In the Delta, aquaculture,
coconut, lemon and rice are cultivated. The district is popularly known as the
Granary of India since about 50.0 percent of the state's rice production comes from
the district.
In the uplands, oil palm, sugarcane, corn, mango, banana and other fruits as well as
tobacco and cotton are produced. In the coastal belt of the district, prawns and fish
is exported to Japan and the United States.

92
Annexure II
Photographs of the Respondents in Action
Azola Cultivation
Women Farmer Marketing Fish
Women farmers vaccinating the poultry birds Field Day on Maize
Women farmers attending the Farm School Woman Farmer using Conoweeder

93
Data Collection from the Woman Farmer Woman Farmer using Fodder Chaffer
Silk Worm rearing by Woman farmer Women Group involved in Handicrafts Making
Woman operating Paddy Transplanter Mat Nursery Preparation by Women Farmers

94
Annexure III Tables related to Dimensions of Impact Index
Social Participation Table 1: Having an equal opportunities like fellow farmers
State
Total Andhra
Pradesh Assam Jharkhand Madhya Pradesh Maharastra Uttarakhand
Social participation- equal opportunities
Disagree 0 0 3 3 1 4 11
.0% .0% 3.8% 3.8% 1.2% 6.0% 2.4%
Agree 46 23 56 47 46 26 244
57.5% 32.9% 70.0% 58.8% 57.5% 38.8% 53.4%
Strongly agree
34 47 21 30 33 37 202
42.5% 67.1% 26.2% 37.5% 41.2% 55.2% 44.2%
Total 80 70 80 80 80 67 457
100.0% 100.0% 100.0% 100.0% 100.0% 100.0% 100.0%
Table 2 : Participating freely in the festivals
State
Total Andhra
Pradesh Assam Jharkhand Madhya Pradesh Maharastra Uttarakhand
Participates freely in the festivals
With some inhibitions
2 2 3 6 5 6 24
2.5% 2.9% 3.8% 7.5% 6.2% 9.0% 5.3%
Freely 39 23 42 44 39 31 218
48.8% 32.9% 52.5% 55.0% 48.8% 46.3% 47.7%
More freely
39 45 35 30 36 30 215
48.8% 64.3% 43.8% 37.5% 45.0% 44.8% 47.0%
Total 80 70 80 80 80 67 457
100.0% 100.0% 100.0% 100.0% 100.0% 100.0% 100.0%

95
Table 3: Interacting freely with people
State
Total Andhra
Pradesh Assam Jharkhand Madhya Pradesh Maharastra Uttarakhand
Interact frequently with people
Very occasionally
4 2 4 4 5 6 25
5.0% 2.9% 5.0% 5.0% 6.2% 9.0% 5.5%
Frequently 34 25 49 51 47 34 240
42.5% 35.7% 61.2% 63.8% 58.8% 50.7% 52.5%
More frequently
42 43 27 25 28 27 192
52.5% 61.4% 33.8% 31.2% 35.0% 40.3% 42.0%
Total 80 70 80 80 80 67 457
100.0% 100.0% 100.0% 100.0% 100.0% 100.0% 100.0%
Table 4: Whether an active member of the group
State
Total Andhra
Pradesh Assam Jharkhand Madhya Pradesh Maharastra Uttarakhand
Being an active memeber of the group
Not an active member
1 4 5 6 13 4 33
1.2% 5.7% 6.2% 7.5% 16.2% 6.0% 7.2%
Active member
40 30 59 48 38 40 255
50.0% 42.9% 73.8% 60.0% 47.5% 59.7% 55.8%
Very active member
39 36 16 26 29 23 169
48.8% 51.4% 20.0% 32.5% 36.2% 34.3% 37.0%
Total 80 70 80 80 80 67 457
100.0% 100.0% 100.0% 100.0% 100.0% 100.0% 100.0%
Table 5: Whether earning the respect of people
State
Total Andhra
Pradesh Assam Jharkhand
Madhya Pradesh Maharastra Uttarakhand
Earn the respect of people
Did not happen
0 3 2 4 7 6 22
.0% 4.3% 2.5% 5.0% 8.8% 9.0% 4.8%
Certainly
43 23 60 48 51 33 258
53.8% 32.9% 75.0% 60.0% 63.8% 49.3% 56.5%
Very certainly
37 44 18 28 22 28 177
46.2% 62.9% 22.5% 35.0% 27.5% 41.8% 38.7%
Total 80 70 80 80 80 67 457
100.0% 100.0% 100.0% 100.0% 100.0% 100.0% 100.0%
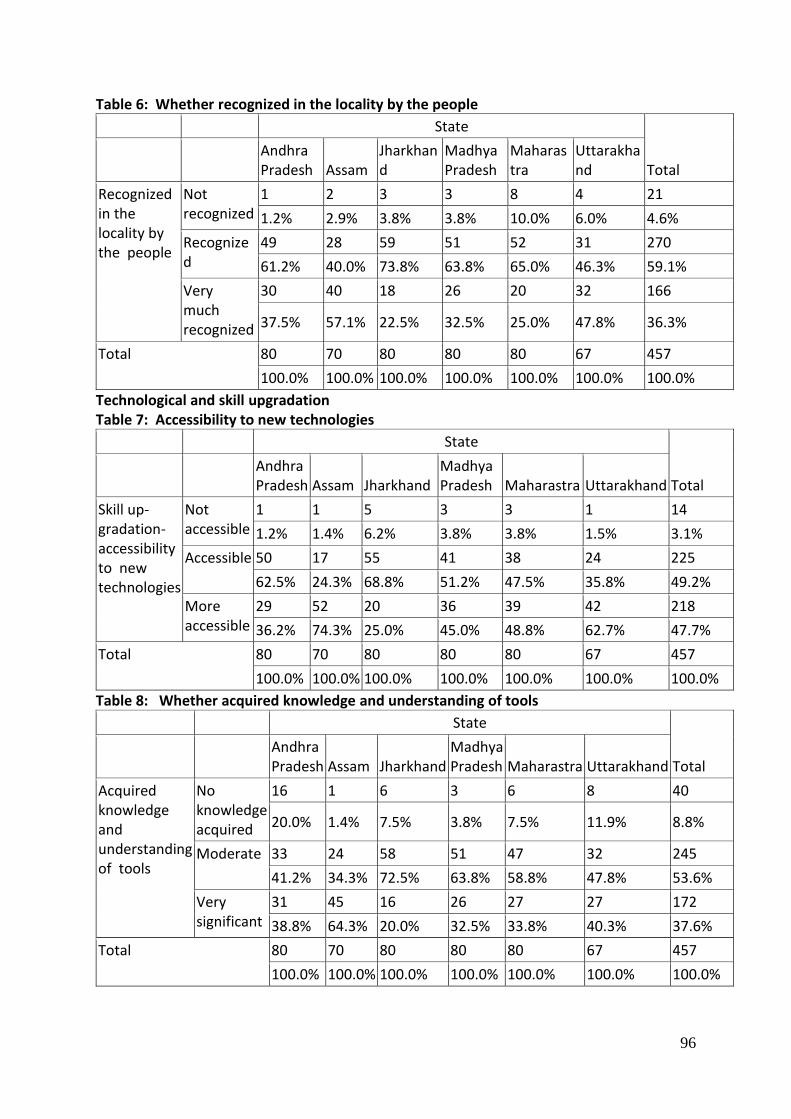
96
Table 6: Whether recognized in the locality by the people
State
Total Andhra
Pradesh Assam Jharkhand
Madhya Pradesh
Maharastra
Uttarakhand
Recognized in the locality by the people
Not recognized
1 2 3 3 8 4 21
1.2% 2.9% 3.8% 3.8% 10.0% 6.0% 4.6%
Recognized
49 28 59 51 52 31 270
61.2% 40.0% 73.8% 63.8% 65.0% 46.3% 59.1%
Very much recognized
30 40 18 26 20 32 166
37.5% 57.1% 22.5% 32.5% 25.0% 47.8% 36.3%
Total 80 70 80 80 80 67 457
100.0% 100.0% 100.0% 100.0% 100.0% 100.0% 100.0%
Technological and skill upgradation Table 7: Accessibility to new technologies
State
Total Andhra
Pradesh Assam Jharkhand Madhya Pradesh Maharastra Uttarakhand
Skill up-gradation-accessibility to new technologies
Not accessible
1 1 5 3 3 1 14
1.2% 1.4% 6.2% 3.8% 3.8% 1.5% 3.1%
Accessible 50 17 55 41 38 24 225
62.5% 24.3% 68.8% 51.2% 47.5% 35.8% 49.2%
More accessible
29 52 20 36 39 42 218
36.2% 74.3% 25.0% 45.0% 48.8% 62.7% 47.7%
Total 80 70 80 80 80 67 457
100.0% 100.0% 100.0% 100.0% 100.0% 100.0% 100.0%
Table 8: Whether acquired knowledge and understanding of tools
State
Total Andhra
Pradesh Assam Jharkhand Madhya Pradesh Maharastra Uttarakhand
Acquired knowledge and understanding of tools
No knowledge acquired
16 1 6 3 6 8 40
20.0% 1.4% 7.5% 3.8% 7.5% 11.9% 8.8%
Moderate 33 24 58 51 47 32 245
41.2% 34.3% 72.5% 63.8% 58.8% 47.8% 53.6%
Very significant
31 45 16 26 27 27 172
38.8% 64.3% 20.0% 32.5% 33.8% 40.3% 37.6%
Total 80 70 80 80 80 67 457
100.0% 100.0% 100.0% 100.0% 100.0% 100.0% 100.0%

97
Table 9: Whether learnt new skills
State
Total Andhra
Pradesh Assam Jharkhand Madhya Pradesh Maharastra Uttar Pradesh
Learnt new skills
No new skills acquired
3 2 5 4 3 5 22
3.8% 2.9% 6.2% 5.0% 3.8% 7.5% 4.8%
Moderate 47 19 58 49 47 41 261
58.8% 27.1% 72.5% 61.2% 58.8% 61.2% 57.1%
Very significant
30 49 17 27 30 21 174
37.5% 70.0% 21.2% 33.8% 37.5% 31.3% 38.1%
Total 80 70 80 80 80 67 457
100.0% 100.0% 100.0% 100.0% 100.0% 100.0% 100.0%
Table 10: Whether applied new technologies
State
Total Andhra
Pradesh Assam Jharkhand Madhya Pradesh Maharastra Uttarakhand
Applied new technologies
No new technologies adopted
2 1 4 1 3 7 18
2.5% 1.4% 5.0% 1.2% 3.8% 10.4% 3.9%
Adopted moderately
43 23 56 43 42 40 247
53.8% 32.9% 70.0% 53.8% 52.5% 59.7% 54.0%
Adopted very significantly
35 46 20 36 35 20 192
43.8% 65.7% 25.0% 45.0% 43.8% 29.9% 42.0%
Total 80 70 80 80 80 67 457
100.0% 100.0% 100.0% 100.0% 100.0% 100.0% 100.0%

98
Table 11: whether the use of new technologies reduced the physical and mental drudgery
State
Total Andhra
Pradesh Assam Jharkhand Madhya Pradesh Maharastra Uttarakhand
Use of new technologies reduced the physical and mental drudgery
No reduction
20 3 11 5 16 22 77
25.0% 4.3% 13.8% 6.2% 20.0% 32.8% 16.8%
Reduction to a moderate account
37 27 52 47 49 39 251
46.2% 38.6% 65.0% 58.8% 61.2% 58.2% 54.9%
Reduction to a significant account
23 40 17 28 15 6 129
28.8% 57.1% 21.2% 35.0% 18.8% 9.0% 28.2%
Total 80 70 80 80 80 67 457
100.0% 100.0% 100.0% 100.0% 100.0% 100.0% 100.0%
Table 12: Whether confident that they can disseminate the new technologies
State
Total Andhra
Pradesh Assam Jharkhand Madhya Pradesh Maharastra Uttarakhand
Confident that he can disseminate the technologies
Not confident
1 3 7 3 6 2 22
1.2% 4.3% 8.8% 3.8% 7.5% 3.0% 4.8%
Confident 35 34 54 53 50 31 257
43.8% 48.6% 67.5% 66.2% 62.5% 46.3% 56.2%
Very much confident
44 33 19 24 24 34 178
55.0% 47.1% 23.8% 30.0% 30.0% 50.7% 38.9%
Total 80 70 80 80 80 67 457
100.0% 100.0% 100.0% 100.0% 100.0% 100.0% 100.0%
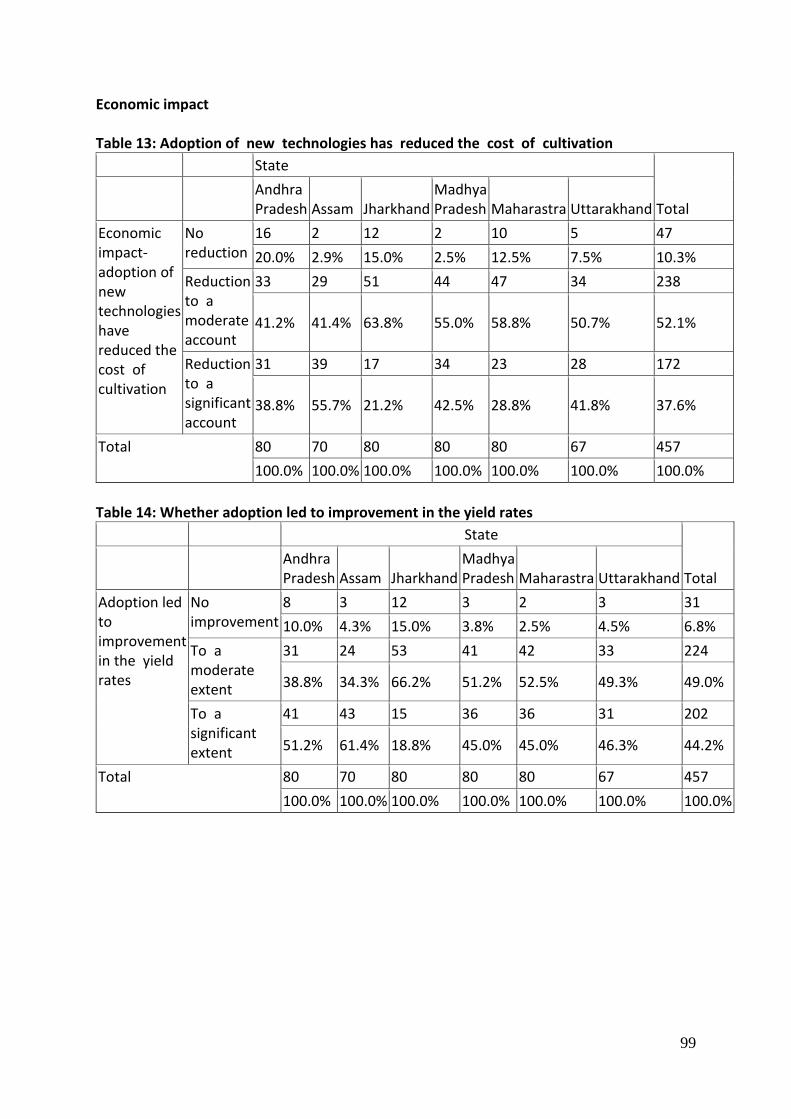
99
Economic impact Table 13: Adoption of new technologies has reduced the cost of cultivation
State
Total Andhra
Pradesh Assam Jharkhand Madhya Pradesh Maharastra Uttarakhand
Economic impact- adoption of new technologies have reduced the cost of cultivation
No reduction
16 2 12 2 10 5 47
20.0% 2.9% 15.0% 2.5% 12.5% 7.5% 10.3%
Reduction to a moderate account
33 29 51 44 47 34 238
41.2% 41.4% 63.8% 55.0% 58.8% 50.7% 52.1%
Reduction to a significant account
31 39 17 34 23 28 172
38.8% 55.7% 21.2% 42.5% 28.8% 41.8% 37.6%
Total 80 70 80 80 80 67 457
100.0% 100.0% 100.0% 100.0% 100.0% 100.0% 100.0%
Table 14: Whether adoption led to improvement in the yield rates
State
Total Andhra
Pradesh Assam Jharkhand Madhya Pradesh Maharastra Uttarakhand
Adoption led to improvement in the yield rates
No improvement
8 3 12 3 2 3 31
10.0% 4.3% 15.0% 3.8% 2.5% 4.5% 6.8%
To a moderate extent
31 24 53 41 42 33 224
38.8% 34.3% 66.2% 51.2% 52.5% 49.3% 49.0%
To a significant extent
41 43 15 36 36 31 202
51.2% 61.4% 18.8% 45.0% 45.0% 46.3% 44.2%
Total 80 70 80 80 80 67 457
100.0% 100.0% 100.0% 100.0% 100.0% 100.0% 100.0%

100
Table 15: Whether adoption led to improvement in the quality of produce
State
Total Andhra
Pradesh Assam Jharkhand Madhya Pradesh Maharastra Uttarakhand
Adoption led to improvement in the quality of produce
No improvement
5 2 9 2 3 5 26
6.2% 2.9% 11.2% 2.5% 3.8% 7.5% 5.7%
To a moderate extent
32 26 55 51 43 30 237
40.0% 37.1% 68.8% 63.8% 53.8% 44.8% 51.9%
To a significant extent
43 42 16 27 34 32 194
53.8% 60.0% 20.0% 33.8% 42.5% 47.8% 42.5%
Total 80 70 80 80 80 67 457
100.0% 100.0% 100.0% 100.0% 100.0% 100.0% 100.0%
Table 16: Extent to which there is value addition to the produce
State
Total Andhra
Pradesh Assam Jharkhand Madhya Pradesh Maharastra Uttarakhand
Value addition to the purchases
No improvement
44 8 23 6 27 27 135
55.0% 11.4% 28.8% 7.5% 33.8% 40.3% 29.5%
To a moderate extent
24 45 47 55 31 37 239
30.0% 64.3% 58.8% 68.8% 38.8% 55.2% 52.3%
To a significant extent
12 17 10 19 22 3 83
15.0% 24.3% 12.5% 23.8% 27.5% 4.5% 18.2%
Total 80 70 80 80 80 67 457
100.0% 100.0% 100.0% 100.0% 100.0% 100.0% 100.0%

101
Table 17 : Whether ATMA facilitated better linkages?
State
Total Andhra
Pradesh Assam Jharkhand Madhya Pradesh Maharastra Uttarakhand
ATMA facilitated better linkages
Not facilitated
43 20 34 28 33 20 178
53.8% 28.6% 42.5% 35.0% 41.2% 29.9% 38.9%
Facilitated moderately
30 46 36 45 32 41 230
37.5% 65.7% 45.0% 56.2% 40.0% 61.2% 50.3%
Facilitated very well
7 4 10 7 15 6 49
8.8% 5.7% 12.5% 8.8% 18.8% 9.0% 10.7%
Total 80 70 80 80 80 67 457
100.0% 100.0% 100.0% 100.0% 100.0% 100.0% 100.0%
Table 18: Whether farm advisory helped to increase farm income
State
Total Andhra
Pradesh Assam Jharkhand Madhya Pradesh Maharastra Uttarakhand
Better farm advisory services helped to increase farm income
Not helped 10 2 13 0 6 2 33
12.5% 2.9% 16.2% .0% 7.5% 3.0% 7.2%
Helped moderately
37 32 55 58 43 45 270
46.2% 45.7% 68.8% 72.5% 53.8% 67.2% 59.1%
Helped very significantly
33 36 12 22 31 20 154
41.2% 51.4% 15.0% 27.5% 38.8% 29.9% 33.7%
Total 80 70 80 80 80 67 457
100.0% 100.0% 100.0% 100.0% 100.0% 100.0% 100.0%
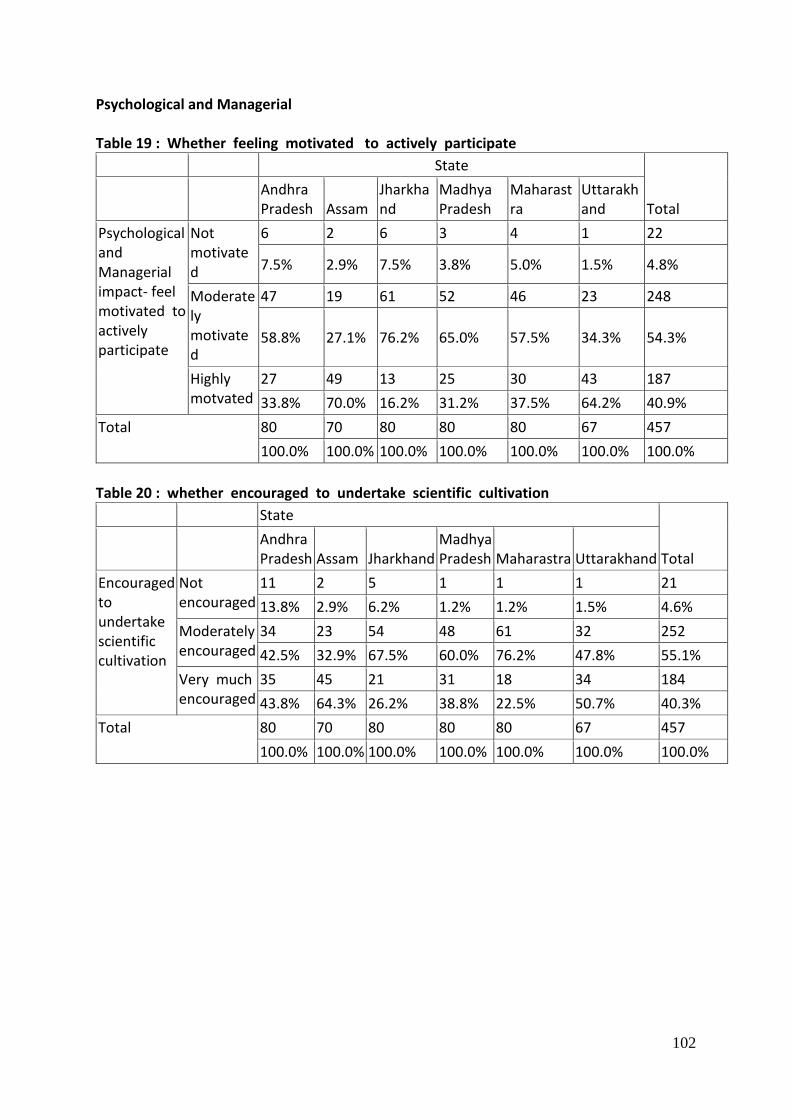
102
Psychological and Managerial Table 19 : Whether feeling motivated to actively participate
State
Total Andhra
Pradesh Assam Jharkhand
Madhya Pradesh
Maharastra
Uttarakhand
Psychological and Managerial impact- feel motivated to actively participate
Not motivated
6 2 6 3 4 1 22
7.5% 2.9% 7.5% 3.8% 5.0% 1.5% 4.8%
Moderately motivated
47 19 61 52 46 23 248
58.8% 27.1% 76.2% 65.0% 57.5% 34.3% 54.3%
Highly motvated
27 49 13 25 30 43 187
33.8% 70.0% 16.2% 31.2% 37.5% 64.2% 40.9%
Total 80 70 80 80 80 67 457
100.0% 100.0% 100.0% 100.0% 100.0% 100.0% 100.0%
Table 20 : whether encouraged to undertake scientific cultivation
State
Total Andhra
Pradesh Assam Jharkhand Madhya Pradesh Maharastra Uttarakhand
Encouraged to undertake scientific cultivation
Not encouraged
11 2 5 1 1 1 21
13.8% 2.9% 6.2% 1.2% 1.2% 1.5% 4.6%
Moderately encouraged
34 23 54 48 61 32 252
42.5% 32.9% 67.5% 60.0% 76.2% 47.8% 55.1%
Very much encouraged
35 45 21 31 18 34 184
43.8% 64.3% 26.2% 38.8% 22.5% 50.7% 40.3%
Total 80 70 80 80 80 67 457
100.0% 100.0% 100.0% 100.0% 100.0% 100.0% 100.0%

103
Table 21 : whether being able to plan and undertake farm activities
State
Total Andhra
Pradesh Assam Jharkhand Madhya Pradesh Maharastra
Uttar Pradesh
Able to plan and undertake farm activities
Low ability
8 4 6 4 7 8 37
10.0% 5.7% 7.5% 5.0% 8.8% 11.9% 8.1%
Moderate ability
39 19 55 49 51 31 244
48.8% 27.1% 68.8% 61.2% 63.8% 46.3% 53.4%
High ability
33 47 19 27 22 28 176
41.2% 67.1% 23.8% 33.8% 27.5% 41.8% 38.5%
Total 80 70 80 80 80 67 457
100.0% 100.0% 100.0% 100.0% 100.0% 100.0% 100.0%
Table 22: Whether capable of guiding fellow farmers
State
Total Andhra
Pradesh Assam Jharkhand Madhya Pradesh Maharastra
Uttar Pradesh
Capable of guiding fellow farmers
Not capable
3 4 4 3 4 12 30
3.8% 5.7% 5.0% 3.8% 5.0% 17.9% 6.6%
Moderately capable
37 23 52 47 55 27 241
46.2% 32.9% 65.0% 58.8% 68.8% 40.3% 52.7%
Highly capable
40 43 24 30 21 28 186
50.0% 61.4% 30.0% 37.5% 26.2% 41.8% 40.7%
Total 80 70 80 80 80 67 457
100.0% 100.0% 100.0% 100.0% 100.0% 100.0% 100.0%
Table 23 : Whether confident to take decisions regarding farm activities
State
Total Andhra
Pradesh Assam Jharkhand Madhya Pradesh Maharastra Uttar Pradesh
Confident to take decisions regading farm activities
Not confident
3 2 6 4 5 5 25
3.8% 2.9% 7.5% 5.0% 6.2% 7.5% 5.5%
Moderately confident
38 35 55 45 46 40 259
47.5% 50.0% 68.8% 56.2% 57.5% 59.7% 56.7%
Very much confident
39 33 19 31 29 22 173
48.8% 47.1% 23.8% 38.8% 36.2% 32.8% 37.9%
Total 80 70 80 80 80 67 457
100.0% 100.0% 100.0% 100.0% 100.0% 100.0% 100.0%

104
Table 24 : whether looking forward to innovative ideas in farming
State
Total Andhra
Pradesh Assam Jharkhand Madhya Pradesh Maharastra Uttarakhand
Look forward to innovative ideas in farming
Not thinking of this matter at all
7 2 5 7 5 7 33
8.8% 2.9% 6.2% 8.8% 6.2% 10.4% 7.2%
To a moderate extent
40 28 51 40 47 27 233
50.0% 40.0% 63.8% 50.0% 58.8% 40.3% 51.0%
To a significant extent
33 40 24 33 28 33 191
41.2% 57.1% 30.0% 41.2% 35.0% 49.3% 41.8%
Total 80 70 80 80 80 67 457
100.0% 100.0% 100.0% 100.0% 100.0% 100.0% 100.0%
Table 25 : whether being able to express and communicate freely and properly
State
Total Andhra
Pradesh Assam Jharkhand Madhya Pradesh Maharastra Uttarakhand
Able to express and communicate freely and properly
Low ability
3 4 5 5 6 3 26
3.8% 5.7% 6.2% 6.2% 7.5% 4.5% 5.7%
Moderate ability
34 31 52 41 56 30 244
42.5% 44.3% 65.0% 51.2% 70.0% 44.8% 53.4%
High ability
43 35 23 34 18 34 187
53.8% 50.0% 28.8% 42.5% 22.5% 50.7% 40.9%
Total 80 70 80 80 80 67 457
100.0% 100.0% 100.0% 100.0% 100.0% 100.0% 100.0%
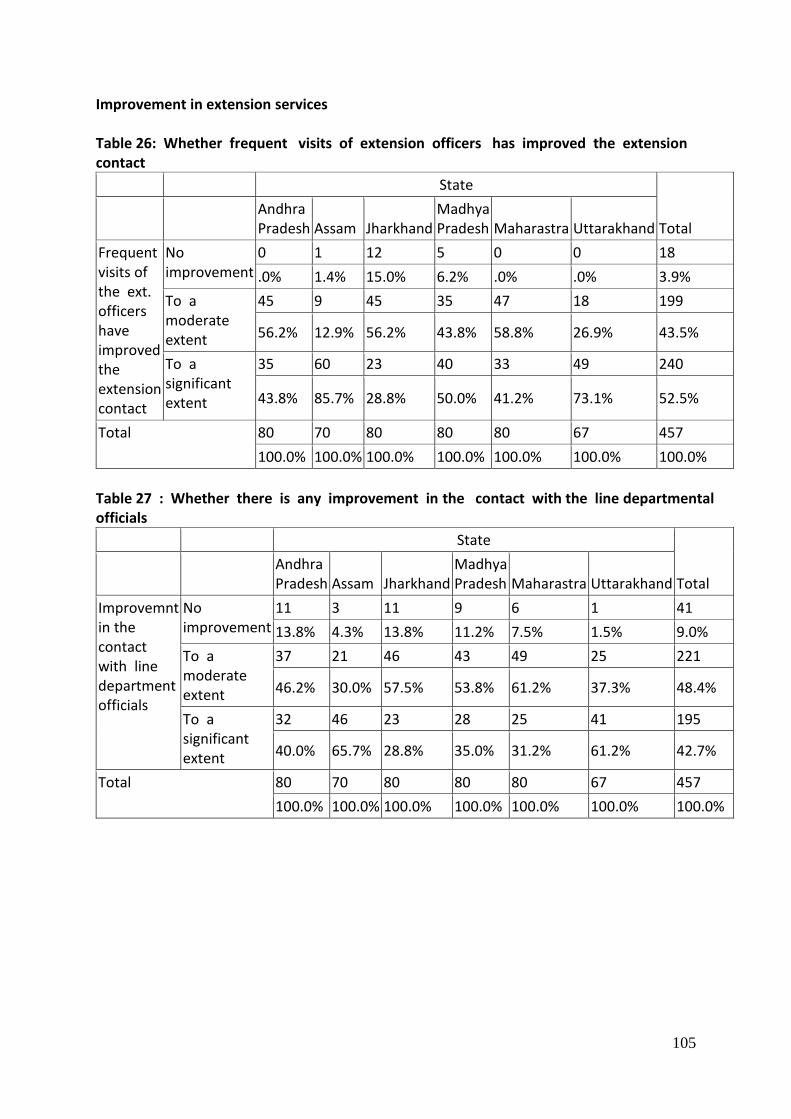
105
Improvement in extension services Table 26: Whether frequent visits of extension officers has improved the extension contact
State
Total Andhra
Pradesh Assam Jharkhand Madhya Pradesh Maharastra Uttarakhand
Frequent visits of the ext. officers have improved the extension contact
No improvement
0 1 12 5 0 0 18
.0% 1.4% 15.0% 6.2% .0% .0% 3.9%
To a moderate extent
45 9 45 35 47 18 199
56.2% 12.9% 56.2% 43.8% 58.8% 26.9% 43.5%
To a significant extent
35 60 23 40 33 49 240
43.8% 85.7% 28.8% 50.0% 41.2% 73.1% 52.5%
Total 80 70 80 80 80 67 457
100.0% 100.0% 100.0% 100.0% 100.0% 100.0% 100.0%
Table 27 : Whether there is any improvement in the contact with the line departmental officials
State
Total Andhra
Pradesh Assam Jharkhand Madhya Pradesh Maharastra Uttarakhand
Improvemnt in the contact with line department officials
No improvement
11 3 11 9 6 1 41
13.8% 4.3% 13.8% 11.2% 7.5% 1.5% 9.0%
To a moderate extent
37 21 46 43 49 25 221
46.2% 30.0% 57.5% 53.8% 61.2% 37.3% 48.4%
To a significant extent
32 46 23 28 25 41 195
40.0% 65.7% 28.8% 35.0% 31.2% 61.2% 42.7%
Total 80 70 80 80 80 67 457
100.0% 100.0% 100.0% 100.0% 100.0% 100.0% 100.0%
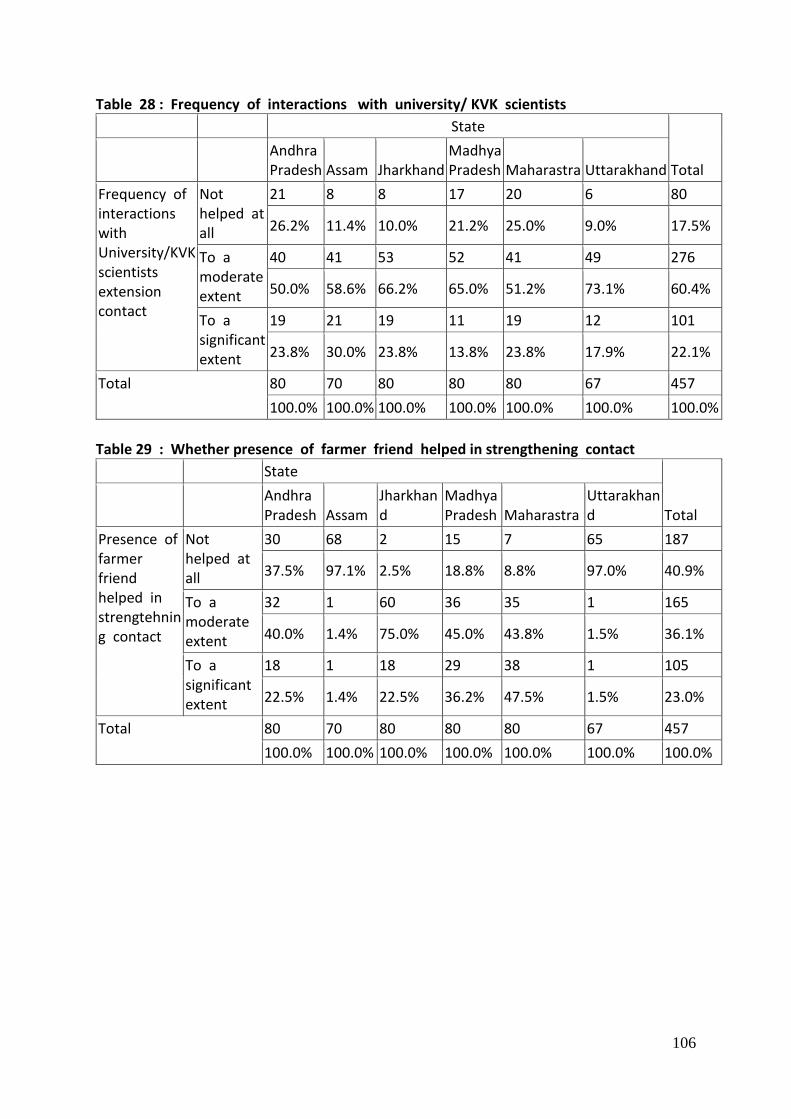
106
Table 28 : Frequency of interactions with university/ KVK scientists
State
Total Andhra
Pradesh Assam Jharkhand Madhya Pradesh Maharastra Uttarakhand
Frequency of interactions with University/KVK scientists extension contact
Not helped at all
21 8 8 17 20 6 80
26.2% 11.4% 10.0% 21.2% 25.0% 9.0% 17.5%
To a moderate extent
40 41 53 52 41 49 276
50.0% 58.6% 66.2% 65.0% 51.2% 73.1% 60.4%
To a significant extent
19 21 19 11 19 12 101
23.8% 30.0% 23.8% 13.8% 23.8% 17.9% 22.1%
Total 80 70 80 80 80 67 457
100.0% 100.0% 100.0% 100.0% 100.0% 100.0% 100.0%
Table 29 : Whether presence of farmer friend helped in strengthening contact
State
Total Andhra
Pradesh Assam Jharkhand
Madhya Pradesh Maharastra
Uttarakhand
Presence of farmer friend helped in strengtehning contact
Not helped at all
30 68 2 15 7 65 187
37.5% 97.1% 2.5% 18.8% 8.8% 97.0% 40.9%
To a moderate extent
32 1 60 36 35 1 165
40.0% 1.4% 75.0% 45.0% 43.8% 1.5% 36.1%
To a significant extent
18 1 18 29 38 1 105
22.5% 1.4% 22.5% 36.2% 47.5% 1.5% 23.0%
Total 80 70 80 80 80 67 457
100.0% 100.0% 100.0% 100.0% 100.0% 100.0% 100.0%

107
Table 30 : Whether farmers’ organizations helped in better access to extension services
State
Total Andhra
Pradesh Assam Jharkhand Madhya Pradesh Maharastra Uttarakhand
Farmers' Organizations helped in better access to extension services
Not helped at all
55 24 18 39 11 60 207
68.8% 34.3% 22.5% 48.8% 13.8% 89.6% 45.3%
To a moderate extent
20 33 50 33 58 6 200
25.0% 47.1% 62.5% 41.2% 72.5% 9.0% 43.8%
To a significant extent
5 13 12 8 11 1 50
6.2% 18.6% 15.0% 10.0% 13.8% 1.5% 10.9%
Total 80 70 80 80 80 67 457
100.0% 100.0% 100.0% 100.0% 100.0% 100.0% 100.0%
Table 31 : Whether opportunity is enhanced to participate in field days
State
Total Andhra
Pradesh Assam Jharkhand Madhya Pradesh Maharastra
Uttar Pradesh
Enhanced opportunity to participate in field days, KisanGhosties etc.
Opportunity not enhanced
20 9 6 7 18 12 72
25.0% 12.9% 7.5% 8.8% 22.5% 17.9% 15.8%
To a moderate extent
42 42 43 47 55 48 277
52.5% 60.0% 53.8% 58.8% 68.8% 71.6% 60.6%
To a significant extent
18 19 31 26 7 7 108
22.5% 27.1% 38.8% 32.5% 8.8% 10.4% 23.6%
Total 80 70 80 80 80 67 457
100.0% 100.0% 100.0% 100.0% 100.0% 100.0% 100.0%
Table 32 : Whether the farmer got awareness on quality agri inputs and sources of procurement
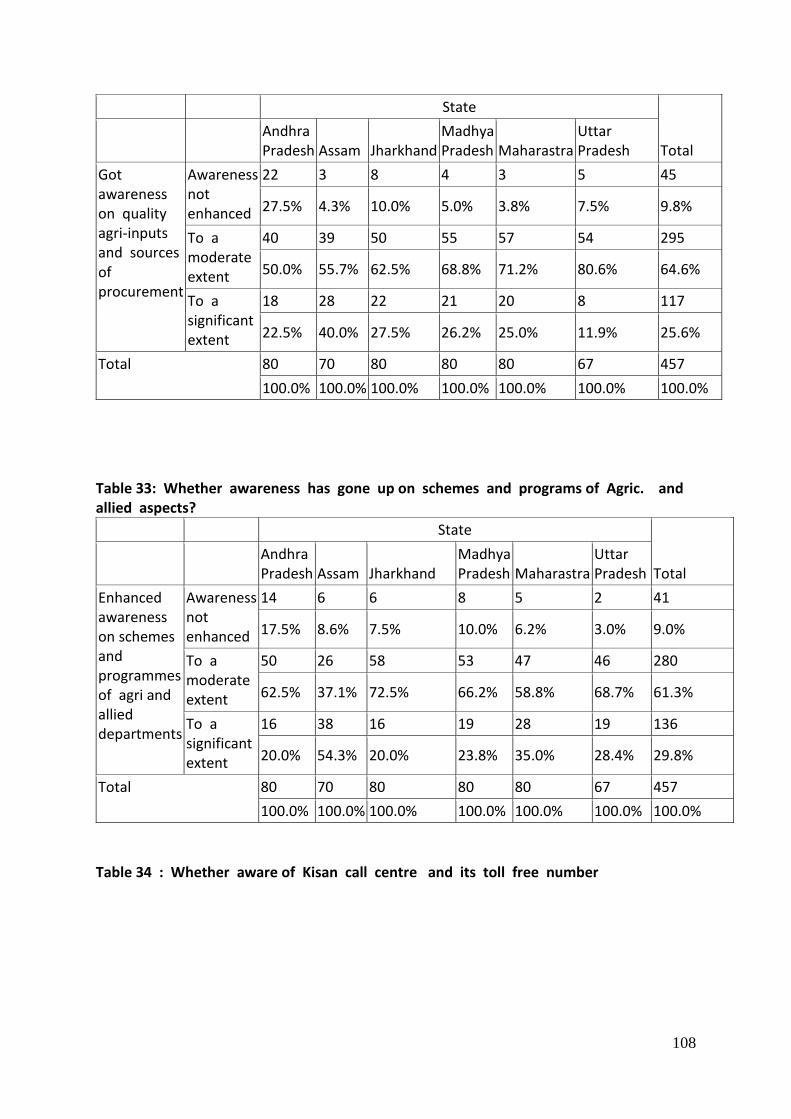
108
State
Total Andhra
Pradesh Assam Jharkhand Madhya Pradesh Maharastra
Uttar Pradesh
Got awareness on quality agri-inputs and sources of procurement
Awareness not enhanced
22 3 8 4 3 5 45
27.5% 4.3% 10.0% 5.0% 3.8% 7.5% 9.8%
To a moderate extent
40 39 50 55 57 54 295
50.0% 55.7% 62.5% 68.8% 71.2% 80.6% 64.6%
To a significant extent
18 28 22 21 20 8 117
22.5% 40.0% 27.5% 26.2% 25.0% 11.9% 25.6%
Total 80 70 80 80 80 67 457
100.0% 100.0% 100.0% 100.0% 100.0% 100.0% 100.0%
Table 33: Whether awareness has gone up on schemes and programs of Agric. and allied aspects?
State
Total Andhra
Pradesh Assam Jharkhand Madhya Pradesh Maharastra
Uttar Pradesh
Enhanced awareness on schemes and programmes of agri and allied departments
Awareness not enhanced
14 6 6 8 5 2 41
17.5% 8.6% 7.5% 10.0% 6.2% 3.0% 9.0%
To a moderate extent
50 26 58 53 47 46 280
62.5% 37.1% 72.5% 66.2% 58.8% 68.7% 61.3%
To a significant extent
16 38 16 19 28 19 136
20.0% 54.3% 20.0% 23.8% 35.0% 28.4% 29.8%
Total 80 70 80 80 80 67 457
100.0% 100.0% 100.0% 100.0% 100.0% 100.0% 100.0%
Table 34 : Whether aware of Kisan call centre and its toll free number

109
State
Total Andhra
Pradesh Assam Jharkhand Madhya Pradesh Maharastra
Uttar Pradesh
Aware of Kisan call centre and its toll free number
Not aware at all
29 17 65 59 16 34 220
36.2% 24.3% 81.2% 73.8% 20.0% 50.7% 48.1%
Not fully aware
37 44 11 14 45 23 174
46.2% 62.9% 13.8% 17.5% 56.2% 34.3% 38.1%
Yes 14 9 4 7 19 10 63
17.5% 12.9% 5.0% 8.8% 23.8% 14.9% 13.8%
Total 80 70 80 80 80 67 457
100.0% 100.0% 100.0% 100.0% 100.0% 100.0% 100.0%
Table 35 : Whether access to farm information through print and electronic media?
State
Total Andhra
Pradesh Assam Jharkhand Madhya Pradesh Maharastra Uttar Pradesh
Improved access to farm information through print and electronic media
Access not improved
30 10 53 44 14 9 160
37.5% 14.3% 66.2% 55.0% 17.5% 13.4% 35.0%
To a moderate extent
43 56 25 32 56 53 265
53.8% 80.0% 31.2% 40.0% 70.0% 79.1% 58.0%
To a significant extent
7 4 2 4 10 5 32
8.8% 5.7% 2.5% 5.0% 12.5% 7.5% 7.0%
Total 80 70 80 80 80 67 457
100.0% 100.0% 100.0% 100.0% 100.0% 100.0% 100.0%

110
Impact of ATMA Table 1 : Average scores on impact dimensions according to literacy level
Educational level
Score on social
participation
Score on technologica
l and skill upgradation
Score on Economic
impact
Score on psychologica
l an managerial
impact
Score on improvement in extension
services
illiterate Mean 13.523 13.178 12.533 15.449 19.084
N 107 107 107 107 107
Able to read and write
Mean 14.300 12.700 12.400 15.950 19.100
N 20 20 20 20 20
Primary Mean 13.856 13.805 12.644 16.212 19.669
N 118 118 118 118 118
High school Mean 14.863 14.568 13.266 16.928 21.151
N 139 139 139 139 139
Intermediate Mean 14.140 14.070 12.884 16.767 20.488
N 43 43 43 43 43
Graduate Mean 15.333 16.000 14.000 20.333 23.000
N 3 3 3 3 3
Post graduate Mean 14.111 14.185 13.593 17.333 21.519
N 27 27 27 27 27
Total Mean 14.155 13.904 12.884 16.385 20.166
N 457 457 457 457 457
Table 2: Average scores on impact dimensions according to subject in which training was received within the district
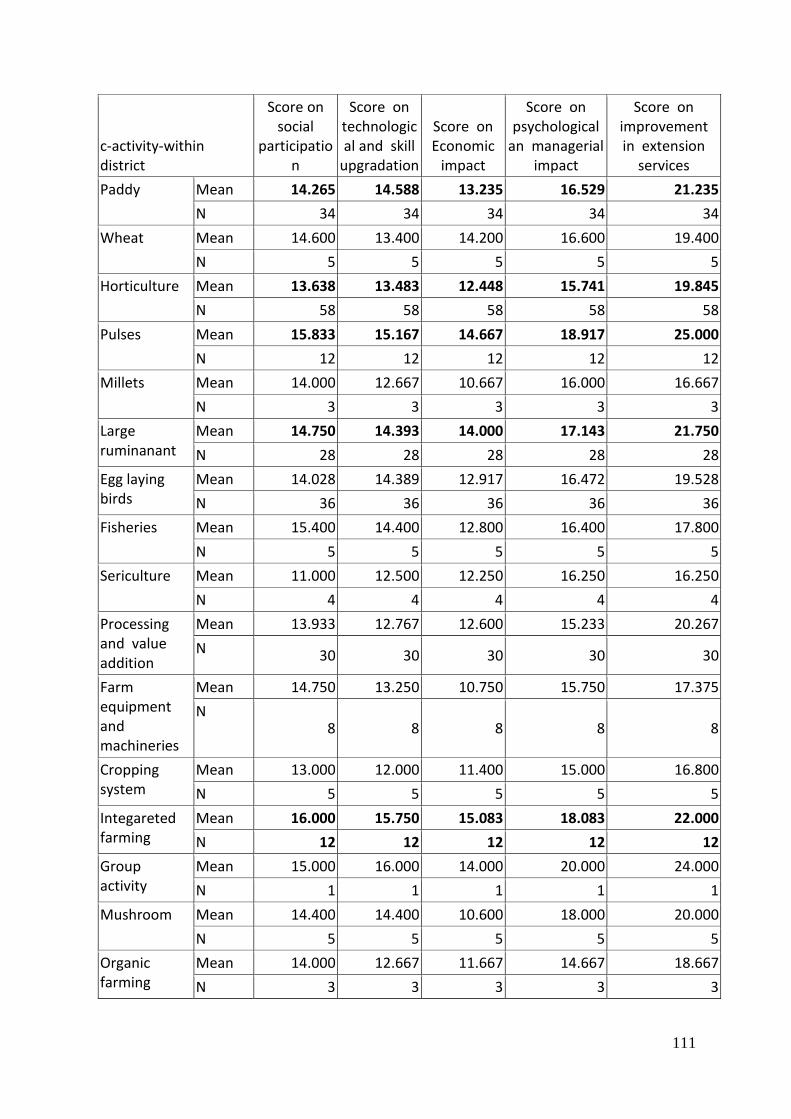
111
c-activity-within district
Score on social
participation
Score on technological and skill
upgradation
Score on Economic
impact
Score on psychological
an managerial impact
Score on improvement in extension
services
Paddy Mean 14.265 14.588 13.235 16.529 21.235
N 34 34 34 34 34
Wheat Mean 14.600 13.400 14.200 16.600 19.400
N 5 5 5 5 5
Horticulture Mean 13.638 13.483 12.448 15.741 19.845
N 58 58 58 58 58
Pulses Mean 15.833 15.167 14.667 18.917 25.000
N 12 12 12 12 12
Millets Mean 14.000 12.667 10.667 16.000 16.667
N 3 3 3 3 3
Large ruminanant
Mean 14.750 14.393 14.000 17.143 21.750
N 28 28 28 28 28
Egg laying birds
Mean 14.028 14.389 12.917 16.472 19.528
N 36 36 36 36 36
Fisheries Mean 15.400 14.400 12.800 16.400 17.800
N 5 5 5 5 5
Sericulture Mean 11.000 12.500 12.250 16.250 16.250
N 4 4 4 4 4
Processing and value addition
Mean 13.933 12.767 12.600 15.233 20.267
N 30 30 30 30 30
Farm equipment and machineries
Mean 14.750 13.250 10.750 15.750 17.375
N 8 8 8 8 8
Cropping system
Mean 13.000 12.000 11.400 15.000 16.800
N 5 5 5 5 5
Integareted farming
Mean 16.000 15.750 15.083 18.083 22.000
N 12 12 12 12 12
Group activity
Mean 15.000 16.000 14.000 20.000 24.000
N 1 1 1 1 1
Mushroom Mean 14.400 14.400 10.600 18.000 20.000
N 5 5 5 5 5
Organic farming
Mean 14.000 12.667 11.667 14.667 18.667
N 3 3 3 3 3
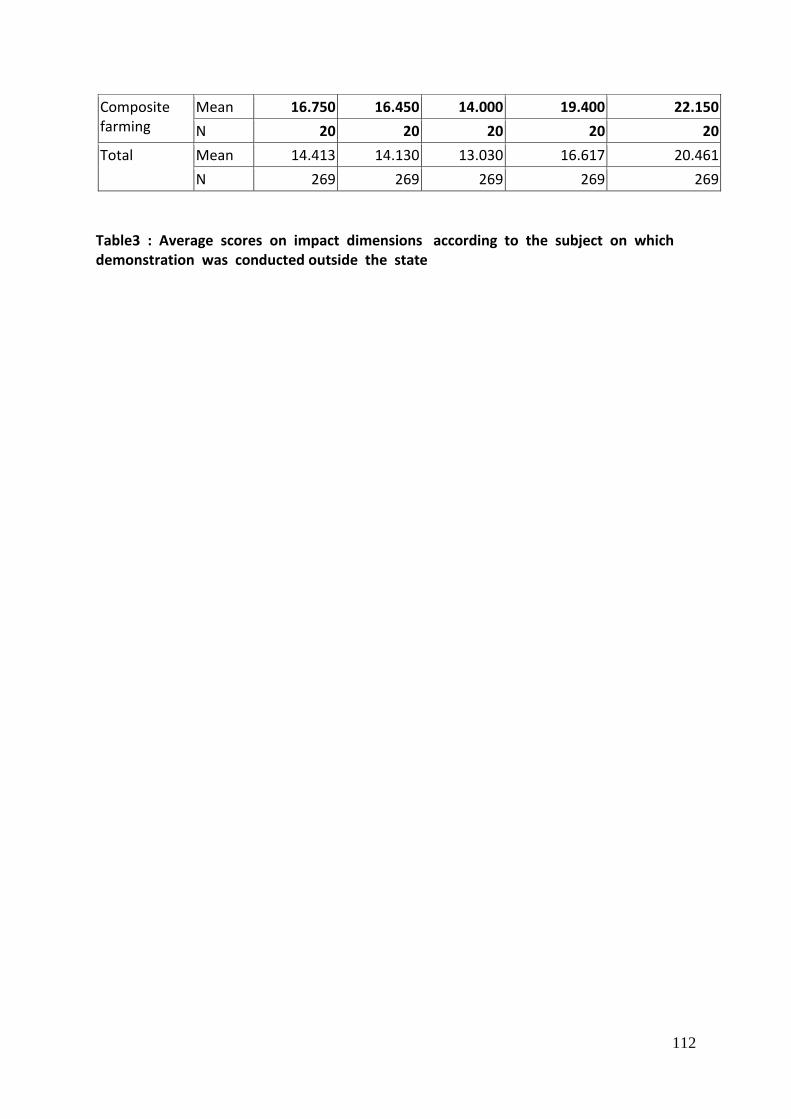
112
Composite farming
Mean 16.750 16.450 14.000 19.400 22.150
N 20 20 20 20 20
Total Mean 14.413 14.130 13.030 16.617 20.461
N 269 269 269 269 269
Table3 : Average scores on impact dimensions according to the subject on which demonstration was conducted outside the state

113
Demonstration_activity_outside the state
Score on social
participation
Score on technological and skill
upgradation
Score on Economic
impact
Score on psychological
an managerial impact
Score on improvement in extension
services
Paddy Mean 14.095 13.667 12.643 15.929 19.952
N 42 42 42 42 42
Wheat Mean 14.300 13.700 14.000 15.300 19.000
N 10 10 10 10 10
Horticulture Mean 13.826 13.609 13.217 16.304 20.130
N 23 23 23 23 23
Pulses Mean 13.063 13.938 13.687 16.438 19.437
N 16 16 16 16 16
Millets Mean 14.100 13.500 12.200 16.500 19.100
N 10 10 10 10 10
Oilseeds Mean 13.000 15.000 14.000 20.000 22.000
N 1 1 1 1 1
Large ruminants
Mean 15.125 14.188 14.125 17.125 21.000
N 16 16 16 16 16
Egg laying birds
Mean 15.833 15.375 13.958 18.125 21.208
N 24 24 24 24 24
Fisheries Mean 14.000 12.750 13.250 14.875 16.000
N 8 8 8 8 8
Sericulture Mean 14.000 15.000 14.000 21.000 20.000
N 1 1 1 1 1
Processing and value addition
Mean 17.000 15.500 11.500 18.500 20.000
N 2 2 2 2 2
Farm equipment and machineries
Mean 15.500 15.000 12.500 17.000 24.000
N 2 2 2 2 2
Cropping system
Mean 13.125 13.875 12.000 15.750 19.750
N 8 8 8 8 8
Integareted farming
Mean 15.000 12.000 11.500 16.500 17.500
N 2 2 2 2 2
Organic farming
Mean 17.000 16.000 16.000 19.000 22.000
N 1 1 1 1 1
Total Mean 14.343 13.988 13.217 16.524 19.946
N 166 166 166 166 166

114
Table 4 : Average scores on impact dimensions according to the subject covered in the exposure visit within the district
Exposure visit- activity-within the district
Score on social participation
Score on technological
and skill upgradation
Score on Economic
impact
Score on psychological
an managerial impact
Score on improvement in extension
services
Paddy Mean 12.889 12.667 12.333 16.556 18.667
N 9 9 9 9 9
Wheat Mean 16.000 18.000 17.000 20.000 24.000
N 1 1 1 1 1
Horticulture Mean 13.733 13.100 13.133 16.000 20.167
N 30 30 30 30 30
Millets Mean 12.000 13.000 12.000 14.000 17.000
N 1 1 1 1 1
Large ruminants
Mean 15.462 14.231 13.769 17.000 21.692
N 13 13 13 13 13
Egg laying birds
Mean 13.200 12.800 12.200 16.400 20.400
N 5 5 5 5 5
Fisheries Mean 15.000 15.000 11.000 20.000 23.000
N 1 1 1 1 1
Sericulture Mean 13.000 15.000 17.000 15.000 21.000
N 1 1 1 1 1
Processing and value addition
Mean 16.143 15.000 12.810 17.905 21.000
N 21 21 21 21 21
Farm equipment and machineries
Mean 18.000 13.000 8.000 13.000 13.000
N 1 1 1 1 1
Cropping system
Mean 15.909 16.545 15.364 19.091 21.364
N 11 11 11 11 11
Mushroom Mean 18.000 18.000 16.000 20.000 26.000
N 1 1 1 1 1
Total Mean 14.747 14.158 13.305 17.053 20.600
N 95 95 95 95 95

115
Table 5 : Average scores on impact dimensions according to how frequently the women farmers attended the farm school
Whether attended all the classes of farm school?
Score on social
participation
Score on technologica
l and skill upgradation
Score on Economic
impact
Score on psychological an
managerial impact
Score on improvement in extension
services
Rarely Mean 10.000 11.000 11.000 7.000 10.000
N 1 1 1 1 1
Occasionally Mean 14.786 13.643 12.857 17.071 20.071
N 14 14 14 14 14
Regularly Mean 15.087 15.217 13.978 17.935 21.880
N 92 92 92 92 92
Total Mean 15.000 14.972 13.804 17.720 21.533
N 107 107 107 107 107
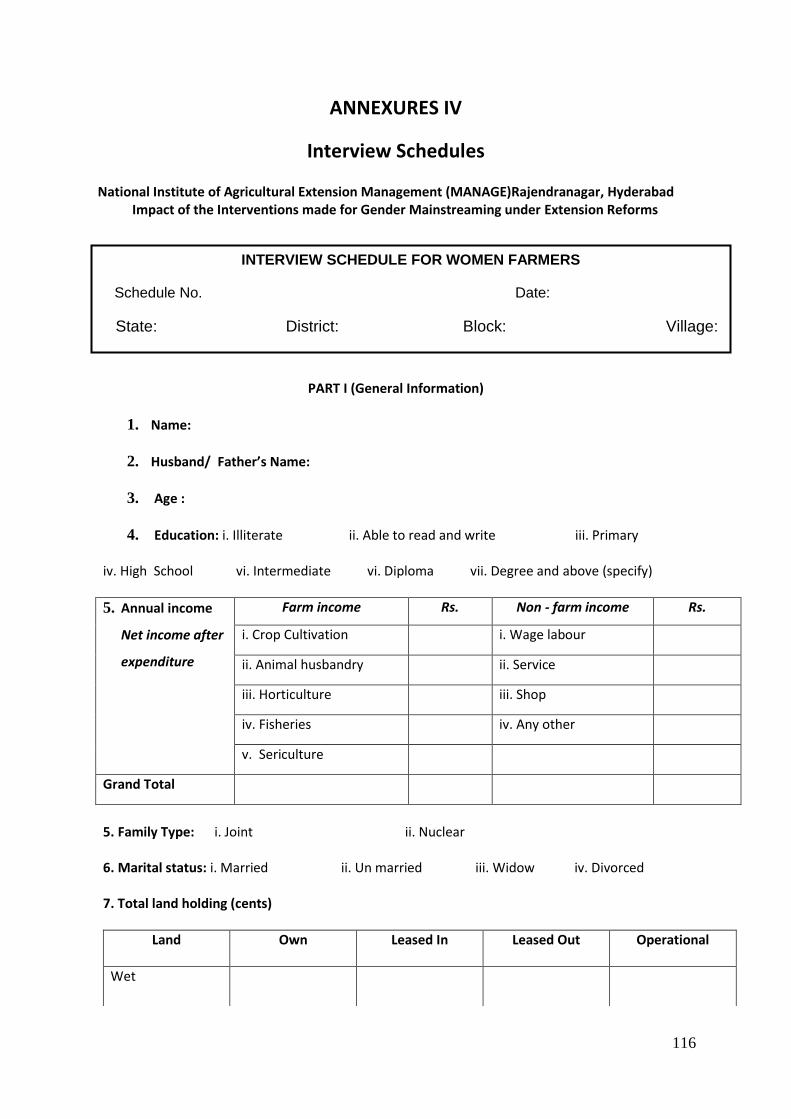
116
ANNEXURES IV
Interview Schedules National Institute of Agricultural Extension Management (MANAGE)Rajendranagar, Hyderabad
Impact of the Interventions made for Gender Mainstreaming under Extension Reforms
PART I (General Information)
1. Name:
2. Husband/ Father’s Name:
3. Age :
4. Education: i. Illiterate ii. Able to read and write iii. Primary
iv. High School vi. Intermediate vi. Diploma vii. Degree and above (specify)
5. Annual income
Net income after
expenditure
Farm income Rs. Non - farm income Rs.
i. Crop Cultivation i. Wage labour
ii. Animal husbandry ii. Service
iii. Horticulture iii. Shop
iv. Fisheries iv. Any other
v. Sericulture
Grand Total
5. Family Type: i. Joint ii. Nuclear
6. Marital status: i. Married ii. Un married iii. Widow iv. Divorced
7. Total land holding (cents)
Land Own Leased In Leased Out Operational
Wet
INTERVIEW SCHEDULE FOR WOMEN FARMERS
Schedule No. Date:
State: District: Block: Village:

117
Dry
8. Is there any land registered on your name? Yes / No
If yes, how many cents of land is registered on your name: _______Cents
9. Experience in farming: _______years
10. Do you have a separate bank account? Yes / No
If yes, when did you open it and why?
PART II
1. Are you aware of the ATMA? Yes No
If Yes, How did you come to know
Through:
i. BTM
ii. SMS
iii. Extension functionaries (Specify) ____________
iv. Farmer friend
v. Fellow farmer/ group members
vi. Other sources ( Radio, T.V, Newspaper etc) Specify: ___________
2. Are you aware of ATMA activities: Yes No
3. Did you participate in any activities of ATMA? Yes No
If yes, can you give the details
Activities Subject organization Duration,
& Place
Specific
learning
Adoption of the
learning
Yes /
No
If yes details, If no reasons
A. Farm Oriented Activities i. Training of women farmers a. Outside the state
b. Within State

118
c. Within district level
ii. Demonstration
iii. Exposure visits of farmers
a. Outside the State
b. Within the State
c. Within the District
iv. Are you a member in any of the groups listed below: (Specify)
i. Farmer Interest Group ( FIG)
ii. Self Help Group (SHG)
iii. MahilaMandal
iv. Dairy cooperative
v. Any other (pl. specify)_________________
If yes, a. Have you attended any
capacity building program
related to your group
activities? Yes/ No
If yes, please give details
b. What are the activities of your group? Specify i.__________________
ii. _________________
iii.____________________

119
c. Whether your SHG/ FIG has received seed money/ revolving fund? Yes / No If yes, how the revolving fund was utilized.
i. Utilized for procuring the critical inputs collectively and distributed among the members
ii. Purchased farm implements and for the usage of group members
iii. Utilized for processing, value addition and marketing activities as a group
iv. Utilized for leasing-in land for cultivation of crops by the group
v. Distributed among the members for individual activities
vi. All the revolving fund was given to one member for interest
vii. Any other (pl. specify) d. Whether your group has received any rewards and incentives:
Yes / No If yes, please give details
Name of
the reward
Year Amount Reason for the reward
e. Did you receive any Farmer award
Yes / No If yes, please give details
Name of the award
Year Amount Reason for the award
B. Farm Information Dissemination i. Have you attended any of the following
events?
Events No. of times attended
1. District level exhibition
2. KisanMelas
3. Fruits and Vegetables shows
4. Any other (Pl. specify)
ii. Did you receive any information from ATMA in
the following form?
Information source
1. Leaf lets / Brochures/
Pamphlets
Yes/ No
2. Newsletters Yes/ No
3. Local Advertisements Yes/ No
4. Any other (Pl. specify)
iii. Do you have any access to technology
through the following
Information source Yes / No
1. KISOK (local names specify) Yes/ No
2. KCC Yes/ No
3. Mobile SMS Yes/ No

120
4. CDs Yes/ No
C. Research- Extension- Farmer linkages
i. Did you interact with the scientists of SAUs /
research stations/ KVKs during
i. Exposure visits Yes/ No
ii. Training programme Yes/ No
iii. Field days / KisanGhostis Yes/ No
iv. Farm Schools Yes/ No
v. Demonstration fields Yes/ No
vi. Any other (Pl. specify)
ii. Are you aware of the name and mobile number of the designated expert from KVK/SAUs? Yes / No D. Innovative Activity
1. Farm School
i. Did you participate in any farm school
organized by ATMA?
Yes / No
If Yes Please indicate the sector
Sectors Tick ( ) Remarks
Agriculture
Horticulture
Fisheries
Animal
Husbandry
Sericulture
Any other
ii. Have you attended all the classes in the farm school? (Regular / Occasionally / Rarely )
iii. How do you find the utility of the farm school?
a. Very useful b. Moderately useful c. Not useful
2. Are you aware of the farmer friend in your village? Yes / No
i. If yes, how frequently you interact with the farmer friend?
a. once a week b. once in a fortnight c. once a month d. once in two month or more
v. Mention the services provided by the farmer friend
a. Technical information
b. Information on programs and schemes
c. Drawing soil samples and delivering the soil test results
d. Helps in mobilizing the farmers / group
e. Takes feedback
vi. Whether the information received from the farmer friend was satisfactory? Yes / No

121
4. Did the functionaries consult you before organizing any training, demonstration, exposure visits in your
area? Yes / No
If yes, how? 4. Are you aware of the cost of demonstrations Yes / No
5. Whether you have received inputs for the demonstration from ATMA? Yes / No
If yes, in what form
i. Direct cash payment or cash deposited in your bank account
ii. Inputs purchased by ATMA and handed over to you
7. Did you find these activities need based i. Fully ii. Partially iii. Not at all 8. How often the following officials interact with you
Categories PD Dy. PD BTM SMS Any other Very Frequently
Occasionally
On request
Never
INDEX
9. Impact of ATMA activities on women farmers: Scale
1. Impact on social participation
i. Have equal opportunities on par with fellow
farmers
Strongly Agree Agree Disagree
ii. Participates freely in the festivals and rituals
events of the village
More Freely Freely With Some Inhibitions
iii. Interact frequently with people in the community More Frequently
Frequently Very Occasionally
iv. Active member of the group of the community Very Active
Member Active
Member Not an Active
Member
v. Earn the respect of people in the village Very Certainly Certainly Did not Happen
vi. Recognized in the locality by the people Very Much Recognized
Recognized Not Recognized

122
2. Impact on technological and skill up gradation
i. Accessibility to new technologies related to agriculture and allied activities
More Accessible
Accessible Not Accessible
ii. Acquired knowledge and understanding of tools and equipment used in agriculture and allied sector
Very Significant Moderate No Knowledge Acquired
iii. Learnt new skills to perform activities in agriculture and allied sectors.
Very Significant Moderate No New Skills Acquired
iv. Adopted new technologies Adopted Very
Significant Adopted
Moderately No New
Technologies Adopted
v. Use of new technologies reduced the physical
and mental drudgery Reduction to a
Significant Extent
Reduction to a Moderate
Extent
No Reduction
vi. Confident about the technologies which I can disseminate to other farmers
Very Much Confident
Confident Not Confident
3. Economic impact
i. Adoption of improved technologies have reduced the cost of cultivation
Reduction to a Significant
Extent
Reduction to a Moderate
Extent
No Reduction
ii. Adoption of improved technologies have
increased yield
To a Significant Extent
To a Moderate
Extent
No Improvement
iii. Adoption of improved technologies have improved the quality of produce
To a Significant Extent
To a Moderate
Extent
No Improvement
iv. Value addition to the produces has helped in
fetching better prices
To a Significant Extent
To a Moderate
Extent
No Improvement
v. ATMA facilitated better linkages with the market Facilitated Very Well
Facilitated Moderately
Not Facilitated
vi. Better farm advisory services helped to increase
farm income
Helped Very Significantly
Helped Moderately
Not Helped
4. Impact on psychological and Managerial aspects
i. Feel motivated to actively participate in farm related activities
Highly Motivated
Moderately Motivated
Not Motivated
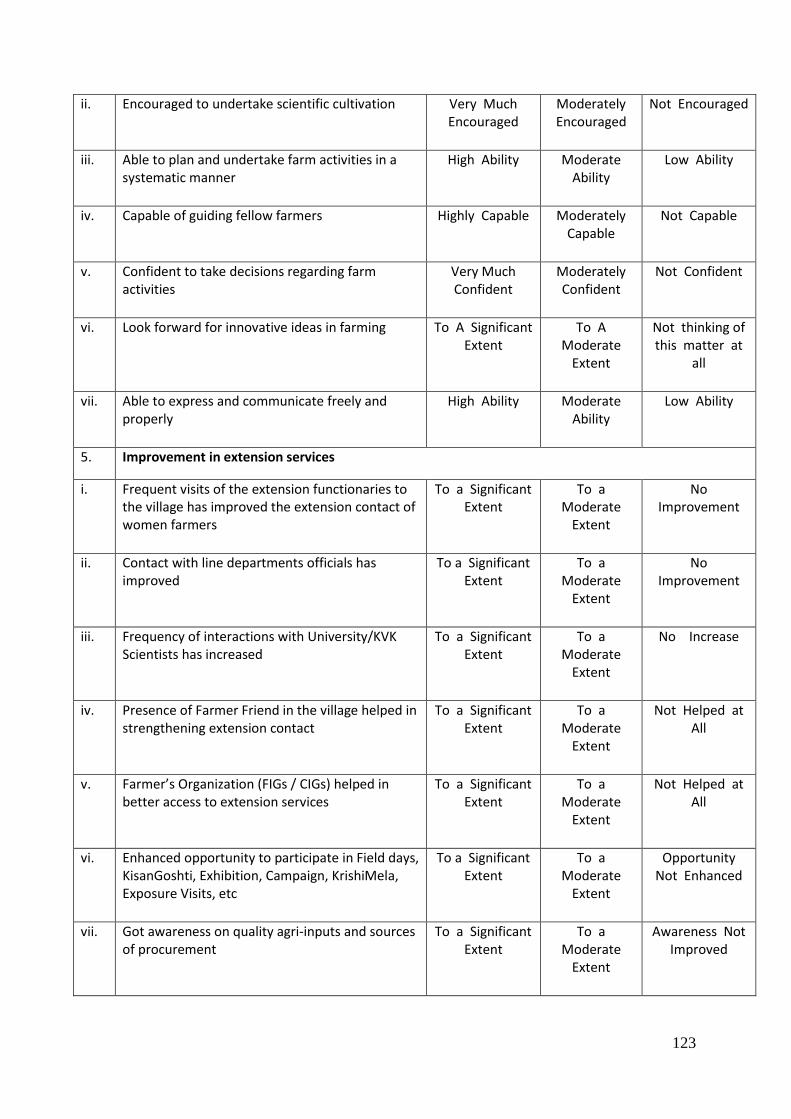
123
ii. Encouraged to undertake scientific cultivation Very Much Encouraged
Moderately Encouraged
Not Encouraged
iii. Able to plan and undertake farm activities in a systematic manner
High Ability Moderate Ability
Low Ability
iv. Capable of guiding fellow farmers Highly Capable Moderately Capable
Not Capable
v. Confident to take decisions regarding farm activities
Very Much Confident
Moderately Confident
Not Confident
vi. Look forward for innovative ideas in farming To A Significant Extent
To A Moderate
Extent
Not thinking of this matter at
all
vii. Able to express and communicate freely and properly
High Ability Moderate Ability
Low Ability
5. Improvement in extension services
i. Frequent visits of the extension functionaries to the village has improved the extension contact of women farmers
To a Significant Extent
To a Moderate
Extent
No Improvement
ii. Contact with line departments officials has improved
To a Significant Extent
To a Moderate
Extent
No Improvement
iii. Frequency of interactions with University/KVK Scientists has increased
To a Significant Extent
To a Moderate
Extent
No Increase
iv. Presence of Farmer Friend in the village helped in strengthening extension contact
To a Significant Extent
To a Moderate
Extent
Not Helped at All
v. Farmer’s Organization (FIGs / CIGs) helped in better access to extension services
To a Significant Extent
To a Moderate
Extent
Not Helped at All
vi. Enhanced opportunity to participate in Field days, KisanGoshti, Exhibition, Campaign, KrishiMela, Exposure Visits, etc
To a Significant Extent
To a Moderate
Extent
Opportunity Not Enhanced
vii. Got awareness on quality agri-inputs and sources of procurement
To a Significant Extent
To a Moderate
Extent
Awareness Not Improved
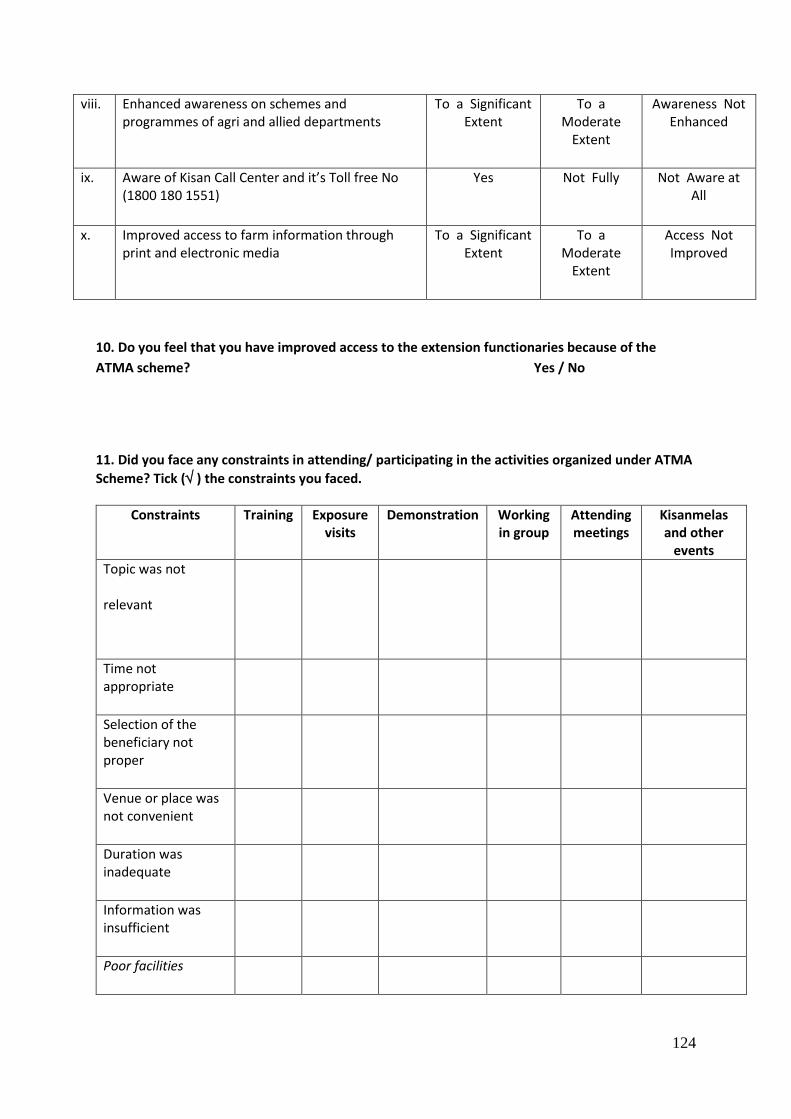
124
viii. Enhanced awareness on schemes and programmes of agri and allied departments
To a Significant Extent
To a Moderate
Extent
Awareness Not Enhanced
ix. Aware of Kisan Call Center and it’s Toll free No (1800 180 1551)
Yes Not Fully
Not Aware at All
x. Improved access to farm information through print and electronic media
To a Significant Extent
To a Moderate
Extent
Access Not Improved
10. Do you feel that you have improved access to the extension functionaries because of the
ATMA scheme? Yes / No
11. Did you face any constraints in attending/ participating in the activities organized under ATMA
Scheme? Tick ( ) the constraints you faced.
Constraints Training
Exposure visits
Demonstration
Working in group
Attending meetings
Kisanmelas and other
events Topic was not
relevant
Time not appropriate
Selection of the beneficiary not proper
Venue or place was not convenient
Duration was inadequate
Information was insufficient
Poor facilities

125
Inadequate transport facilities
Poor communication from the officials about the programs
Less support and cooperation from the extension functionaries
Inputs were not provided on time
Other constraints:
Overloaded with domestic work
Not having ownership of the land
Restriction from the family members
Male dominance
Any other (specify)______________
12. Do you have any suggestions for improving access to extension services to the women farmers? If yes, How? 1. 2. 3.

126
National Institute of Agricultural Extension Management (MANAGE)
Rajendranagar, Hyderabad
Impact of the Interventions made for Gender Mainstreaming under Extension Reforms
Name: ___________________________ Age: ________
Education: ________ Landholding:
Are you a member of any FIG/CIG/SHG: Which sector do you represent? a. Agriculture b. Horticulture c. Livestock d. Sericulture e. Fisheries f. Any other _________
1. Are you a member in ______________ a. Governing Board (GB) b. DFAC c. BFAC
2. Since how long you are the member of the committee a. Less than one year b. 1-2 years c. more than 2 years 3. Your nomination to the GB/ DFAC / BFAC isdone based on
a. Nomination by the CIG b. Nomination by the BFAC/DFAC c. Selection by majority d. Selection on consensus e. Selection by the BTT f. Selection by the MahilaMandal g. Selection by the Yuvakmandal h. Selection by the Block Development council i. Any other pl. specify __________ j. Not aware
4. Have you received orientation on the roles of GB/ DFAC / BFAC members in ATMA? Yes/ No
5. What is your role in GB/ DFAC / BFAC?
S. No Roles Yes / No
a. Collecting information on the needs and problems of the women farmer and giving feedback
b. Providing inputs for prioritizing the farmers needs
INTERVIEW SCHEDULE FOR WOMEN FARMERS REPRESENTATIVES
Schedule No. Date:
State: District: Block: Village:

127
c. Helps in preparation of the Block Action Plan/District Action Plans
d. Helps in formation and nurturing of Farmers Interest Groups / Commodity Interest Groups
e. Any other
6. How often the GB/ DFAC / BFAC meeting takes place? S. No Intervals GB DFAC BFAC
a. Once in month
b. Quarterly
c. Half-yearly
d. Yearly
7. Do you attend the meetings regularly? Yes / No
If no, anyone on your behalf from your family attends the meetings? (Specify)
8. When did you attend the last meeting of GB/ DFAC/ BFAC and what were the issues discussed?
9. What is your perception about the conduct of this committee meetings?
Yes/No a. Meetings are conducted regularly
b. Deliberations are made seriously c. Meetings are conducted at appropriate time / seasons d. Committee members attend the meeting regularly e. Committee members participates actively and gives suggestions f. BTT members encourage farmers to give feedback g. Meeting is only a ritual h. BTT doesn’t bother about farmers feedback in finalizing the BAPs
10. Do you have any constraints in attending the GB/ DFAC/ BFAC meetings? S. No Constraints Yes/ No
a. Delay in communication from the department officials b. Long distance of the meeting venue from the village c. No provision for travel allowances d. Meeting coincide with the peak agriculture periods e. My feedback and opinions were not given due weightage by the committee
members
f. Waste of time
g. Overburdened with family responsibilities
h. Spouse/family members do not allow to attend the meetings
i. Any others

128
11. Do you share the information / decisions of the meeting with the women farmer when you go back to your village? Yes/ No
If yes what is the platform for sharing the information?
a. Sharing information informally whenever we meet each other
b. Discussion in the CIG’s/SHG’s weekly/monthly meetings
c. Organizing special meetings for sharing the information
d. Any other (pl specify) ___________________________________
12. Please mention the merits in participation of women representatives in the GB/ DFAC/ BFAC for the women farmers
a. _______________________________________
b. _______________________________________
c. _______________________________________
d. _______________________________________
13. Do you think the BAPs/DAP are addressing the women farmer concerns / issues?Yes/ No What are your suggestions for helping the women farmers to have more access to extension activities / government schemes.
a. _______________________________________
b. _______________________________________
c. _______________________________________
d. _______________________________________
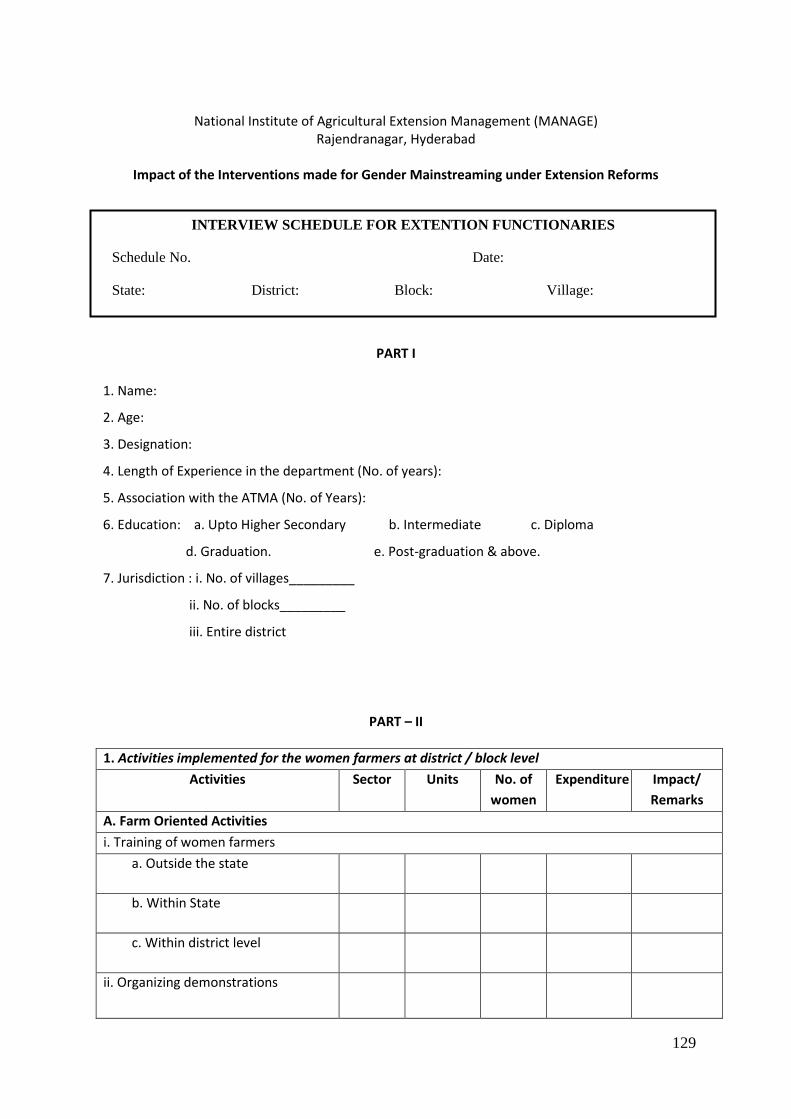
129
National Institute of Agricultural Extension Management (MANAGE)
Rajendranagar, Hyderabad
Impact of the Interventions made for Gender Mainstreaming under Extension Reforms
PART I
1. Name:
2. Age:
3. Designation:
4. Length of Experience in the department (No. of years):
5. Association with the ATMA (No. of Years):
6. Education: a. Upto Higher Secondary b. Intermediate c. Diploma
d. Graduation. e. Post-graduation & above.
7. Jurisdiction : i. No. of villages_________
ii. No. of blocks_________
iii. Entire district
PART – II
1. Activities implemented for the women farmers at district / block level
Activities Sector Units No. of
women
Expenditure Impact/
Remarks
A. Farm Oriented Activities
i. Training of women farmers
a. Outside the state
b. Within State
c. Within district level
ii. Organizing demonstrations
INTERVIEW SCHEDULE FOR EXTENTION FUNCTIONARIES
Schedule No. Date:
State: District: Block: Village:

130
a. Demonstration in Agri.
b. Demonstration in Allied sectors
c. Farm School (Demo plot) -
d. Visits of women farmers to farm
school / Demo plot - -
iii. Exposure visits of women farmers
a. Outside the State
b. Within the State
c. Within Districts
v. Mobilization of women farmers groups/ FIGs etc
a. Capacity building, skill
development and support
services
b. Seed money/ revolving fund
vi. Rewards and incentives- best
organized women group -
vii. Women farmer awards -
B. Farm Information Dissemination
i. District level exhibitions, kisanmelas,
fruits and vegetable shows
ii. Information dissemination through
printed material and local
advertisements
C. Research- Extension- Farmer Linkages
i. Farmer scientist interaction
ii. Organization of field days and kisan
goshtis
2. How many women farmer’s representatives are there in
No. Procedure followed for selection
i. District Farm Advisory Committees
(DFAC)

131
ii. Governing Body of ATMA (GB)
iii. ATMA Management Committee (AMC)
iv. Block Farm Advisory Committees
(BFAC)
3. How many women farmer friends are there in your block or district?
District:______________ Block:_________________________
4. How many women officials got benefited under the scheme?
Activity No.
i. Training
ii. Exposure visits
iii. Enrolled in PGDAEM
PART III
1. Rank the following information sources for identifying the needs of women farmer
S. No Source of information Rank i. Based on gaps identified in SREP
ii. Interaction with women representatives in BFAC’s
iii. Interaction with the scientists
iv. Based on your past experiences
v. Interaction with women farmer/group
vi. Interaction with the PRI’s
vii. Any other (specify)
2. Indicate your priorities to allocate 30.0 percent of the funds earmarked for women farmers in
your jurisdiction.
S. No Areas for allocation of fund Rank Reason for choosing
i. To support small and marginal farm women
ii. To support women headed household
iii. To motivate active women groups

132
iv. To impart knowledge to the women farmers
v. To bring changes in attitude and skill
vi. Social mobilization and women group formation
vii. To introduce income generating activities
viii. Linking women farmers to markets
ix. Any other (specify)
3. What are the qualities/ criteria’s for the selection of women representatives in BFAC or GB?
S. No Qualities Rank
i. Member of a FIG / SHGs
ii. Practicing farmer
iii. Credibility among other women farmers in the village
iv Able to spare time for social service
v. Should have good communication skills
vi. Should have good leadership skills
vii. Knowledgeable about departments and schemes
viii Any other (specify)
4. What is the role played by these women farmer representatives in the committees
S. No. Committees
Role played by women farmer representatives
i. District Farm Advisory Committees
(DFAC)
ii. Governing Body of ATMA (GB)
iii. ATMA Management Committee
(AMC)
iv Block Farm Advisory Committees (BFAC)
Such as: selection of the villages for under taking activities, selection of beneficiaries , helps
decision making in meetings, helps in problem solving, helps in formation of FIGs, helps in
communicating important messages.
5. Are the women representatives attending meeting regularly? Yes / No

133
If yes, how do you rate the participation of the women representatives in the meetings
a. Poor b. Average c. Good
If no, what are the reasons for non/ poor participation of women representatives?
i. Restrictions from family members
ii. Husband attend the meeting on behalf of the women representatives
iii. Less cooperation from the other BFAC members
iv. Overburdened with domestic responsibilities
v. Lack of mobility / transport available to the women representatives
vi. Lack of confidence
vii. Unable to communicate
viii. Lack of interest in attending the meetings
ix. Any other (specify) 6. What are steps taken to motivate the women farmer representatives to participate?
PART - IV
1. Perceived impact of ATMA intervention on women farmers
No change
Partial Fully
i. Participation of women farmers in extension activities
ii. Awareness of new technologies
iii. Crop Diversification
iv. Adoption of the new technologies
v. Technology dissemination among the women (women farmer to women farmer)
vi. Income levels
vii. Economic independency
viii. Leadership development
ix. Social participation
x. Self confidence
xi. Decision making ability

134
xii. Getting the cooperation of male members of the family
particularly in farm activities
2. What are the major constraints faced in implementing the activities for women farmers. Please give
ranking.
Constraints Rank
i. Low confidence level of women farmers
ii. Poor cooperation of women farmers
iii. Women farmers not having lands on their name
iv. Poor family support to women farmers
v. Cultural barriers existing in the village
vi. Unable to organize the programs as per the convenience of the women
farmers
vii. Unable to manage venues for the activities
viii. Women don’t want to travel outside the village (exposure and training within the district and outside the district)
ix. Lack of gender sensitivity among the extension functionaries
x. Less number of women extension functionaries
xi. Lack of sufficient funds
xii. Any other (specify)
3. Suggestion for strengthening gender mainstreaming under extension reforms