a study on the financial performance of siesta logistics ...sjput.in/pdf/finance sample project.pdfa...
TRANSCRIPT

A Study on the financial performance of Siesta Logistics
Corporation Limited using Ratio Analysis
(A Report Submitted in partial fulfillment of the requirements for the Degree
of Master of Business Administration in Pondicherry University of distance
education)
Submitted by
Ms. Lidia .A
Enrolment No: 5712370009
MBA: FINANCE
Under the Guidance of
Dr. Kanishka. K
St. Joseph’s Evening College
Bangalore – 560025
ST. JOSEPH’S EVENING COLLEGE – PONDICHERRY UNIVERSITY
TWINNING PROGRAMME
PONDICHERRY – 605014
BATCH (2012 – 2014)

CERTIFICATE
This is to certify that this project titled “A Study on the financial
performance of Siesta Logistics Corporation Limited using Ratio
Analysis” is based on an original project study conducted by
Ms. Lidia .A
Reg. No. 5712370009
of IV semester MBA under the guidance of Dr. Kanishka. This project
work is original and not submitted earlier for the award of any
degree/diploma or associateship of any other University/Institution.
Signature of the candidate Signature of the Supervisor
Signature of the coordinator
Place: Bangalore
Date:

CERTIFICATE OF THE GUIDE
This is to certify that the project work titled “A Study on the financial performance
of Siesta Logistics Corporation Limited using Ratio Analysis” is a bonafide work
of Ms. Lidia .A Enroll No: 5712370009 carried out in partial fulfillment for the
award of degree of Master of Business Administration in Finance in Pondicherry
University under my guidance. This project work is original and not submitted
earlier for the award of any degree/diploma or associateship of any other University
/ Institution.
Date:
Place: Bangalore
Dr. Kanishka
St. Joseph’s Evening College
Bangalore
Student’s Declaration
I, Ms. Lidia .A hereby declare that the project work titled “A Study on
the financial performance of Siesta Logistics Corporation Limited
using Ratio Analysis” is the original work done by me and submitted to
the Pondicherry University - St. Joseph’s Evening College Twinning
Programme in partial fulfillment of requirements for the award of Master
of Business Administration in Finance is a record of original work done
by me under the guidance of Dr. Kanishka.
Enroll No: 5712370009
Signature of the Student

ACKNOWLEDGEMENT
“It is not possible to prepare a project report without the assistance &
encouragement of other people. This one is certainly no exception.”
On the very outset of this report, I would like to extend my sincere & heartfelt
obligation towards all the personages who have helped me in this endeavor.
Without their active guidance, help, cooperation & encouragement, I would
not have made headway in the project.
It gives me great pleasure in extending my thanks to Principal GRACELET
STANTLY for enabling me to do this project.
I am ineffably indebted to Mr. Kanishka K for conscientious guidance and
encouragement to accomplish this assignment.
I express sincere thanks to Siesta Logistics Corporation Limitedfor according
permission to carry out this study in his esteemed organization.
I also acknowledge with a deep sense of reverence, my gratitude towards my
parents and member of my family, who has always supported me morally as
well as economically.
At last but not least gratitude goes to all of my friends who directly or
indirectly helped me to complete this project report.
Any omission in this brief acknowledgement does not mean lack of gratitude.
Lidia .A

EXECUTIVE SUMMARY
ABOUT THE SIESTA LOGISTICS CORPORATION LIMITED:-
Siesta Logistics Corporation Limited is India’s only truly Integrated Logistics
Service Provider. The company was promoted by Mr. Ashok Chattaraj a first
generation entrepreneur and its present Chairman & Managing Director. The
company was founded in 2007 and is based in Bangalore, India with an additional
office in Hong Kong. Siesta Logistics Corporation Limited operates as a subsidiary
of The Siesta Group of Companies.

CONTENTS
Sl. No Title Page No.
Chapter - 1 Introduction
1 - 26
Theoretical background
1.1 Use and significance of Ratio Analysis
1.2 Limitations
1.3 Classifications of ratios
Chapter - 2 Research Methodology
27 - 31
2.1 Introduction
2.2 Need for the study
2.3Liquidity And Profitability
2.4 Scope of the study
2.5 Objectives of the study
2.6 Statement of the problem:
2.7Data sources
2.8 Limitations
Chapter –3 Company Profile 32 - 38
Chapter –4 Analysis and Interpretation 39 - 77
Chapter –5 Findings, Recommendations and Conclusion 78 - 82
Bibliography 83
Annexure 84 - 84

LIST OF TABLES
Sl. No Table No Title of the tables Page No
1 4.1 Current Ratio 40
2 4.2 Quick Ratio 42
3 4.3 Cash Ratio 43
4 4.4 Debt equity Ratio 45
5 4.5 Proprietary Ratio 47
6 4.6 Capital Gearing Ratio 49
7 4.7 Average Collection Period 51
8 4.8 Fixed assets turnover ratio 53
9 4.9 Working Capital Turnover Ratio 55
10 4.10 Capital Turnover Ratio 56
11 4.11 Total Assets Turnover Ratio 58
12 4.12 Current Assets Turnover Ratio 60
13 4.13 Gross Profit Ratio 62
14 4.14 Net profit ratio 64
15 4.15 Operating Ratio 66
16 4.16 Expenses Ratio 68
17 4.17 Return on Total Assets 70
18 4.18 Return on Capital Employed 72
19 4.19 Return on Total Shareholder’s Funds 74
20 4.20 Earnings Per Share 76
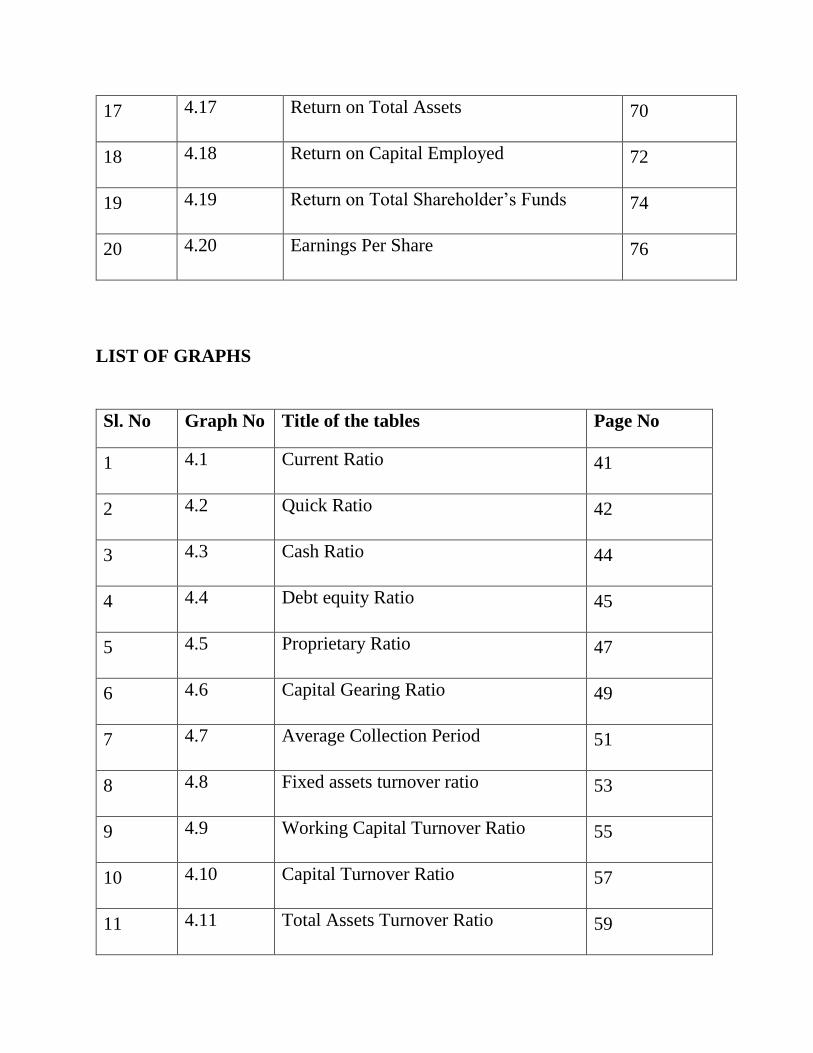
LIST OF GRAPHS
Sl. No Graph No Title of the tables Page No
1 4.1 Current Ratio 41
2 4.2 Quick Ratio 42
3 4.3 Cash Ratio 44
4 4.4 Debt equity Ratio 45
5 4.5 Proprietary Ratio 47
6 4.6 Capital Gearing Ratio 49
7 4.7 Average Collection Period 51
8 4.8 Fixed assets turnover ratio 53
9 4.9 Working Capital Turnover Ratio 55
10 4.10 Capital Turnover Ratio 57
11 4.11 Total Assets Turnover Ratio 59

12 4.12 Current Assets Turnover Ratio 61
13 4.13 Gross Profit Ratio 63
14 4.14 Net profit ratio 65
15 4.15 Operating Ratio 67
16 4.16 Expenses Ratio 69
17 4.17 Return on Total Assets 71
18 4.18 Return on Capital Employed 73
19 4.19 Return on Total Shareholder’s Funds 75
20 4.20 Earnings Per Share 77

A Study on the financial performance of Siesta Logistics Corporation Limited using Ratio Analysis
1
CHAPTER - 1
INTRODUCTION
A Study on the financial performance of Siesta Logistics Corporation Limited using Ratio Analysis
2
INTRODUCTION:
FINANCIAL ANALYSIS:
Financial analysis is the process of identifying the financial strengths and
weaknesses of the firm and establishing relationship between the items of the
balance sheet and profit & loss account. Financial ratio analysis is the calculation
and comparison of ratios, which are derived from the information in a company‟s
financial statements. The level and historical trends of these ratios can be used to
make inferences about a company‟s financial condition, its operations and
attractiveness as an investment. The information in the statements is used by-
Trade creditors, to identify the firm‟s ability to meet their claims i.e.
liquidity position of the company.
Investors, to know about the present and future profitability of the company
and its financial structure.
Management, in every aspect of the financial analysis. It is the responsibility
of the management to maintain sound financial condition in the company.
RATIO ANALYSIS:
Ratio analysis is such a significant technique for financial analysis. It indicates
relation of two mathematical expressions and the relationship between two or more
things. Financial ratio is a ratio of selected values on an enterprise's financial
statement.
There are many standard ratios used to evaluate the overall financial condition of a
corporation or other organization. Financial ratios are used by managers within a
firm, by current and potential stockholders of a firm, and by a firm„s creditor.

A Study on the financial performance of Siesta Logistics Corporation Limited using Ratio Analysis
3
Financial analysts use financial ratios to compare the strengths and weaknesses in
various companies.
MEANING OF RATIO:
A ratio is simple arithmetical expression of the relationship of one number to
another. It may be defined as the indicated quotient of two mathematical
expressions.
According to Accountant‟s Handbook by Wixom, Kill and Bedford, “a ratio is an
expression of the quantitative relationship between two numbers”.
MEANING OF RATIO ANALYSIS:
Ratio analysis is a very important tool of financial analysis. It is the process of
establishing the significant relationship between the items of financial statement to
provide a meaningful understanding of the performance and financial position of a
firm. Ratio when calculated on the basis of accounting information are called
„Accounting Ratio‟.
DEFINITIONS OF RATIO ANALYSIS:
Kennedy and Mc Mulla. “The relationship of one to another, expressed in simple
term of mathematical is known as ratio”
According to Accountant‟s Handbook by Wixom, Kell and Bedford, a ratio “is an
expression of the quantitative relationship between two numbers”.
NATURE OF RATIO ANALYSIS:
Ratio analysis is a technique of analysis and interpretation of financial statements.
It is the process of establishing and interpreting various ratios for helping in
making certain decisions. However, ratio analysis is not an end in itself. It is only a

A Study on the financial performance of Siesta Logistics Corporation Limited using Ratio Analysis
4
means of better understanding of financial strengths and weakness of a firm. There
are a number of ratios which can be calculated from the given information given in
the financial statements, but the analyst as to select the appropriate data and
calculate only a few appropriate ratios from the same keeping in mind the
objectives of analysis. The following are the four steps involved in the ratio
analysis:
Selection of relevant data from the financial statements depending upon the
objective of the analysis.
Calculation of appropriate from the above data.
Comparison of the calculated ratios with the ratios of the same firm in the
past, or the ratios developed from the projected financial statements.
Interpretation of the ratios.
GUIDELINES OR PRECAUTIONS FORRATIOANALYSIS
The calculation of ratios may not be a difficult task but their use is not easy.
Following guidelines or factors may be kept in mind while interpreting various
ratios are-
Accuracy of financial statements
Objective or purpose of analysis
Selection of ratios
Use of standards
Caliber of the analysis

A Study on the financial performance of Siesta Logistics Corporation Limited using Ratio Analysis
5
1. THEORETICAL BACKGROUND:
1.1 USE AND SIGNIFICANCEOFRATIOANALYSIS:
The ratio is one of the most powerful tools of financial analysis. It is used as a
device to analyze and interpret the financial health of enterprise. Ratio analysis
stands for the process of determining and presenting the relationship of items and
groups of items in the financial statements. It is an important technique of the
financial analysis. It is the way by which financial stability and health of the
concern can be judged. Thus ratios have wide applications and are of immense use
today. The following are the main points of importance of ratio analysis:
A. MANAGERIALUSESOFRATIOANALYSIS:
The following are the uses of ratio analysis:
1. Helps in decision making: Financial statements are prepared primarily for
decision-making. Ratio analysis helps in making decision from the
information provided in these financial Statements.
2. Helps in financial forecasting and planning: Ratio analysis is of much
help in financial forecasting and planning. Planning is looking ahead and the
ratios calculated for a number of years a work as a guide for the future.
Thus, ratio analysis helps in forecasting and planning.
3. Helps in communicating: The financial strength and weakness of a firm are
communicated in a more easy and understandable manner by the use of
ratios. Thus, ratios help in communication and enhance the value of the
financial statements.

A Study on the financial performance of Siesta Logistics Corporation Limited using Ratio Analysis
6
4. Helps in co-ordination: Ratios even help in co-ordination, which is of at
most importance in effective business management. Better communication
of efficiency and weakness of an enterprise result in better co-ordination in
the enterprise.
5. Helps in control: Ratio analysis even helps in making effective control of
business. The weaknesses are otherwise, if any, come to the knowledge of
the managerial, which helps, in effective control of the business.
B. UTILITY TO SHAREHOLDERS/INVESTORS:
An investor in the company will like to assess the financial position of the concern
where he is going to invest. His first interest will be the security of his investment
and then a return in form of dividend or interest. Ratio analysis will be useful to the
investor in making up his mind whether present financial position of the concern
warrants further investment or not.
C. UTILITY TO CREDITORS:
The creditors or suppliers extend short-term credit to the concern. They are
invested to know whether financial position of the concern warrants their payments
at a specified time or not.
D. UTILITY TO EMPLOYEES:
The employees are also interested in the financial position of the concern
especially profitability. Their wage increases and amount of fringe benefits are
related to the volume of profits earned by the concern.

A Study on the financial performance of Siesta Logistics Corporation Limited using Ratio Analysis
7
E. UTILITY TO GOVERNMENT:
Government is interested to know overall strength of the industry. Various
financial statement published by industrial units are used to calculate ratios for
determining short term, long-term and overall financial position of the concerns.
F. TAX AUDIT REQUIREMENTS:
Sec44AB was inserted in the income tax act by financial act; 1984.Caluse 32 of the
income tax act requires that the following accounting ratios should be given:
a) Gross profit/turnover.
b) Net profit/turnover.
c) Stock in trade/turnover
d) Material consumed/finished goods produced.
Further, it is advisable to compare the accounting ratios for the year under
consideration with the accounting ratios for earlier two years so that the auditor can
make necessary enquiries, if there is any major variation in the accounting ratios.
1.2 LIMITATIONS:
1. Lack of proper standards.
2. Comparison not possible if different firms adopt different accounting
policies.
3. Ratio analysis becomes less effective due to price level changes.
4. Ratio may be misleading in the absence of absolute data.
5. Limited use of a single data.
6. False accounting data gives false ratio.
7. Ratios alone are not adequate for proper conclusions.
8. Effect of personal ability and bias of the analyst.

A Study on the financial performance of Siesta Logistics Corporation Limited using Ratio Analysis
8
1.3 CLASSIFICATIONS OF RATIOS:
Several ratios, calculated from the accounting data can be grouped into various
classes according to financial activity or function to be evaluated. Management is
interested in evaluating every aspect of the firm‟s performance. They have to
protect the interests of all parties and see that the firm grows profitably .In view of
the requirement of the various users of ratios; ratios are classified into following
four important categories:
A. LIQUIDITYRATIO:
a) Current Ratio
b) Quick Ratio or Acid Test Ratio
c) Cash ratio
B. LEVERAGE OR CAPITAL STRUCTURE RATIO:
a) Debt Equity Ratio
b) Proprietary Ratio
c) Capital Gearing Ratio
d) Interest Coverage Ratio
C. ACTIVITY RATIO OR TURNOVERRATIO:
a) Stock Turnover Ratio
b) Debtors or Receivables Turnover Ratio
c) Average Collection Period
d) Creditors or Payables Turnover Ratio
e) Average Payment Period
f) Fixed Assets Turnover Ratio
g) Working Capital Turnover Ratio

A Study on the financial performance of Siesta Logistics Corporation Limited using Ratio Analysis
9
D. PROFITABILITYRATIOOR INCOME RATIO:
Profitability Ratio based on Sales :
i. Gross Profit Ratio
ii. Net Profit Ratio
iii. Operating Ratio
iv. Expenses Ratio
Profitability Ratio Based on Investment:
i. Return on Capital Employed
ii. Return on Shareholder‟s Funds
a. Return on Total Shareholder‟s Funds
b. Return on Equity Shareholder‟s Funds
iii. Earnings Per Share
iv. Dividend Per Share
A. LIQUIDITYRATIO:
It is extremely essential for a firm to be able to meet the obligations as they
become due. Liquidity ratios measure the ability of the firm to meet its current
obligations (liabilities). The liquidity ratios reflect the short-term financial strength
and solvency of a firm. In fact, analysis of liquidity needs the preparation of cash
budgets and cash and funds flow statements; but liquidity ratios, by establishing a
relationship between cash and other current assets to current obligations, provide a
quick measure of liquidity. A firm should ensure that it does not suffer from lack
of liquidity, and also that it does not have excess liquidity. The failure of a
company to meet its obligations due to lack of sufficient liquidity, will result in a

A Study on the financial performance of Siesta Logistics Corporation Limited using Ratio Analysis
10
poor credit worthiness, loss of credit worthiness, loss of creditors‟ confidence, or
even in legal tangles resulting in the closure of the company.
A very high degree of liquidity is also bad; idle assets earn nothing. The firm‟s
funds will be unnecessarily tied up in current assets. Therefore, it is necessary to
strike a proper balance between high liquidity and lack of liquidity. The most
common ratios which indicate the extent of liquidity are lack of it, are:
a. Current ratio
b. Quick ratio.
c. Cash ratio and
a. Current ratio:
Current ratio is calculated by dividing current assets by current liabilities.
Current assets include cash and other assets that can be converted into cash within
in a year, such as marketable securities, debtors and inventories. Prepaid expenses
are also included in the current assets as they represent the payments that will not
be made by the firm in the future.
All obligations maturing within a year are included in the current liabilities.
Current liabilities include creditors, bills payable, accrued expenses, short-term
bank loan, income tax, liability and long-term debt maturing in the current year.
Current Assets
Current Ratio
= …………………………………
Current Liabilities

A Study on the financial performance of Siesta Logistics Corporation Limited using Ratio Analysis
11
The current ratio is a measure of firm‟s short-term solvency. It indicates the
availability of current assets in rupees for every one rupee of current liability. A
ratio of greater than one means that the firm has more current assets than current
claims against them Current liabilities.
b. Quick Ratio: Quick ratio also called Acid-test ratio, establishes a
relationship between quick, or liquid, assets and current liabilities. An asset is a
liquid if it can be converted into cash immediately or reasonably soon without a
loss of value. Cash is the most liquid asset. Other assets that are considered to be
relatively liquid and included in quick assets are debtors and bills receivables and
marketable securities (temporary quoted investments). Inventories are considered
to be less liquid. Inventories normally require some time for realizing into cash;
their value also has a tendency to fluctuate. The quick ratio is found out by
dividing quick assets by current liabilities.
The Formula for calculating Quick Ratio is as follows:-
(Quick Assets=Current Assets=Inventories)
Quick Assets
Quick Ratio= ……………………………
Current Liabilities
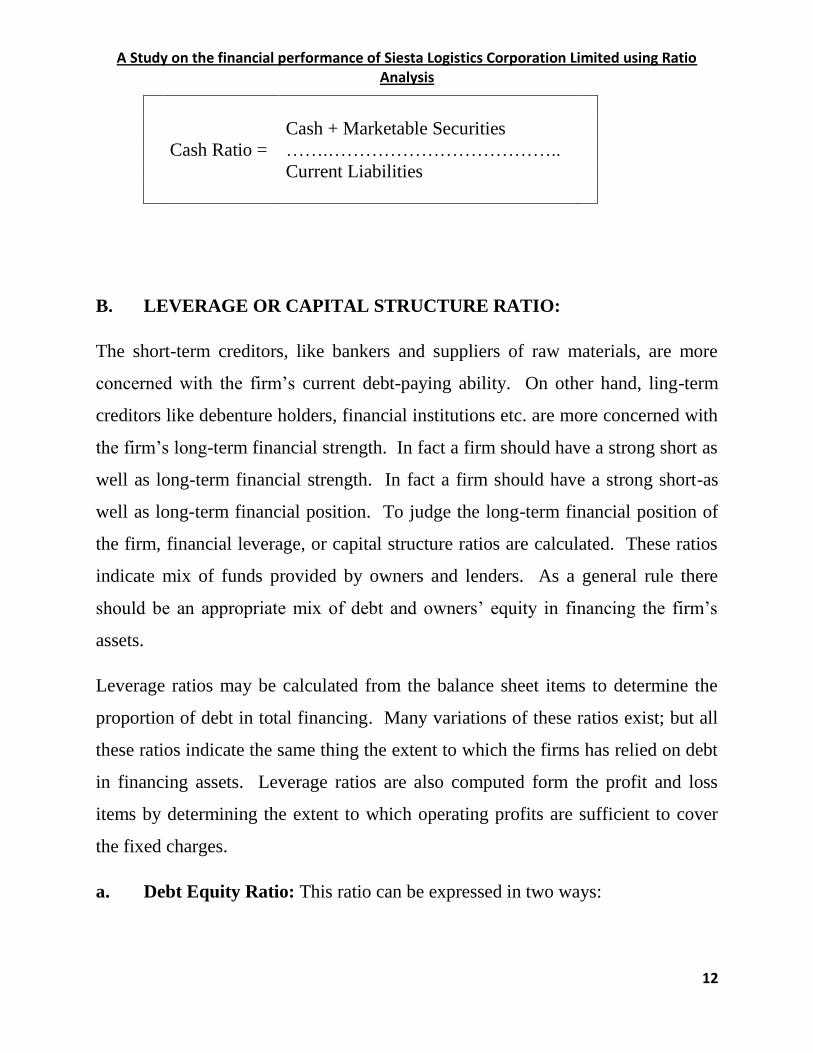
c. Cash Ratio: Since cash is the most liquid asset, it may be examined cash
ratio and its equivalent to current liabilities. Trade investment or marketable
securities are equivalent of cash; therefore, they may be included in the
computation of cash ratio:
A Study on the financial performance of Siesta Logistics Corporation Limited using Ratio Analysis
12
Cash + Marketable Securities
Cash Ratio = …….………………………………..
Current Liabilities
B. LEVERAGE OR CAPITAL STRUCTURE RATIO:
The short-term creditors, like bankers and suppliers of raw materials, are more
concerned with the firm‟s current debt-paying ability. On other hand, ling-term
creditors like debenture holders, financial institutions etc. are more concerned with
the firm‟s long-term financial strength. In fact a firm should have a strong short as
well as long-term financial strength. In fact a firm should have a strong short-as
well as long-term financial position. To judge the long-term financial position of
the firm, financial leverage, or capital structure ratios are calculated. These ratios
indicate mix of funds provided by owners and lenders. As a general rule there
should be an appropriate mix of debt and owners‟ equity in financing the firm‟s
assets.
Leverage ratios may be calculated from the balance sheet items to determine the
proportion of debt in total financing. Many variations of these ratios exist; but all
these ratios indicate the same thing the extent to which the firms has relied on debt
in financing assets. Leverage ratios are also computed form the profit and loss
items by determining the extent to which operating profits are sufficient to cover
the fixed charges.
a. Debt Equity Ratio: This ratio can be expressed in two ways:

A Study on the financial performance of Siesta Logistics Corporation Limited using Ratio Analysis
13
First Approach: According to this approach, this ratio expresses the relationship
between long term debts and shareholder‟s fund.
Formula:
Total Liabilities
Debt Equity Ratio = ………………………………………….
Shareholder‟s Funds or Net Worth
Long Term Loans: These refer to long term liabilities which mature after one
year. These include Debentures, Mortgage Loan, Bank Loan, and Loan from
Financial institutions and Public Deposits etc.
Shareholder’s Funds: These include Equity Share Capital, Preference Share
Capital, Share Premium, General Reserve, Capital Reserve, Other Reserve and
Credit Balance of Profit & Loss Account.
Second Approach: According to this approach the ratio is calculated as follows:
Formula:
External Equities
Debt Equity Ratio = …………………………………….
Internal Equities
Debt equity ratio is calculated for using second approach.
Significance: This Ratio is calculated to assess the ability of the firm to meet its
long term liabilities. Generally, debt equity ratio of is considered safe.

A Study on the financial performance of Siesta Logistics Corporation Limited using Ratio Analysis
14
If the debt equity ratio is more than that, it shows a rather risky financial position
from the long-term point of view, as it indicates that more and more funds invested
in the business are provided by long-term lenders.
The lower this ratio, the better it is for long-term lenders because they are more
secure in that case. Lower than 2:1 debt equity ratio provides sufficient protection
to long-term lenders
b. Proprietary Ratio: This ratio indicates the proportion of total funds provide
by owners or shareholders.
Formula for the calculation of Proprietary Ratio:
Shareholder‟s Funds
Proprietary Ratio =
….….………………….. + Long term
Loans
Shareholder‟s funds
This ratio should be 33% or more than that. In other words, the proportion of
shareholders‟ funds to total funds should be 33% or more. If the ratio is low it
indicates that long-term loans are less secured and they face the risk of losing their
money.
b. Capital Gearing Ratio: This ratio establishes a relationship between equity
capital (including all reserves and undistributed profits) and fixed cost
bearing capital.

A Study on the financial performance of Siesta Logistics Corporation Limited using Ratio Analysis
15
Formula:
Equity Share Capital+ Reserves + P&L Balance
Capital Gearing
Ratio = ….….………………………………………………..
Fixed cost Bearing Capital
Whereas, Fixed Cost Bearing Capital = Preference Share Capital + Debentures +
Long Term Loan
Significance: If the amount of fixed cost bearing capital is more than (the equity
share capital including reserves an undistributed profits), it will be called high
capital gearing and if it is less, it will be called low capital gearing.
The high gearing will be beneficial to equity shareholders when the rate of
interest/dividend payable on fixed cost bearing capital is lower than the rate of
return on investment in business.
Thus, the main objective of using fixed cost bearing capital is to maximize the
profits available to equity shareholders.
d. Interest Coverage Ratio: This ratio is also termed as „Debt Service Ratio‟.
This ratio is calculated as follows:
Formula:
Net Profit before charging interest and tax
Interest Coverage Ratio
= ……...….….……………………………………
Fixed Interest Charges
A Study on the financial performance of Siesta Logistics Corporation Limited using Ratio Analysis
16
Significance: This ratio indicates how many times the interest charges are covered
by the profits available to pay interest charges. This ratio measures the margin of
safety for long-term lenders.
This higher the ratio, more secure the lenders is in respect of payment of interest
regularly. If profit just equals interest, it is an unsafe position for the lender as well
as for the company also, as nothing will be left for shareholders.
An interest coverage ratio of 6 or 7 times is considered appropriate.
ACTIVITY RATIO OR TURNOVERRATIO:
These ratios are calculated on the bases of „cost of sales‟ or sales, therefore, these
ratios are also called as „Turnover Ratio‟. Turnover indicates the speed or number
of times the capital employed has been rotated in the process of doing business.
Higher turnover ratio indicates the better use of capital or resources and in turn
leads to higher profitability.
It includes the following:
a. Stock Turnover Ratio: This ratio indicates the relationship between the
cost of goods during the year and average stock kept during that year. Formula:
Cost of Goods Sold
Stock Turnover Ratio = ……...….….………………
Average Stock

A Study on the financial performance of Siesta Logistics Corporation Limited using Ratio Analysis
17
Here, Cost of goods sold = Net Sales – Gross Profit
Average Stock = Opening Stock + Closing Stock/2
Significance: This ratio indicates whether stock has been used or not. It shows the
speed with which the stock is rotated into sales or the number of times the stock is
turned into sales during the year.
The higher the ratio, the better it is, since it indicates that stock is selling quickly.
In a business where stock turnover ratio is high, goods can be sold at a low margin
of profit and even than the profitability may be quite high.
b. Debtors Turnover Ratio: This ratio indicates the relationship between
credit sales and average debtors during the year.
Formula for calculation of Debtors Turnover Ratio is:
Net Credit sales
Debtors Turnover Ratio = …………………………………..
Averages Debtors + Average B/R
While calculating this ratio, provision for bad and doubtful debts is not deducted
from the deducted from the debtors, so that it may not give a false impression that
debtors are collected quickly.
Significance: This ratio indicates the speed with which amount is collected from
debtors. The higher the ratio, the better it is, since it indicates that amount from
debtors is being collected more quickly.
c. Average Collection Period: This ratio indicates the time with in which the
amount is collected from debtors and bills receivables.

A Study on the financial performance of Siesta Logistics Corporation Limited using Ratio Analysis
18
Formula is:
Debtors + Bills Receivable
Average Collection
Period = ………………………………
Credit Sales per day
Here, Credit Sales per day= Net Credit Sales of the year/365
Average Debtors*365
Average Collection
Period = ………………………………….
Net Credit Sales
Significance: This ratio shows the time in which the customers are paying for
credit sales. A higher debt collection period is thus, an indication of the
inefficiency and negligence on the part of management. On the other hand, if there
is decrease in debt collection period, it indicates prompt payment by debtors which
reduces the chance of bad debts.
d. Creditors Turnover Ratio: This ratio indicates the relationship between
credit purchased and average creditors during the year and the formula:
Net Credit Purchases
Creditors Turnover Ratio = ……………………………………
Average Creditors +Average B/P

A Study on the financial performance of Siesta Logistics Corporation Limited using Ratio Analysis
19
Significance: This ratio indicates the speed with which the amount is being paid to
creditors. The higher the ratio, the better it is, since it will indicate that the
creditors are being paid more quickly which increases the credit worthiness of the
firm.
e. Average Payment Period: This ratio indicates the period which is normally
taken by the firm to make payment to its creditors.
Formula for Average Payment Period is:
Creditors + B/P
Average Payment Period
= …………………………………..
Credit Purchase per day
Significance: The lower the ratio, the better it is, because a shorter payment period
implies that the creditors are being paid rapidly.
f. Fixed Assets Turnover Ratio: This ratio reveals how efficiently the fixed
assets are being utilized.
Formula:
Cost of Goods Sold
Fixed Assets Turnover
Ratio= …………………………………..
Net Fixed Assets
Here, Net Fixed Assets = Fixed Assets – Depreciation
A Study on the financial performance of Siesta Logistics Corporation Limited using Ratio Analysis
20
Significance: This ratio is particular importance in manufacturing concerns where
the investment in fixes asset is quite high. Compared with the previous year, if
there is increase in this ratio, it will indicate that there is better utilization of fixed
assets. If there is a fall in this ratio, it will show that fixed assets have not been
used as efficiently as they had been used in the previous year.
g. Working Capital Turnover Ratio: This ratio reveals how efficiently
working capital has been utilized in making sales.
Formula is:
Cost of Goods Sold
Working Capital
Turnover Ratio= …………………………………..
Working Capital
Here, Cost of Goods Sold = Opening Stock + Purchases + Carriage + Wages +
Other Direct Expenses – Closing Stock
Working Capital = Current Assets – Current Liabilities
Significance: This ratio is of Particular importance in non-manufacturing concerns
where current assets play a major role in generating sales. It shows the number of
times working capital has been rotated in producing sales.
A high working capital turnover shows efficient use of working capital and quick
turnover of current assets like stock and debtors. A low working capital turnover
ratio indicates under-utilization of working capital.
E. PROFITABILITYRATIOOR INCOME RATIO:
A Study on the financial performance of Siesta Logistics Corporation Limited using Ratio Analysis
21
The main object of every business concern is to earn profits. A business must be
able to earn adequate profits in relation to the risk and capital invested in it. The
efficiency and the success of a business can be measured with the help of
profitability ratio.
a. Profitability Ratio Based on Sales:
i. Gross Profit Ratio: This ratio shows the relationship between gross
profit & sales. Formula:
Gross Profit
Gross Profit Ratio = ……………………………* 100
Net Sales
Here, Net sales = Sales – Sales Return
Significance: This ratio measures the margin of profit available on sales. The
higher the gross profit ratio, the better it is. No ideal standard is fixed for this ratio,
but the gross profit ratio should be adequate enough not only to cover the operating
expenses but also to provide for depreciation, Interest on loans, dividends and
creation of reserves.
ii. Net Profit Ratio: This ratio shows the relationship between net profit and
sales.
It may be calculated by two methods.
Method -1

A Study on the financial performance of Siesta Logistics Corporation Limited using Ratio Analysis
22
Net Profit
Net Profit Ratio = ……………………………* 100
Net Sales
Method -2
Operating Net Profit
Operating Net Profit = ……………………………* 100
Net Sales
Significance: This ratio measures the rate of net profit earned on sale. It helps in
determining the overall efficiency of the business operations. An increase in the
ratio over the previous year shows improvement in the overall efficiency and
profitability of the business.
iii. Operating Ratio: This ratio measures the proportion of an enterprise cost of
sales and operating expenses in comparison to its sales.
Formula:
Cost of Goods Sold + Operating
Expenses
Operating
Ratio =
………………………………………
….. * 100
Net Sales
Significance: Operating Ratio is a measurement of the efficiency and profitability
of the business enterprises. The ratio indicates the extent of sales that is absorbed
by the cost of goods sold and operating expenses. Lower the Operating ratio is
better, because it will leave higher margin of profit on sales.

A Study on the financial performance of Siesta Logistics Corporation Limited using Ratio Analysis
23
iv. Expenses Ratio: The ratio indicates the relationship between expenses and
sales. Although the operating ratio reveals the ratio of total operating expenses in
relation to sales but some of the expenses include in operating ratio may be
increasing while some may be decreasing. Hence, specific expenses ratio are
computed by dividing each type of expenses with the net sales to analyze the
causes of various in each type of expenses.
Formula for the Computation of Expenses Ratio:
Particular Expense
Expenses Ratio
= ……………………………
* 100
Net Sales
Significance: Various expenses ratio when compared with the same ratios of the
previous year give a very important indication whether these expenses in relation
to sales are increasing, decreasing or remain stationary. If the expenses ratio is
lower, the profitability will be greater and if the expenses ratio is higher the
profitability will be lower.
b. Profitability Ratio Based on Investment:
These ratios reflect the true capacity of the resources employed in the enterprises.
Sometimes the profitability ratio based on sales is high whereas profitability ratio
based on investment is low. Since the capital is employed to earn profit, these are
the real measures of the success of the business and managerial efficiency.

A Study on the financial performance of Siesta Logistics Corporation Limited using Ratio Analysis
24
i. Return on Capital Employed: This ratio reflects the overall profitability of
the business. It is calculated by comparing the profit earned and the capital
employed to earn it. This ratio is usually in percentage and is also known as „Rate
of Return‟ or Yield on Capital‟.
Formula for calculation of Return on Capital employed is:
Profit Before Interest, Tax and
Dividends
Return on Capital
Employed = …………………………………
* 100
Capital Employed
Advantages of ‘Return on Capital Employed:
Since profit is the overall objective of a business enterprise, this ratio is a
barometer of the overall performance of the enterprise. It measures how
efficiently the capital employed in the business is being used.
Even the performance of two dissimilar firms may be compared with the
help of this ratio.
The ratio can be used to judge the borrowing policy of the enterprise
This ratio helps in affecting the necessary changes in the financial policies of
the firm.
Return on Shareholder‟s Fund: Return on Capital Employed shows the
overall profitability of the funds supplied by long term lenders and
shareholders taken together. Whereas, Return on shareholder‟s funds
measures only the profitability of the funds invested by shareholders.
These are several measures to calculate the return on shareholder‟s funds:

A Study on the financial performance of Siesta Logistics Corporation Limited using Ratio Analysis
25
Return on Total Shareholder‟s Funds: For calculating this ratio „Net Profit
after Interest and Tax‟ is divided by total.
Net Profit After Interest and
Tax
Return on Total
Shareholder‟s Fund =
………………………………
……
Total Shareholder‟s Funds
Where, Total Shareholder‟s Funds = Equity Share Capital + Preferences Share
Capital + All Reserved +P&L Account Balance – Fictitious Assets
Significance: This ratio reveals how profitably the proprietor‟s funds have been
utilized by the firm. A comparison of this ratio with that of similar firms will throw
light on the relative profitability and strength of the firm.
Return on Equity Shareholder’s Funds: Equity Shareholders of a company are
more interested in knowing the earning capacity of their funds in the business. As
such, this ratio measures the profitability of the funds belonging to the equity
shareholder‟s.
Formula:
Net Profit (after interest ,
tax & preferences
dividend)
Return on Equity
Shareholder‟s Funds =
…………………………
……. *100
Equity Shareholder‟s
Funds

A Study on the financial performance of Siesta Logistics Corporation Limited using Ratio Analysis
26
Equity Shareholder‟s Funds = Equity Share Capital + All Reserves + P&L
Account.
Significance: This ratio measures how efficiently the equity shareholder‟s funds
are being used in the business. It is a true measure of the efficiency of the
management since it shows what the earning capacity of the equity shareholders‟
funds. If the ratio is high, it is better, because in such a case equity shareholders
may be given a higher dividend.
iii. Earnings per Share (E.P.S): This ratio measures the profit available to the
equity shareholders on a per share basis. All profit left after payment of tax and
preference dividends are available to equity shareholders.
Formula:
Net Profit – Dividend on Preference
Shares
Earnings Per
Share = ………………………………………
No. of Equity Shares
Significance: This ratio helpful in the determining of the market price of the equity
share of the company. The ratio is also helpful in estimating the capacity of the
company to declare dividends on equity shares.
iv. Dividend per Share (D.P.S): Profits remaining after payment of tax and
preference dividend are available to equity shareholders. But of these are not
distributed among them as dividend. Out of these profits is retained in the business
and the remaining is distributed among equity shareholders as dividend. D.P.S. is

A Study on the financial performance of Siesta Logistics Corporation Limited using Ratio Analysis
27
the dividend distributed to equity shareholders dividend by the number of equity
shares.
Formula:
Dividend paid to Equity
Shareholders
D.P.S =
………………………………………
……... * 100
Total Net Profit belonging to Equity
Shareholders

A Study on the financial performance of Siesta Logistics Corporation Limited using Ratio Analysis
28
CHAPTER – 2
RESEARCH METHODOLOGY

A Study on the financial performance of Siesta Logistics Corporation Limited using Ratio Analysis
29
2.1 RESEACH METHODOLOGY:
INTRODUCTION:
Financial statements have two major uses in financial analysis. First, they are used
to present a historical recover of the firm‟s financial development. Second, they are
used for a course of action for the firm.
A performance financial statement is prepared for a future period. It is the financial
manager‟s estimate of the firm‟s future performance.
The operation and performance of a business depends on many individuals are
collective decisions that are continually made by its management team. Every one
of these decisions ultimately causes a financial impact, for better or works on the
condition and the periodic results of the business. In essence, the process of
managing involves a series of economic choices that activates moments of
financial resources connected with the business.
Some of the decisions made by management one will be the major, such as
investment in a new facility, raising large amounts of debts or adding a new line of
products or services. Most other decisions are part of the day to day process in
which every functional area of the business is managed. The combine of effect of
all decisions can be observed periodically when the performance of the business is
judged through various financial statements and special analysis.
These changes have profoundly affected all our lives and it is important for
corporate managers, shareholders, tenders, customers and suppliers to investment
and the performance of the corporations on which then relay. All who depend on a
corporation for products, services, or a job must be med about their company‟s

A Study on the financial performance of Siesta Logistics Corporation Limited using Ratio Analysis
30
ability to meet their demands time and in this changing world. The growth and
development of the corporate enterprises is reflected in their financial statement.
2.2 NEED FOR THE STUDY:
The study has great significance and provides benefits to various parties
whom directly or indirectly interact with the company.
It is beneficial to management of the company by providing crystal clear
picture regarding important aspects like liquidity, leverage, activity and
profitability.
The study is also beneficial to employees and offers motivation by showing
how actively they are contributing for company‟s growth.
The investors who are interested in investing in the company‟s shares will
also get benefited by going through the study and can easily take a decision
whether to invest or not to invest in the company‟s shares.
2.3 LIQUIDITY AND PROFITABILITY:
Liquidity and profitability are two important demanders in determining the
soundness of an enterprise.
Liquidity means ability of a firm to meet its current obligations when they become
due for payment. It has two aspects – quantitative and qualitative. Qualitative
aspect implies the quantum of current assets a firm possesses irrespective of
making any difference b/w various types of current assets such as inventories, cash
and so on. Qualitative aspect reforms the quality of current in terms of their
realization in to cash considering time dimension involved in maturing different
components of current assets.

A Study on the financial performance of Siesta Logistics Corporation Limited using Ratio Analysis
31
Profitability is the capacity of earning profits and due most important measure of
performance of affirms. It is generally assumed that there is negative relationship
b/w liquidity and profitability i.e. higher liquidity results in lower profitability and
vice-versa.
2.4 SCOPE OFTHE STUDY:
The scope of the study is limited to collecting financial data published in the
annual reports of the company every year. The analysis is done to suggest the
possible solutions. The study is carried out for 5 years (2009-13).
2.5 OBJECTIVESOFTHE STUDY:
To examine the financial performance of the Siesta Logistics Corporation
Ltd. for the period of 2010 to 2013.
To analyses interpret and to suggest the operational efficiency of the Siesta
Logistics Corporation Ltd by comparing the balance sheet& profit & loss
A\c
To critically analyses the financial performance of the Siesta Logistics
Corporation Ltd. With Help of the ratios.
To offer appropriate suggestions for the better performance of the
organization.
2.6 STATEMENTOFTHE PROBLEM:
Development of industries depends on several factors such as financial personnel,
technology, and quality of the product and marketing art of these. Financial aspects
assume a significant role in determining the growth of industries. All of the
company‟s operations virtually affect its need for cash. Most of these data covering
operations areas are however outside the direct responsibility of the financial

A Study on the financial performance of Siesta Logistics Corporation Limited using Ratio Analysis
32
executives. Values top management appreciates the value of good financial
executives to know the profitability and liquidity of the concern. The firm whose
present operations are inherently difficult should try to makes its financial analysis
to enable its management to stay on top of its working position. In this context the
researcher is interested in undertaking an analysis of the financial performance of
companies to examine and to understand how management of fiancé plays a
crucial role of the financial performance analysis of selected companies in India
has been undertaken.
2.7 DATA SOURCES:
The study is based on secondary data. However the primary data is also collected
to fill the gap in the information.
Primary data will be through regular interaction with the officials of Siesta
Logistics Corporation Ltd.
Secondary data collected from annual reports and also existing manuals and
like company records balance sheet and necessary records.
2.8 LIMITATIONS:
The study is based on only secondary data.
The period of study was 2010-13 financial years only.
One of the factors of the study was lack of availability of ample information.
Most of the information has been kept confidential and as such as not assed
as art of policy of company.
Time is an important limitation. The whole study was conducted in a period
of 60 days, which is not sufficient to carry out proper interpretation and
analysis.

A Study on the financial performance of Siesta Logistics Corporation Limited using Ratio Analysis
33
CHAPTER – 3
COMPANY PROFILE

A Study on the financial performance of Siesta Logistics Corporation Limited using Ratio Analysis
34
COMPANY PROFILE
SIESTA LOGISTICS CORPORATION LIMITED BANGALORE, INDIA
Siesta Logistics Corporation Limited is India‟s only truly Integrated Logistics
Service Provider. The company was promoted by Mr. Ashok Chattaraj a first
generation entrepreneur and its present Chairman & Managing Director. The
company was founded in 2007 and is based in Bangalore, India with an additional
office in Hong Kong. Siesta Logistics Corporation Limited operates as a subsidiary
of The Siesta Group of Companies. It has the capability to serve the clients with a
portfolio of customized solutions in the areas of transportation, freight forwarding,
rail, port and cargo services, 3PL services, Odd Dimension Cargo and Project
Cargo. Headquartered in Bangalore, the company has a vast network, covering
over 15 key business centers including major cities like Delhi, Kolkata, Ghaziabad,
Hyderabad, Bangalore, Chennai, Goa, Pune and Visakhapatnam among others.
SLCL helps clients redesign their supply chains, optimize their routes, negotiate
better vendor terms and ensure that their raw materials reach them on time, thereby
constantly delivering value to clients that comprise large multinationals and Indian
corporations.
A Study on the financial performance of Siesta Logistics Corporation Limited using Ratio Analysis
35
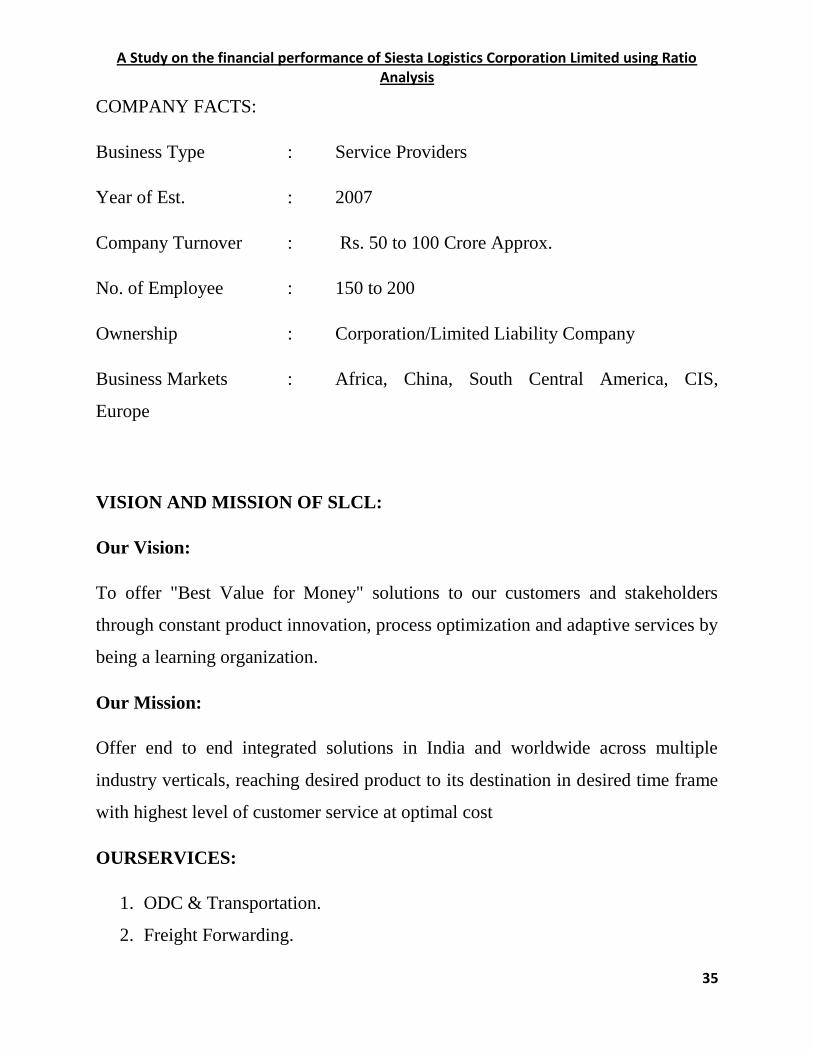
COMPANY FACTS:
Business Type : Service Providers
Year of Est. : 2007
Company Turnover : Rs. 50 to 100 Crore Approx.
No. of Employee : 150 to 200
Ownership : Corporation/Limited Liability Company
Business Markets : Africa, China, South Central America, CIS,
Europe
VISION AND MISSION OF SLCL:
Our Vision:
To offer "Best Value for Money" solutions to our customers and stakeholders
through constant product innovation, process optimization and adaptive services by
being a learning organization.
Our Mission:
Offer end to end integrated solutions in India and worldwide across multiple
industry verticals, reaching desired product to its destination in desired time frame
with highest level of customer service at optimal cost
OURSERVICES:
1. ODC & Transportation.
2. Freight Forwarding.
A Study on the financial performance of Siesta Logistics Corporation Limited using Ratio Analysis
36
3. Warehousing Management & 3PL services.
4. Customs House Agent (CHA):
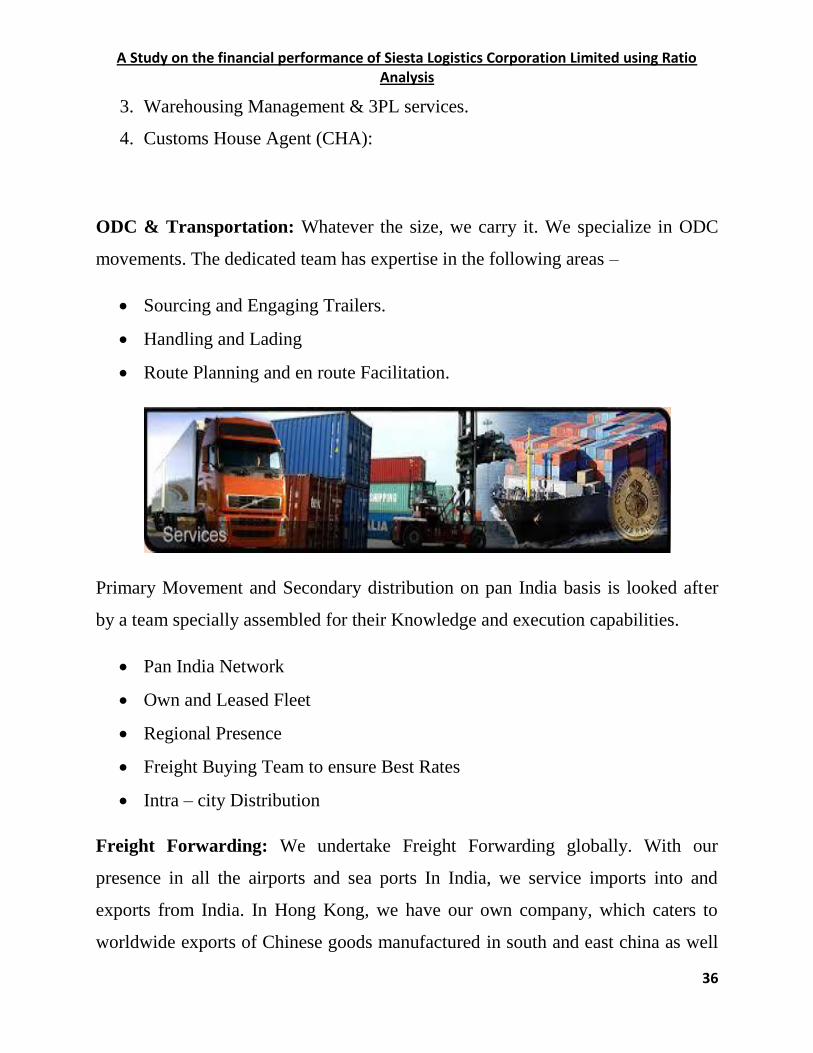
ODC & Transportation: Whatever the size, we carry it. We specialize in ODC
movements. The dedicated team has expertise in the following areas –
Sourcing and Engaging Trailers.
Handling and Lading
Route Planning and en route Facilitation.
Primary Movement and Secondary distribution on pan India basis is looked after
by a team specially assembled for their Knowledge and execution capabilities.
Pan India Network
Own and Leased Fleet
Regional Presence
Freight Buying Team to ensure Best Rates
Intra – city Distribution
Freight Forwarding: We undertake Freight Forwarding globally. With our
presence in all the airports and sea ports In India, we service imports into and
exports from India. In Hong Kong, we have our own company, which caters to
worldwide exports of Chinese goods manufactured in south and east china as well

A Study on the financial performance of Siesta Logistics Corporation Limited using Ratio Analysis
37
as imports into Hong Kong and China. We are in the process of setting up our
offices in South Africa, Europe, Singapore, Indonesia and Middle East.
We have MPO registration. ICD and CFS facilities are also available through our
strategic tie ups.
Warehouse Management and 3PL Services: Bespoke warehousing solutions are
designed and implemented based on the customer‟s specific requirements to
optimize costs, ensure accurate inventory, timely movements and throughput. We
have in-house software packages to control the warehouse. We also possess
knowledge of several popular WMS packages, which are available if the need
arises for any of our customers.
Dedicated, Multi-user as well as Multi _model warehousing is available on
demand.
Customs House Agent (CHA): Our CHA Team is highly knowledge and
experienced in the regulations covering all imports and exports in India. They are
specialized in the process of imports in India.
We have a rule 8/9 Qualified execution team, with our own CHA License.
Advances Licensing (EPCG, DEPB, DEEC, DFRC)
Bonding and De- Bonding of premises and goods.
In Bond Transportation
Samples
Alcoholic Beverages Imports.

A Study on the financial performance of Siesta Logistics Corporation Limited using Ratio Analysis
38
MANAGEMENT TEAM OF SLCL:
Ashok Chattaraj
The founder Chairman & Managing Director of SLCL
R. S. Unaware
Director
Kumar. S
Country Head - Projects & Contract Logistics
Kasi R. M
Executive Vice President – Finance
Pradeep Narsaria
Finance Controller – Operations
Malik Sharif
SBU Head – Power Projects
OUR CLIENTS:

A Study on the financial performance of Siesta Logistics Corporation Limited using Ratio Analysis
39

A Study on the financial performance of Siesta Logistics Corporation Limited using Ratio Analysis
40
CHAPTER – 4
ANALYSIS AND INTERPRETATION
A Study on the financial performance of Siesta Logistics Corporation Limited using Ratio Analysis
41
LIQUIDITY RATIOS:
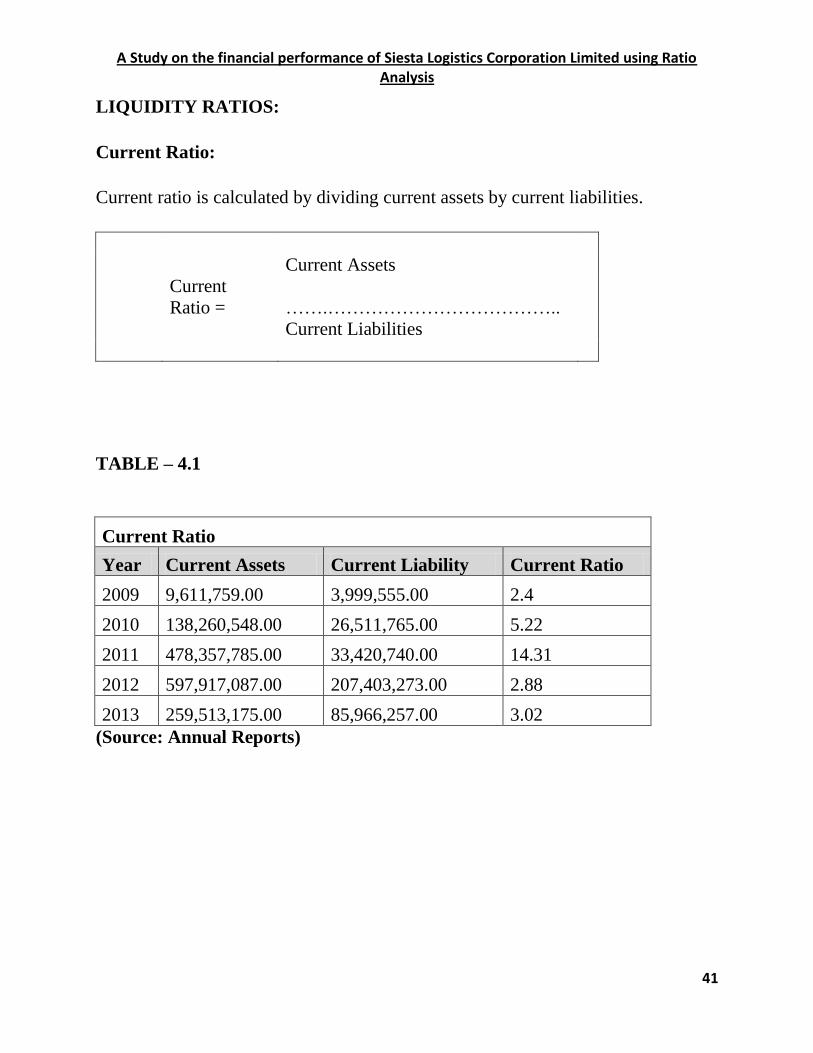
Current Ratio:
Current ratio is calculated by dividing current assets by current liabilities.
Current Assets
Current
Ratio = …….………………………………..
Current Liabilities
TABLE – 4.1
Current Ratio
Year Current Assets Current Liability Current Ratio
2009 9,611,759.00 3,999,555.00 2.4
2010 138,260,548.00 26,511,765.00 5.22
2011 478,357,785.00 33,420,740.00 14.31
2012 597,917,087.00 207,403,273.00 2.88
2013 259,513,175.00 85,966,257.00 3.02
(Source: Annual Reports)
A Study on the financial performance of Siesta Logistics Corporation Limited using Ratio Analysis
42
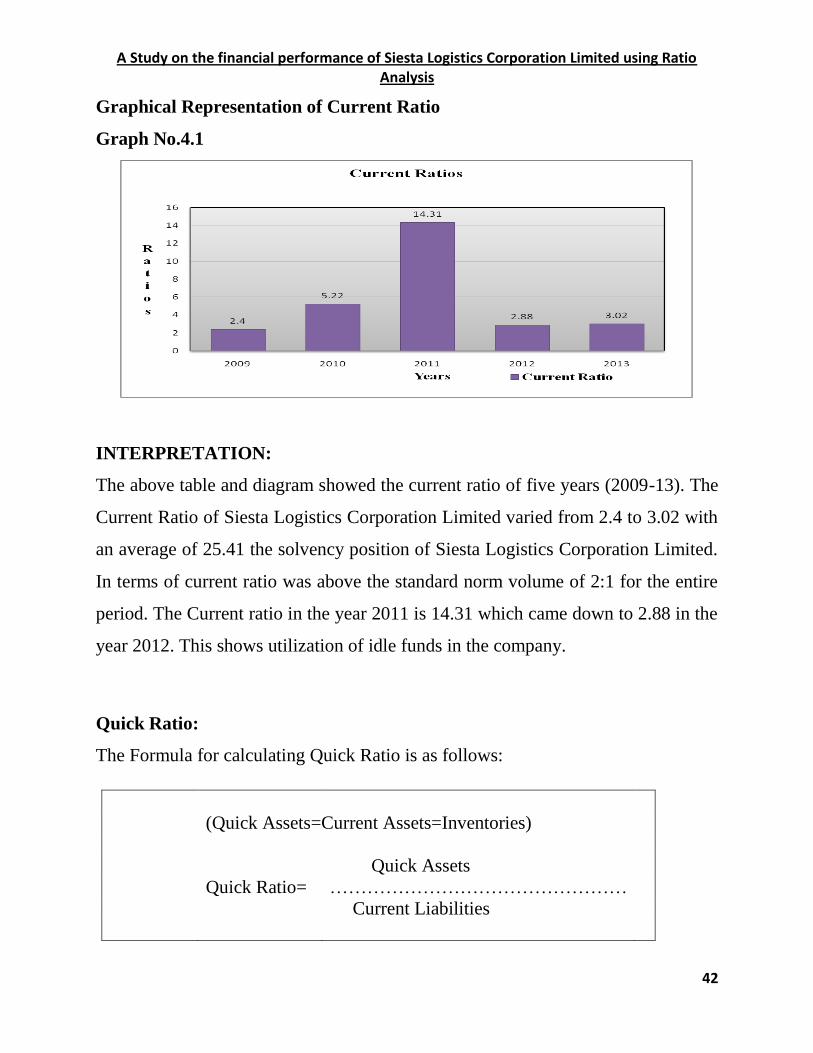
Graphical Representation of Current Ratio
Graph No.4.1
INTERPRETATION:
The above table and diagram showed the current ratio of five years (2009-13). The
Current Ratio of Siesta Logistics Corporation Limited varied from 2.4 to 3.02 with
an average of 25.41 the solvency position of Siesta Logistics Corporation Limited.
In terms of current ratio was above the standard norm volume of 2:1 for the entire
period. The Current ratio in the year 2011 is 14.31 which came down to 2.88 in the
year 2012. This shows utilization of idle funds in the company.
Quick Ratio:
The Formula for calculating Quick Ratio is as follows:
(Quick Assets=Current Assets=Inventories)
Quick Assets
Quick Ratio= …………………………………………
Current Liabilities
A Study on the financial performance of Siesta Logistics Corporation Limited using Ratio Analysis
43
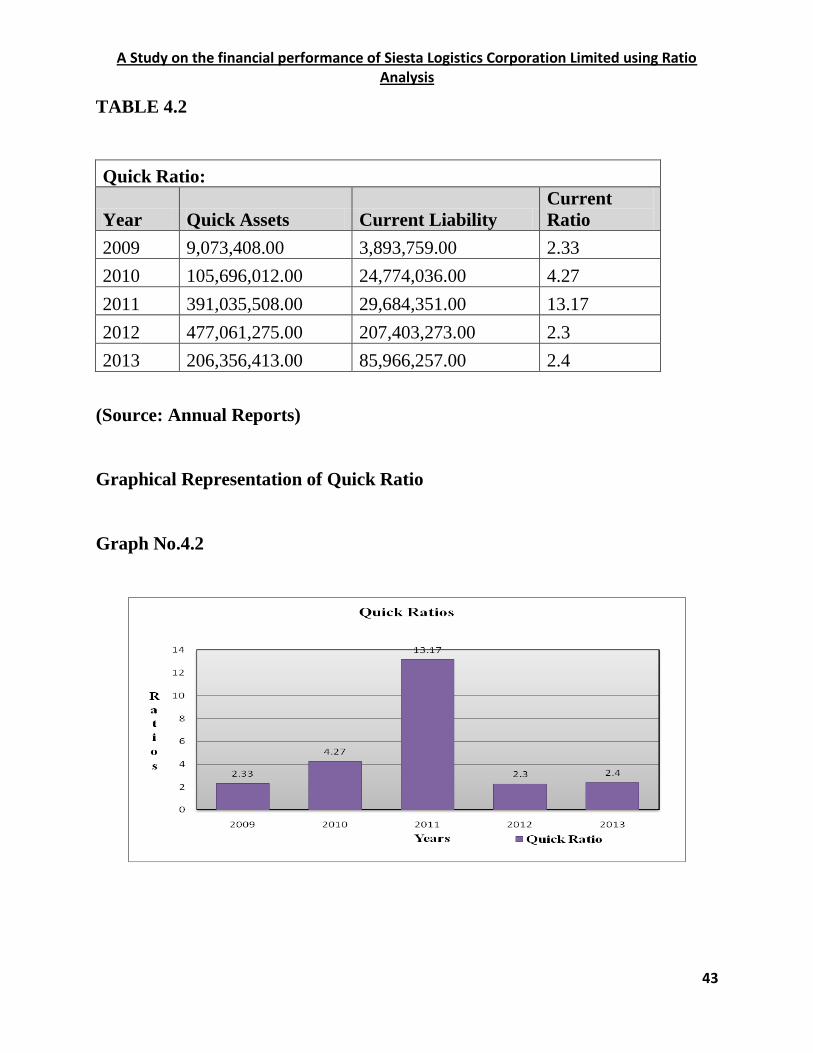
TABLE 4.2
Quick Ratio:
Year Quick Assets Current Liability
Current
Ratio
2009 9,073,408.00 3,893,759.00 2.33
2010 105,696,012.00 24,774,036.00 4.27
2011 391,035,508.00 29,684,351.00 13.17
2012 477,061,275.00 207,403,273.00 2.3
2013 206,356,413.00 85,966,257.00 2.4
(Source: Annual Reports)
Graphical Representation of Quick Ratio
Graph No.4.2

A Study on the financial performance of Siesta Logistics Corporation Limited using Ratio Analysis
44
INTERPRETATION:
The above table and diagram shows the Quick Ratio of five years (2009-2013). As
per the annual reports the ideal Ratio is not 1:1 in any financial year. The high
Quick Ratio indicates that the firm has the ability to meet its current liabilities. It
confirms that the liquidity position of Siesta Logistics Corporation Ltd. In terms of
quick ratio were more than the above standards.
Cash Ratio:
The Formula for calculating Cash Ratio is as follows:
Cash + Marketable Securities
Cash Ratio = …….………………………………..
Current Liabilities
TABLE – 4.3
Cash Ratio:
Year
(Cash + Marketable
Securities) Current Liability Current Ratio
2009 407,457.00 3,893,759.00 0.1
2010 3,690,318.00 24,774,036.00 0.15
2011 138,788,265.00 29,684,351.00 4.68
2012 477,061,275.00 207,403,273.00 2.3
2013 206,356,413.00 85,966,257.00 2.4
(Source: Annual Reports)
A Study on the financial performance of Siesta Logistics Corporation Limited using Ratio Analysis
45
Graphical Representation of Cash Ratio
Graph No.4.3
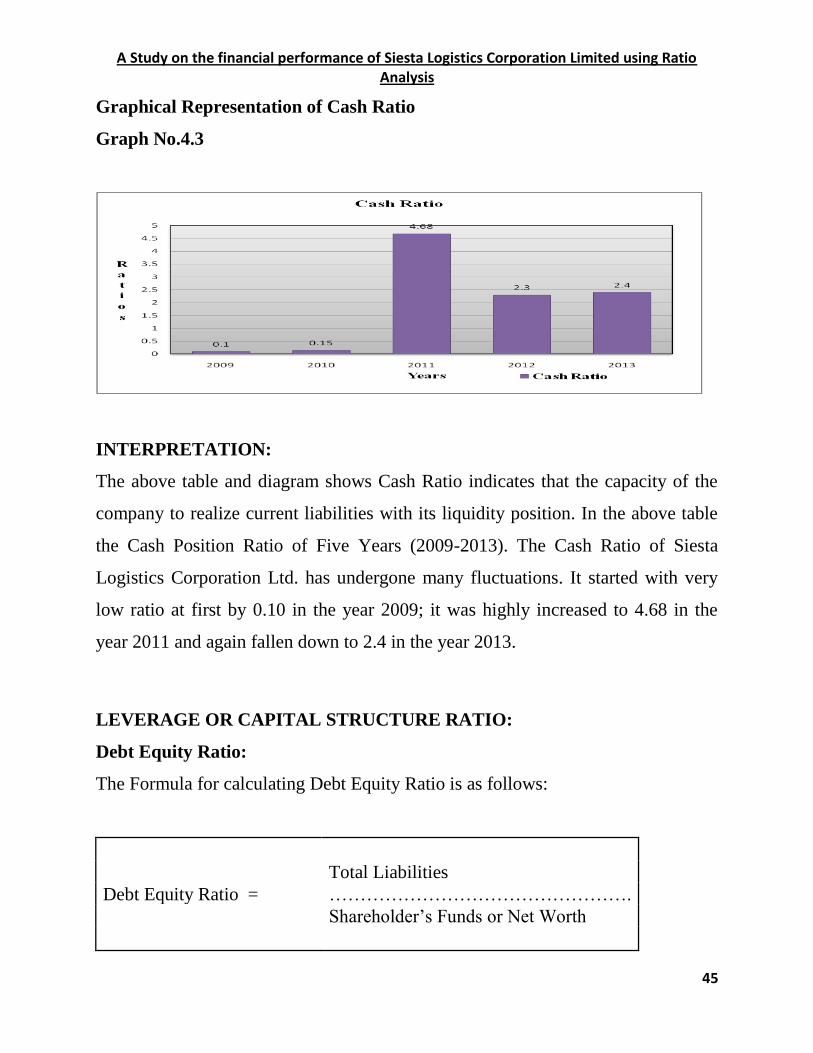
INTERPRETATION:
The above table and diagram shows Cash Ratio indicates that the capacity of the
company to realize current liabilities with its liquidity position. In the above table
the Cash Position Ratio of Five Years (2009-2013). The Cash Ratio of Siesta
Logistics Corporation Ltd. has undergone many fluctuations. It started with very
low ratio at first by 0.10 in the year 2009; it was highly increased to 4.68 in the
year 2011 and again fallen down to 2.4 in the year 2013.
LEVERAGE OR CAPITAL STRUCTURE RATIO:
Debt Equity Ratio:
The Formula for calculating Debt Equity Ratio is as follows:
Total Liabilities
Debt Equity Ratio = ………………………………………….
Shareholder‟s Funds or Net Worth

A Study on the financial performance of Siesta Logistics Corporation Limited using Ratio Analysis
46
Shareholders‟ Fund includes Share Capital, Reserves and P & L A/c
TABLE – 4.4
Debt Equity Ratio
Year Total Liability
Shareholders'
Fund Debt Equity Ratio
2009 3,999,555.00 621,067.00 6.44
2010 26,511,765.00 3,831,775.00 6.92
2011 33,420,740.00 407,431,187.00 0.08
2012 207,403,273.00 424,727,372.00 0.49
2013 85,966,257.00 179,156,303.00 0.48
(Source: Annual Reports)
Graphical Representation of Debt Equity Ratio
Graph No- 4.4
A Study on the financial performance of Siesta Logistics Corporation Limited using Ratio Analysis
47
INTERPRETATION:
This Ratio is calculated to assess the ability of the firm to meet its long term
liabilities. Generally, debt equity ratio of is considered safe. The standard norm for
the ratio is 2:1. The actual debt-equity ratio in the above table shows, the first two
years less than the standard ratio after the ratio has decreased from 6.44 in 2009 to
0.08 in 2011 and again raises to 0.49 and 0.48 in the 2012 and 2013 respectively.
This indicates from the study that the firm tries to reduce the debt and reducing
financial risk of the firm when both ratios of the year 2009 and 2013 are compared.
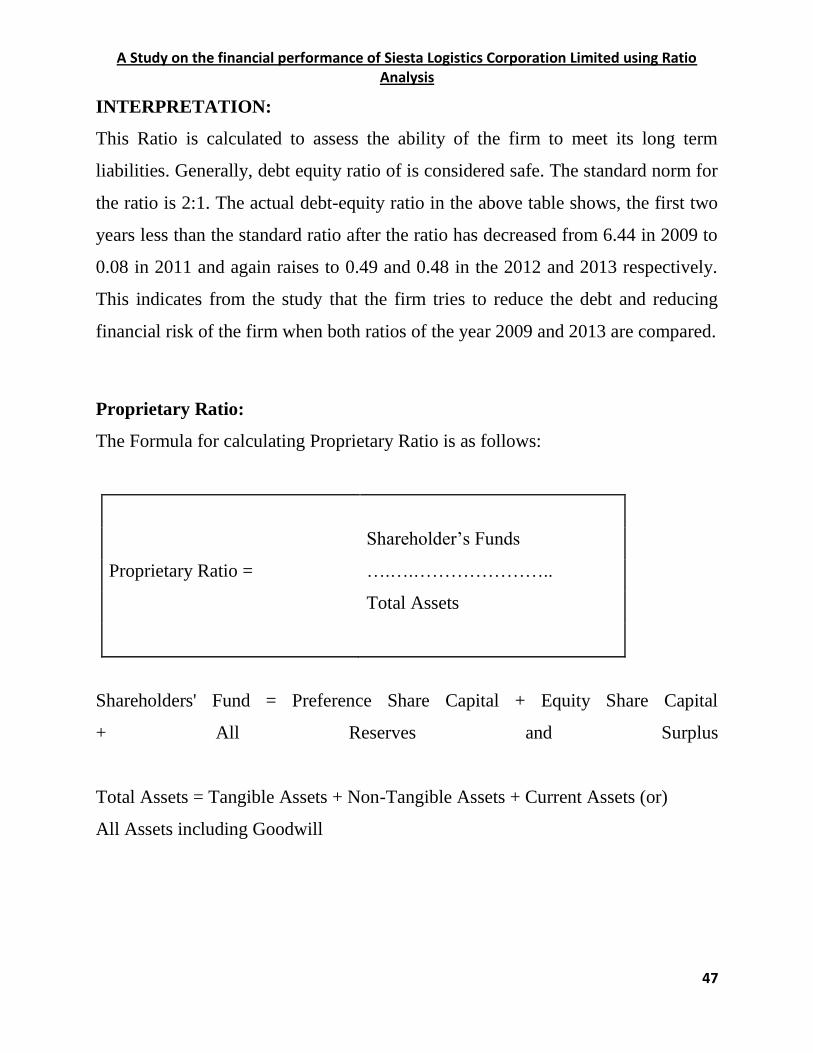
Proprietary Ratio:
The Formula for calculating Proprietary Ratio is as follows:
Shareholder‟s Funds
Proprietary Ratio = ….….…………………..
Total Assets
Shareholders' Fund = Preference Share Capital + Equity Share Capital
+ All Reserves and Surplus
Total Assets = Tangible Assets + Non-Tangible Assets + Current Assets (or)
All Assets including Goodwill

A Study on the financial performance of Siesta Logistics Corporation Limited using Ratio Analysis
48
TABLE – 4.5
Proprietary Ratio
Year
Shareholders'
Fund Total Assets
Proprietary
Ratio
2009 621,067.00 10,556,873.00 0.06
2010 3,831,775.00 150,725,802.00 0.03
2011 407,431,187.00 492,987,127.00 0.83
2012 424,727,372.00 638,489,824.00 0.67
2013 179,156,303.00 304,920,525.00 0.59
(Source: Annual Reports)
Graphical Representation of Proprietary Ratio
Graph No- 4.5
A Study on the financial performance of Siesta Logistics Corporation Limited using Ratio Analysis
49
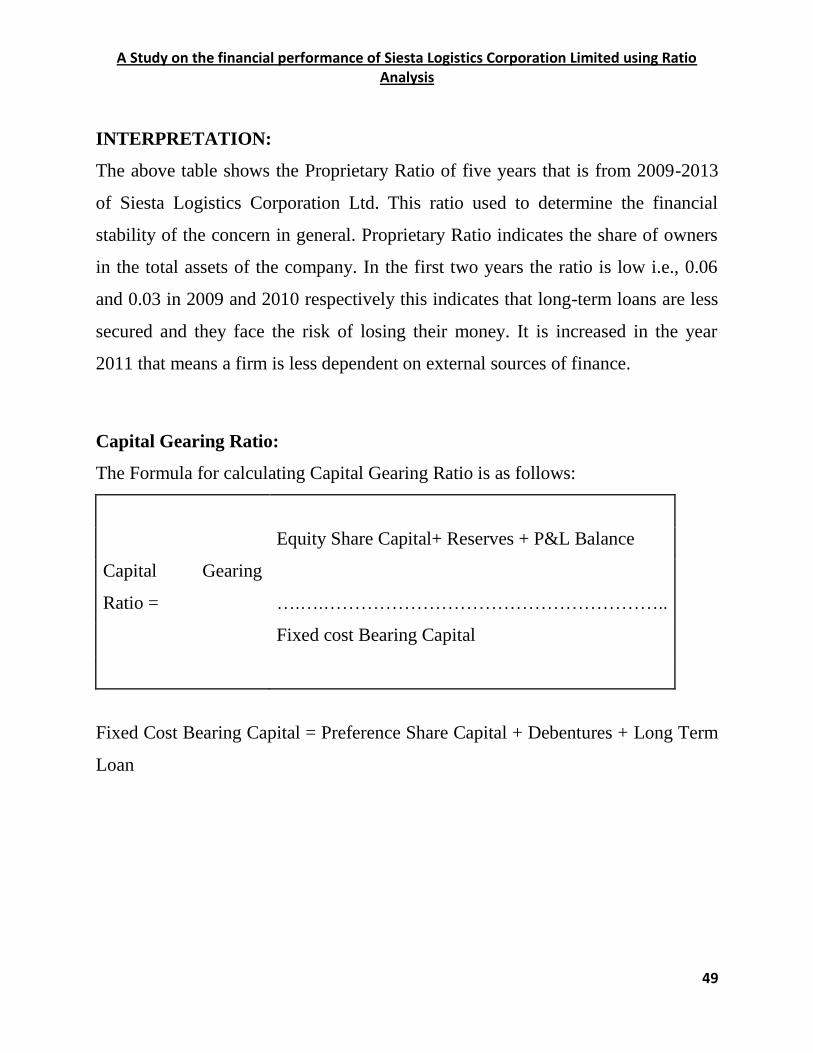
INTERPRETATION:
The above table shows the Proprietary Ratio of five years that is from 2009-2013
of Siesta Logistics Corporation Ltd. This ratio used to determine the financial
stability of the concern in general. Proprietary Ratio indicates the share of owners
in the total assets of the company. In the first two years the ratio is low i.e., 0.06
and 0.03 in 2009 and 2010 respectively this indicates that long-term loans are less
secured and they face the risk of losing their money. It is increased in the year
2011 that means a firm is less dependent on external sources of finance.
Capital Gearing Ratio:
The Formula for calculating Capital Gearing Ratio is as follows:
Equity Share Capital+ Reserves + P&L Balance
Capital Gearing
Ratio = ….….………………………………………………..
Fixed cost Bearing Capital
Fixed Cost Bearing Capital = Preference Share Capital + Debentures + Long Term
Loan

A Study on the financial performance of Siesta Logistics Corporation Limited using Ratio Analysis
50
TABLE – 4.6
Capital Gearing Ratio
Year
Equity share
capital+Reserves+P&L
A/c
Fixed cost
Bearing Capital
Capital
Gearing
Ratio
2009 621,067.00 6,088,961.00 0.1
2010 3,831,775.00 120,006,810.00 0.03
2011 407,431,187.00 64,049,237.00 6.36
2012 424,727,372.00 27,321,811.00 15.55
2013 179,156,303.00 201,478,612.00 0.89
(Source: Annual Reports)
Graphical Representation of Capital Gearing Ratio
Graph No- 4.6
0.1 0.03
6.36
15.55
0.89
0
2
4
6
8
10
12
14
16
18
2009 2010 2011 2012 2013
R
a
t
i
o
s
Years
Capital Gearing Ratio
Capital Gearing…

A Study on the financial performance of Siesta Logistics Corporation Limited using Ratio Analysis
51
INTERPRETATION:
The above table shows the Capital Gearing Ratio of five (2009-2013).Capital
Gearing Ratio of Siesta Logistics Corporation Ltd. If the amount of fixed cost
bearing capital is more than (the equity share capital including reserves an
undistributed profits), it will be called high capital gearing and if it is less, it will
be called low capital gearing. In the year 2009, 2010 and 2013 the ratio is 0.1, 0.03
and 0.89it shows the company is facing high capital gearing. In the year 2011 and
2012 the ratio is 6.36 and 15.55 it shows the company is facing low capital
gearing.
ACTIVITY RATIO OR TURNOVER RATIO
Average Collection Period:
The Formula for calculating Average Collection Period is as follows Formula is:
Debtors + Bills Receivable
Average Collection
Period = ………………………………
Credit Sales per day
Here, Credit Sales per day= Net Credit Sales of the year/365

A Study on the financial performance of Siesta Logistics Corporation Limited using Ratio Analysis
52
TABLE – 4.7
Average Collection Period
Year
Debtors + Bills
Receivable
Credit Sales
per day
Average Collection
Period
2009 86,65,951.00 23,742.33 3.65
2010 10,20,05,694.00 52,376.47 19.48
2011 25,22,47,243.00 2,26,980.12 11.11
2012 37,83,60,320.00 31,717.06 119.29
2013 19,98,98,640.00 25,190.64 79.35
(Source: Annual Reports)
Graphical Representation of Average Collection Period
Graph No- 4.7
3.65
19.48 11.11
119.29
79.35
0.00
20.00
40.00
60.00
80.00
100.00
120.00
140.00
2009 2010 2011 2012 2013
R
a
t
i
o
s
Years
Average Collection Period
Average Collection Period

A Study on the financial performance of Siesta Logistics Corporation Limited using Ratio Analysis
53
INTERPRETATION:
The above table and diagram shows the relationship between Debtors + Bills
Receivable and Credit Sales per day. In the year 2009, 2010, 2011, 2012 and 2013
the Average Collection Period of the company in the year 2009 the ratio is 3.65
and the ratios goes to 19.48 in the year 2010 the ratio decreases in 2011 to
11.11and again ratio increases to 119.29 in 2012 from 119.29 comes down to 79.35
in the year 2013.
Fixed Assets Turnover Ratio:
The Formula for calculating Fixed Assets Turnover Ratio is as follows Formula is:
Cost of Goods Sold
Fixed Assets Turnover
Ratio= …………………………………..
Net Fixed Assets
Here, Net Fixed Assets = Fixed Assets – Depreciation

A Study on the financial performance of Siesta Logistics Corporation Limited using Ratio Analysis
54
TABLE – 4.8
Fixed Assets Turnover Ratio
Year
Cost of Goods
Sold
Net Fixed
Assets
Fixed Assets Turnover
Ratio
2009 (17,635.00) 1,07,337.00 -0.16
2010 1,41,53,984.00 10,80,322.00 13.10
2011 7,19,33,592.00 35,45,677.00 20.29
2012 84,15,71,444.00 4,45,86,237.00 18.88
2013 44,17,34,481.00 4,94,20,850.00 8.94
(Source: Annual Reports)
Graphical Representation of Fixed Assets Turnover Ratio
Graph No- 4.8

A Study on the financial performance of Siesta Logistics Corporation Limited using Ratio Analysis
55
INTERPRETATION:
The above table and diagram shows the relationship between costs of goods sold
and Net Fixed Assets. In the year 2009 - 0.16 the company has not utilized the
fixed assets. In the year 2010 the ratio has been increased to 13.10 and in the year
2011 the sales has been increased a lot. It shows that a sale is 4 times more than
fixed assets. 20.29 again decrease to 18.88 and 8.94 in the year 2012 and 2013.
Working Capital Turnover Ratio:
The Formula for calculating Working Capital Turnover Ratio is as follows
Formula is:
Cost of Goods Sold
Working Capital
Turnover Ratio= …………………………………..
Working Capital
Here, Cost of Goods Sold = Opening Stock + Purchases + Carriage + Wages
+ Other Direct Expenses – Closing Stock
Working Capital = Current Assets – Current Liabilities

A Study on the financial performance of Siesta Logistics Corporation Limited using Ratio Analysis
56
TABLE – 4.9
Working Capital Turnover Ratio
Year
Cost of Goods
Sold
Working
Capital
Working Capital Turnover
Ratio
2009 (17,635.00) 51,79,649.00 0.00
2010 1,41,53,984.00 8,09,21,976.00 0.17
2011 7,19,33,592.00 36,13,51,157.00 0.20
2012 84,15,71,444.00 26,96,58,002.00 3.12
2013 44,17,34,481.00 12,03,90,156.00 3.67
(Source: Annual Reports)
Graphical Representation of Working Capital Turnover Ratio
Graph No- 4.9
A Study on the financial performance of Siesta Logistics Corporation Limited using Ratio Analysis
57
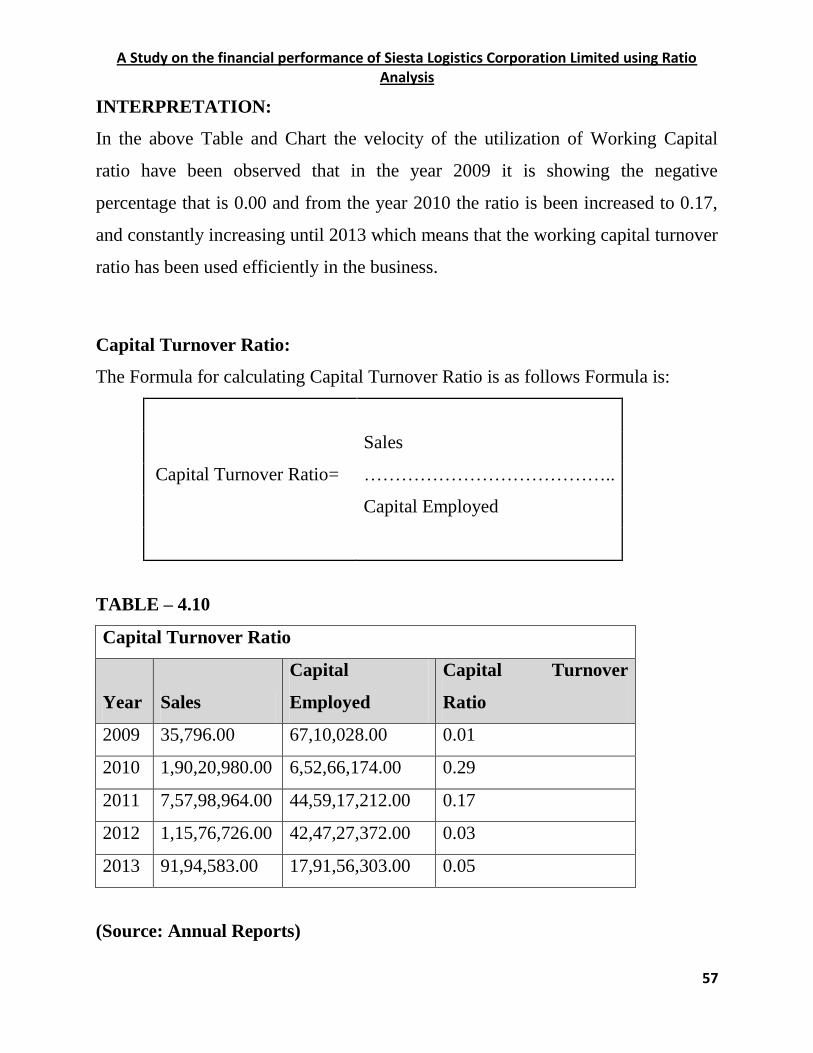
INTERPRETATION:
In the above Table and Chart the velocity of the utilization of Working Capital
ratio have been observed that in the year 2009 it is showing the negative
percentage that is 0.00 and from the year 2010 the ratio is been increased to 0.17,
and constantly increasing until 2013 which means that the working capital turnover
ratio has been used efficiently in the business.
Capital Turnover Ratio:
The Formula for calculating Capital Turnover Ratio is as follows Formula is:
Sales
Capital Turnover Ratio= …………………………………..
Capital Employed
TABLE – 4.10
Capital Turnover Ratio
Year Sales
Capital
Employed
Capital Turnover
Ratio
2009 35,796.00 67,10,028.00 0.01
2010 1,90,20,980.00 6,52,66,174.00 0.29
2011 7,57,98,964.00 44,59,17,212.00 0.17
2012 1,15,76,726.00 42,47,27,372.00 0.03
2013 91,94,583.00 17,91,56,303.00 0.05
(Source: Annual Reports)

A Study on the financial performance of Siesta Logistics Corporation Limited using Ratio Analysis
58
Graphical Representation of Capital Turnover Ratio
Graph No- 4.10
INTERPRETATION:
The above table and diagram shows the relationship between sales and capital
employed. In the year 2009 it was 0.01 and it increases to 0.29 in the year 2010
then it decreases to 0.17 in the year 2011 again decreases to 0.03 in the year 2012
and the year 2013 it increases to 0.05 .It shows that picture of capital turnover ratio
indicating that the company is striving to make a profit and sales out of the capital
which it is employing.

A Study on the financial performance of Siesta Logistics Corporation Limited using Ratio Analysis
59
Total Assets Turnover Ratio:
The Formula for calculating Total Assets Turnover Ratio is as follows Formula is:
Sales
Total Assets Turnover
Ratio = …………………………………..
Total Assets
TABLE – 4.11
Total Assets Turnover Ratio
Year Sales Total assets
Net Assets Turnover
Ratio
2009 1,21,13,071.00 1,05,56,873.00 1.15
2010 1,90,20,980.00 15,07,25,802.00 0.13
2011 7,57,98,964.00 49,29,87,127.00 0.15
2012 86,75,74,447.00 64,25,03,324.00 1.35
2013 68,78,19,247.00 30,89,34,025.00 2.23
(Source: Annual Reports)

A Study on the financial performance of Siesta Logistics Corporation Limited using Ratio Analysis
60
Graphical Representation of Total Assets Turnover Ratio
Graph No- 4.11
INTERPRETATION:
The above table and diagram shows the relationship between sales and total assets.
Total Assets Turnover Ratio of the company is rotating their assets into business
purpose. It shows that the company can rotate the total assets in the business. In the
year 2009 is 1.15 and again decreases to 0.13 in the year 2010 from 2011 the
relationship between sales and total assets is very high and goes in a good flow in
2013 is 2.23.

A Study on the financial performance of Siesta Logistics Corporation Limited using Ratio Analysis
61
Current Assets Turnover Ratio:
The Formula for calculating Current Assets Turnover Ratio is as follows Formula
is:
Sales
Current Assets Turnover
Ratio = …………………………………..
Current Assets
TABLE – 4.12
Current Assets Turnover Ratio
Year Sales Current Assets
Net Assets Turnover
Ratio
2009 1,21,13,071.00 96,11,759.00 1.26
2010 1,90,20,980.00 13,82,60,548.00 0.14
2011 7,57,98,964.00 47,83,57,785.00 0.16
2012 86,75,74,447.00 59,79,17,087.00 1.45
2013 68,78,19,247.00 25,95,13,175.00 2.65
(Source: Annual Reports)

A Study on the financial performance of Siesta Logistics Corporation Limited using Ratio Analysis
62
Graphical Representation of Current Assets Turnover Ratio
Graph No- 4.12
INTERPRETATION:
The above table and diagram shows the relationship between sales and Current
Assets. Total Assets Turnover Ratio of the company is rotating their assets into
business purpose. It was highly purchased current assets by the end of the year
2009, 2012 and 2013. Current assets turnover ratio was 1.26, 0.14, 0.16, 1.45and
2.65 in respective years of 2009, 2010, 2011, 2012 and 2013 so the company
achieved maximum Current assets turnover ratio in the year 2013 is 2.65.

A Study on the financial performance of Siesta Logistics Corporation Limited using Ratio Analysis
63
PROFITABILITY RATIO OR INCOME RATIO
PROFITABILITY RATIO BASED ON SALES
Gross Profit Ratio:
The Formula for calculating Gross Profit Ratio is as follows Formula is:
Gross Profit
Gross Profit Ratio = ……………………… * 100
Net Sales
Here, Net sales = Sales – Sales Return
TABLE – 4.13
Gross Profit Ratio
Year Gross Profit Net Sales Gross Profit Ratio
2009 53,431.00 1,20,77,275.00 0.44
2010 48,66,996.00 22,66,55,598.00 2.15
2011 38,65,372.00 65,60,80,452.00 0.59
2012 2,60,03,003.00 1,04,39,71,057.00 2.49
2013 24,60,84,766.00 65,14,37,853.00 37.78
(Source: Annual Reports)

A Study on the financial performance of Siesta Logistics Corporation Limited using Ratio Analysis
64
Graphical Representation of Gross Profit Ratio
Graph No- 4.13
INTERPRETATION:
The above table and diagram shows the profit earned by the company before tax
and interest payable. This ratio measures the margin of profit available on sales.
The higher the gross profit ratio, the better it is. In the year 2009 the profit ratio
was very less 0.44 and its been increased to 2.15 in the year 2010 again decreases
to 0.59 in 2011 but in the year 2013 it was highly increased to 37.78.

A Study on the financial performance of Siesta Logistics Corporation Limited using Ratio Analysis
65
Net Profit Ratio:
The Formula for calculating Net Profit Ratio is as follows Formula is:
Net Profit
Net Profit Ratio =
……………………………*
100
Net Sales
TABLE – 4.14
Net Profit Ratio
Year Net Profit Net Sales Net Profit Ratio
2009 1,21,067.37 1,20,77,275.00 1.00
2010 33,31,775.00 22,66,55,598.00 1.47
2011 55,98,545.00 65,60,80,452.00 0.85
2012 1,72,96,185.00 1,04,39,71,057.00 1.66
2013 24,55,71,070.00 65,14,37,853.00 37.70
(Source: Annual Reports)

A Study on the financial performance of Siesta Logistics Corporation Limited using Ratio Analysis
66
Graphical Representation of Net Profit Ratio
Graph No- 4.14
INTERPRETATION:
The above table and diagram shows the relationship between net profit and sales.
Net profit ratio was 1.00, 1.47, 0.85, 1.66, and 37.70 in respective year of 2009,
2010, 2011, 2012 and 2012 so the company achieved maximum Net profit ratio in
the year 2013 ratio is 37.70 .
1.00 1.47 0.85 1.66
37.70
0.00
5.00
10.00
15.00
20.00
25.00
30.00
35.00
40.00
2009 2010 2011 2012 2013
R
a
t
i
o
s
Years
Net Profit Ratio
Net Profit Ratio

A Study on the financial performance of Siesta Logistics Corporation Limited using Ratio Analysis
67
Operating Ratio:
The Formula for calculating Operating Ratio is as follows Formula is:
Cost of Goods Sold + Operating
Expenses
Operating Ratio
=
………………………………………
….. * 100
Net Sales
TABLE – 4.15
Operating Ratio
Year
Cost of Goods
Sold+ Operating
Expenses Net Sales
Operating
Ratio
2009 1,19,53,384.00 1,20,77,275.00 98.97
2010 25,18,99,397.00 22,66,55,598.00 111.14
2011 79,01,99,840.00 65,60,80,452.00 120.44
2012 1,48,85,95,462.00 1,04,39,71,057.00 142.59
2013 58,07,51,452.00 65,14,37,853.00 89.15
(Source: Annual Reports)

A Study on the financial performance of Siesta Logistics Corporation Limited using Ratio Analysis
68
Graphical Representation of Operating Ratio
Graph No- 4.15
INTERPRETATION:
The above table and diagram shows the higher ratio which indicates that the
company is not able to maintain their operational efficiency but in the year 2013 it
shows that the firm is slowly moving towards the level of operational efficiency
which is a sign for the company.
98.97
111.14 120.44
142.59
89.15
0.00
20.00
40.00
60.00
80.00
100.00
120.00
140.00
160.00
2009 2010 2011 2012 2013
R
a
t
i
o
s
Years
Operating Ratio
Operating Ratio

A Study on the financial performance of Siesta Logistics Corporation Limited using Ratio Analysis
69
Expenses Ratio:
The Formula for calculating Expenses Ratio is as follows Formula is:
Direct Expense
Expenses Ratio
=
……………………………
… * 100
Net Sales
TABLE – 4.16
Expenses Ratio
Year Direct Expense Net Sales Expenses Ratio
2009 85,13,170.00 1,20,77,275.00 70.49
2010 21,05,77,246.00 22,66,55,598.00 92.91
2011 54,48,50,782.00 65,60,80,452.00 83.05
2012 4,56,35,947.00 1,04,39,71,057.00 4.37
2013 11,53,09,010.00 65,14,37,853.00 17.70
(Source: Annual Reports)
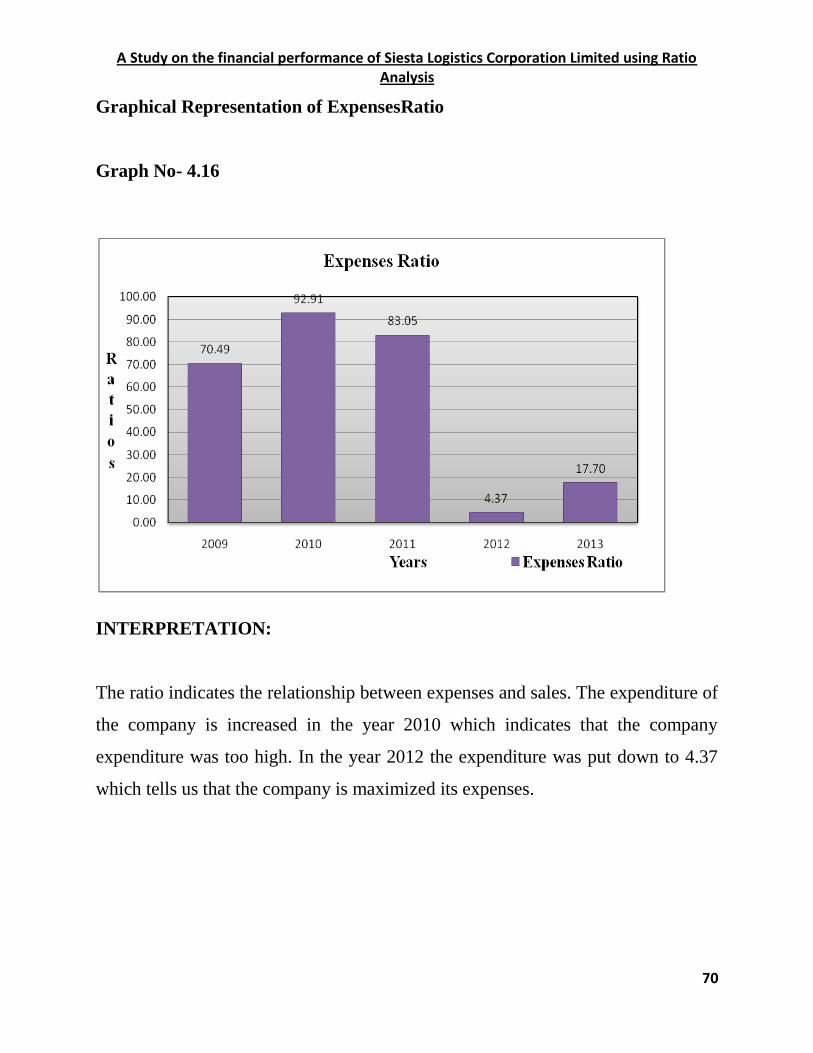
A Study on the financial performance of Siesta Logistics Corporation Limited using Ratio Analysis
70
Graphical Representation of ExpensesRatio
Graph No- 4.16
INTERPRETATION:
The ratio indicates the relationship between expenses and sales. The expenditure of
the company is increased in the year 2010 which indicates that the company
expenditure was too high. In the year 2012 the expenditure was put down to 4.37
which tells us that the company is maximized its expenses.

A Study on the financial performance of Siesta Logistics Corporation Limited using Ratio Analysis
71
PROFITABILITY RATIO BASED ON INVESTMENT
Return on Total Assets:
The Formula for calculating Return on Total Assets is as follows Formula is:
Net Profit * 100
Return on Total Assets = ……………………………
Total Assets
TABLE – 4.17
Return on Total Assets
Year Net Profit Total assets
Return on Total
Assets
2009 1,21,067.37 1,05,56,873.00 1.15
2010 33,31,775.00 15,07,25,802.00 2.21
2011 55,98,545.00 49,29,87,127.00 1.14
2012 1,72,96,185.00 64,25,03,324.00 2.69
2013 24,55,71,070.00 30,89,34,025.00 79.49
(Source: Annual Reports)

A Study on the financial performance of Siesta Logistics Corporation Limited using Ratio Analysis
72
Graphical Representation of Return on Total Assets
Graph No- 4.17
INTERPRETATION:
The above table and diagram shows the relationship between net profit and total
assets in percentage. As total assets were increasing in 2009 and 2010 the ratio is
1.15 to 2.21 again decreases from 2.21 to 1.14 in the year 2011 and from the year
2012 the ratio started increasing from 1.14 to 2.69 in 2012 and 79.49 in 2013 . The
net profit in the year 2011 is very less but in the year 2013 is very high.

A Study on the financial performance of Siesta Logistics Corporation Limited using Ratio Analysis
73
Return on Capital Employed:
The Formula for calculating Return on Capital Employed is as follows Formula is:
Profit Before Interest, Tax and
Dividends
Return on Capital
Employed =
……………………………………
……. * 100
Capital Employed
TABLE – 4.18
Return on Capital Employed
Year
Profit Before
Interest, Tax and
Dividends
Capital
Employed
Return on Capital
Employed
2009 53,431.00 67,10,028.00 0.80
2010 48,66,996.00 6,52,66,174.00 7.46
2011 38,65,372.00 44,59,17,212.00 0.87
2012 2,60,03,003.00 42,47,27,372.00 6.12
2013 2,19,81,367.00 17,91,56,303.00 12.27
(Source: Annual Reports)

A Study on the financial performance of Siesta Logistics Corporation Limited using Ratio Analysis
74
Graphical Representation of Return on Capital Employed
Graph No- 4.18
INTERPRETATION:
The above table and diagram shows relationship between net profit earned and
capital employed. In the year 2009 is the profit is only 0.80 but in the year 2010
the profit is increased to 7.46 again the profit went down to 0.87 in the year 2011

A Study on the financial performance of Siesta Logistics Corporation Limited using Ratio Analysis
75
finally in the year 2012 and 2013 the company is gaining the profit of 6.12 and
12.27 in the last two years the company is improving and achieving profit.
Return on Total Shareholder’s Funds:
The Formula for calculating Return on Total Shareholder‟s Funds is as follows
Formula is:
Net Profit After Interest and
Tax
Return on Total Shareholder‟s
Fund =
………………………………
……
Total Shareholder‟s Funds
Where, Total Shareholder‟s Funds = Equity Share Capital + Preferences
Share Capital + All Reserved +P&L Account Balance – Fictitious Assets
TABLE – 4.19
Return on Total Shareholder’s Fund
Year
Net Profit After
Interest and Tax
Total
Shareholder’s
Funds
Return on Total
Shareholder’s Fund
2009 1,21,067.37 6,21,067.00 0.19
2010 33,31,775.00 38,31,775.00 0.87
2011 55,98,545.00 40,74,31,187.00 0.01
2012 1,72,96,185.00 42,47,27,372.00 0.04
2013 24,55,71,070.00 17,91,56,303.00 1.37

A Study on the financial performance of Siesta Logistics Corporation Limited using Ratio Analysis
76
(Source: Annual Reports)
Graphical Representation of Return on Total Shareholder’s Fund
Graph No- 4.19
INTERPRETATION:
The above table and diagram shows relationship between net profits earned and
Total Shareholder‟s Funds. This ratio reveals how profitability the proprietor‟s
funds have been utilized by the firm. A comparison of this with that of similar
firms will throw light on the relative profitability and strength of the firm. In the
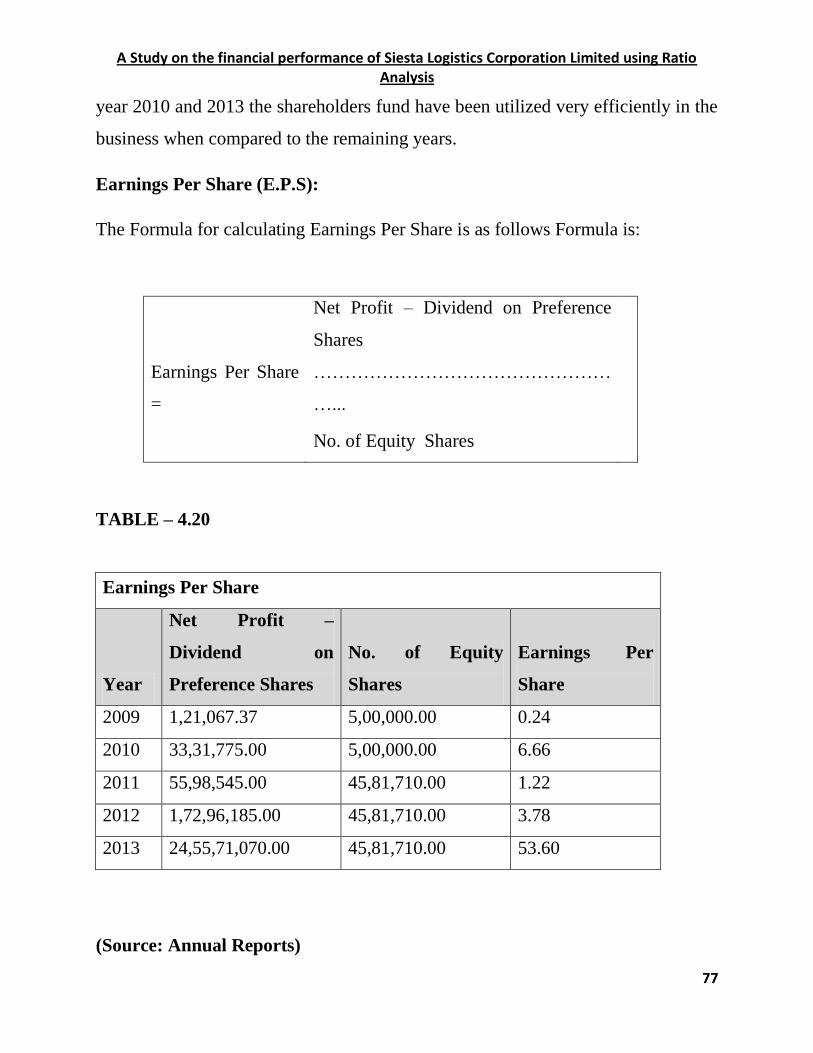
A Study on the financial performance of Siesta Logistics Corporation Limited using Ratio Analysis
77
year 2010 and 2013 the shareholders fund have been utilized very efficiently in the
business when compared to the remaining years.
Earnings Per Share (E.P.S):
The Formula for calculating Earnings Per Share is as follows Formula is:
Net Profit – Dividend on Preference
Shares
Earnings Per Share
=
…………………………………………
…...
No. of Equity Shares
TABLE – 4.20
Earnings Per Share
Year
Net Profit –
Dividend on
Preference Shares
No. of Equity
Shares
Earnings Per
Share
2009 1,21,067.37 5,00,000.00 0.24
2010 33,31,775.00 5,00,000.00 6.66
2011 55,98,545.00 45,81,710.00 1.22
2012 1,72,96,185.00 45,81,710.00 3.78
2013 24,55,71,070.00 45,81,710.00 53.60
(Source: Annual Reports)

A Study on the financial performance of Siesta Logistics Corporation Limited using Ratio Analysis
78
Graphical Representation of Earnings Per Share
Graph No- 4.20
INTERPRETATION:
Earnings per share ratio was 0.24, 6.66, 1.22, 3.78 and 53.60 in respective year of
2009, 2010, 2011, 2012, and 2013 . The share capital is constant in the year 2009
and 2010 again constant from the year 2011 to 2013. In the year 2009 the net profit
is less so the earnings per share are 0.24. Due to the huge increase in net profit the
earnings per share is greatly increased in 2013.

A Study on the financial performance of Siesta Logistics Corporation Limited using Ratio Analysis
79
CHAPTER - 5
Findings, Recommendations
and Conclusion

A Study on the financial performance of Siesta Logistics Corporation Limited using Ratio Analysis
80
FINDINGS
The current ratio is fluctuating every year that is 2.4, 5.22, 14.31, 2.88 and
3.02 during 2011 which indicates a continuous increase in both current
assets and current liabilities.
The quick ratio is also fluctuating throughout the period 2009 – 2013
resulting as 2.33, 4.27, 13.17, 2.3 and 2.4. It confirms that the liquidity
position of Siesta Logistics Corporation Limited. In terms of quick ratio
were more than the above standards.
The cash Ratio of Siesta Logistics Corporation Limited has undergone many
fluctuations. It started with very low ratio at first by 0.10 in the year 2009 it
was highly increased to 4.68 in the year 2011 and again fallen down to 2.4 in
the year 2013.
The debt- equity ratio of the first two years less than the standard ratio after
the ratio has decreased from 6.44 in 2009 to 0.08 in 2011 and again raises to
0.49 and 0.48 in the year 2012 and 2013 respectively.
Proprietary Ratio is increased in the year 2011 that means a firm is less
dependent on external sources of finance.
In the year 2009, 2010 and 2013 the ratio is 0.1, 0.03 and 0.89 it shows the
company is facing high capital gearing. In the year 2011 and 2012 the ratio
is 6.36 and 15.55 it shows the company is facing low capital gearing.
In the year 2009 the stock turnover ratio shows negative balance but from
the year 2010 the stock ratio is showing increasing balance still 2012 which
indicate that the stock has not been used efficiently in sales and again in the
year 2013.

A Study on the financial performance of Siesta Logistics Corporation Limited using Ratio Analysis
81
The Average Collection Period of the company in the year 2009 the ratio is
3.65 and the ratios goes to 19.48 in the year 2010 the ratio decreases in 2011
to 11.11 and again ratio increases to 119.29 in 2012 from 119.29 comes
down to 79.35 in the year 2013.
The fixed assets turnover ratio is increasing from the year 2010 to 2013 that
is 13.10, 20.29, 18.88 and 8.94. It indicates that the company is efficiently
utilizing the fixed assets.
In the year 2009 it is showing the negative percentage that is 0.00 and from
the year 2010 the ratio is been increased to 0.17, and constantly increasing
until 2013 which means that the working capital turnover ratio has been used
efficiently in the business.
The capital turnover ratio is indicating that the company is striving to make a
profit and sales out of the capital which it is employing.
It shows that the company can rotate the total assets in the business. In the
year 2009 is 1.15 and again decreases to 0.13 in the year 2010 from 2011 the
relationship between sales and total assets is very high and goes in a good
flow in 2013 is 2.23.
Current assets turnover ratio was 1.26, 0.14, 0.16, 1.45and 2.65 in respective
years of 2009, 2010, 2011, 2012 and 2013 so the company achieved
maximum Current assets turnover ratio in the year 2013 is 2.65.
Gross profit ratio is been fluctuating every year which tells us that the
company‟s profit is not remaining constant.
Net profit ratio was 1.00, 1.47, 0.85, 1.66, and 37.70 in respective year of
2009, 2010, 2011, 2012 and 2012 so the company achieved maximum Net
profit ratio in the year 2013 ratio is 37.70 .

A Study on the financial performance of Siesta Logistics Corporation Limited using Ratio Analysis
82
The company is not able to maintain their operational efficiency but in the
last year 2013 it shows that the firm is slowly moving towards the level of
operational efficiency which is a sign for the company.
The expenditure is increased in the year 2010 which indicates that the
company expenditure was too high and company is maximized its expenses
in the year 2012.
Total assets were increasing in 2009 and 2010 again decreases in the year
2011 and from the year 2012 the ratio started increasing.
Though the company is not increased its profit in the year 2009 and 2011, it
is managed to make profit in rest of years which means that the company is
improving and achieving its target.
The company is utilized its shareholders fund to the maximum extent in the
year 2010 and 2013.
The share capital is constant in the year 2009 and 2010 again constant from
the year 2011 to 2013. In the year 2009 the net profit is less so the earnings
per share are 0.24. Due to the huge increase in net profit the earnings per
share is greatly increased in 2013.
RECOMMENDATIONS
Siesta Logistics Corporation Limited is enjoying liberal credit facilities from
its suppliers. It should continue to take advantage of high creditor‟s
payment.
The ERP system already established in the division should be strictly
monitored. One committee is required to be setup with the representative of
all departments and the committee should review the function of the system
regularly.

A Study on the financial performance of Siesta Logistics Corporation Limited using Ratio Analysis
83
There is a gradual increase in the value of slow moving and non-moving
items. Hence efforts should be made to reduce the size of inventory by
analyzing the slow &nonmoving items and disposing them periodically.
The company should make an effort to increase the return on investment.
The overall performance of the organization is on an average and quite
satisfactory.
Siesta Logistics Corporation Limited should focus its attention on efficient
inventory management. It should evolve such a system that there is efficient
and timely use of inventory.
It is recommended that the company should aim at achieving higher returns
on investment, by better utilization and allocation of funds employed in the
business which in return helps the company to meet its long term objectives.
The operating income and expenses are fluctuating every year. Efficient
monitoring has to be done so that income and expenses standards can be
maintained.
CONCLUSION
The project of Ratio analysis in the service industry is not merely a work of the
project. But a brief knowledge and experience that how to analyze the financial
performance of the firm. The study undertaken has brought in to the light of the
following conclusions. According to this project I came to know that from the
analysis of financial statements it is clear that Siesta Logistics Corporation Limited
the company have been incurring profit during the period of study. So the firm
should focus on getting of huge profits in the coming year by taking care internal
as well as external factors. Gross profit and net profit of the Siesta Logistics
Corporation Limited is fluctuating over the past five years. On an average the
Siesta Logistics Corporation Limited overall performance is quite satisfactory.

A Study on the financial performance of Siesta Logistics Corporation Limited using Ratio Analysis
84
BIBLOGRAPHY
REFERENCES:
Text Books:
• M. Muniraju, K. Ramachandra, Management Accounting,
Himalaya Publishing House, First Edition: 2007.
• Jawaharlal, Cost and Financial Analysis, Himalaya Publishing
House, First Edition: 2007.
• Appannaiah Reddy, Mukund Sharma, Management Accounting,
Himalaya Publishing House, First Edition: 2011.
• J.K. Sachdeva, Research Methodology, Himalaya Publishing
House, First Edition: 2008.
Reports:
• Annual Report of Siesta Logistics Corporation Limited (5 years)
WEBSITES:
www.siestalogistics.com
www.wikepidea.com
www.studyindia.org
www.ratioanalysis.net
http://www.investopedia.com
www.indiainfoline.com
www.moneycontrol.com
www.secuties.com

A Study on the financial performance of Siesta Logistics Corporation Limited using Ratio Analysis
85
ANNEXURE
BALANCE SHEET AS AT 31ST MARCH, 2009 TO 31ST MARCH, 2011
SCHEDUL
E 31-Mar-09 31-Mar-10 31-Mar-11
No. (Rs.) (Rs.) (Rs.)
SOURCES OF
FUND
1.
Shareholders'
Fund
a. Share Capital 1 500,000.00 500,000.00 4,581,710.00
b
.
Reserves and
Surplus 2 121,067.00 3,331,775.00
402,849,477.0
0
2. Loan Funds
a.
Secured
Loans 3 61,434,399.00 38,486,025.00
b
.
Unsecured
Loans 4
6,088,961.0
0 58,572,411.00 25,563,212.00
Deferred Tax
Liability
107,930.00 549,218.00 1,282,820.00
TOTAL
6,817,958.0
0
124,387,803.0
0
472,763,244.0
0
APPLICATION OF
FUNDS
1. Fixed Assets 5
Gross Block
Depreciation
1,052,451.0
0 13,545,576.00 18,175,019.00
Net Block
107,337.00 1,080,322.00 3,545,677.00

A Study on the financial performance of Siesta Logistics Corporation Limited using Ratio Analysis
86
945,114.00 12,465,254.00 14,629,342.00
2. Investments 6 - 6 13,196,857.00
3.
Current Assets, Loans and
Advances
Cash and Bank
Balances 7 407,457.00 3,690,318.00
138,788,265.0
0
Sundry Debtors 8
8,665,951.0
0
102,005,694.0
0
252,247,243.0
0
Loan &
Advances 9 538,351.00 32,564,536.00 87,322,277.00
9,611,759.0
0
138,260,548.0
0
478,357,785.0
0
BALANCE SHEET AS AT 31ST MARCH, 2012 & 31ST MARCH, 2013
NOTE 31-Mar-12 31-Mar-13
No. (Rs.) (Rs.)
Equity And Liabilities
1. Shareholders' Fund
a. Share Capital 2.1 4,581,710.00 4,581,710.00
b. Reserves and Surplus 2.2 420,145,662.00 174,574,593.00
c.
Money received against
share warrants
2. Non-Current Liabilities
a. Long-term Borrowings 2.3 27,321,811.00 201,478,612.00
b.
Differed Tax Liabilities
(Net) 2.4
2,289,638.00 1,775,942.00
c.
Other Long Term
Liabilities - -
d. Long-term Provisions 2.5 1,203,020.00 1,238,011.00
3 Current Liabilities
a. Short-term Borrowing 2.6 126,836,915.00 -

A Study on the financial performance of Siesta Logistics Corporation Limited using Ratio Analysis
87
b. Trade Payables 2.7 58,800,887.00 67,216,976.00
c. Other Current Liabilities 2.8 13,180,037.00 2,596,000.00
d. Short-term Provisions 2.9 8,585,434.00 16,153,281.00
TOTAL 662,945,114.00 469,615,125.00
Assets
1. Non-Current Assets
Fixed Assets
Tangible Assets 2.10 40,572,737.00 45,407,350.00
Intangible Assets
- -
Capital Work-in-progress
4,013,500.00 4,013,500.00
Non-Current Investments 2.11 13,224,971.00 13,224,971.00
Long Term Loans and
Advances 2.12
7,216,819.00 147,456,129.00
2. Current Assets
Trade Receivables 2.13 378,360,320.00 199,898,640.00
Cash and Cash Equivalents 2.14 98,700,955.00 6,457,773.00
Loans and Advances 2.15 120,855,812.00 53,156,762.00
Other Current Assets
TOTAL 662,945,114.00 469,615,125.00