a study on the consumer awareness of food additives … · a study on the consumer awareness of...
TRANSCRIPT
A study on the consumer awareness of food additives in packaged food andtheir effects on health in Abha region, Saudi Arabia.
Sachithananthan V*
Faculty of Public health, College of Applied Medical sciences, King Khalid University, Khamis Mushayat, SaudiArabia
Abstract
Background: This study will be useful to create an awareness of consumers about the packaged food,study consumers’ attitude towards packaged food and their knowledge about health problems arisingfrom use of packaged food among Abha community and the use of this information and food labelinginformation in the purchasing of packaged food.Objectives: To study the socioeconomic background of the study subjects and to study the consumerknowledge and attitude towards use of packaged food.Methods: A validated semi structured questionnaire was prepared to elicit information onsocioeconomic background, knowledge and attitude of consumers towards the use of packaged food. Itwas administered to 407 subjects in three different malls in Abha, Saudi Arabia. The responses werecoded into SPSS 22 software and the Chi square significance was studied among different variables.Results: Within the high income group, 90.3% of the female subjects did not like packaged food(p<0.05) due to the reason that they like fresh food. Also within the low income group, 87% of thefemale subjects within the family members did not like the packaged food, whereas (53.1%) of themale subjects liked the packaged food. The reason may be that packaged foods are expensive. Asignificant (p<0.01) majority of the subjects within the family or individual income, belonging to low(72.2%), average (89.9%) and high income group (87.2%) felt fresh food was better. Overall all thesubjects felt that packaged foods are expensive. Of the total, around 25.1% of the subjects read thelabels sometimes of which female constituted 18.7%. This gender difference was not due to income oreducational level; but may be due to level of exposure. Of the total 89.2% of the subjects disposedwhile 10.8% of the subjects used the expired products. A significant (p<0.05)majority of subjects(54.3%) of the average income group did not find any fungus or adulterants in the packaged food,while 25.8% of the subjects of the same group found adulterants and fungus in the packaged food.From the above results it is evident that education, sex and income levels play an important part inpurchasing attitudes in the use of packaged food.Conclusion: Creating awareness and knowledge about the packaged food will go a long way to educateconsumers on the use of packaged food giving significant importance to the labels.
Keywords: Consumer awareness; Packaged food; Health problems; Like or dislikeAccepted on 05 December, 2017
IntroductionCurrent trends show that increasing technology andconsumption of packaged foods in the diets of modern societylead to increase in the use and need of food additives [1]. Foodadditives are substances that are used in the production,processing, treatment, packaging, transportation or storage offood [2]. It is justified that maintaining food distribution andtransportation would be impossible without the use of foodadditives in the present rapid urbanization and increasingpopulation [3].
Almost all the food additives currently in use have been foundto cause health problems in consumers. This has raised healthconcerns to consumers and government. However, regardlessof the increasing incidence and range of health problems ofadditives in packaged foodstuffs, awareness of consumers isnot as such significant [4]. Despite this, the issue of consumerawareness about usage of food labeling information has
attracted little research attention in developing countries [5]and little is known about consumer expectations and theirresponse to such food label information [6].
Although law permits the use of food additives, excessiveconsumption of these leads to myriad side effects [7]. Increasedconsumption of fast food, high or rich in food preservatives andflavoring agents among adolescents has been directlycorrelated with obesity [8]. High levels of N-nitrosodimethylamine in diet have a possible role in highincidence of gastrointestinal cancers [9]. It has been seen thatthe food preservatives sodium benzoate and propionic acid andcolorant curcumin suppress Th1-type immune response in vitro[10]. Regular soda intake independent of weight status isassociated with asthma among US high school students [11].Research has confirmed a link between attention deficithyperkinetic disorder and food additives [12]. Children aresuffering the most from food additives because they areexposed to food chemicals from infancy and human bodies are
Research Article http://www.alliedacademies.org/food-technology-and-preservation/
J Food Technol Pres 2017 Volume 1 Issue 314
not meant to be exposed to the degree of food chemicals andfood additives that we are currently consuming. Theseadditives may include side effects such as food allergies,increased waist lines, decreased absorption of minerals andvitamins and more [13]. With the current trends of increasedconsumption of packed food in the diet, the incidence andrange of such ill effects has also increased [14]. Studies whichexplore the knowledge and perceptions of the people aboutthese chemicals are necessary as they give inputs for planningintervention strategies [15].
Many surveys conducted have established that the consumersare unaware of the function, role and advantages of suchadditives and that many of them perceived the additives to beunhealthy and therefore approach them negatively [16].Consumers with lower levels of education are more likely totrust government institutions to regulate food additives [17].
People look at food labels for different reasons. But whateverthe reason, many consumers would like to know how to usethis information more effectively and easily. The informationabout nutrition labeling and the health benefits of the food isone of the important factors that influence decision making.The modern package label has taken the responsibility foreducating the consumer about the product by multitasking suchas attracting, promoting and motivating at the point of purchasethrough the information on the label. The labels should beclosely observed for nutrient content declaration on calories,fat, protein, dietary fiber, vitamins and mineral content eitheras percentage daily value or recommended dietary intake (RDI)or per 100 g or 100 ml or per serving size [18]. Low awarenessof food labeling, low level of education, low healthconsciousness, products attributes, food labeling format,influence of media, perceived role of regulatory authorities andnon-availability of consumer guidelines on the use of foodlabeling have been reported by studies from various countriesas factors related to consumers not reading and using foodlabeling information in purchasing food [19].
While compliance with legal requirements is fundamental tofood safety, consumers also have a responsibility in handlingand preparing food to do what is within their own control toprotect themselves. By demanding improved standards,consumers can act as a powerful influence on the food industryas a whole [20].
Important food hazards which affect food safety are microbialhazards, pesticide residue, misuse of additives, chemicalcontaminants including biological toxins and adulteration.Although microbial contamination and chemical hazards havereceived most attention, it is recognized that food adulterationand food fraud should not be neglected considering their role inpublic health [21].
Different people have different food and nutritionalrequirement, choices and preferences. Some people have healthproblems that require a certain amount of nutrients and need toavoid certain types of foods or ingredients. Some foods havespecific instructions for preparation and use; some requirespecific storage conditions, etc. Also the production and expirydate on the label indicates the shelf life of different foods. All
these suggest the need for consumers to be well informed aboutthe above characteristics of packaged food before purchase andthis information is expected to be found on the food label [22].
Rationale of the study
Findings from this study will provide information on:
The awareness of consumers of the health problems arisingfrom use of packaged food among Abha community and theuse of this information in purchasing packaged food. Thisinformation will bring to the attention of the policy makers onthe need to have programs to improve consumer awareness offood labeling information as well as the use of suchinformation in the purchase of food. Also manufactures willunderstand the need to improve food labeling regulations andfood label formats and provide wholesome and uniquepackaged foods to the consumers.
Food purchasing practices and consumer behavior regarding topackaged food.
Objectives of Research• To study the socioeconomic background of the selected
subjects.• To assess the degree of knowledge and awareness on the
use of labeled packaged food.
Review of LiteratureThe literature for this study has been reviewed under thefollowing headings:
• Food additives used in packaged food• Importance of food labeling in packaged food• Consumer awareness of food labeling in packaged food.
Food additives used in packaged food
Food additives are important for our food supply and foodquality and shelf life cannot be maintained without the use offood additives [23]. Their use brings many benefits includinggreater safety and greater choice of food products [24]. Manyfood additives may produce side effects such as food allergies,increased waist lines, and decreased absorption of minerals andvitamins, cancer and more [13]. For a variety of reasons, someconsumers might regard the use of food additives, especiallyartificial ones with suspicion and food additives are consideredunnatural, unhealthy or even a public health risk [25]. Foodpreservatives which enhance the shelf life of various fooditems and flavoring agents which increase the palatability areplentiful in number. Their use in food products is increasingday by day. Some of the commonly used class II foodpreservatives in packed or canned foods include benzoic acid,sulphurous acid, nitrates and nitrites of sodium and potassium,methyl or propyl para hydroxy benzoates, sodium diacetates,propionates of calcium or sodium, lactic acid and its sodium,potassium and calcium salts and acid calcium phosphates [26].
In a study [27], it was found that there was a significantcorrelation between having sufficient knowledge about food
Sachithananthan
J Food Technol Pres 2017 Volume 1 Issue 315
additives and the profession of respondents. Also a significantrelationship existed between education of respondents andknowledge of food additives. In another study [15], it wasfound that only 40.6% of the subjects were aware of foodpreservatives and 49.6% had good knowledge about flavoringagents. The gaps in the knowledge need to be addressed bypublic awareness campaigns.
Importance of food labeling in packaged food
Nutrition labeling refers to the standardized presentation of thefood. The food label is one of the most important and directmeans of communicating the product information betweenbuyers and sellers. The Codex guidelines insist that a foodlabel should contain energy, protein, fat, transfat andcarbohydrate content [18].
Consumption of packaged food has grown very fast in therecent years. When consumers need to make informeddecisions when purchasing and consuming food products, foodlabeling becomes handy. In a study conducted in India, it wasfound that females gave priority to the brand (93.33%) than tothe price (70%) and taste (53.33%) of the product. In the samestudy, it was found that the usage of the information printed onthe packaged food was relatively high amongst the consumerswhile buying packaged food. However, increasingly moreimportance was given to expiry date [5].
With the change in lifestyle and consumption pattern, foodsafety standards, transparency in dissemination of informationrelated to food product and legal regulations are becomingimportant on food labels. The expenditure on labeling will beof use only if consumers are aware of and are able tounderstand, comprehend and purchase based on informationgiven in the labels [5].
In another study conducted in South India, it was found that amajority of subjects (52.5%) were aware of the food additivesand their harmful effects on health. However around 38.3 percent did not know anything about a food label [15]. Therequirement of consumers to reduce additives in food productshas led to the removal of artificial colors, flavors andpreservatives in many food categories so as to obtain clean-label products [28].
Consumer awareness of food labeling in packaged food
In a study in supermarkets in India, it was found that 22.5% ofthe people had awareness about labeled food products, whilethe remaining 77.5% did not have any awareness about labeledfood products [18]. In another study in Turkey, around 70.3%of consumers had the habit of reading the label on foodproducts. There was a statistically significant differencebetween genders in reading food labels. More ladies (76.4%)and significantly less men (61.5%) had the habit of readinglabels. Twenty per cent of the respondents stated that theynever understood food labels in packaged food [27]. The levelof consciousness about food safety of women increased withincreasing education and income level [29].
In a study conducted in India, it was found that 90% of theconsumers gave importance to expiry date of the products,
followed by 76.7% who chose manufacturing date asimportant. Also nutritional information is considered veryimportant by 56.7% of the consumers, ingredients by 53.33%of the consumers and direction of use by 53.33% of theconsumers. Consumers perceived different kinds ofinformation on the food label as important, but inspite of thatthey don’t use this information during purchase [5].
In a study conducted in Tanzania by Samson, [29] it was foundthat 88% of the consumers checked for expiry dates, followedby list of ingredients (63.9%), manufacturing date (25.5%) andnutrition information (25%). Price was the least factor whichwas sought for in the label (2.9%). Both male and femaleconsumers felt that food labeling provides very importantinformation to the consumer.
In a study in India, it was found that 86.7% of the studyparticipants reported to read labeling information prior topurchase of packaged food. However, only one third of theconsumers were very much informed about food labeling basedon computed awareness scores. A majority of the respondentsmentioned price of food as the factor for motivating them toread the food label before purchase of the food item. Today,consumers in one hand have more access to new food productsand more information about food; on the other hand there areincreasing concerns about the potential for consumers to bemisled by food labels. This necessitates consumers to beenlightened with the knowledge and ability to read, understandand interpret food labeling and use such information indecision making during purchase of packaged food [30].
Materials and MethodsThe study was conducted in the following steps:
• Study design• Selection of the area• Selection of the subjects• Preparation of the tool• Conduct of the study• Analysis of the results.
Study design
This was a questionnaire based cross sectional study doneonline in Google forms.
Selection of the area
Abha city was selected for the study. Participants filled anonline questionnaire that was made through Google forms; theLink of the questionnaire was distributed through social Appslike: (WhatsApp groups, Snapchat groups, telegram groupsetc.).
Selection of subjects
Inclusion criteria: Sample will be collected electronically.
• Random sample• Age ranged from less than 18 to above 40 years.• Both male and female who purchase packaged food.
Citation: Sachithananthan V. A study on the consumer awareness of food additives in packaged food and their effects on health in Abharegion, Saudi Arabia. J Food Technol Pres 2017;1(3):14-27.
16J Food Technol Pres 2017 Volume 1 Issue 3
Preparation of the tool
A pilot survey was used to collect information on socio-demographic variables, awareness of food labelinginformation, format and language of food labeling information,nutritional information and product attributes such as price,appearance and packaging design. Level of awareness on foodlabeling was obtained by asking the respondents about theirfamiliarity with the information on the labels and whether theyread the food labels or not, and asking about the circumstancesunder which they skip reading labels and the difficulties theyencounter in understanding food labels.
Conduct of the study
Based on the above tool, the information was collected fromthe respondents.
Analysis of the results
Data were uploaded on SPSS 22 platform and Chisquare wasperformed to assess the statistical significance betweendemographic variables and food labeling information variables.
ResultsThe results of the study are presented in the following tablesand figures:
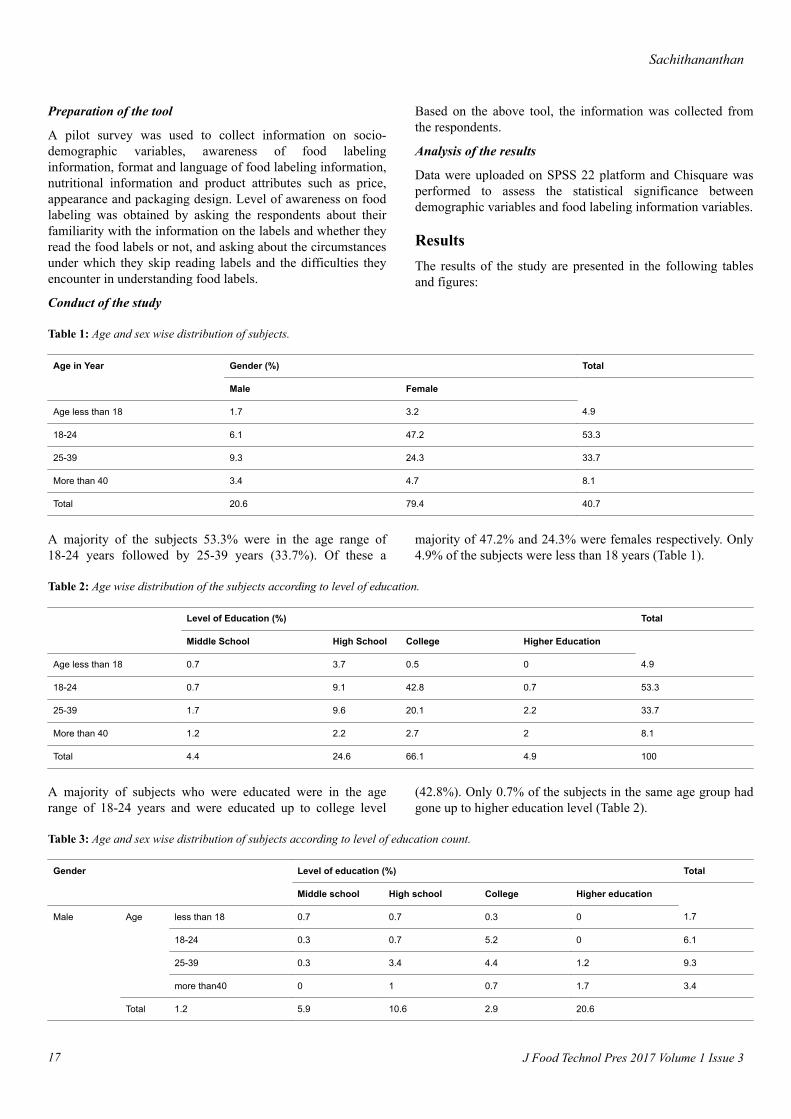
Table 1: Age and sex wise distribution of subjects.
Age in Year Gender (%) Total
Male Female
Age less than 18 1.7 3.2 4.9
18-24 6.1 47.2 53.3
25-39 9.3 24.3 33.7
More than 40 3.4 4.7 8.1
Total 20.6 79.4 40.7
A majority of the subjects 53.3% were in the age range of18-24 years followed by 25-39 years (33.7%). Of these a
majority of 47.2% and 24.3% were females respectively. Only4.9% of the subjects were less than 18 years (Table 1).
Table 2: Age wise distribution of the subjects according to level of education.
Level of Education (%) Total
Middle School High School College Higher Education
Age less than 18 0.7 3.7 0.5 0 4.9
18-24 0.7 9.1 42.8 0.7 53.3
25-39 1.7 9.6 20.1 2.2 33.7
More than 40 1.2 2.2 2.7 2 8.1
Total 4.4 24.6 66.1 4.9 100
A majority of subjects who were educated were in the agerange of 18-24 years and were educated up to college level
(42.8%). Only 0.7% of the subjects in the same age group hadgone up to higher education level (Table 2).
Table 3: Age and sex wise distribution of subjects according to level of education count.
Gender Level of education (%) Total
Middle school High school College Higher education
Male Age less than 18 0.7 0.7 0.3 0 1.7
18-24 0.3 0.7 5.2 0 6.1
25-39 0.3 3.4 4.4 1.2 9.3
more than40 0 1 0.7 1.7 3.4
Total 1.2 5.9 10.6 2.9 20.6
Sachithananthan
J Food Technol Pres 2017 Volume 1 Issue 317
Female Age less than 18 0 2.9 0.3 0 3.2
18-24 0.5 8.4 37.6 0.7 47.2
25-39 1.5 6.1 15.7 1 24.3
more than40 1.2 1.2 2 0.3 4.7
Total 3.2 18.7 55.5 2 79.4
Total Age less than 18 0.7 9.1 0.5 0 4.9
18-24 0.7 9.1 42.8 0.7 53.3
25-39 1.7 9.6 20.1 2.2 33.7
more than40 1.2 2.2 2.7 2 8.1
Total 4.4 24.6 66.1 4.9 100
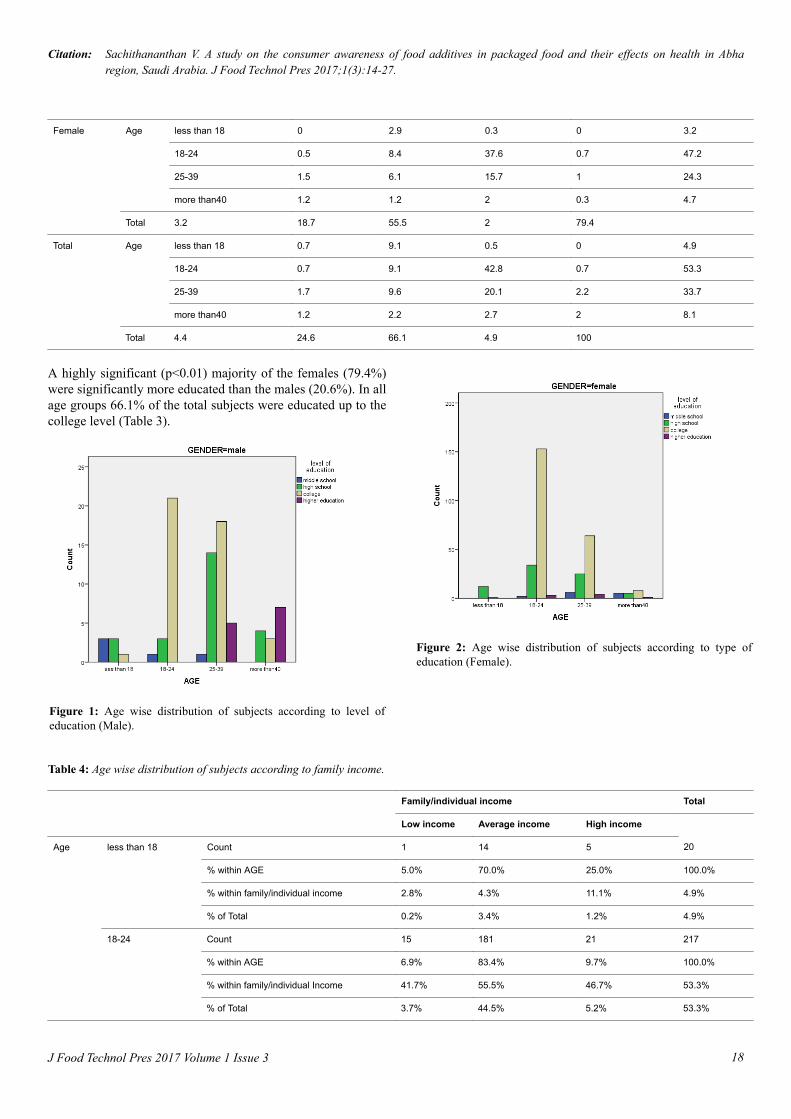
A highly significant (p<0.01) majority of the females (79.4%)were significantly more educated than the males (20.6%). In allage groups 66.1% of the total subjects were educated up to thecollege level (Table 3).
Figure 1: Age wise distribution of subjects according to level ofeducation (Male).
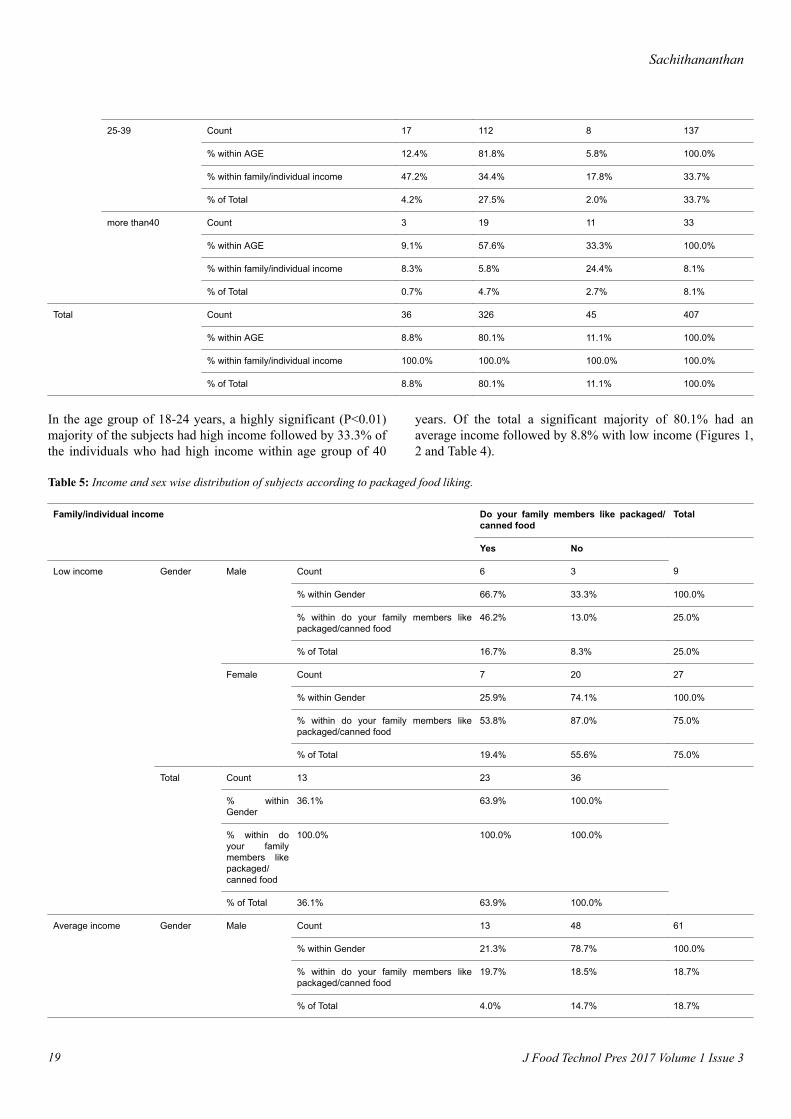
Figure 2: Age wise distribution of subjects according to type ofeducation (Female).
Table 4: Age wise distribution of subjects according to family income.
Family/individual income Total
Low income Average income High income
Age less than 18 Count 1 14 5 20
% within AGE 5.0% 70.0% 25.0% 100.0%
% within family/individual income 2.8% 4.3% 11.1% 4.9%
% of Total 0.2% 3.4% 1.2% 4.9%
18-24 Count 15 181 21 217
% within AGE 6.9% 83.4% 9.7% 100.0%
% within family/individual Income 41.7% 55.5% 46.7% 53.3%
% of Total 3.7% 44.5% 5.2% 53.3%
Citation: Sachithananthan V. A study on the consumer awareness of food additives in packaged food and their effects on health in Abharegion, Saudi Arabia. J Food Technol Pres 2017;1(3):14-27.
18J Food Technol Pres 2017 Volume 1 Issue 3
25-39 Count 17 112 8 137
% within AGE 12.4% 81.8% 5.8% 100.0%
% within family/individual income 47.2% 34.4% 17.8% 33.7%
% of Total 4.2% 27.5% 2.0% 33.7%
more than40 Count 3 19 11 33
% within AGE 9.1% 57.6% 33.3% 100.0%
% within family/individual income 8.3% 5.8% 24.4% 8.1%
% of Total 0.7% 4.7% 2.7% 8.1%
Total Count 36 326 45 407
% within AGE 8.8% 80.1% 11.1% 100.0%
% within family/individual income 100.0% 100.0% 100.0% 100.0%
% of Total 8.8% 80.1% 11.1% 100.0%
In the age group of 18-24 years, a highly significant (P<0.01)majority of the subjects had high income followed by 33.3% ofthe individuals who had high income within age group of 40
years. Of the total a significant majority of 80.1% had anaverage income followed by 8.8% with low income (Figures 1,2 and Table 4).
Table 5: Income and sex wise distribution of subjects according to packaged food liking.
Family/individual income Do your family members like packaged/canned food
Total
Yes No
Low income Gender Male Count 6 3 9
% within Gender 66.7% 33.3% 100.0%
% within do your family members likepackaged/canned food
46.2% 13.0% 25.0%
% of Total 16.7% 8.3% 25.0%
Female Count 7 20 27
% within Gender 25.9% 74.1% 100.0%
% within do your family members likepackaged/canned food
53.8% 87.0% 75.0%
% of Total 19.4% 55.6% 75.0%
Total Count 13 23 36
% withinGender
36.1% 63.9% 100.0%
% within doyour familymembers likepackaged/canned food
100.0% 100.0% 100.0%
% of Total 36.1% 63.9% 100.0%
Average income Gender Male Count 13 48 61
% within Gender 21.3% 78.7% 100.0%
% within do your family members likepackaged/canned food
19.7% 18.5% 18.7%
% of Total 4.0% 14.7% 18.7%
Sachithananthan
J Food Technol Pres 2017 Volume 1 Issue 319
Female Count 53 212 265
% within Gender 20.0% 80.0% 100.0%
% within do your family members likepackaged/canned food
80.3% 81.5% 81.3%
% of Total 16.3% 65.0% 81.3%
Total Count 66 260 326
% withinGender
20.2% 79.8% 100.0%
% within doyour familymembers likepackaged/canned food
100.0% 100.0% 100.0%
% of Total 20.2% 79.8% 100.0%
High income Gender Male Count 4 10 14
% within Gender 28.6% 71.4% 100.0%
% within do your family members likepackaged/canned food
57.1% 26.3% 31.1%
% of Total 8.9% 22.2% 31.1%
Female Count 3 28 31
% within Gender 9.7% 90.3% 100.0%
% within do your family members likepackaged/canned food
42.9% 73.7% 68.9%
% of Total 6.7% 62.2% 68.9%
Total Count 7 38 45
% withinGender
15.6% 84.4% 100.0%
% within doyour familymembers likepackaged/canned food
100.0% 100.0% 100.0%
% of Total 15.6% 84.4% 100.0%
Total Gender Male Count 23 61 84
% within Gender 27.4% 72.6% 100.0%
% within do your family members likepackaged/canned food
26.7% 19.0% 20.6%
% of Total 5.7% 15.0% 20.6%
Female Count 63 260 323
% within Gender 19.5% 80.5% 100.0%
% within do your family members likepackaged/canned food
73.3% 81.0% 79.4%
% of Total 15.5% 63.9% 79.4%
Total Count 86 321 407
% withinGender
21.1% 78.9% 100.0%
Citation: Sachithananthan V. A study on the consumer awareness of food additives in packaged food and their effects on health in Abharegion, Saudi Arabia. J Food Technol Pres 2017;1(3):14-27.
20J Food Technol Pres 2017 Volume 1 Issue 3
% within doyour familymembers likepackaged/canned food
100.0% 100.0% 100.0%
% of Total 21.1% 78.9% 100.0%
Within the high income group, 90.3% of the female subjectsdid not like packaged food, whereas 42.9% within the familymembers liked the packaged food (p<0.05). Also within the
low income group, 87% of the female subjects within thefamily members did not like the packaged food, whereas(53.1%) of the male subjects liked the packaged food (Table 5).
Table 6: Income wise classification according to which food is better packaged/fresh.
Packaged/canned food Fresh food Total
Family/individual income Low income Count 10 26 36
% within family/individual income 27.8% 72.2% 100.0%
% within witch do you feel is betterpackaged/canned food or fresh food
19.6% 7.3% 8.8%
% of Total 2.5% 6.4% 8.8%
Average income Count 32 293 326
% within family/individual income 9.8% 89.9% 100.0%
% within witch do you feel is betterpackaged/canned food or fresh food
62.7% 82.5% 80.1%
% of Total 7.9% 72.0% 80.1%
High income Count 9 36 45
% within family/individual income 20.0% 80.0% 100.0%
% within witch do you feel is betterpackaged/canned food or fresh food
17.6% 10.1% 11.1%
% of Total 2.2% 8.8% 11.1%
Total Count 51 355 407
% within family/individual income 12.5% 87.2% 100.0%
% within witch do you feel is betterpackaged/canned food or fresh food
100.0% 100.0% 100.0%
% of Total 12.5% 87.2% 100.0%
A majority of the subjects within the family or individualincome, belonging to low (72.2%), average (89.9%) and highincome (87.2%) felt fresh food was better (Table 6).
Table 7: Income wise classification according to feel of expensiveness of packaged food.
Do you feel packaged/canned food areexpensive
Total
Yes no
Family/individual income Low income Count 12 24 36
% within family/individual income 33.3% 66.7% 100.0%
% within do you feel packaged/cannedfood are expensive
8.6% 9.0% 8.8%
% of Total 2.9% 5.9% 8.8%
Sachithananthan
J Food Technol Pres 2017 Volume 1 Issue 321
Average income Count 108 218 326
% within family/individual income 33.1% 66.9% 100.0%
% within do you feel packaged/cannedfood are expensive
77.1% 81.6% 80.1%
% of Total 26.5% 53.6% 80.1%
High income Count 20 25 45
% within family/individual income 44.4% 55.6% 100.0%
% within do you feel packaged/cannedfood are expensive
14.3% 9.4% 11.1%
% of Total 4.9% 6.1% 11.1%
Total Count 140 267 407
% within family/individual income 34.4% 65.6% 100.0%
% within do you feel packaged/cannedfood are expensive
100.0% 100.0% 100.0%
% of Total 34.4% 65.6% 100.0%
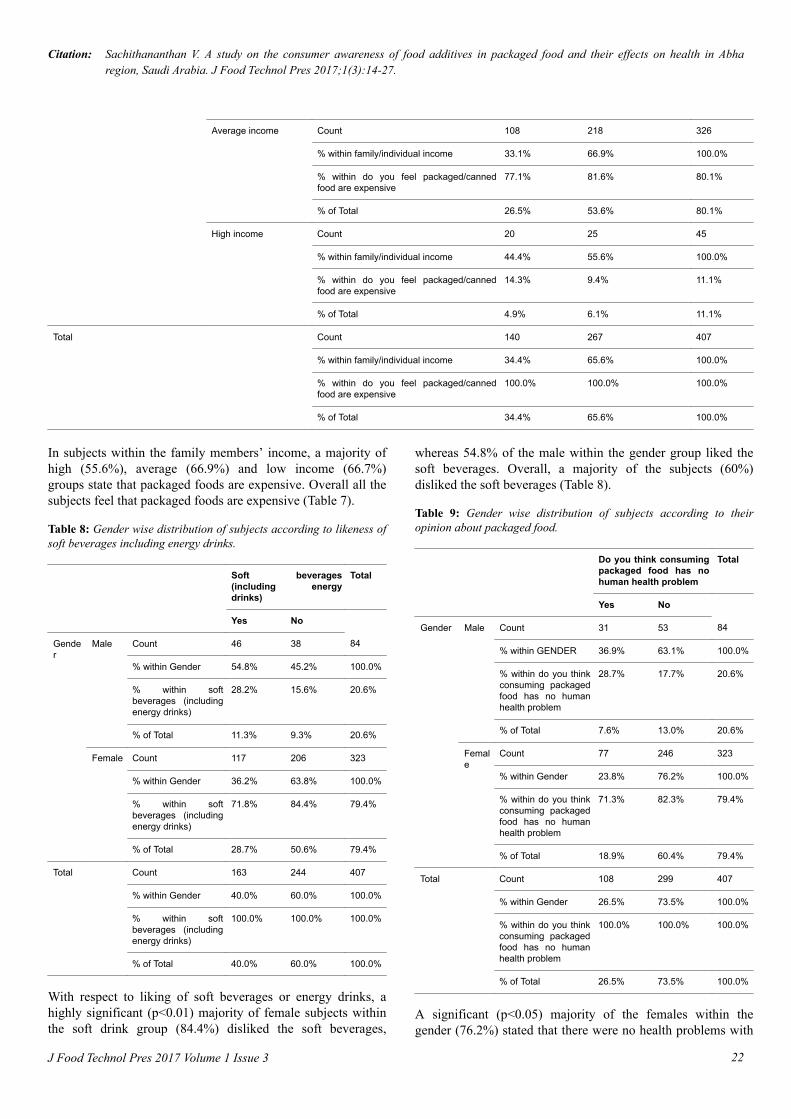
In subjects within the family members’ income, a majority ofhigh (55.6%), average (66.9%) and low income (66.7%)groups state that packaged foods are expensive. Overall all thesubjects feel that packaged foods are expensive (Table 7).
Table 8: Gender wise distribution of subjects according to likeness ofsoft beverages including energy drinks.
Soft beverages(including energydrinks)
Total
Yes No
Gender
Male Count 46 38 84
% within Gender 54.8% 45.2% 100.0%
% within softbeverages (includingenergy drinks)
28.2% 15.6% 20.6%
% of Total 11.3% 9.3% 20.6%
Female Count 117 206 323
% within Gender 36.2% 63.8% 100.0%
% within softbeverages (includingenergy drinks)
71.8% 84.4% 79.4%
% of Total 28.7% 50.6% 79.4%
Total Count 163 244 407
% within Gender 40.0% 60.0% 100.0%
% within softbeverages (includingenergy drinks)
100.0% 100.0% 100.0%
% of Total 40.0% 60.0% 100.0%
With respect to liking of soft beverages or energy drinks, ahighly significant (p<0.01) majority of female subjects withinthe soft drink group (84.4%) disliked the soft beverages,
whereas 54.8% of the male within the gender group liked thesoft beverages. Overall, a majority of the subjects (60%)disliked the soft beverages (Table 8).
Table 9: Gender wise distribution of subjects according to theiropinion about packaged food.
Do you think consumingpackaged food has nohuman health problem
Total
Yes No
Gender Male Count 31 53 84
% within GENDER 36.9% 63.1% 100.0%
% within do you thinkconsuming packagedfood has no humanhealth problem
28.7% 17.7% 20.6%
% of Total 7.6% 13.0% 20.6%
Female
Count 77 246 323
% within Gender 23.8% 76.2% 100.0%
% within do you thinkconsuming packagedfood has no humanhealth problem
71.3% 82.3% 79.4%
% of Total 18.9% 60.4% 79.4%
Total Count 108 299 407
% within Gender 26.5% 73.5% 100.0%
% within do you thinkconsuming packagedfood has no humanhealth problem
100.0% 100.0% 100.0%
% of Total 26.5% 73.5% 100.0%
A significant (p<0.05) majority of the females within thegender (76.2%) stated that there were no health problems with
Citation: Sachithananthan V. A study on the consumer awareness of food additives in packaged food and their effects on health in Abharegion, Saudi Arabia. J Food Technol Pres 2017;1(3):14-27.
22J Food Technol Pres 2017 Volume 1 Issue 3
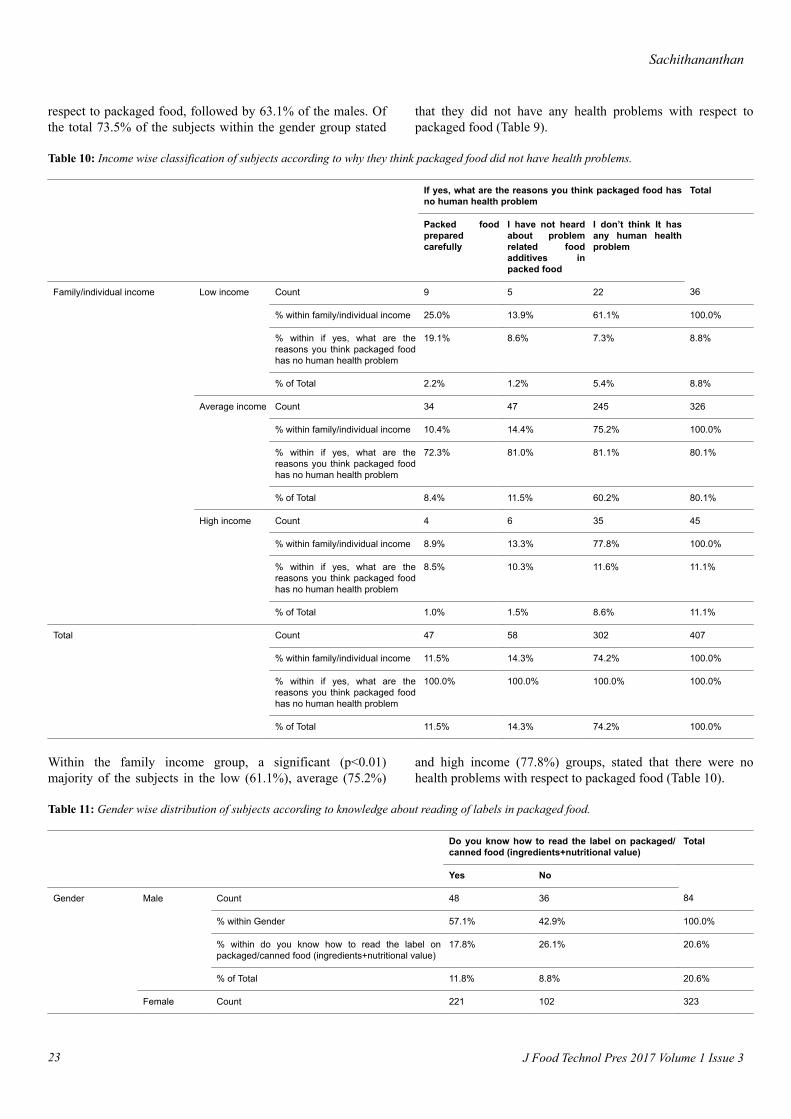
respect to packaged food, followed by 63.1% of the males. Ofthe total 73.5% of the subjects within the gender group stated
that they did not have any health problems with respect topackaged food (Table 9).
Table 10: Income wise classification of subjects according to why they think packaged food did not have health problems.
If yes, what are the reasons you think packaged food hasno human health problem
Total
Packed foodpreparedcarefully
I have not heardabout problemrelated foodadditives inpacked food
I don’t think It hasany human healthproblem
Family/individual income Low income Count 9 5 22 36
% within family/individual income 25.0% 13.9% 61.1% 100.0%
% within if yes, what are thereasons you think packaged foodhas no human health problem
19.1% 8.6% 7.3% 8.8%
% of Total 2.2% 1.2% 5.4% 8.8%
Average income Count 34 47 245 326
% within family/individual income 10.4% 14.4% 75.2% 100.0%
% within if yes, what are thereasons you think packaged foodhas no human health problem
72.3% 81.0% 81.1% 80.1%
% of Total 8.4% 11.5% 60.2% 80.1%
High income Count 4 6 35 45
% within family/individual income 8.9% 13.3% 77.8% 100.0%
% within if yes, what are thereasons you think packaged foodhas no human health problem
8.5% 10.3% 11.6% 11.1%
% of Total 1.0% 1.5% 8.6% 11.1%
Total Count 47 58 302 407
% within family/individual income 11.5% 14.3% 74.2% 100.0%
% within if yes, what are thereasons you think packaged foodhas no human health problem
100.0% 100.0% 100.0% 100.0%
% of Total 11.5% 14.3% 74.2% 100.0%
Within the family income group, a significant (p<0.01)majority of the subjects in the low (61.1%), average (75.2%)
and high income (77.8%) groups, stated that there were nohealth problems with respect to packaged food (Table 10).
Table 11: Gender wise distribution of subjects according to knowledge about reading of labels in packaged food.
Do you know how to read the label on packaged/canned food (ingredients+nutritional value)
Total
Yes No
Gender Male Count 48 36 84
% within Gender 57.1% 42.9% 100.0%
% within do you know how to read the label onpackaged/canned food (ingredients+nutritional value)
17.8% 26.1% 20.6%
% of Total 11.8% 8.8% 20.6%
Female Count 221 102 323
Sachithananthan
J Food Technol Pres 2017 Volume 1 Issue 323
% within Gender 68.4% 31.6% 100.0%
% within do you know how to read the label onpackaged/canned food (ingredients+nutritional value)
82.2% 73.9% 79.4%
% of Total 54.3% 25.1% 79.4%
Total Count 269 138 407
% within Gender 66.1% 33.9% 100.0%
% within do you know how to read the label onpackaged/canned food (ingredients+nutritional value)
100.0% 100.0% 100.0%
% of Total 66.1% 33.9% 100.0%
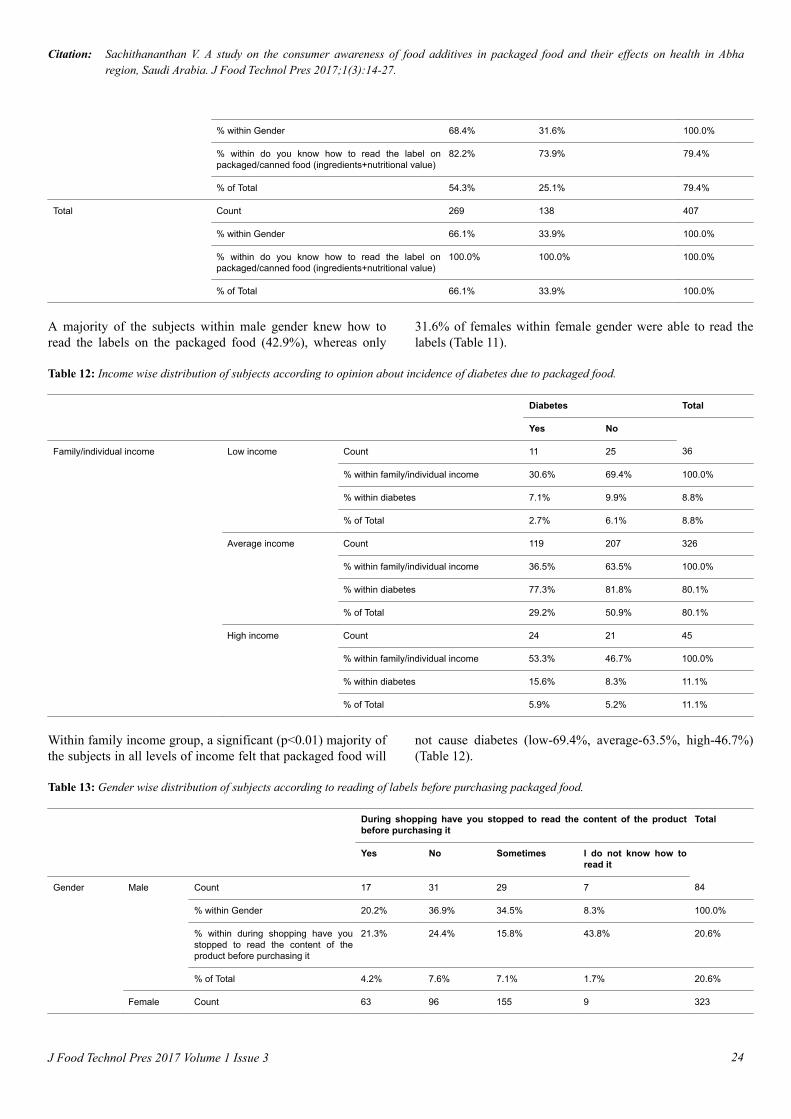
A majority of the subjects within male gender knew how toread the labels on the packaged food (42.9%), whereas only
31.6% of females within female gender were able to read thelabels (Table 11).
Table 12: Income wise distribution of subjects according to opinion about incidence of diabetes due to packaged food.
Diabetes Total
Yes No
Family/individual income Low income Count 11 25 36
% within family/individual income 30.6% 69.4% 100.0%
% within diabetes 7.1% 9.9% 8.8%
% of Total 2.7% 6.1% 8.8%
Average income Count 119 207 326
% within family/individual income 36.5% 63.5% 100.0%
% within diabetes 77.3% 81.8% 80.1%
% of Total 29.2% 50.9% 80.1%
High income Count 24 21 45
% within family/individual income 53.3% 46.7% 100.0%
% within diabetes 15.6% 8.3% 11.1%
% of Total 5.9% 5.2% 11.1%
Within family income group, a significant (p<0.01) majority ofthe subjects in all levels of income felt that packaged food will
not cause diabetes (low-69.4%, average-63.5%, high-46.7%)(Table 12).
Table 13: Gender wise distribution of subjects according to reading of labels before purchasing packaged food.
During shopping have you stopped to read the content of the productbefore purchasing it
Total
Yes No Sometimes I do not know how toread it
Gender Male Count 17 31 29 7 84
% within Gender 20.2% 36.9% 34.5% 8.3% 100.0%
% within during shopping have youstopped to read the content of theproduct before purchasing it
21.3% 24.4% 15.8% 43.8% 20.6%
% of Total 4.2% 7.6% 7.1% 1.7% 20.6%
Female Count 63 96 155 9 323
Citation: Sachithananthan V. A study on the consumer awareness of food additives in packaged food and their effects on health in Abharegion, Saudi Arabia. J Food Technol Pres 2017;1(3):14-27.
24J Food Technol Pres 2017 Volume 1 Issue 3
% within Gender 19.5% 29.7% 48.0% 2.8% 100.0%
% within during shopping have youstopped to read the content of theproduct before purchasing it
78.8% 75.6% 84.2% 56.3% 79.4%
% of Total 15.5% 23.6% 38.1% 2.2% 79.4%
Total Count 80 127 184 16 407
% within Gender 19.7% 31.2% 45.2% 3.9% 100.0%
% within during shopping have youstopped to read the content of theproduct before purchasing it
100.0% 100.0% 100.0% 100.0% 100.0%
% of Total 19.7% 31.2% 45.2% 3.9% 100.0%
A majority of the female subjects (56.3%) did not read thelabels on the packaged food, followed by 43.8% of malesubjects did not read the labels (Table 13).
Table 14: Gender wise distribution of subjects according to readingof labels.
Count Total
Do you read production and expiry dateand act according
No Yes sometimes
Gender Male 2.7 11.5 6.4 20.6
Female 3.2 57.5 18.7 79.4
Total 5.9 69 25.1 100
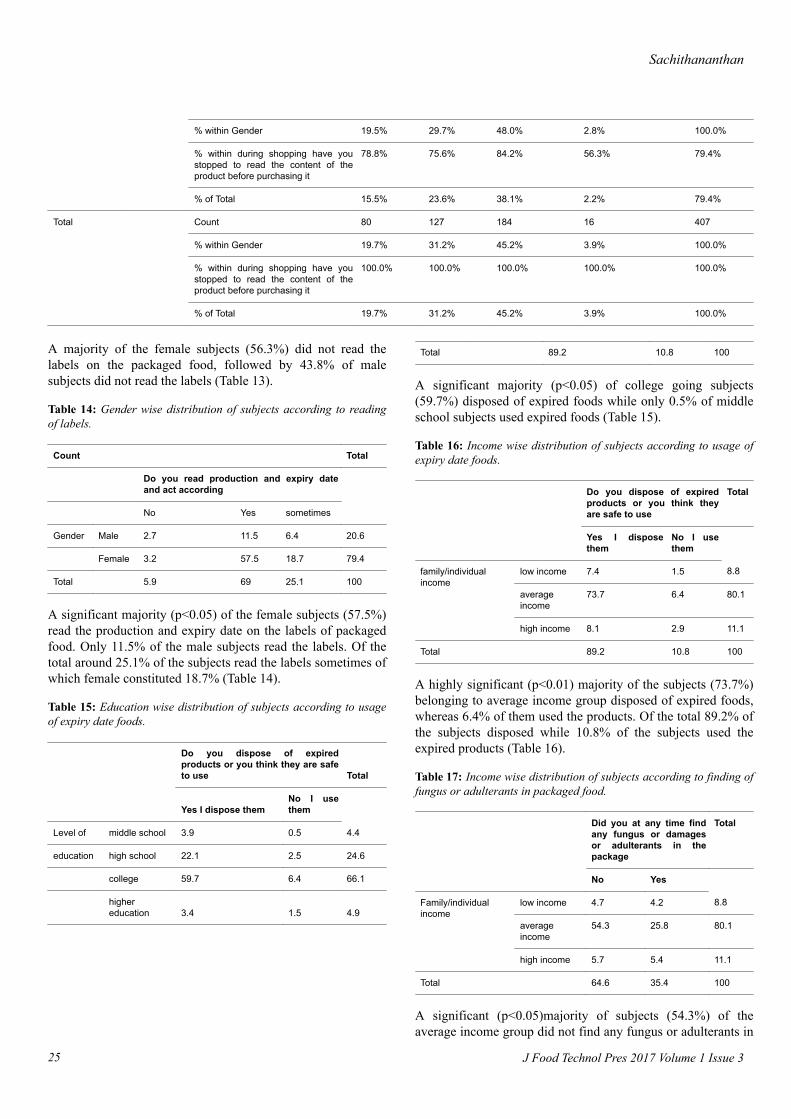
A significant majority (p<0.05) of the female subjects (57.5%)read the production and expiry date on the labels of packagedfood. Only 11.5% of the male subjects read the labels. Of thetotal around 25.1% of the subjects read the labels sometimes ofwhich female constituted 18.7% (Table 14).
Table 15: Education wise distribution of subjects according to usageof expiry date foods.
Do you dispose of expiredproducts or you think they are safeto use Total
Yes I dispose themNo I usethem
Level of middle school 3.9 0.5 4.4
education high school 22.1 2.5 24.6
college 59.7 6.4 66.1
highereducation 3.4 1.5 4.9
Total 89.2 10.8 100
A significant majority (p<0.05) of college going subjects(59.7%) disposed of expired foods while only 0.5% of middleschool subjects used expired foods (Table 15).
Table 16: Income wise distribution of subjects according to usage ofexpiry date foods.
Do you dispose of expiredproducts or you think theyare safe to use
Total
Yes I disposethem
No I usethem
family/individualincome
low income 7.4 1.5 8.8
averageincome
73.7 6.4 80.1
high income 8.1 2.9 11.1
Total 89.2 10.8 100
A highly significant (p<0.01) majority of the subjects (73.7%)belonging to average income group disposed of expired foods,whereas 6.4% of them used the products. Of the total 89.2% ofthe subjects disposed while 10.8% of the subjects used theexpired products (Table 16).
Table 17: Income wise distribution of subjects according to finding offungus or adulterants in packaged food.
Did you at any time findany fungus or damagesor adulterants in thepackage
Total
No Yes
Family/individualincome
low income 4.7 4.2 8.8
averageincome
54.3 25.8 80.1
high income 5.7 5.4 11.1
Total 64.6 35.4 100
A significant (p<0.05)majority of subjects (54.3%) of theaverage income group did not find any fungus or adulterants in
Sachithananthan
J Food Technol Pres 2017 Volume 1 Issue 325
the packaged food, while 25.8% of the subjects of the samegroup found adulterants and fungus in the packaged food(Table 17).
DiscussionThere are no reported studies from Abha with which thefindings of this study can be compared. In this study majorityof them had awareness about the presence of ‘FoodPreservatives’ and ‘Flavouring Agents’ in the packed foodsthat they buy. But they lacked any specific knowledge aboutthe effects of these chemicals. Similar results have beenreported from South Korea [31]. One study from USA reportedlow levels of consumer awareness cannot be compared withour study as they explored the consumer awareness attitudes ongenetically modified foods, irradiated foods, chemical µbiological contamination [32].
Within the high income group, 90.3% of the female subjectsdid not like packaged food (p<0.05) due to the reason that theylike fresh food. Also within the low income group, 87% of thefemale subjects within the family members did not like thepackaged food, whereas (53.1%) of the male subjects liked thepackaged food. The reason may be that packaged foods areexpensive. A majority of the subjects within the family orindividual income, belonging to low (72.2%), average (89.9%)and high income (87.2%) felt fresh food was better. Overall allthe subjects feel that packaged foods are expensive. Overall, amajority of the subjects (60%) disliked the soft beverages,canned juices, canned soups etc.
Of the total 73.5% of the subjects within the gender groupstated that they did not have any health problems with respectto packaged food. A majority of the subjects within malegender knew how to read the labels on the packaged food(42.9%), whereas only 31.6% of females within female genderwere able to read the labels. Of the total, around 25.1% of thesubjects read the labels sometimes of which female constituted18.7%. This gender difference was not due to income oreducational level; but may be due to level of exposure. Withinfamily income group, a significant (p<0.01) majority of thesubjects in all levels of income felt that packaged food will notcause diabetes (low-69.4%, average-63.5%, high-46.7%). Asignificant majority (p<0.05) of college going subjects (59.7%)disposed of expired foods while only 0.5% of middle schoolsubjects used expired foods. A highly significant (p<0.01)majority of the subjects (73.7%) belonging to average incomegroup disposed of expired foods, whereas 6.4% of them usedthe products. Of the total 89.2% of the subjects disposed while10.8% of the subjects used the expired products. A significant(p<0.05)majority of subjects (54.3%) of the average incomegroup did not find any fungus or adulterants in the packagedfood, while 25.8% of the subjects of the same group foundadulterants and fungus in the packaged food. From the aboveresults it is evident that education, sex and income levels playan important part in purchasing and using of packaged food.Also illiteracy about packaged food holds back a significantmajority of people from enjoying the benefits of packagedfood.
ConclusionAn awareness program about the benefits of packaged food isthe need of the hour. Also the product expensiveness should bebrought down so that all strata of the population can enjoypackaged food due to its palatability, safety and time savingfeatures.
RecommendationsEspecially in the case of working women, knowledge aboutpackaged food should be popularized. It is the knowledgeabout packaged food which will lead to better usage of theproduct. Also awareness on reading food labels beforepurchasing packaged food is important and is the need of thehour.
References1. Diehl JF (2002) Some established facts and some new
concepts in food toxicology- A review. Acta Alimentaria31: 355-369.
2. Abdulmumeen HA, Risikat AN, Sururah AR (2012) Food:Its preservatives, additives and applications. InternationalJournal of Chemical and Biochemical Sciences 1: 36-47.
3. Seetaramaiah K, Smith AA, Murali R, et al. (2011)Preservatives in food products- Review. InternationalJournal of Pharmaceutical and Biological Archives 2:583-599.
4. Legesse A, Muluken A, Getasew A (2016) A survey onawareness of consumers about health problems of foodadditives in packaged foods and their attitude towardconsumption of packaged foods: A case study at JimmaUniversity. International Food Research Journal 23:375-380.
5. Kaur VP, Kaur N, Qumar N (2016) Assessment ofconsumer awareness about usage of food labels and itsimpact on food buying behaviour. International Journal ofResearch-Granthaalayah 4: 10-19.
6. Wang G, Fletcher SM, Carley DH (2008) Consumerutilization of food labeling as a source of nutritioninformation. The Journal of Consumer Affairs 2: 368-380.
7. Brian G, Wilson Sami LB (2005) Adverse reactions to foodadditives: Review Article. Annals of Allergy, Asthma andImmunology 95: 499-507.
8. Niemeier HM, Raynor HA, Lloyd-Richardson EE, et al.(2006) Fast food consumption and breakfast skipping:predictors of weight gain from adolescence to adulthood ina nationally representative sample. J Adolesc Health 39:842-849.
9. Keszei AP, Goldbohm RA, Schouten LJ, et al. (2013)Dietary N-nitroso compounds, endogenous nitrosation, andthe risk of esophageal and gastric cancer subtypes in theNetherlands Cohort Study. Am J Clin Nutr 97: 135-146.
10. Maier E, Kurz K, Jenny M, et al. (2010) Food preservativessodium benzoate and propionic acid and colorant curcuminsuppress Th1-type immune response in vitro. Food ChemToxicol 8: 1950-1956.
Citation: Sachithananthan V. A study on the consumer awareness of food additives in packaged food and their effects on health in Abharegion, Saudi Arabia. J Food Technol Pres 2017;1(3):14-27.
26J Food Technol Pres 2017 Volume 1 Issue 3
11. Park S, Blanck HM, Sherry B, et al. (2013) Regularsodaintake independent of weight status is associated withasthma among US high school students. J Acad-Nutr Diet113: 106-111.
12. McCann D, Barrett A, Cooper A, et al. (2007) FoodAdditives and hyperactive behavior in 3 year old and 8-9year old children in the community: A randomized doubleblinded, placebo controlled trial. The Lancet 370:1560-1567.
13. Boga A, Binokay S (2010) Food additives and effects tohuman health. Archives Medical Review Journal 19:141-154.
14. Stuckler D, McKee M, Ebrahim S, et al. (2012)Manufacturing epidemics: the role of global producers inincreased consumption of unhealthy commodities includingprocessed foods, alcohol, and tobacco. PLoS Med 9:e1001235.
15. Harsha HN, Jha AK, Taneja KK, et al. (2013) A study onconsumer awareness, safety perceptions and practices aboutfood preservatives and flavoring agents used in packed/canned foods from South India. Natl J Community Med 4:402-406.
16. Aoki K, Shen J, Saijo T (2010) Consumer reaction toinformation on food additives: evidence from an eatingexperiment and a field survey. Journal of EconomicBehavior and Organization 73: 433-438.
17. Wu L, Zhang Q, Shan L, et al. (2013) Identifying criticalfactors influencing the use of additives by food enterprisesin China. Food Control 31: 425-432.
18. http://www.pharmatutor.org/articles/consumer-awareness-nutritional-labelled-foods
19. Coveney J (2007) Food and trust in Australia: building apicture. Public Health Nutrition 11: 237-245.
20. Food safety authority of Ireland (2003) Consumer attitudesto food safety in Ireland, p. 5.
21. FAO/WHO expert consultation (1986) Food protection forurban consumers. Food and Agriculture Organization,Rome, pp: 1-17.
22. Al-Tamimi and Company (2004) Standardization andclassification in the UAE: Centre for Food Safety-2006,Benefit of Nutrition information on Food Labels.
23. Emerton V, Choi E (2008) Essential guide to foodadditives. Leatherhead Publishing, Cambridge, UK.
24. Tomaska LD (2014) Food additives: food additives-generalencyclopedia of food safety. Hazards and Diseases 2:449-454.
25. Bearth A, Cousin M, Siegrist M (2014) The consumer’sperception of artificial food additives: Influences onacceptance, risk and benefit perceptions. Food Quality andPreference 38: 14-23.
26. http://fssai.gov.in/portals/0/pdf/15manuals/foodadditives.pdf
27. Kayisoglu S, Coskun F (2016) Determination of the levelof knowledge of consumers about food additives. IOSRJournal of Environmental Science, Toxicology and FoodTechnology (IOSR-JESTFT).
28. Brockman C, Beeren CJM (2011) Additives in dairy foods,consumer perceptions of additives in dairy productsencyclopedia of dairy sciences, pp: 41-48.
29. Angis S, Oguzhan P (2008) Su Ürünlerinde KullanılanKatkı Maddeleri Türkiye 10. Gıda Kongresi, Mayıs,Erzurum, pp: 21-23.
30. Dutta S, Patel D (2017) Study of consumer awareness onfood labelling and use of pack information for purchase ofpre-packaged food products. International Journal of IndianPsychology.
31. Soon-Mi S, Sun HS, Youngja L, et al. (2011) Consumers’knowledge and safety perceptions of food additives:Evaluation on the effectiveness of transmitting informationon preservatives. Food Control 22: 1054-1060.
32. Brewer MS, Rojas M (2012) Consumer’s attitude towardsissues in food safety. Food Science and Human NutritionDepartment, University of Illinois.
*Correspondence to:
Sachithananthan V
Faculty of Public health
College of Applied Medical sciences
King Khalid University
Khamis Mushayat
Saudi Arabia
Tel: 00966 553243155
E-mail: [email protected]
Sachithananthan
J Food Technol Pres 2017 Volume 1 Issue 327