a study on subject matter expertise - hp labs · a study on subject matter expertise inbal tadeski,...
TRANSCRIPT

Keyword(s): Abstract:
A Study on Subject Matter Expertise
Inbal Tadeski, Omer Barkol, Ruth Bergman
HP LaboratoriesHPL-2012-239
expertise retrieval; graph mining; collaboration systems
We suggest a method to automatically evaluate employees' subject matter expertise in knowledgemanagement systems. The approach stems from several conclusions that arose in extensive research ofsubject matter experts and their expertise. We find that self-reported expertise is biased and constantlychanging. We, furthermore, observe that automatic methods to infer expertise perform about as well asself-reported profiles. The crux of the proposed method is to combine automatic inference expertise withthe benefit of the expert's opinion, and to do so periodically so the profile remains accurate and fresh.
External Posting Date: December 6, 2012 [Fulltext] Approved for External PublicationInternal Posting Date: December 6, 2012 [Fulltext]
Copyright 2012 Hewlett-Packard Development Company, L.P.

A Study on Subject Matter Expertise
Inbal Tadeski, Omer Barkol, Ruth BergmanHP Labs Israel
November 19, 2012
Abstract
We suggest a method to automatically evaluate employees’ subject matter expertisein knowledge management systems. The approach stems from several conclusions thatarose in extensive research of subject matter experts and their expertise. We find thatself-reported expertise is biased and constantly changing. We, furthermore, observe thatautomatic methods to infer expertise perform about as well as self-reported profiles. Thecrux of the proposed method is to combine automatic inference expertise with the benefitof the expert’s opinion, and to do so periodically so the profile remains accurate andfresh.
1 Introduction
Expertise retrieval is a field of increasing interest to enterprises. On the one hand, the needto rapidly identify experts to solve a problem remains a challenge for any organization greaterthan a few hundred people. On the other hand, huge amounts of documents and informationin a variety of forms are available. The industry standard approach to knowledge managementtoday still consists of self-reported databases of profiles. These systems have been widelyrecognized as inadequate because profiles are incomplete and become obsolete over time. Inthe past [4] we proposed an automatic method to discover experts and their expertise viasemantic analysis of their work products. A key component of this approach is a relevanceengine, which calculates the most relevant items (experts, documents and expertise) given aquery item. While the results of that work appear valid on inspection and the visualization ofthe results is compelling, a well-defined notion of expertise is needed as well as quantitativeevidence that the inferred set of expertise areas is accurate.
Beyond initially bootstrapping a knowledge management system with automatically in-ferred expertise, we are concerned with keeping these profiles fresh. Although, one couldsimply re-compute expertise automatically when new work-products are available, the out-come may be unacceptable to users since profiles might shift dramatically with new activitiesor not change enough to reflect new interests. We, therefore, explore a hybrid approach thatuses automatic inference to reduce the level of effort required from the employee, but allowsher to update the inferred profile to reflect her perceptions.
The data set we deal with contains experts, tags and tagged documents. Graph-basedmodels represent this data as a graph in which these entities are the nodes and the relationsbetween them are the edges. There are relations between each expert and the documents sheauthors, and between each document and its tags. There are also organizational hierarchy
1

relations between each expert and her manager and similarity scores between documents.Edges might be weighted – in our case similarity edges are.
Our goal is to find a set of most relevant tags given an expert, which, in the graph model,may be done by traversing edges in the graph.
We address the following issues:
1. Defining the notion of ”expertise” and assessing the quality of an inferred set of expertiseareas is a difficult task by itself. We cannot depend on the existence and accuracyof self-reported user profiles. One way to compile the expertise of an expert is toobtain an authoritative opinion from other experts. This approach was taken in theW3C collection [2], which used the judgment of TREC (Text Retrieval Conference)participants, and in the CERC (CSIRO Enterprise Research Collection [1]), in whichparticipants were experts who testified about other experts in their fields of expertise.Obviously, such a method is biased in favor of well known senior experts, discriminatingyoung and unknown ones, and is highly affected by the number and the experience oftestifying participants. Another option is to use a self-reported profile of each of theexperts. The advantage of this approach is that people know themselves best. Theproblem with self-reported profiles, as our results show, is that they are not accurate,possible because they are rarely updated or because people do not evaluate their skillsobjectively. Our approach suggests using an algorithm that achieves results almostas good as those of a self-reported profile when it is not available, and improves itsaccuracy when such a profile is available.
2. There are many approaches for expertise retrieval. A summary can be found in [3]. Inthis paper we focus on graph-based models, although many of the conclusions we presentare independent of algorithm selection. We compare several existing algorithms as wellas a new algorithm we call Phased Random Walk with Restart, and find the algorithmsthat best capture the expertise of each expert. We summarize the examined algrithmsin Section 2.
3. Some of the relations between the elements are almost trivial to obtain, but someof them, such as similarity relations, require intelligent analysis. The quality of theanalysis affects the quality of the results. Which types of such relations improve theresults and which ones are insignificant? Under which circumstances? Answering thesequestions will help us focusing our efforts in the right directions.
We conducted an extensive experiment which included a survey among experts to betterassess the quality of the results. We present the experiments and their results in Section 3.In Section 4 we describe another experiment aiming to answer the third issue. In Section 5we summarize our conclusions.
2 Expertise Retrieval Methods
In this section we summarize the methods we compared in the study; Tags voting is a simplebaseline for comparison; it relies only on documents authored by an expert. The othermethods are based on graph traversal and infer tags from the broader context of the expert.
2

All of the presented methods produce a score for each of the tags. We present a methodfor extracting a group of unknown number of most relevant tags according to the distributionof their scores.
2.1 Notations
• E - a group of experts
• D - a set of documents
• T - a set of tags (expertise areas)
• De ⊆ D - the documents authored by expert e
• Td ⊆ T - the tags of document d
2.2 Algorithms
2.2.1 Tags voting (TV)
Voting models in the context of expertise finding are based on the intuition that every doc-ument which is relevant for the expert e can be viewed as a vote for its tags. In our im-plementation tags are ranked by the number of related documents authored by the expert.Formally, the score of tag t as an expertise of e is
score(e, t) = |{d ∈ De : t ∈ Td}|. (1)
2.2.2 Random walk with restart (RWR) / Personalized page rank
The idea around Page Rank [8] is to grant each node of a graph a score which is the probabilitythat a random walker in the graph will be in that node in the long run. Let A be the adjacencymatrix of the graph where each edge between the ith node and the jth node is marked witha 1-entry at Aij , or with the weight of the edge in case the graph is weighted. Let A be thetranspose of the row-normalized matrix A, i.e., the sum of each column of A is 1. Let vt be theprobabilities vector such that the ith entry vt(i) is the probability of landing in node i after tsteps of the random walk. So, simulating the random walk is equivalent to multiplying withA, i.e., vt+1 = Avt. According to the Perron - Forbenious theorem [6] adding random jumpswith a predefined probability c to some nodes in the graph, assures that the random walkconverges to a stable state. In many applications the behavior of a random walker indeedincludes random jumps. For example, when using a search engine users tend to ”jump” tothe starting point and start the search over from time to time. Let vr be a vector with allentries equal 1/n, where n is the number of nodes in the graph. That is, in an arbitrarystage, we jump to any node in the graph with the same probability. Then,
vt+1 = (1− c)Avt + cvr (2)
defines the random walk, and its stable state is the Page Rank vector:
v = (1− c)Av + cvr. (3)
3

If one chooses a non-symmetric vector vr then specific nodes are given inherent advantage.In particular, let vi be the vector with all entries equal 0 but the ith entry, which equals 1,and let vr = vi. Then with probability c at each stage we go back to the ith node. Thestationary distribution that results from this procedure is considered to signify the relevanceof nodes in the graph to the node i. This is the idea behind Personalized Page Rank [7]. Thescore of tag t as an expertise of expert i is then
score(i, t) = v(t) (4)
where v(t) is the tth entry of the stable state’s vector v.
2.2.3 Phased random walk with restart (PRWR)
The Phased Random Walk With Restart exploits the special structure of our graph. Thegraph consists of three layers: experts, documents and tags, with inter-layer edges onlybetween the first and the second layers, and between the second and the third layers. Thestructure of the graph is illustrated in Figure 1. One could think of an expertise search asa two phased process: first look for documents which are most relevant to this expert, andthen search for the most relevant tags for these documents. This motivated us to designthe Phased Random Walk With Restart algorithm. We start by running a RWR over thesubgraph induced from the first two layers only. Let A(1) be the transposed normalizedadjacency matrix of the induced subgraph, then the stable state of the first phase is definedby
v(1) = (1− c)A(1)v(1) + cvi. (5)
We then run a RWR over the subgraph induced from the last two layers, where instead ofstarting at the expert’s node we start randomly at the documents’ nodes according to theprobabilities inferred from the first phase. Let A(2) be the transposed normalized adjacencymatrix of the second induced subgraph, and let v(1)(D) be the vector induced from v(1) bysetting all the entries of nodes other the documents to 0, normalized to sum to 1. Then
v(2) = (1− c)A(2)v(2) + cv(1)(D) (6)
defines the stable state of the second phase. The score of tag t as an expertise of expert i is
score(i, t) = v(2)(t) (7)
where v(2)(t) is defined as before.This model can be generalized to any graph constructed from layers.Another variant of PRWR we examined is instead of using only two layers in each phase
we begin with the full graph and remove the highest layer in each phase. In our case we onlyhave two phases, in which the experts’ layer is removed from the graph in the second phase.We refer to this variant of PRWR as Phased Reducing RWR (PRRWR).
2.3 Extraction of top tags from a tags probabilities vector
All the algorithms output a score for each of the tag nodes in the graph. Our goal is to returna set (of unknown size) of the highest ranked tags. In order to decide how many top tags
4
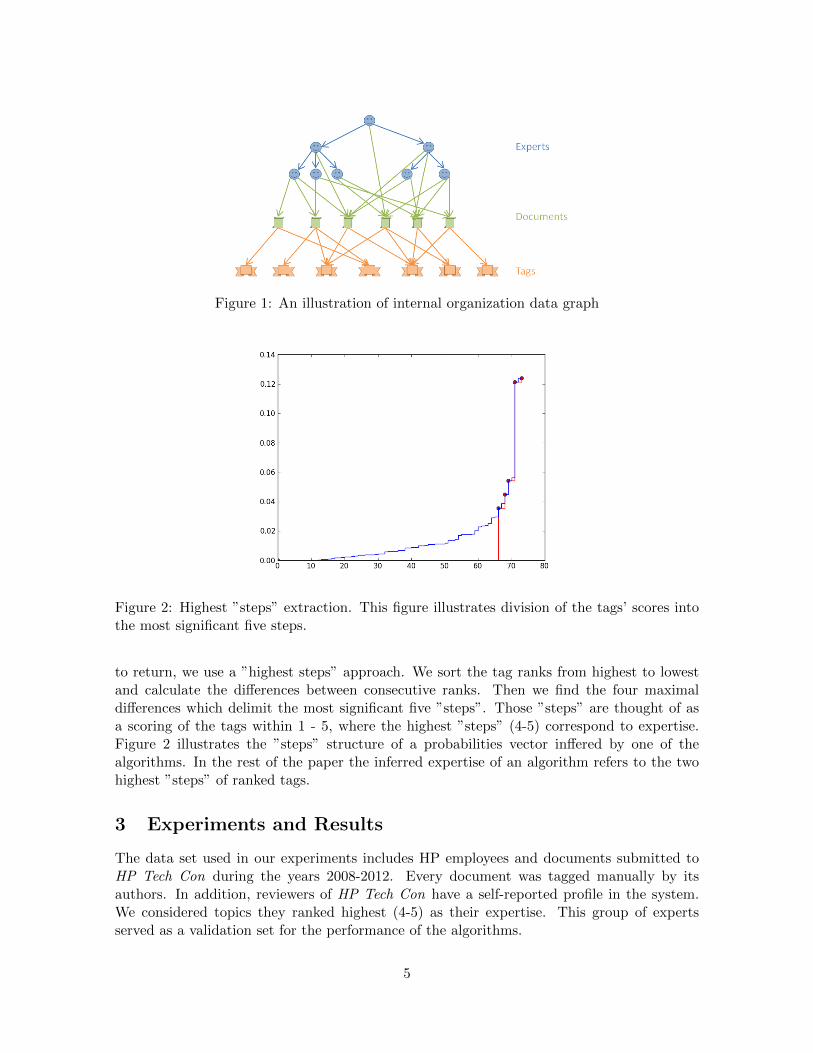
Figure 1: An illustration of internal organization data graph
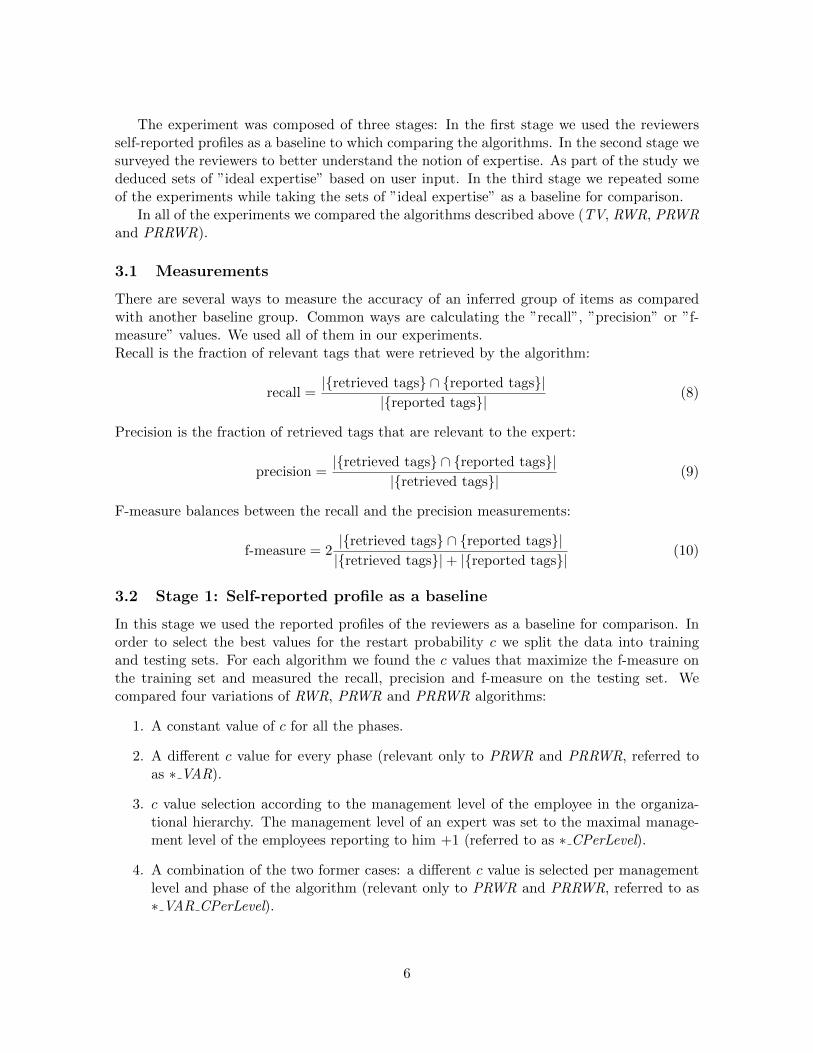
Figure 2: Highest ”steps” extraction. This figure illustrates division of the tags’ scores intothe most significant five steps.
to return, we use a ”highest steps” approach. We sort the tag ranks from highest to lowestand calculate the differences between consecutive ranks. Then we find the four maximaldifferences which delimit the most significant five ”steps”. Those ”steps” are thought of asa scoring of the tags within 1 - 5, where the highest ”steps” (4-5) correspond to expertise.Figure 2 illustrates the ”steps” structure of a probabilities vector inffered by one of thealgorithms. In the rest of the paper the inferred expertise of an algorithm refers to the twohighest ”steps” of ranked tags.
3 Experiments and Results
The data set used in our experiments includes HP employees and documents submitted toHP Tech Con during the years 2008-2012. Every document was tagged manually by itsauthors. In addition, reviewers of HP Tech Con have a self-reported profile in the system.We considered topics they ranked highest (4-5) as their expertise. This group of expertsserved as a validation set for the performance of the algorithms.
5
The experiment was composed of three stages: In the first stage we used the reviewersself-reported profiles as a baseline to which comparing the algorithms. In the second stage wesurveyed the reviewers to better understand the notion of expertise. As part of the study wededuced sets of ”ideal expertise” based on user input. In the third stage we repeated someof the experiments while taking the sets of ”ideal expertise” as a baseline for comparison.
In all of the experiments we compared the algorithms described above (TV, RWR, PRWRand PRRWR).
3.1 Measurements
There are several ways to measure the accuracy of an inferred group of items as comparedwith another baseline group. Common ways are calculating the ”recall”, ”precision” or ”f-measure” values. We used all of them in our experiments.Recall is the fraction of relevant tags that were retrieved by the algorithm:
recall =|{retrieved tags} ∩ {reported tags}|
|{reported tags}|(8)
Precision is the fraction of retrieved tags that are relevant to the expert:
precision =|{retrieved tags} ∩ {reported tags}|
|{retrieved tags}|(9)
F-measure balances between the recall and the precision measurements:
f-measure = 2|{retrieved tags} ∩ {reported tags}||{retrieved tags}|+ |{reported tags}|
(10)
3.2 Stage 1: Self-reported profile as a baseline
In this stage we used the reported profiles of the reviewers as a baseline for comparison. Inorder to select the best values for the restart probability c we split the data into trainingand testing sets. For each algorithm we found the c values that maximize the f-measure onthe training set and measured the recall, precision and f-measure on the testing set. Wecompared four variations of RWR, PRWR and PRRWR algorithms:
1. A constant value of c for all the phases.
2. A different c value for every phase (relevant only to PRWR and PRRWR, referred toas ∗ VAR).
3. c value selection according to the management level of the employee in the organiza-tional hierarchy. The management level of an expert was set to the maximal manage-ment level of the employees reporting to him +1 (referred to as ∗ CPerLevel).
4. A combination of the two former cases: a different c value is selected per managementlevel and phase of the algorithm (relevant only to PRWR and PRRWR, referred to as∗ VAR CPerLevel).
6

Figure 3: The average success rates of the algorithms over 20 different splits of the data fortraining and testing.
In Figure 3 we present the results of the algorithms averaged over 20 different splits fortraining and testing sets. As can be seen from the results the match of all the algorithm ispoor: only about 50% precision and 40% recall. This motivated the rest of our study. Ourgeneral impression was that our algorithms perform better than the results indicate and wewanted to understand how accurate our measurements are.
Another observation is that all the variants of RWR and PRWR gain better results thanthe TV algorithm (about 40% precision and f-measure), in particulary RWR with a constantc value is as good as the other algorithms in all of the three measurements. The immediateconclusion is that simply selecting the tags of the documents written by an expert as herexpertise (TV ) is not sufficient and obtaining expertise from her environment of colleaguesand similar documents gains better results.
In Figure 4 we count the number of times each of the algorithms outputs the resultwith the best accuracy (using f-measure, if more than one algorithm gave the best result allof them count). Here we can see a clear advantage for the PRWR over the simple RWR.In applications for which the number of satisfied users is more important than the averageaccuracy PRWR is preferred.
It is worth mentioning the selection of c values for each of the algorithms. RWR obtainedthe best results with c ≈ 0.2 whereas PRWR and PRRWR obtained best results with c = 0.4.When allowing different c values for each phase we found that the values chosen in the firstphase were smaller than values chosen in the second phase. These results make sense sincethe far one is from the starting point the smaller c needs to be.
To conclude, the results indicate that in the general case the simple RWR is the best.
7

Figure 4: The number of times each algorithm gained the best results (or was one of thealgorithms gained the best results), averaged over 20 different splits of the data for trainingand testing.
3.3 Stage 2: A subject matter expertise survey
To further explore the mismatch between reported expertise and document tags, a surveywas taken among the reviewers of HP Tech Con over the years 2008-2012. The text of theintroduction was as follows:
”We are conducting a study on subject matter expertise. Our goal is to infer an individ-ual’s skill set from their work-products. For our study, we used data from HP Tech Con. Wehave data about your submissions in the years 2008-2012, as well as about your interests andskills as a reviewer. We have created a questionnaire, specifically for you based on this data,which will help us to understand the relationships between expertise and authored papers,and to develop better algorithms to meet our goal. Your personal data will not be disclosed.Your participation will be appreciated.”
The main purposes were:
1. Understanding which of the proposed algorithms best captures the expertise sets fromthe perspective of the participants.
2. Measuring the quality of an automatic expertise retrieval versus a self-reported pro-file. The assumption we are examining is that a self-reported profile is biassed, thusextracting expertise from an individual’s work-products may focus her on her actualexpertise.
3. Creating an ”ideal expertise” for each of the users which we can later use as a baselinefor comparison.
4. Understanding some of the reasons for the fact that topics which were reported by thereviewers or inferred by the algorithms are not relevant.
8

Figure 5: Survey results - percentages of preference among the three automatic algorithms.Intersections mean the algorithms agreed on their outputs.
Past topic 20.25%
An interest 34.48%
Too general 38.68%
Other 37.44%
Table 1: Survey results - average percentage of reasons for irrelevancy of topics as selectedby the participants. One could select more than one reason per topic, thus the values do notsum to 100%.
For each reviewer, in addition to the existing profile, we calculated her expertise usingeach of the algorithms described in Section 2. We then surveyed the reviewers, asking themto select one of the four sets that best captures their fields of expertise. Participants whoselected their own reported profile were asked in addition to select their second preference.In addition, participants were asked to mark topics which they consider irrelevant and topicsthey would add to the set they selected. In the rest of the paper we refer to the set modifiedaccording to a participant’s selections as the her ”ideal expertise” (although it is not literally”ideal” since the participants did not have the option to select topics which did not appearin any of their sets).
154 reviewers answered the survey; 43% of them selected a set other than their profile.Figure 5 shows the full preference breakdown among the three algorithms: Each algorithmis signified by an oval. As in some cases two or even all three algorithms produced the sameexpertise set, there are intersections between these ovals. For example, 18.1% of the timesPRWR was exclusively the best, whilst in 43% RWR and PRWR produced the same expertiseset which was chosen as the best set. In 66% PRWR was one of the preferred algorithms,which makes it the best algorithm comparing to 59% of RWR and 27.5% of TV.
In order to address the last purpose of our survey the participants were asked to selectreasons for marking topics as irrelevant. They were offered three reasons: 1. the topicwas more relevant in the past, 2. the topic describes the participant’s interests rather thanexpertise, 3. The participant considers the topic as a general field of knowledge. Table 1summarizes the results. A significant number of topics were marked by participants as pasttopics - evidence that user profiles are becoming stale.
9

Figure 6: The average success rates of the algorithms, compared with the ideal expertisecreated from the survey results.
3.4 Stage 3: Survey results as a baseline
In the third stage of the experiment we used the ideal expertise of the survey’s participants(Section 3.3) as a baseline for comparison. The average accuracy of the methods’ resultsin comparison with the ideal expertise sets is illustrated in Figure 6 (The methods are, asbefore, TV, RWR, PRWR and the self-reported profiles EX ).
When examining the results according to the precision measurement, which is a standardmeasurement in expertise retrieval, we find that the performance of RWR and PRWR algo-rithms is almost as good as the original reported expertise of the participants, which impliesthat those algorithms can approximate user reported profile quite well. Moreover, the accu-racy of the self-reported profiles is only about 70%, which means that modifying them usingthe algorithms’ results significantly improves them.
4 Graph Properties Relevance and Relations
In this section we examine the relevance of several properties of the graph as well as therelations between them; can some properties compensate for the absence of others?
Let us first describe the graph model in more detail. As mentioned above, the data ofexperts, documents and tags can be modeled as a graph, with several types of edges:
1. An edge (e, d) for every document d ∈ D and each of its authors e ∈ E.
2. An edge (d, t) for every document d ∈ D and each of its tags t ∈ T .
Every other relation between two elements can also be modeled by an edge in the graph. Inour case the following edges also exist:
3. HP’s organizational hierarchy edges: for every employee e ∈ E and his manager m ∈ Ethere is a directed edge (m, e).
10

4. Similarity edges: every two documents d1, d2 ∈ D with a similarity score above somethreshold has a weighted directed edge (d1, d2) with the similarity score as its weight.We measure the similarity of documents using the COURSE algorithm, which wasshown in [5] to perform well, but any other similarity algorithm could be used as well.
Our goal is to examine which of these edges contribute to the performance of the algorithms,should they be directed or undirected, and how does scaling the weights of the similarityedges influences the results.
To answer these questions we compared the f-measure of the algorithms in several differentsettings of the graph:
1. With and without the organizational hierarchy edges
2. With and without the similarity edges between documents
3. Directed (original) graph and undirected graph
In Figure 7 we show the accuracy of the algorithms versus the reviewers’ reported profilesfor several combinations of the above properties. From the results we conclude that:
1. The organizational hierarchy edges improve the results of RWR and PRWR.
2. Similarity edges improve the results of RWR and PRWR only when they need to com-pensate for other missing edges, such as missing or directed hierarchy edges. In thebest configuration similarity edges were irrelevant.
3. Turning the graph to undirected improves the results of RWR and PRWR in all theexamined configurations.
The best configuration we found is an undirected graph with hierarchy edges, with or withoutsimilarity edges. The most significant properties of our graph are the existence of hierarchyedges and directionality. This result proves that we can learn about one’s expertise from herorganizational environment, work products and expertise of her managers and team members.
The importance of undirected edges as well as the irrelevancy of the similarity edgessuggest that allowing the random walker to traverse from one document to others throughtags reduces the need in similarity edges. But, it is often the case that document taggingis lacking; many documents are untagged and for tagged documents tagging is usually donemanually and many relevant tags are omitted. In order to examine the assumption thatsimilarity edges may partly compensate for the missing tags we measured the accuracy of thealgorithms, with and without the similarity edges, simulating lack of tags using three datamodels:
1. The original graph
2. The original graph with randomly selected 50% of the tag nodes filtered out
3. The original graph with randomly selected 80% of the tag nodes filtered out
As expected, we found out that as the percentage of tags which are filtered out gets biggerso does the difference between the success rates of the RWR and PRWR algorithms with andwithout similarity edges. The lower the tagging percentage the bigger is the contribution ofthe similarity edges. The results of RWR and PRWR algorithms are illustrated in Figure 8.
11

Figure 7: A comparison between the average success rates of the algorithms in differentcombinations of properties of the graph. The algorithms’ results are averaged over 20 differentsplits of the data for training and testing and compared with the self-reported profiles of thereviewers.
Figure 8: The average f-measures of the algorithms’ results, compared with the reportedprofiles, once keeping only 50% of the tags and once keeping 20% of them, once with similarityedges and once without them.
12
5 Conclusions
Our research proves that a hybrid approach for expertise retrieval, combining manual feedbackwith automatic algorithms is superior to each of these methods separately.
We propose the following new method for extracting expertise: Construct an undirectedgraph from your data set as described above. In case the tagging of the documents in yourdata set is sparse run COURSE or any other documents similarity algorithm and calculatesimilarity scores between every pair of documents, add those as weighted edges to the graph.Organizational hierarchy edges will also be beneficial. Run PRWR or RWR algorithm onthe graph (PRWR gives better results but since RWR is more general it might be sufficient).Extract the two ”highest steps” from the resulting ranking as described above. If no userprofile is available, use the inferred set as the expertise, or as a baseline for creating a userprofile. If a user profile is available, suggest the results of the algorithm as potential updates.That is, recommend this set as an alternative and allow the user to remove tags from hisprofile and add tags from the offered set. This process can be repeated from time to time sothat the user will be encouraged to update her profile when there is a major change in theresults of the algorithm, probably due to a shift in her interests.
References
[1] http://es.csiro.au/cerc/.
[2] http://research.microsoft.com/en-us/um/people/nickcr/w3c-summary.html.
[3] K. Balog, Y. Fang, M. de Rijke, P. Serdyukov, and L. Si. Expertise retrieval. Foundationsand Trends in Information Retrieval, 6(2-3):127–256, 2012.
[4] O. Barkol, R. Bergman, K. Kasravi, S. Golan, and M. Risov. Enterprise collective:Connecting people via content. Technical report HPL-2012-102R1, HP Labs, 2012.
[5] O. Barkol, S. Golan, R. Vexler, and M. Aharon. Personalized intra-organization search:A matter for course. Technical report, HP Labs, 2012.
[6] G. Frobenius. Ueber Matrizen aus nicht negativen Elementen, pages 456–477. Sitzungsber.Knigl. Preuss. Akad. Wiss., 1912.
[7] T. H. Haveliwala. Topic-sensitive pagerank. In Proceedings of the 11th internationalconference on World Wide Web, WWW ’02, pages 517–526, New York, NY, USA, 2002.ACM.
[8] L. Page, S. Brin, R. Motwani, and T. Winograd. The pagerank citation ranking: Bringingorder to the web, 1999.
13