a study on severe geomagnetic storms and earth’s magnetic...
TRANSCRIPT

M.V.Subramanian. Int. Journal of Engineering Research and Application www.ijera.com
ISSN : 2248-9622, Vol. 6, Issue 10, ( Part -3) October 2016, pp.64-77
www.ijera.com 64 | P a g e
A study on severe geomagnetic storms and earth’s magnetic field
H variations, Sunspots and formation of cyclone
M.V.Subramanian* and S.Jagadesan
PG & Research Department of physics, H.H. The Rajah’s College, Pudukkottai. Tamilnadu.
ABSTRACT For our study, we have selected ten severe geomagnetic storms. Which occurred during the years 1994 to 2015.
Here great geomagnetic storm of Dst index from -422 nT to -17 nT are taken. These storms are significant not
only because of the extremely high magnetic activity but also due to their great impact on the
geomagnetosphere. We have studied the relation between severe geomagnetic storms with Earth’s magnetic
field in horizontal component (H constant) and also studied the relation between Dst index with sunspots
number. The H constant data from Kyoto data centre and Dst index, Ap index, Kp index from OMNI data
centre. We have found that the Dst is at very lowest level in this storm period, Ap index Kp index are increased
in severe geomagnetic storm period and H Constant is at very lowest level in storm period. We have found that
geomagnetic storms were induced to form the cyclones within 29 days. The Sunspots numbers are increased to
induce to geomagnetic storm within 5 – 15 days.
Keywords: H constant, Dst index, Ap index, Kp index, Sunspot number and Cyclone.
I. INTRODUCTION
Solar output in terms of solar plasma and
magnetic field ejected out into interplanetary
medium consequently create the perturbation in the
geomagnetic field. When these plasma and fields
reach the Earth's atmosphere, they produce extra
ionization in the sunlit part of the Earth and
exhibits peculiar storm time charges in the
observed geomagnetic field. Solar wind plasma
constantly flowing out of the sun throughout
interplanetary space at typical speeds of the order
of 400–500 km/s, carrying the Sun's magnetic field
frozen into it (Brandt, 1970). Superposed on this
ambient plasma, there are transient injections of
material, often faster than the solar wind and also
carrying strong magnetic field, known as coronal
mass ejections. Earth's magnetic field, shields Earth
from a variety of interplanetary structures and
forms the cavity known as magnetosphere. If the
solar wind magnetic field is such that its direction
points anti–parallel to Earth's magnetic field,
energy can be injected into the magnetosphere,
increasing the equatorial ring current, causing
geomagnetic storms. Large geomagnetic storms are
usually caused by structures in the solar wind
having specific features, long durations of strong
southward interplanetary magnetic field (IMF)
impinging on the Earth's magnetosphere. These
features are effective in causing geomagnetic
disturbances and are said to be geo effective (Chen,
1996; Chen et al., 1996).
Large geomagnetic storms can cause
deleterious effects on space and ground based
installations. The variation of Earth's magnetic
field, usually expressed through magneto grams,
shows the time variation of declination (D),
vertical component (Z) and horizontal component
(H). However, for global quantitative
representation, various geomagnetic indices have
been introduced [R. Tripathi and A. P.
Mishra.,2006].
Within 24 – 48 hours of a solar flare or
intense solar activity, a plasma cloud of electrons
and protons ejected from an active solar region,
together with an embedded magnetic field, arrives
at the earth. If the direction of the interplanetary
magnetic field is favorable, and if the solar plasma
has sufficient energy density, field and particle
energy enters the earth’s environment and perturbs
its electromagnetic state. it is the H component
which best reflects the storm signature on the
geomagnetic field, and the effect is most prominent
at the equator. The first onslaught of the solar
plasma on the earth’s magnetopause manifests as a
shock wave which leaves its signature on the
ground geomagnetic field as a sharp rise in H
called the storm sudden commencement [Grija
rajaram, 1998].
Geomagnetic storms are disturbances in the
geomagnetic field and in the magnetosphere that
have been studied for more than 200 years (e.g. von
Humboldt 1808; Chapman and Bartels,1940;
Rostoker and Falthammar1967; Gonzalez and
Tsurutani,1987; Gonzalez etal.,1994, 2007;
Tsurutani etal.,1988, 1997, 2006a, 2006b; Echer
and Gonzalez,2004; Gonzalez and Echer,2005;
Guarnieri etal.,2006; Echer etal.,2005a, 2008).
RESEARCH ARTICLE OPEN ACCESS

A study on severe geomagnetic storms and earth’s magnetic field H variations, Sunspots and ..
www.ijera.com 65 | P a g e
Geomagnetic storms are usually defined by
ground-based, low-latitude geo- magnetic field
horizontal component (H) variations. The magnetic
variations are proxies (and indirect measures) for
disturbances in the plasma populations and current
systems present in the magnetosphere (Dessler and
Parker,1959; Sckopke, 1966). It is well known that
the primary inter planetary cause of geomagnetic
storms is the presence of a southward
interplanetary magnetic field structure in the solar
wind (Rostoker and Falthammar1967; Hirshberg
and Colburn,1969; Gonzalez and Tsurutani1987;
Tsurutani and Gonzalez,1987; Tsurutani etal.,1988;
Gonzalez et al.1994, 1994; Echer etal.,2005a,
2005b). This magnetic field orientation allows
magnetic reconnection (Dungey, 1961; Gonzalez
and Mozer,1974; Akasofu, 1981) and energy
transfer from the solar wind to the Earth’s
magnetosphere.
Geomagnetic storms are characterized by
enhanced particle fluxes in the radiation belts.
These enhanced fluxes can be indirectly measured
by decreases in the Earth’s magnetic field
horizontal component caused by the diamagnetic
effect generated by the azimuthal circulation of the
ring current particles. A standard measure of this is
the Dst index, which is approximately proportional
to the total kinetic energy of 20–200 KeV particles
flowing westwardly (as viewed from the northern
hemisphere) in the region of ~ 2– 6 terrestrial
radii(RE), during the storm’s main and recovery
phases. The inner edge of the ring current is located
at 4RE or less from the Earth’s surface during
intense storms. For lesser intensity storms, the ring
current is located further away from the Earth
(Gonzalez etal.,1994; Daglis and Thorne,1999;
Echer etal.,2005a).
The Dst index is derived from hourly
averages of the horizontal component of the geo-
magnetic field, usually recorded at four or six low-
latitude observatories. Dst is the average of the H
fields after the average solar quiet variation and the
permanent magnetic field have been subtracted
from the disturbed one (Sugiura, 1964).
The various magnetic fields, more notably
its shot-term components, is due to disturbances in
the earth’s electromagnetic environment caused by
solar activity. The degree of disturbance in the
magnetic field is indicated by what are called
indices of geomagnetic activity. These are
essentially indices of energy coupling between the
environments of the sun and earth. There have been
several such indices devised for research and
application purpose. The more prominent of these
are Dst, Ap, kp, Cp and AE index based on
geomagnetic pulsation [Grija rajaram, 1998].
The Kp scale is essentially a logarithmic
one. It is often necessary to have a linear scale for
assessing the level of magnetic activity, especially
for correlating with other geophysical phenomena.
This is provided by Ap index (index of planetary
amplitude), which is derived from the Kp index.
[Grija rajaram, 1998].
The aim of the study presented in this
paper is to analyze various characteristics of severe
geomagnetic storms days and their association with
different horizontal component (H), Ap index, Kp
index and Dst index. We have studied the relation
between sunspots numbers and geomagnetic storm
and also relation between geomagnetic storm and
formation of cyclone.
II. SELECTION CRITERIA AND DATA
ANALYSIS
Severe geomagnetic storms that occurred
during 1994–2015, have been compiled. In the
present study, we have analyzed in detail all those
large geomagnetic storms (ten)
(https://www.spaceweatherlive.com/en/auroral-
activity/top-50-geomagnetic-storms) which are
associated with Dst decreases of less than –100nT
and are observed during the period 1994 –2015.
The hourly values of geomagnetic Ap index, Dst
index, kp index, has been obtained by OMNI data
services. The hourly values of Earth’s magnetic
field in horizontal component (H) have been
measured by Kyoto data centre. Station name,
station code, latitude and longitude details (Table
1).
III. RESULTS AND DISCUSSION
The characteristic features of all those
severe geomagnetic storms, which are compiled in
Table 3, are described here. In the following
section we have discussed some of the great events,
illustrating various features of H constant, Ap
index, Dst index and kp index. The Correlation
between sunspots number, cyclone and
geomagnetic field are shown in table2.
August 27 (year 1998) geomagnetic storm
The variations of geomagnetic parameters
are shown in a figure 1, for the period of 26 to 28
August, 1998. The geomagnetic storm day was
27th
August at 22 hours. The Earth magnetic field
was measured in six stations. The stations were
Alibag, Chengdu, Chichijima, Pondicherry,
Tirunelveli and Ujjain. In Alibag, H constant
variation was 389nT. Followed by Chengdu was
175nT, Chichijima was 517nT, Pondicherry was
422nT, Tirunelveli was 382nT and Ujjain was -
31nT.
The Ap index was at peak level at 179nT seen in
the Figure 9. The Kp index was at peak level at
80nT. The Dst index was very lowest level at -
155nT.
We found that with a gap of 8 – 25 days after the
geomagnetic storm induced atmospheric sea level

A study on severe geomagnetic storms and earth’s magnetic field H variations, Sunspots and ..
www.ijera.com 66 | P a g e
pressure and formed the cyclone. Five cyclones in
Atlantic region were formed. The Sunspots number
12th
was 159 as seen in the Figure 17. After 15 days
geomagnetic storms was formed. The sunspots
number increased to induce the geomagnetic storm.
July 15 (year 2000) geomagnetic storm
Figure 2 shows the variation of various
interplanetary geomagnetic parameters, for the
period of 14 to 16 July 2000 and storm day was
15th
July 2000 at 22 hours. Earth magnetic field
was observed in five stations. The stations were
Alibag, chichijima, Moscow, Ujjain and
Visakhapatnam. In Alibag, H constant variation
was 255nT. In chichijima, H constant variation was
432nT. After Moscow was -458nT, Ujjain was -
165nT and Visakhapatnam was 450nT.
We found that the Ap index was peak
level at 400nT seen in the Figure 10. The Kp index
was at peak level at 90nT. The Dst index was at the
very lowest level at -301nT.
We found that after geomagnetic storm induced
atmospheric sea level pressure. Six cyclones in
Atlantic region were formed, three cyclones in
pacific region were formed and seven cyclones in
west north pacific region were formed. The
cyclone formed after occurred the geomagnetic
storm between 2 - 28 days. At the days sunspots
number seen in the Figure 18. July 10th
was 309
and peak value, after five days geomagnetic storms
were formed. The sunspots number increased to
induce the geomagnetic storm.
March 31 (year 2001) geomagnetic storm
The variations of geomagnetic parameters
shown in figure 3, for the period of March 30 to
April 1, 2001. The Earth magnetic field was 31th
March at 09 hours. The Storm was measured in
nine stations. The stations were Alibag, Chengdu,
Chichijima, Moscow, Nagpur, Pondicherry,
Tirunelveli, Ujjain and Visakhapatnam. In Alibag,
H constant variation was 291nT. Followed by
Chengdu was -54nT, Chichijima was 273nT,
Moscow was -151nT, Nagpur was 200nT,
Pondicherry was 437nT, Tirunelveli was 198nT,
Ujjain was -147nT and Visakhapatnam was 304nT.
The Ap index was peak level at 300nT as seen in
the Figure 11. The Kp index was peak level at
87nT. The Dst index was at very lowest level at -
387nT.
We found that with a gap of 17 days after occurred
the geomagnetic storm induced atmospheric sea
level pressure. One cyclone in pacific region was
formed.
The Sunspots number 16th
was 352 as seen in the
Figure 19. After 15 days, geomagnetic storms were
formed. The sunspots number increased to induce
the geomagnetic storm.
November 06 (year 2001) geomagnetic storm
The variation of geomagnetic parameters
shown in a figure 4, for the period of 5th
to 7th
November, 2001. The geomagnetic storm day was
6th
November at 5 hours. Earth magnetic field was
measured in five stations. The stations were
chichijima, Nagpur, Pondicherry, Tirunelveli and
Visakhapatnam. In chichijima, H constant variation
was 545nT. Followed by Nagpur was 246nT
Pondicherry was 407nT, Tirunelveli was 478nT
and Visakhapatnam was 482nT.
The Ap index was peak level at 300nT
seen in the Figure 12. The Kp index was peak level
at 87nT. The Dst index was very lowest level at -
281nT.
We found that after the geomagnetic storm
disturbed atmospheric sea level pressure and
formed the cyclone, one cyclone in Atlantic region
was formed, one cyclone in pacific region was
formed and four cyclones in west north pacific
region were formed. The cyclone formed
occurrence of the geomagnetic storm between 10
- 28 days. The sunspots numbers are gradually
increased as seen in the Figure 20. The sunspots
number increased to induce the geomagnetic storm.
October 29 &30 (year 2003) geomagnetic storm
Figure 5 was a geomagnetic H constant
variation from the 28th
to 31th
of October (2003).
Geomagnetic storm day was 29th
and 30th
October
2003. Earth magnetic Field was observed in four
stations. The stations were Alibag, Moscow,
Pondicherry and Visakhapatnam. In 29th
alibag, H
constant variation was 331nT at 23 hours.
Followed by Moscow was -351nT, Pondicherry
was 491nT and Visakhapatnam was 415nT.
On 30th
Alibag was 204nT seen in the Figure 13.
Moscow was -374nT. Pondicherry was 369nT and
Visakhapatnam was 291nT. The Ap index was
peak level at 300nT. The Kp index was peak level
at 87nT.
On October 29th
, The Dst index was at very lowest
level at -39nT and October 30th was -17nT.
We found that with a gap of six days after occurred
the geomagnetic storm induced atmospheric sea
level pressure, a cyclone in Atlantic region was
formed at Dec 4, 2003. On those days sunspots
number are gradually increased seen in the Figure
21.
November 20 (year 2003) geomagnetic storm
Figure 6 shows the variation of various
interplanetary geomagnetic parameters, for the
period of 19 to 21 July, 2003 and storm day was
20th
July at 20 hours. The Earth magnetic field was
observed in three stations. The stations were
Alibag, Moscow, and Tirunelveli. In Alibag, H
constant variation was -39nT. In Moscow, H
A study on severe geomagnetic storms and earth’s magnetic field H variations, Sunspots and ..
www.ijera.com 67 | P a g e
constant variation was -324nT and Tirunelveli was
-165nT.
The Ap index was at peak level at 300nT as seen in
the Figure 14. The Kp index was at peak level at
87nT. The Dst index was at very lowest level at -
422nT.
We found that with a gap of 14 days after
occurred the geomagnetic storm induced
atmospheric sea level pressure. The geomagnetic
storm was induced to form low pressure level and
formed cyclone. One cyclone in Atlantic region
was formed. The Sunspots number was gradually
increased as seen in the Figure 22. The sunspots
number increased to induce the geomagnetic storm.
July 25 & 27 (year 2004) geomagnetic storm
Figure 7 was similar to Figure 6 but for
the period of 24–28 July, 2004, and it shows the
storm days, 25th
and 27th
October, 2004. Earth
magnetic field was measured in five stations. The
stations were chichijima, Nagpur, Pondicherry,
Tirunelveli and Visakhapatnam. On 25th
chichijima, H constant variation was 369nT at 23
hours. Followed by Nagpur was 326nT,
Pondicherry was 551nT Tirunelveli was 585nT and
Visakhapatnam was 488nT.
On 27th
chichijima, H constant variation
was 366nT. Nagpur was 248nT, Pondicherry was
456nT Tirunelveli was 505nT and Visakhapatnam
was 413nT. The Ap index was peak level at 300nT
seen in the Figure 15. The Kp index was at peak
level at 87nT.
On July 25th
, the Dst index was at very lowest level
at-136nT and October 27th
was -170nT.
We found that after occurred the geomagnetic
storm induced atmospheric sea level pressure, six
cyclones in Atlantic region were formed, three
cyclones in pacific region were formed and seven
cyclones in west north pacific region were formed.
The cyclone formed occurrence of the geomagnetic
storm between 4 – 10 days.
On those days sunspots number peak value seen in
the Figure 23, 14th
was 148 and 19th
was 164, after
5 – 15 days the induced geomagnetic storm was
produced. The sunspots number increased to induce
the geomagnetic storm.
November 10 (year 2004) geomagnetic storm
The variation of geomagnetic parameters
shown in a figure 8, for the period of 9th
to 11th
November, 2004. The geomagnetic storm day was
10th
November at 22 hours. The Earth magnetic
field was measured in five stations. The stations
were chichijima, Moscow, Nagpur, Tirunelveli and
Visakhapatnam. In chichijima, H constant variation
was 199nT. Followed by Moscow was -45nT,
Nagpur was 167nT, Tirunelveli was 438nT and
Visakhapatnam was 333nT.
We found that the Ap index was at peak
level at 300nT as seen in the Figure 16. The Kp
index was peak level at 87nT. The Dst index was
very lowest level at -368nT.
We found that after occurred the geomagnetic
storms disturbed atmospheric sea level pressure.
Four cyclones in pacific region were formed. Four
cyclones in west north pacific were formed. The
cyclone formed after the geomagnetic storm
between 4 - 29 days. The geomagnetic storm
induced to form cyclone.
The sunspots number 2nd
was 119 as seen in the
Figure 24 and peak value after eight days
geomagnetic storms were formed. The sunspots
number increased to induce the geomagnetic storm.
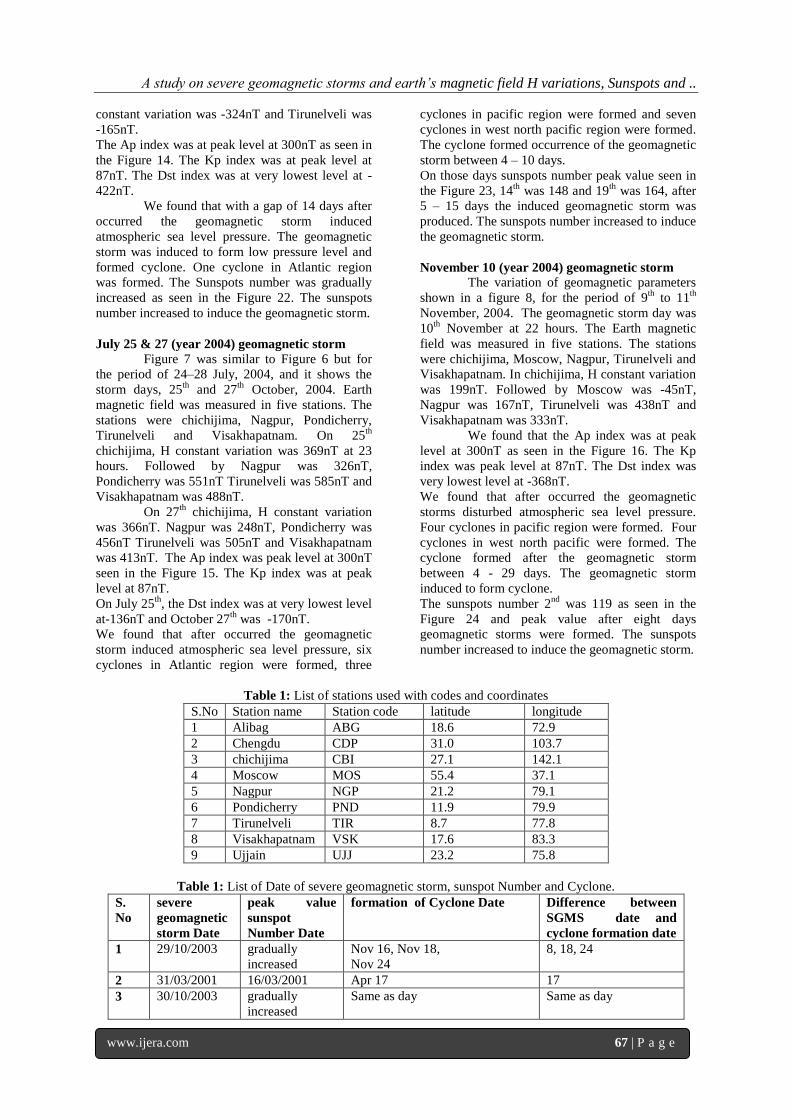
Table 1: List of stations used with codes and coordinates
S.No Station name Station code latitude longitude
1 Alibag ABG 18.6 72.9
2 Chengdu CDP 31.0 103.7
3 chichijima CBI 27.1 142.1
4 Moscow MOS 55.4 37.1
5 Nagpur NGP 21.2 79.1
6 Pondicherry PND 11.9 79.9
7 Tirunelveli TIR 8.7 77.8
8 Visakhapatnam VSK 17.6 83.3
9 Ujjain UJJ 23.2 75.8
Table 1: List of Date of severe geomagnetic storm, sunspot Number and Cyclone.
S.
No
severe
geomagnetic
storm Date
peak value
sunspot
Number Date
formation of Cyclone Date Difference between
SGMS date and
cyclone formation date
1 29/10/2003 gradually
increased
Nov 16, Nov 18,
Nov 24
8, 18, 24
2 31/03/2001 16/03/2001 Apr 17 17
3 30/10/2003 gradually
increased
Same as day Same as day

A study on severe geomagnetic storms and earth’s magnetic field H variations, Sunspots and ..
www.ijera.com 68 | P a g e
4 27/07/2004 19/07/2004 Jul 31, Aug 02, Aug 03, Aug 06,
Aug 09, Aug 13, Aug 17, Aug
18, Aug 19, Aug 23, Aug 24.
4, 6, 7, 9,
12, 16, 20, 21,
22, 27, 28
5 15/07/2000 10/07/2000 Jul 17, Jul 23, Jul 24, Jul 26,
Jul 27, Jul 31, Aug 03, Aug 05,
Aug 09, Aug 10, Aug 13.
2, 8, 9, 11,
12,16, 18, 20,
24, 25, 28
6 10/11/2004 02/11/2004 Nov14, Nov 22, Nov 27, Nov 28,
Dec 09.
4, 12, 17, 18,
29
7 25/07/2004 14/07/2004 27/07/2004 2 days
8 20/11/2003 gradually
increased
Dec 04. 14
9 27/08/1998 12/08/2004 Oct 05, 22. 8, 25
10 06/11/2001 gradually
increased
Nov 16, 18, 24, Dec 04. 10, 12, 18, 28
Table 3: Severe Geomagnetic Storms days, Dst index, Ap index, Kp index.
S. No Date of severe geomagnetic storm Dst (nT) Ap (nT) Kp (nT)
1 29/10/2003 -039 300 84
2 31/03/2001 -387 300 87
3 30/10/2003 -017 300 84
4 27/07/2004 -170 300 87
5 15/07/2000 -301 400 90
6 10/11/2004 -368 300 87
7 25/07/2004 -136 300 87
8 20/11/2003 -422 300 87
9 27/08/1998 -155 179 80
10 06/11/2001 -288 300 87
Figure 1: The Earth’s magnetic field in horizontal (H) component variation from 26
th to 28
th August 1998.
Figure 2: The Earth’s magnetic field in horizontal (H) component variation from 14
th to 16
th July 2000.

A study on severe geomagnetic storms and earth’s magnetic field H variations, Sunspots and ..
www.ijera.com 69 | P a g e
Figure 3: The Earth’s magnetic field in horizontal (H) component variation from March 30
th to April 1
st 2001.
Figure 4: The Earth’s magnetic field in horizontal (H) component variation from 5
th to 7
th November 2001.

A study on severe geomagnetic storms and earth’s magnetic field H variations, Sunspots and ..
www.ijera.com 70 | P a g e
Figure 5: The Earth’s magnetic field in horizontal (H) component variation from 28
th to 31
th October 2003.
Figure 6: The Earth’s magnetic field in horizontal (H) component variation from 19
th to 22
th November 2003.
Figure 7: The Earth’s magnetic field on horizontal (H) component variation from 24
th to 28
th July 2004.

A study on severe geomagnetic storms and earth’s magnetic field H variations, Sunspots and ..
www.ijera.com 71 | P a g e
Figure 8: The Earth’s magnetic field in horizontal (H) component variation from 7
th to 11
th November 2004.
Figure 9: The Kp index Ap index Dst index variation on 27
th August 1998.
Figure 10: The Kp index Ap index Dst index variation on 15
th July 2000.

A study on severe geomagnetic storms and earth’s magnetic field H variations, Sunspots and ..
www.ijera.com 72 | P a g e
Figure 11: The Kp index Ap index Dst index variation on 31
th March 2001.
Figure 12: The Kp index Ap index Dst index variation on 6
th November 2001.
Figure 13: The Kp index Ap index Dst index variation on 28
th and 30
th October 2003.
Figure 14: The Kp index Ap index Dst index variation on 20
th November 2003.

A study on severe geomagnetic storms and earth’s magnetic field H variations, Sunspots and ..
www.ijera.com 73 | P a g e
Figure 15: The Kp index Ap index Dst index variation on 25
th and 27
th July 2004.
Figure 16: The Kp index Ap index Dst index variation on 10
th November 2004.
Figure 17: Sunspots Number variation on 27
th August 1998.
Figure 18: Sunspots Number variation on 15
th July 2000.

A study on severe geomagnetic storms and earth’s magnetic field H variations, Sunspots and ..
www.ijera.com 74 | P a g e
Figure 19: Sunspots Number variation on 31
th March 2001.
Figure 20: Sunspots Number variation on 6
th November 2001.
Figure 21: Sunspots Number variation on 29
th and 30
th October 2003.
Figure 22: Sunspots Number variation on 20
th November 2003.

A study on severe geomagnetic storms and earth’s magnetic field H variations, Sunspots and ..
www.ijera.com 75 | P a g e
Figure 23: Sunspots Number variation on 25
th and 27
th July 2004.
Figure 24: Sunspots Number variation on 10
th November 2004.
IV. CONCLUSION
A solar flare or intense solar activity, a
plasma cloud of electrons and protons ejected from
an active solar region, together with an embedded
magnetic field, arrives at the earth. If the direction
of the interplanetary magnetic field is favorable,
and if the solar plasma has sufficient energy
density, field and particle energy enters the earth’s
environment and perturbs its electromagnetic state.
It is the H component which best reflects the storm
signature on the geomagnetic field, and the effect is
most prominent at the equator. The first onslaught
of the solar plasma on the earth’s magnetopause
manifests as a shock wave which leaves its
signature on the ground geomagnetic field as a
sharp rise in H called the storm sudden
commencement [Grija rajaram, 1998].
The various magnetic fields, more notably
its shot-term components, is due to disturbances in
the earth’s electromagnetic environment caused by
solar activity. The degree of disturbance in the
magnetic field is indicated by what are called
indices of geomagnetic activity. These are
essentially indices of energy coupling between the
environments of the sun and earth [Grija rajaram,
1998].
We have analyzed the relationship
between severe geomagnetic storms and Earth’s
magnetic field in horizontal component (H
constant). Also we have found the relation between
geomagnetic storm and sunspots number, we have
found that Earth’s magnetic field in horizontal
component (H constant) was induced by
geomagnetic storm. In the following days, H
constant value is at very lowest level in
geomagnetic storm period. We have found that Dst
index also is at the very lowest level (Negative
value) in geomagnetic storm days. The Ap index
and Kp index are at the highest level in
geomagnetic storm days. The geomagnetic storms
induced Cyclones were formed after geomagnetic
storm within 29 days. The Sunspots number
increased to induced geomagnetic storms.
We have selected ten severe geomagnetic
storm events taken for analysis; they indicate
various solar and interplanetary characteristics
changes and their corresponding Earth’s magnetic
field effects changes these changes also change
Earth’s atmosphere. For each event, peak Dst
values as well as date and time of their occurrences,
Kp index, Ap index are presented. The event of 20th
November, 2003 with the Dst magnitude was -422
nT and it was the highest geomagnetic storm of the
period 1994 to 2015. The event of 15th
July, 2000
with the Ap index was 400 nT with the highest
storm in the period. The event of 15th
July, 2000
with the Kp index was 90 nT with the highest
storm in the period. The event of 15th
July, 2000

A study on severe geomagnetic storms and earth’s magnetic field H variations, Sunspots and ..
www.ijera.com 76 | P a g e
with the Sunspots Number was 353 with the
highest number of sunspots of the period in
between 1994 to 2015. The sunspots number was
highest number (353) induced the Geomagnetic
storm.
On October 29 &30 (year 2003), we found that
with a gap of six days after occurrence of the
geomagnetic storm induced atmospheric sea
level pressure and cyclone formed, a cyclone
in Atlantic region was formed on Dec 4, 2003.
On those days sunspots number were gradually
increased. The sunspots number induced the
interplanetary magnetic field and also
Geomagnetic storms were induced.
On July 25 & 27 (year 2004), we found that
after occurrence of the geomagnetic storm
induced atmospheric sea level pressure and
form the cyclone. We found six cyclones in
Atlantic region were formed, three cyclones in
Pacific region were formed and seven cyclones
in West North Pacific region were formed. A
cyclone was formed after occurrence of the
geomagnetic storm within 10 days. On those
days sunspots number peak value, 14th
was 148
and 19th
was 164, the sunspots number induced
to form after 5 – 15 days geomagnetic storm.
On July 15 (year 2000), we found that
occurrence of the geomagnetic storm induced
atmospheric sea level atmospheric pressure
and form cyclone, Six cyclones in Atlantic
region were formed, three cyclones in Pacific
region were formed and seven cyclones in
West North Pacific region were formed. The
cyclone formed occurrence of the geomagnetic
storm within 28 days. At that days sunspots
number was July 10th
309 and it was peak
value, the sunspots number gradually increased
to induce interplanetary magnetic field and
after five days geomagnetic storms were
formed.
On November 10 (year 2004), we found that
after occurrence of the geomagnetic storms
induced the atmospheric sea level pressure and
form the cyclone, Four cyclones in Pacific
region were formed. Four cyclones in West
North Pacific were formed. Cyclone was
formed occurrence of the geomagnetic storm
within 29 days. The sunspots number 2nd
was
119 it was peak value the sunspots number
induced interplanetary magnetic field and after
eight days geomagnetic storms were formed.
On November 20 (year 2003), we found that
with a gap of 14 days after occurrence of the
geomagnetic storm induced the atmospheric
sea level atmospheric pressure and form the
cyclone, One cyclone in Atlantic region was
formed. The Sunspots number was gradually
increased to induce the Geomagnetic storms.
On August 27 (year 1998), we found that with
a gap of 8 – 25 days occurrence of the
geomagnetic storm induced the atmospheric
sea level pressure and form the cyclone, Five
cyclones in Atlantic region were formed. The
Sunspots number 12th
was 159. The sunspots
number increased to induce after 15 days
geomagnetic storms were formed.
On November 06 (year 2001), we found that
after occurrence of the geomagnetic storm
induced the atmospheric sea level pressure and
form the cyclone, one cyclone in Atlantic
region was formed, one cyclone in Pacific
region was formed and four cyclones in West
North Pacific region were formed. The
cyclones were formed occurrence of the
geomagnetic storm between 10 - 28 days.
The sunspots numbers are gradually increased
to induced interplanetary magnetic field and
form Geomagnetic storms.
On March 31 (year 2001), we found that with a
gap of 17 days occurrence of the geomagnetic
storm induced atmospheric sea level pressure
and the cyclone was formed, One cyclone in
Pacific region was formed. The Sunspots
number 16th
was 352. After 15 days, the
sunspots number gradually increased to
induced interplanetary magnetic field and
geomagnetic storms were formed.
REFERENCES [1]. Dessler, A.J., Parker, E., 1959. Hydro
magnetic theory of magnetic storms. J.
Geophys. Res. 64, 2239–2259.
[2]. Sckopke, N., 1966. A general relation
between energy of trapped particles and
disturbance field near earth. J. Geophys.
Res. 71, 3125.
[3]. Gonzalez, W.D., Joselyn, J.A., Kamide,
Y., Kroehl, H.W., Rostoker, G., Tsurutani,
B.T., Vasyliunas, V., 1994. What is a
geomagnetic storm. J. Geophys. Res. 99,
5771–5792.
[4]. Daglis, I.A., Thorne, R.M., 1999. The
terrestrial ring current: origin, formation,
and decay. Rev. Geophys. 37, 407–438.
[5]. Echer, E., Gonzalez, W.D., Guarnieri,
F.L., Dal Lago, A., Schuch, N.J., 2005a.
Introduction to Space Weather. Adv.
Space Res. 35, 855–865.
[6]. Sugiura, M., 1964. Hourly values of
equatorial Dst for the IGY. Annual
International Geophysical Year, vol. 35.
Pergamon, New York, p. 9.
[7]. Gonzalez, W.D., Joselyn, J.A., Kamide,
Y., Kroehl, H.W., Rostoker, G., Tsurutani,
B.T., Vasyliunas, V., 1994. What is a
geomagnetic storm. J. Geophys. Res. 99,
5771–5792.

A study on severe geomagnetic storms and earth’s magnetic field H variations, Sunspots and ..
www.ijera.com 77 | P a g e
[8]. Tsurutani, B. T., et al. (1997), Preface,
AGU Geophys. Monogr. 98, Magn.
Storms, ix–x.
[9]. Gonzalez, W.D., Joselyn, J.A., Kamide,
Y., Kroehl, H.W., Rostoker, G., Tsurutani,
B.T., Vasyliunas, V., 1994. What is a
geomagnetic storm. J. Geophys. Res. 99,
5771–5792.
[10]. Daglis, I. A., et al. (1999), The terrestrial
ring current: Origin, formation and decay,
Rev. Geophys., 37(4), 407– 438.
[11]. Dungey, J.W. Interplanetary magnetic
field and the auroral zones. Phys. Rev.
Lett. 6, 47–48, 1961.
[12]. Gonzalez, W.D., Joselyn, J.A., Kamide,
Y., Kroehl, H.W., Rostoker, G., Tsurutani,
B.T., Vasyliunas, V., 1994. What is a
geomagnetic storm. J. Geophys. Res. 99,
5771–5792.
[13]. Gonzalez, W.D., Tsurutani, B.T., Clu´a de
Gonzalez, A.L. Interplanetary origin of
geomagnetic storms. Space Sci. Rev. 88,
529–562, 1999.
[14]. Kamide, Y., Baumjohann, W., Daglis,
I.A., Gonzalez, W.D., Grande, M.,
Joselyn, J.A., McPherron, R.L., Phillips,
J.L., Reeves, E.G.D., Rostoker, G.,
Sharma, A.S., Singer, H.J., Tsurutani,
B.T., Vasyliunas, V.M. Current
understanding of magnetic storms: storm–
sub storm relationships. J. Geophys. Res.
103, 17705–17728, 1998.
[15]. Gonzalez, W.D., Joselyn, J.A., Kamide,
Y., Kroehl, H.W., Rostoker, G., Tsurutani,
B.T., Vasyliunas, V., 1994. What is a
geomagnetic storm. J. Geophys. Res. 99,
5771–5792.
[16]. Tsurutani, B. T., and W. D. Gonzalez
(1997), The interplanetary causes of
magnetic storm, in Magnetic Storms,
Geophys. Monogr. Ser., vol. 98, edited by
B. T. Tsurutani et al., p. 77, AGU,
Washington, D. C.
[17]. Burton, R. K., R. L. McPherron, and C. T.
Russell (1975), Empirical relationship
between interplanetary conditions and Dst,
J. Geophys. Res., 80, 4204– 4214.
[18]. Kamide, Y., Baumjohann, W., Daglis,
I.A., Gonzalez, W.D., Grande, M.,
Joselyn, J.A., McPherron, R.L., Phillips,
J.L., Reeves, E.G.D., Rostoker, G.,
Sharma, A.S., Singer, H.J., Tsurutani,
B.T., Vasyliunas, V.M. Current
understanding of magnetic storms: storm–
sub storm relationships. J. Geophys. Res.
103, 17705–17728, 1998.
[19]. R. Tripathi., and A. P. Mishra., (2006),
Occurrence of severe geomagnetic storms
and their association with solar–
interplanetary features. ILWS Workshop
2006, GOA, February 19-24, 2006.
[20]. J. C. Brandt, Introduction to the Solar
Wind, SanFrancisco, 1970.
[21]. J. Chen, “Theory of prominences eruption
and propagation: Interplanetary
consequences”, J. Geophys. Res., vol. 101,
p. 27499, 1996.
[22]. J. Chen, P. J. Cargill and P. J. Palmadesso,
“Real–time identification and prediction
of geoeffective solar wind structures”,
Geophys. Res. Lett., vol. 23, p. 625, 1996.
[23]. Grija Rajaram and P. R.Pisharoty, “The
Earth magnetic field”, Oxford & IBH
Publishing.co.pvt.ltd. April 1998. p.136-
138.