a study on mutual funds program with reference to banks
TRANSCRIPT

ISSN: 2455-2631 © February 2021 IJSDR | Volume 6 Issue 2
IJSDR2102051 www.ijsdr.orgInternational Journal of Scientific Development and Research (IJSDR) 356
A Study on Mutual Funds program with Reference to
Banks
Bellaji Vishnu Vardhan Reddy, Ch. Shivapriya
Department of Business Management
Anurag University
Abstract: Mutual funds mobilize the savings of the people and channelize it to the money and capital market. One of the main
advantages of mutual funds over any other investment to small investor is that they give small investors access to
professionally managed, diversified portfolio of equities, bonds and other securities, which is rather impossible for a small
investor to create with a small amount of capital he/ she owns. Mutual funds constitute a very important component of the
capital market in developed countries and are now becoming vibrant in emerging markets like India. The origin of mutual
funds industry in India can be traced in the enactment of the Unit Trust of India (UTI) Act in 1963. Due to historic reasons,
the UTI enjoyed the total monopoly in the initial years and until now continues to maintain the largest market share. The
industry has now moved from complete monopoly to that of a monopolistic competition. Presently, the share of Net Assets of
mutual funds is more than 7 percent of India’s gross domestic product (GDP). Also, the monies accredited to mutual funds
form an adequate part of gross domestic savings (GDS) in the country. This indicates the important place of mutual funds as
an investment vehicle in the country. Majority of the money parked in mutual funds come from the institutional segment
including corporates, banks and foreign institutional investors (FIIs).
Keywords: Capital market, Investment patterns, Market share, Mutual Funds.
Introduction: Mutual Fund is a trust that pools the savings of a number of investors who share a common financial goal. This pool
of money is invested in accordance with a state objective. The joint ownership of the fund is thus “Mutual”, i.e. the fund belongs to
all investors.
The money thus collected is then invested in capital market instrument such as shares, debentures, and other securities. The income
earned through these investments and the capital appreciations realized are shared by its unit holders in proportions the number of
units owned by them. Thus a Mutual Fund is the most suitable investment for the common man as it offers an opportunity to invest
in a diversified, professionally managed basket of securities at a relatively low cost.
A Mutual Fund is an investment tool that allows small investors access to a well-diversified portfolio of equities, bonds and other
securities. Each shareholder participates in the gain or loss of the fund.
Objectives: To know the extent of Mutual Funds in earing returns over fixed deposits or savings account, to analyze the way of
investment pattern in Mutual Funds by customers and to know the banking operations carried on with respect to Mutual Funds.
Research Methodology: Detailed information which is relevant to the project is gathered by visiting the different banks.
Secondary data is used only for the reference and it has been collected through various journals and websites.
Company Profile:
SBI: The State Bank of India (SBI) is an Indian multinational, public sector banking and financial services statutory body. It is
a government corporation statutory body headquartered in Mumbai, Maharashtra. SBI is ranked as 236th in the Fortune Global 500
list of the world's biggest corporations of 2019. It is the largest bank in India with a 23% market share in assets, besides a share of
one-fourth of the total loan and deposits market.
SBI is an Indian multinational, Public Sector banking and financial services company. SBI is one of India’s major banks and is an
industry leader in terms of size, business sector promotion and initiatives for the progress and economic enhancement of the Indian
economy. SBI is entering into many new businesses with strategic tie ups – Pension Funds, General Insurance, Custodial Services,
Private Equity, Mobile Banking, Point of Sale Merchant Acquisition, Advisory Services, organized items and so on – every one of
these activities having a massive potential for development.
Housing Development Finance Corporation Limited
HDFC Bank Limited is an Indian financial services company based in Mumbai, Maharashtra that was incorporated in August 1994.
HDFC Bank is the fifth or sixth largest bank in India by assets and the first largest bank by market capitalization as of November 1,
2012. The bank was promoted by the Housing Development Finance Corporation, a premier housing finance company (set up in
1977) of India.
BANK OF BARODA: Bank of Baroda (BOB) was founded by Maharaja Sayajirao Gaekwad in July 1908. It started with a paid-
up capital of Rs 10 lakh. Bank of Baroda is a pioneer in various customer centric initiatives in the Indian banking sector. Bank is
amongst first in the industry to complete an all–inclusive rebranding exercise wherein various novel customer centric initiatives
were undertaken along with the change of logo. The initiatives include setting up of specialized NRI Branches, Gen–Next Branches
and Retail Loan Factories/ SME Loan Factories with an assembly line approach of processing loans for speedy disbursal of loans.

ISSN: 2455-2631 © February 2021 IJSDR | Volume 6 Issue 2
IJSDR2102051 www.ijsdr.orgInternational Journal of Scientific Development and Research (IJSDR) 357
Data analysis and interpretation:
2. What is the preferred way of communication to your customers about Mutual Funds?
Table 1: Table showing preferred way of communication to their customers about Mutual Funds
Mode No. of respondents Percentage
Directly to the
customers 25 41.6
media 10 16.6
Internet 24 40
Telephone 1 1.6
TOTAL 60 100%
Fig.1. Graph showing the percentage of mode of communication
Interpretation: By seeing the graph, we can understand that out of 60 respondents, most of the banks prefer to communicate
directly with their customers about Mutual Funds and also use internet to communicate with their customers
3. While investing in Mutual Funds, which factors customers prefer most?
Table 2: Table showing factors that customers prefer the most
Factors No. of respondents percentage
Liquidity 13 21.6
low risk 37 61.6
high returns 10 16.6
company reputation 0 0
Total 60 100
Modes
Directly to the customers Media Internet Telephone

ISSN: 2455-2631 © February 2021 IJSDR | Volume 6 Issue 2
IJSDR2102051 www.ijsdr.orgInternational Journal of Scientific Development and Research (IJSDR) 358
Fig 2: Graph showing the percentage of factors that customers prefer the most
Interpretation:
By seeing the graph, we can understand that out of 60 respondents, most of customers of banks prefer Mutual Funds for low risk
and also invest by seeing opportunity of liquidity. Some people invest in mutual funds by expecting high returns.
4. Which type of Mutual Funds scheme do you suggest to your customers?
Table 3: Table showing the type of Mutual Fund schemes that bankers suggest to their customers
Type of scheme No. of respondents Percentage
Growth 8 13.33
Income 24 40
Balanced 28 46.66
Total 60 100
Factors
Liquidity Low risk High returns Company reputation

ISSN: 2455-2631 © February 2021 IJSDR | Volume 6 Issue 2
IJSDR2102051 www.ijsdr.orgInternational Journal of Scientific Development and Research (IJSDR) 359
Fig 3: Graph showing the percentage of type of schemes that bankers suggest to their customers
Interpretation:
By seeing the graph, we can understand that out of 60 respondents, most of the bankers suggest their customers to invest in balanced
schemes because of the low risk or diversification of the risk.
5. Which mode of investment does your customers prefer?
Table 4: Table showing mode of investment preferred by customers
Mode of investment No. of respondents Percentage
SIP 44 73.33
One-time investment plan 16 26.66
Total 60 100
Fig 4: Graph showing the percentage of mode of investment preferred by customers
Type of schemes
Growth Income Balanced
Mode of investment
SIP One time investment plan

ISSN: 2455-2631 © February 2021 IJSDR | Volume 6 Issue 2
IJSDR2102051 www.ijsdr.orgInternational Journal of Scientific Development and Research (IJSDR) 360
Interpretation:
By seeing the graph, we can understand that out of 60 respondents, most of the investors prefer investing in the Mutual Funds
through SIP.
6. Which kind of investors do you regularly see?
Table 5: Table showing kind of investors that bankers regularly see
Kind of investors No. of respondents percentage
Risk averse 39 65
Moderate risk taker 21 35
High risk taker 0 0
Total 60 100
Fig 5: Graph showing the percentage of kind of investors
Interpretation:
By seeing the graph, we can understand that out of 60 respondents, most of the customers of the banks who invest their savings in
Mutual Funds are risk averse.
7. Most of your Mutual Fund customers in your bank are from
Table 6: Table showing the customers from the sector they belong to
Type of
customers No. of respondents Percentage
Government 5 8.33
Private Sector 26 43.33
Business 23 38.33
Agriculture 3 5
Others 3 5
Total 60 100
Kind of investors
Risk averse Moderate risk taker High risk taker

ISSN: 2455-2631 © February 2021 IJSDR | Volume 6 Issue 2
IJSDR2102051 www.ijsdr.orgInternational Journal of Scientific Development and Research (IJSDR) 361
Fig 6: Graph showing the percentage of customers from the sector they belong to
Interpretation:
By seeing the graph, we can understand that out of 60 respondents, most of the customers who invest in Mutual Funds are business
persons and also from private sector.
8. Through which channel your customers invest in Mutual Funds?
Table 7: Table showing channels through which the customers invest in Mutual Funds
Channel No. of respondents percentage
Directly from AMC 36 60
Brokers 12 20
Sub Brokers 12 20
Other sources 0 0
Total 60 100
Type of customers
Government Private sector Business Agriculture Others

ISSN: 2455-2631 © February 2021 IJSDR | Volume 6 Issue 2
IJSDR2102051 www.ijsdr.orgInternational Journal of Scientific Development and Research (IJSDR) 362
Fig 7: Graph showing the percentage of channels through which the customers invest in Mutual Funds
Interpretation:
By seeing the graph, we can understand that out of 60 respondents, most of the investors invest in Mutual Funds through AMC’s
and very less people are through Brokers and Sub Brokers.
9. How much percentage of your customers are continuously following up about their investments?
Table 8: Table showing the percentage of customers who continuously follow up their investments
Percentage of customers No. of respondents Percentage
10-20% 5 8.33
20-30% 32 53.33
30-40% 21 35
40-50% 2 3.33
Above 50% 0 0.00
Total 60 100
Channels
Directly from AMC Brokers Sub Brokers Other Sources

ISSN: 2455-2631 © February 2021 IJSDR | Volume 6 Issue 2
IJSDR2102051 www.ijsdr.orgInternational Journal of Scientific Development and Research (IJSDR) 363
Fig 8: Graph showing the percentage of customers who continuously follow up their investments
Interpretation:
By seeing the graph, we can understand that out of 60 respondents, 20-30% of customers are following up their investments.
10. Is there a need for creating awareness among the public about the benefits of investing the Mutual Funds?
Table 9: Response given by bankers for creating awareness about benefits of investing in Mutual Funds
Response No. of respondents percentage
Yes 58 96.66
No 2 3.33
Total 60 100
Fig 9: Graph showing the percentage of response given by bankers about creating awareness
Percentage of customers
10-20% 20-30% 30-40% 40-50% Above 50%
Response
Yes No

ISSN: 2455-2631 © February 2021 IJSDR | Volume 6 Issue 2
IJSDR2102051 www.ijsdr.orgInternational Journal of Scientific Development and Research (IJSDR) 364
Interpretation:
By seeing the graph, we can understand that out of 60 respondents, most of the bankers opinion is that there is a need for creating
awareness among the public about the benefits of investing in the Mutual Funds.
11. Does your bank arranges campaigns to create awareness on Mutual Funds?
Table 10: Response given by bankers about campaigns to create awareness on Mutual Funds
Response No. of respondents Percentage
Yes 53 88.33
No 7 11.66
Total 60 100
Fig 10: Graph showing the percentage of response given by bankers about campaigns
Interpretation:
By seeing the graph, we can understand that out of 60 respondents, most of the banks are conducting awareness campaigns for the
Mutual Funds.
12. Average age of customers taking Mutual Funds in your banks?
Table 11: Table showing the average age of customers taking Mutual Funds
Age No. of respondents Percentage
20-25
years 4 6.66
25-30 38 63.33
30-35 18 30
Above 35 0 0
Total 60 100
Response
Yes No

ISSN: 2455-2631 © February 2021 IJSDR | Volume 6 Issue 2
IJSDR2102051 www.ijsdr.orgInternational Journal of Scientific Development and Research (IJSDR) 365
Fig 11: Graph showing the percentage of age of customers taking Mutual Funds
Interpretation:
By seeing the graph, we can understand that out of 60 respondents, average age of customers who invest in Mutual Funds is 25-30
years and also mostly by the people age between 30-35 years and very less people from age 20-25 years.
13. Do customers have the option of buying Mutual Funds online?
Table 12: Table showing whether the customers have the option of buying Mutual Funds online
Response No. of respondents percentage
Yes 60 100
No 0 0
Total 60 100
Age of customers
20-25 years 25-30 30-35 Above 35

ISSN: 2455-2631 © February 2021 IJSDR | Volume 6 Issue 2
IJSDR2102051 www.ijsdr.orgInternational Journal of Scientific Development and Research (IJSDR) 366
Fig 12: Graph showing the percentage of response given by bankers about option of buying online
Interpretation:
By seeing the graph, we can understand that out of 60 respondents, most of the banks are maintaining the Mutual Funds through
online.
14. What is the percentage of customers increased after selling through online?
Table 13: Table showing the percentage of customers increased after selling through online
Response No. of respondents percentage
5-10% 7 11.66
10-15% 22 36.66
15-20% 31 51.66
Above 20% 0 0.00
Total 60 100
Response
Yes No
ISSN: 2455-2631 © February 2021 IJSDR | Volume 6 Issue 2
IJSDR2102051 www.ijsdr.orgInternational Journal of Scientific Development and Research (IJSDR) 367
Fig 13: Graph showing the percentage of customers increased after selling through online
Interpretation:
By seeing the graph, we can understand that out of 60 respondents, 15-20% of customers have increased after selling the Mutual
Funds through online. Some say that above 20% of customers have increased after selling the Mutual Funds through online.
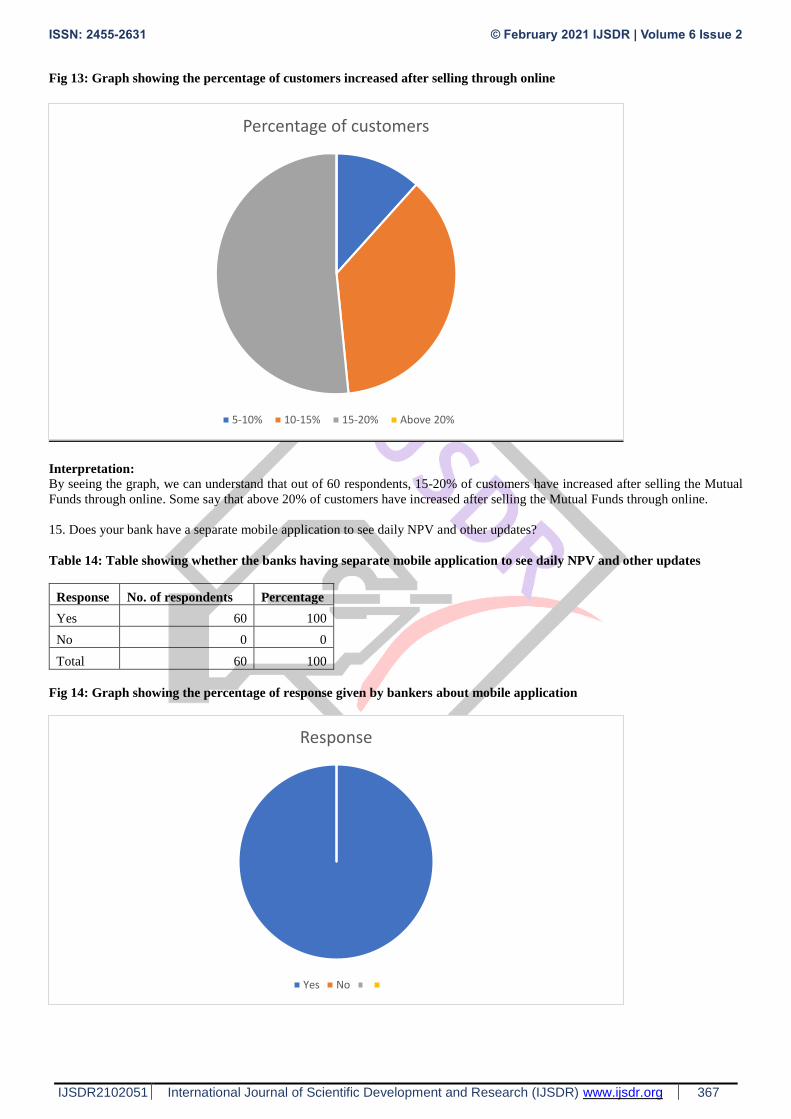
15. Does your bank have a separate mobile application to see daily NPV and other updates?
Table 14: Table showing whether the banks having separate mobile application to see daily NPV and other updates
Response No. of respondents Percentage
Yes 60 100
No 0 0
Total 60 100
Fig 14: Graph showing the percentage of response given by bankers about mobile application
Percentage of customers
5-10% 10-15% 15-20% Above 20%
Response
Yes No

ISSN: 2455-2631 © February 2021 IJSDR | Volume 6 Issue 2
IJSDR2102051 www.ijsdr.orgInternational Journal of Scientific Development and Research (IJSDR) 368
Interpretation:
By seeing the graph, we can understand that out of 60 respondents, now-a-days every bank is maintaining their own mobile
application for the convenience of their customers.
16. Do you have a separate customer support for Mutual Funds?
Table 15: Table showing the percentage of banks having separate customer support for Mutual Funds
Response No. of respondents percentage
Yes 60 100
No 0 0
Total 60 100
Fig 15: Graph showing the percentage of banks having separate customer support for Mutual Funds
Interpretation:
By seeing the graph, we can understand that out of 60 respondents, Now-a-days every bank is treating their customers very carefully
and supporting for in every situation.
17. Does your customers are pushed to buy Mutual Funds while opening a savings account with your bank?
Table 16: Response given by bankers regarding the purchase of Mutual Funds by their customers
Response No. of respondents Percentage
Yes 19 31.66
No 41 68.33
Total 60 100
Response
Yes No

ISSN: 2455-2631 © February 2021 IJSDR | Volume 6 Issue 2
IJSDR2102051 www.ijsdr.orgInternational Journal of Scientific Development and Research (IJSDR) 369
Fig 16: Graph showing the percentage of response given by bankers regarding the purchase of Mutual Funds by their
customers
Interpretation:
By seeing the graph, we can understand that out of 60 respondents, most of the bankers say that no customer is pushed to buy the
Mutual Funds in any banks.
Findings:
Most of the banks are selling Mutual Funds from last 25 years.
Most of the bankers feel that public need more awareness towards Mutual Funds.
By conducting awareness campaigns and by advertisements the public can be more aware of Mutual Funds.
Most of the customers invest their savings in Mutual Funds for the diversification of the risk and for the liquidity purpose
even though they are getting less returns.
Most of the bankers prefer balanced Mutual fund schemes to invest.
Most Government banks or nationalized banks don’t really bother about the mutual funds in their banks.
Now-a-days, almost every bank is using mobile applications for the ease of customers services.
Customers who invest their savings in Mutual Funds do follow up their investments regularly through online applications.
There is a scope for earning higher returns in mutual funds when compared to fixed deposits because the rate of interest in
fixed deposits is fixed and the rate in mutual funds varies according to the market fluctuations. Portfolio diversification is
always helpful.
Conclusion:
The survey is conducted among 60 respondents and I observed few things where customer relationship should improve. Investing
in a Mutual Fund is best option for the investors irrespective of their knowledge upon the stock markets and the Mutual Funds
because the funds of the investor are effectively managed by the professional fund managers by investing in the various business
of various sectors rather than confiding to single corporate entity nor the single industry sector.
There are several aspects need to considered before choosing either Asset Management Company or Scheme.
“Mutual Fund is like appointing an driver to drive a vehicle rather than Self-Driving
References:
www.timesofindia.com
Sales
Yes No