a study on job satisfaction of women faculties in self...
TRANSCRIPT

A Study on Job Satisfaction of Women Faculties in SelfFinancing Colleges
Megha RastogiResearch Scholar, TMU
ABSTRACTThe starting of 'self financing' colleges has been implemented for the last three decades in UttarPradesh and other parts of India. The Government does not financially support these colleges. The'job satisfaction' of faculties working in such colleges is always questionable. The present studyaims at studying job satisfaction among the women faculties of self-financing colleges in westernpart of Uttar Pradesh. The job dissatisfaction of women faculties may lead to less involvement inteaching. Data were collected from 120 women college faculties of different self-financingcolleges in and around western Uttar Pradesh by adopting random sampling technique with theprime objectives to assess the level of job satisfaction and to suggest appropriate measures toimprove the level of job satisfaction. The study has found the determinants of job satisfactionindicated that among different variables, satisfaction variables were positively related tofaculty-student relationship, job involvement and role change while, salary, discipline and workenvironment were negatively related with job satisfaction among women faculties.
Keywords: Job Satisfaction, Self-Financing Colleges, Women Faculties, Job Related Factors.
INTRODUCTIONJob satisfaction is an elusive, even mythical, concept that has been increasingly challenged andrefined particularly since the Herzberg, Mauser and Synderman study in 1959. The most importantinformation to have regarding an employee in an institution is a validated measure of his/her levelof job satisfaction (Roznowski and Hulin, 1992). A better understanding of job satisfaction andfactors associated with it helps top level management in educational institutions guide employees'activities in a desired direction. The morale of employees is a deciding factor in the institution'sefficiency (Chaudhary and Banerjee, 2004).Since job is a critical part of most peoples' lives, employees have various feeling about their job. Itis these feelings also known as attitudes that determine job satisfaction. Work related attitudes arethe vital aspect of job satisfaction because they determine how enjoyable or unenjoyable a personfeels a job is or will be. The affective component encompasses the good and bad feelings about ajob, such as how people feel about their supervisors, co-workers, salaries, fringe benefits, officesettings and commute to work. This information can be based on facts, conjecture and rumors. Anda person's predisposition to respond in a favourable or unfavourable way to things on a job is thebehavioural component. This aspect of an attitude determines the course of action a personchooses.Flowers and Hughes (1973) developed the notion of the relationship between job satisfaction andenvironmental factors. Pearson and Seiler (1983) found that academics were generally moresatisfied than dissatisfied with their work environment, but there were high levels ofdissatisfaction with compensation-related elements of the job(e.g., fringe benefits, pay andperformance criteria). Besides, the higher order needs tended to dominate in university settings,where academics generally have a high degree of control over content factors, including the
TMIMT International Journal: Volume-3, Issue 2, December,2016, ISSN 2348-988X | Available at: www.tmimtjournal.org

process of teaching and molding minds. By contrast, academics generally have limited controlover context factors, such as the university or college environment in which the teaching andresearch processes take place. However, the closure of academic departments and institutions,what are characterised as "attacks" on tenure, and the institution of longer probation periods, haveresulted in a fear of job loss for untenured academics and sense that their lower order needs forsecurity are threatened.The pattern of job changes also gives some weight to the thesis that job satisfaction levels, as likelyto be reflected in decisions to change jobs, are more determined by the perceptions of a supportive'culture'. When faculty change jobs, they do not confirm to the rational economic labour marketmodel (i.e., they do not put very much weight on extrinsic factors such as income) and that suchdecisions are influenced by intrinsic motives, such as seeking opportunities for professionalgrowth through compatible work activities and colleagues. In short, academics who found theirwork less intrinsically satisfying than others, more commonly intended to leave the institutions.Salary or economic resources as did not appear to influence intentions to stay or go. Moreover, the'climate' or 'culture' of the environment in which academics work has a large influence on theirfeelings of satisfaction with the job as a whole, and their commitment to stay in the job rather thanseeking to fulfill intrinsic needs elsewhere.
OBJECTIVES OF THE STUDYThe motivation to investigate the degree of job satisfaction arises from the fact that a betterunderstanding of faculties is desirable to achieve a higher level of motivation which is directlyassociated with student achievement. Since, women constitute 48.46 per cent of the population ofIndia and play a very crucial role in the development of society and education at all levels, thepresent study was attempted to study on job satisfaction of women faculties in Self-FinancingColleges in Western Uttar Pradesh with the following specific objectives:
1. To identify the level of job satisfaction of women faculties working in self-financingcolleges located in and around Western Uttar Pradesh.
2. To analyse the determinants of job satisfaction.3. To suggest appropriate measures to improve the level of job satisfaction.
METHODOLOGYAmong the regions of Uttar Pradesh, the self-financing colleges in and around Western UttarPradesh is selected. The data and information were collected from the women faculties inself-financing colleges in and around Western Uttar Pradesh by adopting random samplingtechnique and the sample size is 120.
TOOLS APPLIED FOR THE STUDYThe descriptive statistics, correlation and multiple regression techniques are used to analyse thedata and information collected from the respondents.Descriptive statistics and frequency distribution were extensively used to detect the pattern ofdemographic and socio-economic conditions of the female faculties. The correlation analysis wascarried out to describe the relationship between women faculties overall job satisfaction and themotivational and Socio-Economic factors.
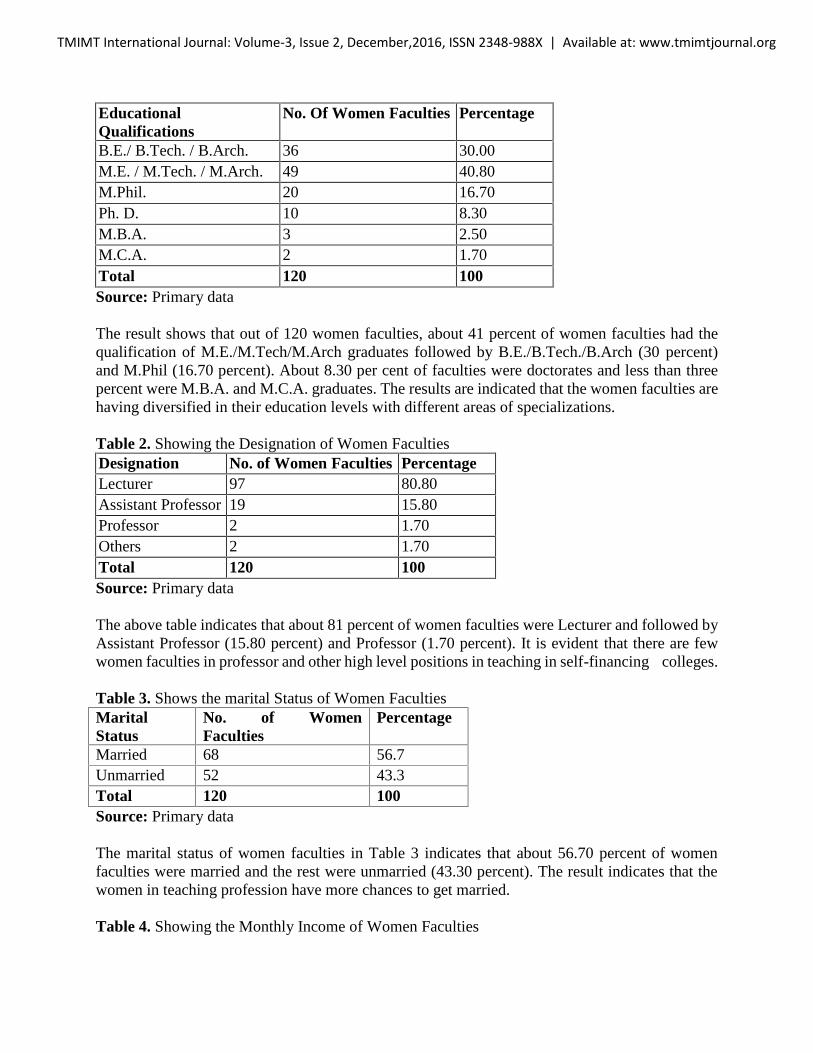
RESULTS AND DISCUSSIONTable 1. Shows the educational qualification of Women Faculties
TMIMT International Journal: Volume-3, Issue 2, December,2016, ISSN 2348-988X | Available at: www.tmimtjournal.org
EducationalQualifications
No. Of Women Faculties Percentage
B.E./ B.Tech. / B.Arch. 36 30.00M.E. / M.Tech. / M.Arch. 49 40.80M.Phil. 20 16.70Ph. D. 10 8.30M.B.A. 3 2.50M.C.A. 2 1.70Total 120 100Source: Primary data
The result shows that out of 120 women faculties, about 41 percent of women faculties had thequalification of M.E./M.Tech/M.Arch graduates followed by B.E./B.Tech./B.Arch (30 percent)and M.Phil (16.70 percent). About 8.30 per cent of faculties were doctorates and less than threepercent were M.B.A. and M.C.A. graduates. The results are indicated that the women faculties arehaving diversified in their education levels with different areas of specializations.
Table 2. Showing the Designation of Women FacultiesDesignation No. of Women Faculties PercentageLecturer 97 80.80Assistant Professor 19 15.80Professor 2 1.70Others 2 1.70Total 120 100Source: Primary data
The above table indicates that about 81 percent of women faculties were Lecturer and followed byAssistant Professor (15.80 percent) and Professor (1.70 percent). It is evident that there are fewwomen faculties in professor and other high level positions in teaching in self-financing colleges.
Table 3. Shows the marital Status of Women FacultiesMaritalStatus
No. of WomenFaculties
Percentage
Married 68 56.7Unmarried 52 43.3Total 120 100Source: Primary data
The marital status of women faculties in Table 3 indicates that about 56.70 percent of womenfaculties were married and the rest were unmarried (43.30 percent). The result indicates that thewomen in teaching profession have more chances to get married.
Table 4. Showing the Monthly Income of Women Faculties
TMIMT International Journal: Volume-3, Issue 2, December,2016, ISSN 2348-988X | Available at: www.tmimtjournal.org
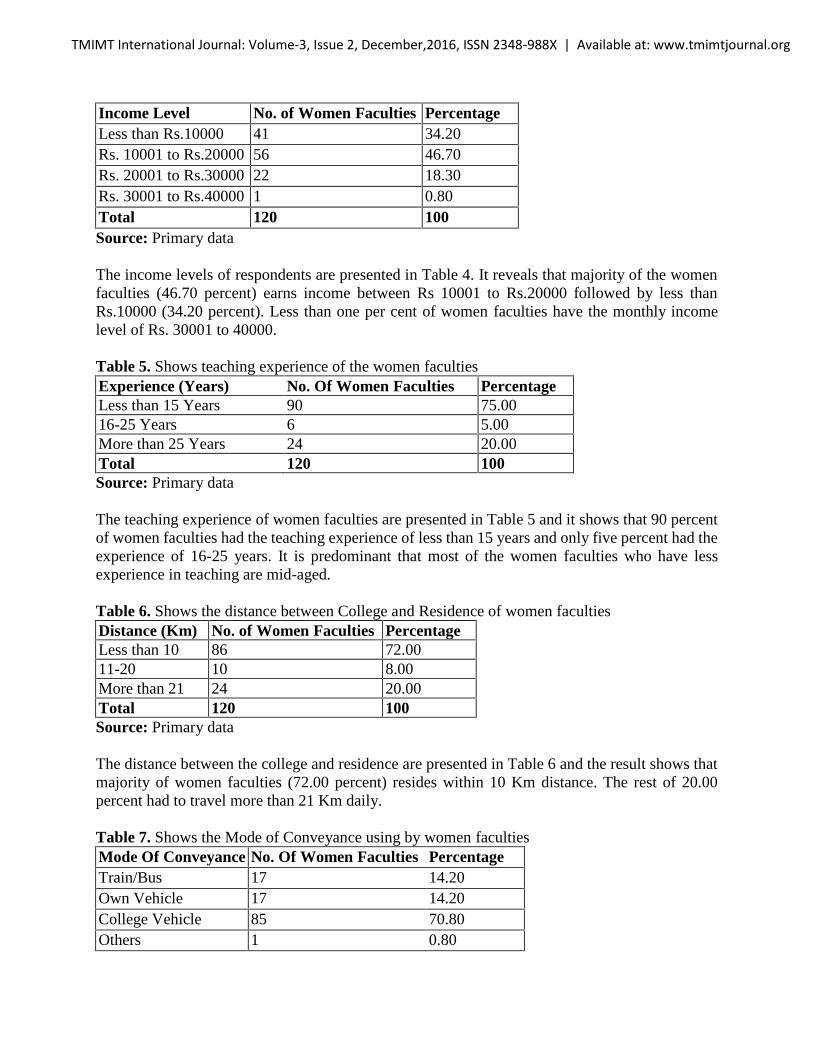
Income Level No. of Women Faculties PercentageLess than Rs.10000 41 34.20Rs. 10001 to Rs.20000 56 46.70Rs. 20001 to Rs.30000 22 18.30Rs. 30001 to Rs.40000 1 0.80Total 120 100Source: Primary data
The income levels of respondents are presented in Table 4. It reveals that majority of the womenfaculties (46.70 percent) earns income between Rs 10001 to Rs.20000 followed by less thanRs.10000 (34.20 percent). Less than one per cent of women faculties have the monthly incomelevel of Rs. 30001 to 40000.
Table 5. Shows teaching experience of the women facultiesExperience (Years) No. Of Women Faculties PercentageLess than 15 Years 90 75.0016-25 Years 6 5.00More than 25 Years 24 20.00Total 120 100Source: Primary data
The teaching experience of women faculties are presented in Table 5 and it shows that 90 percentof women faculties had the teaching experience of less than 15 years and only five percent had theexperience of 16-25 years. It is predominant that most of the women faculties who have lessexperience in teaching are mid-aged.
Table 6. Shows the distance between College and Residence of women facultiesDistance (Km) No. of Women Faculties PercentageLess than 10 86 72.0011-20 10 8.00More than 21 24 20.00Total 120 100Source: Primary data
The distance between the college and residence are presented in Table 6 and the result shows thatmajority of women faculties (72.00 percent) resides within 10 Km distance. The rest of 20.00percent had to travel more than 21 Km daily.
Table 7. Shows the Mode of Conveyance using by women facultiesMode Of Conveyance No. Of Women Faculties PercentageTrain/Bus 17 14.20Own Vehicle 17 14.20College Vehicle 85 70.80Others 1 0.80
TMIMT International Journal: Volume-3, Issue 2, December,2016, ISSN 2348-988X | Available at: www.tmimtjournal.org
Total 120 100Source: Primary data
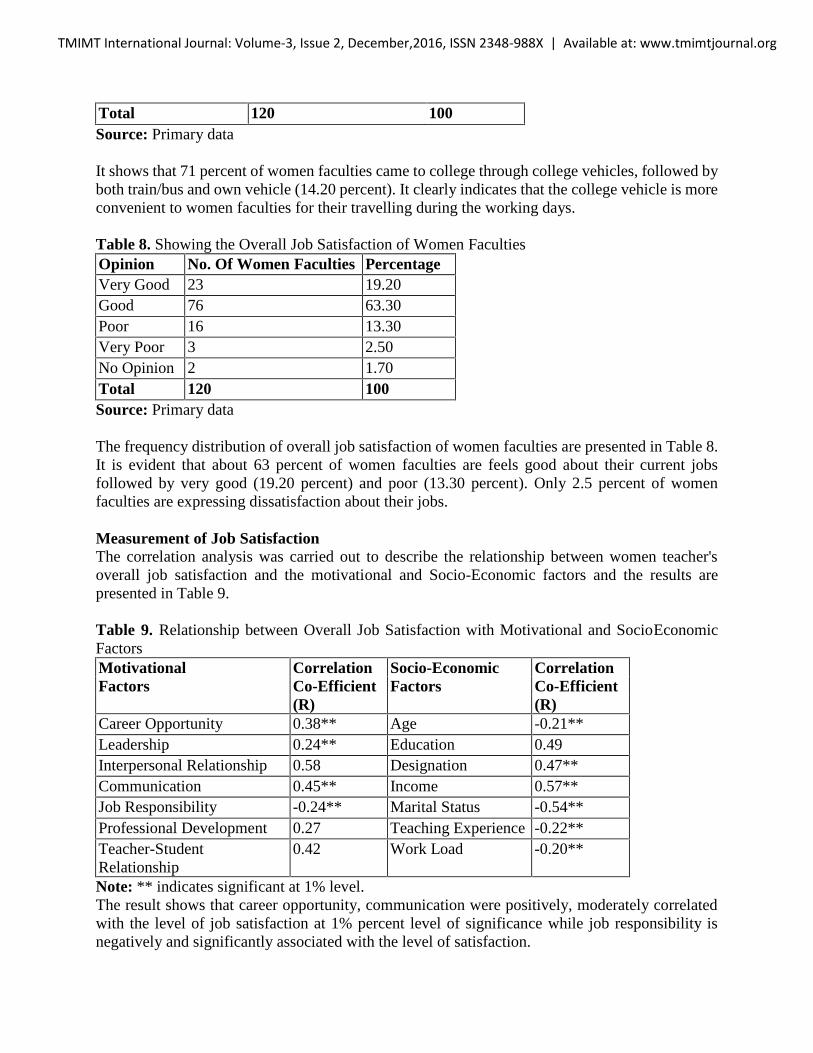
It shows that 71 percent of women faculties came to college through college vehicles, followed byboth train/bus and own vehicle (14.20 percent). It clearly indicates that the college vehicle is moreconvenient to women faculties for their travelling during the working days.
Table 8. Showing the Overall Job Satisfaction of Women FacultiesOpinion No. Of Women Faculties PercentageVery Good 23 19.20Good 76 63.30Poor 16 13.30Very Poor 3 2.50No Opinion 2 1.70Total 120 100Source: Primary data
The frequency distribution of overall job satisfaction of women faculties are presented in Table 8.It is evident that about 63 percent of women faculties are feels good about their current jobsfollowed by very good (19.20 percent) and poor (13.30 percent). Only 2.5 percent of womenfaculties are expressing dissatisfaction about their jobs.
Measurement of Job SatisfactionThe correlation analysis was carried out to describe the relationship between women teacher'soverall job satisfaction and the motivational and Socio-Economic factors and the results arepresented in Table 9.
Table 9. Relationship between Overall Job Satisfaction with Motivational and SocioEconomicFactorsMotivational Correlation Socio-Economic CorrelationFactors Co-Efficient Factors Co-Efficient
(R) (R)Career Opportunity 0.38** Age -0.21**Leadership 0.24** Education 0.49Interpersonal Relationship 0.58 Designation 0.47**Communication 0.45** Income 0.57**Job Responsibility -0.24** Marital Status -0.54**Professional Development 0.27 Teaching Experience -0.22**Teacher-StudentRelationship
0.42 Work Load -0.20**
Note: ** indicates significant at 1% level.The result shows that career opportunity, communication were positively, moderately correlatedwith the level of job satisfaction at 1% percent level of significance while job responsibility isnegatively and significantly associated with the level of satisfaction.
TMIMT International Journal: Volume-3, Issue 2, December,2016, ISSN 2348-988X | Available at: www.tmimtjournal.org

Among socio-economic factors, designation and income are positively significantly associatedwith the level of job satisfaction while marital status, age, teaching experience and work load arenegatively correlated with job satisfaction of women faculties.
Determinants of Job SatisfactionIn order to analyse the determinant of level of job satisfaction among the women faculties inself-financing colleges, the ordinal regression analysis was carried out. The ordinal regressionmodel may be written in the form as follows if the logit link is applied. f [gj (X)] = log { gj (X) / [1-gj (X)]} = log {[ P(Y < yj | X)] / [P(Y >y | X)]} = a + BX, j = 1, 2, ..., k - 1, and gj (x) = e (a j + B X)
/ [ 1 + e (a j + B X) ], where j indices the cut-off points for all categories (k) of the outcome variable.If multiple explanatory variables are applied to the ordinal regression model, BX is replaced by thelinear combination of B1X1 + B2X2 +... + BpXp (Bender and Benner, 2000). The function of f [gj(X)] is called the link function that connects the systematic components (i.e. aj + BX) of the linearmodel (Gill, 2001). The alpha aj represents a separate intercept or threshold for each cumulativeprobability. The threshold (aj) and the regression coefficient (B) are unknown parameters to beestimated by means of the maximum likelihood method.The name of the logit link can be traced back to the logistic regression function where the odds ofevent occurrence is defined as a ratio of the probability of event occurrence to the probability ofevent non-occurrence, e.g., g(X) / [1- g(X)] = e (a + B X). The log (odds), e.g., log {g(X) / [1- g (X)]}is called the logit, which equals the linear form of a + BX (Hosmer and Lemeshow, 1989). Noticethat the ordinal regression model is called the cumulative logit model because the model is builtbased on the cumulative response probabilities gj (X) of being in category (j) or lower given theknown explanatory variable (Walters, et al. 2001). The ordinal regression model with the logit linkis also known as the proportional odds model because the regression coefficient (e.g., log odds) isindependent of the category (Bender and Benner, 2000). A part of Table 1 below shows that thecumulative response probabilities were calculated for ordinal regression equations in the logit link.In constructing the ordinal regression model, an alternative choice to the logit link is the clogloglink function. The ordinal regression model may be written in the following form if the clogloglink is used to create the model. f [gj (X)] = log { -log [ 1- gj (X) ] } = log { -log [P(Y =y | X)/ P(Y>y | X)] }= aj + BX, and gj (X)= 1 - e e (aj + BX) , where j = 1, 2, k - 1 and j indexes the cut-off pointsfor all categories of the outcome variable. Again, if multiple explanatory variables are involved inthe ordinal regression model, the linear combination of B1X1 + B2X2 +... + BpXp is substitutedfor BX (Bender and Benner, 2000). The term of the complementary function comes from [1- gj
(X)]. Thus, the name of the complementary log-log link function is derived from log {-log [1- gj
(X)]} which equals to the linear form of aj + BX. The ordinal regression model with the clogloglink is called the continuation ratio model because it is a ratio of the two conditional probabilities,e.g., P(Y =yj | X) to P(Y >yj | X). The model with the cloglog link is also called the proportionalhazard model because the relationship between the explanatory variables and the ordinal outcomeis independent of the category (Bender and Benner, 2000).The ordinal regression method was used to model the relationship between ordinary dependentvariable and the independent variables. The major decisions involved in the model building forordinal regression were deciding which independent variables should be included in the model andchoosing the link function that demonstrated the model appropriateness. It is impossible to assumethe normality and homogeneity of variance for ordered dependent when the ordinal dependentcontains merely a small number of discrete categories. Thus, the ordinal regression modelbecomes a preferable modeling tool that does not assume the normality and constant variance, but
TMIMT International Journal: Volume-3, Issue 2, December,2016, ISSN 2348-988X | Available at: www.tmimtjournal.org

require assumption of parallel lines across all levels of the categorical dependent, were essentiallyassessed for selecting the best model. The test of parallel lines designed to make judgementconcerning the model adequacy and results are presented in Table 10.
Table 10. Determinants of Job Satisfaction of Women FacultiesVariables Regression Co-efficient P ValueBest Salary -.2620 .029**Equality in Work Load -.0410 .774Working Hours -.1680 .215Promotion .1330 .412Role Change .0840 .015**Fringe Benefits .1750 .163ProfessionalDevelopment
-.1430 .390
Leadership -.1400 .428
Table 10. Determinants of Job Satisfaction of Women Faculties (Contd...)Variables Regression
Co-efficientP Value
Job Security -.1460 .483Interpersonal Relationship .1640 .373Communication .0040 .979Job Responsibility -.2630 .145Teacher-Student Relationship .1050 .026**Discipline -.1270 .0.12**Motivation .1460 .375Work Environment -.4230 .010**Recognition -.0110 .945Morale -.1410 .360Convenience .0660 .714Job Involvement .4620 .020**Note: ** indicates significance at 1% levelThe result indicates that among different variables, satisfaction variables were positively related toteacher-student relationship, job involvement and role change while salary, discipline and workenvironment were negatively related with job satisfaction among women faculties. Furthermore,none of the satisfaction variables were not significantly associated with the overall satisfactionlevel of women faculties.
Table 11. Model Fitting InformationModel -2 Log Likelihood Chi-Squar
edf Sig.
Interceptonly
244.248
TMIMT International Journal: Volume-3, Issue 2, December,2016, ISSN 2348-988X | Available at: www.tmimtjournal.org

Final 203.786 40.462 21 .007The model fitting information presented in Table 11 and it indicates that the -2LL of the modelwith only intercept is 244.248 while the -2LL of the model with intercept and independent variableis 203.786. That is the difference (Chi-Square Statistics) is 40.462 which is significant at 0.05.Wecan conclude that there is association between the dependent and independent variables.
Table 12. Pseudo R-SquareCox and Snell .786Nagelkerke .628McFadden .563The model fitting statistic, namely pseudo R-square, measured the success of the model inexplaining the variations in the data and is presented in Table 12. The larger the pseudo R squarewas, better the model fitting was. The pseudo R square for McFadden (0.56), Cox and Snell (0.79)and Nagelkerke (0.55) in the model with the complementary log-log link.
Table 13. Goodness of FitChi-square df Sig.
Deviance 199.627 431 1.000The additional model fitting statistic (Table 13), the Deviance =199.627 for the model with thecomplementary log-log link indicated that the observed data were not consistent with the estimatedvalues in the fitted model.
Table 14. Test of Parallel LinesModel -2 Log Likelihood Chi-Square df Sig.NullHypothesis
203.786
General .000(a) 203.786 63 .0064
The test of parallel lines showed that chi-square with df. 63 indicated in Table 14 that there was nosignificant difference for the corresponding regression co- efficient across the response categories,suggesting that the model assumption of parallel lines was not violated in the model with thecomplementary Log-log link.
CONCLUSION AND POLICY IMPLICATIONSThe foregoing analysis on job satisfaction among women faculties in self-financing collegesindicated that there are few women faculties in professor and other high level positions in teachingin self-financing colleges and the college vehicle is more convenient to women faculties for theirtravelling during the working days. The analysis also showed that career opportunity,communication was positively, moderately correlated with the level of job satisfaction at onepercent level of significance while job responsibility is negatively and significantly associatedwith the level of satisfaction.The results of the determinants of job satisfaction indicated that among different variables,satisfaction variables were positively related to teacher-student relationship, job involvement androle change, while salary, discipline and work environment were negatively related with jobsatisfaction among women faculties. Furthermore, none of the satisfaction variables were not
TMIMT International Journal: Volume-3, Issue 2, December,2016, ISSN 2348-988X | Available at: www.tmimtjournal.org
significantly associated with the overall satisfaction level of women faculties. Besides, in order toimprove the job satisfaction at sustained manner, the promotion, professional developmentprogrammes, job security, inter-personal relationship and recognition are the areas of concern andthese should be improved and given proper priorities in a systematic manner.One of the major implications that a study of this nature raises the manner in which administratorsmonitor the work climate, observe and identify factors that may increase or decrease jobsatisfaction and work commitment of classified employees. The cost associated with leaving ishigh. Women faculties have identified behaviours and conditions that promote job satisfaction,organisational support, and organisational commitment. They are more likely to be morecommitted to the colleges when they are provided a proportionate amount of job autonomy andequitable workloads. The perception that the college also focus on competitive salaries may alsocontribute to job commitment.
REFERENCES1. Bender, R. and Benner (2000), A Calculating Ordinal Regression Models in SAS and S-Plus,Biometric Journal, 42(6):677-699.2. Best, M., & Thurston, N., (2004), Measuring Nurse Job Satisfaction, Journal of NursingAdministration, 34(6), 2833. Chaudhury, S and Banerjee, A. (2004), Correlated Job Satisfaction in Medical Officers,MJAFAI, 60(4): 329-332.4. Elloy, D. F. (2005), The Influence of Super-Leader Behaviors on Organization Commitment,Job Satisfaction and Organization Self-esteem in a Self-managed Work Team, Leadership andOrganizational Development Journal, 26(2), 120-127.5. Flowers, V.S. and Hughes, C.L. (1973), Why Employees Stay, Harvard Business Review,51(4), 49-60.6. Gill, Jeff (2000), Generalized Linear Model: A Unified Approach, Sage Publication, ThousandOaks, California.7. Herzberg, F.,Mausner, B. and Snyderman, B.B. (1959), The Motivation to Work, New York,John Wiley and Sons.8. Hosmer, David W. and Lemeshow, Stanley (1989), Applied Logistic Regression, John Wileyand Sons, New York.9. Lok, P., & Crawford, J., (2001), Antecedents of Organizational Commitment and the MediatingRole of Job Satisfaction, Journal of Managerial Psychology, 16(7/8), 594-614.10. Pearson, D.A. and Seiler, R.E. (1983), Environmental Satisfiers in Academic, HigherEducation, 12, 35-47.11. Rosnowski, M.and Hulin, C. (1992), The Scientific Merit of Valid Measures of GeneralConstructs with Special Reference to Job Satisfaction and Job Withdrawal, In C.J. their jobs andhow it affects their performance, Lexington Books: New York.12. Silverthorne, C., (2004), The Impact of Organizational Culture and Person Organization fit onOrganizational Commitment and Job Satisfaction in Taiwan, Leadership and OrganizationDevelopment Journal, 25(7), 592-599.13. Walters, S.J., Campbell, M.J. and Lall, R (2001), Design and Analysis of Trails with Quality ofLife as an Outcome: A Practical Guide, Journal of Biopharmaceutical Statistics, 11(3), 155-176.
TMIMT International Journal: Volume-3, Issue 2, December,2016, ISSN 2348-988X | Available at: www.tmimtjournal.org