a study on consumers' attitude towards counterfeit products in
TRANSCRIPT
1
A STUDY ON CONSUMERS’ ATTITUDE
TOWARDS COUNTERFEIT PRODUCTS
IN MALAYSIA
NORASHIKIN NORDIN
FACULTY OF BUSINESS AND ACCOUNTANCY
UNIVERSITY OF MALAYA
2009
2
A Study on Consumers’ Attitude towards Counterfeit Products in Malaysia
Norashikin Nordin Bachelor of Information Technology (Hons.)
University of Tenaga National 2006
Submitted to the Graduate School of Business Faculty of Business and Accountancy
University of Malaya, in partial fulfillment of the requirements for the Degree of Master of Business
Administration
2009
3
ABSTRACT
The study aims to investigate which of the social and personality factors affects the
attitude of the consumers towards counterfeit products. The study is also set out to
examine the relationship of consumers’ attitude towards counterfeit product with
purchase intention. A conceptual model is proposed by following the studies of
Huang et al. (2004), De Matos et al. (2007) and Phau and Teah (2009). A survey of
270 respondents was conducted in the Malaysian market. Pearson correlation,
multiple regression and the Sobel test were used to test the hypotheses postulated and
research question. It is discovered that perceived risk, price consciousness, novelty
seeking and normative susceptibility are the independent variables that strongly
influence consumers’ attitude towards counterfeit product. Attitude towards
counterfeit product was also found significant in influencing purchase intention. This
reinforces the mediator role of attitude in its relationship with purchase intentions. By
having a better understanding of the consumers’ behavioral intentions of buying
counterfeit products, the manufacturers and marketers of the genuine brand products
can make better marketing strategies to entice the consumer to buy the original
product and not the counterfeit version. Theoretical contribution of this study is an
extension of knowledge of consumers’ attitude with regards to counterfeit products.

4
ACKNOWLEDGEMENT
It is with great pleasure that I present you my thesis. This thesis would not have been
complete if it was not for a group of individuals whom I truly am grateful for having
in my life.
My first and deepest thank you goes out to Dr. Yusniza Kamarulzaman for her
guidance, comments, sleepless nights, and reassuring words. Her optimism got me
through tough times and she never fails to keep me on track. Dr., there was never a
stress mode in your presence. Thank you.
Special thanks to a dear friend whom had been there from the very beginning. Lau
Xue Hao, thank you.
To my parents, Dr. Nordin Othman and Norzela Abd. Jalil, for their prayers and
constant encouragement. They had faith in me even during the times that I did not.
Mama and Abah, I love you.
To my siblings, who kept sane and was always cheering me on. Thank you for
understanding.
Last but definitely not the least, my appreciation goes out to all the respondents who
took their time to participate in answering my questionnaire. May the benefits reaped
from this thesis help others in the future.
5
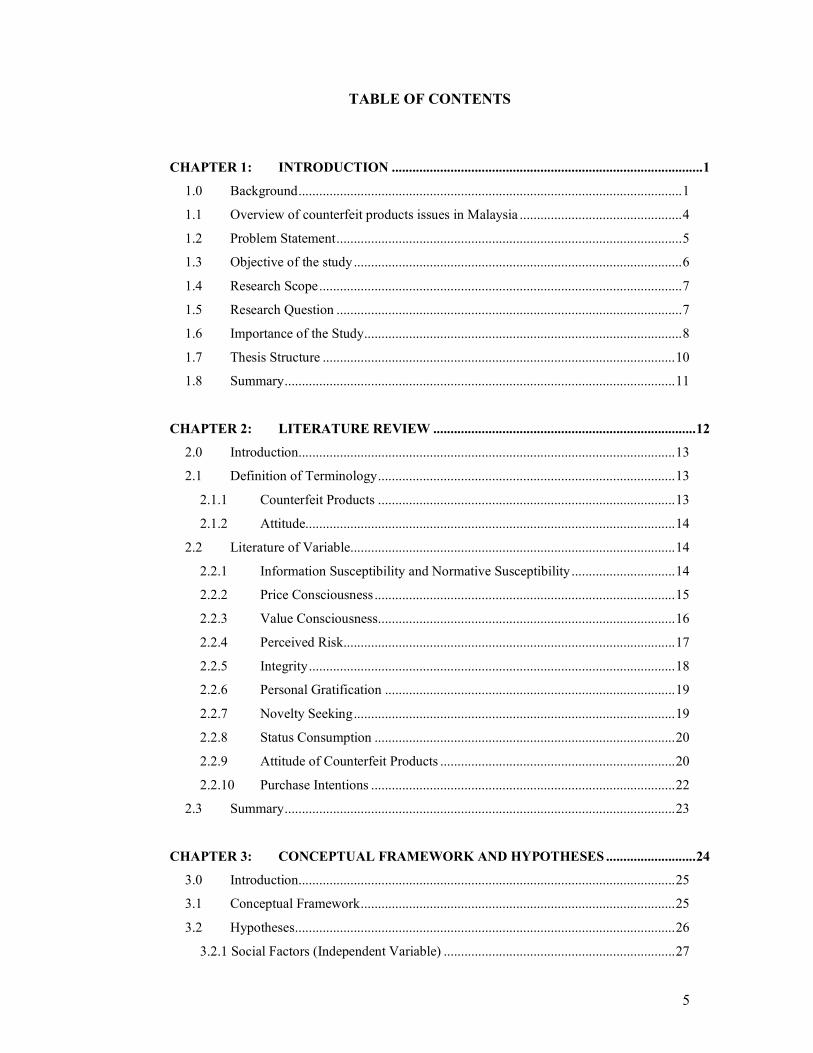
TABLE OF CONTENTS
CHAPTER 1: INTRODUCTION ..........................................................................................1
1.0 Background...............................................................................................................1
1.1 Overview of counterfeit products issues in Malaysia ...............................................4
1.2 Problem Statement....................................................................................................5
1.3 Objective of the study...............................................................................................6
1.4 Research Scope.........................................................................................................7
1.5 Research Question ....................................................................................................7
1.6 Importance of the Study............................................................................................8
1.7 Thesis Structure ......................................................................................................10
1.8 Summary.................................................................................................................11
CHAPTER 2: LITERATURE REVIEW ............................................................................12
2.0 Introduction.............................................................................................................13
2.1 Definition of Terminology......................................................................................13
2.1.1 Counterfeit Products ......................................................................................13
2.1.2 Attitude...........................................................................................................14
2.2 Literature of Variable..............................................................................................14
2.2.1 Information Susceptibility and Normative Susceptibility ..............................14
2.2.2 Price Consciousness.......................................................................................15
2.2.3 Value Consciousness......................................................................................16
2.2.4 Perceived Risk................................................................................................17
2.2.5 Integrity..........................................................................................................18
2.2.6 Personal Gratification ....................................................................................19
2.2.7 Novelty Seeking.............................................................................................19
2.2.8 Status Consumption .......................................................................................20
2.2.9 Attitude of Counterfeit Products ....................................................................20
2.2.10 Purchase Intentions ........................................................................................22
2.3 Summary.................................................................................................................23
CHAPTER 3: CONCEPTUAL FRAMEWORK AND HYPOTHESES ..........................24
3.0 Introduction.............................................................................................................25
3.1 Conceptual Framework...........................................................................................25
3.2 Hypotheses..............................................................................................................26
3.2.1 Social Factors (Independent Variable) ...................................................................27
6
3.3.2 Personality Factors (Independent Variable)...................................................27
3.3.3 Attitude towards counterfeit products (Mediating Variable) .........................30
3.3 Summary.................................................................................................................30
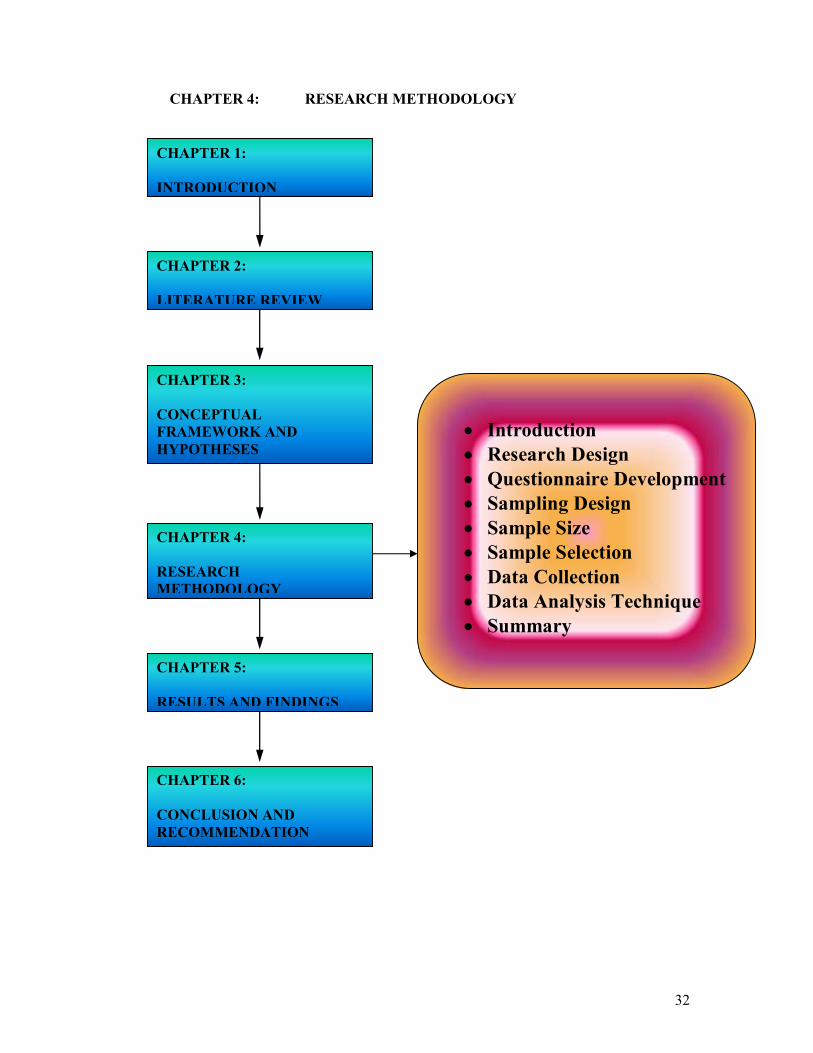
CHAPTER 4: RESEARCH METHODOLOGY ................................................................32
4.0 Introduction.............................................................................................................33
4.1 Research Design .....................................................................................................33
4.2 Questionnaire Development ...................................................................................33
4.3 Sampling Design.....................................................................................................35
4.4 Sample Size ............................................................................................................35
4.5 Sample Selection ....................................................................................................36
4.6 Data Collection .......................................................................................................36
4.7 Data Analysis Technique........................................................................................37
4.8 Summary.................................................................................................................38
CHAPTER 5: RESULTS AND FINDINGS........................................................................39
5.0 Introduction.............................................................................................................40
5.1 Descriptive Analysis ...............................................................................................40
5.1.1 Gender............................................................................................................41
5.1.2 Age.................................................................................................................41
5.1.3 Citizenship .....................................................................................................42
5.1.4 Ethnic Group..................................................................................................42
5.1.5 Marital Status .................................................................................................43
5.1.6 Education level...............................................................................................43
5.1.7 Occupation .....................................................................................................43
5.1.8 Monthly Income.............................................................................................44
5.2 Preliminary Analysis ..............................................................................................44
5.2.1 Data Screening – Reversing negatively worded items...................................45
5.2.2 Normality .......................................................................................................45
5.2.3 Reliability and Validity Analysis ...................................................................49
5.2.4 Factor Analysis ..............................................................................................51
5.2.4.1 Independent Variable .....................................................................................52
5.2.4.2 Mediating Variable ........................................................................................54
5.2.4.3 Dependent Variable .......................................................................................55
5.3 Bivariate Analysis...................................................................................................56
5.4 Multivariate Analysis..............................................................................................60
5.4.1 Assumptions Test...........................................................................................61
7
5.4.2 Standard Multiple Regression........................................................................64
5.4.3 Sobel Test.......................................................................................................67
5.5 Summary.................................................................................................................68
CHAPTER 6: CONCLUSION AND RECOMMENDATION ..........................................69
6.0 Introduction.............................................................................................................70
6.1 Discussion of the research result ............................................................................70
6.2 Contribution of the study ........................................................................................74
6.3 Managerial Implication...........................................................................................75
6.4 Research Limitation................................................................................................77
6.5 Recommendation for future research......................................................................78
6.6 Summary.................................................................................................................78
BIBLIOGRAPHY ........................................................................................................................80
APPENDIX A – QUESTIONNAIRE SAMPLE........................................................................88
APPENDIX B – HISTOGRAM ..................................................................................................92
APPENDIX C – CORRELATION TABLE........................................................................ 98
8
LIST OF TABLES
Table 4.1: Source of measurement scale items ........................................................................34
Table 4.2: Summary of data analysis techniques and objective...............................................37
Table 5.1: Respondents Demographic Profile..........................................................................41
Table 5.2: The items of each variable and its simplified code .................................................46
Table 5.3: Mean, Standard deviation, Skewed and Kurtosis of each item...............................48
Table 5.4: Corrected Item-Total Correlation (validity) of each item and Cronbach’s Alpha
Coefficient (reliability) of each scale .......................................................................................49
Table 5.5: KMO and Bartlett's Test for nine independent variable..........................................52
Table 5.6: Rotated Component Matrix for nine independent variable .....................................53
Table 5.7: KMO and Bartlett's Test for the mediating variable ...............................................54
Table 5.8: Component Matrix for the mediating variable........................................................55
Table 5.9: KMO and Bartlett's Test for the dependent variable...............................................55
Table 5.10: Component Matrix(a) for the dependent variable .................................................56
Table 5.11: Correlation between variables...............................................................................57
Table 5.12: Model Summary of Attitude towards counterfeit products...................................64
Table 5.13: Coefficients of Dependent Variable: Attitude towards counterfeit products ........65
Table 5.14: Sobel/ Aroian/ Goodman tests of mediating effects..............................................67
Table 6.1: Summary of hypotheses and the result....................................................................70
9
LIST OF FIGURES
Figure 5.1: Histogram of Dependent Variable: Attitude towards counterfeit products ...........63
Figure 5.2: Normal Probability Plot of Regression Standardized Residual of Dependent
Variable: Attitude towards counterfeit products ......................................................................63
Figure 5.3: Scatterplot of Dependent Variable: Attitude towards counterfeit products ...........64
1
CHAPTER 1: INTRODUCTION
1.0 Background
By definition, counterfeits are those products bearing a trademark that is identical to,
or impossible to tell apart from, a trademark registered to another party, thus
infringing the rights of the owner of the trademark. (Chaudhry and Walsh, 1996; Bian
and Veloutsou, 2007) Usually, successful branded products have the highest level of
attractiveness to counterfeiters. It is so, because products that do not have a trademark
are less appealing and would not be highly sought after, and efforts of counterfeiting
the products are futile.
It appears that all product categories are affected. Counterfeits of almost anything can
be found, from apparels to pharmaceuticals, electrical goods, bleach and dyes, books,
food and the list goes on. Clearly, counterfeiting has become a significant economic
phenomenon. Past researches have revealed that about one-third of consumers would
knowingly purchase counterfeit goods (Tom et al., 1998; Phau et al., 2001). Since
demand is always the key driver of a market, a number of researchers have argued
that consumer demand for counterfeits is one of the leading causes of the existence
and rise in growth of the counterfeiting phenomenon (Gentry et al., 2001; Ang et al.,
2001). As a direct result of these arguments, a good deal of research has focused on
identifying important factors that influence consumers’ attitude towards counterfeit
products.
2
According to the International Anti-counterfeiting Coalition (IACC, 2005) and the
International Intellectual Property Institute (IIPI, 2003), considering the countries
worldwide, almost five percent of all products are counterfeit. The IACC also
estimated that counterfeiting is responsible in at least $200 billion a year for lost jobs,
taxes and sales (Furnham and Valgeirsson, 2007). This indicates that the problem,
which is already very serious, is growing and is likely to cause much more damages in
the future.
There seems to be some conscious efforts to eradicate the problem, including
implementing processes to trace, detect and prosecute counterfeiting offenders (Nill
and Shultz, 1996; Chow, 2000; Prendergast et al., 2002). However, the attempt seems
fruitless with the increasingly sophisticated counterfeit syndicates, the intensification
in world trade and emerging new markets, fast paced technology advancements, and
also the escalation of goods that are worth counterfeiting, making it harder to detect
and wipe out these activities. In addition, the lack of serious penalties allows
offenders to be increasingly brazen in their illegal pursuits (Hung, 2003; Sonmez and
Yang, 2005; Clark, 2006). However, if the government were to take serious measures,
it would need to be on a national, regional, and global level for it to be effective, but
until now, there are no perceived organized and solid efforts to overcome this
problem.
It is a sad case for owners of genuine products as the organization has invested huge
amount of money in designing, marketing and manufacturing their products, while
counterfeit producers use the brand names without having to design or incurring
marketing costs but yet able to reap the profits.
3
One thing for sure, it is now difficult to differentiate between imitation and genuine
goods as modern technology and sophisticated machines enable counterfeit goods to
resemble the genuine ones. Hence, it is difficult for the public to differentiate between
these two groups of products. The most obvious reason for people to buy counterfeit
products is that the counterfeit items are cheaper than the genuine items. It could also
be because the counterfeit products are easily accessible and available while genuine
products are not. Another factor that contributes to consumers’ demand for counterfeit
products is the pursuit of status goods and the desire of being in tune with fashions
and fads (Chang, 1998; Eisend and Schuchert-Guler, 2006). These prestige conscious
individuals prefer to own branded items as they assume that these products reflect
their "status" in the society but of course it comes with a price and clearly not
everybody can afford the branded products in the retail shop. Hence, in order to
quench the thirst of such up-scale, high end products, these individuals are willing to
buy counterfeit or imitation goods that closely resemble aesthetics and functions of
genuine items.
With the many factors that are thought to be contributing to the increase of
consumers’ demand towards counterfeit products, a study to explore these factors
should be conducted. Is price really the main factor that drives consumer to side the
counterfeits? However, if price is the main reason, the consumers should buy a
product without a brand or an unknown brand that offers a cheaper price. Why must
they opt for an imitated branded product knowing that it is of inferior quality?
Therefore, with the increasing sales of counterfeits worldwide today, a comprehensive
understanding of the determinants that leads to a counterfeit purchase will contribute
4
to the literature and may help the marketers of genuine branded goods to set up a
more refined and effective marketing strategies.
1.1 Overview of counterfeit products issues in Malaysia
Malaysia has a counterfeit market value of $378 million, with software dominating
$289 million of that market value. (Havocscope Global Market Indexes, 2008). Most
often the news broadcast on counterfeiting in Malaysia are usually associated with
branded goods, and now, these items are circulating in the form of essential products
and used on a daily basis.
The Domestic Trade and Consumer Affairs Ministry’s enforcement division, through
their relentless raids in pursuit of these types of goods, have identified imitation
products such as garments, electrical items, pharmaceuticals, shoes, bags, leather
goods, watches, cigarettes, batteries, sauces, engine oils, toothpastes, detergents and
canned food, to name a few. It is clear that anything that has a demand and potential
to be copied would invariably attract infringers to resort to reaping profits through
producing similar counterfeit items which would then be sold to ‘blind’ and ignorant
consumers.
The ease of getting and buying counterfeit products does not help the situation as the
sellers of counterfeit products blatantly sell the goods at shopping malls, night
markets, and plazas. Globalization has made it relatively easy for imitation products
to flow into the local market and efficient logistics allow the counterfeit products to
move fast and within a short time frame. Despite constant enforcement, curbing the
flood of imitation goods in the local market is not easy. As far as the issue of IP law is
5
concerned, the Trademarks Act of 1976 has been amended to contain provisions for
border measures prohibiting counterfeit trademark goods from being imported into the
country.
Aside from legislation imposed, the government of Malaysia, specifically, the
Domestic Trade and Consumer Affairs Ministry, regularly holds talks and media
advertisements to improve public awareness on imitation goods particularly among
low-wage earners and youths. It is hoped that these efforts would increase awareness
on the negative effects of buying counterfeit products, as continuous support to the
illegal activity would have adverse effects on Malaysia's economy.
1.2 Problem Statement
Counterfeiting is a big business and it is rampant in Asia (Asian Wall Street Journal,
1999a). It is not difficult to get hold of a counterfeit product, be it clothes, watches,
handbags and many more. What is alarming is that sellers and buyers of counterfeit
products do their transactions in the open together with non-counterfeited products.
This phenomenon is bad news for the manufacturers of the genuine products as it
affects their businesses. The manufacture and sale of counterfeit products is
undermining company and brand reputations, hitting profits, devaluing research and
development costs, and incurring legal fees (Nash, 1989).
The issue remains as to why consumers buy counterfeit products even though they are
aware that these products are of lower quality (Albers-Miller, 1999). Is price the main
determinant of consumers’ favourable attitude towards counterfeit products? Are
there other underlying attributes, such as, concerned about the opinion and
6
expectation of others, or engrossed in keeping up-to-date with the latest fashion, or
simply prestige conscious? Many factors that may determine consumers’ attitude in
purchasing counterfeit products, but the question is, which factor and that is the main
issue to be answered.
There are very limited researches conducted to understand consumers’ behaviour in
purchasing and using counterfeit products particularly in Malaysia. Many of past
research have been done in countries such as China, Brazil, Taiwan, Singapore (Wang
et al., 2001; Huang et al., 2004; Wang et al., 2005; De Matos et al., 2007; Phau and
Teah, 2009). Therefore, in view of this gap, this study is constructed to explore and
understand the relationships between the attitude of consumers in Malaysia and the
purchase intention of buying a counterfeit product. It is also to examine the factors
affecting the attitude.
By understanding the factors that influence the attitudes of consumers towards
counterfeit products, which in turn lead to the intention of actually buying a
counterfeit product would help the manufacturers and marketers of genuine products
in understanding the consumers’ actions.
1.3 Objective of the study
This study strives to respond to the call for research to understand the purchase
intentions of the consumers who consciously seek out counterfeit brands and indulge
in purchase (Bloch et al., 1993; Cordell et al., 1996; Prendergast et al., 2002). It
strives to explore the consumers’ in Malaysia mindset in relation to purchasing
counterfeit products.
7
Thus, the objectives of this study are as follows:
1) To investigate which social or personality factor affects consumers’ attitude
towards counterfeit products.
2) To examine the relationship of consumers’ attitude towards counterfeit
products with the purchase intention.
3) To explore which of the factors that is dominant in influencing the consumers’
attitude towards counterfeit products, which then would lead to purchase
intention.
1.4 Research Scope
The study is to determine the factors that influence the attitude of consumers towards
counterfeit products, which is believed to lead to purchase intention. The study will be
within the context of Malaysian market and the respondents are consumers residing in
Malaysia of the age group of 18 years old and above. The respondents are chosen
from those 18 years and above because it is believed that they have a considerable
amount of spending power and substantial exposure and knowledge of counterfeit
products.
1.5 Research Question
The main research questions of this study are:
1. How do the social and personality factors influence consumers’ attitude
towards counterfeit products?
2. What is the impact of consumers’ attitude towards purchase intention?
8
3. What are the dominant factors influencing consumers’ attitude towards
counterfeit products, which leads to purchase intention?
By knowing the answer to these questions, the producers of genuine products are able
to understand why the consumers would want to buy the imitated or counterfeited
version of their products regardless of the genuine products’ superior quality. The
producers and marketers of genuine products could then come up with ways or
different strategies in enticing the consumers to buy the genuine products over the
counterfeit products.
1.6 Importance of the Study
From the theoretical perspectives, this study would help to understand the Malaysian
consumers’ behavioural intentions of buying counterfeit products better. It is an
extension of knowledge of consumers with regards to counterfeit products.
From the perspectives of marketers, this study would help to understand the
consumers’ attitudes; hence, the marketers can try to fulfil the consumers’ needs and
wants by portraying their products as what the consumer requires. By having a better
understanding of the consumers’ purchase intentions of buying counterfeit products,
the marketers of the genuine products can make better marketing strategies to entice
the consumer to buy the original products and not the imitations.
From the industry perspective, a better understanding of consumers’ attitude towards
counterfeit products can probably help overcome the illegal syndicate. Actions such
as making it compulsory for each manufacturer to support anti-counterfeiting firms

9
which employ investigators to carry out surveillance and raids against counterfeiters
or push the government and authorities to strengthen enforcement of respective laws
and regulations or one of which could be a penalty to the seller as well as the buyer to
eradicate the illegal trading.
10
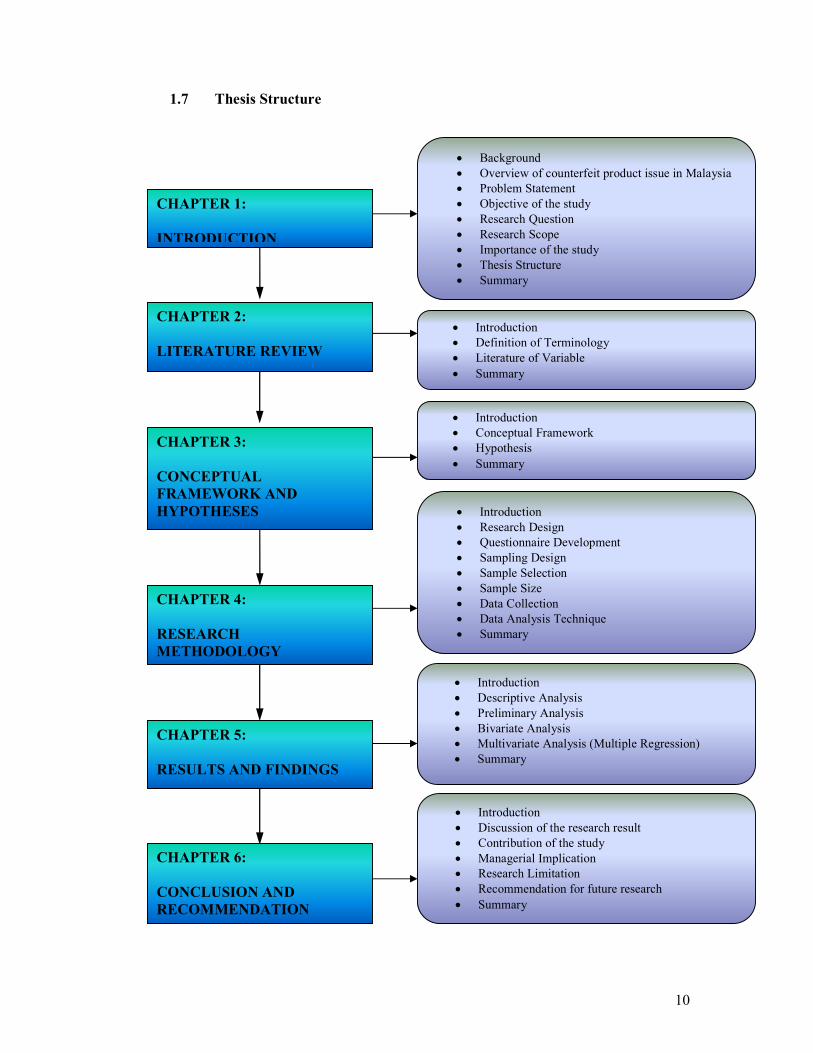
1.7 Thesis Structure
CHAPTER 6:
CONCLUSION AND
RECOMMENDATION
CHAPTER 3:
CONCEPTUAL
FRAMEWORK AND
HYPOTHESES
CHAPTER 4:
RESEARCH
METHODOLOGY
CHAPTER 5:
RESULTS AND FINDINGS
CHAPTER 2:
LITERATURE REVIEW
CHAPTER 1:
INTRODUCTION
• Background
• Overview of counterfeit product issue in Malaysia
• Problem Statement
• Objective of the study
• Research Question
• Research Scope
• Importance of the study
• Thesis Structure
• Summary
• Introduction
• Definition of Terminology
• Literature of Variable
• Summary
• Introduction
• Conceptual Framework
• Hypothesis
• Summary
• Introduction
• Discussion of the research result
• Contribution of the study
• Managerial Implication
• Research Limitation
• Recommendation for future research
• Summary
• Introduction
• Research Design
• Questionnaire Development
• Sampling Design
• Sample Selection
• Sample Size
• Data Collection
• Data Analysis Technique
• Summary
• Introduction
• Descriptive Analysis
• Preliminary Analysis
• Bivariate Analysis
• Multivariate Analysis (Multiple Regression)
• Summary
11
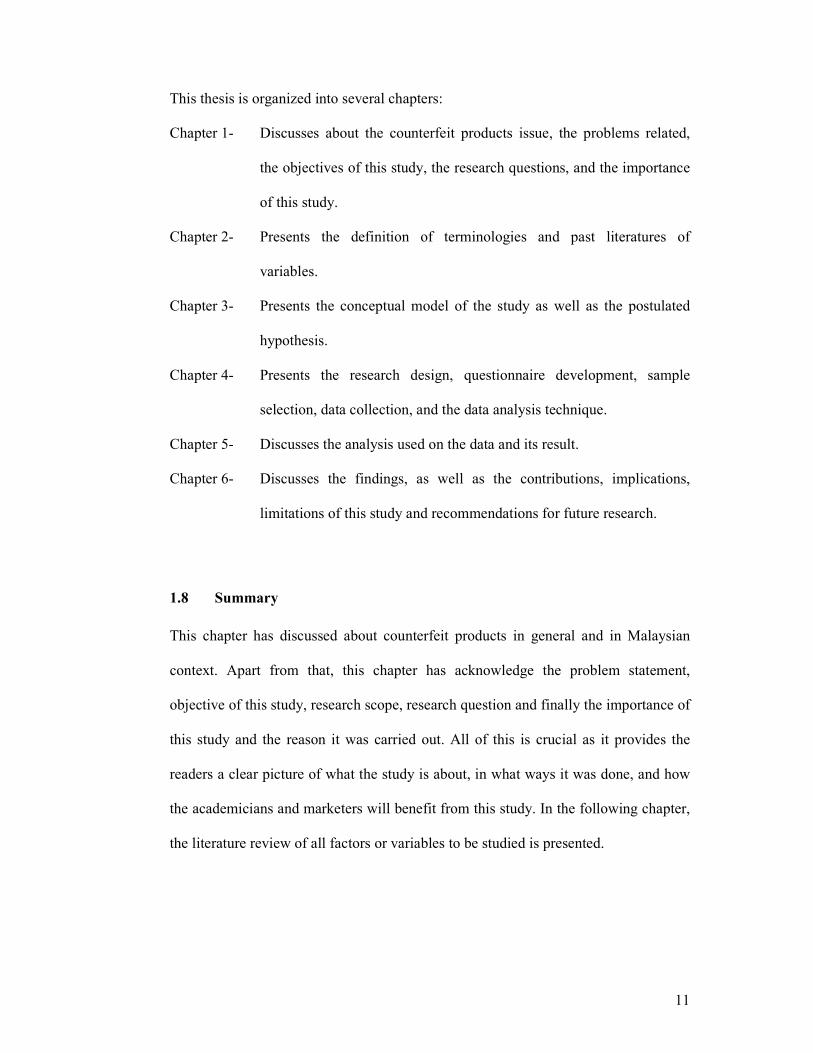
This thesis is organized into several chapters:
Chapter 1- Discusses about the counterfeit products issue, the problems related,
the objectives of this study, the research questions, and the importance
of this study.
Chapter 2- Presents the definition of terminologies and past literatures of
variables.
Chapter 3- Presents the conceptual model of the study as well as the postulated
hypothesis.
Chapter 4- Presents the research design, questionnaire development, sample
selection, data collection, and the data analysis technique.
Chapter 5- Discusses the analysis used on the data and its result.
Chapter 6- Discusses the findings, as well as the contributions, implications,
limitations of this study and recommendations for future research.
1.8 Summary
This chapter has discussed about counterfeit products in general and in Malaysian
context. Apart from that, this chapter has acknowledge the problem statement,
objective of this study, research scope, research question and finally the importance of
this study and the reason it was carried out. All of this is crucial as it provides the
readers a clear picture of what the study is about, in what ways it was done, and how
the academicians and marketers will benefit from this study. In the following chapter,
the literature review of all factors or variables to be studied is presented.
12
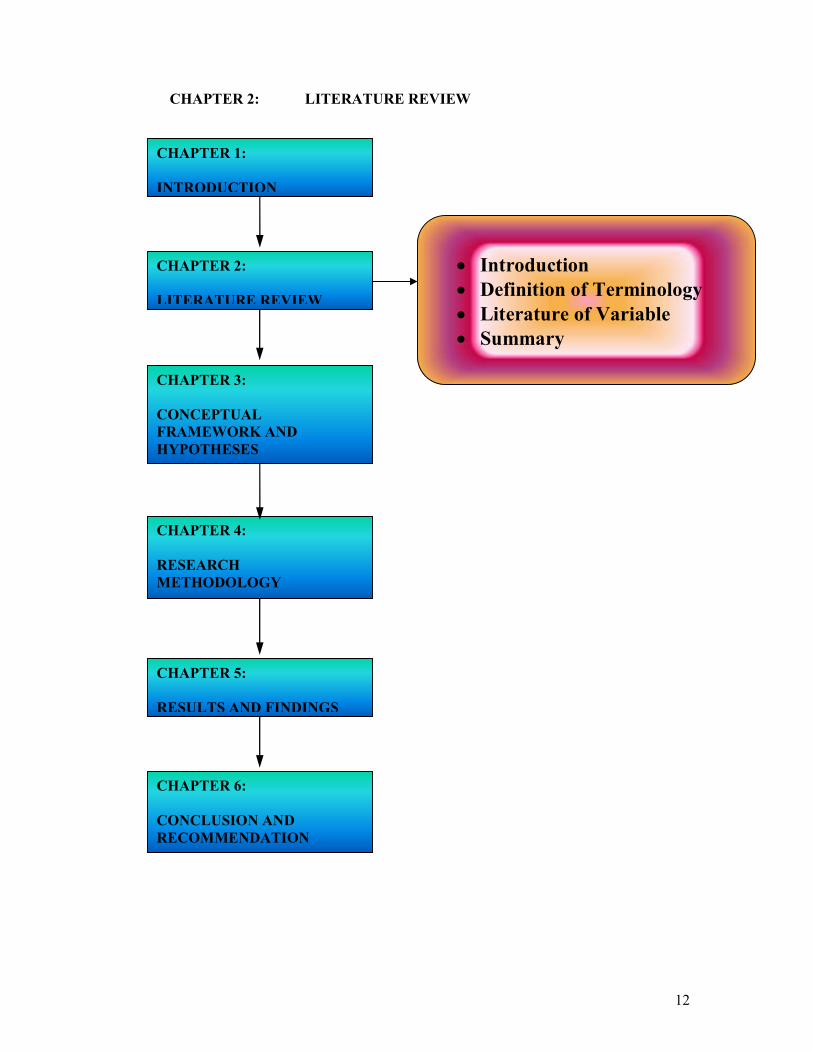
CHAPTER 2: LITERATURE REVIEW
CHAPTER 6:
CONCLUSION AND
RECOMMENDATION
CHAPTER 3:
CONCEPTUAL
FRAMEWORK AND
HYPOTHESES
CHAPTER 4:
RESEARCH
METHODOLOGY
CHAPTER 5:
RESULTS AND FINDINGS
CHAPTER 2:
LITERATURE REVIEW
CHAPTER 1:
INTRODUCTION
• Introduction
• Definition of Terminology
• Literature of Variable
• Summary
13
2.0 Introduction
The previous chapter has highlighted the importance of this study. This chapter will
cover previous literatures of each topic area. Literature reviews are secondary sources
obtained from published work such as journals, books, master’s thesis, conference
proceedings, and other reports. It is vital in supporting the derivation of hypothesis,
which will be discussed in detail in Chapter 3.
2.1 Definition of Terminology
2.1.1 Counterfeit Products
A number of definitions have been used for product counterfeiting. The one given by
Cordell et al. (1996) was “any unauthorized manufacturing of goods whose special
characteristics are protected as intellectual property rights (trademarks, patents and
copyrights) constitutes product counterfeiting. This means, that the counterfeiters
copied or imitated products that has been patented and trademarked without
permission from the manufacturers of the genuine products. The products are seen to
look closely similar or identical to genuine products. This would include packaging,
labelling, and trademarks, intentionally passing off as the original product (Kay, 1990;
Ang et al., 2001; Chow, 2000).
Lai and Zaichkowsky (1999) stated that counterfeiting and piracy are in the same
essence since they are both the reproduction of identical copies of authentic products.
These two terms have been used interchangeably (Wee et al., 1995; Kwong et al.,
2003). However, piracy is mainly related to software and fixed medium contents such
as films and music recordings (Chow, 2000; Cheung and Prendergast, 2006).
14
Furthermore, counterfeiting is dissimilar to other forms of intellectual property
infringements like grey market goods. De Matos et al. (2007) have utilized scales that
measured grey market products for counterfeits, which is undeniably different in
characteristics and definition. Grey market goods are, by definition, overruns from
outsourced manufacturers that are distributed through unauthorized channels (Huang
et al., 2004; Gentry et al. 2006), whereas counterfeiting involves an illegally produced
copy of the original article.
2.1.2 Attitude
“Attitude” is “...a learned predisposition to behave in a consistently favourable or
unfavourable manner with respect to a given object.” (Schiffman and Kanuk, 1997). It
is claimed to be highly correlated with one’s intentions, which in turn is a reasonable
predictor of behaviour. (Ajzen and Fishbein, 1980) This means that if a person’s
attitude towards counterfeit products is favourable, it is highly likely that the person
would consider purchasing a counterfeit product but if a person’s attitude towards
counterfeit products is unfavourable, then it is most likely that the person would not
consider purchasing a counterfeit product.
2.2 Literature of Variable
2.2.1 Information Susceptibility and Normative Susceptibility
Social influence refers to the effects that others have on an individual consumer’s
behaviour (Ang et al., 2001). Two common forms of consumer susceptibility to social
influences are information susceptibility and normative susceptibility (Bearden et al.,
1989; Wang et al., 2005). Information susceptibility refers to purchase decision based
15
on the expert opinion of others (Ang et al., 2001; Wang et al., 2005), meaning that the
assurance of other’s opinions play an important role as a point of reference especially
when consumers have little knowledge of the product category or product brand. If
peers or reference groups were to have expert knowledge on the differences between
originals and counterfeits (such as in product quality), there are consequences of
being perceived to purchase counterfeits which would affect the consumers’
perception towards counterfeit products.
On the other hand, normative susceptibility concerns purchase decisions based on the
expectations of what would impress others (Ang et al., 2001; Wang et al., 2005; Penz
and Sto¨ttinger, 2005). The consumers whom are normative susceptibility would
purchase a product based on what they assume the others would expect or want them
to buy. They are more inclined to satisfy the society’s expectations as self-image
plays a huge role and they want to make a good impression.
Consumers may be informationally susceptible, when expertise from others influences
their choice (e.g. when one does not know the product category), and normatively
susceptible, they are more interested in making a good impression to others (Bearden
et al., 1989). Regarding counterfeits, friends and relatives may act as inhibitors or
contributors to the consumption, depending on how much this behaviour is approved
by them.
2.2.2 Price Consciousness
Price plays an important role in affecting consumers’ attitude and it has been studied
extensively. According to the range theory, people use the range of remembered price
16
experiences to set lower and upper bounds on price expectations, such that the
attractiveness of a market price is a function of its position within this range
(Janiszewski and Lichtenstein, 1999). Reference price has been discussed as a factor
that importantly affects a consumer’s purchasing behaviour. After adaptation-level
theory was integrated into pricing theory, an internal reference price was presented as
a degree of adaptation that depends on recent price experiences (Janiszewski and
Lichtenstein, 1999). Rajendran and Tellis (1994) have found that within this context,
the lowest price is an important cue for a reference price, whereas over the time, the
past prices of the actual brand seem to become the most important cue.
The fact that consumers use the price in the authorized channel as a reference price is
plausible, and so the manufacturers of counterfeit products would take advantage of
lower price to attract consumers’ interest. Most researchers claim that price difference
is an important factor when purchasing counterfeit products (Bucklin, 1993; Chang,
1993; Weigand, 1991). When the sellers of counterfeit products sell simultaneously
alongside an authorized channel, consumers with a higher price consciousness may
prefer to select the counterfeit products sold at the lower price.
2.2.3 Value Consciousness
Perceived value has been defined as "the consumer's overall assessment of the utility
of a product based on what is received and what is given" (Zeithaml 1988). Most of
the consumers of counterfeit products pursue value for brand, prestige and image
benefits, but unwilling to pay a high price for it (Bloch et al., 1993). Therefore, for a
lower price and a substandard quality, counterfeits are considered value for money
(Bloch et al., 1993; Lichtenstein et al., 1990; Ang et al., 2001; Wang et al., 2005), as
17
counterfeit products usually provide the same functional benefits as the genuine, but
at a fraction of the price of the genuine products. Value conscious consumers consider
themselves as smart buyers. They are concerned of paying a low price but the product
is subject to some quality constraint.
2.2.4 Perceived Risk
Perceived risk is one of the main explanatory variables in consumers’ behaviour
(Mitchell, 1999; Mitchell and Boustani, 1993; Gabbott, 1991; Brooker, 1984).
Marketing literature has long acknowledged perceived risk as an important issue
during buying decisions, proposing that consumers seek to reduce uncertainty and the
unfavourable consequences of purchase decisions (Mitchell, 1999; Cox, 1967; Bauer,
1960).
Perceived risk comprises of multidimensional constructs (Mandel, 2003; Campbell
and Goodstein, 2001; Mitchell and Boustani, 1993; Jacoby and Kaplan, 1972;
Roselius, 1971):
• Functional (associated to the performance of the product)
• Financial (related with the potential monetary loss)
• Social (relative to the perception of other individuals about the consumer)
• Physical (relative to the health or physical well-being)
• Psychological risk (associated to the individuals self-esteem)
• Time risk (refers to the time lost as a result of product failure)
Each product has a set of these risks associated with its purchase and each consumer
has an individual level of tolerance towards each one (Mitchell, 1998). Since the
18
outcome of the choice decision made by the consumer can only be known in the
future, the consumers are forced to deal with uncertainty till the extent of the
consumers realize that the counterfeit products that they have bought did not
accomplish all of their buying goals, then, risk is perceived.
2.2.5 Integrity
The influence of basic values like integrity will affect the judgment towards
succumbing to unethical activities (Steenhaut and van Kenhove, 2006). Integrity is
determined by personal ethical standards and obedience to the law. If the consumers
view integrity as critical, the chances of them viewing counterfeit products as
favourable would be less, but if the consumers do not feel that integrity is important
then they would be in favour of counterfeits (Ang et al., 2001; Wang et al., 2005).
Consumers’ purchase of a counterfeit is not a criminal act, but as consumers
participate in a counterfeit transaction that supports illegal activity, consumer’s
respect for lawfulness might explain how much engagement the consumer will have
in buying counterfeit products. Indeed, research shows that consumers’ willingness to
purchase counterfeit products is negatively related to attitudes toward lawfulness
(Cordell et al., 1996). In this sense, those consumers who have lower ethical standards
are expected to feel less guilty when buying a counterfeit product (Ang et al., 2001).
Rather, they rationalize their behaviour in a way to reduce the cognitive dissonance of
an unethical behaviour.
19
2.2.6 Personal Gratification
Personal gratification is the need for a sense of accomplishment, social recognition,
and the desire to enjoy the finer things in life (Ang et al., 2001; Wang et al., 2005).
Consumers with high sense of personal gratification would be more conscious of the
appearance and visibility of fashion products and are probably less prone to accept
goods of inferior quality (Phau and Teah, 2009). This is because by buying a
counterfeit version of the genuine products, the consumers are seen as not thinking
highly of themselves. Buying a counterfeit product does not portray the consumer’s
accomplishment.
There are conflicting results in literatures because Bloch et al. (1993) suggest that
consumers choosing a counterfeit product see themselves as less well off financially,
less confident, less successful and lower status than non-counterfeit buyers. On the
contrary, Ang et al. (2001) reveal that there is no significant influence of personal
gratification on consumer attitudes toward counterfeits.
2.2.7 Novelty Seeking
Novelty seeking is the curiosity of individuals to seek variety and difference
(Hawkins et al., 1980; Wang et al., 2005). A consumer who is inclined to try new
products would probably have positive attitudes towards counterfeits of counterfeit
products. Novelty seeking consumers are particularly inclined towards products with
low purchase risk. Hence, the low cost of counterfeit products is well suited to satisfy
their curiosity and the need for experimentation (Wee et al., 1995).
20
2.2.8 Status Consumption
Status is a form of power that consists of respect, consideration, and envy from others
and represents the goals of a culture and status consumption refers to consumers who
are seeking self satisfaction as well as displaying their prestige and status to others
usually through visible evidence (Eastman et al., 1997). Status is a position or rank in
a society, which is given or awarded to an individual by others. Status consumers seek
to possess brands that exude brand symbols that reflect their self-identity. Eastman
(1997) suggests that significant levels of status consumption exist in all communities
in the world where the utility of products is measured by the social advantage these
purchases offer.
2.2.9 Attitude of Counterfeit Products
As counterfeits are the cheaper alternatives to the more expensive genuine products,
there might not be a significant difference in perceived quality (Gentry et al., 2006).
According to Tom et al. (1998), consumers are more inclined to purchase products
with a fashion component attached. Consumers are willing to pay for the visual
attributes and functions without paying for the associate quality (Grossman and
Shapiro, 1988; Cordell et al., 1996). Consumers are also expected to prefer counterfeit
products with a famous brand’s name attached that would present some meaning to
the consumer (Cordell et al., 1996). This reinforces the concept that only brand’s
names that are well known or worth counterfeiting, are targeted for illegal production
(Eisend and Schuchert-Gu¨ ler, 2006).
Past research has examined the economic, quality, and legal or ethical factors that
shape and influence attitudes of consumers (Cordell et al., 1996; Ang et al., 2001;
21
Wang et al., 2005). Ultimately, the functional benefits are important when purchasing
counterfeits products. However, it is also the desire to own the prestige and status
symbol that are inherent in the trademarked brand (Cordell et al., 1996; Chadha,
2007). More commonly, price also reflects consumers’ attitudes towards the value of
counterfeit products.
The general perception is that the low financial risks provide the added benefit for
consumers to purchase counterfeit goods, as prices of counterfeits are relatively
advantageous. In addition, because counterfeits are often sold at a lower price, the
expectation of quality would not be equivalent to that of the genuine articles. As long
as the basic functional requirements are met or the visibility and symbolic value is
achieved, consumers will be satisfied (Eisend and Schuchert-Gu¨ ler, 2006). However,
the quality of counterfeit products has been improved in recent years due to better
technological advancement, bringing a competitive advantage to counterfeit products
(Nill and Shultz, 1996). Certain products can be tried before purchase to gauge the
functionality or performance, which can encourage consumers’ willingness to
purchase (Cordell et al., 1996; Bian and Veloutsou, 2007).
However, unlike genuine products, counterfeit products are still without warranties,
adding to greater financial risks of purchases (De Matos et al., 2007). It has been
found that if the perceived product attributes between the genuine products and the
counterfeit products are similar in terms of quality, the purchase intention will be
higher (Wee et al., 1995; Penz and Sto¨ ttinger, 2005).
22
Consumers experiencing situational ethics excuse themselves for purchasing
counterfeits as justifiable because they perceive themselves to be less unethical or
illegal (Cordell et al., 1996; Albers-Miller, 1999; Gupta et al., 2004). Hence,
consumers feel less responsible towards their role as a counterfeit patron. The double
standards show indifferent attitudes towards the consumption of counterfeit goods,
since major corporations might not suffer from the perceived slight loss of profits
(Cordell et al., 1996; Ang et al., 2001; De Castro et al., 2007).
2.2.10 Purchase Intentions
According to the theory of planned behaviour (TPB), purchase behaviour is
determined by the purchase intention, which in turn determined by attitudes (Fishbein
and Ajzen, 1975). Attitudes towards behaviour instead of towards the product are
noted to be a better predictor of behaviour (Fishbein, 1967; Fishbein and Ajzen, 1975;
Lutz, 1975; Yi, 1990; Penz and Sto¨ ttinger, 2005). However, the TPB also stated that
the opportunities and resources, such as the accessibility of counterfeit products, must
be present before purchase behaviour can be performed. Without such circumstances,
regardless of how favourable intentions are, it would be difficult to perform a
purchase (Chang, 1998).
The more favourable consumers’ attitudes towards counterfeiting are, the higher the
chances those consumers will purchase counterfeit brands. Similarly, the more
unfavourable consumers’ attitudes towards counterfeiting are, the less likely are the
chances of purchase (Wee et al., 1995). In addition, social and personality antecedents
23
have long been established to have an influence on consumers’ decision-making
(Miniard and Cohen, 1983) towards purchase intention.
The link attitude-behavioural intentions have been extensively examined in the
marketing literature. According to the Theory of Reasoned Action, attitude is
positively correlated with purchase intentions, which in turn is an antecedent of the
real behaviour (Ajzen and Fishbein, 1980).
2.3 Summary
This chapter has covered the literature of past study based on the specific areas that
are relevant. These literatures will then support the hypotheses postulated in the
following chapter.
24
CHAPTER 3: CONCEPTUAL FRAMEWORK AND HYPOTHESES
CHAPTER 6:
CONCLUSION AND
RECOMMENDATION
CHAPTER 3:
CONCEPTUAL
FRAMEWORK AND
HYPOTHESES
CHAPTER 4:
RESEARCH
METHODOLOGY
CHAPTER 5:
RESULTS AND FINDINGS
CHAPTER 2:
LITERATURE REVIEW
CHAPTER 1:
INTRODUCTION
• Introduction
• Conceptual Framework
• Hypothesis
• Summary
25
3.0 Introduction
The previous chapter discusses the literature review of past study and research. This
chapter presents the conceptual framework model of this study, which consists of
independent variables, mediating variables and dependent variables. Hypotheses are
then postulated based on the model and supported by the literature review in chapter
2.
3.1 Conceptual Framework
H3
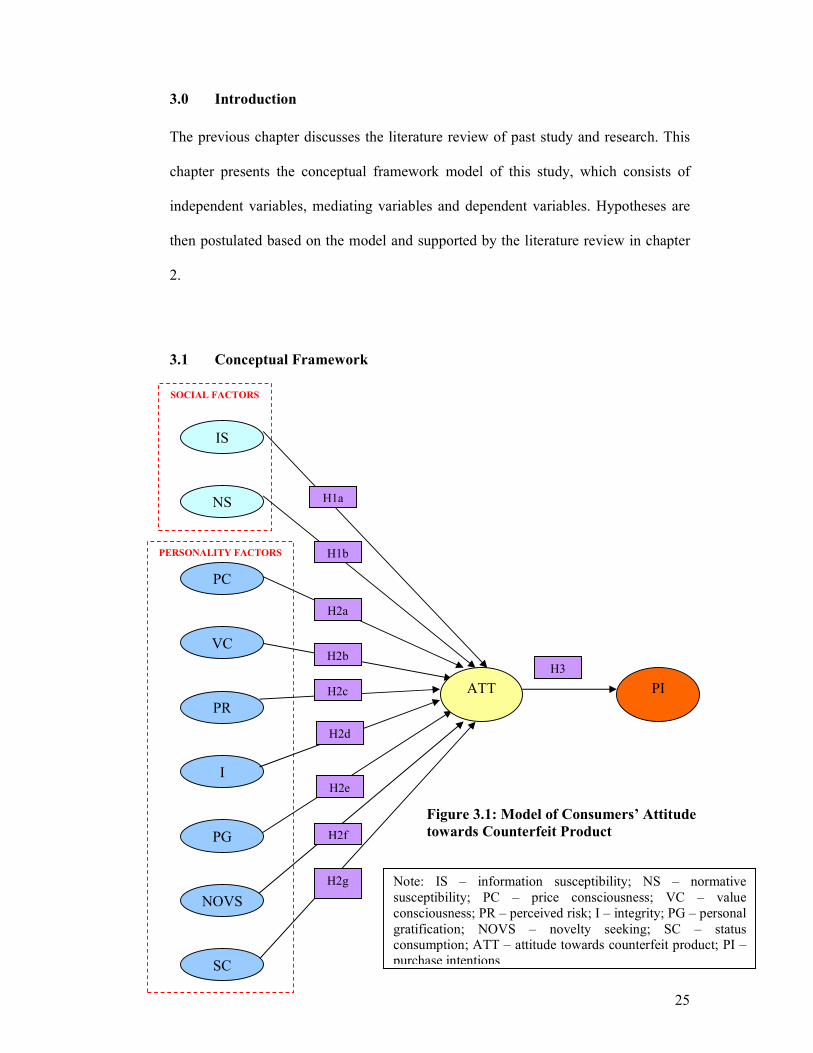
Note: IS – information susceptibility; NS – normative susceptibility; PC – price consciousness; VC – value consciousness; PR – perceived risk; I – integrity; PG – personal gratification; NOVS – novelty seeking; SC – status consumption; ATT – attitude towards counterfeit product; PI – purchase intentions
SOCIAL FACTORS
PERSONALITY FACTORS
NOVS
PG
I
PR
VC
PC
NS
IS
SC
ATT PI
H2d
H2e
H2f
H2g
H2c
H1b
H2a
H2b
H1a
Figure 3.1: Model of Consumers’ Attitude
towards Counterfeit Product
26
From past research and literatures in Chapter 2, the conceptual model for this study is
as in Figure 3.1, which shows Information Susceptibility, Normative Susceptibility,
Price Consciousness, Value Consciousness, Perceived Risk, Integrity, Personal
Gratification, Novelty Seeking and Status Consumption as independent variables
(IV), Attitude of Counterfeit Products as the mediating variable (MV) and Purchase
Intention as the dependent variable (DV).
The model adapted and extended from Huang et al. (2004), De Matos et al. (2007),
Phau, and Teah (2009). Huang et al. (2004) examined three factors, De Matos et al.
(2007) model examined six factors, and Phau I. and Teah M. (2009) model examined
eight factors. The combination of all three models has derived a model with nine
factors.
Price Consciousness was adopted from Huang et al (2004), Information susceptibility,
normative susceptibility, value consciousness, novelty seeking and status
consumption was adopted from De Matos et al. (2007), and perceived risk was
adopted from Phau and Teah (2009). Both integrity and personal gratification were
taken from De Matos et al. (2007) and Phau and Teah (2009) model.
3.2 Hypotheses
The hypotheses indicated below is tested and discussed in this whole study
accordingly:
27
3.2.1 Social Factors (Independent Variable)
Social influence refers to the effects that others such as family members and/or
friends have on an individual consumer’s attitude. Two common forms of consumer
susceptibility to social influences are information susceptibility and normative
susceptibility (Bearden et al., 1989; Wang et al., 2005; Phau and Teah, 2009).
Informative Susceptibility and Normative Susceptibility
Informative susceptibility concerns purchase decisions, which are based on the expert
opinions of others, and normative susceptibility concerns purchase decisions, which
are based on the expectations of what would impress others (Ang et al., 2001). As
counterfeit products is not legal/ethical and does not have a positive social image,
consumers with higher susceptibility to social influence may present negative
attitudes towards counterfeit products. It can be hypothesized that:
H1a: Information susceptibility has no effects on consumers’ attitude towards
counterfeit products.
H1b: Normative susceptibility has no effects on consumers’ attitude towards
counterfeit products.
3.3.2 Personality Factors (Independent Variable)
Personality influence refers to the individual’s interpersonal influence without relying
on the opinion of others or conforming to the expectation of others.
Price Consciousness
Perception of the price cue for some consumers can be characterized more narrowly
as reflecting price consciousness. According to the term used by Lichtenstein et al.
28
(1993), price consciousness refers to the degree to which the consumer focuses
exclusively on paying low prices. Consumers whose main concern is paying a low
price on a product would opt for counterfeit products. Thus, it can be hypothesized
that:
H2a: Price consciousness has no effects on consumers’ attitude towards
counterfeit products.
Value Consciousness
Value consciousness is defined as a concern for paying lower prices but with
acceptable standard of quality (Lichtenstein et al., 1990; Ang et al., 2001). As
counterfeit products usually provide similar functions to the genuine products but for
a lower price, consumers who are value-conscious may choose counterfeit products
over the genuine products. Thus, it can be hypothesized that:
H2b: Value consciousness has no effects on consumers’ attitude towards
counterfeit products.
Perceived Risk
Marketing literature has long acknowledged perceived risk as an important issue
during buying decisions, suggesting that consumers seek to reduce uncertainty and the
inauspicious consequences of purchase decisions (Mitchell, 1999; Cox, 1967; Bauer,
1960). Thus, the greater the perceived risk, the lower is the likelihood of consumers'
consideration of a counterfeit product. It can be hypothesized that:
H2c: Perceived risk has no effects on consumers’ attitude towards counterfeit
products.
29
Integrity
Integrity represents the level of consumers’ ethical standards and obedience to the law
(Ang et al., 2001). The more important integrity is to a consumer, the more negative
the consumer will feel about counterfeit products. Therefore, it can be hypothesized
that:
H2d: Integrity has no effects on consumers’ attitude towards counterfeit
products.
Personal Gratification
Personal gratification concerns the need for a sense of accomplishment, social
recognition, and to enjoy the finer things in life (Ang et al., 2001). Consumers with
high personal gratification will value the original version of the branded products,
thus have a negative attitude towards the counterfeit products. It can be hypothesized
that:
H2e: Personal gratification has no effects on consumers’ attitude towards
counterfeit products.
Novelty Seeking
Novelty seeking is the curiosity of individuals to seek variety and difference
(Hawkins et al., 1980; Wang et al., 2005). Therefore, consumers who likes keeping
up-to-date would like to be seen with the latest products or designs would very likely
purchase counterfeit products as they are able to continuously change their style but at
a relatively lower price. It can be hypothesized that:
H2f: Novelty seeking has no effects on consumers’ attitude towards counterfeit
products.
30
Status Consumption
Status consumers are more conscious of the display of accomplishment (Phau and
Teah, 2009). The consumers would most likely buy and even pay more for a product
that has status. Should their peers or family members know that they buy counterfeit
products, the status consumers would feel that their image is tarnished thus their
attitudes towards counterfeit products would be unfavourable. It is therefore
hypothesized that:
H2g: Status consumption has no effects on consumers’ attitude towards
counterfeit products.
3.3.3 Attitude towards counterfeit products (Mediating Variable)
According to the theory of planned behaviour (TPB), purchase behaviour is
determined by the purchase intention, which is in turn determined by attitudes
(Fishbein and Ajzen, 1975). The more favourable consumers’ attitudes towards
counterfeiting are the higher the chances those consumers will purchase counterfeit
products. Therefore, it is hypothesized that:
H3: Consumers’ attitude towards counterfeit products has no effects on
purchase intention.
3.3 Summary
This chapter has presented the conceptual model for this study. The model was
derived from past studies of Huang et al. (2004), De Matos et al. (2007), Phau, and
Teah (2009). There are nine independent variables, namely, information
susceptibility, normative susceptibility, price consciousness, value consciousness,
31
perceived risk, integrity, personal gratification, novelty seeking and status
consumption, one mediating variable which is consumers’ attitude towards counterfeit
products and one dependent variable namely purchase intention. The hypotheses
developed test the effects that one variable has over another variable. Hypothesis 1
tests the effects of social factors on consumers’ attitude towards counterfeit products.
Hypothesis 2 tests the effects of personality factor on consumers’ attitude towards
counterfeit products. Finally, hypothesis 3, tests the effects of consumers’ attitude
towards counterfeit products on purchase intention. All of the hypotheses result will
be tested in chapter 5. The next chapter presents the research methodology.
32
CHAPTER 4: RESEARCH METHODOLOGY
CHAPTER 6:
CONCLUSION AND
RECOMMENDATION
CHAPTER 3:
CONCEPTUAL
FRAMEWORK AND
HYPOTHESES
CHAPTER 4:
RESEARCH
METHODOLOGY
CHAPTER 5:
RESULTS AND FINDINGS
CHAPTER 2:
LITERATURE REVIEW
CHAPTER 1:
INTRODUCTION
• Introduction
• Research Design
• Questionnaire Development
• Sampling Design
• Sample Size
• Sample Selection
• Data Collection
• Data Analysis Technique
• Summary
33
4.0 Introduction
The previous chapter has presented the conceptual model and discussed the
hypotheses that are to be analyzed. The content of this chapter will cover the methods
chosen to do the analysis such as how the questionnaire was developed, how the
sample was selected, how the data was collected, and what are the analysis techniques
that will be used on the data obtained from the questionnaire.
4.1 Research Design
The approach of study taken is the quantitative approach. The approach is seen as
having objective observations, precise measurements, statistical analysis and
verifiable truths. The hypotheses that were constructed in Chapter 3 will be tested by
carefully analyzing the data using statistics.
A combination of both primary and secondary data collection methods have been used
for this study. The primary data for this study is obtained from the data collected
through the questionnaire distributed. The secondary data is collected from past
literature reviews and relevant articles.
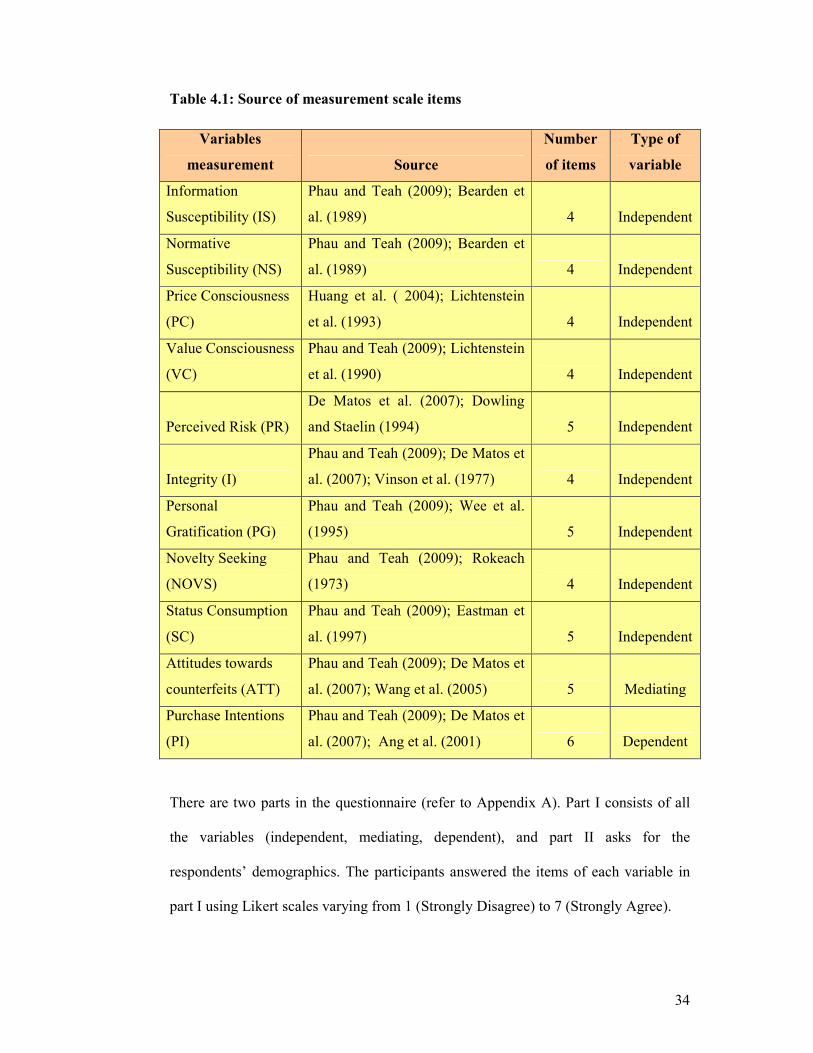
4.2 Questionnaire Development
Based on the literature, the researcher assembled the questionnaire, using scales that
was already validated in previous research (Huang et al., 2004; De Matos et al., 2007;
Phau and Teah, 2009) as can be seen in Table 4.1, which summarizes the items used
in each scale, as well as the authors as reference.
34
Table 4.1: Source of measurement scale items
There are two parts in the questionnaire (refer to Appendix A). Part I consists of all
the variables (independent, mediating, dependent), and part II asks for the
respondents’ demographics. The participants answered the items of each variable in
part I using Likert scales varying from 1 (Strongly Disagree) to 7 (Strongly Agree).
Variables
measurement Source
Number
of items
Type of
variable
Information
Susceptibility (IS)
Phau and Teah (2009); Bearden et
al. (1989) 4 Independent
Normative
Susceptibility (NS)
Phau and Teah (2009); Bearden et
al. (1989) 4 Independent
Price Consciousness
(PC)
Huang et al. ( 2004); Lichtenstein
et al. (1993) 4 Independent
Value Consciousness
(VC)
Phau and Teah (2009); Lichtenstein
et al. (1990) 4
Independent
Perceived Risk (PR)
De Matos et al. (2007); Dowling
and Staelin (1994) 5
Independent
Integrity (I)
Phau and Teah (2009); De Matos et
al. (2007); Vinson et al. (1977) 4 Independent
Personal
Gratification (PG)
Phau and Teah (2009); Wee et al.
(1995) 5 Independent
Novelty Seeking
(NOVS)
Phau and Teah (2009); Rokeach
(1973) 4 Independent
Status Consumption
(SC)
Phau and Teah (2009); Eastman et
al. (1997) 5 Independent
Attitudes towards
counterfeits (ATT)
Phau and Teah (2009); De Matos et
al. (2007); Wang et al. (2005) 5 Mediating
Purchase Intentions
(PI)
Phau and Teah (2009); De Matos et
al. (2007); Ang et al. (2001) 6 Dependent
35
In this study, there is no particular counterfeited product being specified. Questions
considered the expression “counterfeit products” as general because the aim is just to
assess consumers’ attitude towards counterfeit products as an overall.
4.3 Sampling Design
Non-probability sampling is used in this study, meaning that the elements in the
population have no probability attached to their being selected as sample subjects.
The type of probability sampling that was chosen to collect the sample is convenience
sampling because the response can be obtained quickly and efficiently. It involves
collecting information from members of the population who are conveniently
available to provide it.
The sampling frame for this study is based on the consumer’s age, ethnic group,
education level, occupation, and income level.
4.4 Sample Size
For this study, Roscoe (1975) rules of thumb are followed for determining the sample
size:
• The sample size is larger than 30 and smaller than 500.
• A minimum sample size of 30 for each category in the sub samples (e.g.
Malay/ Chinese/ Indian, SPM/ diploma/ bachelor/ postgraduate, and others).
36
4.5 Sample Selection
A survey was conducted among respondents in Klang Valley and the samples selected
are of consumers between the age of eighteen and above. The respondents include
both male and female, who are students or working professionals from various
institutions and organizations, or self-employed or even retirees.
4.6 Data Collection
A total of 300 self-administrated questionnaires were distributed through many
different channels, namely, via email, via mall intercept at a shopping complex, and
via direct distribution to students at public and private universities. Data collection
was performed over a two-week period on both weekdays and weekends.
A ball pen and imported chocolates were given out to the respondents of mall
intercept and direct distribution, as a token of gratitude. The researcher felt like it was
necessary, as some were hesitant to spend their time answering the questionnaires.
Several universities were visited to gather responses for the occupation category of
students. For respondents that were approached via email, constant reminders had to
be given, as some would forget to reply.
The questionnaire was also circulated amongst work colleagues of family and friends.
This is to ensure that there are no biases. In the end, a total of 270 questionnaires that
were completed and returned were used for further analysis in Chapter 5.
37
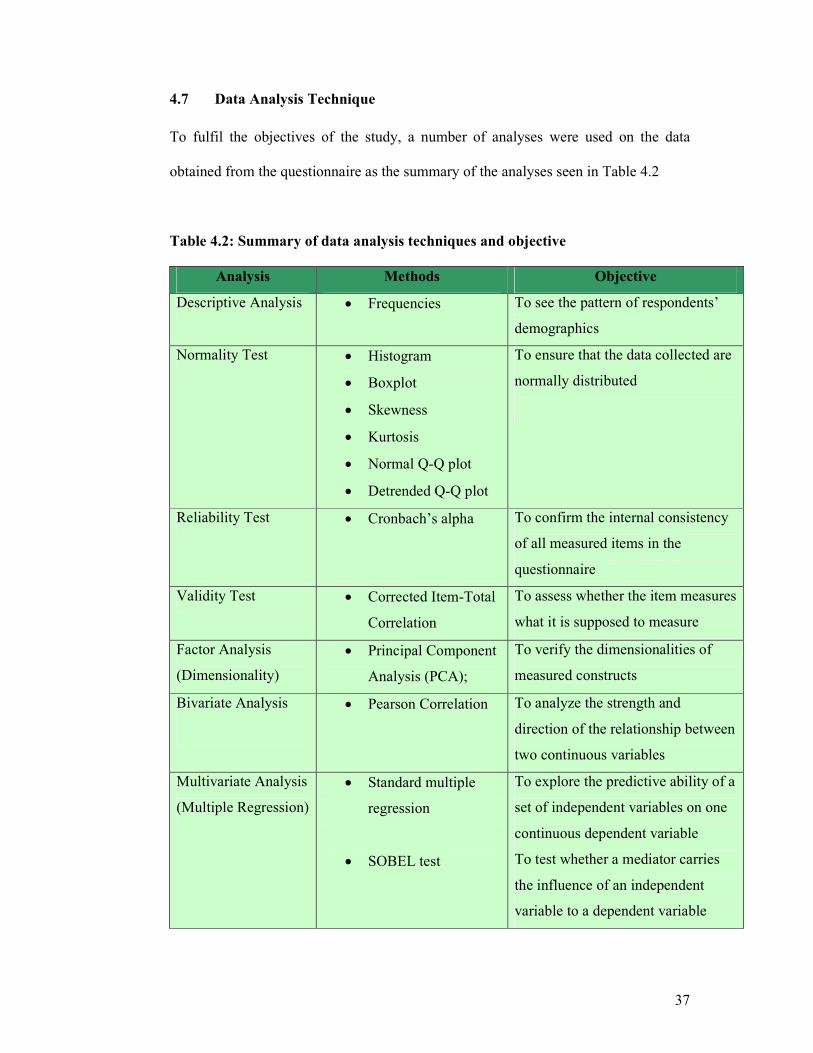
4.7 Data Analysis Technique
To fulfil the objectives of the study, a number of analyses were used on the data
obtained from the questionnaire as the summary of the analyses seen in Table 4.2
Table 4.2: Summary of data analysis techniques and objective
Analysis Methods Objective
Descriptive Analysis • Frequencies To see the pattern of respondents’
demographics
Normality Test • Histogram
• Boxplot
• Skewness
• Kurtosis
• Normal Q-Q plot
• Detrended Q-Q plot
To ensure that the data collected are
normally distributed
Reliability Test • Cronbach’s alpha To confirm the internal consistency
of all measured items in the
questionnaire
Validity Test • Corrected Item-Total
Correlation
To assess whether the item measures
what it is supposed to measure
Factor Analysis
(Dimensionality)
• Principal Component
Analysis (PCA);
To verify the dimensionalities of
measured constructs
Bivariate Analysis
• Pearson Correlation To analyze the strength and
direction of the relationship between
two continuous variables
Multivariate Analysis
(Multiple Regression)
• Standard multiple
regression
• SOBEL test
To explore the predictive ability of a
set of independent variables on one
continuous dependent variable
To test whether a mediator carries
the influence of an independent
variable to a dependent variable
38
4.8 Summary
This chapter has discussed the approaches taken to do the study. The items in the
questionnaire were taken from different sources such as Phau and Teah (2009), De
Matos et al. (2007), Wang et al. (2005), Ang et al. (2001), and others. The data
analysis to be done on the data obtained from the questionnaire was also presented;
complete with the method to be taken and its objective. In the next chapter, the data
analysis technique that had been mentioned will be performed on the data obtained
from the questionnaire.
39
CHAPTER 5: RESULTS AND FINDINGS
CHAPTER 6:
CONCLUSION AND
RECOMMENDATION
CHAPTER 3:
CONCEPTUAL
FRAMEWORK AND
CHAPTER 4:
RESEARCH
CHAPTER 5:
RESULTS AND FINDINGS
CHAPTER 2:
LITERATURE REVIEW
CHAPTER 1:
INTRODUCTION
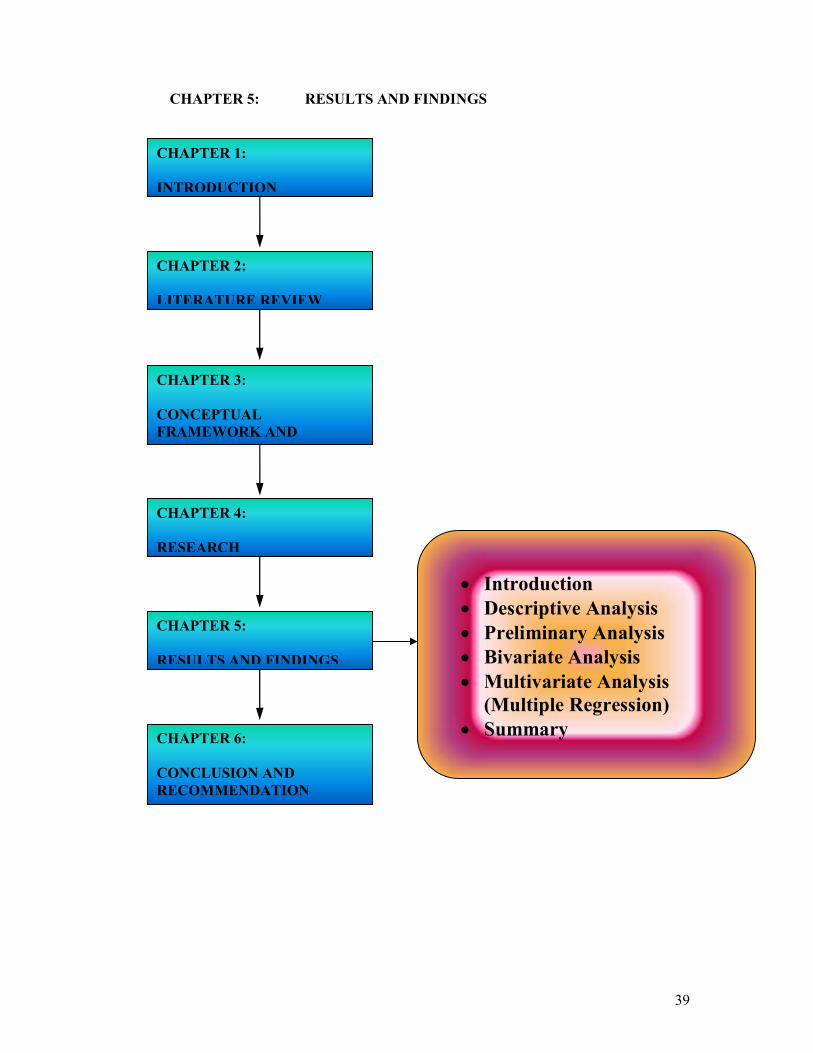
• Introduction
• Descriptive Analysis
• Preliminary Analysis
• Bivariate Analysis
• Multivariate Analysis
(Multiple Regression)
• Summary
40
5.0 Introduction
In the previous chapter, the research methodology was presented along with a
summary of data analysis that is to be performed in this chapter. Thus, the content of
this chapter looks into the analyses tested on the data and its result. The analyses are
divided into four sections. In the first section, descriptive analysis was done to see the
pattern and frequency of respondents demographic. In the second section, preliminary
analysis such as normality, reliability, validity and factor analysis were assessed.
Normality tests is to see whether the data obtained were normal, reliability test is to
see whether the items that make up a scale are all measuring the same underlying
construct, validity test is to see whether the item measures what it is supposed to
measure, and factor analysis is to verify the dimensionalities of measured constructs.
In the third section, Bivariate analysis was done by using Pearson correlation to test
the hypotheses made in Chapter 3. In the final section, Multivariate analysis was used
to see the predictive ability of the set of independent variables on the dependent
variable and whether, the mediator carries the influence of an independent variable to
a dependent variable.
5.1 Descriptive Analysis
A total of 300 questionnaires were distributed and only 270 completed questionnaires
were returned and taken as the sample. The 90 per cent response rate included both
male and female, out of which, 119 were male and 151 were female. There were no
missing values coded when the data was typed in the SPSS system.
The respondents’ demographic profile, which consists of gender, age, citizenship,
ethnic group, marital status, education, occupation and monthly income, were
41
analyzed and summarized as in Table 5.1. It is hope to contribute in explaining the
findings of this study for deeper understanding.
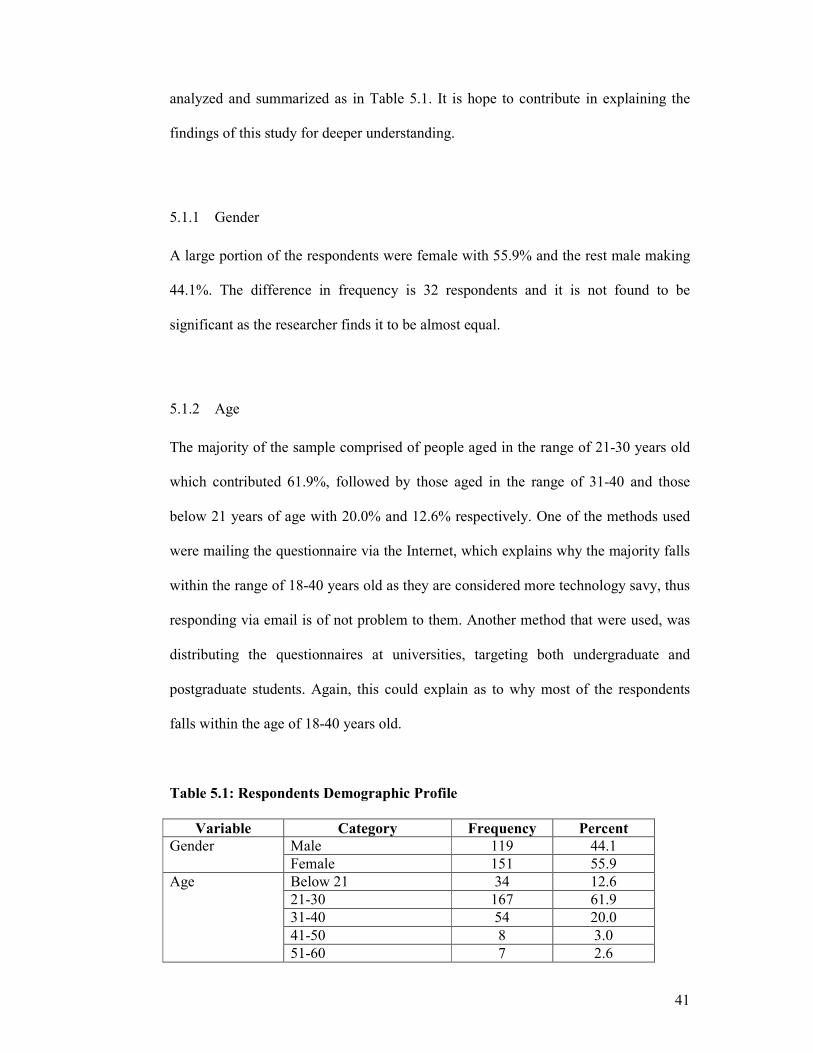
5.1.1 Gender
A large portion of the respondents were female with 55.9% and the rest male making
44.1%. The difference in frequency is 32 respondents and it is not found to be
significant as the researcher finds it to be almost equal.
5.1.2 Age
The majority of the sample comprised of people aged in the range of 21-30 years old
which contributed 61.9%, followed by those aged in the range of 31-40 and those
below 21 years of age with 20.0% and 12.6% respectively. One of the methods used
were mailing the questionnaire via the Internet, which explains why the majority falls
within the range of 18-40 years old as they are considered more technology savy, thus
responding via email is of not problem to them. Another method that were used, was
distributing the questionnaires at universities, targeting both undergraduate and
postgraduate students. Again, this could explain as to why most of the respondents
falls within the age of 18-40 years old.
Table 5.1: Respondents Demographic Profile
Variable Category Frequency Percent
Male 119 44.1 Gender
Female 151 55.9
Below 21 34 12.6
21-30 167 61.9
31-40 54 20.0
41-50 8 3.0
Age
51-60 7 2.6
42
Malaysian 258 95.6 Citizenship
Others 12 4.4
Malay 170 63.0
Chinese 47 17.4
Indian 33 12.2
Ethnic group
Others 20 7.4
Single 209 77.4
Married 59 21.9
Marital status
Divorced/Widow 2 0.7
SPM 38 14.1
Diploma 30 11.1
Bachelor degree 145 53.7
Education
Postgraduate 57 21.1
Professional 49 18.1
Top management 7 2.6
Manager 20 7.4
Executive 56 20.7
Clerical/Admin 9 3.3
Student 105 38.9
Self-employed 13 4.8
Not working 10 3.7
Occupation
Retiree 1 0.4
Below RM2,000 119 44.1
RM2,000-RM4,000 98 36.3
RM4,001-RM6,000 38 14.1
RM6,001-RM8,000 3 1.1
RM8,001-RM10,000 4 1.5
Monthly income
RM10,001 and above 8 3.0
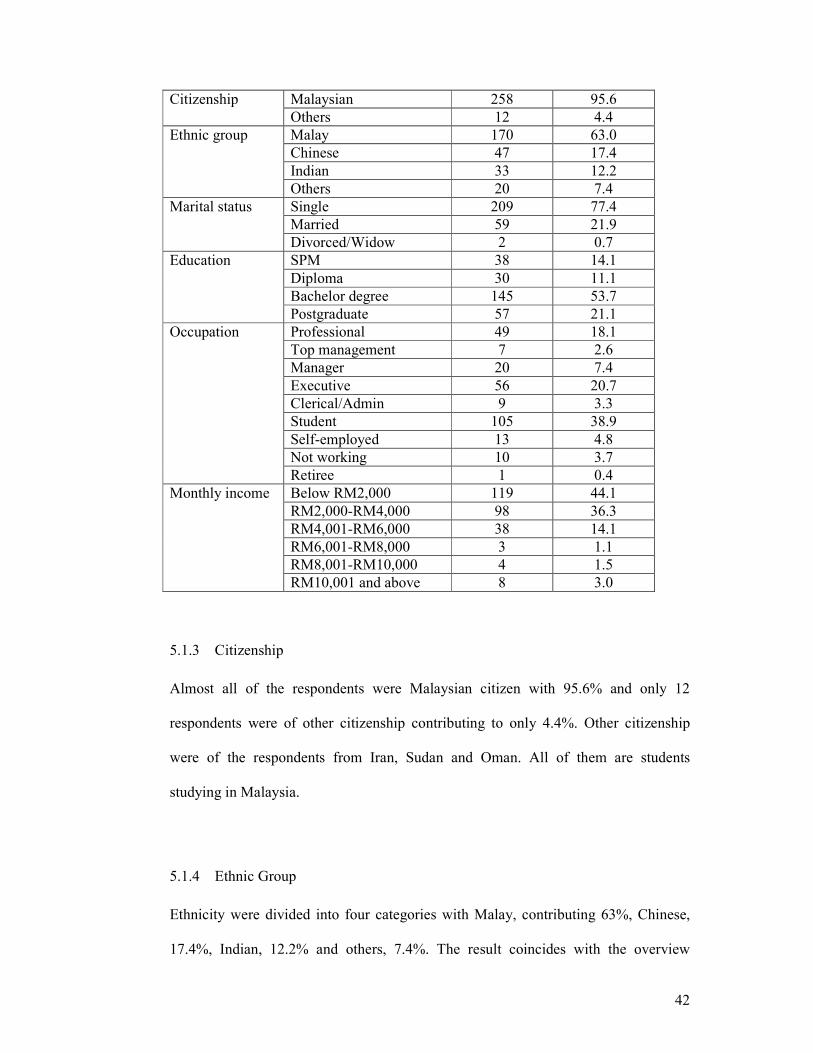
5.1.3 Citizenship
Almost all of the respondents were Malaysian citizen with 95.6% and only 12
respondents were of other citizenship contributing to only 4.4%. Other citizenship
were of the respondents from Iran, Sudan and Oman. All of them are students
studying in Malaysia.
5.1.4 Ethnic Group
Ethnicity were divided into four categories with Malay, contributing 63%, Chinese,
17.4%, Indian, 12.2% and others, 7.4%. The result coincides with the overview
43
statistics of Malaysia with Malays contributing the highest number of population,
followed by the Chinese, then the Indians and finally others.
5.1.5 Marital Status
For marital status, a huge number of respondents are single with a frequency of 209
respondents, followed by married respondents of 59 and only 2 divorcee or widow.
The justification for this is due of that 74.4% or 201 of the respondents are of 30 years
old and below. It is very likely that these respondents are not married yet as the norm
for males to get married is 30 years old and above, and for females, 27 years and
above.
5.1.6 Education level
Looking at the education segment, the sample has 38 SPM holders, 30 diploma
holders, 145 bachelor degree holders, and 57 postgraduates with their percentages of
14.1%, 11.1%, 53.7%, and 21.1% respectively. Therefore, it can be concluded that
85.9% of the respondents are of people with higher education.
5.1.7 Occupation
In the occupation segment, the majority of the respondents are students with 38.9%,
followed by executives with 20.7%, professionals with 18.1% and others such as
managers, self-employed, not working, clerical or admin, top management and retiree.
As mentioned earlier, a large portion of the respondents had a higher formal
education, therefore it is not surprising that a huge percentage goes to Student (those
44
who are still studying), Executive, Professional, Manager and Self-employed who are
mostly businessman or businesswoman.
5.1.8 Monthly Income
Monthly income of the respondents was also looked into with a majority having
below RM2,000 contributing 44.1%, followed by respondents having RM2,000-
RM4,000 with 36.3% and those having RM4,001-RM6,000 with 14.1%. A total of
119 respondents has an income of below RM2,000 because they are students and
those having an income of RM2,000-RM4,000 is due to the respondents’ age which
falls in the range of 21-30 years old and have only started building a career.
It can be concluded that the majority of these samples are Malaysian respondents,
falling in the range of 21-30 years old, Malay, single, has a bachelor degree, with an
income of RM4,000 and below.
5.2 Preliminary Analysis
Data screening, normality test, reliability test, validity test, and factor analysis were
all done in order to ensure that the data is ready for use to conduct analyses and to test
the hypotheses derived in Chapter 3.
45
5.2.1 Data Screening – Reversing negatively worded items
Before any statistical analysis were performed, the negatively worded items in the
data set were reversed. Only 1 worded item were reversed from the status
consumption construct:
• SC_4 - The status of a product is irrelevant to me
5.2.2 Normality
There are a number of tests, which one could do to see whether the data obtained is
normally distributed. It is important for the data to be normally distributed in order to
carry out tests such as Pearson correlation and multiple regressions.
One way to test the normality of data is by using histogram and Box Plot (refer to
Appendix B). As can be seen, the data is normal which allows for further analyses.
Another way is to look at the skewed and kurtosis of each item as can be seen in
Table 5.3. The skewed value provides an indication of the symmetry of the
distribution whereas the kurtosis provides information about the ‘peakedness’ of the
distribution. All items complied with the skewed and kurtosis level, by having values
below 2 and 3, indicating that all items within the normality curve.
Table 5.2 states the items of each variable and its simplified code to know which item
is which, in table 5.3, whereas in table 5.3, the mean, standard deviation, skewed and
kurtosis of each item in the questionnaire is presented.
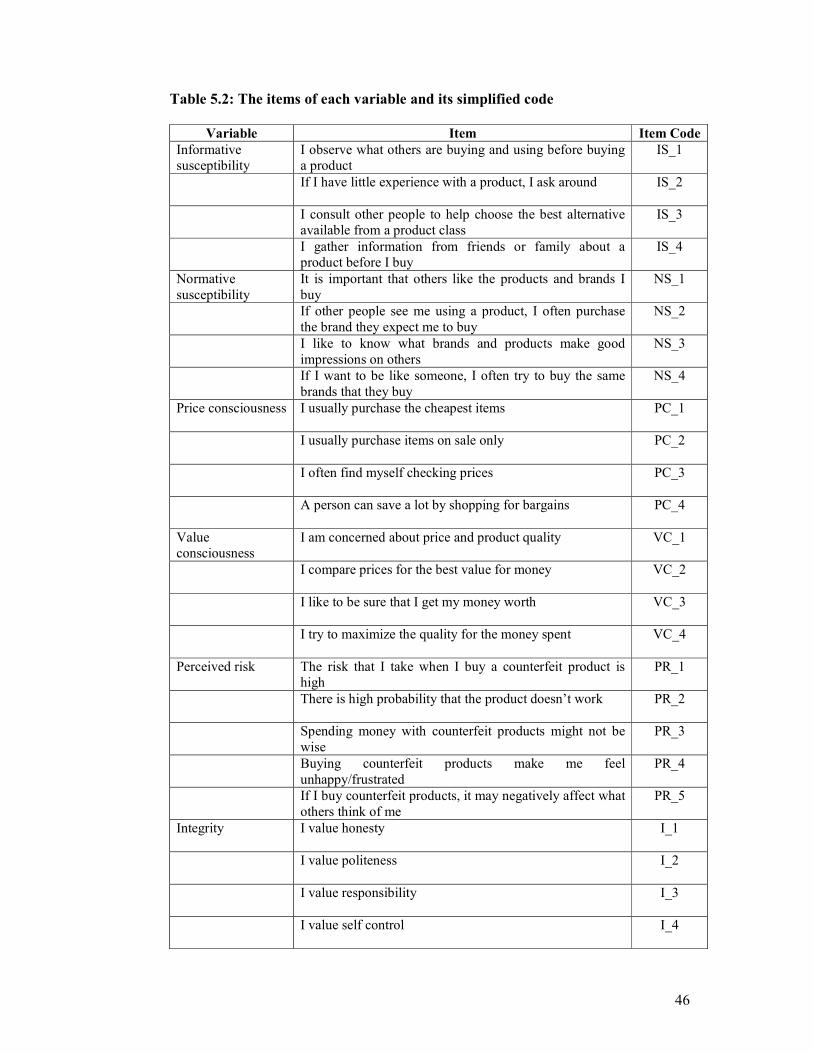
46
Table 5.2: The items of each variable and its simplified code
Variable Item Item Code
Informative susceptibility
I observe what others are buying and using before buying a product
IS_1
If I have little experience with a product, I ask around
IS_2
I consult other people to help choose the best alternative available from a product class
IS_3
I gather information from friends or family about a product before I buy
IS_4
Normative susceptibility
It is important that others like the products and brands I buy
NS_1
If other people see me using a product, I often purchase the brand they expect me to buy
NS_2
I like to know what brands and products make good impressions on others
NS_3
If I want to be like someone, I often try to buy the same brands that they buy
NS_4
Price consciousness I usually purchase the cheapest items
PC_1
I usually purchase items on sale only
PC_2
I often find myself checking prices
PC_3
A person can save a lot by shopping for bargains
PC_4
Value consciousness
I am concerned about price and product quality VC_1
I compare prices for the best value for money
VC_2
I like to be sure that I get my money worth
VC_3
I try to maximize the quality for the money spent
VC_4
Perceived risk The risk that I take when I buy a counterfeit product is high
PR_1
There is high probability that the product doesn’t work
PR_2
Spending money with counterfeit products might not be wise
PR_3
Buying counterfeit products make me feel unhappy/frustrated
PR_4
If I buy counterfeit products, it may negatively affect what others think of me
PR_5
Integrity I value honesty
I_1
I value politeness
I_2
I value responsibility
I_3
I value self control
I_4
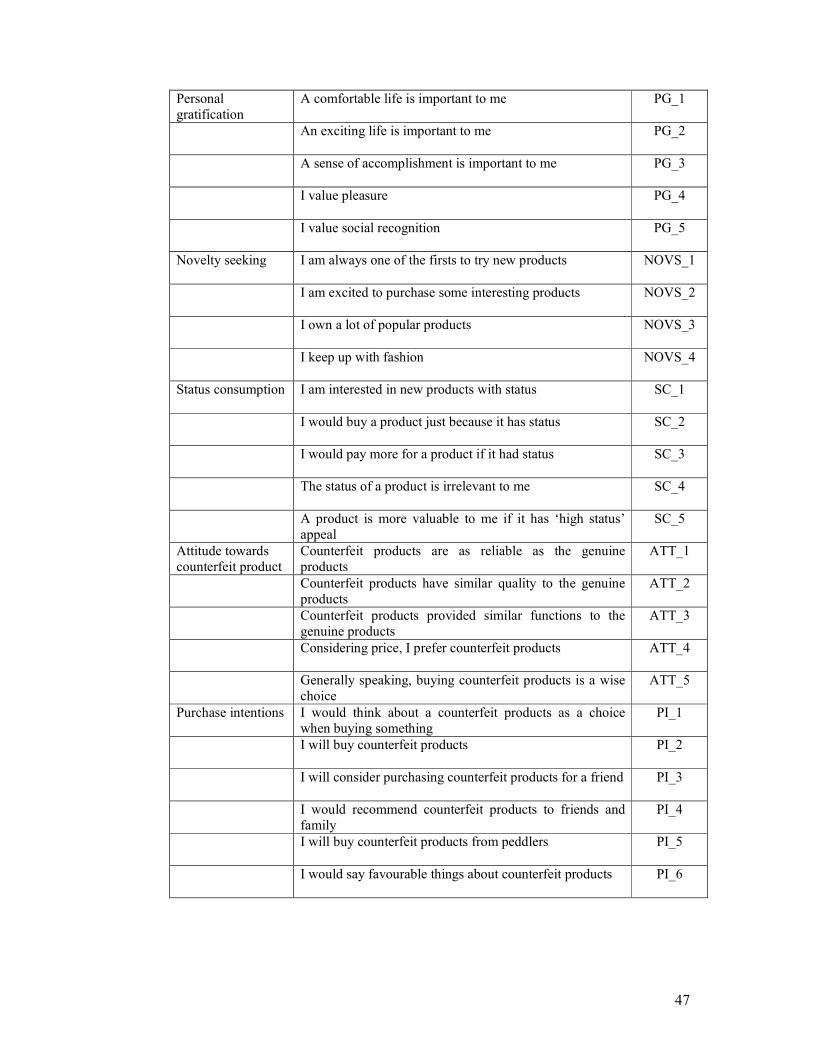
47
Personal gratification
A comfortable life is important to me PG_1
An exciting life is important to me
PG_2
A sense of accomplishment is important to me
PG_3
I value pleasure
PG_4
I value social recognition
PG_5
Novelty seeking I am always one of the firsts to try new products
NOVS_1
I am excited to purchase some interesting products
NOVS_2
I own a lot of popular products
NOVS_3
I keep up with fashion
NOVS_4
Status consumption I am interested in new products with status
SC_1
I would buy a product just because it has status
SC_2
I would pay more for a product if it had status
SC_3
The status of a product is irrelevant to me
SC_4
A product is more valuable to me if it has ‘high status’ appeal
SC_5
Attitude towards counterfeit product
Counterfeit products are as reliable as the genuine products
ATT_1
Counterfeit products have similar quality to the genuine products
ATT_2
Counterfeit products provided similar functions to the genuine products
ATT_3
Considering price, I prefer counterfeit products
ATT_4
Generally speaking, buying counterfeit products is a wise choice
ATT_5
Purchase intentions I would think about a counterfeit products as a choice when buying something
PI_1
I will buy counterfeit products
PI_2
I will consider purchasing counterfeit products for a friend
PI_3
I would recommend counterfeit products to friends and family
PI_4
I will buy counterfeit products from peddlers
PI_5
I would say favourable things about counterfeit products
PI_6
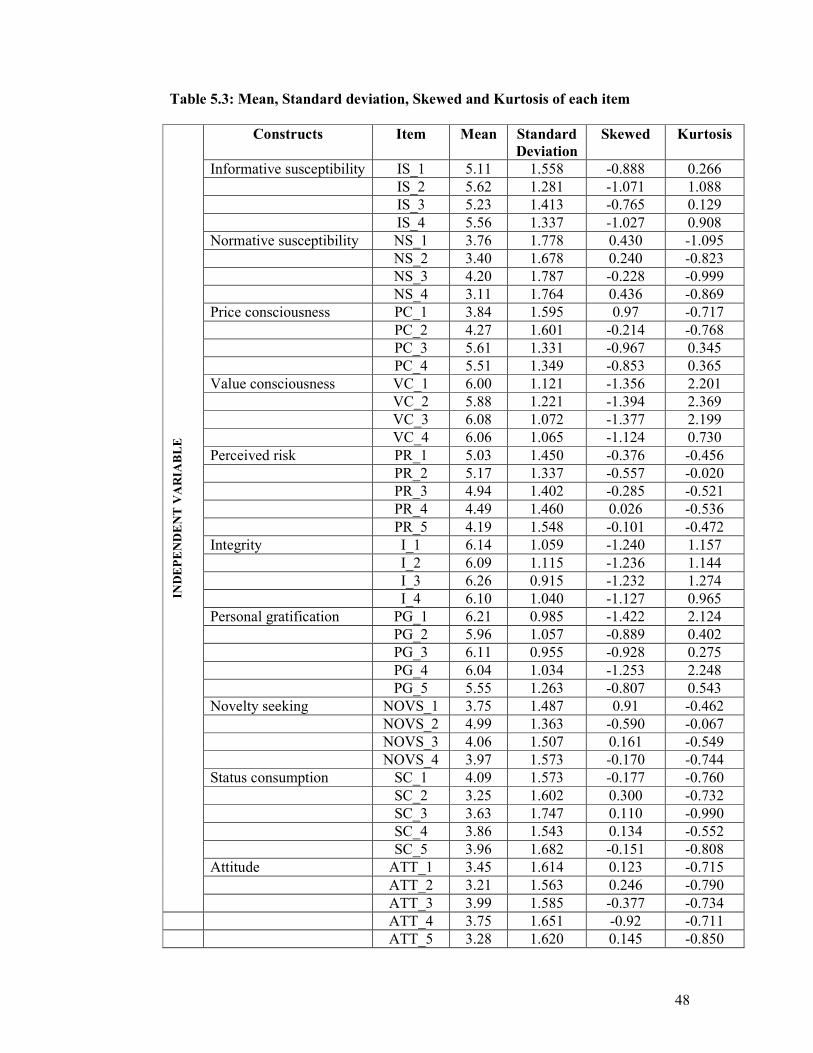
48
Table 5.3: Mean, Standard deviation, Skewed and Kurtosis of each item
Constructs Item Mean Standard
Deviation
Skewed
Kurtosis
Informative susceptibility IS_1 5.11 1.558 -0.888 0.266
IS_2 5.62 1.281 -1.071 1.088
IS_3 5.23 1.413 -0.765 0.129
IS_4 5.56 1.337 -1.027 0.908
Normative susceptibility NS_1 3.76 1.778 0.430 -1.095
NS_2 3.40 1.678 0.240 -0.823
NS_3 4.20 1.787 -0.228 -0.999
NS_4 3.11 1.764 0.436 -0.869
Price consciousness PC_1 3.84 1.595 0.97 -0.717
PC_2 4.27 1.601 -0.214 -0.768
PC_3 5.61 1.331 -0.967 0.345
PC_4 5.51 1.349 -0.853 0.365
Value consciousness VC_1 6.00 1.121 -1.356 2.201
VC_2 5.88 1.221 -1.394 2.369
VC_3 6.08 1.072 -1.377 2.199
VC_4 6.06 1.065 -1.124 0.730
Perceived risk PR_1 5.03 1.450 -0.376 -0.456
PR_2 5.17 1.337 -0.557 -0.020
PR_3 4.94 1.402 -0.285 -0.521
PR_4 4.49 1.460 0.026 -0.536
PR_5 4.19 1.548 -0.101 -0.472
Integrity I_1 6.14 1.059 -1.240 1.157
I_2 6.09 1.115 -1.236 1.144
I_3 6.26 0.915 -1.232 1.274
I_4 6.10 1.040 -1.127 0.965
Personal gratification PG_1 6.21 0.985 -1.422 2.124
PG_2 5.96 1.057 -0.889 0.402
PG_3 6.11 0.955 -0.928 0.275
PG_4 6.04 1.034 -1.253 2.248
PG_5 5.55 1.263 -0.807 0.543
Novelty seeking NOVS_1 3.75 1.487 0.91 -0.462
NOVS_2 4.99 1.363 -0.590 -0.067
NOVS_3 4.06 1.507 0.161 -0.549
NOVS_4 3.97 1.573 -0.170 -0.744
Status consumption SC_1 4.09 1.573 -0.177 -0.760
SC_2 3.25 1.602 0.300 -0.732
SC_3 3.63 1.747 0.110 -0.990
SC_4 3.86 1.543 0.134 -0.552
SC_5 3.96 1.682 -0.151 -0.808
Attitude ATT_1 3.45 1.614 0.123 -0.715
ATT_2 3.21 1.563 0.246 -0.790
INDEPENDENT VARIA
BLE
ATT_3 3.99 1.585 -0.377 -0.734
ATT_4 3.75 1.651 -0.92 -0.711
ATT_5 3.28 1.620 0.145 -0.850
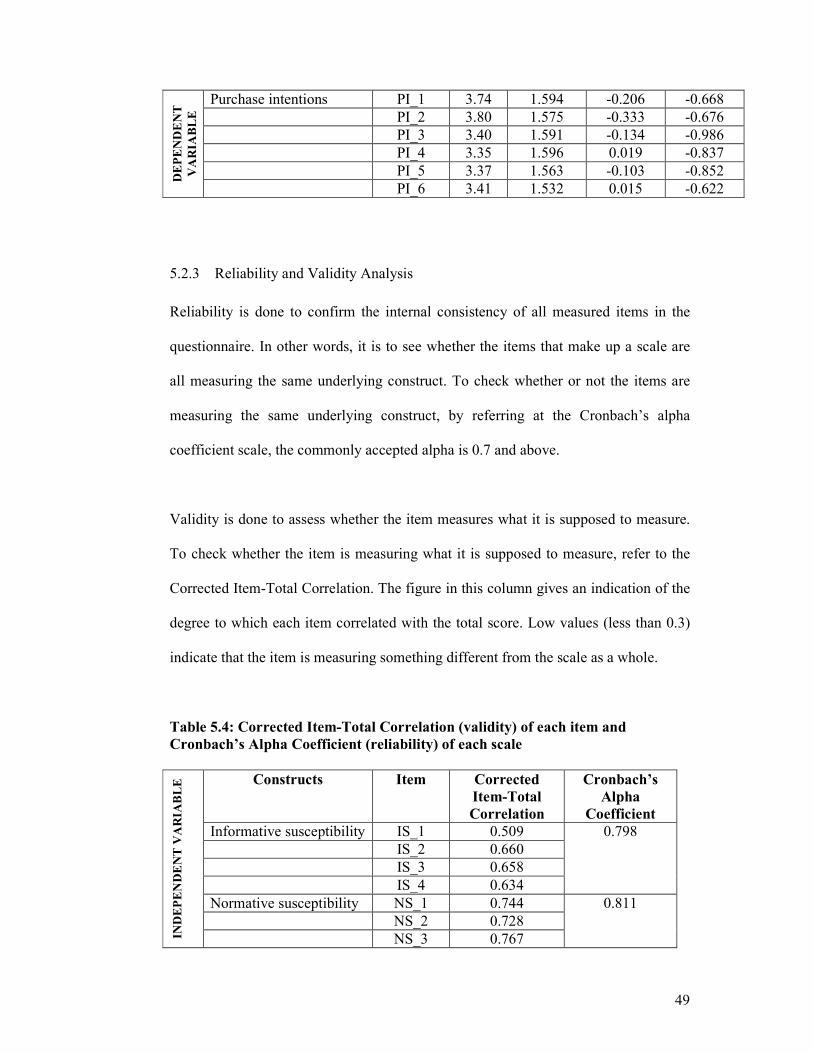
49
Purchase intentions PI_1 3.74 1.594 -0.206 -0.668
PI_2 3.80 1.575 -0.333 -0.676
PI_3 3.40 1.591 -0.134 -0.986
PI_4 3.35 1.596 0.019 -0.837
PI_5 3.37 1.563 -0.103 -0.852 DEPENDENT
VARIA
BLE
PI_6 3.41 1.532 0.015 -0.622
5.2.3 Reliability and Validity Analysis
Reliability is done to confirm the internal consistency of all measured items in the
questionnaire. In other words, it is to see whether the items that make up a scale are
all measuring the same underlying construct. To check whether or not the items are
measuring the same underlying construct, by referring at the Cronbach’s alpha
coefficient scale, the commonly accepted alpha is 0.7 and above.
Validity is done to assess whether the item measures what it is supposed to measure.
To check whether the item is measuring what it is supposed to measure, refer to the
Corrected Item-Total Correlation. The figure in this column gives an indication of the
degree to which each item correlated with the total score. Low values (less than 0.3)
indicate that the item is measuring something different from the scale as a whole.
Table 5.4: Corrected Item-Total Correlation (validity) of each item and
Cronbach’s Alpha Coefficient (reliability) of each scale
Constructs Item Corrected
Item-Total
Correlation
Cronbach’s
Alpha
Coefficient
Informative susceptibility IS_1 0.509
IS_2 0.660
IS_3 0.658
IS_4 0.634
0.798
Normative susceptibility NS_1 0.744
NS_2 0.728
INDEPENDENT VARIA
BLE
NS_3 0.767
0.811
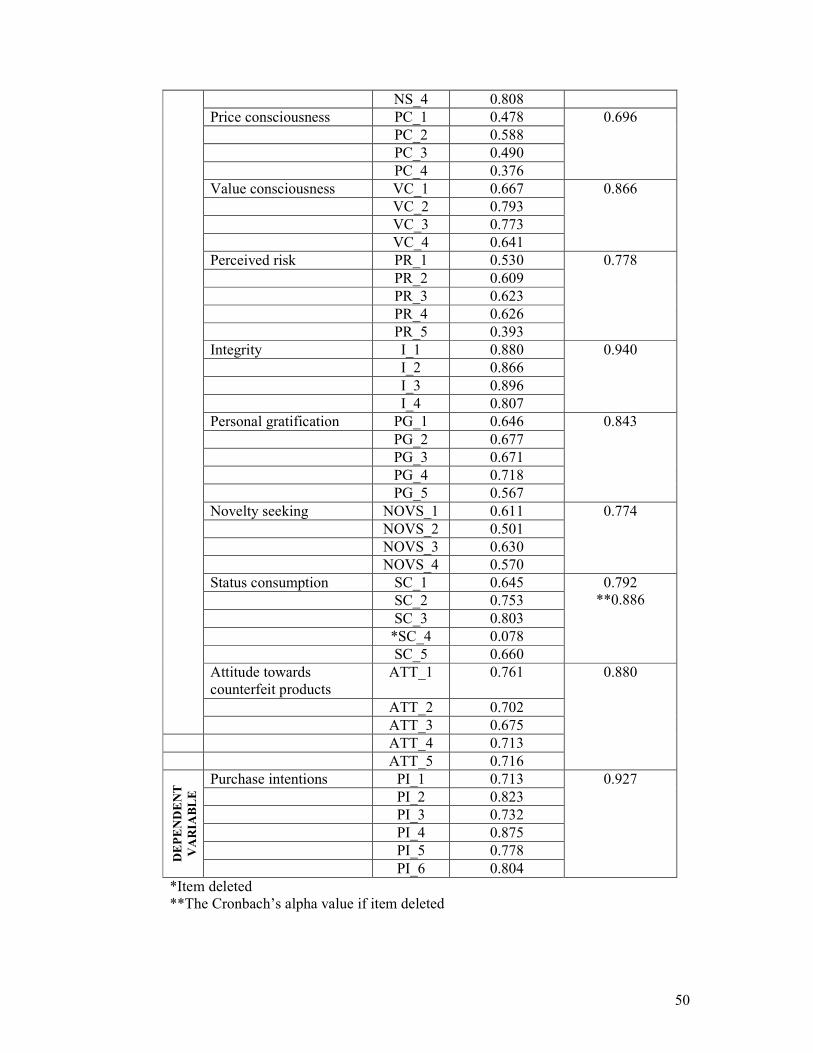
50
NS_4 0.808
Price consciousness PC_1 0.478
PC_2 0.588
PC_3 0.490
PC_4 0.376
0.696
Value consciousness VC_1 0.667
VC_2 0.793
VC_3 0.773
VC_4 0.641
0.866
Perceived risk PR_1 0.530
PR_2 0.609
PR_3 0.623
PR_4 0.626
PR_5 0.393
0.778
Integrity I_1 0.880
I_2 0.866
I_3 0.896
I_4 0.807
0.940
Personal gratification PG_1 0.646
PG_2 0.677
PG_3 0.671
PG_4 0.718
PG_5 0.567
0.843
Novelty seeking NOVS_1 0.611
NOVS_2 0.501
NOVS_3 0.630
NOVS_4 0.570
0.774
Status consumption SC_1 0.645
SC_2 0.753
SC_3 0.803
*SC_4 0.078
SC_5 0.660
0.792 **0.886
Attitude towards counterfeit products
ATT_1 0.761
ATT_2 0.702
ATT_3 0.675
ATT_4 0.713
ATT_5 0.716
0.880
Purchase intentions PI_1 0.713
PI_2 0.823
PI_3 0.732
PI_4 0.875
PI_5 0.778
DEPENDENT
VARIA
BLE
PI_6 0.804
0.927
*Item deleted **The Cronbach’s alpha value if item deleted
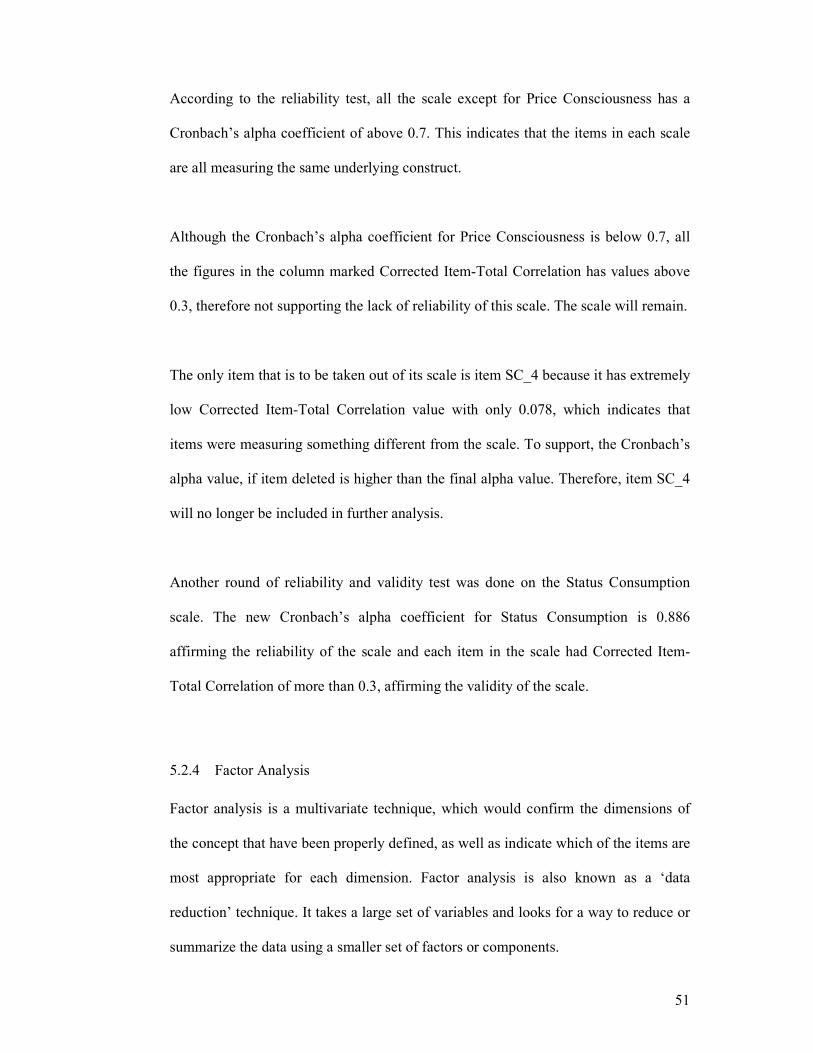
51
According to the reliability test, all the scale except for Price Consciousness has a
Cronbach’s alpha coefficient of above 0.7. This indicates that the items in each scale
are all measuring the same underlying construct.
Although the Cronbach’s alpha coefficient for Price Consciousness is below 0.7, all
the figures in the column marked Corrected Item-Total Correlation has values above
0.3, therefore not supporting the lack of reliability of this scale. The scale will remain.
The only item that is to be taken out of its scale is item SC_4 because it has extremely
low Corrected Item-Total Correlation value with only 0.078, which indicates that
items were measuring something different from the scale. To support, the Cronbach’s
alpha value, if item deleted is higher than the final alpha value. Therefore, item SC_4
will no longer be included in further analysis.
Another round of reliability and validity test was done on the Status Consumption
scale. The new Cronbach’s alpha coefficient for Status Consumption is 0.886
affirming the reliability of the scale and each item in the scale had Corrected Item-
Total Correlation of more than 0.3, affirming the validity of the scale.
5.2.4 Factor Analysis
Factor analysis is a multivariate technique, which would confirm the dimensions of
the concept that have been properly defined, as well as indicate which of the items are
most appropriate for each dimension. Factor analysis is also known as a ‘data
reduction’ technique. It takes a large set of variables and looks for a way to reduce or
summarize the data using a smaller set of factors or components.
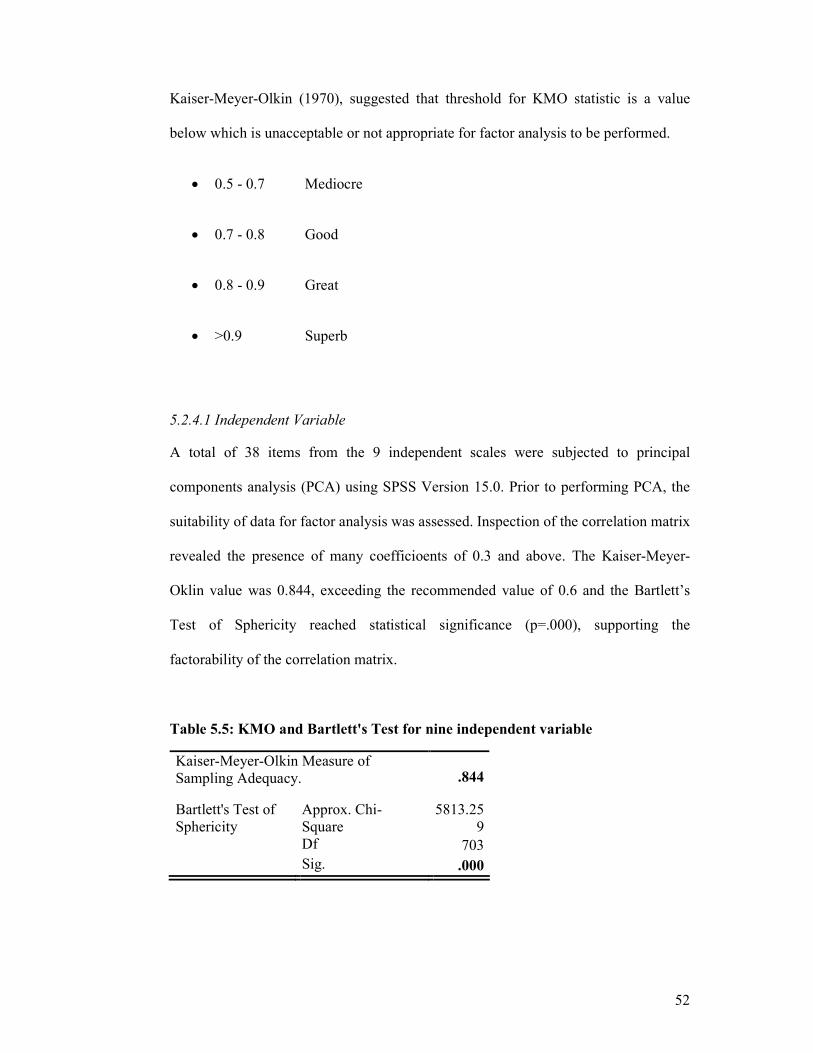
52
Kaiser-Meyer-Olkin (1970), suggested that threshold for KMO statistic is a value
below which is unacceptable or not appropriate for factor analysis to be performed.
• 0.5 - 0.7 Mediocre
• 0.7 - 0.8 Good
• 0.8 - 0.9 Great
• >0.9 Superb
5.2.4.1 Independent Variable
A total of 38 items from the 9 independent scales were subjected to principal
components analysis (PCA) using SPSS Version 15.0. Prior to performing PCA, the
suitability of data for factor analysis was assessed. Inspection of the correlation matrix
revealed the presence of many coefficioents of 0.3 and above. The Kaiser-Meyer-
Oklin value was 0.844, exceeding the recommended value of 0.6 and the Bartlett’s
Test of Sphericity reached statistical significance (p=.000), supporting the
factorability of the correlation matrix.
Table 5.5: KMO and Bartlett's Test for nine independent variable
Kaiser-Meyer-Olkin Measure of Sampling Adequacy. .844
Bartlett's Test of Sphericity
Approx. Chi-Square
5813.259
Df 703
Sig. .000
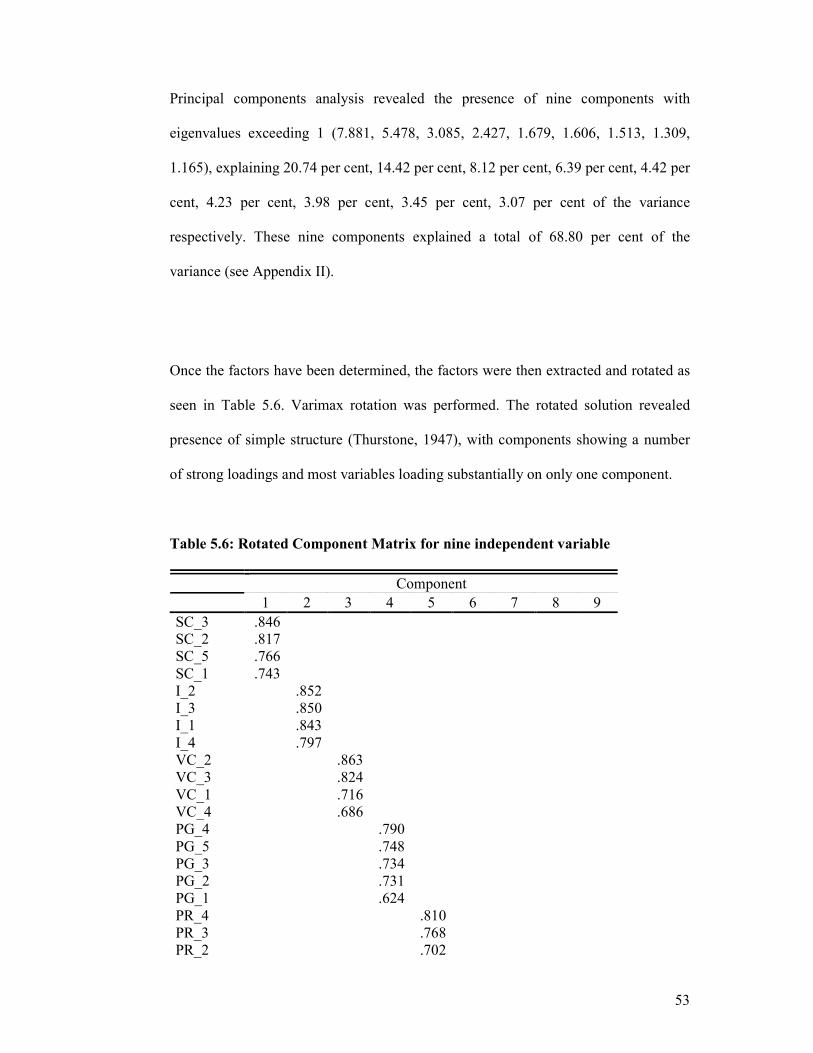
53
Principal components analysis revealed the presence of nine components with
eigenvalues exceeding 1 (7.881, 5.478, 3.085, 2.427, 1.679, 1.606, 1.513, 1.309,
1.165), explaining 20.74 per cent, 14.42 per cent, 8.12 per cent, 6.39 per cent, 4.42 per
cent, 4.23 per cent, 3.98 per cent, 3.45 per cent, 3.07 per cent of the variance
respectively. These nine components explained a total of 68.80 per cent of the
variance (see Appendix II).
Once the factors have been determined, the factors were then extracted and rotated as
seen in Table 5.6. Varimax rotation was performed. The rotated solution revealed
presence of simple structure (Thurstone, 1947), with components showing a number
of strong loadings and most variables loading substantially on only one component.
Table 5.6: Rotated Component Matrix for nine independent variable
Component
1 2 3 4 5 6 7 8 9
SC_3 .846 SC_2 .817 SC_5 .766 SC_1 .743 I_2 .852 I_3 .850 I_1 .843 I_4 .797 VC_2 .863 VC_3 .824 VC_1 .716 VC_4 .686 PG_4 .790 PG_5 .748 PG_3 .734 PG_2 .731 PG_1 .624 PR_4 .810 PR_3 .768 PR_2 .702
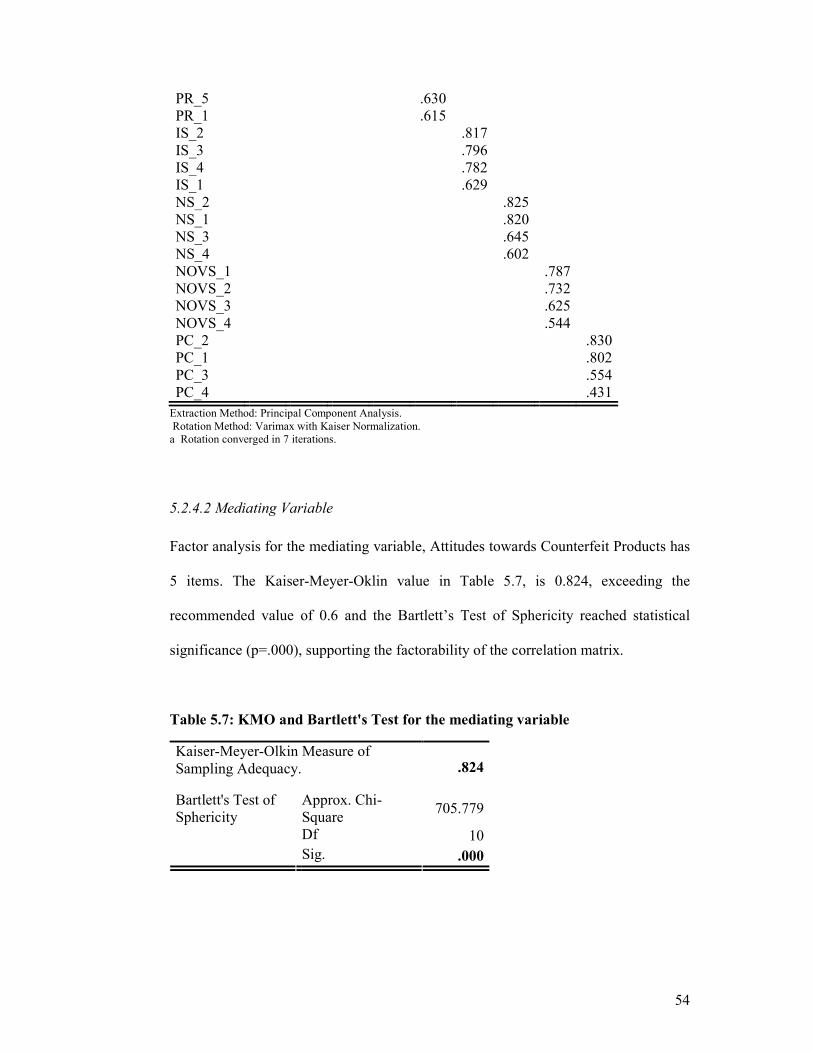
54
PR_5 .630 PR_1 .615 IS_2 .817 IS_3 .796 IS_4 .782 IS_1 .629 NS_2 .825 NS_1 .820 NS_3 .645 NS_4 .602 NOVS_1 .787 NOVS_2 .732 NOVS_3 .625 NOVS_4 .544 PC_2 .830 PC_1 .802 PC_3 .554 PC_4 .431
Extraction Method: Principal Component Analysis. Rotation Method: Varimax with Kaiser Normalization. a Rotation converged in 7 iterations.
5.2.4.2 Mediating Variable
Factor analysis for the mediating variable, Attitudes towards Counterfeit Products has
5 items. The Kaiser-Meyer-Oklin value in Table 5.7, is 0.824, exceeding the
recommended value of 0.6 and the Bartlett’s Test of Sphericity reached statistical
significance (p=.000), supporting the factorability of the correlation matrix.
Table 5.7: KMO and Bartlett's Test for the mediating variable
Kaiser-Meyer-Olkin Measure of Sampling Adequacy. .824
Approx. Chi-Square
705.779
Df 10
Bartlett's Test of Sphericity
Sig. .000
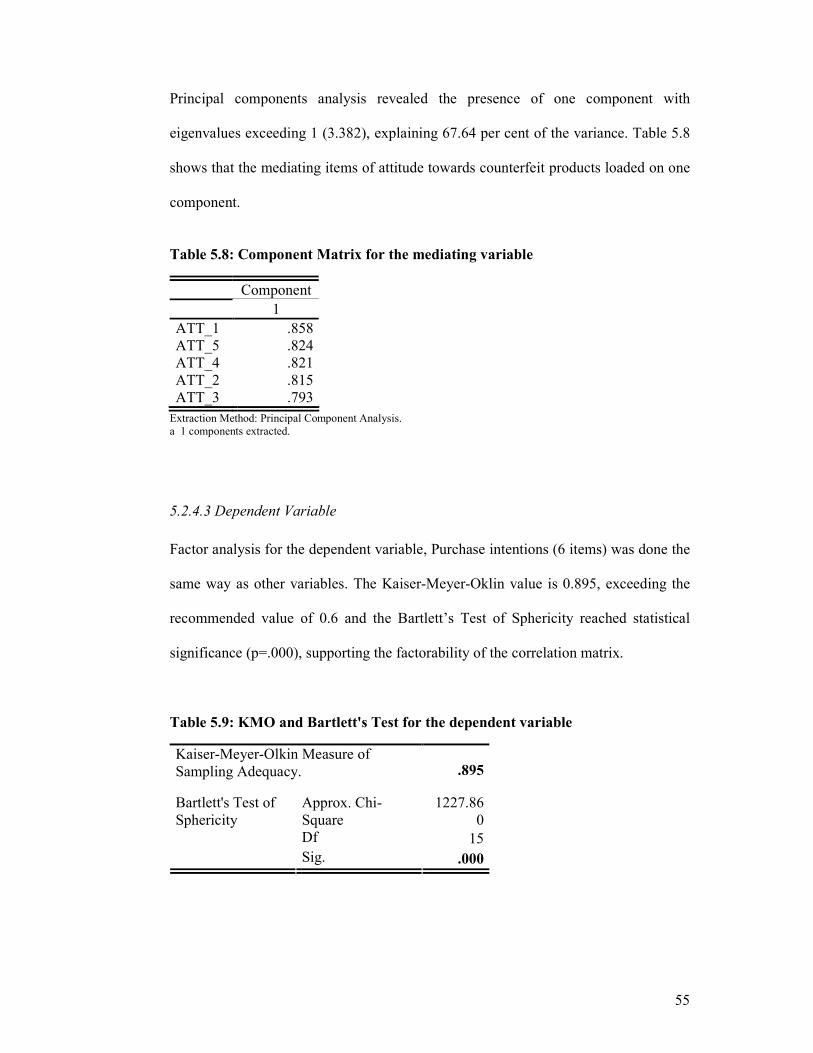
55
Principal components analysis revealed the presence of one component with
eigenvalues exceeding 1 (3.382), explaining 67.64 per cent of the variance. Table 5.8
shows that the mediating items of attitude towards counterfeit products loaded on one
component.
Table 5.8: Component Matrix for the mediating variable
Component
1
ATT_1 .858 ATT_5 .824 ATT_4 .821 ATT_2 .815 ATT_3 .793
Extraction Method: Principal Component Analysis. a 1 components extracted.
5.2.4.3 Dependent Variable
Factor analysis for the dependent variable, Purchase intentions (6 items) was done the
same way as other variables. The Kaiser-Meyer-Oklin value is 0.895, exceeding the
recommended value of 0.6 and the Bartlett’s Test of Sphericity reached statistical
significance (p=.000), supporting the factorability of the correlation matrix.
Table 5.9: KMO and Bartlett's Test for the dependent variable
Kaiser-Meyer-Olkin Measure of Sampling Adequacy. .895
Approx. Chi-Square
1227.860
Df 15
Bartlett's Test of Sphericity
Sig. .000
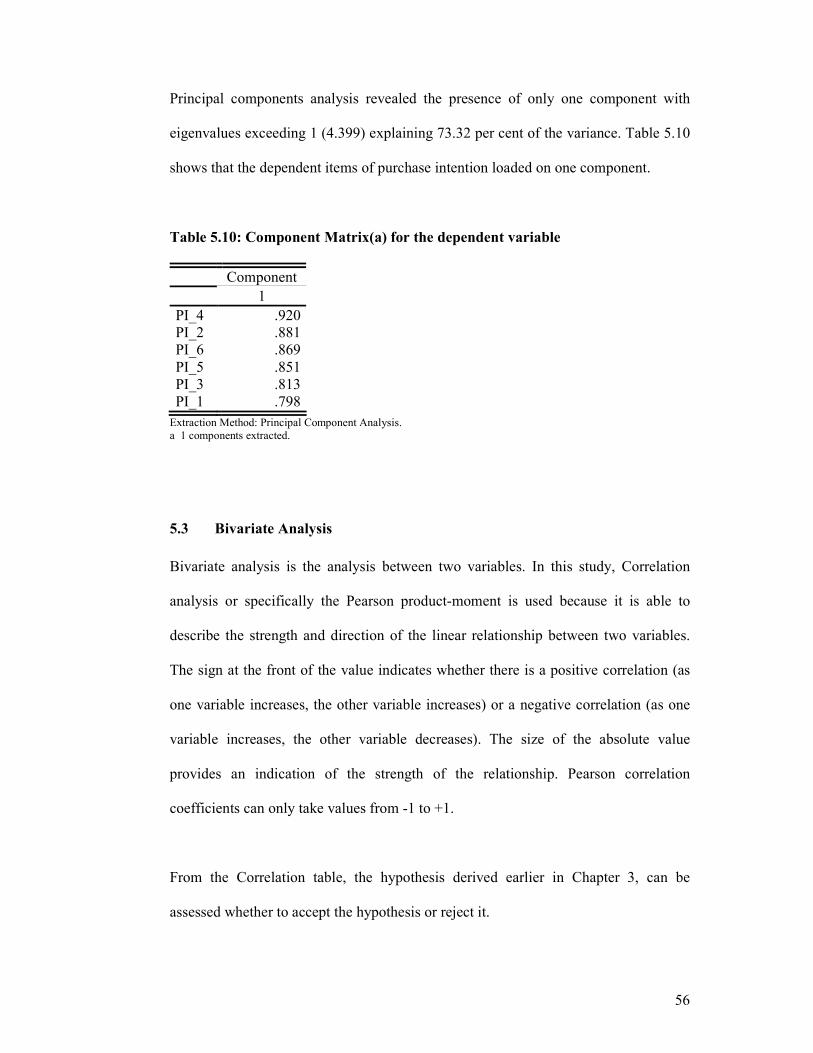
56
Principal components analysis revealed the presence of only one component with
eigenvalues exceeding 1 (4.399) explaining 73.32 per cent of the variance. Table 5.10
shows that the dependent items of purchase intention loaded on one component.
Table 5.10: Component Matrix(a) for the dependent variable
Component
1
PI_4 .920 PI_2 .881 PI_6 .869 PI_5 .851 PI_3 .813 PI_1 .798
Extraction Method: Principal Component Analysis. a 1 components extracted.
5.3 Bivariate Analysis
Bivariate analysis is the analysis between two variables. In this study, Correlation
analysis or specifically the Pearson product-moment is used because it is able to
describe the strength and direction of the linear relationship between two variables.
The sign at the front of the value indicates whether there is a positive correlation (as
one variable increases, the other variable increases) or a negative correlation (as one
variable increases, the other variable decreases). The size of the absolute value
provides an indication of the strength of the relationship. Pearson correlation
coefficients can only take values from -1 to +1.
From the Correlation table, the hypothesis derived earlier in Chapter 3, can be
assessed whether to accept the hypothesis or reject it.
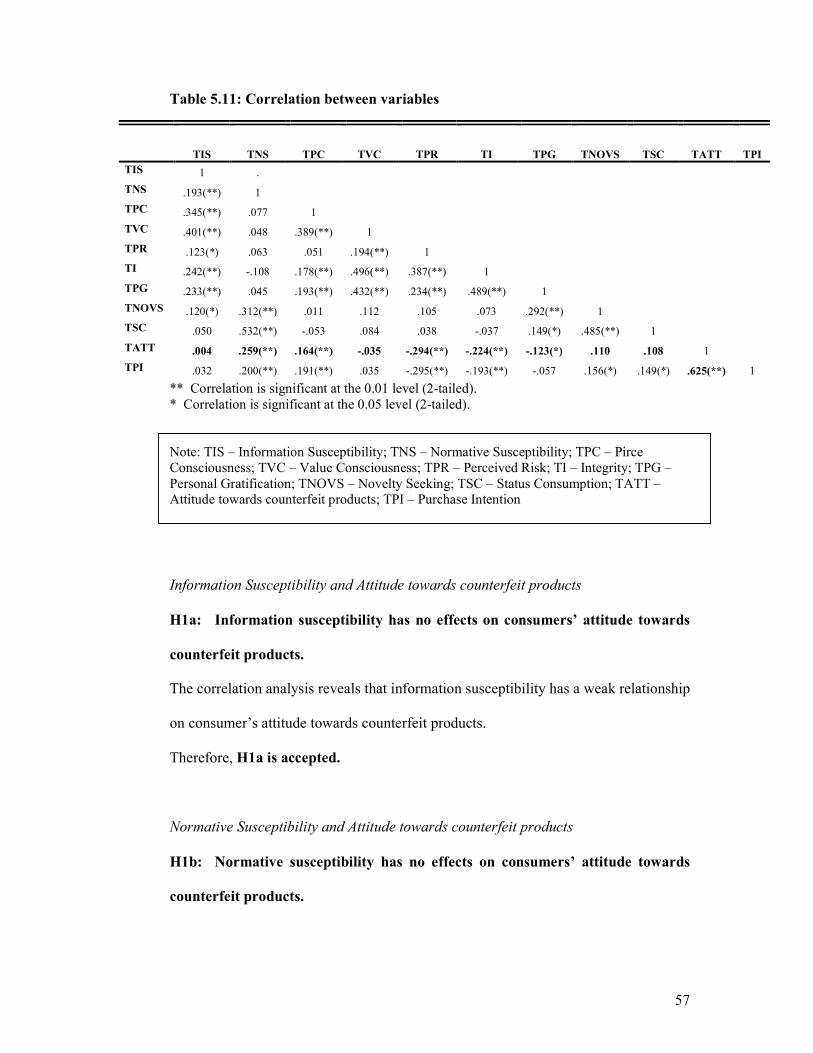
57
Table 5.11: Correlation between variables
TIS TNS TPC TVC TPR TI TPG TNOVS TSC TATT TPI
TIS 1 .
TNS .193(**) 1
TPC .345(**) .077 1
TVC .401(**) .048 .389(**) 1
TPR .123(*) .063 .051 .194(**) 1
TI .242(**) -.108 .178(**) .496(**) .387(**) 1
TPG .233(**) .045 .193(**) .432(**) .234(**) .489(**) 1
TNOVS .120(*) .312(**) .011 .112 .105 .073 .292(**) 1
TSC .050 .532(**) -.053 .084 .038 -.037 .149(*) .485(**) 1
TATT .004 .259(**) .164(**) -.035 -.294(**) -.224(**) -.123(*) .110 .108 1
TPI .032 .200(**) .191(**) .035 -.295(**) -.193(**) -.057 .156(*) .149(*) .625(**) 1
** Correlation is significant at the 0.01 level (2-tailed). * Correlation is significant at the 0.05 level (2-tailed). Note: TIS – Information Susceptibility; TNS – Normative Susceptibility; TPC – Pirce Consciousness; TVC – Value Consciousness; TPR – Perceived Risk; TI – Integrity; TPG – Personal Gratification; TNOVS – Novelty Seeking; TSC – Status Consumption; TATT – Attitude towards counterfeit products; TPI – Purchase Intention
Information Susceptibility and Attitude towards counterfeit products
H1a: Information susceptibility has no effects on consumers’ attitude towards
counterfeit products.
The correlation analysis reveals that information susceptibility has a weak relationship
on consumer’s attitude towards counterfeit products.
Therefore, H1a is accepted.
Normative Susceptibility and Attitude towards counterfeit products
H1b: Normative susceptibility has no effects on consumers’ attitude towards
counterfeit products.
58
The correlation analysis reveals that normative susceptibility has a significant positive
relationship on consumer’s attitude towards counterfeit products.
Therefore, H1b is rejected.
Price Consciousness and Attitude towards counterfeit products
H2a: Price consciousness has no effects on consumers’ attitude towards
counterfeit products.
The correlation analysis reveals that price consciousness has a significant positive
relationship on consumer’s attitude towards counterfeit products.
Therefore, H2a is rejected.
Value Consciousness and Attitude towards counterfeit products
H2b: Value consciousness has no effects on consumers’ attitude towards
counterfeit products.
The correlation analysis reveals that value consciousness has a weak relationship on
consumer’s attitude towards counterfeit products.
Therefore, H2b is accepted.
Perceived Risk and Attitude towards counterfeit products
H2c: Perceived risk has no effects on consumers’ attitude towards counterfeit
products.
The correlation analysis reveals that perceived risk has a significant negative
relationship on consumer’s attitude towards counterfeit products.
Therefore, H2c is rejected.
59
Integrity and Attitude towards counterfeit products
H2d: Integrity has no effects on consumers’ attitude towards counterfeit
products.
The correlation analysis reveals that integrity has a significant negative relationship
on consumer’s attitude towards counterfeit products.
Therefore, H2d is rejected.
Personal Gratification and Attitude towards counterfeit products
H2e: Personal gratification has no effects on consumers’ attitude towards
counterfeit products.
The correlation analysis reveals that personal gratification has a significant negative
relationship on consumer’s attitude towards counterfeit products.
Therefore, H2e is rejected.
Novelty Seeking and Attitude towards counterfeit products
H2f: Novelty seeking has no effects on consumers’ attitude towards counterfeit
products.
The correlation analysis reveals that novelty seeking has a weak relationship on
consumer’s attitude towards counterfeit products.
Therefore, H2f is accepted.
Status Consumption and Attitude towards counterfeit products
H2g: Status consumption has no effects on consumers’ attitude towards
counterfeit products.
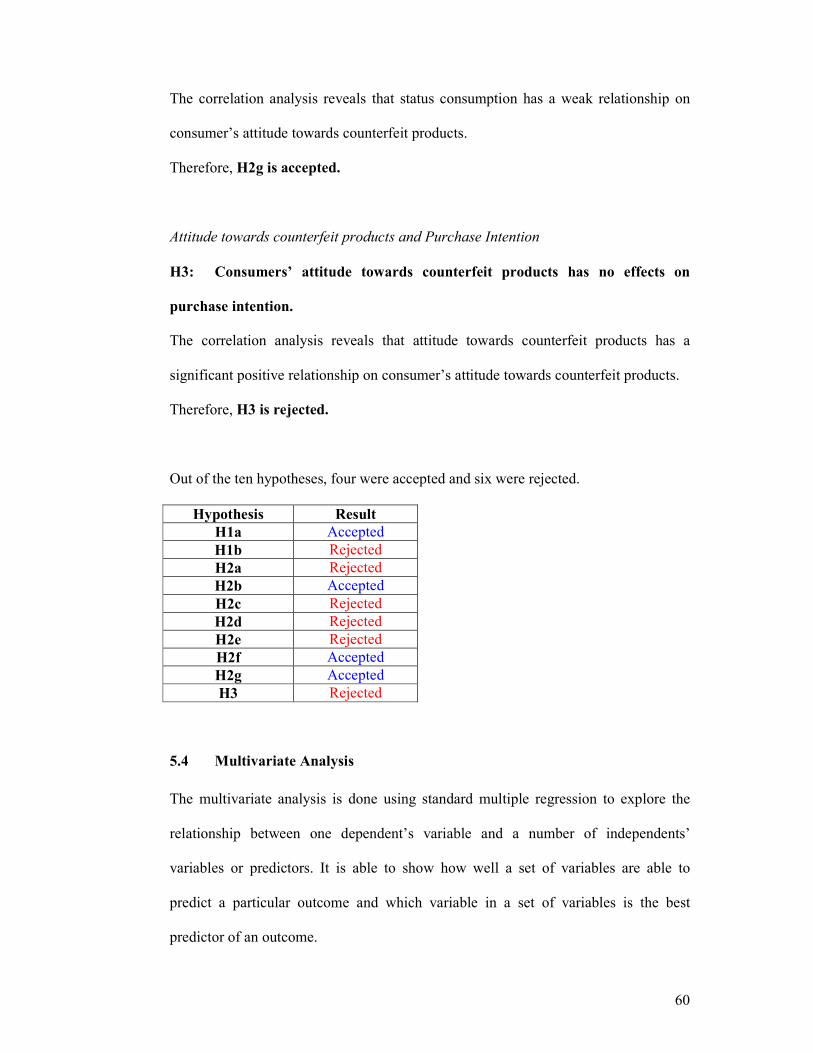
60
The correlation analysis reveals that status consumption has a weak relationship on
consumer’s attitude towards counterfeit products.
Therefore, H2g is accepted.
Attitude towards counterfeit products and Purchase Intention
H3: Consumers’ attitude towards counterfeit products has no effects on
purchase intention.
The correlation analysis reveals that attitude towards counterfeit products has a
significant positive relationship on consumer’s attitude towards counterfeit products.
Therefore, H3 is rejected.
Out of the ten hypotheses, four were accepted and six were rejected.
Hypothesis Result
H1a Accepted
H1b Rejected
H2a Rejected
H2b Accepted
H2c Rejected
H2d Rejected
H2e Rejected
H2f Accepted
H2g Accepted
H3 Rejected
5.4 Multivariate Analysis
The multivariate analysis is done using standard multiple regression to explore the
relationship between one dependent’s variable and a number of independents’
variables or predictors. It is able to show how well a set of variables are able to
predict a particular outcome and which variable in a set of variables is the best
predictor of an outcome.
61
In this study, multiple regressions are used to test on the nine independent variables
(information susceptibility, normative susceptibility, price consciousness, value
consciousness, perceived risk, integrity, personal gratification, novelty seeking, and
status consumption) in relation with the consumers’ attitude towards counterfeit
products. It is expected that the multiple regressions will provide information about
the model as a whole and the relative contribution of each variables that make up the
model.
5.4.1 Assumptions Test
Prior to performing the multiple regression tests, a few assumption tests by
Tabachnick and Fidell (2001) have to be done, namely:
• Multicollinearity
• Normality
• Outliers
• Linearity
• Homoscedasticity
• Independence of Residuals.
One way of checking the multicollinearity is by looking at the correlations table.
Multicollinearity exists when the independent variables are highly correlated (r=0.9
and above). The independent variables in the Correlation table (refer to Appendix C),
show some relationship with the independent variable by having values above 0.3 and
none is above 0.9. This indicates that the variables are not multicollinearity.
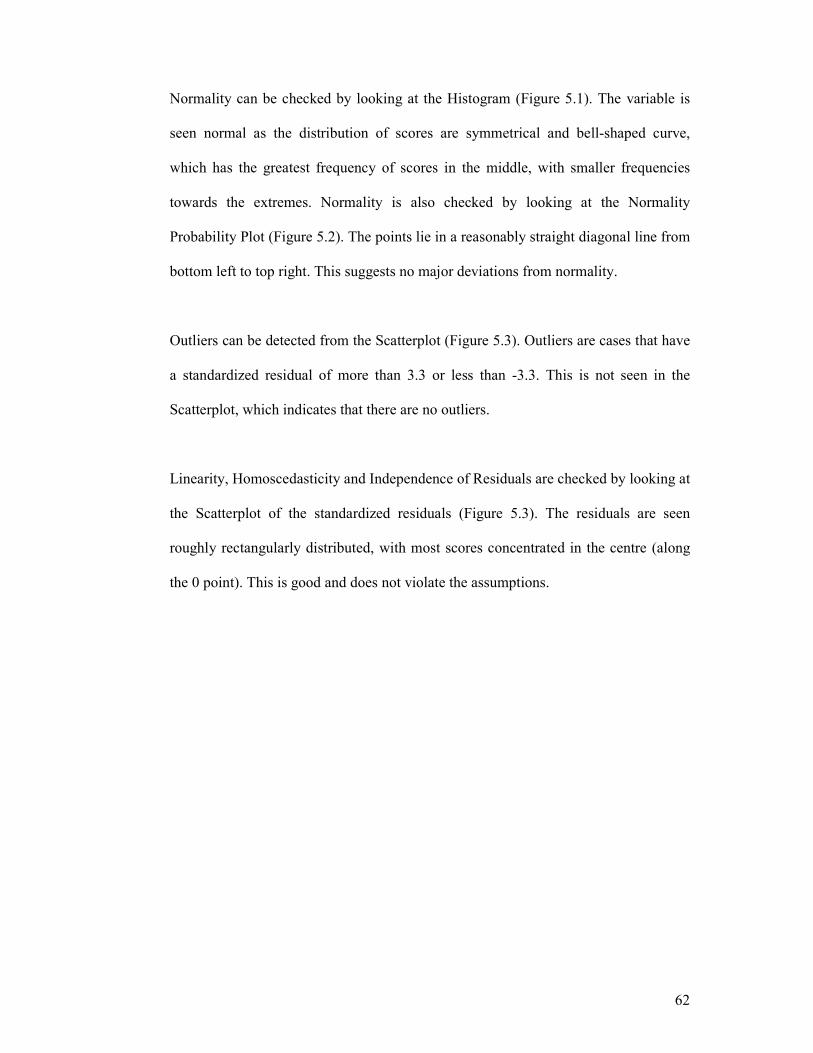
62
Normality can be checked by looking at the Histogram (Figure 5.1). The variable is
seen normal as the distribution of scores are symmetrical and bell-shaped curve,
which has the greatest frequency of scores in the middle, with smaller frequencies
towards the extremes. Normality is also checked by looking at the Normality
Probability Plot (Figure 5.2). The points lie in a reasonably straight diagonal line from
bottom left to top right. This suggests no major deviations from normality.
Outliers can be detected from the Scatterplot (Figure 5.3). Outliers are cases that have
a standardized residual of more than 3.3 or less than -3.3. This is not seen in the
Scatterplot, which indicates that there are no outliers.
Linearity, Homoscedasticity and Independence of Residuals are checked by looking at
the Scatterplot of the standardized residuals (Figure 5.3). The residuals are seen
roughly rectangularly distributed, with most scores concentrated in the centre (along
the 0 point). This is good and does not violate the assumptions.
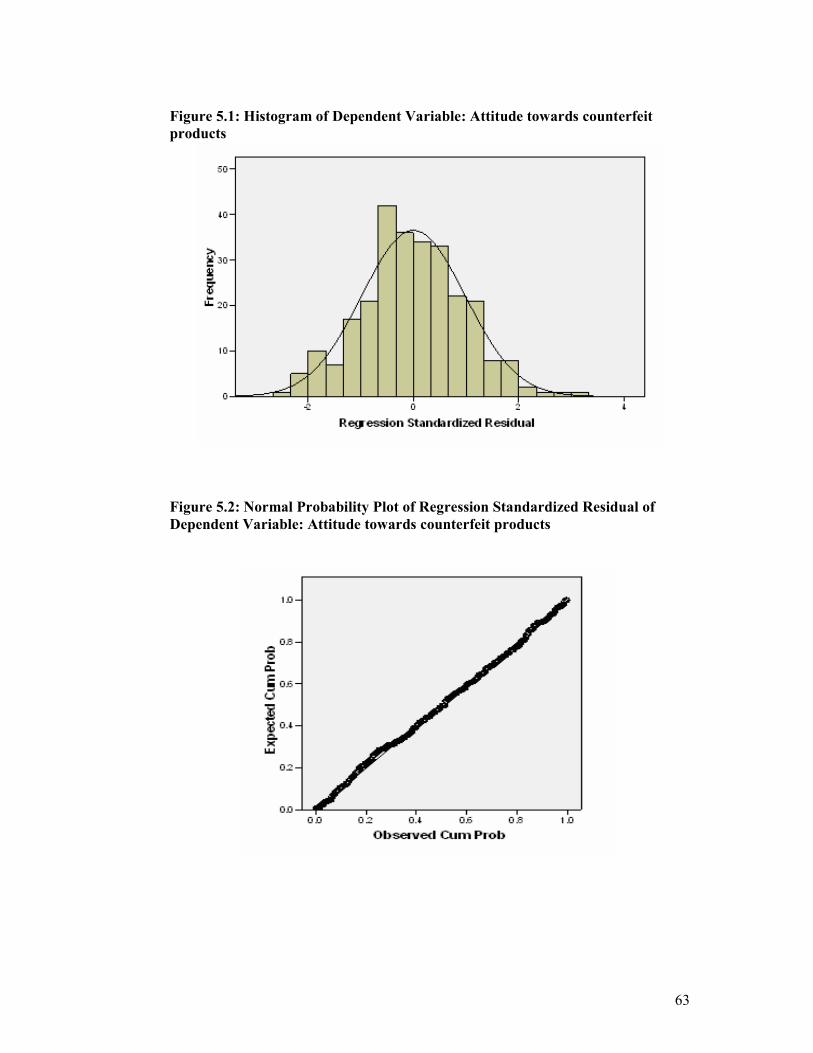
63
Figure 5.1: Histogram of Dependent Variable: Attitude towards counterfeit
products
Figure 5.2: Normal Probability Plot of Regression Standardized Residual of
Dependent Variable: Attitude towards counterfeit products
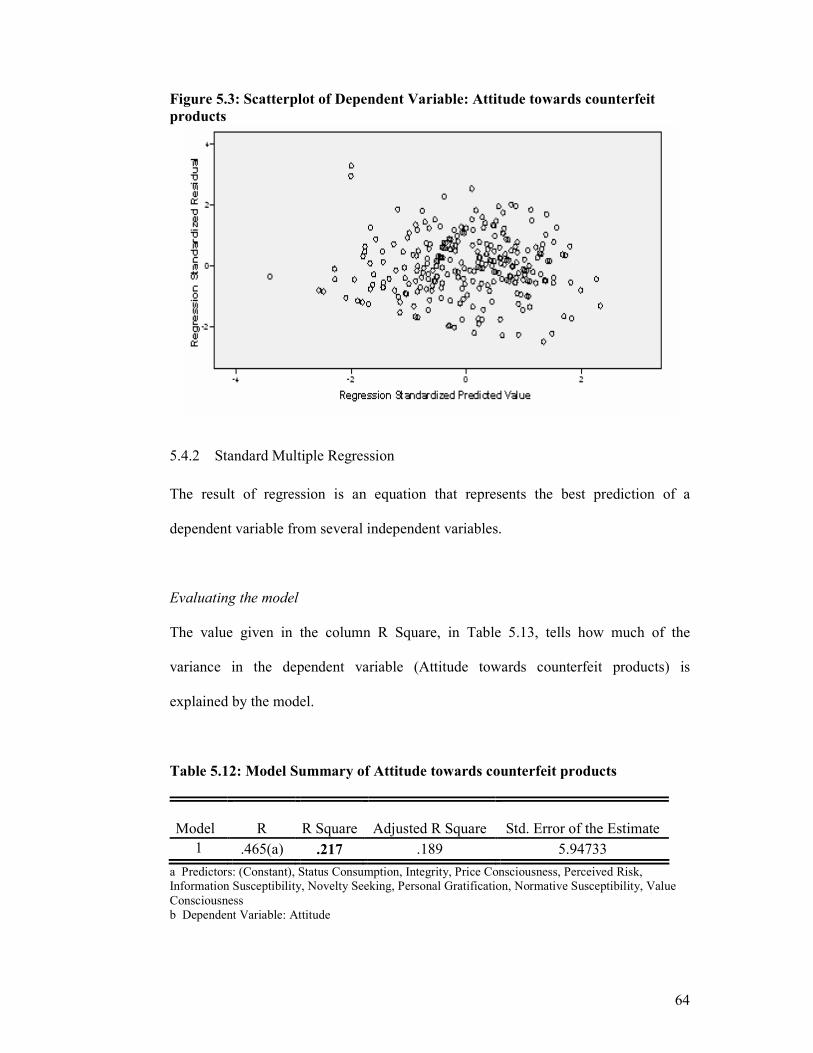
64
Figure 5.3: Scatterplot of Dependent Variable: Attitude towards counterfeit
products
5.4.2 Standard Multiple Regression
The result of regression is an equation that represents the best prediction of a
dependent variable from several independent variables.
Evaluating the model
The value given in the column R Square, in Table 5.13, tells how much of the
variance in the dependent variable (Attitude towards counterfeit products) is
explained by the model.
Table 5.12: Model Summary of Attitude towards counterfeit products
Model R R Square Adjusted R Square Std. Error of the Estimate
1 .465(a) .217 .189 5.94733
a Predictors: (Constant), Status Consumption, Integrity, Price Consciousness, Perceived Risk, Information Susceptibility, Novelty Seeking, Personal Gratification, Normative Susceptibility, Value Consciousness b Dependent Variable: Attitude
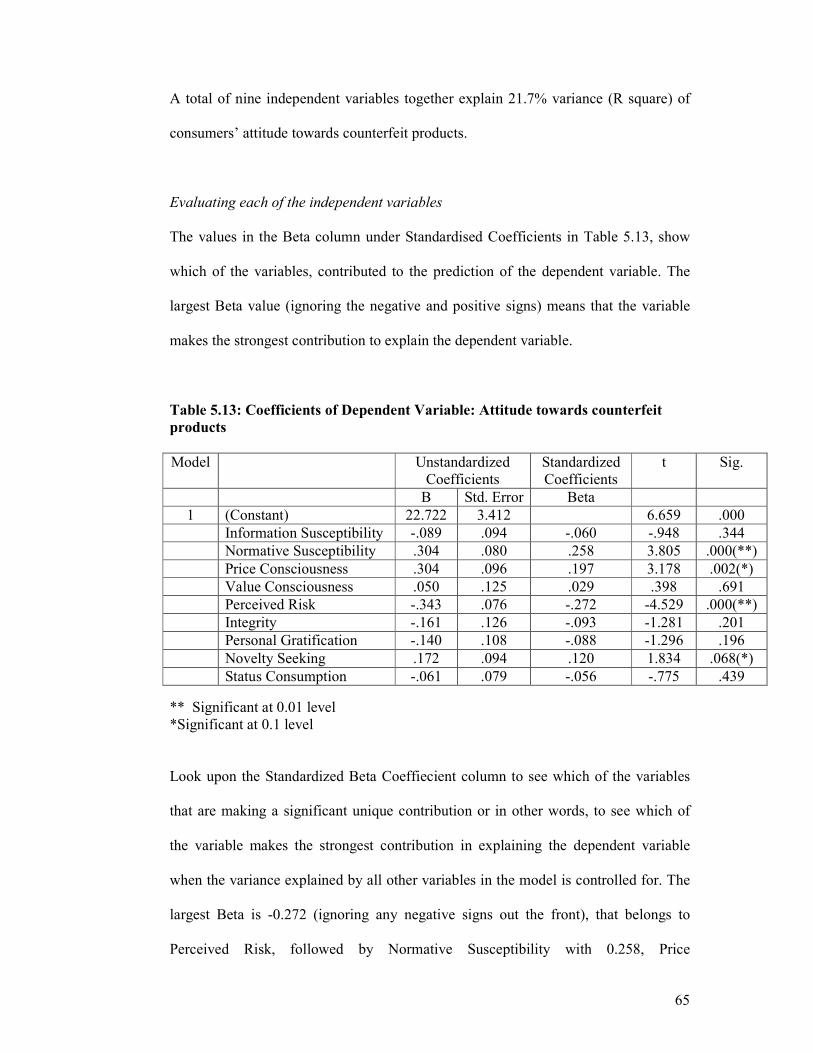
65
A total of nine independent variables together explain 21.7% variance (R square) of
consumers’ attitude towards counterfeit products.
Evaluating each of the independent variables
The values in the Beta column under Standardised Coefficients in Table 5.13, show
which of the variables, contributed to the prediction of the dependent variable. The
largest Beta value (ignoring the negative and positive signs) means that the variable
makes the strongest contribution to explain the dependent variable.
Table 5.13: Coefficients of Dependent Variable: Attitude towards counterfeit
products
Model Unstandardized Coefficients
Standardized Coefficients
t Sig.
B Std. Error Beta
1 (Constant) 22.722 3.412 6.659 .000
Information Susceptibility -.089 .094 -.060 -.948 .344
Normative Susceptibility .304 .080 .258 3.805 .000(**)
Price Consciousness .304 .096 .197 3.178 .002(*)
Value Consciousness .050 .125 .029 .398 .691
Perceived Risk -.343 .076 -.272 -4.529 .000(**)
Integrity -.161 .126 -.093 -1.281 .201
Personal Gratification -.140 .108 -.088 -1.296 .196
Novelty Seeking .172 .094 .120 1.834 .068(*)
Status Consumption -.061 .079 -.056 -.775 .439
** Significant at 0.01 level *Significant at 0.1 level
Look upon the Standardized Beta Coeffiecient column to see which of the variables
that are making a significant unique contribution or in other words, to see which of
the variable makes the strongest contribution in explaining the dependent variable
when the variance explained by all other variables in the model is controlled for. The
largest Beta is -0.272 (ignoring any negative signs out the front), that belongs to
Perceived Risk, followed by Normative Susceptibility with 0.258, Price
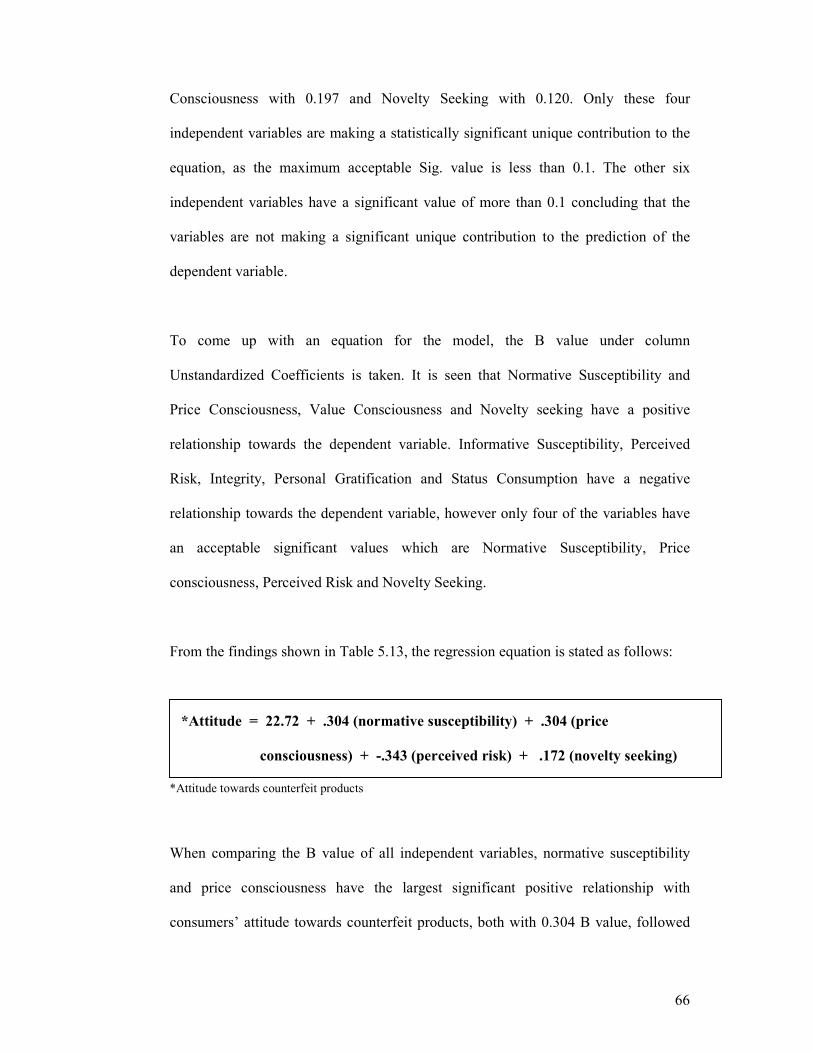
66
Consciousness with 0.197 and Novelty Seeking with 0.120. Only these four
independent variables are making a statistically significant unique contribution to the
equation, as the maximum acceptable Sig. value is less than 0.1. The other six
independent variables have a significant value of more than 0.1 concluding that the
variables are not making a significant unique contribution to the prediction of the
dependent variable.
To come up with an equation for the model, the B value under column
Unstandardized Coefficients is taken. It is seen that Normative Susceptibility and
Price Consciousness, Value Consciousness and Novelty seeking have a positive
relationship towards the dependent variable. Informative Susceptibility, Perceived
Risk, Integrity, Personal Gratification and Status Consumption have a negative
relationship towards the dependent variable, however only four of the variables have
an acceptable significant values which are Normative Susceptibility, Price
consciousness, Perceived Risk and Novelty Seeking.
From the findings shown in Table 5.13, the regression equation is stated as follows:
*Attitude = 22.72 + .304 (normative susceptibility) + .304 (price
consciousness) + -.343 (perceived risk) + .172 (novelty seeking)
*Attitude towards counterfeit products
When comparing the B value of all independent variables, normative susceptibility
and price consciousness have the largest significant positive relationship with
consumers’ attitude towards counterfeit products, both with 0.304 B value, followed
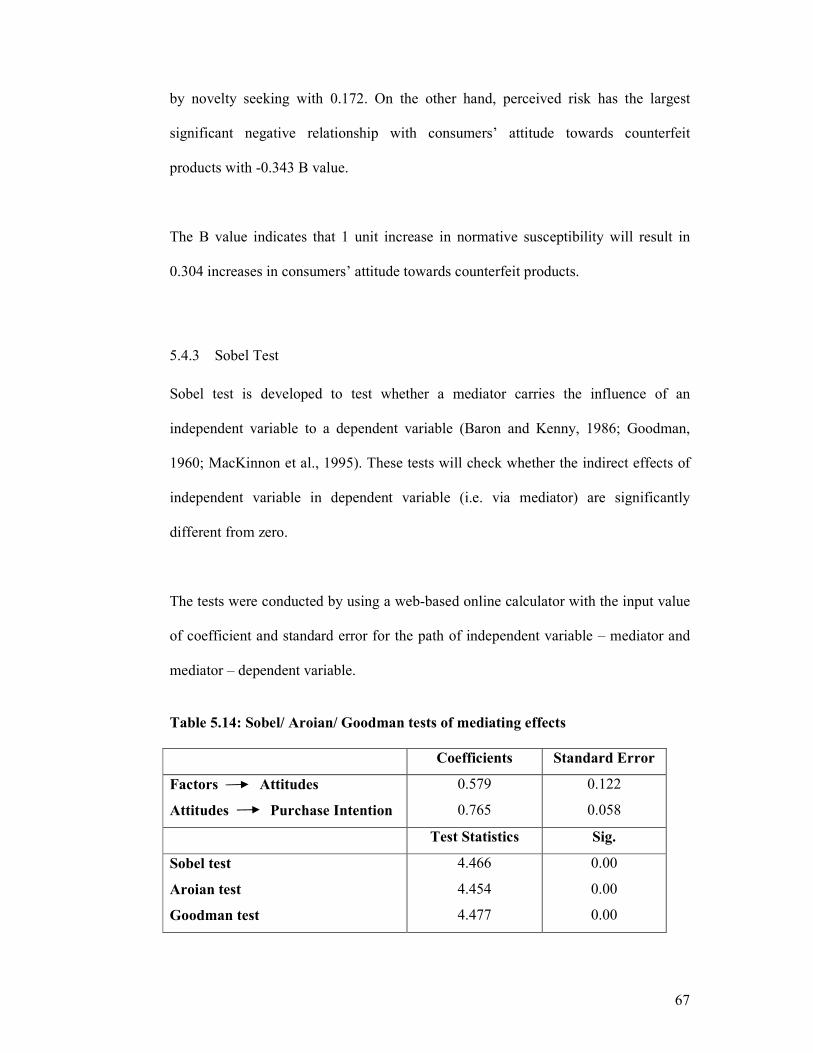
67
by novelty seeking with 0.172. On the other hand, perceived risk has the largest
significant negative relationship with consumers’ attitude towards counterfeit
products with -0.343 B value.
The B value indicates that 1 unit increase in normative susceptibility will result in
0.304 increases in consumers’ attitude towards counterfeit products.
5.4.3 Sobel Test
Sobel test is developed to test whether a mediator carries the influence of an
independent variable to a dependent variable (Baron and Kenny, 1986; Goodman,
1960; MacKinnon et al., 1995). These tests will check whether the indirect effects of
independent variable in dependent variable (i.e. via mediator) are significantly
different from zero.
The tests were conducted by using a web-based online calculator with the input value
of coefficient and standard error for the path of independent variable – mediator and
mediator – dependent variable.
Table 5.14: Sobel/ Aroian/ Goodman tests of mediating effects
Coefficients Standard Error
Factors Attitudes
Attitudes Purchase Intention
0.579
0.765
0.122
0.058
Test Statistics Sig.
Sobel test
Aroian test
Goodman test
4.466
4.454
4.477
0.00
0.00
0.00
68
From Table 5.14, the result shows that consumers’ attitude towards counterfeit
products has significantly affected the relationship between the independent variables
(social and personality factors) and the dependent variable (purchase intention).
5.5 Summary
This chapter has presented the result of the analysis done from the data obtained.
After the factor analysis, the original scale with nine components remains as nine
components. The hypotheses postulated in Chapter 3, were tested by Pearson
correlation. Out of the ten null hypotheses, four were supported and accepted, six
were rejected. Then, through multiple regressions, Normative Susceptibility, Price
Consciousness, Novelty Seeking and Perceived Risk were found to be dominant thus
is part of the regression equation. Finally, the Sobel test has confirmed that the
mediator variable (attitude towards counterfeit products) carries the influence of the
independent variables to a dependent variable (purchase intention). In the next
chapter, the result in this chapter is discussed in greater depth and length.
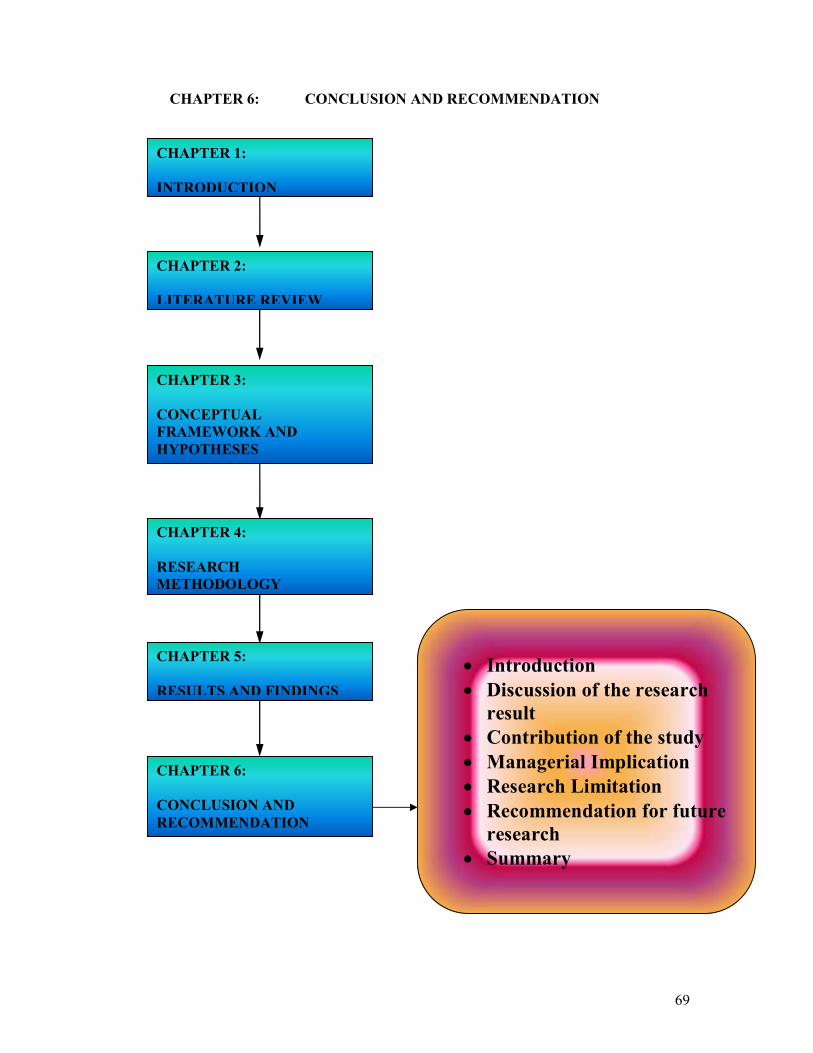
69
CHAPTER 6: CONCLUSION AND RECOMMENDATION
CHAPTER 6:
CONCLUSION AND
RECOMMENDATION
CHAPTER 3:
CONCEPTUAL
FRAMEWORK AND
HYPOTHESES
CHAPTER 4:
RESEARCH
METHODOLOGY
CHAPTER 5:
RESULTS AND FINDINGS
CHAPTER 2:
LITERATURE REVIEW
CHAPTER 1:
INTRODUCTION
• Introduction
• Discussion of the research result
• Contribution of the study
• Managerial Implication
• Research Limitation
• Recommendation for future
research
• Summary
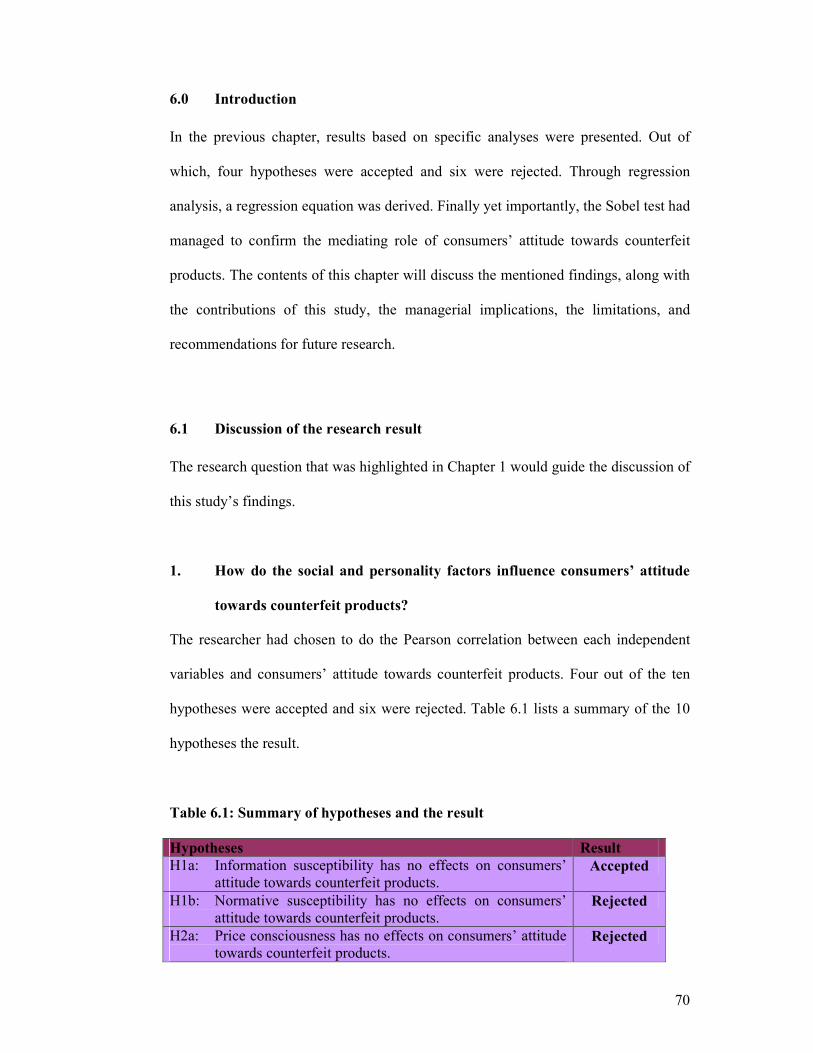
70
6.0 Introduction
In the previous chapter, results based on specific analyses were presented. Out of
which, four hypotheses were accepted and six were rejected. Through regression
analysis, a regression equation was derived. Finally yet importantly, the Sobel test had
managed to confirm the mediating role of consumers’ attitude towards counterfeit
products. The contents of this chapter will discuss the mentioned findings, along with
the contributions of this study, the managerial implications, the limitations, and
recommendations for future research.
6.1 Discussion of the research result
The research question that was highlighted in Chapter 1 would guide the discussion of
this study’s findings.
1. How do the social and personality factors influence consumers’ attitude
towards counterfeit products?
The researcher had chosen to do the Pearson correlation between each independent
variables and consumers’ attitude towards counterfeit products. Four out of the ten
hypotheses were accepted and six were rejected. Table 6.1 lists a summary of the 10
hypotheses the result.
Table 6.1: Summary of hypotheses and the result
Hypotheses Result
H1a: Information susceptibility has no effects on consumers’ attitude towards counterfeit products.
Accepted
H1b: Normative susceptibility has no effects on consumers’ attitude towards counterfeit products.
Rejected
H2a: Price consciousness has no effects on consumers’ attitude towards counterfeit products.
Rejected
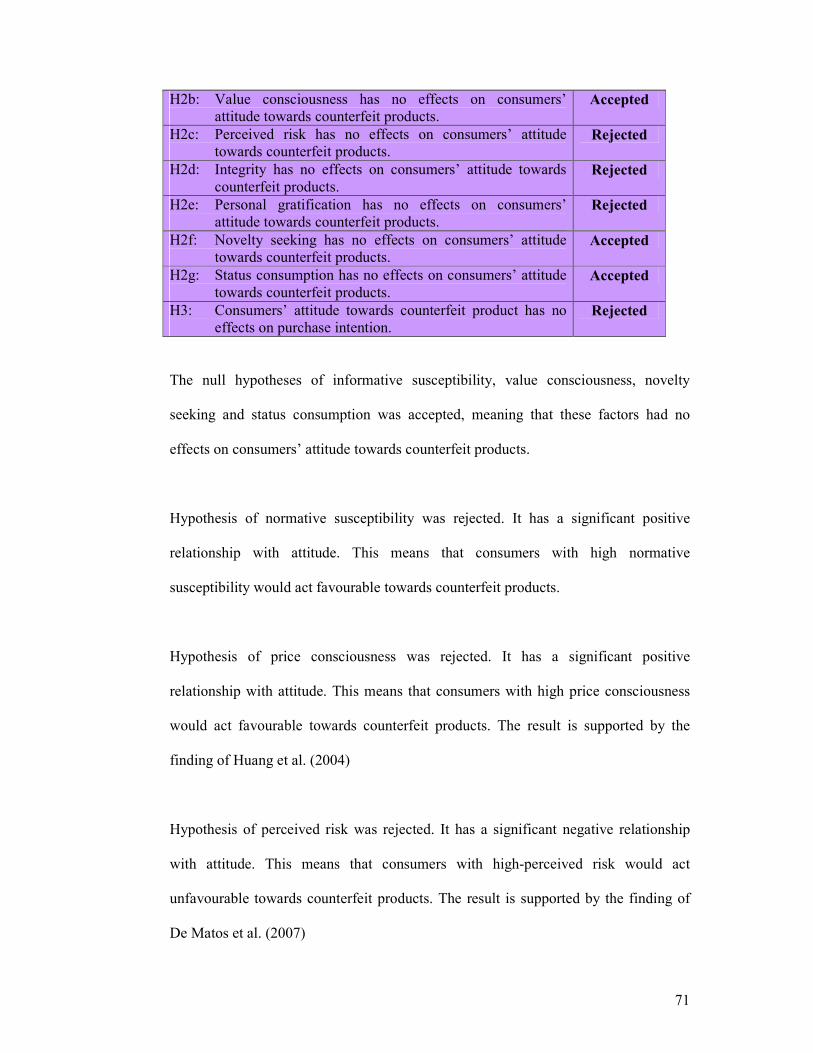
71
H2b: Value consciousness has no effects on consumers’ attitude towards counterfeit products.
Accepted
H2c: Perceived risk has no effects on consumers’ attitude towards counterfeit products.
Rejected
H2d: Integrity has no effects on consumers’ attitude towards counterfeit products.
Rejected
H2e: Personal gratification has no effects on consumers’ attitude towards counterfeit products.
Rejected
H2f: Novelty seeking has no effects on consumers’ attitude towards counterfeit products.
Accepted
H2g: Status consumption has no effects on consumers’ attitude towards counterfeit products.
Accepted
H3: Consumers’ attitude towards counterfeit product has no effects on purchase intention.
Rejected
The null hypotheses of informative susceptibility, value consciousness, novelty
seeking and status consumption was accepted, meaning that these factors had no
effects on consumers’ attitude towards counterfeit products.
Hypothesis of normative susceptibility was rejected. It has a significant positive
relationship with attitude. This means that consumers with high normative
susceptibility would act favourable towards counterfeit products.
Hypothesis of price consciousness was rejected. It has a significant positive
relationship with attitude. This means that consumers with high price consciousness
would act favourable towards counterfeit products. The result is supported by the
finding of Huang et al. (2004)
Hypothesis of perceived risk was rejected. It has a significant negative relationship
with attitude. This means that consumers with high-perceived risk would act
unfavourable towards counterfeit products. The result is supported by the finding of
De Matos et al. (2007)
72
Hypothesis of integrity was rejected. It has a significant negative relationship with
attitude. This means that consumers with high integrity would act unfavourable
towards counterfeit products. The result is supported by the findings of Phau and Teah
(2007) and De Matos et al. (2007).
Hypothesis of personal gratification was rejected. It has a significant negative
relationship with attitude. This means that consumers with high personal gratification
would act favourable towards counterfeit products. The result is supported by the
finding of De Matos et al. (2007)
Lastly, H3 hypothesized that consumers’ attitude towards counterfeit products has no
effects on purchase intention. The hypothesis was rejected. It has a significant positive
relationship, meaning that consumer’s attitude has effects on purchase intention. If the
consumers’ attitude is favourable towards counterfeit products then they will purchase
the counterfeit. If the consumers’ attitude is unfavourable towards counterfeit
products then they will not purchase the counterfeit. This result corresponds to the
findings of past research (Phau and Teah, 2009; De Matos et al., 2007; Huang et al.,
2004). It is evident that consumers’ attitude towards counterfeit products play an
important role in leading or driving the consumer purchase intention.
2. What is the impact of consumers’ attitude towards purchase intention?
The Sobel test was used to test whether the mediator variable (consumers’ attitude
towards counterfeit products) carries the influence of an independent variable to the
dependent variable (purchase intention). The result shows that consumers’ attitude
towards counterfeit products has a significant impact on purchase intention.
73
This means that the consumers’ attitude of whether they are in favour or not in favour
of counterfeit products affects the consumer’s purpose or objective to purchase
counterfeit products.
3. What are the dominant factors influencing consumers’ attitude towards
counterfeit products, which leads to purchase intention?
Standard multiple regressions were used to determine the dominant variables that
influences consumers’ attitude towards counterfeit products. It is found that normative
susceptibility, price consciousness and novelty seeking, contributed significantly
positive influence on consumers’ attitude. Perceived risk on the other hand,
contributed to a significant negative influence on consumers’ attitude.
The result indicates that consumers in Malaysia are very likely to consider other
people’s opinions and thoughts when buying a particular product. The consumers feel
that it is important that others like the products and brands that they buy. They want to
make a good impression on others and would often purchase the brand that others
expect them to buy.
The consumers seems to be equivalently price conscious, meaning that they purchase
products based on the price that is offered, normally going after the less expensive
products. Price conscious consumer tends to buy items that are on sale or bargains,
which usually are cheap.
74
The consumers are to an extent novelty seeker, which means they like to keep up with
fashion and trends. They like to be the first to try out new products and they get
excited in purchasing interesting, unique products.
Perceived risk is dominant and the only factor contributing to a significant negative
influence on consumers’ attitude. It is pleasing to know that consumers do think of the
risks involved if they were to purchase counterfeit products. There are some
consumers who thinks that spending money on counterfeit products is not wise and
would even make them feel unhappy or frustrated, and some thinks about the negative
effects of what others think if they were to be caught buying counterfeit products.
6.2 Contribution of the study
This study is conducted based on past research of Phau and Teah (2009), De Matos et
al. (2007) and Huang et al. (2004). Each of the research was done in a different
country with different setting such as different behaviour and different culture of
consumers. This study contributes in enabling others to understand the attitudes of
consumers in Malaysia.
The study has verified that the intention to purchase a counterfeit product is very
much reliant on the attitude that the consumers have towards counterfeit products.
These attitudes were strongly influenced by perceived risk, normative susceptibility
and price consciousness and novelty seeking. The result differs from the past research
(Phau and Teah, 2009; De Matos et al., 2007; Huang et al, 2004), but it is acceptable
due to the nature of the study with its own set of setting.
75
The outcome of this study can be used as reference and knowledge in the educational
institution. Moreover, the findings can be beneficial to the manufacturers and
marketers of branded genuine products in understanding the consumers’ behaviour or
attitude towards counterfeit products.
6.3 Managerial Implication
From the result in Chapter 5, it is found that both social factor (normative
susceptibility) and personality factor (price consciousness, novelty seeking and
perceived risk) have significant impact on consumers’ purchase intention towards
counterfeit products. Manufacturers and marketers of genuine products in Malaysia
must keep in mind of these factors and use it to their advantage.
Manufacturers and marketers can work to change consumers’ behaviour through
shaping attitudes and beliefs with strategies such as below:
• Normative susceptibility – these consumers care about what other people think
of them because they want to make a good impression of themselves. They
buy products that they feel others expect them to buy.
Since the consumers are concerned about what other people think of them, the
marketers should directly address counterfeit issue in advertising programs.
Emphasize the importance of buying the ‘real thing’ and that if they buy the
counterfeit version, it means that the consumers do not think highly of
themselves. Another strategy is to use celebrity endorsers, as consumers with
76
high normative susceptibility like to purchase the same product and brand of
someone they like or admire.
� Price – these consumers only want products that are not expensive if not those
that are on sale.
The manufacturer should try to consider lowering their price through the
introduction of brand extensions and special licensed products. Else, perhaps
encourage consumers to purchase by introducing a membership card that
awards the consumers’ privileges such as huge discounts after a number of
purchases, or points of the consumer were to bring family and friends as
customers.
� Novelty seeking – these consumers seeks variety and difference.
Manufacturer of genuine branded products should differentiate their products
by emphasizing style, design, quality and appearance differences. Create
products that would have the consumer eager of owning and that they will not
be able to wait for the counterfeiters to produce and sell. Perhaps, it creates
limited number of products, thus, the consumer who bought it will feel grand
and one of a kind.
� Perceived risk – these consumers seek to reduce uncertainty and unfavourable
consequences when making a purchase.
77
Marketers should highlight their genuine products is of superior quality,
functionality and reliability, and if they are really confident of their products,
warranties are issued or if for some reason the customer is not satisfied, have a
guarantee that they will serve the customer till they are satisfied. Marketers
can capture the consumers who have high-perceived risk of counterfeit
products by stressing their after-sale services. After all, the after-sale services
are something that would differentiate their genuine products from the
counterfeits.
It is with hope that in time, the suggestions mentioned would be able to lessen the
purchases of counterfeit products among consumers in Malaysia.
6.4 Research Limitation
A few limitations have been identified throughout the study:
• Time limitation and resource constraints have led to limited geographical area
being covered in the study. Utilizing the survey results gathered within the
Klang Valley and generalizing it across the Malaysian population may not be
convincing. To achieve the general objective, studies should be done in other
parts of Malaysia.
• Factors such as product involvement, perceived benefit, price quality
inference, brand image and more were not included in the study. As such, its
effects and influences on consumers’ attitude towards counterfeit products are
unknown.
78
• There was no predetermined indication as to what constitute a counterfeit
product for this particular survey to the respondents. Different categories of
products have its own set of variables for measurement.
• Counterfeit issue is a sensitive subject. Getting respondents to voluntary
participate in answering the questionnaire was a challenge as for some fear
that their image reputation or status will be affected.
6.5 Recommendation for future research
A number of recommendations that can be considered and done for future research:
• Sample selection should be distributed more evenly rather than concentrating
on one particular area. The result will be more representative and convincing.
• Other variables should be looked upon, as there is no finite and definite
measurement of determining consumers’ attitude towards counterfeit
products.
• Clear, specific indication of the product categories that can be constituted as
counterfeit products should be highlighted, thus taken into judgment and
deliberation by the consumers.
6.6 Summary
This study has made a significant contribution to the academicians, marketers, and
manufacturers of branded genuine goods and the industry as a whole. It has found that
normative susceptibility, price consciousness, novelty seeking and perceived risk to
be dominant in influencing consumers to purchase counterfeit products through the
mediation of attitude. From the theoretical perspective, it is an extension of
79
knowledge of consumers concerning counterfeit products. However, for the marketers
and manufacturers of genuine branded products, the findings can serve as a reference
in developing better marketing strategies to entice the consumers to purchase genuine
products and not the counterfeit version. Knowing that attitude plays a role in
determining the purchase intention of a customer, manufacturers and marketers can
work on finding ways to change consumers’ attitudes and beliefs.
80
BIBLIOGRAPHY
Ajzen, I. and Fishbein, M. (1980), “Understanding Attitudes and Predicting Social
Behavior”, Prentice-Hall, Englewood Cliffs, NJ.
Albers-Miller, N.D. (1999), “Consumer misbehavior: why people buy illicit goods”,
Journal of Consumer Marketing, Vol. 16 No. 3, pp. 273-87.
Alcock, L., Chen, P., Ch’ng, H.M. and Hodson, S. (2003), “Counterfeiting: tricks and
trends”, Brand Management, Vol. 11 No. 2, pp. 133-6.
Ang, S.H., Cheng, P.S., Lim, E.A.C. and Tambyah, S.K. (2001), “Spot the difference:
consumer responses towards counterfeits”, Journal of Consumer Marketing, Vol. 18
No. 3, pp. 219-35.
Baron, R. M., & Kenny, D. A. (1986), “The moderator-mediator variable distinction
in social psychological research: Conceptual, strategic, and statistical considerations”,
Journal of Personality and Social Psychology, 51, 1173-1182.
Bearden, W.O., Netemeyer, R.G. and Teel, J.E. (1989), “Measurement of consumer
susceptibility to interpersonal influence”, Journal of Consumer Research, Vol. 15 No.
4, pp. 473-81.
Bian X, Moutinho L. (2008), “An investigation of determinants of counterfeit
purchase consideration”, J Bus Res.
Bian X, Veloutsou C. (2007), “Consumers' attitudes regarding non-deceptive
counterfeit brands in the UK and China” J Brand Management ;14(3):211–22
Bloch, P.H., Bush, R.F. and Campbell, L. (1993), “Consumer ‘Accomplices’ in
product Counterfeiting; a demand side investigation”, Journal of Consumer
Marketing, Vol. 10 No. 4, pp. 27-36.
81
Bonoma, T.V. and Johnston, W.J. (1979), “Decision making under uncertainty: a
direct measurement approach”, Journal of Consumer Research, Vol. 6 No. 2, pp. 177-
91.
Bucklin, L.P. (1993), “Modeling the international gray market for public policy
decisions”, International Journal of Research in Marketing, Vol. 10 No. 4, pp. 387-
405.
Cespedes, F.V., Corey, E.R. and Rangan, V.K. (1988), “Gray markets: causes and
cures”, Harvard Business Review, Vol. 66 No. 4, pp. 75-83.
Chadha, R. (2007), “From Mao suits to Armani”, Advertising Age, Vol. 78 No. 2, p.
27.
Chakravarti A, Janiszewski C. (2003), “The influence of macro-level motives on
consideration set composition in novel purchase situations”, J Consum Res
30(2):244–58 (September).
Chang, M.K. (1998), “Predicting unethical behaviour: a comparison of the theory of
reasoned action and the theory of planned behaviour”, Journal of Business Ethics,
Vol. 17, pp. 1825-34.
Chang, T.-Z. (1993), “Parallel importation in Taiwan: a view from a newly emerged
country and a comparative analysis”, International Marketing Review, Vol. 10 No. 6,
pp. 30-41.
Chaudhry PE,Walsh MG. (1996), “An assessment of the impact of counterfeiting in
international markets: the piracy paradox persists”, Columbia J World Bus. 31(3):34–
49 (Fall).
Chaudhry, P., Cordell, V. and Zimmerman, A. (2005), “Modeling anti-counterfeiting
strategies in response to protecting intellectual property rights in a global
environment”, Marketing Review, Vol. 5 No. 1, pp. 59-72.
82
Cheung, W.L. and Prendergast, G. (2006), “Buyers’ perceptions of pirated products in
China”, Marketing Intelligence & Planning, Vol. 24 No. 5, pp. 446-62.
Chow, D.C.K. (2000), “Enforcement against counterfeiting in the People’s Republic
of China”, Northwestern Journal of International Law & Business, Vol. 20 No. 3, p.
447.
Clark, D. (2006), “Counterfeiting in China: a blueprint for change”, The China
Business Review, January/February, p. 14.
Cordell, V., Wongtada, N. and Kieschnick, R.L. Jr (1996), “Counterfeit purchase
intentions: role of lawfulness attitudes and product traits as determinants”, Journal of
Business Research, Vol. 35 No. 1, pp. 41-53.
De Castro, J.O., Balkin, D.B. and Shepherd, D.A. (2007), “Knock-off or knockout?”,
Business Strategy Review, Vol. Spring, pp. 28-32.
De Matos, C.A., Ituassu, C.T. and Rossi, C.A.V. (2007), “Consumer attitudes toward
counterfeits: a review and extension”, Journal of Consumer Marketing, Vol. 24 No. 1,
pp. 36-47.
Dholakia UM. (1998), “Involvement–response models of joint effects: an empirical
test and extension”, Adv Consum Res. 25(1):499–506.
Donthu, N. and Garcia, A. (1999), “The Internet shopper”, Journal of Advertising
Research, Vol. 39 No. 3, pp. 52-8.
Dowling, G.R. and Staelin, R. (1994), “A model of perceived risk and intended risk-
handling activity”, Journal of Consumer Research, Vol. 21 No. 1, pp. 119-34.
Eastman, J.K., Fredenberger, B., Campbell, D. and Calvert, S. (1997), “The
relationship between status consumption and materialism: a cross-cultural comparison
of Chinese, Mexican, and American students”, Journal of Marketing Theory and
Practice, Winter.
83
Eisend, M. and Schuchert-Gu¨ ler, P. (2006), “Explaining counterfeit purchases: a
review and preview”, Academy of Marketing Science Review, Vol. 2006 No. 12. pp.
1-26
Fishbein, M. and Ajzen, I. (1975), Belief, Attitude, Intention, and Behavior: An
Introduction to Theory of Research, Addison-Wesley, Reading, MA.
Furnham, A. and Valgeirsson H., (2007), “The effect of life values and materialism on
buying counterfeit products”, The Journal of Socio-Economics, No. 36 pp. 677–685.
Gentry, J.W., Putrevu, S. and Shultz, C.J. II (2006), “The effects of counterfeiting on
consumer search”, Journal of Consumer Behaviour, Vol. 5 No. 3, pp. 245-56.
Gentry, J.W., Putrevu, S., Shultz, C., Commuri, S. (2001), ” How now Ralph Lauren?
The separation of brand and product in a counterfeit culture”, Advances in Consumer
Research, Vol 28, No. 258–265.
Goodman, L. A. (1960). “On the exact variance of products”, Journal of the American
Statistical Association, 55, 708-713.
Grossman, G.M. and Shapiro, C. (1988), “Foreign counterfeiting of status goods”,
Quarterly Journal of Economics, February, pp. 79-100.
Gupta, P.B., Gould, S.J. and Pola, B. (2004), “‘To pirate or not to pirate?’ A
comparative study of the ethical versus other influences on the consumer’s software
acquisition mode decision”, Journal of Business Ethics, Vol. 55, pp. 255-74.
Harvey MG, Ronkainen IA. (1985), “International counterfeiters: marketing success
without the cost and the risk”, Columbia J World Bus. 20(3):37–45 (Fall).
Harvey PJ, Walls WD. (2003), “The revealed demand for pirate goods: probit analysis
of experimental data”, Int J Manag. 20(2):194–201.
Havlena, W.J. and DeSarbo, W.S. (1991), “On the measurement of perceived
consumer risk”, Decision Sciences, Vol. 22 No. 4, pp. 927-39.
84
Hawkins, D.I., Coney, K.A. and Best, R.J. (1980), Consumer Behavior: Implications
for Marketing Strategy, Business Publications, Dallas, TX.
Hoe, L., Hogg, G. and Hart, S. (2003), “Fakin’ it: counterfeiting and consumer
contradictions”, in Turley, D. and Brown, S. (Eds), European Advances in Consumer
Research, 6th ed., Association for Consumer Research, Provo, UT, pp. 60-7.
Huang, J.H., Lee, B.C.Y. and Ho, S.H. (2004), “Consumer attitude toward gray
market goods”, International Marketing Review, Vol. 21 No. 6, pp. 598-614.
Hung, C.L. (2003), “The business of product counterfeiting in China and the post-
WTO membership environment”, Asia Pacific Business Review, Vol. 10 No. 1, pp.
58-77.
International Anticounterfeiting Coalition (2005), “Facts on fakes”, available at:
www.iacc.org/Facts.html
International Intellectual Property Institute (2003), “Counterfeit goods and the
public’s health and safety”, available at: www.iacc.org/IIPI.pdf
Jacoby, J. and Kaplan, L. (1972), “Components of perceived risk”, Proceedings of the
Third Annual Conference of the Association for Consumer Research, pp. 382-93.
Janiszewski, C. and Lichtenstein, D.R. (1999), “A range theory account of price
perception”, Journal of Consumer Research, Vol. 25, March, pp. 353-68.
Kay, H. (1990), “Fake’s progress”, Management Today, July, pp. 54-8.
Kwong, K.K., Yau, O.H.M., Lee, J.S.Y., Sin, L.Y.M. and Tse, A.C.B. (2003), “The
effects of attitudinal and demographic factors on intention to buy pirated CDs: the
case of Chinese consumers”, Journal of Business Ethics, Vol. 47 No. 3, pp. 223-35.
Lai, K.K.Y. and Zaichkowsky, J.L. (1999), “Brand imitation: do the Chinese have
different views?”, Asia Pacific Journal of Management, Vol. 16 No. 2, pp. 179-92.
85
Lichtenstein, D.R., Netemeyer, R.G. and Burton, S. (1990), “Distinguishing coupon
proneness from value consciousness: an acquisition-transaction utility theory
perspective”, Journal of Marketing, Vol. 54 No. 3, pp. 54-67.
Lichtenstein, D.R., Ridgway, N.M. and Netemeyer, R.G. (1993), “Price perceptions
and consumer shopping behavior: a field study”, Journal of Marketing Research, Vol.
30 No. 2, pp. 234-45.
MacKinnon, D. P., Warsi, G., & Dwyer, J. H. (1995). A simulation study of mediated
effect measures. Multivariate Behavioral Research, 30(1), 41-62.
Miniard, P.W. and Cohen, J.B. (1983), “Modeling personal and normative influences
on behavior”, Journal of Consumer Research, Vol. 10 No. 2.
Mitchell, V.M. (1998), “A role for consumer risk perceptions in grocery retailing”,
British Food Journal, Vol. 100 No. 4, pp. 171-83.
Nill, A. and Shultz, C.J. II (1996), “The scourge of global counterfeiting”, Business
Horizons, Vol. 39 No. 6, pp. 37-43.
Penz, E. and Sto¨ ttinger, B. (2005), “Forget the ‘real’ thing – take the copy! An
explanatory model for the volitional purchase of counterfeit products”, Advances in
Consumer Research, Vol. 32, pp. 568-75.
Phau I, Prendergast G, Chuen LH. (2001), “Profiling brand-piracy-prone consumers:
an exploratory study in hong kong's clothing industry”, J Fash Mark Manag. 5 (1):45–
55.
Phau, I., and Teah, M. (2009), “Devil wears (counterfeit) Prada: a study of
antecedents and outcomes of attitudes towards counterfeits of luxury brands”, Journal
of Consumer Marketing, Vol. 26 No. 1, pp. 15-27.
86
Prendergast, G., Chuen, L.H. and Phau, I. (2002), “Understanding consumer demand
for non-deceptive pirated brands”, Marketing Intelligence & Planning, Vol. 20 No. 7,
pp. 405-16.
Rajendran, K.N. and Tellis, G.J. (1994), “Contextual and temporal components of
reference price”, Journal of Marketing, Vol. 58 No. 1, pp. 22-34.
Roselius, E. (1971), “Consumer rankings of risk reduction methods”, Journal of
Marketing, Vol. 35, pp. 56-61.
Schiffman, L.G. and Kanuk, L.L. (1997), Consumer Behavior, 8th ed., Prentice Hall,
Englewood Cliffs, NJ.
Shultz II CJ, Saporito B. (1996), “Protecting intellectual property: strategies and
recommendations to deter counterfeiting and brand piracy in global markets”,
Columbia J World Bus. 31(1):18–28 (Spring).
Sonmez, M. and Yang, D. (2005), “Manchester United versus China: a counterfeiting
and trademark match”, Managing Leisure, Vol. 10, pp. 1-18.
Steenhaut, S. and van Kenhove, P. (2006), “An empirical investigation of the
relationships among a consumer’s personal values, ethical ideology and ethical
beliefs”, Journal of Business Ethics, Vol. 64, pp. 137-55.
Tellis, G.J. and Gaeth, G.J. (1990), “Best value, priceseeking, and price aversion: the
impact of information and learning on consumer choices”, Journal of Marketing, Vol.
54, April, pp. 34-45.
Tom, G., Garibaldi, B., Zeng, Y. and Pilcher, J. (1998), “Consumer demand for
counterfeit goods”, Psychology & Marketing, Vol. 15 No. 5, pp. 405-21.
Trainer, T.P. (2002), “The fight against trademark counterfeiting”, The China
Business Review, November/ December, pp. 21-4.
87
Wang, F., Zhang, H., Zang, H. and Ouyang, M. (2005), “Purchasing pirated software:
an initial examination of Chinese consumers”, Journal of Consumer Marketing, Vol.
22 No. 6, pp. 340-51.
Wee C, Tan SJ, Cheok KH. (1995), “Non-price determinants of intention to purchase
counterfeit goods”, Int Mark Rev. 12(6):19–47.
Weigand, R.E. (1991), “Parallel import channels – options for preserving territorial
integrity”, Columbia Journal of World Business, Vol. 26 No. 1, pp. 53-60.
Zeithaml, Valarie A. (1984), "Issues in Conceptualizing and Measuring Consumer
Response to Price," in Advances in Consumer Research, Vol. 11.
Zinkhan, G.M. and Karande, K.W. (1990), “Cultural and gender differences in risk-
taking behavior among American and Spanish decision markers”, The Journal of
Social Psychology, Vol. 131 No. 5, pp. 741-2.
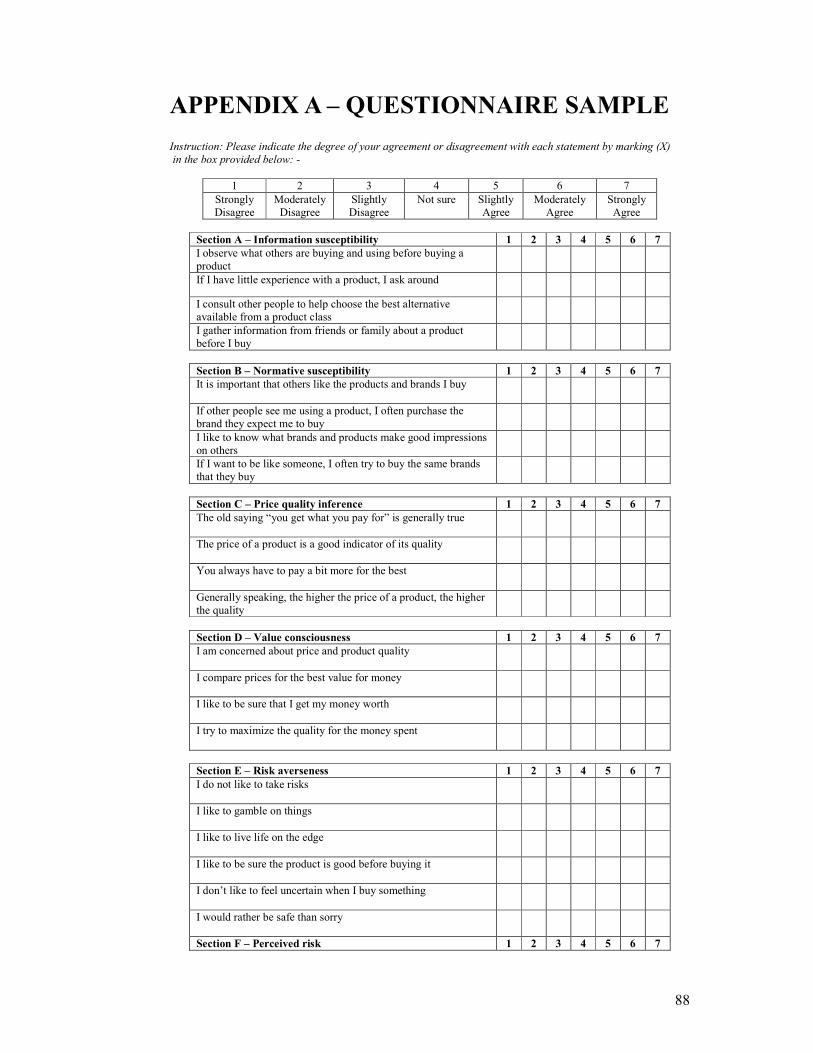
88
APPENDIX A – QUESTIONNAIRE SAMPLE Instruction: Please indicate the degree of your agreement or disagreement with each statement by marking (X) in the box provided below: -
1 2 3 4 5 6 7
Strongly Disagree
Moderately Disagree
Slightly Disagree
Not sure Slightly Agree
Moderately Agree
Strongly Agree
Section A – Information susceptibility 1 2 3 4 5 6 7
I observe what others are buying and using before buying a product
If I have little experience with a product, I ask around
I consult other people to help choose the best alternative available from a product class
I gather information from friends or family about a product before I buy
Section B – Normative susceptibility 1 2 3 4 5 6 7
It is important that others like the products and brands I buy
If other people see me using a product, I often purchase the brand they expect me to buy
I like to know what brands and products make good impressions on others
If I want to be like someone, I often try to buy the same brands that they buy
Section C – Price quality inference 1 2 3 4 5 6 7
The old saying “you get what you pay for” is generally true
The price of a product is a good indicator of its quality
You always have to pay a bit more for the best
Generally speaking, the higher the price of a product, the higher the quality
Section D – Value consciousness 1 2 3 4 5 6 7
I am concerned about price and product quality
I compare prices for the best value for money
I like to be sure that I get my money worth
I try to maximize the quality for the money spent
Section E – Risk averseness 1 2 3 4 5 6 7
I do not like to take risks
I like to gamble on things
I like to live life on the edge
I like to be sure the product is good before buying it
I don’t like to feel uncertain when I buy something
I would rather be safe than sorry
Section F – Perceived risk 1 2 3 4 5 6 7
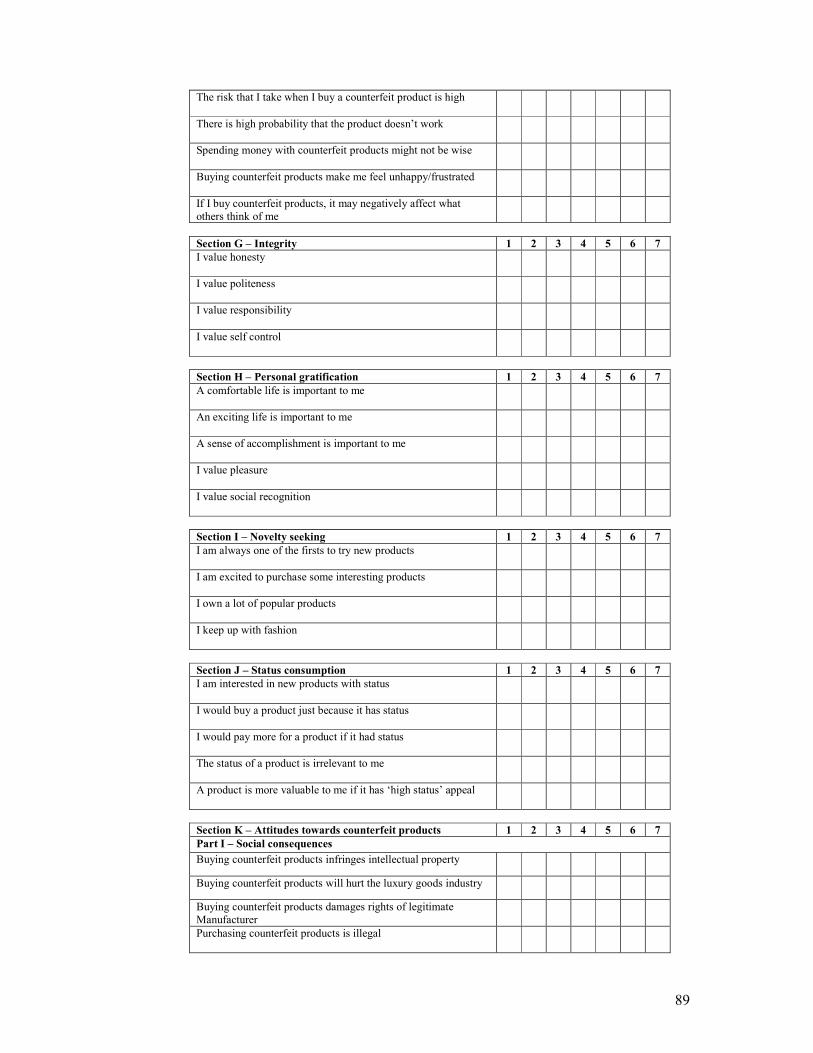
89
The risk that I take when I buy a counterfeit product is high
There is high probability that the product doesn’t work
Spending money with counterfeit products might not be wise
Buying counterfeit products make me feel unhappy/frustrated
If I buy counterfeit products, it may negatively affect what others think of me
Section G – Integrity 1 2 3 4 5 6 7
I value honesty
I value politeness
I value responsibility
I value self control
Section H – Personal gratification 1 2 3 4 5 6 7
A comfortable life is important to me
An exciting life is important to me
A sense of accomplishment is important to me
I value pleasure
I value social recognition
Section I – Novelty seeking 1 2 3 4 5 6 7
I am always one of the firsts to try new products
I am excited to purchase some interesting products
I own a lot of popular products
I keep up with fashion
Section J – Status consumption 1 2 3 4 5 6 7
I am interested in new products with status
I would buy a product just because it has status
I would pay more for a product if it had status
The status of a product is irrelevant to me
A product is more valuable to me if it has ‘high status’ appeal
Section K – Attitudes towards counterfeit products 1 2 3 4 5 6 7
Part I – Social consequences
Buying counterfeit products infringes intellectual property
Buying counterfeit products will hurt the luxury goods industry
Buying counterfeit products damages rights of legitimate Manufacturer
Purchasing counterfeit products is illegal
90
Section K – Attitudes towards counterfeit products 1 2 3 4 5 6 7
Part I – Perceptions of counterfeit products
Counterfeit products are as reliable as the genuine products
Counterfeit products have similar quality to the genuine products
Counterfeit products provided similar functions to the genuine products
Considering price, I prefer counterfeit products
Section L – Purchase intentions 1 2 3 4 5 6 7
I would think about a counterfeit products as a choice when buying something
I will buy counterfeit products
I will consider purchasing counterfeit products for a friend
I would recommend counterfeit products to friends and family
I will buy counterfeit products from peddlers
I would say favorable things about counterfeit products
Section M – Respondent profile
Instruction: Please tick (√) for the answer and fill in the blanks when necessary
1. Gender
Male Female
2. Age
Below 21 years 21 - 30 years 31 - 40 years
41 – 50 years 51 - 60 years Above 60 years
3. Citizenship
Malaysian Others (please specify) ____________________
4. Ethnic group
Malay Chinese
Indian Others (please specify) ____________________
5. Marital status
Single Married Divorced / Widow
6. Highest level of education
SPM Diploma
Bachelor Degree Post Graduate Degree
7. Occupation
Professional Executive Self-employed
Top Management Clerical / Admin Not working
Managers Student Retiree
8. Monthly income
91
Below RM2,000 RM2,000 - RM4,000 RM4,001 – RM6,000
RM6,001 - RM8,000 RM8,001 - RM10,000 RM10,001 and above
9. What is your favorite expensive brand?
____________________
10. What is your favorite shopping mall?
____________________
11. Why do you purchase branded products?
Please rank 1 to 7 in the column below, with number 1 as the most important reason and 7 the least important reason in purchasing branded products
Quality
Prestige
Image
Social influence
Design
Style
Others (please specify) __________
12. How much price difference between original and counterfeit product is good for you?
(Assuming the price is reflecting the quality of the counterfeit products)
Below RM 100 RM 101 - RM 300
RM 301 - RM 500 RM 501 and above
13. If you have ever bought a counterfeit product, what are they and what brand?
(e.g. Watch, Tag Heur )
1. ______________________________
2. ______________________________
3. ______________________________
~ Thank you for your time and cooperation ~
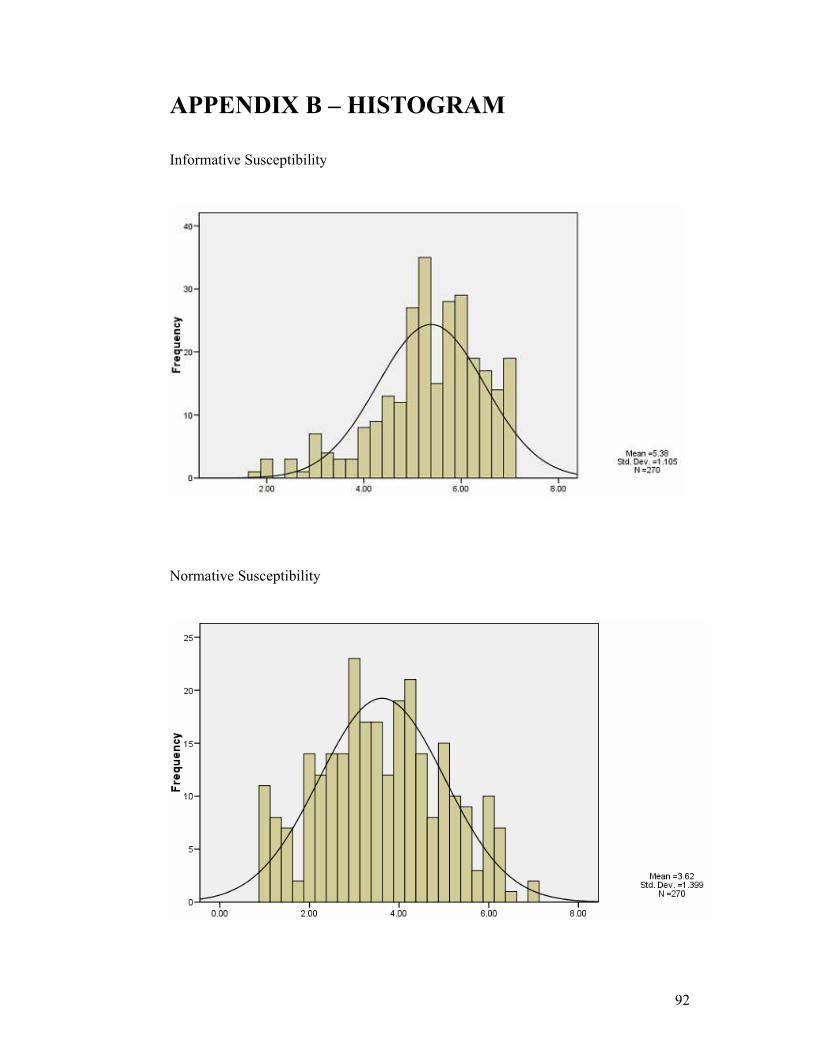
92
APPENDIX B – HISTOGRAM
Informative Susceptibility
Normative Susceptibility
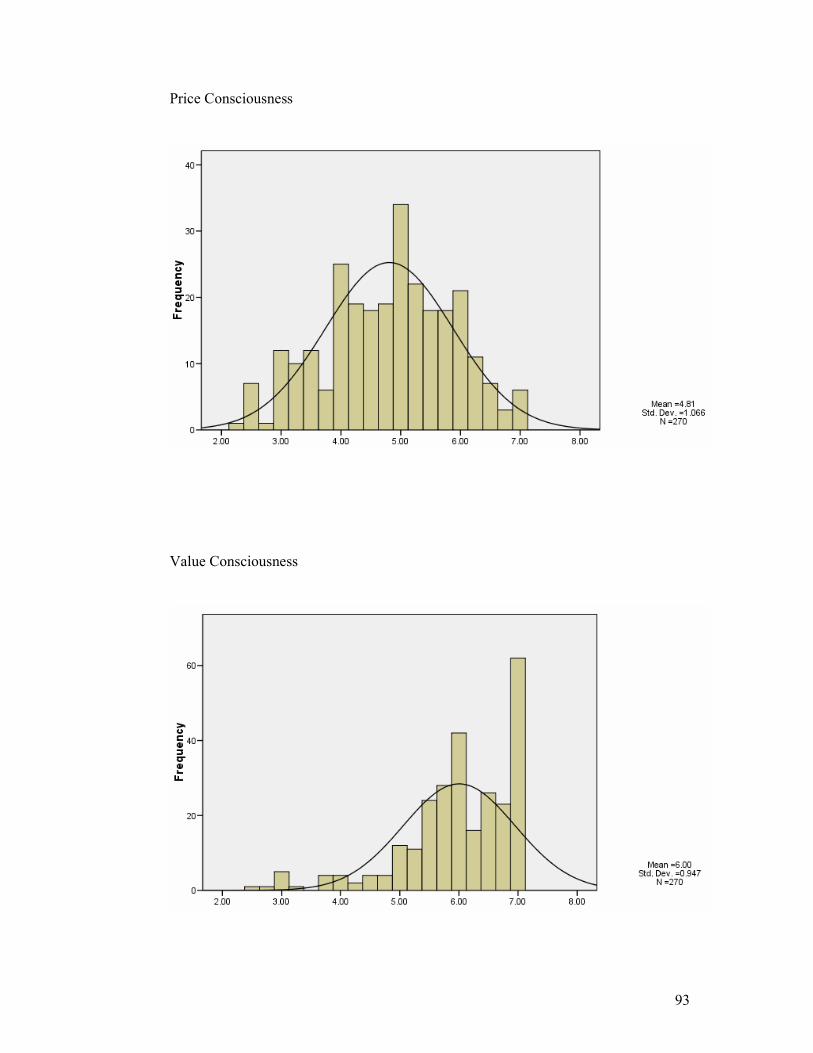
93
Price Consciousness
Value Consciousness
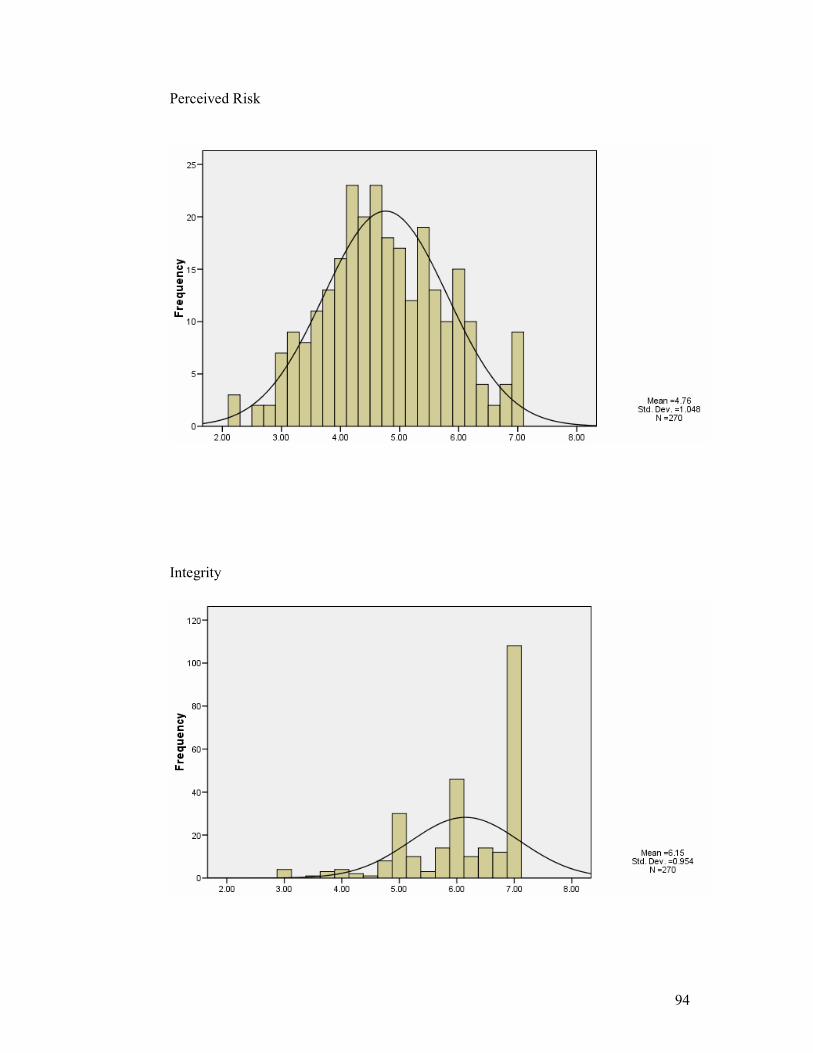
94
Perceived Risk
Integrity
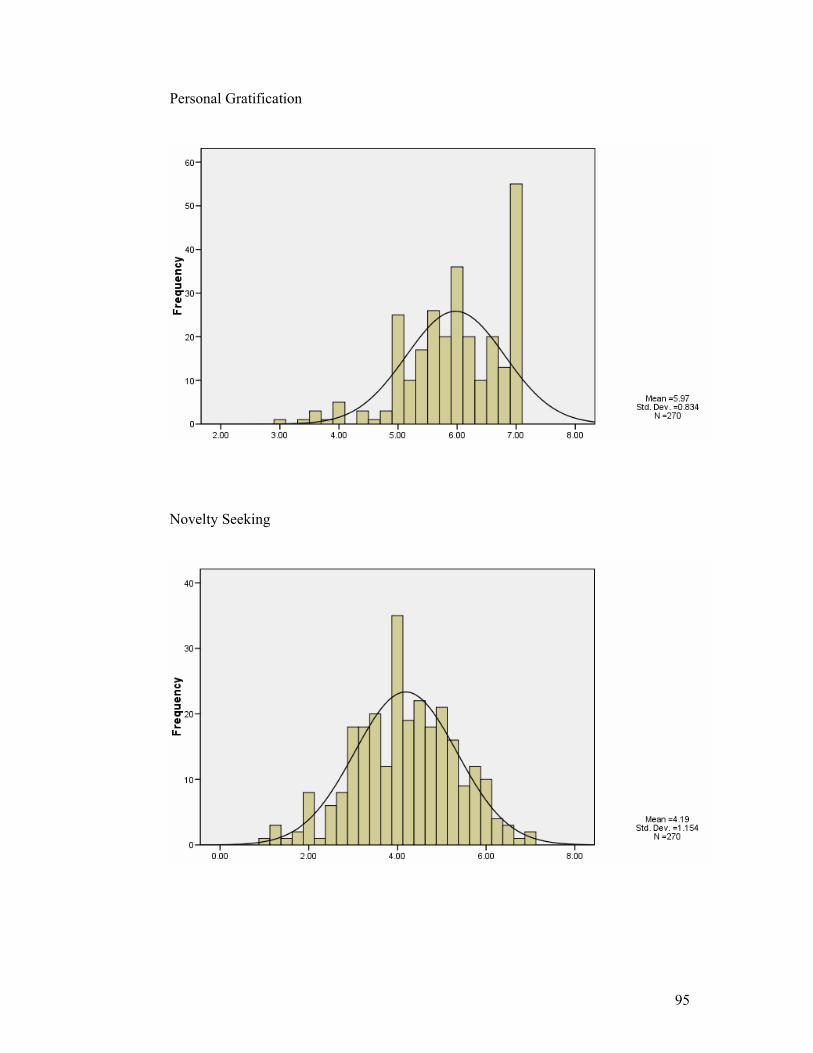
95
Personal Gratification
Novelty Seeking
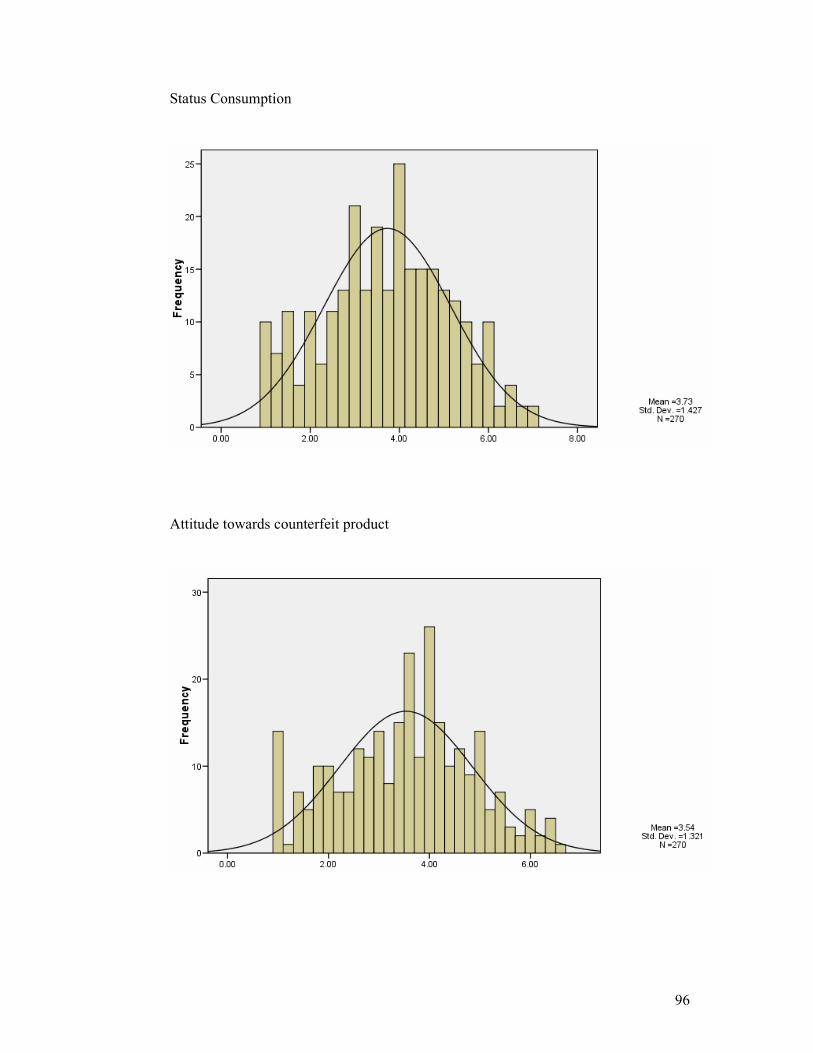
96
Status Consumption
Attitude towards counterfeit product
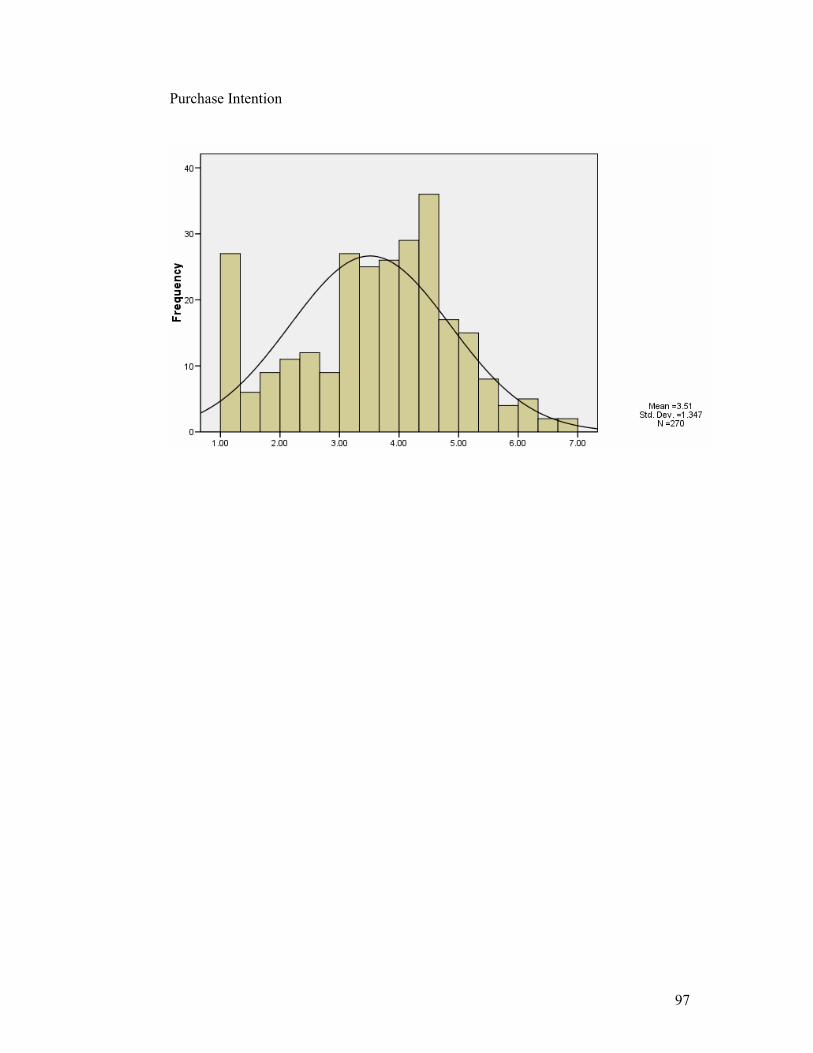
97
Purchase Intention
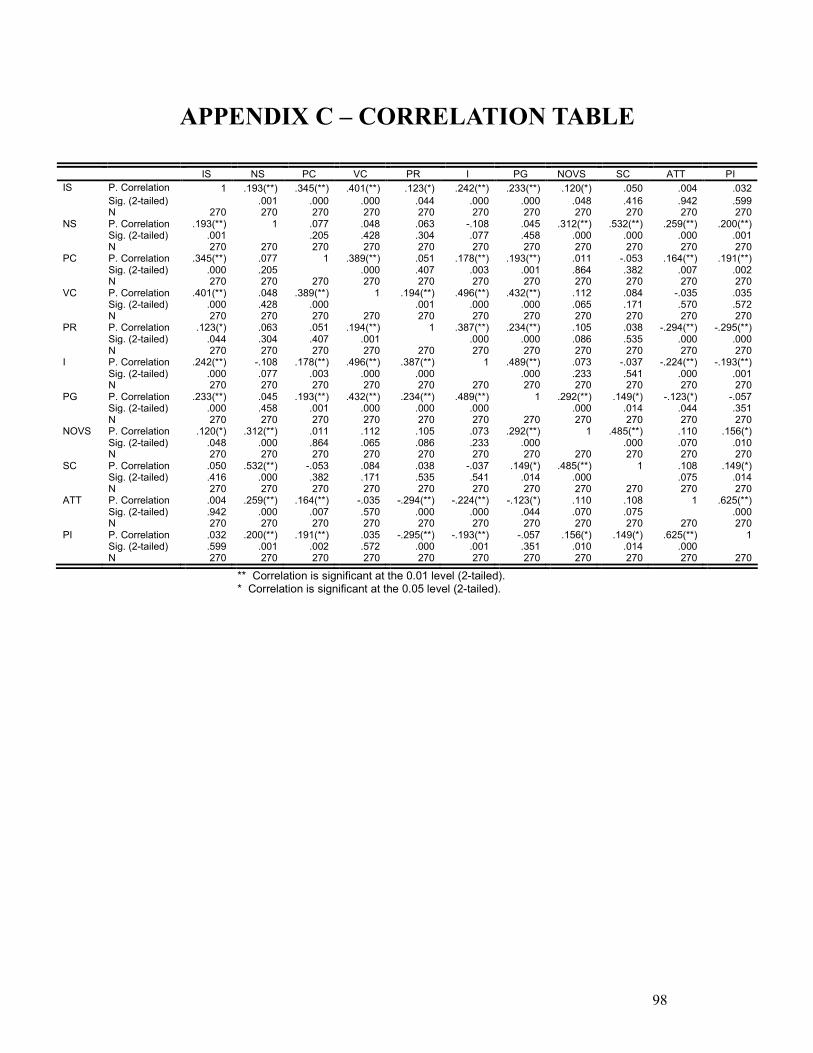
98
APPENDIX C – CORRELATION TABLE
IS NS PC VC PR I PG NOVS SC ATT PI
IS P. Correlation 1 .193(**) .345(**) .401(**) .123(*) .242(**) .233(**) .120(*) .050 .004 .032
Sig. (2-tailed) .001 .000 .000 .044 .000 .000 .048 .416 .942 .599 N 270 270 270 270 270 270 270 270 270 270 270 NS P. Correlation .193(**) 1 .077 .048 .063 -.108 .045 .312(**) .532(**) .259(**) .200(**) Sig. (2-tailed) .001 .205 .428 .304 .077 .458 .000 .000 .000 .001 N 270 270 270 270 270 270 270 270 270 270 270 PC P. Correlation .345(**) .077 1 .389(**) .051 .178(**) .193(**) .011 -.053 .164(**) .191(**) Sig. (2-tailed) .000 .205 .000 .407 .003 .001 .864 .382 .007 .002 N 270 270 270 270 270 270 270 270 270 270 270 VC P. Correlation .401(**) .048 .389(**) 1 .194(**) .496(**) .432(**) .112 .084 -.035 .035 Sig. (2-tailed) .000 .428 .000 .001 .000 .000 .065 .171 .570 .572 N 270 270 270 270 270 270 270 270 270 270 270 PR P. Correlation .123(*) .063 .051 .194(**) 1 .387(**) .234(**) .105 .038 -.294(**) -.295(**) Sig. (2-tailed) .044 .304 .407 .001 .000 .000 .086 .535 .000 .000 N 270 270 270 270 270 270 270 270 270 270 270 I P. Correlation .242(**) -.108 .178(**) .496(**) .387(**) 1 .489(**) .073 -.037 -.224(**) -.193(**) Sig. (2-tailed) .000 .077 .003 .000 .000 .000 .233 .541 .000 .001 N 270 270 270 270 270 270 270 270 270 270 270 PG P. Correlation .233(**) .045 .193(**) .432(**) .234(**) .489(**) 1 .292(**) .149(*) -.123(*) -.057 Sig. (2-tailed) .000 .458 .001 .000 .000 .000 .000 .014 .044 .351 N 270 270 270 270 270 270 270 270 270 270 270 NOVS P. Correlation .120(*) .312(**) .011 .112 .105 .073 .292(**) 1 .485(**) .110 .156(*) Sig. (2-tailed) .048 .000 .864 .065 .086 .233 .000 .000 .070 .010 N 270 270 270 270 270 270 270 270 270 270 270 SC P. Correlation .050 .532(**) -.053 .084 .038 -.037 .149(*) .485(**) 1 .108 .149(*) Sig. (2-tailed) .416 .000 .382 .171 .535 .541 .014 .000 .075 .014 N 270 270 270 270 270 270 270 270 270 270 270 ATT P. Correlation .004 .259(**) .164(**) -.035 -.294(**) -.224(**) -.123(*) .110 .108 1 .625(**) Sig. (2-tailed) .942 .000 .007 .570 .000 .000 .044 .070 .075 .000 N 270 270 270 270 270 270 270 270 270 270 270 PI P. Correlation .032 .200(**) .191(**) .035 -.295(**) -.193(**) -.057 .156(*) .149(*) .625(**) 1 Sig. (2-tailed) .599 .001 .002 .572 .000 .001 .351 .010 .014 .000 N 270 270 270 270 270 270 270 270 270 270 270
** Correlation is significant at the 0.01 level (2-tailed). * Correlation is significant at the 0.05 level (2-tailed).