a study oflearners conceptual development in mathematics
TRANSCRIPT

A Study of Learners Conceptual Development inMathematics in a Grade Eight Class Using Concept
Mapping
by
Urmilla Moodley
Submitted in partial fulfilment of the academic
requirements for the degree of
Master of Education in the
School of Science, Mathematics, and Technology Education
Faculty of Education
University of KwaZulu-Natal
February 2009

11
ABSTRACT
This study encompasses the use of concept maps to investigate learners' conceptual
understanding of mathematics of a grade eight class in the predominantly Indian
suburb of Shallcross. The grade eight learners that were the participants of this study
were in the secondary school for the first time. They were in the middle of the Senior
Phase within the General Education and Training Phase of their schooling career.
This study is embedded in an action research methodology and is conducted from an
interpretivist paradigm. Operating on a mixed methods theory, concept maps
constructed by learners were analysed through the duration of the study. Towards the
end of the study learners completed a questionnaire. Based on certain responses in the
questionnaire and the analysis of the concept maps, six learners were then selected
and interviewed to probe learners' conceptual understanding of concept maps.
The results of the study reveal that most learners find concept maps enjoyable, fun
and a creative way to learn mathematics. Further analysis of the questionnaire
indicates that learners enjoy the social dynamics that group work provides and they
found that working together also enhances their understanding. Further analysis of
individual and group concept maps reveals that group work is effective in the use of
concept mapping.
The results of the study suggest that concept maps might be successfully used in
assessing learners' declarative knowledge. An important implication of this study is
that concept maps can be practically and effectively applied to a variety of outcomes
within the constraints of the classroom.

PREFACE
The work described in this thesis was carried out in the School of Science,
Mathematics and Technology Education, University of KwaZulu-Natal,
from July 2008 to February 2009 under the supervision ofDr V Mudaly
(Supervisor).
This study represents original work by the author and has not otherwi se
been submitted in any form for any degree or diploma to any tertiary
institution. Where use has been made of the work of others, it is duly
acknowledged in the text.
Urmilla Moodley
February 2009
111
IV
TABLE OF CONTENTS
ABSTRACT
PREFACE
TABLE OF CONTENTS
LIST OF FIGURES
LIST OF TABLES
ACKNOWLEDGEMENT
DEDICATION
CHAPTER 1 INTRODUCTION TO STUDY
1.1 Implications of Revised National Curriculum Statement
11
III
IV
VII
VIII
x
XI
2
1.2 Aims and Objectives of this Study 3
1.3 The Structure of the Study 5
CHAPTER 2 LITERATURE REVIEW 6
2.1 A Brief History of Concept Maps 6
2.2 Local Studies Using Concept Maps 9
2.3 Concept Maps as Graphic Organizers 10
2.4 Concept Maps as a Metalearning Tool 11
2.5 Student Success with Concept Maps 12
2.6 Concept Maps Reveal Alternate Conceptions 12
2.7 Concept Maps as a Tool to Determine Learners' Conceptual Development 13
2.8 Assessing Understanding with Concept Mapping
2.8.12.8.2
Assessment using concept-maps in the mathematics fieldIn the science field
v
14
1416
2.9 Advantages and Disadvantages of Concept Maps
2.10 Summary
18
24
CHAPTER 3 THEORETICAL AND CONCEPTUAL FRAMEWORKS 25
3.1 How Learners' Learn
3.2 Constructivism in the Use of Concept Maps
3.3 Conceptual Development
3.4 Conceptual Framework - Visual Literacy
3.5 Summary
CHAPTER 4 RESEARCH DESIGN AND METHODOLOGY
4.1 Research Design and Methodology
4.2 Data Collection Strategies4.2.1 Content analysis4.2.2 The questionnaire4.2.3 The interview
4.3 Ethical Issues
4.4 Summary
CHAPTER 5 PRESENTATION AND ANALYSIS OF FINDINGS
25
29
32
34
38
39
39
43444648
49
52
53
5.1 Training Learners to Construct Concept Maps 54
5.2 Analysis of Concept Maps 585.2.1 Assessing individual versus group concept maps for real numbers 605.2.2 Assessing concept maps of real numbers and data handling 68
5.3 The Questionnaire 785.3.1 Response to whether learners liked using concept maps during their
maths lessons and their reasons thereof 785.3 .2 Responses to when learners found concepts maps useful 805.3.3 Response to how concept maps affecting learners' learning when used
at the beginning of the section 81
VI
5.3.4 Responses to how the use of concept maps during classroom activitiesaffected Learners ' Learning 82
5.3.5 Responses to how the use of concept maps used at the end of a sectionaffected learners' learning 83
5.3.6 Responses to whether learners will use concept maps to revise 835.3.7 Responses to whether learners preferred concept map tests to traditional
tests 85
5.4 Summary 86
CHAPTER 6 DISCUSSION, LIMITATlONS AND RECOMMENDATIONS 88
6.1 Discussion 88
6.1.1 Use of concept maps to assess declarative knowledge 89
6.1.2 Group-work using concept maps 906.1.3 Affective factors 906.1.4 Promotes learning 916.1.5 Information for the teacher 926.1.6. Concept map assessments 93
6.2 Recommendations Of The Study 94
6.3 Limitations 95
6.4 Conclusion 95
REFERENCES 97
APPENDICES 104

vu
LIST OF FIGURES
Figure 4.1 : Skeleton concept maps drawn by educator and filled in by learners 41
Figure 5.2 : Skeleton concept map filled in by learners 56
Figure 5.3 : Dual bar graph representing individual and group mean scores 62
Figure 5.4 : Atish' s Individual concept map 64
Figure 5.5 : Atish's Group concept map 65
Figure 5.6 : Shival's Individual cocept map on real numbers 67
Figure 5.7: Shival's Group concept map on real numbers 68
Figure 5.8 : Dual bar graph representing mean scores for real numbe rs anddata handling 69
Figure 5.9 : Mitchlin's concept map on real numbers 72
Figure 5.10 : Mitchlin's concept map on data handling 73
Figure 5.11: Vukani's concept map on real numbers.. . . ... . .. .... .. ...... .. .. .... .. .... 74
Figure 5.12: Vukani's concept map data handling 74
Figure 5.13: Shahil 's concept map on real numbers 77
Figure 5.14: Shahil ' s concept map on data handling 77

VUl
LIST OF TABLES
Table 5.1: Modification ofNovak and Gowin's (1984) scoring guide 59
Table 5.2: Summary of Mean scores of individual concept maps and groupconcept maps 61
Table 5.3: Summary of mean scores for concept maps on real numbers anddata handling 69
Table 5.4: Aggregated responses for the usefulness of concept map 80
Table 5.5: Aggregated responses for use of concept maps at a beginning of asection 81
Table 5.6: Aggregated responses of concept maps during classroom activities 82
Table 5.7: Aggregated responses for the use of concept maps at the end of asection 83

ACKNOWLEDGEMENT
My heartfelt thanks are extended to
My supervisor, Dr V. Mudaly for your time, patience and guidance.
To my principal , Mr G. M. Govender
Thank you for your encouragement and support.
To grade 88 of 2008
I cannot thank you enough for being such enthusiastic participants.
To my dear friends at my school in Shallcross,
Sherri , Simmy, Rani , Veni, Jayshree, Vaneshree and Karunai
My sincerest gratitude for giving me your valuable time so generously
To my darling husband,
Who supported me unquestioningly throughout the writing of this thesis.
You were unwaveringly helpful despite the barrage of questions
I plagued you with.
I thank you for not abandoning me despite being busy
with your own thesis.
IX

To my loving sons, Jashlin and Drishend.
Thank you for helping me with the household chores
That afforded me the time to complete this thesis.
My unbounded gratitude also for your invaluable technical
assistance with the computer.
To my wonderful mum ,
Thank you for making me believe that I can achieve anything my heart desires.
You are a true inspiration.
x

DEDICATION
This thesis is dedicated to three truly special gentlemen in my life, my husband
and two adorable sons. Your respect and appreciation for knowledge motivates
me to no end.
Xl
1
CHAPTER 1
INTRODUCTION TO STUDY
The focus of this study is to assess the benefits of using the concept map method
for teaching and assessing learners' conceptual knowledge in mathematics of grade
eight learners at a previously disadvantaged school in Shallcross. Present practices in
mathematics classrooms concentrate on symbols, notations, rules and mechanical
procedures. This method does not promote effective acquisition, retention and
transferability of mathematical concepts. Often this results in great anxiety and apathy
in the learning of mathematics. I believe that novel and appealing methods that
promote conceptual development should be utilized. This is not just a personal belief
as the Revised National Curriculum Statement (RNCS) encompasses such thinking
(2003). Past studies reveal that concept mapping is a visually appealing method to
both teach and develop learners' conceptual knowledge.
I love teaching mathematics and I want my learners to love learning
mathematics. I therefore decided to conduct a study to determine whether an alternate
method of teaching and learning would help learners understand mathematics better.
Hence my research is to explore learners' conceptual development using concept
maps in a grade eight class. My interest in this field was sparked by a lecture on visual
literacy delivered by Dr Mudaly (2007). He exposed us to the various ways of using
visual representations to engage the interest of learners in mathematics classes.
Concept mapping provides a non-competitive way to illustrate conceptual
understanding and meaningful learning as opposed to the rote learning of procedural
knowledge.

1.1 IMPLICATIONS OF REVISED NATIONAL CURRICULUM
STATEMENT
After the first democratic elections in 1994 reform initiatives were launched at
schools. One of these reform initiatives was the Outcomes Based Education (OBE).
OBE now forms the foundation of the curriculum in South Africa. According to the
Revised National Curriculum Statement (2003), OBE strives to make all learners
reach their full potential by adopting a learner-centred, activity-based approach to
teaching. This translates to a constructivist approach to teaching and learning where
understanding is the foundation for all learning.
The changing milieu of South African Education demands an in-depth look at
instructional practices in the classroom. Although it has been almost fourteen years
since the introduction of OBE and the first cohort of matriculants have completed
their exams in 2008, many educators are yet to embrace the principles underpinning
OBE, where group work activities are encouraged, research tasks implemented and
fun-filled activities that engage learners in meaningful learning are expected. The
previous curriculum promoted rote learning as opposed to meaningful learning.
According to Ausubel, Novak and Hanesian (1968) to learn meaningfully, learners
must relate new knowledge to relevant concepts and propositions they already know,
whereas in rote learning new knowledge may be acquired simply by verbatim
memorisation and incorporated into a learners' knowledge structure without
interacting with the previous knowledge that already exists (Novak & Canas, 2006) .
Novak (2002) argues that rote learning has two negative consequences. First,
knowledge learnt by rote is easily forgotten, unless rehearsed frequently. Second, the
knowledge or cognitive structure of the learner is not enhanced or modified to clear
up ideas that are misunderstood. Novak (2002) explains further that rote learning
2

3
allows misconceptions to persist and as a result knowledge learnt has little or no
potential for use in further learning.
Novak and Canas (2006) believe that the concept map is a powerful tool that
can be used to facilitate meaningful learning. They assert that concept maps serve as a
kind of template or scaffold to help organise conceptual knowledge in small units of
concepts that are build on by using linking words to join other concepts. Many
teachers and learners see the benefit of this simple tool to facilitate meaningful
learning that not only allows the creation of powerful knowledge frameworks that
represents both pre-existing knowledge and new knowledge but also aids in the
retention of knowledge (Novak, 2002).
1.2 AIMS AND OBJECTIVES OF THIS STUDY
The purpose of this study was to investigate learners' conceptual development in
mathematics in a grade eight class. To achieve this, this study focussed on the
question: Can concept maps be used to explore learners' conceptual development in
mathematics? To fulfil this intention, formulated the following objectives to guide this
study:
1. What are the advantages and disadvantages of using concept maps to
teach mathematics? - A literature perspective.
2. Can concept maps facilitate group-work?
3. Are concept maps an effective learning tool for mathematics for grade eight
learners?
4. Can concept maps provide valid information for the teacher about learners'
knowledge of mathematical concepts?
5. How can concept maps assessments be practically applied to classroom
4
situations?
6. Do concept maps develop grade eight learners' conceptual understanding
through the comparison of successive concept maps ?
Since the purpose of this study is to find solutions to a social challenge, in particular a
teaching method that will help learners' understanding of mathematical concepts, the
study is embedded in an action research methodology. Grade eight learners were
chosen to be part of the study as they are young learners and I believe that of them
most probably had not become comfortable with any particular learning strategy as
yet.
My study embraced the interpretivist paradigm since it was characterized by
my concern to understand from within , learners' conceptual change of mathematical
knowledge. A mixed method approach was utilized since it contains elements of both
qualitative and quantitative methods to explore learners understanding using concept
maps. In this study learners were involved in designing concept maps , which were
then scored against a set of criteria. The content of concept maps were also
qualitatively analysed. This was followed by a short survey in the form of a
questionnaire administered to the whole class. The questionnaire (quantitative part)
was designed to get a general idea of how learners felt about concept maps and
whether they were comfortable using it in mathematics. A sample of six participants
was thereafter chosen according to a set criterion, for the semi-structured interview
(qualitative part). The purpose of the interview was to explore an in depth description
oflearners' perceptions regarding the use of concept maps.
Furthermore a comparison of concept maps done at the beginning and end of
the study was examined in terms of the structural complexity to ascertain learners '
5
conceptual development. A comparison of individual and group designed concept
maps was also examined to determine the cognitive and social benefits of group work.
1.3 THE STRUCTURE OF THE STUDY
The introduction served to acquaint the reader with the motivation, background
and data collection techniques of this study. The literature review in chapter two
examines past and current trends in the use of concept maps both locally and abroad.
It also highlights gaps and contradictions in past research that my study will
endeavour to clarify. The theoretical and conceptual framework from which concept
mapping is derived is discussed in chapter three . Chapter four discusses the
underlying philosophical assumptions, the selection of participants, the data
producing techniques and the type of data analysis. The qualitative and quantitative
analysis of concept maps , analysis of the questionnaire and interview form the basis
of chapter five. The final chapter provides a further discussion of the analysis;
recommendations for the classroom practitioner and the limitations of this study
conclude this thesis.

6
CHAPTER 2
LITERATURE REVIEW
The intention of this study is determine learners' conceptual development
through the use of concept maps; this chapter begins with a brief history and
development of concept maps as a tool for examining conceptual development. This
is followed by a report of the extensive research done in the use of concept maps
firstly, as a graphic organiser, secondly as a tool for teaching and learning, and finally
as an evaluative tool in mathematics. I will also discuss the use of individually and co
operatively designed concept maps. I will end this chapter with the benefits and
limitations of concept maps drawing from the vast literature available on concept
maps.
2.1 A BRIEF HISTORY OF CONCEPT MAPS
Concept mapping as a research and an evaluation tool in science education is
almost 35 years old. This technique had its origin at Cornell University. Under the
leadership ofNovak and his graduate students concept maps was used as a vehicle to
explore meaningful learning acquired through-tutorial instruction in elementary
school science (Novak, 1977). Since then concept maps has become a widely used
strategy for assessing the structural complexity and propositional validity of
knowledge in science-related fields (Novak & Gowin, 1984). A concept map is a
visual technique that employs a two dimensional, hierarchical, node-link
representation that depicts the major concepts found in a particular domain of
knowledge. In a concept map, concepts are enclosed in an oval or any other shape that

7
is appropriate to that learning domain. Lines are drawn between concepts and the
linking phrase along the line indicates how the concepts are related to each other. This
is known as a proposition. Novak and Gowin (1984) believe that concept maps is an
overt representation of a learners internal knowledge structure and at the same time
acknowledge the difficulty ofjudging the degree of correspondence between the map
and actual internal representation. Recent studies indicate otherwise, see 'Theoretical
and Conceptual Framework' under sub-section 3.3.
Using Ausubel's theory (Ausubel, Novak & Hanesian, 1968) that understanding
occurs through the linking of new knowledge to existing knowledge, Novak (1977)
proposes a hierarchical representation of concept maps, where the most general idea
of the topic is at the top of the concept map and progresses to more specific concepts
and ends with examples which are not enclosed in some shape as they are not
concepts (Novak & Gowin, 1984). The map also includes cross-links such that
relations between sub-branches can be identified. Concept maps are underpinned by
major psychological theories of prior learning, assumption, progressive
differentiation, cognitive bridging and integrative reconciliation which is designed to
help learners reflect upon their own experiences and to construct new and more
powerful meanings to knowledge (Ausubel & Robinson, 1969). It is important that
learners construct the concept maps as the complexity of the knowledge network
directly relates to the degree of learners understanding and linking words reveal
whether or not students correctly associate the concepts.
Although Novak and Gowin (1984) adhere strictly to hierarchical concept maps,
there are other researchers that hold alternate views. The associationist theory
provided a basis for cognitive structure where concepts are represented as nodes,
however the linking lines were unlabelled (Deese, 1965). This led to semantic

8
networks where the concepts were linked by labelled lines (Ruiz-Prirno & Shavelson,
1996). The associationist network theory like concept maps has it theoretical
underpinnings in Ausubel 's theory. The important difference is that semantic
networks do not emphasise the hierarchical structure of networks. White and
Gunstone (1993) argue that whether or not a concept map is hierarchical depends on
the structure of the subject material. Buzan and Buzan (2003) propose another
approach to learning known as mind mapping. The mind map has a central image
from which main themes of the subject radiate as branches. Branches comprise of key
words or images on an associated line. Topics of lesser importance are attached to
higher-level branches. Based on this theoretical approach the concept maps used in
this study are networks with concept nodes linked by lines that are labelled indicating
the relationship between the concepts and are not necessarily hierarchical.
A review of the literature reveals that concept maps has been extensively used to
describe a variety of outcomes. A primer study by Novak employed concept maps as
a meta-Iearning tool. This means, "to help learners how to learn" (Novak, 1984, p8).
This study showed that concept maps serves as an effective means of empowering
students through knowledge of their own learning. A significant number of studies
have examined the use of concept maps in science learning Novak (1990) , Rice, Ryan
and Samson (1998) , Ruiz-Primo (1996) , Wandersee (1990) , Markow (1998) . Many
studies have also been conducted in the biology field too, Wallace and Mintzes (1990)
and Markham, Mintzes and Jones (1994) . These two fields have based their studies on
using concept maps as a heuristic in promoting meaningful learning in a variety of
instructional settings. In mathematics, concept maps has been used abroad as a
research tool to understand learners conceptual change in functions (Williams, 2002).
Karoline Afamasaga-Fuata'i (2004) tracked the conceptual development of six

9
learners whilst learning and solving problems for selected new topics, Ozdemir (2005)
analyzed concept maps as an assessment tool for mathematics. Leou and Liu (2004)
used concept maps to develop an educator's mathematical professional knowledge
through a period of eight years.
2.2 LOCAL STUDIES USING CONCEPT MAPS
Locally Mwakependa and Adler (2003) used concept maps as a tool to explore
first-year university students' understanding of key concepts in the South African
secondary school mathematics curriculum. After concise instruction in concept map
construction students were expected to construct a map of 16 concepts. These
concepts were selected because they cut across the algebraic, numerical, graphical and
geometric settings of the mathematics school curriculum. The aim of the study was to
determine whether students could link concepts across topics that are typically
fragmented in the curriculum. Thereafter interviews were conducted. First, to
establish a link between concepts, which students did not include in their maps, and
second, to probe students thinking, to clarify meanings oflinks displayed in students'
concept maps. Mwakapenda (2003) asserts that since students showed uncertainty
about the links they used, may be an indication that learners understood the concepts
whilst they were engaging with these topics at school but could not recall them after
school. He justifies these findings by stating that many classroom practitioners teach
mathematics as an unrelated body of facts and algorithms. My study delves into a
conceptual development of learners in mathematics using concept maps. However,
my study is classroom based.
Qhobela, Rollnick and Stanton (2004) conducted a four-stage intervention in the
Science field at Lerotholi Polytech in Lesotho. The students that participated in this

10
study were enrolled in a bridging programme aimed to fill in gaps between secondary
level and tertiary level science. Here I reviewed the first stage of this intervention,
which the researchers called the Conceptual Foundation Phase. The purpose of this
programme was to get learners to talk or write and reach a consensus about a
particular concept. Learners were given a concept map and they had to discuss the
relationships between concepts, whether they were valid or not and finally make
improvements on the maps . The findings from this study concur with that of
Mwakependa and Adler's (2003) observation that concept maps were largely linear
and have virtually no cross-links. However this study benefited the students in other
ways. One, students were able to discuss and reach agreement about concepts and
their relationship with other concepts. Two, rehearsing knowledge from secondary
school allows learners to share meanings of scientific concepts. The literature does
not specify the time spent on the technicalities of constructing a concept map. All the
literature on concept maps point out that concept maps are different from other
activities and learners have to be taught how to draw them. If they were not given this
instruction on concept map construction then these researchers should not expect
elaborately networked concept maps that include cross-links.
2.3 CONCEPT MAPS AS GRAPHIC ORGANIZERS
According to studies conducted by Willerman and Harg (1991) concept maps
can also provide the classroom teacher with a meaningful and practical structure for
using graphic organizers in their class. Graphic organizers may be defined as an
instructional unit that is used before direct instruction, or before a new topic is
introduced to assist the educator when introducing the more challenging topics
(Hendron, 2007; Willerman & Harg, 1991). The effectiveness of using concept maps

11
as graphic organizers is that the concept map developed by the teacher gives the
learners greater direction for learning concepts and facts as compared to teacher talk
objectives in the unit (Willerman & Harg, 1991). Moreover concept maps constructed
by the educator will serve to familiarise learners with the techniques of constructing
concept maps hence building learners' confidence in the use of concept maps.
2.4 CONCEPT MAPS AS A METALEARNING TOOL
Another aim of my study is to determine whether concept maps are effective
learning tools for mathematics in a grade eight class. I will now review the literature
of concept maps used in this area. Novak and Gowin's (1984) primer study was aimed
at helping students ' learn how to learn'. They claim that as educators it is our
responsibility to organize instructional material in a manner that is easy to learn.
Novak (1990) found that concept mapping together with other metacognitive tools
played a key role in helping students take charge of their own meaning making.
Novak and Gowin (1984) claim that for too long educational theory has been
influenced by behaviourism - a theory that emphasizes rote learning and verbatim
instruction.
These authors suggest an alternate view to learning, one that is synonymous
with meaningful learning where learners make sense of educative materials and
discover knowledge for themselves. The authors discuss two principal educational
tools to bring about meaningful learning- concept maps and Vee diagrams. They
argue that concept maps and Vee diagrams help students to construct new and
powerful meanings through classroom strategies that invoke meaningful learning.

12
2.5 STUDENT SUCCESS WITH CONCEPT MAPS
Of interest to me is the anxiety associated with the learning of mathematics and
the associated apathetic attitude of learners towards mathematics. According to White
and Gunstone (1993) learners rarely view concept map activities as competitive
threats, although the intellectual demand cannot be denied. They add that no map is so
poorly done that it can be preordained as completely incorrect. Furthermore no two
maps are the same or perceptibly better than another. Hence the anxiety associated
with traditional tests is rare during concept map activities. White and Gunstone (1993)
therefore claim that the friendly nature of the concept map to probe understanding is a
preferable tool to use in the teaching of mathematics. A study to support the non
threatening nature of concept maps was conducted in Nigeria by Jegede, Alaiyemola
and Okebukola (1990). Their study had two groups; one group received conventional
lecture-type instruction whilst the other group used concept map tasks. An important
aspect of their research focussed on students' anxiety toward science. They used the
Zuckerman's Affect Adjective Checklist to determine students ' levels of anxiety and
found that students using concept mapping displayed a highly significant reduction in
anxiety levels.
2.6 CONCEPT MAPS REVEAL ALTERNATE CONCEPTIONS
Trowbridge and Wandersee (1998) report that concept maps are useful in
identifying misconceptions. They explain that the presence of incorrect linkages that
result in invalid propositions is evidence of misconceptions. Moreover inclusion of
irrelevant concepts or concepts that are not related to the super ordinate concept is
another indication of misconceptions. Missing concepts further signify gaps in

13
learners ' knowledge structure. Hence White and Gunstone (1993) assert that since
concept maps elicit the relations learners see between concepts, they therefore reveal
the degree of understanding of individual concepts as well as the whole topic.
Concept maps for that reason serve as a powerful diagnostic tool that assist s the
teacher in making judgements about their method of instruction. Instructional
techniques can be revisited to fill in the gaps where concepts have not been fully
developed and to rectify misconceptions.
2.7 CONCEPT MAPS AS A TOOL TO DETERMINE LEARNERS'
CONCEPTUAL DEVELOPMENT
Not only does concept mapping foster active engagement of learners, but is also
an invaluable tool to measure changes in knowledge structure (Novak, 2002). Carey
(1986) recommends the comparing of successive concept maps in determining
knowledge acquisition. Wallace and Mintzes (1990) used concept maps to explore
conceptual change in biology. There findings reveal that concept mapping offers a
valid and useful mechanism for looking at changes in learners' cognitive structure.
Novak (1990) conducted a 12-year long longitudinal study, which demonstrates that
concept maps can be used effectively in analysing conceptual change over long
periods of time. Williams (1998) investigated the conceptual knowledge held by
college students in the domain of functions . Comparison of expert and novice concept
maps lends credence to the conclusion that concept maps do represent to a degree,
one's conceptual knowledge.

14
2.8 ASSESSING UNDERSTANDING WITH CONCEPT MAPPING
As an assessment tool , concept maps can be thought of as a procedure to
measure the structure of a students ' declarative knowledge (Ruiz-Primo & Shavelson,
1996; Royer, Cisero, & Carlo, 1993). The literature indicates that any particular age
group of learners can use concept maps. Research reports indicate that learners from
primary school are capable of constructing and explaining concept maps (Novak &
Gowin, 1984; Novak, 1990; White & Gunstone, 1993) . Researchers have also
completed successful studies using concept maps with middle school (similar to our
GET band) learners (Novak & Gowin, 1984; White & Gunstone, 1993; Willerman &
Harg, 1991) . There is also evidence that learners of various ability levels can become
good concept map drawers. Previous research illustrates that concept mapping can be
easily learnt and applied to large groups without any difficulty hence making it ideal
for classroom settings (Ruiz-Primo & Shavelson, 1996) . White and Gunstone (1993)
suggest that concept maps not be scored whilst Novak and Gowin (1984) provide an
elaborate scoring guide. White and Gunstone (1993) advise that the choice to score or
not to score depends on the "purpose for which the scores are needed" (p39).
2.8.1 As sessment using Concept -ma ps in the mathematics field
Relatively few studies have investigated the use of concept maps as an alternate
method of teaching and assessing of mathematics at secondary school level and even
fewer have been conducted in the South African setting. Willerman and Harg (1991)
claim that the few studies that have been conducted in secondary schools report
contradictory findings. Baralos (c2005) conducted a study of grade 11 mathematics
learners and found that there was no strong correlation between written tests and
concept maps. He concluded that concept mapping is an essential supplement of
15
conventional tests, which reveals a different view of students' cognitive structures. It
is surprising that so few studies have been conducted in mathematics since Wallace
and Mintzes (1990) suggest that concept maps may be used to determine learner's
knowledge acquisition by comparing successive concept maps. As the learner
becomes more adept at constructing concept maps the researcher will be able to see
how learners knowledge becomes restructured. I plan to compare learners concept
maps done at the beginning of the study to ones done towards the latter part of the
study to see whether learners have developed as concept mappers and more
importantly to see whether their cognitive structures have developed or not.
Baroody and Bartels (2001) declare that concept mapping is an invaluable
tool for assessing meaningful learning as it provides a concrete record of how
concepts are organized and inter-related within a learners' cognitive structure. They
believe that the number of linking lines in a learners concept map can help one
estimate a learners' depth of understanding. Furthermore concepts and examples
reveal a complete and flexible knowledge structure. A simple example is illustrated,
when learners were asked to draw linking lines specifying the relations among the
following concepts: (a). decimals, (b). fractions, and (c). parts ofa whole. One
learner made several linking lines between decimals and fractions, which indicates a
deeper understanding than another learner that drew just one linking line between the
same two concepts. However a third learner reveals minimum understanding as no
linking lines were drawn.
Baroody and Bartels (200 I) also assert that accurate understanding is
demonstrated by logical placement oflinking lines between concepts whilst specific
and descriptive linking phrases are strong indications of accurate and profound
16
understanding of concepts. They add that the 'specificity' of the linking phrase is a
sound indication of how well a learner understands a concept.
Pedro, Eduardo and Ramon (2003) investigated the possibilities of using
concept maps to assess learners' conceptual knowledge. These authors concluded
from their study that concept maps helps identify misconceptions, misunderstandings
and variable meanings, which allows the teacher to promote learning of students.
They also found that concept maps are a good indication of the level of competence of
a learner since deep meta-cognition level is represented by meaningful structures and
sub-structures of the concept map. Lastly, they found that learners do more maths
whilst pondering to find ways of how concepts are related to one another than they do
in other mathematics activities.
2.8 .2 In the Science Field
In the science field I review four articles in chronological order. Markham,
Mintzes and Jones (1994) did a study that sought evidence of the concurrent validity
of concept mapping as a research and evaluative tool in the science field. Thereafter
Ruiz-Primo and Shavelson (1996) examined the problems and issues in the use of
concept maps in science assessment. This was followed by a study by Rice, Ryan and
Samson (1998) that focussed on using concept maps to assess student learning in the
classroom where the emphasis was whether it was necessary for different methods to
compete. Lastly I review a study by McClure, Sonak and Suen (1999) who looked at
the reliability, validity and logistical practicality of using concept maps as an
assessment of classroom learning.
Markham et al. (1994) conducted a study of advanced college biology majors
and beginning non-majors students. These students had to construct a concept map in
17
the domain of mammals. Maps were scored using a modified version ofNovak's
(1984) scoring guide . Points were given for number of concepts, relationships,
branchings, hierarchies, cross-links and examples found in each map . The
propositions generated by students were then analysed. As expected the experienced
students demonstrated a sound knowledge of mammals; as they offered twice as many
scientifically acceptable propo sitions than the novices. The concept maps of the
majors differed substantially from the non-majors in the structural complexity and
organisational patterns of their cognitive knowledge of mammals. The results
revealed that the majors scored significantly higher in all six categories. Markham et
al. (1994) claim that these findings suggest that the concept map provides a
theoretically powerful and psychometrically sound tool for assessing conceptual
change in experimental and classroom settings.
Ruiz-Primo and Shavelson (1996) reviewed various studies pertaining to: (a).
the task of concept mapping, (b). the type of response formats and, (c). the
development of scoring guides. They described the task of concept mapping. The
literature on concept maps reveals that there is a vast array of concept map
techniques, which in turn produce different representations and scores. The type of
technique employed should determine the type of concept map used. However Ruiz
Primo and Shavelson (1996) propose for further study that a theory be developed to
guide the structural representation and the number of possible techniques to a
manageable set.
Rice et al. (1998) explored the use of concept maps to assess learning in science
classrooms. They compared concept map scores to multiple-choice test scores.
Concept maps were scored on the correctness of propositions. High correlations
between the concept map scores and multiple-choice scores present strong evidence
18
of the content validity of the map scores. Furthermore correlations between map
scores and state criterion-referenced and national norm-referenced standardized rests
were indicators of high concurrent validity.
McClure et al. (1999) conducted a study to determine the reliability, validity and
logistic practicality of using concept maps as an assessment technique in the
classroom environment. Their study entailed scoring the same concept maps by three
different methods. One used the holistic scoring method where based on the overall
judgement of the map learners were allocated a score of one to ten. The second
method employed a relational scoring method. This technique meant identifying
separate propositions and a score of one to three was awarded depending on the
correctness of the scoring guide. The final score for the map was found by adding up
the individual scores. The last method was termed the structural scoring guide and
points were awarded for correct propositions, hierarchical levels , cross -links and
examples. This study found that the reliability scores for the relational scoring guide
together with a criterion-referenced map were the highest. The researchers believed
that since the raters were not familiar with concept maps, they found this method the
easiest use to assess the map. The proposition is the least complex structure on a
concept map and analysis using this technique is probably least taxing on a rater of
the map. However the authors hypothesise that as the educator becomes more familiar
with concept scoring, the other methods may become easier to implement.
2.9 ADVANTAGES AND DISADVANTAGES OF CONCEPT MAPS
According to Rice et aI. (1998) concept maps produced by learners reveal a
wealth of information about their understanding of concepts. These insights go
beyond the right and wrong information produced by scoring multi-choice questions.

19
Gaps in knowledge structure and misconceptions can be easily recognised, however
this is not readily seen in conventional tests since they are aimed at computational
procedures. Even whilst awarding scores to concept maps, researchers easily
developed a qualitative sense of where instruction has been successful and where it
has been unsuccessful. They qualify that although confusion between concepts can be
recognised in multiple-choice questions upon careful analysis , educators do not have
the time nor the inclination to carry out such analysis. However with concept map
assessments, failure in instruction is easily recognised and can be subsequently
remedied .
Baroody and Bartels (2001) report similar benefits of concept maps for
diagnosis and instructional feedback are reported by. They assert that by examining
learners ' concept maps, the educators can determine the extent oflearners ' conceptual
understanding. This information may be used to make the necessary adjustments to
instruction and to judge learners' progress.
Goldsmith and Johnson (1990) claim that commonly used evaluation techniques
are one-dimensional and knowledge acquisition is expressed by the "percent correct "
in tests based on recall of terms . The problem with these assessment tasks is that they
do not show the understanding of relationships among the different concepts. What's
more is the consensus between cognitive scientists and psychologists that structural
representations (such as concept maps) capture the configural property of knowledge
better than any other presently available technique (Markham et aI., 1994). Goldsmith
and Johnson (1990) add that compared to essay tests, concept map assessments are
less time consuming and demanding of expertise.
Whether an educator will implement a new technique depends on its educational
value . According to McClure et al. (1999) the value of a technique is expressed as the
20
relationship between potential costs and the educational benefits associated with the
technique. With regards to concept maps the cost factor is the time required to train
learners in the mapping technique, the time required to complete a concept map task
and the time required to rate a concept map. Additionally learners' skills in
developing concept maps will affect the quality of their concept map artefacts and
will affect the reliability and validity of the scores of the assessment. It is also
assumed that learners and educators are both comfortable and familiar with common
assessment tasks. However this may not be the case with concept map tasks .
McClure et al. (1999) conducted a study that addressed these issues. Their
findings suggest that it is possible to train learners using a direct instruction method in
a 90-minute session. In these sessions most of the time is devoted to guided practice.
They also found that the time required to produce a relatively complex map took
approximately twenty-nine minutes. This fits easily into a normal class period.
McClure et a1. (1999) results reveal that the cost in terms of time is comparable to a
traditional pencil and paper examination. The final time consideration is the
evaluation of concept maps by educators. These researchers found that scoring of
concept maps can take from one to five minutes, depending on the scoring guide
selected. They concluded that these times are comparable with objective assessments
such as short answer tests but concept maps are similar in degree to open-ended
responses such as essay exams. The assertion is that the comparison between times to
score essay type assessment and concept map assessments favour concept mapping.
Many researchers indicate the time factor as a disadvantage for the use of concept
maps within the classroom. However this study is a clear indication that the
educational value of concept maps far outweighs the time factor and that the time for
scoring is comparable to essay type questions.

21
Baroody and Bartels (2001) pointed out that concept map assessment plays
an integral part of instruction. They believe that even when concept maps are used for
instructional purposes, observing learners build concept maps provides invaluable
diagnostic information and instructional feedback for the educator. Observing learners
allows the educator to see the gaps in learners' knowledge structure and helps the
educator gain information about the success of instruction. This allows the educator to
make the required modifications to instruction to fill in the gaps of learners'
knowledge. They report that concept map assessments can also be used to expand
learners ' knowledge. Similar findings are reported by (White & Gunstone, 1993).
They found that the value of concept maps as a probe lies not only in the end product,
but also in the process that can be observed while they are being constructed.
Reflection of what the maps reveal about teaching can cause reconsideration of the
teaching style so that learners' knowledge converges to that of the educators.
White and Gunstone (1993) found that the construction of concept maps
during group work encourages lively discussion and hence promotes meaningful
learning. They found that learners that are generally shy also participate freely in the
co-operative and unthreatening activity of building concept maps. They believe that
this is probably because learners do not see concept maps as a competitive threat since
with concept maps there are no right or wrong answers. Boxtel , Linden , Roelofs and
Erkens (2002) also suggest that concept map activities provide opportunities for
learner interaction, thus the more learners talk about science concepts and the more
elaborate the talk, the higher the learning outcomes.
Edmondson (1995) claim that concept mapping is a valuable tool for
developing integrated curriculum courses. This study used concept maps to draw the
inter-relationship between the veterinary curriculum, specific courses and case-based
22
studies. Zeilik, Schau, Hall, Teague and Bisard (1997) makes similar assertions about
the advantages of concept maps. They believe that concept maps shift the emphasis
from inert, static knowledge to contextually embedded knowledge, from isolated facts
to theoretical frameworks of related concepts.
Willerman and Harg (1991) found that concept maps used as graphic organisers
can significantly improve science achievement. A concept map designed by the
educator and used as a graphic designer presents new content information in a
visually appealing, logical and organised manner. Since a concept map constructed by
an educator is complete and accurate it is effective in anchoring the new information
in the learners' cognitive structure. They add that concept maps developed by the
educator provides learners with greater direction for learning of concepts and facts.
Zeilik et al. (1997) also believes that concept maps used as graphic organisers allow
learners to focus on the "big picture" enabling them to devote more of their time to
conceptual understanding rather than rote learning.
Zeilik et al. (1997) offers the following disadvantages of concept maps . He
reports that comparison of concept maps to a criterion-referenced map is difficult
because concept maps reveal the idiosyncratic way that learners view content
knowledge. As a result evaluation can become time consuming for the instructor,
especially in large classes. However he explains that this can be circumvented if a
particular variation, such as select and fill in the blanks is adopted. Another
disadvantage offered by Zeilik et al. (1997) is that learners that have developed a
strong competence for rote learning sometimes find concept mapping intimidating.
Moreover concept maps is a demanding cognitive task that requires training before it
is implemented in the classroom (Zeilik et aI., 1997). White and Gunstone (1993) also
caution against the overuse of concept maps. They explain that concept maps involves

23
intellectual effort, and if they are used too often learners will produce superficial maps
that will be of no value to them or the educator.
For learners to fully appreciate the educational value of concept maps the timing
of when it is introduced to them is vital. Studies conducted by Santhanam, Leach and
Dawson (1998) found that first year students at university showed no evidence of the
long-term benefits of concept maps . It appears that most students at this stage of their
academic careers have already nurtured reliable approaches for learning. Due to the
outcome of this study, these researchers suggest that concept maps be introduced in
high school or even earlier. Hence, I decided to use grade eight learners for my study
as they were the youngest learners at my school and had probably not found a
particular learning strategy that they preferred as yet.
A further advantage of concept maps is its use in planning for lessons.
According to White and Gunstone (1993) it is helpful to the teacher to do a concept
map in order to determine the progression of presentation of ideas and to identify
relations that are to be highlighted. When the educator draws a concept map only then
does it become apparent how concepts should be taught. Another study by Leou and
Liu (2004) indicates that an educator's entire belief system about teaching and
learning changed due to the use of concept maps in her planning and instruction of
mathematics lessons. Before the study she believed that learners should do as many
exercises as possible and she inundated them with copious notes . However since her
study her learners have become active participants who discuss their concept maps
with their peers. The educator has moved from the deliverer of knowledge to
facilitator of knowledge. The educator herself claims that she is more effective and
confident in the classroom.

2.10 SUMMARY
This chapter discussed, from a literature perspective the various constructs for
which concept maps can be used . Concept maps have been successfully used as
graphic organizers, as a tool to stimulate lively group discussions and to assess
learners' conceptual development through the comparison of successive concept
maps. Concept maps were also used by educators to design lessons and was
effectively used to design the curriculum in the medical field. This chapter finally
ended with the advantages and disadvantages of using concept maps.
24

25
CHAPTER 3
THEORETICAL AND CONCEPTUAL FRAMEWORKS
Teachers are entrusted with the job of educating the nation. It is commonly
accepted that educators are expected to be relative experts in the understanding of the
human learning process. The more we learn about ways to improve learning the more
efficient and effective our teaching becomes. This chapter discusses the
epistemological approach of concept maps, as well as the conceptual theories that
frames this study. Here I show how concept maps can be used effectively within the
constructs of constructivism. This chapter also discusses the concepts that frame this
study, namely 'visual literacy' and 'visual learning' . The literature reflects that
concept maps are visual tools that appeal to learners who appreciate visual
representation when learning.
3.1 HOW LEARNERS' LEARN
According to Howe (1991) there are two factors that directly influence a child's
learning. He believes that the first category consists of activities that the child actually
engages in, whilst the second category that influences learning depend on what the
learner already knows. Existing knowledge acquired through past experiences makes
it possible for the learner to understand new information and events.
Indirect influences on learning include the effects of attention, boredom, interest
and motivation. Perceptual disorders such, as deafness, family background and social
class are also factors that indirectly affect learning . Another influence of learning is
teaching. However, the acquisition of knowledge depends on the learner, hence the

26
ultimate aim of education should be for learners to learn how to learn. According to
Howe (1991) no educational objective is more important than teaching learners how
to learn and how to function as autonomous and independent learners. These qualities
that should be imbued in learners are echoed in the Revised National Curriculum
Statement (2003). It states that learners who emerge from the Further Education and
Training (FET) band should be able to think logically , analytically and holistically.
The RNCS(2003) document further emphasizes that the curriculum should aim to
train learners to transfer skills from familiar to unfamiliar situations; hence
developing the intellectual, social , emotional , spiritual and physical needs of learners.
The earliest teaching of mathematics emphasized the skill of calculation. For
almost a century the behaviourists believed that learning was synonymous with a
change in behaviour (Novak & Gowin, 1984). Thorndike (1920) was of the view that
drill and practice were essential for the mastery of mathematical techniques (cited in
Howe, 1991). Educators such as Brownwell (1992) cautioned against rote learning.
Traften (1975) also made attempts to bring relevance to computation by relating it to
everyday life occurrences such as grocery bills and buying of yards of material (cited
in Howe, 1991).
In the early 1960's schools in the United States of America were under pressure
to produce learners whose mathematical sophistication matched that of the space age.
These reform initiatives meant the integrating of mathematical knowledge with other
disciplines and learning of mathematics that was relevant and meaningful and not just
a body of unrelated facts and procedures. The advocates of this type of mathematical
learning emphasized a conceptual rather than a computational approach to instruction
(Resnick & Ford, 1981) .
This was the onset of research into how learners make meaning of mathematics.

27
The field of cognitive psychology was born - the study into humans ' cognitive
processes and suggestions of how mathematical instruction might be made
meaningful by responding to specific intellectual capabilities of learners (Resnick &
Ford, 1981). Piaget (1941 ; 1952) an American psychologist was of the view that
learning was based on the psychological development of children. Within his theory,
learning is based on discovery methods (Resnick & Ford, 1981). They believed that
knowledge is actively created or invented by the individual, and not passively
received from the environment (Clements & Battista, 1990).
Bruner did extensive work in the 1960s on the cognitive process. One part of
that work was concept development (Howe, 1991). He asserted that for students to
make meaning of instruction, teaching should fill in the gaps of knowledge that
learners have and it should be based on experiences and contexts that are familiar to
the child's learning (Huitt, 2003). This meant that classroom instruction should move
from concrete and physical to the realm of mental imagery. He believed that any idea
or concept could be presented in a simple enough manner so that any child could
understand it. Concept mapping is a visually appealing tool that is simple to employ
and lends creativity to mathematics and other disciplines (Edmondson, 1995). It helps
educators to see the gaps in learners' knowledge and adjust teaching to fill in these
gaps and other misconceptions that the concept maps may reveal (Zeilik et al., 1997).
Lev Vygotsky (1896-1934) a Russian psychologist criticized Piaget's emphasis
on individual idiosyncratic construction of meaning. He argued for the social aspects
of learning, which included linguistic factors, cultural factors , interpersonal
interactions such as peer relations, and the role of the educator (Ernest, 1994).
Vygotsky used this background to develop a model called The Social Cognition
Learning Model , which asserts that culture is a key determinant of individual
28
development (Doolittle, 1997). Culture has a two-fold effect on a child's intellectual
development. First , through culture a child acquires much of his/her content
knowledge. Second, culture provides the means of thinking which Vygotsky calls the
tools of intellectual development (Vygotsky, 1978). Hence it can be seen that the
curriculum should be designed to emphasize interaction between learners and learning
tasks (Doolittle, 1997). Vygotsky believes that with appropriate adult help, children
can perform tasks they are incapable of completing on their own. This can be
achieved through scaffolding (part of Social Cognition Model). The term Zone of
Proximal Development may be seen as comfort zones of learning for a child. What a
child can do by himself/herself is their level of actual development and what they can
do with help is their level of potential development. Vygotsky believes that through
the assistance of an adult a child can develop within this zone (Vygotsky, 1978).
Piaget contrarily argued that cognitive growth occurs through stages that
correspond to a particular age (Charles Stuart University, 2000). His theory posits that
each individual constructs their own understanding of the world and is primarily
responsible for the development of their own intelligence as a result of experience
(Matthews, 2003). The contrasting views between Piaget and Vygotsky lies within
teacher involvement. On one hand the Piagetian view suggests that teacher
involvement may inhibit learning whilst on the other hand the Vygotskian approach of
scaffolding and guided discovery suggest that a guiding hand by the educator is
essential for effective learning (McMahon, c1999).

29
3.2 CONSTRUCTIVISM IN THE USE OF CONCEPT MAPS
Using this brief history of how learning occurs as a backdrop, the theoretical
framework, from which concept mapping is derived, is based on a constructivist
epistemology. An alternative to behaviourist learning theory that focuses on the
presentation of information and its transfer from the teacher to the learner, the
constructivist approach encompasses practices are strategies that enhance education
by helping learners to learn about learning and about the nature and construction of
knowledge which will serve to liberate and empower learners in the classroom. Novak
and Gowin (1984) propose strategies that help the teacher and learner apply heuristic
tools that promote meaningful learning and empower the learner to be responsible for
their own learning. In their endeavour to reach this goal Novak and Gowin (1984)
propose two strategies viz. concept maps and vee diagrams. Concept mapping is one
instructional technique, which allows the theoretical ideas of Piaget, Ausubel and von
Glasersfeld to be implemented by educators. Since the rationale of this study is to
explore the use of concept maps, I will concentrate on concept maps for the rest of
this thesis. According to Novak (1984) concept mapping is a tool that allows both
learners and educators to learn key points that they must focus on for any specific
learning task. He explains further that concept maps present meaningful relationships
between concepts and prepositions and provide a schematic summary of what has
been learnt. During concept mapping learners are actively involved because they
construct the concept maps. Ausubel believed that the most important thing to do
before teaching was to ascertain what the learners already know and teach from that
point on. White and Gunstone (1993) claim that pre-tests used to determine learners'
prior knowledge are not popular with learners. However concept maps can be used to

30
determine what learners already understand about a topic since they are less
threatening because concept mapping is open and less concerned with right answers
than a test. White and Gunstone (I 993) explain that iflearners agree to concept
mapping before a section, this map can be compared to one at the end of the section.
Comparison of the two maps provides the educator with invaluable information about
learners' understanding of the topic and their conceptual development.
Ausubel also promoted the use of advance organizers or graphic organizers to
introduce topics of higher order abstractness (Klausmeier et aI., 1974). He again
claimed that advance organisers helped to bridge the gap between what a learner
already knows and what they need to know in the new section. According to Hendron
(2007) there are other valuable benefits of using advanced organizers. Firstly , they are
fluid and dynamic since diagrams can be updated and manipulated easily. Secondly,
saved organizers can be used for direct instruction and for review in follow-up
lessons. Finally the graphic organizer can be easily adapted in note taking and
summarisation. Hendron (2007) also suggests various ways of using a graphic
organizer, such as a pictograph for social studies, drawing for science, or concept
maps, which lend themselves to any discipline. Willerman and Harg (1991) showed in
their study of using concept maps as advance organisers that concept maps provide
classroom practitioners with a meaningful and practical structured approach for using
advance organisers in their classrooms. Their study also found that advance organisers
using concept maps also served to improve levels of understanding and recall.
Vygotsky's notion of 'zone of proximal development' suggests that the educator
provides a guiding hand during discovery learning and that this technique is critical
for effective learning (Huitt, 2003). In this study the educator's role was vital in
introducing learners to the technique of constructing concept maps. The pace and

31
manner in which it was introduced was chosen to build learners confidence and not
overwhelm them as this was a new technique they were being exposed to. It was not
practical to expect these learners to read up on concept maps and construct it on their
own without the facilitation and encouragement of their educator. According to Chall
(2000) constructivism supports a learner-directed approach to learning where the
educator makes skills relevant to the learners' background and experience by
anchoring learning tasks in meaningful, authentic and visual situations (cited in
Matthews, 2003). Concepts maps can be helpful to meet these conditions, by
identifying the concepts held by the learner through prior learning and assisting the
educator in introducing more explicit knowledge that can be anchored into a learners
developing conceptual frameworks (Novak & Canas, 2006).
Consistent with the constructivist theory , is ' understanding' which is
characterised by knowledge being constructed by the active process of integrating
new experiences and information with existing concepts (Olivier, 1992). Hence the
focus is not just the understanding of facts but how the facts are organised and how
they relate to one another (Charles Stuart University, 2000). The goals of instruction
are therefore deep understanding and conceptual development and not beha viours or
skills like in the Behaviourist Theory of Learning (Baralos, c2002). The constructivist
model underscores the need for learners to be actively engaged in their learning.
Learners are expected to ask questions and must be encouraged to test their own
ideas. Educators must seek out learners' ideas, promote cooperative group learning
and encourage learners to challenge each other's ideas. In addition advocates of the
constructivist approach suggest that educators use: collaborative styles where learners
learn from their peers (Artz & Newman, 1990), reflective processes where learners
talk about what was previously learned, discussion through which they construct
32
knowledge, and engage in inquiry-based activities (Educational Broadcasting
Corporation, 2004).
White and Gunstone (1993) found that group work endeavours of concept
mapping promote serious debate, even amongst learners who are generally less likely
to participate in class discussions. These authors presume that the task of concept
mapping is purposeful, involves creativity and more importantly to the learner there is
no one correct answer. Consequently learners do not notice a competitive threat in
concept mapping, although the intelIectual demand cannot be denied.
Evaluation compares learners to themselves rather than to peers, there is de
emphasis on formal assessment (Matthews, 2003) and an emphasis on alternate
assessment methods such as open-ended questions, doing research and developing
products, assessing student portfolios, and so on (Charles Stuart University, 2000).
Other authors suggest that concept maps are ideal for this purpose: White and
Gunstone (1993) suggest that the comparison of concept maps done before and at the
end of a section shows the development of knowledge and helps the learner to see
their own progression which in itself is a powerful learning experience. Zeilik et al.
(1997) add that initial concept maps can be given back to the learner to modify by
adding new concepts and making necessary corrections that they then feel they
understand better.
3.3 CONCEPTUAL DEVELOPMENT
According to Baddely (1994) we can acquire two types of knowledge, namely
procedural and declarative knowledge. Procedural knowledge refers to the
acquisition of skills, applying of rules and formula, and so on. Declarative knowledge
33
is the acquisition of new knowledge or experience and the acquiring of factual
knowledge (Royer, Cisero & Carlo, 1993).
In this study I focus primarily on declarative or conceptual knowledge as
opposed to procedural knowledge. Mathematicians are of the view that meaningful
learning will occur if teaching emphasized the structures that underpin mathematical
procedures and how old concepts linked to new knowledge will serve to enrich the
intellectual capacities of the child (Resnick & Ford, 1981). This accentuates the
relevance of conceptual knowledge to make sense of computational skills. The
importance of conceptual development in mathematics was discussed at Woods Hole
Conference in 1963. The outcome of this conference suggested that mathematics will
only be fully understood, easily remembered and applied to other novel situations if
the "reasons that underlie mathematical operations are made clear by the concepts that
link one operation to another" (Resnick & Ford, 1981, P104). As far back as the
1960's, educationists were emphasizing the importance of both the conceptual
knowledge as well as the procedural knowledge. It is important to note that these are
not competing factors. They in fact complement each other and enhance
understanding and learning.
Procedural knowledge can be assessed by criterion-referenced assessment
techniques such as short answer, true and false, matching and multiple-choice tests
(Royer et aI., 1993). Concept maps are functional tools that have been specifically
designed to detect a learners' conceptual structure on a certain topic and to
externalise, for both the learner and educator, what the learner already knows (Novak
& Gowin, 1984) . The construction of a concept map requires the mapper to relate
salient concepts to a general upper-ordinate concept. Unlike a lecture or linear text
that reflects the logical structure of knowledge, concept maps reflect the

34
psychological structure of knowledge (Wandersee, 1990) . Hiebert and Carpenter,
(1992) suggest that understanding can be viewed as a connection between two pieces
of information and the number, accuracy and strength of those connections determine
the degree of a learners' understanding. This claim is supported by neurobiologists'
researches that study the functioning of the brain (Posner & Raichle, 1994). They also
emphasize the importance of links and the connection with concepts, images and
meaning,
Recent research into the brain indicates that the brain is a multidimensional,
organism that does not think in a linear monotonous way but in multiple directions
from a central trigger point, which Buzan (2006a) calls Radiant Thinking. Buzan
(2006b) states that since we speak and write in sentences we are of the view that
information is stored in our brain in the same way. This linear emphasis continues in
schools, tertiary education and the workplace. Buzan (2006b) argues that this is not
the best way to record information that has to be memorised since the brain prefers
key words that represents the big picture. I believe that concept maps is an extension
and an elaborate form of mind maps and hence portrays the same benefits for
memonsmg.
3.4 CONCEPTUAL FRAMEWORK - VISUAL LITERACY
The concepts that frame this study are visual literacy and visual learning. The
term visual literacy is credited to the writer John Debes in 1968 (Wikipedia, 2008).
He provided that visual literacy is a group of competencies that a human being can
develop by seeing and simultaneously having and integrating other sensory
experiences. Bamford (2003) states that visual literacy is the development of skills
and understanding through the use of visual images. A similar definition is offered by
35
Haas (2003), he believes that visual literacy is the ability to read, interpret and
understand information presented in pictorial or graphic images.
Although the term visual literacy dates back to the 1960's the concept of
reading signs and symbols is prehistoric (Bamford, 2003). Symbolic representation
dates back to the Paleolithic Age almost 30 000 years ago. The early drawings in
ancient caves, like the one in Lascaux, France, are early forms of visual literacy whilst
evidence of the written word appeared in Iraq just 5500 years ago (Flattley, 1998).
Human beings rely on images to make meaningful interpretation and understanding of
X-rays, maps, and complex ideas such as mathematical and chemical formulas
through the mixing of linguistic and pictorial elements (Bamford, 2003).
Linda Kreger Silverman (2002) author of Upside Down Brilliance claims, after
extensive research on gifted children in the 1980's that some learners are inclined
towards the visual spatial learning style whilst others prefer an auditory-sequential
learning style and very importantly for educators, the two styles are not mutually
exclusive. She explains in more detail that the brain is made of two hemispheres, the
left and the right. According to her research, on the one hand the left-brained learner
responds best to auditory stimuli, such as sequential, analytical and time-orientated
activities and on the other hand , the right-brained learner perceives the whole,
synthesizes and learns the best by seeing relationships.
Silverman (c2007a) claims that even the most dedicated teacher cannot
accommodate the different learning styles and intelligence of learners. She suggests
that to have happier learners and to teach effectively we need to reach both the left
brained learner and the right-brained learner. The right-brained learner or visual
spatial learner thinks in pictures rather than words, learn better visually and are

36
whole-part learners who need to see the big picture first before they learn the details
(Silverman,2007b).
In the past teachers taught sequentially. The three R's - reading, writing and
arithmetic were undisputed parts of the curriculum. This type of learning served the
sequential left-brained learner who is dependent on auditory stimuli. This type of
learning is insufficient as research is continuously showing that learning relies heavily
on technology - with learners being bombarded by the internet, play station games, 1
pods, cell phones, cyberspace entertainment and data-projection presentations.
Silverman (2002) maintains that in the new age of information the right hemisphere of
the brain is favoured and needs to be utilised in the classroom if our learners are to be
successful at the work place.
Silverman (2002) outlines the comprehensive learning styles of visual-spatial
learners. She explains that these learners learn all at once and once they understand,
learning is permanent. They do not learn from repetition and drill. They learn best
when they know the goals of instruction, so that they have an idea of the whole
picture. They prefer visual presentations and visual techniques such as mind-mapping
(similar to concept mapping) and pictorial notes. Haas (2003) suggest that in the
secondary school math classes ' learners be engaged in demonstrations and
participatory activities as opposed to memorising facts and formulas to assist the
visual-spatial learner. West (1997) claims that learning of mathematics is more
effective when learners 'do' mathematics instead of 'watching' mathematics.
The literature however, reveals that visual treatments in the classroom enhance
learning in varying degrees. Chanlin (1997) reports that when prior learning is low,
graphics are better for learning descriptive facts than text alone (cited in Stokes,
2001). Further studies conducted by Kleinman and Stokes (2001) indicates, that the

37
use of colour graphics as opposed to black and white graphics in instructional
modules promotes achievement, particularly when learning concepts. A study
conducted by Willerman and Harg (1991) further illustrates the benefits of visual
learning. Their study reveals that concept maps as graphic organisers presented to
learners at the beginning of a section, help learners see the relationship between
concepts. This again favours visual-spatial learners, since these learners prefer to see
the relationships between concepts when learning. Haas (2003) believes that visual
spatial learners are holistic learners; they grasp whole concepts rather than individual
facts. They synthesize and construct conceptual frameworks to show connections
between a particular topic and the rest of the subject. Haas (2003) believes that
concept maps is an effective tool to represent such learning.
Stokes (2001) cautions, that although studies repeatedly show that visuals aid
in learning , it must be carefully integrated with instruction. Visuals should not be
excessively entertaining that the underlying objective of the lesson is lost.
Furthermore with regards to the visual aid, concept maps, White and Gunstone (1993)
suggests that although learners enjoy doing them, concept maps require intellectual
effort and if they are done too frequently learners will lose interest and produce
superficial maps that are of no educational value. In this study concept maps were
sometimes used to introduce a section . Classroom activities were follow up exercises
from the textbook or worksheet, research tasks using the internet or a concept map
generally at the end of a section to recap all that was learnt in a particular topic. I
believe that learners were not overwhelmed by the construction of concept maps as
they were interspersed with other fun activities in the mathematics class, such as
designing questionnaires, doing surveys, research in the library and building prisms
and pyramids from jelly tots and tooth-picks.
38
3.5 SUMMARY
This chapter focussed on a visually appealing way to motivate learners to make
sense of learning material within a constructivist epistemology. Within this paradigm
of teaching and learning learners become active participants to learning and not
passive recipients. In this thesis concept mapping is used as a teaching and learning
tool to engage learners in meaningful learning. Past studies have shown that if
introduced early in a learners' schooling career, concept maps can be effectively used
as a learning tool.

39
CHAPTER 4
RESEARCH DESIGN AND METHODOLOGY
This chapter will provide a description and an in depth explanation of the
suitability of the methods employed in my study to determine the benefits of using the
concept map approach for teaching and assessing learners' conceptual knowledge in
mathematics in a grade eight class . This study is guided by the following objectives:
1. What are the advantages and disadvantages of using concept maps to
teach mathematics? - A literature perspective.
2. Can concept maps facilitate group-work?
3. Are concept maps an effective learning tool for mathematics for grade eight
learners?
4. Can concept maps provide valid information for the teacher about learners'
knowledge of mathematical concepts?
5. How can concept maps assessments be practically applied to classroom
situations?
6. Do concept maps develop grade eight learners' conceptual understanding
through the comparison of successive concept maps?
4.1 RESEARCH DESIGN AND METHODOLOGY
According to Nieuwenhuis (2007) a research design is defined as a plan,
which moves from the underlying philosophical assumptions to specifying the
selection of participants, the data producing techniques, and the type of data analysis.

40
Since the aim of this study is to find solutions to a social challenge, in particular a
teaching method that will help learners' understanding of mathematical concepts, the
study is embedded in an action research methodology (McNiff & Whitehead, 2005).
Educational action research in a sense is an educational technology in which teachers
take action to improve learners' learning and at the same time improves their own
practices (Swain, 2001). Action research frequently emerges in situations where
people want to make changes thoughtfully - when social beings become dissatisfied
with the way things are and want to change it for the better (Kemmis & McTaggart,
2000).
According to Mouton (2001) the advantages of using action research is that it
involves participation and close involvement of all the part of subjects, which
enhances chances of high construct validity, low refusal rates and 'ownership' of
findings, whilst limitations of action research are that the small number of cases and
low degree of control affect overall generalisability and possibility of strong causal
and structural explanations. Kemmis and McTaggart (2000) level other criticisms
against action research - they believe that the prominence given to teachers'
knowledge with the hope that significant changes can be accomplished in the
classroom without the support from the community and the education department is
overemphasized.
In this study, thirty-four learners of a grade eight class participated in this action
research that extended over ten months. Learners were taught how to construct
concept maps over an extensive period that was not only determined by hours but by
the activities that they engaged in. Thereafter concept map activities were used across
a range of topics and at different stages of my lessons. Both the learners and I
constructed concept maps. I constructed concept maps: (a). to introduce sections, (b).

41
to summarise previous work and (c). to revise before a test. Figure 5.1 represents a
skeleton concept map (a drawn concept map with links and branches but the concepts
are missing), which was used to check whether learners remembered their class-work
activities from the previous day. Learners constructed concept maps as classroom
activities, homework tasks and as assessment tasks. range of concept map activities
used was: (a). as tasks that invite learners to provide evidence of their knowledge
structure in a particular domain where they would construct a pencil and paper
concept map from a list of given concepts, (b). as a format for learners' response
where skeleton concept maps were given and learners had to fill in the correct concept
(Figure 5.1) , and (c). as a pencil and paper task to construct concept maps for a
particular domain.
Figure 4.1 Skeleton concept maps drawn by educator and filled in by learners
This study will be conducted from an interpretivist paradigm. Within this
paradigm concern for the individual is paramount. Hence the central endeavour of the
42
interpretive paradigm is to seek to understand from within the subjective world of the
human experience (Cohen, Manion & Morrison, (2007). These authors believe that
this is in opposition to where humans are studied by observing and the observer
reflects his or her viewpoints. Hennie, Rensburg and Smit (2004) assert that since
measurement in this paradigm is fallible , the interpretive researcher is encouraged to
use different methods of data collection and analysis to ensure validity of results.
They propose unstructured observations; open interviewing and qualitative data
analysis as ways to capture "insider" information. My study embraced the
interpretivist paradigm since it is characterized by my concern to understand from
within, the learners ' conceptual change of mathematical knowledge. .
Hence, this study will utilise a mixed method approach since it contains
elements of both qualitative and quantitative methods to explore learners
understanding using concept maps (Vos, 2006 ; Ivankova, Creswell, & Clark, 2007).
Spicer (2004) declares that the benefit of using mixed methods allows the researcher
to capture the best of both approaches. Greene (2008) further asserts that in the social
field of education the practical demands of the educational context require both
'generality and particularity' . Vos (2006) claims that to investigate and understand the
complexity of human beings it is necessary to adopt dispassionate neutrality as well as
contextual stories about lived experience.
When the quantitative and qualitative methods are combined to acquire multiple
measures of the same phenomena by the application of various research instruments
the process is known as triangulation (Vos, 2006). Triangulation is critical in
facilitating interpretative validity and establishing data trustworthiness (Terra
Blanche, 2004). However critics argue that triangulation may not necessarily

43
corroborate findings nor does it necessarily increase validity, reduce bias or bring
objectivity to the research (Cohen et aI., 2007).
For my study I will employ the Sequential Explanatory Strategy since I think it
is the most appropriate of the six major mixed methods models (Ivankova et al.,
2007). Ivankova et a1. (2007) characterized this strategy as a collection of the
quantitative data first, which is then followed by the qualitative data and then
integrating the two methods during the interpretation phase of the study. This model
enabled me to use the results from the questionnaire (quantitative analysis) to explain
and interpret the results of the interview (qualitative component) of the research.
Research that mixes methodologies can 'temper biases in each tradition' and a
quantification of outcomes together with rich contextual lived experiences can only
yield valuable and in depth findings (Sosulski & Lawrence, 2008).
4.2 DATA COLLECTION STRATEGIES
In this study learners were involved in designing concept maps, which were then '
scored against a set of criteria. This was followed by a short survey in the form of a
questionnaire administered to the whole class. The questionnaire was designed to get
a general idea of how learners felt about concept maps and whether they were
comfortable using it in mathematics. All learners answered the questionnaire. A
sample of six participants was chosen according to set criteria, see chapter five for
details for the semi-structured interview. The aim of the interview was to explore an
in depth description of learners' perceptions regarding the use of concept maps.

44
4.2.1 Content Analysis
During the first part of the study that spanned ten months, learners engaged in
concept map activities that encompassed:
• Filling in of skeleton concept maps,
• Building concept maps from a list of given concepts and
• A pencil and paper concept map of a given section.
Thereafter concept maps were scored against a drawn up set of criteria by analysing
the content of the concept maps. Krippendorff (2004) defines content analysis as a
research technique that makes replicable and valid inferences from texts or other
meaningful matter which provides insights and increases a researchers understanding
of a particular phenomenon (in this case concept maps) to the contexts of their use.
Holsti (1969) offers a broad definition of content analysis in that it is a "technique for
making inferences by objectively and systematically identifying specified
characteristics of messages" (p14). This definition does not constrain content analysis
to textual analysis but to analysing any means of communication. Reliability, which
demonstrates the trustworthiness of data, is defined as the extent to which a measuring
procedure yields the same results on repeated trials (Neuendorf, 2002). Reliability is
achieved through duplicating the analysis under various conditions such using several
researchers of varying personalities or by relying on different but functionally equal
measuring devices to obtain the same results (Krippendorff, 2004). To ensure the
trustworthiness and reliability of the scores for the concept maps my supervisor and I
scored the concept maps to ensure reliability of the scores.
In this study the content of concept maps were analysed. The focus was to concentrate
on the complexity of the structural nature of the map. This entailed examining the
number of correct concepts used and whether they were corrected linked to other

45
concepts with a descriptive linking word. The levels of branching were also
examined. This structure reveals valid information about a learners' conceptual
development (Baroody & Bartels, 2001)
The strengths of using content analysis is that it is an unobtrusive method which
means that errors associated with the interaction between researchers and participants
are avoided whereas the weakness of this method lies in the authenticity and
representativeness of the material analysed which makes the overall external validity
of the findings limited (Mouton, 200 I).
The evidence of concurrent validity of concept maps was established by a study
conducted by Markham and Mintzes (1994). Concurrent validity is demonstrated by
correlations that concur from past studies (Krippendorf, 2004). In this study
Markham and Mintzes (1994) explored the concept maps constructed by new students
that enrolled for an introductory course in biology and compared them to those
constructed by graduate level students majoring in biology . Comparison of the
concept map scores would indicate the differences in structural complexity of the
student's knowledge bases. These researchers used the findings from previous studies
that found that knowledge structure and application are tightly linked; hence concept
maps will provide a fairly accurate account of the way learners' structure their
knowledge. These results are often quoted for the concurrent validity of concept
mapping as an evaluation tool.
Analysing series of concept maps will determine learners' conceptual change if
any. This analysis will help me determine learners' conceptual understanding of a
topic but it does not help me determine how learners ' feel about concept maps ,
whether they will use it whilst studying, if it helps with retention of knowledge, or
whether it is a method that they are comfortable using in their mathematics lessons.
46
Stemler (2001) states that content analysis allows inferences to be made, which can be
corroborated using other data collection methods. Hence , I followed the analysis of
the concept maps with a questionnaire
4.2.2 The Questionnaire
A questionnaire is a written list of questions where participants are expected to
read and interpret what is expected of them and then responds in writing (Kumar,
2005). Oppenheim (2004) claims that a well-designed questionnaire should provide
accurate answers to the questions of the investigation. Besides it should not leave
loopholes in conclusions, it should allow valid generalizations to be made and lastly it
should not produce irrelevant information. To make certain that the criteria for a good
questionnaire was met I took the liberty of engaging the help of my supervisor and
colleague who is familiar with my study instead of using a pilot. A pilot is the lengthy
but valuable process of designing and trying out questions before the actual
instrument is used (Oppenheim, 2004). Studying a questionnaire rarely reveals
problems of interpretation or usage however it does become apparent and clear
through testing (Willi s, 2005) . In addition before we ask questions we need to
ascertain exactly what we need to know. Vague questioning is often clarified through
testing. Oppenheim (2004) further illustrates the benefits of a pilot by stating that it
assists us with the sequence of questions and reduction of non-response rates. I
however could not heed the advice offered by Oppenheim (2004) when he suggested
that researchers engage the help of their respondents since the pilot could only be
carried out with learners that knew how to construct concept maps. This was not
possible as I only taught concept maps to my research participants. I therefore
47
engaged the help of my supervisor and a colleague that was familiar with my study
and concept maps.
My questionnaire (see Appendix C) included both open-ended and close-ended
questions. Closed questions are where respondents are offered a choice of alternatives
and in my case tick the most appropriate response (Kumar, 2005). Closed questions
are easier and quicker to answer and quantification is straightforward however the
disadvantage is that we cannot record the spontaneity and expressiveness of
participants (Oppenheim, 2004). He adds that closed questions also stand the risk of
bias in that respondents are forced to choose from the given alternatives. Moreover
they are forced to think of alternatives that may not have occurred to them. Kumar
(2005) maintains that closed questions are open to greater investigator bias as the
researcher may list only the responses that he/she is interested in.
Closed questions alternately allow the respondents to answer in writing in their
own words (Willis, 2005). The advantage of open questions is the freedom it offers
respondents which yield data they take time to think about whereas in an interview
there is the risk that respondents don 't necessarily give a full account of their feelings
but offer what is uppermost in their minds (Oppenheim, 2004). Maree and Pieterson
(2007) assert that one of the advantages of open questions is that it reveals
participants' thinking processes and it could reveal other interesting information.
Since respondents are free to express themselves it eliminates the possibility of
investigator bias (Kumar, 2005). However the disadvantage of open questions is that
responses may differ among participants, which could result in difficulty whilst
coding the responses (Cohen et aI., 2007). Bloch (2004) argues that to ensure the
measurement validity of a questionnaire the novice should seek help from

48
professionals to determine whether questions are framed so as to elicit the information
that is needed. This was achieved by engaging my supervisor's assistance.
4.2.3 The Interview
Once the quantitative data was captured, eight learners were selected for a post
hoc semi-structured interview (see Appendix B). Greeff (2006) define semi-structured
interviews as those that are designed around areas of particular interest in this instance
determining learners' feelings about concept maps, whilst still allowing flexibility in
scope and depth. Post-hoc interviews are used to rank learners according to their
ability levels and then some learners are selected from each ability level , ranging from
high achievers, average performers to low achievers (Wallace & Mintzes, 1990).
Since I am a novice researcher it was essential that I build a pilot venture of the
interview into my study schedule. Greeff (2006) acknowledges that pilot endeavours
ensure that researchers come to grips with at least some of the practical aspects of
access and conducting of the interview, as well as becoming alert to their own level of
interviewing skills. I learnt from my pilot that I should not talk too much because then
I become the focus instead of the participants whose opinions I sought.
The learners' names for each ability level were put into separate hats to ensure
that all learners had an equal chance of being selected. Durrheim and Wassenaar
(2002) point out that participants be assured of the extent of confidentiality of the
information supplied by them. Hence before the interview process learners were
informed that the interview will be recorded and that summarized information will be
used or some excerpts may be published but it will be reported anonymously.
The reason for the interview was two-fold: firstly it clarified thoughts that I
had about a particular learners concept maps and secondly it allowed me to explore

49
any other information, relevant to my study that came up in the questionnaire. This is
supported by Nieuwenhuis (2007) who claims that semi -structured interviews are
defined as a ' line of inquiry' that allows the attentive researcher to prod and explore
emerging lines of inquiry that are related to the topic under scrutiny. The advantage of
using semi-structured interviews is that the interviewer can pick up on non-verbal
cues and explore interviewees suggested feelings or thoughts (Fontana & Frey, 2000).
One of my main reasons for using interviews is that it allowed me, the researcher to
use visual aids during the interview. I needed to show interviewees a series of concept
maps that they had designed (Kumar, 2005). This could not be done in the
questionnaire. Cohen et al. (2007) offer other strengths of this method. They maintain
that this method allows for any gaps that may be anticipated in the data to be filled.
In this study it was necessary for me to probe to gain an in depth understanding of
learners perceptions regarding their changing conceptual understanding. It was
therefore essential to use an interview as a data collection method as it facilitates this
requirement.
4.3 ETHICAL ISSUES
According to Fontana and Frey (2000) gaining access to participants that one
wishes to study is difficult in certain instances. However being an educator and
studying my own learners made it ideal for me for many reasons. I have easy access
to my learners and they also trust me. Since I teach these learners I have established a
good rapport with them. The importance of this is confirmed by Fontana and Frey
(2000) who asserts that since the aim of unstructured interviews is 'understanding' it
is of utmost importance that the researcher ascertains a rapport with the participants.
50
According to Ali and Kelly (2004) getting informed consent is a procedure that
supports individual autonomy and helps safeguard the rights of participants by letting
them decide for themselves what are in their best interest and what risks they are
prepared to take. Since these learners are minors' consent was also sought from
parents (see Appendix A). Learners will also be asked to sign a letter of consent (see
Appendix A). The letters informed learners and parents about the nature of the study
and that the children will be interviewed during the breaks and not during tuition time.
It also explained that learners could leave the process at any time without any
repercussions. This is supported by Durrheim and Wassenaar (2002) who assert that
consent should be voluntary and informed, and should contain a clear non-technical
explanation of the task so that participants can make informed decisions whether to
participate in the study or not.
When interviewing I needed to be mindful of introducing bias to the
interpretation of questions and also in the framing of questions (Kumar, 2005). In
order to avoid bias in the interpretation of questions, probing questions will follow
responses made by participants in order to clarify responses and not to gain the
responses that I am looking for. To avoid bias in framing of questions, I engaged the
assistance of a peer to check the interview schedule.
I also need to be aware of power relations that exist between the learners and
me. Schostak (2003) affirms that within the limits of the classroom, teachers are
powerful beings in the lives of children. This is more so with grade eight learners who
have just come from the primary school. These learners hold their educators in high
esteem and may feel intimidated or compelled to give answers that they think their
educator wishes to hear. Nieuwenhuis (2007) suggests asking a variety of questions
that range from 'experience and behaviour' questions (Tell me about this concept

51
map) to ' opinion and value questions' (How did you feel about the group work
activity?) to help circumvent this.
McNiff and Whitehead (2002) mention many practical issues that researchers
are faced with in the research process itself. They emphasize maintaining good ethical
practice - he warns that as educators we should be mindful of abusing our power.
They add that as researchers that we be aware of propagating false results in our
enthusiasm to find something concrete at the end of our investigation. He also asserts
that researchers should be realistic about what they can achieve and set deadlines that
are achievable and ensure that you honour it to safe guard your credibility. Durrheim
and Wassenaar (2002) warn that novice researchers conduct research in fields that
they are competent to conduct. For example medical doctors should conduct research
on trauma patients and educators on educational issues. According to Cohen et al.
(2007) and Kumar (2005) qualitative research is evaluated by its credibility. Credible
research produces findings that are convincing and believable. Cohen et al. (2007) and
Kumar (2005) believe that this can be achieved by triangulation, prolonged
engagement in the field , reflexive journals and an audit trail. My study uses three
forms of data collection, which includes qualitative and quantitative methods. I
believe that would be sufficient triangulation of results. Furthermore I will keep a
reflective journal where I will record my field notes of every incident in the class that
centres on the study; this will ensure validity of the processes involved in the study.
Durrheim and Wassenaar (2002) confirm that with interpretive research
transferability is achieved by producing detailed and rich descriptions of contexts.
They explain that this gives the reader detailed accounts of observations and the
context in which it occurred. Durrheim and Wassenaar (2002) declare that interpretive
and constructionist researchers cannot expect to find the same results repeat edly
52
however they propose that findings be dependable. This is achieved through opulent
and detailed descriptions that show how certain actions and opinions are rooted in and
developed out of contextual interaction.
4.4 SUMMARY
The content oflearners' concept maps were analysed qualitatively and reported
as a narrative in Chapter 5. The questionnaire was quantitatively analysed. A short
report that accompanied each question was justi tied by extracts taken from learners'
responses. The interview served to fill in gaps of information that I could not gather
from the questionnaire or the concept maps.

53
CHAPTER 5
PRESENTATION AND ANALYSIS OF FINDINGS
In this chapter I discuss the findings of my research in detail. I had used a
multimode methodology to collect data. Initially I will present a brief outline of my
introduction of concept mapping to my learners. This is essential because it sets a
platform for the work that follows. The purpose of this study was to determine
whether concept maps were effective teaching and learning tools and whether they
were appropriate for assessment purposes.
Learners had to have a fairly good knowledge of how to construct concept maps.
At the outset it was essential to introduce it in a manner that encompasses the existing
curriculum structures and a method , which portrayed my personal teaching style. My
thinking was influenced by a study conducted by Santanam, Leach and Dawson
(1998) who did a study on how concept maps should be introduced, and whether they
presented evidence for long-term benefits. One of their findings was that when
learners were given a choice , they totally avoided using concept maps as they felt it
played no part in their coursework. These researchers concluded that the way in which
it was introduced could have been the reason learners reacted in this way. What's
more, is that the researchers concluded that these learners had not gained sufficient
expertise and confidence in constructing concept maps and hence could not see the
value in concept maps. I sought to eradicate this by ensuring that I spent sufficient
time introducing concept maps.
54
5.1 'TRAINING LEARNERS TO CONSTRUCT CONCEPT MAPS
I introduced concept maps as described by Novak and Gowin (1984) in their
book Learning How to Learn. I drew two columns on the board. The heading of one
column was "objects" and the other was "events". I used dog as an example of an
object and barking as an example of an event. The learners were then to give some
examples, which they did. For objects we recorded words such as kennel, bone, cat,
book, table and car. For events we recorded words such as eating, playing, jumping
and running. It was interesting to note that the concept that learners listed were all
associated with the dog . I would use this later to construct a simple concept map.
Then I asked them to close their eyes and asked them what they ' saw ' when
I said "dog" and I got a few responses like "fie rce ", "cuddly", "dirty", etc. This was
actually a good array of thoughts because everybody was thinking of different things.
Then I went on to explain that the mental images that they conjectured were referred
to as concepts. I had now introduced the word 'concept' to them , albeit a rather
intuitive one. Then I drew their attention to the fact that the word ' dog' made
everybody think of something different. I then went on to explain that even though we
use the same word we have differences in our mental images, which explains why we
sometimes have problems understanding each other (Novak & Gowin, 1984). I added
that words were labels for concepts; however we each make our own meaning of the
word (Novak & Gowin, 1984) .
I then enclosed the word dog and barking in an oval and asked them if it made any
sense to them .

dog barking
55
One learner shouted out: "It could mean the dog is barking ".
This provided the necessary response that was used as a springboard to introduce
'linking words ' . I explained that linking words are used to join concepts together to
create a short sentence, hence giving the concepts more meaning. I then provided an
example to illustrate what I meant.
dog
IS
barking
We did a few more examples ofjoining concepts with linking words such as is, has,
contains, includes, etc.
Then I asked them to list some mathematical concepts that they knew. They listed
square, add, triangle, Slim. This was a useful list as it contained both concepts and
associated events. I then asked learners if I could use Wingen Heights as a concept.
Some said 'yes' and some said ' no'. I then explained that proper nouns were not
concepts. I used a few more examples until I was confident that learners understood
what concepts and events were. I then made some short sentences using mathematical
concepts to illustrate how linking words and concepts are used together to convey
meaning. The examples I used were: a square has 4 sides and sum is the addition of
numbers.
Learners were then asked to construct a few of their own short sentences. A
few learners put their sentences up on the board and together we identified the

56
concepts and linking words. I ringed the concepts and used a line to join them. The
linking word appeared along the line. As a follow up activity learners were then given
a relatively simple skeleton map of geometric shapes with the concepts on a card
(Figure 5.2).
S id e.s S G tYle
le..n g Ulrt'n t eK~-; 0
angle
____p_roperues L "-':~~_"""'~ •
Figure 5.2 Skeleton concept map filled in by learners
They were expected to put the cards in the correct places. The purpose was for them
to be exposed to expert concept maps so that they could get a feel of how to link the
concepts. From my observation learners were animated during this first activity. The
topic was familiar so they could see the connections quite easily and hence completed
the activity successfully and in a short time. During this activity learners' talked
positively about concept maps. This is indicated by comments such as, 'this is fun'
and 'this is easy'.

57
As the homework task learners were given a short extract on 'the history of
numbers' since the topic I was currently teaching was the number system. Learners
had to compile a list of concepts from this extract. In the next lesson I recorded a list
of concepts from learners responses on the board. Together with the class I
constructed a concept map. The purpose of constructing this concept map with
learners was to discuss the relevance of linking words and to talk about cross-links.
We also discussed the relevance of propositions or linking word together with the
concepts and highlighted that propositions tell the reader of the map how well you
understand the relationships between concepts.
Within a few days the topic, real numbers was completed. I now felt that
learners were ready for their first attempt at constructing a concept map. This time
they had to produce a list of concepts using their notebooks and textbook and
whatever other related concepts they could think of from primary school that they
could link to the new concepts that they learnt in this section. I expected at least
twenty-one concepts since this is what I compiled after examining their class work
exercises and the textbook. These concepts were real numbers, rational numbers,
irrational numbers, integers, whole numbers , natural numbers, multiples, factors,
prime numbers, composite numbers, squares, square roots, perfect squares, non
perfect squares, terminating decimal, recurring decimal, infinite decimal, fractions,
mixedfractions and identity element.
Learners were now challenged to construct a concept map of real numbers. They
were then expected to present their work to their peers whilst working in groups of
fours.
During this time the learners were expected to demonstrate and communicate their
understanding of real numbers so that critics (peers and the educator) could make
58
sense of this section. Thereafter the group had to jointly submit a concept map but this
time they had to collectively decide on all the concepts they could think of and use in
a single group concept map.
5.2 ANALYSIS OF CONCEPT MAPS
In order to enhance the analysis of concept maps, pictures of learners concept
maps have been included, however pseudonyms have used to protect the identity of
these learners. This was especially necessary as judgements were made about learners
which could have a negative impact on the learner should he/she read the thesis.
During the analysis of the concept maps I focused on both the qualitative
and quantitative aspects oflearners' concept maps , with particular emphasis on the
accuracy or validit y of the knowledge represented by learners. A scoring guide
represented by Table 5.1 was used to judged learners ' concept maps. It was designed
by modifying the Novakian scheme of scoring concept maps (Novak & Gowin, 1984)
and that employed by Markham et al. (1994) . Points were awarded for the nature of
concepts used, the structural complexity of the network of concepts, valid links and
relevant linking words. It needs to be emphasized that I did not see the need to teach
my learners about the hierarchical arrangement of concepts; but marks were given for
levels of branching. I felt this was relevant because I could then judge the extent of
integration of learners' mathematical knowledge in that topic. Propositions that
correctly describe the inter-relationship between concepts (Novak & Gowin, 2004),
indicates the accuracy and strength of learners ' connections (Baroody & Bartels,
2001). Points were also awarded for concepts used as this indicates the nature of
students' perceptions of mathematical knowledge in a section (Karoline- Afarnasaga
Fuantai, 2004) and their depth of understanding (Baroody & Bartels, 2001). I also

59
awarded points for examples, as the number of concepts and examples linked together
portray the learners' complete and flexible understanding of a topic whilst Markham
et al. (1994) assert that examples represent specificity of knowledge. This simply
means a way to ascertain whether a concept is really understood by a learner. Cross-
links form an important part of concept maps as they reveal how previously learnt
concepts could be integrated with new knowledge. Markham et al. (1994) refer to this
as "conceptual integration or cohesion" (p 97). Karoline- Afamasaga- Fuantai (2004)
affords another reason for including cross-links in assessing concept maps , in that
redundant concepts indicate students' tendency to learn information in isolation from
each other instead of identifying potential cross-links when the concept was first used.
Generally concept maps are not scored out of a particular total since it is possible that
a learners' map could have more links and concepts than the criterion-referenced map.
In this study I use concept maps as a tool to explore concept map development.
Quantitative scores will only assist in making qualitative judgments about learners'
concept maps.
Table 5.1 Modification of Novak and Gowin's (1984) scoring guide
Category Description
Valid links A meaningful relation between two concepts which is
indicated by the connecting line and linking words
Branching Is each subordinate concept more specific and less general
than the concept drawn above it in terms of the topic being
mapped.
Cross-links Are there meaningful connections between concepts from
one segment of branching to another concept in another
segment
Examples Specific events or objects that are valid instances of those
designated by the concept level.
Score
1 point for eachmeaningful, valid
propositionI point for each level of
branching
1 point for each validcross-link
1 point for each example

60
5.2.1 Assessing individual versus group concept maps for real numbers
Here I assessed five individual concept maps and compared them to five
concept maps that were done in a group. Learners first worked alone on a concept
map on real numbers, thereafter they worked on a group effort on the same topic. The
purpose of this exercise was to ascertain whether concept maps facilitated
collaborative learning. I wanted to use group work early in the study as group work
has a strong social function of providing support to learners. Since concept mapping
was a new technique to these learners I felt that discussion amongst group members
could enhance their understanding of concept maps. It was also possible that members
of the group could grasp the technicalities of concept mapping and the value of using
concept maps better from a peer than from an educator. Analysis of the interview
revealed that learners felt that the group activity improved their understanding of
concept maps. Typical responses offered by learners were: "Group work helps me to
understand concepts because ifI don't know I can ask someone who is in my group"
(Nkanyiso).
To me it was essential that learners' got a firm grasp in constructing concept
maps . Furthermore I also wanted them to feel comfortable drawing them . Several
studies in the past indicate that the instruction time was too short or rushed and hence
learners did not appreciate the value of concept maps. For example, an extensive
study by Williams (1995) that included 2000 learners revealed that concept maps
were extremely divergent. Students produced concept maps with over 300 different
concepts over different terms. Some critics argue that the reason for this diversity
resulted from students' not understanding the construction of concept maps. I
therefore conducted various concept map activities during my study to ascertain were
learners found it most helpful.
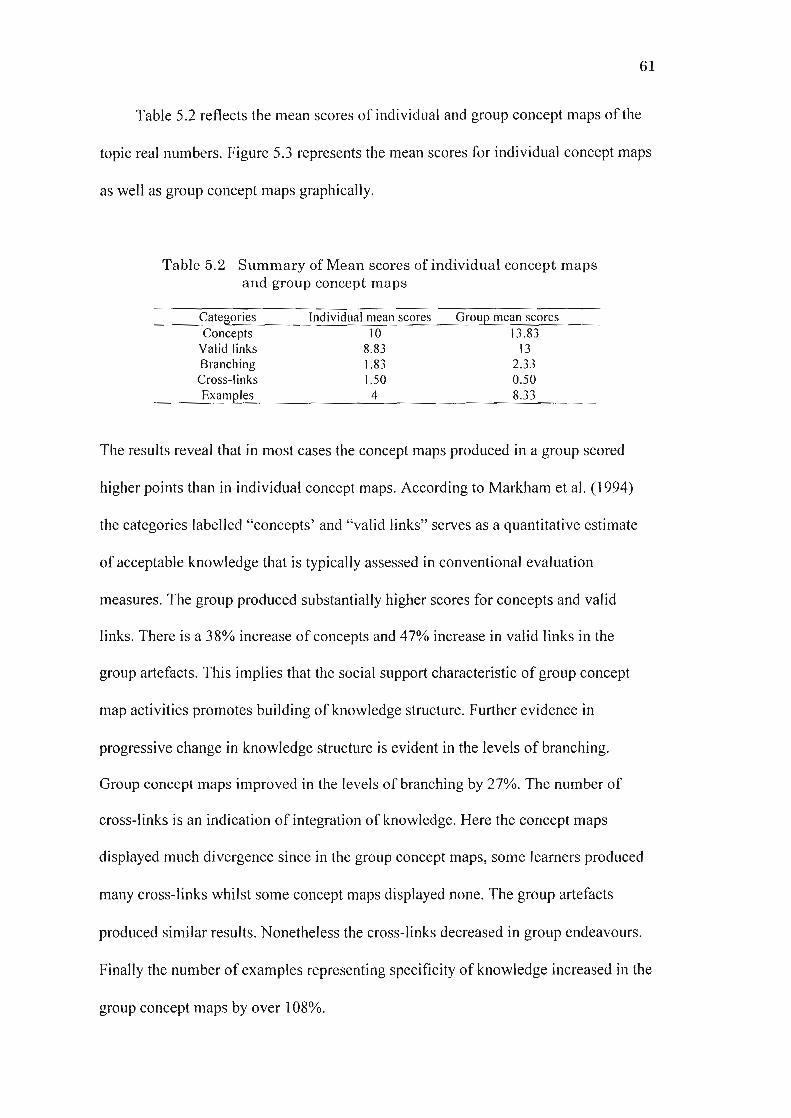
61
Table 5.2 reflects the mean scores of individual and group concept maps of the
topic real numbers. Figure 5.3 represents the mean scores for individual concept maps
as well as group concept maps graphically.
Table 5.2 Summary of Mean scores of individual concept maps
and group concept maps
CategoriesConcepts
Valid linksBranchingCross-linksExamples
Individual mean scores10
8.831.831.50
4
Group mean scores13.83
132.330.508.33
The results reveal that in most cases the concept maps produced in a group scored
higher points than in individual concept maps. According to Markham et al. (1994)
the categories labelled "concepts' and "valid links" serves as a quantitative estimate
of acceptable knowledge that is typically assessed in conventional evaluation
measures. The group produced substantially higher scores for concepts and valid
links . There is a 38% increase of concepts and 47% increase in valid links in the
group artefacts. This implies that the social support characteristic of group concept
map activities promotes building of knowledge structure. Further evidence in
progressive change in knowledge structure is evident in the levels of branching.
Group concept maps improved in the levels of branching by 27% . The number of
cross-links is an indication of integration of knowledge. Here the concept maps
displayed much divergence since in the group concept maps , some learners produced
many cross-links whilst some concept maps displayed none. The group artefacts
produced similar results. Nonetheless the cross-links decreased in group endeavours.
Finally the number of examples representing specificity of knowledge increased in the
group concept maps by over 108%.

62
concept map scores of individuals and groups
(")~:: 1
12 .l/I~ 10o~ 8l:m 6E 4
2
o
o~
o 0<0 0
~ , [J ,concepts valid links branching crosslinks examples
categories on concept maps
Figure 5.3 Dual bar graph representing individual and group mean scores
Further analysis of the interview revealed that all learners that were
interviewed enjoyed the group work activity and found working with their peers
supportive and helpful. This is exemplified by the comments: "When we do an
activity in a group I understand because they (members of the group) explain to me
when I don't understand (Sindiswa), "I found out what mistakes 1 made and my
classmates helped me correct them" (Carl) and "It is easier to work in a group than
alone because they help you to understand the work" (Portia) .
Figure 5.4 is Atish's individual concept map on real numbers whilst figure 5.5 is
a group concept map on real numbers of which Atish was a member. At a glance the
concept maps are so similar one could conclude they were done by the same person .
However a closer look at the two concept maps revealed some interesting features.
Researchers such as Roth and Roychoudhury (1992) describe concept mapping as a
valuable tool to help learners organise and reflect on their conceptual understanding.
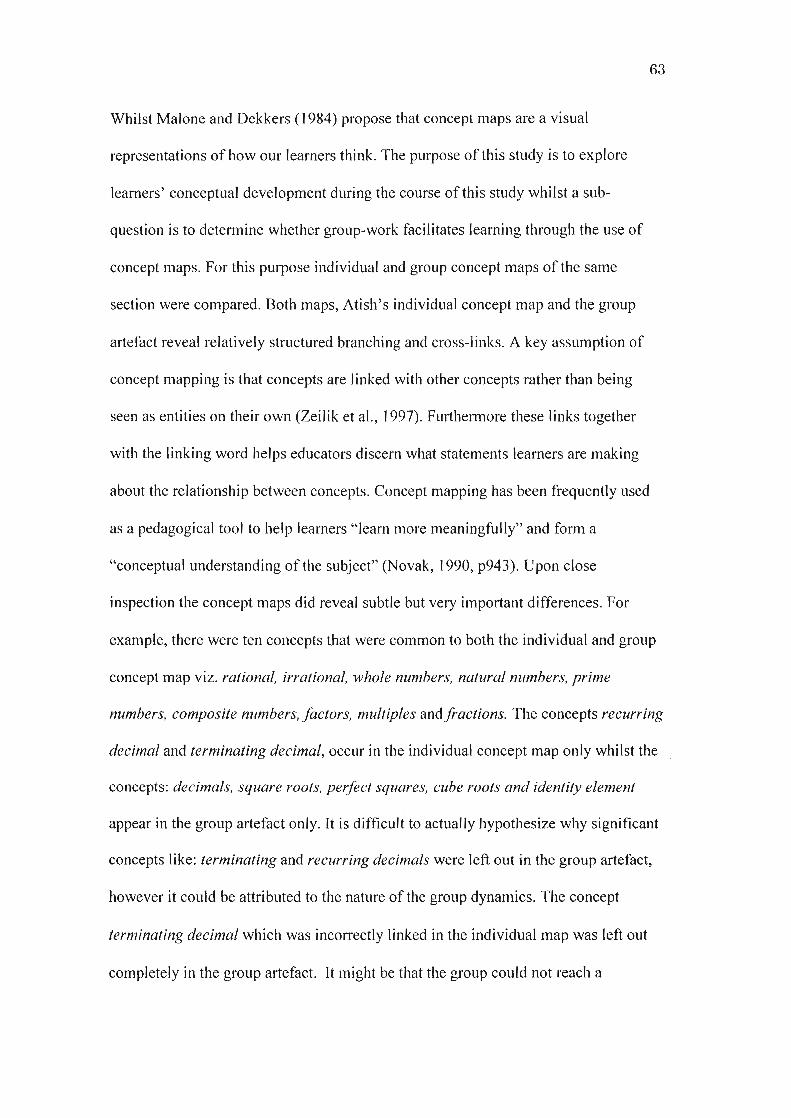
63
Whilst Malone and Dekkers (1984) propose that concept maps are a visual
representations of how our learners think. The purpose of this study is to explore
learners ' conceptual development during the course of this study whilst a sub
question is to determine whether group-work facilitates learning through the use of
concept maps. For this purpose individual and group concept maps of the same
section were compared. Both maps, Atish's individual concept map and the group
artefact reveal relatively structured branching and cross-links. A key assumption of
concept mapping is that concepts are linked with other concepts rather than being
seen as entities on their own (Zeilik et aI., 1997). Furthermore these links together
with the linking word helps educators discern what statements learners are making
about the relationship between concepts. Concept mapping has been frequently used
as a pedagogical tool to help learners "learn more meaningfully" and form a
"conceptual understanding of the subject" (Novak, 1990, p943). Upon close
inspection the concept maps did reveal subtle but very important differences. For
example, there were ten concepts that were common to both the individual and group
concept map viz. rational, irrational, whole numbers, natural numbers, prime
numbers, composite numbers, fa ctors, multiples and fractions. The concepts recurring
decimal and terminating decimal, occur in the individual concept map only whilst the
concepts: decimals, square roofs, perfect squares, cube roots and identity element
appear in the group artefact only. It is difficult to actually hypothesize why significant
concepts like: terminating and recurring decimals were left out in the group artefact,
however it could be attributed to the nature of the group dynamics. The concept
terminating decimal which was incorrectly linked in the individual map was left out
completely in the group artefact. It might be that the group could not reach a
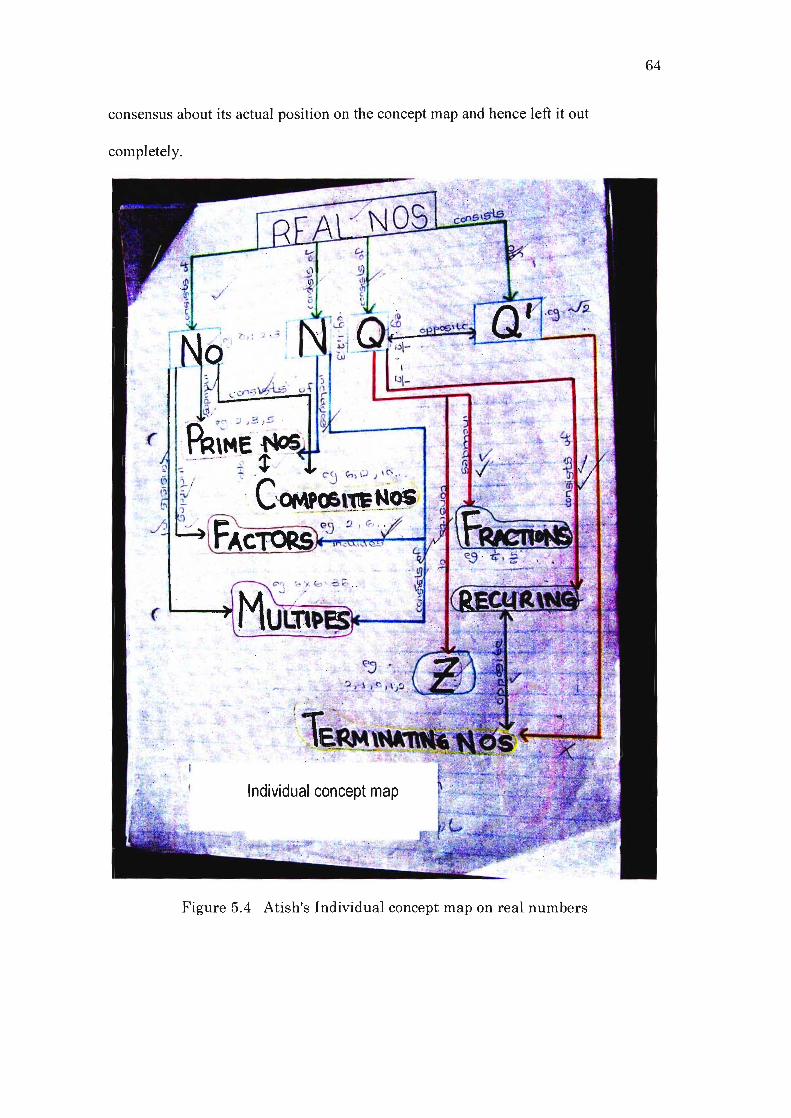
consensus about its actual position on the concept map and hence left it out
completely.
64
Figure 5.4 Atish's Individual concept map on real numbers

65
Figure 5.5 Atish's group concept map

66
The number of cross-links shown in a concept map is taken as a measure of
integration of the knowledge base in a particular section. In Atish's individual concept
map there were three valid cross-links, between the concepts: rational and irrational
numbers, recurring decimals and terminating decimals and lastly between prime and
composite numbers whereas in the group effort there were no cross-links at all. As I
walked around during this activity I noticed there was heated debate amongst the
members of this particular group. I gathered from listening in to their discussion that
Atish wanted to include everything from his concept map, as it appeared to be better
than the others in the group. This indicated to me that the group was probably
frustrated by Atish's dominance and chose not to include the cross-links just to let
him know that he could not have his way all the time. However this was at the
expense of losing points for the cross-links.
The overall structure of Atish 's group effort is far more complex than the
individual effort. There are more concepts in the group endeavour indicating growth
in this topic. Moreover the levels of branching increased substantially as well,
revealing an integrated knowledge structure that the learners are developing when
they work as a group. According to Wallace and Mintzes (1990) these findings imply
a significant shift in the degree of concept differentiation and an increase in the total
number of mathematically acceptable links encoded and stored in learners cognitive
structure.
Figures 5.6 and 5.7 are individual and group concept maps, respectively for
Shival on the topic real numbers. The largest difference in scores occurs between
Shival's individual concept map and his group's concept map. Shival's effort did not
include linking words just concepts linked to the central concept but the fascinating
thing about this concept map was that the central concept was numbers whilst real

67
numbers appeared in the first branch. If we assume that Shival meant number system
when he wrote numbers then his understanding is quite profound since he sees real
numbers as a part of the number system . However the learner fails to see that rational
numbers, integers and decimals lie within the ambits of real numbers. Although the
group endeavour included many more concepts indicating that together as a group
they complemented each other's knowledge of the section it did not indicate much
depth in the understanding of real numbers as most ofthe links stem from the main
concept, real numbers. There is some branching from the concept natural numbers
and even a cross-link between prime and composite numbers indicating learners'
complexity in the understanding of natural numbers. Why was the group comfortable
in drawing links from natural numbers only? It's possible that they are most familiar
with this concept as it was introduced early in their primary school years and hence
they understand this concept better than the others.
Figure 5.6 Shival's individual concept map
on real numbers

•
68
•
;--' . -"(~tGJ ~.t <LN• ..-/--- ~
. ' ("~h ._. _.'- ~-... .
~,-..~ r~'~ '..: - '. ~ -~~~. .:' ¥ '
> .• - ./
Figure 5.7 Shival's group concept map on real numbers
5.2.2 Assessing concept maps of real numbers and data handling
Concept maps of real numbers were done right at the beginning of the study
whilst data handling was done eight months later, towards the end of the study. The
rationale for comparing these two concept maps was to see how learners developed in
the construction of concept maps , which will also reveal their conceptual development
during the course of the study. Both individually constructed concept maps for real
numbers and data handling were scored using Table 5.1. The concepts that I expected
for this section were drawn up from learners' textbooks and their notebooks. They
include: data representation, data collection, data representation, data interpretation,
surveys, questionnaire, tally tables, stem and leaf, bar graph , dual bar graphs, mean,
median and mode. For the construction of concept maps on data handling they were

69
given the same instructions as for the construction of real numbers, that is to use as
many concept as possible - these could be chosen from class discussions, textbooks,
notebooks and any others that they knew from previous knowledge. For the analysis
of the concept maps I chose six learners based on their scores in the June examin ation ,
ranging from the upper to the lower levels of the academic rung.
Table 5.3 Summary of mean scores for concept maps on
Real numbers and data handling
Categories
ConceptsValid linksBranchingCross-linksExamples
Mean scores for realnumbers
11 .836.502.17
I4.17
Mean scores for datahandling
23.3312.69
30.678.83
Figure 5.8 reveals that learners generally scored higher points in the latter
concept map of data handling than in real numbers.
,-- - - - .
25.00 ,I
'" 20.00 ['~~ 15.00 ]
11
: :: : '['
0.00 -
mean scores for real number and data handling(")(")
(")
N
I'<DNa ~ ~ ~
<D ._ , . _~. T _~_ -r- iI.T , _
Ul"0 ~._ 0.- IDro 0> C
oo
Ul'0 Cl Ul Ul
-" C -" ID
,§ Ul :.c .s 0.
:2 ID 0 u; E> c Ul ro
(ij .!!1 ~ 0 x> .0 t; ID
L .... __ .__ .categories on concept maps
Fi gure 5.8 Dual bar graph represen ting mean score s for real
numbers and data handling

70
The scores for 'concepts' and 'valid links' for the concept map on data handling
is significantly higher than for the concept maps on real numbers. There is a 97%
increase in concepts and an increase of95% in valid links. This is an indication of the
profound increase in the depth of knowledge as time progresses. The increase in valid
links reveals that learners have improved in the accuracy of their understanding. The
number of examples increased by an appreciable 111%. This is a clear indication of
the substantial increase in learners' specificity of knowledge. The number of cross
links is an indication of the cohesion in knowledge. Here the cross-links decreased by
49%. In this category the analysis revealed similar results to the previous set of
concept maps. Again the number of cross-links between learners' concept maps
showed no coherence. There was a maximum of two cross-links in some concept
maps whilst some had no cross-links at all.
I will now look at a few learners' concept maps. Figure 5.9 and 5.10 represents
Mitchlin's initial and latter concept maps. Mitchlin is an above average learner, his
scores reveal the highest difference between real numbers and data handling. The
following discussion reports on Mitchlin's progress. Firstly, in the concept map for
real numbers there are no examples cited to show how well he understands each
concept. Whereas in the concept map for data handling he offers examples for all the
ways to analyse data, for example he drew tally tables and stem and leafplots. For
data representation he mentioned the various graphs and even drew little bar graphs,
pie charts, and so on. Under interpretation of data he offers a brief definition for the
concepts: mean, median and mode. The concept map shows that the learner has a firm
grasp of concepts and a sound knowledge of how the concepts in data hand Iing are
linked to each other. This signifies that he has a good understanding of the
relationship that exists between the various concepts in this section.

71
For the concept map on real numbers Mitchlin used thirteen concepts whilst for
data handling he used thirty-four concepts. In data handling most concepts that appear
on his concept map were mentioned in class activities however a number of the
concepts discussed in class were not, for example under data collection he mentions
various other ways of collecting data other than those discussed in class. This leads
me to conclude that the learner engaged in extra reading on the sub-topic of data
collection and included it in his concept map. This is further evident as he offers
advantages and disadvantages of the various data collection techniques. This is
perhaps a reflection of how this learners' conceptual development has improved in
this section. For real numbers many concepts that were mentioned in class activities
are absent and two concepts are incorrectly linked, namely terminating decimals and
irrational numbers. Irrational numbers should have been linked to infinite decimals.
However it is interesting to see that this particular concept, "infinite decimal" is
absent from all learners' concept maps on real numbers. This is where I find concept
maps especially useful- it makes me, the educator aware of gaps in learners'
knowledge structure and areas that I may have not have discussed very well. Although
there are linking words, they are repeatedly used and nondescriptive. According to
Baroody and Bartels (2001) this indicates an incomplete understanding of the
relations between concepts or a lack of confidence in this section.

72
~eLu({RINQVO~
l.J..Q
lV>I -I~11
! l
i. ; . t
6/1_- " , ~ ..
JK! Cf:)1~;( L : ;1 )1 /~t.d{~
Figure 5.9 Mitchlin's concept map on real numbers

73
Figure 5.10 Mitch1in's concept map on data handling
The other concept map that I would like to comment on is Vukani's. His
performance in mathematics has been below average but has shown great enthusiasm
in class from the beginning of lessons using concept maps. He particularly enjoys the
assessments we engaged in this year, like the research project, designing a
questionnaire and collecting data and off-course the concept maps. There was a

difference of eleven points between his concept map for real numbers and that for
data handling.
Figure 5.11 Vukani's concept map on real numbers
Figure 5.12 Vukani's concept map on data handling
74

75
All of the ten concepts used in the real numbers concept map is valid however
there were many more concepts that were discussed in class that do not appear on his
concept map. This is probably an indication of an incomplete understanding of this
section. Yet concepts that are used are linked to other concepts using relevant linking
words. Thus I hypothesise that although he does not have a good knowledge of all
concepts, he does have a good grasp of the few concepts that he does list.
In data handling too, there are many concepts that were covered in class that
are excluded from his concept map but it does have more concepts than the concept
map for real numbers. For data handling there are thirteen valid links however there
are no linking words to suggest the extent to which he understands the relationship
between these concepts. In real numbers he uses one cross-link between prime and
comp osite numbers with the linking word opposite. Although this may be a mediocre
word to describe the relationship between the two concepts, it nevertheless expresses
his understanding of the link. This suggests that he has an accurate understanding of
the relationship between these two concepts and it indicates some complexity of
understanding of concepts that are already on the concept map. In data handling there
is one cross-link between questionnaire and tally tables but there is no linking word.
This is a valid link since data from the questionnaire is organized on a tally table
however I can only guess that he did not include a linking word because he was
unsure of the relationship that exists between the two concepts. Although both
concepts maps have peculiar strengths and weaknesses, judging from the scores for
each concept map I can conclude that there is some improvement in Vukani's
conceptual development across the study.
I am now going to examine Shahil 's concept maps for real numbers and data
handling more closely. Shahil is an above average learner and I wanted to compare

76
the development of his conceptual knowledge from the start of this study to the end of
this study by comparing his concept map on real numbers and data handling. For the
concept map on real numbers he used fifteen concepts and three levels of branching
with fourteen valid links. Whilst for data handling he used twenty-nine concepts, three
levels of branching and forty-four links. This shows a solid grasp of concepts and a
profound level of understanding, which is represented by the complex nature of his
concept map, and the elaborate connections that he sees between concepts in data
handling.
Shahil's knowledge and understanding of concepts in real numbers is
satisfactory compared to other learners' in this study . For example when compared to
Atish's individual concept map on real numbers, Shahil 's concept map has fewer
concepts and most are incorrectly linked.
Shahil's concept map on data handling shows a complex structure, indicating
an immense conceptual development across the study. The large number of levels of
branching and linking words in data handling is evidence of a more integrated
structure of his knowledge base than for real numbers. In addition he uses a vast
number of concepts for data handling than for real numbers that surpasses concepts
covered in class. For his concept map on real numbers many concepts that were
discussed in class are absent from the map, such as "recurring decimals and
fractions", Moreover the branching attached to Q' should have been linked to Q. This
indicates that the learner lacks the basic knowledge of real numbers. The use of
linking words is non-descriptive indicating a poor understanding of concepts in real
numbers. Even the examples quoted in some instances are incomplete for his concept
map in real numbers; "2" the first prime number is absent from the list he made . For
"terminating decimals" he incorrectly gives an example for "recurring decimals".
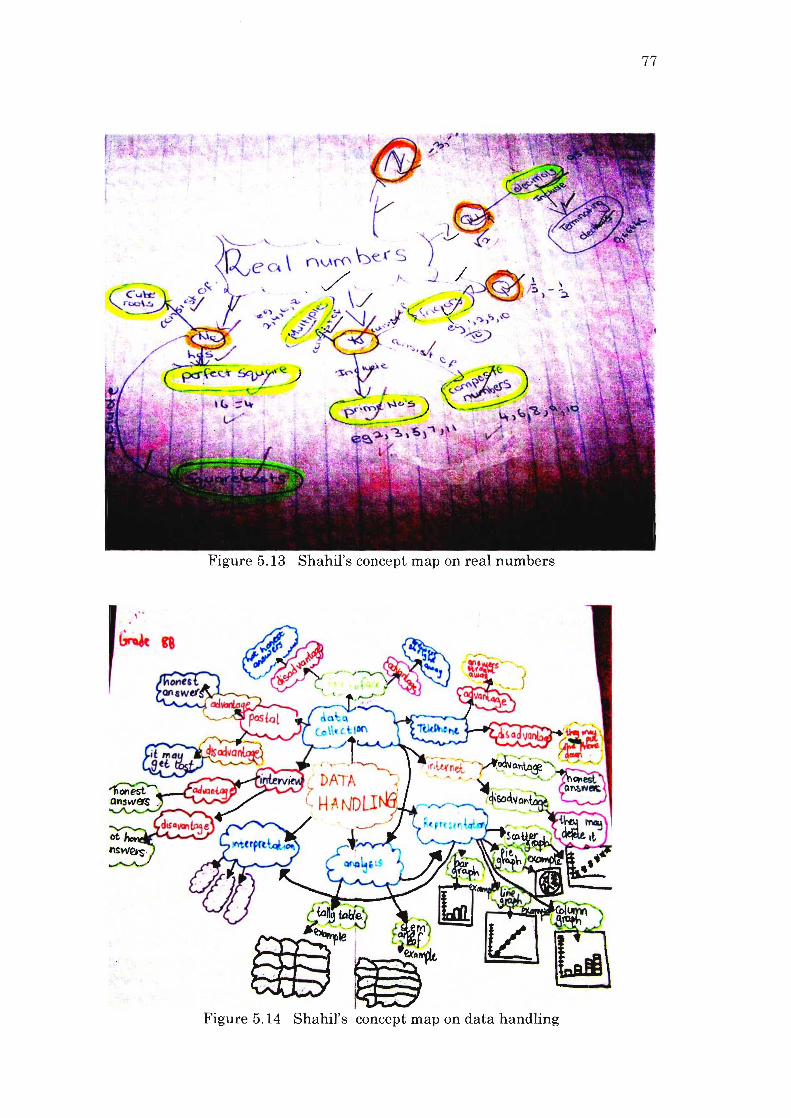
77
Figure 5.13 Shahil's concept map on real numbers

78
The analysis of concept maps helped me, as the educator to identify gaps in
learners' knowledge structure and to identify misconceptions in specific areas. This
insight helps me to make the necessary adjustments to my instruction to fulfil
learners' educational needs .
5.3 THE QUESTIONNAIRE
After ten months of concept map activities integrated with other mathematics
activities the grade eight learners who took part in this study answered a
questionnaire. All learners completed the questionnaire. The questionnaire that I used
was not a traditional one but incorporated some concept maps as well. Learners did
not experience any problems with understanding the concept maps in the
questionnaire. There was only one query from a second language speaker - she did
not understand what' grasp' meant. After a brief explanation the learner continued
answering the questionnaire.
5.3.1 Response to whether learners liked using concept maps during their
maths lessons and their reasons thereof
Of the thirty-four learners that responded to the questionnaire 29% liked using
concept maps in their mathematics lessons whilst 70% preferred using concept maps
sometimes during their mathematics lessons. 1% did not like using concept maps at
all. Some reasons offered by the 29% of learners that like using concept maps in their
maths lessons were: "Concept maps are fun and creative way to learn and understand
" (Denelle), "it is a helpful way to learn" (Vukani), "all the work is summarized so it
is easier to learn" (Denise), "It helps me remember the different topics more easily"

79
(Presantha) and "It helps me understand the whole section in one simple map
(Netrisha). The one learner that did not like using concept maps , found that" It is hard
to do and I don 't understand it" (Jessie). According to my reflective journal this
learner was not in my class for almost two weeks as he was part of the school choir
that was preparing for a competition. He missed the entire introductory lesson and
follow up activities that were designed to build learners confidence in constructing
concept maps. This could be a possible reason why he found it difficult.
Of the 70% that preferred to use concept maps ' sometimes ' , the general feeling
was that they, at times , found concept maps confusing and at other times they did not.
The reasons vary but three general categories seem to emerge.
The first one was that learners felt that it was easy to construct concept maps for
certain sections only. This is supported by the comments: " I chose sometimes
because when using it, it can be very helpful but for difficult sections it can be very
confusing" (Leshav), " It helps with certain topics in maths not all" (Kershan) and
"Sometimes it is confusing and sometimes its easy to understand, it all depends on
what it is about" (Shival). From these reasons it is possible that learners find it
difficult to construct concept maps for the more challenging sections. This was also
evident from analysing learners' concept maps. Learners produced far more integrated
concept maps for data handling than for real numbers. Real numbers is in fact a
difficult topic within the grade eight syllabus.
The second general category that became apparent was learners' preference to
use concept maps that were drawn by their teacher rather than concept maps drawn by
them. This is exemplified by the following responses: " It is a nice way to learn, but
sometimes gets confusing when constructing your own" (Akshay), "Sometimes when

80
my teacher is drawing on the board , it just clicks in my head and I understand
everything." (Wandile).
A third general theme that emerged was based on the time constraints of
constructing concept maps. This is demonstrated by the comment: "It can be very
helpful although it can be very time consuming. . ."(Leshav).
Learners' who preferred using concept maps, 'sometimes', had many positive
comments to make about concept maps. Firstly, learners found it to be helpful in their
understanding of maths concepts during the times that they did like using them. This
is indicated by the statements: " . .. but when we do one it helps to understand how
sections are linked but sometimes I just don't get it" (Kamilla), and "It does make
your work easier when you do use it" (Serisha). Secondly, some learners found it
useful whilst revising. This is illustrated by the following: " it is also good when we
study because we can see how each concept is linked to the other" (Renita) and
"Sometimes it is easy to do and understand and it can help with the exam" (Denise).
5.3.2 Responses to when learners found concepts maps useful
In Table 5.4 learners' reasons for using concept maps at the beginning of a
section are recorded . In response to when learners found concept maps most useful,
Table 5.4 Aggregated responses for the usefulness
of concept map
Yes No
End of section 79% 21%
During section 85% 15%
Beginning ofsection 48% 52%
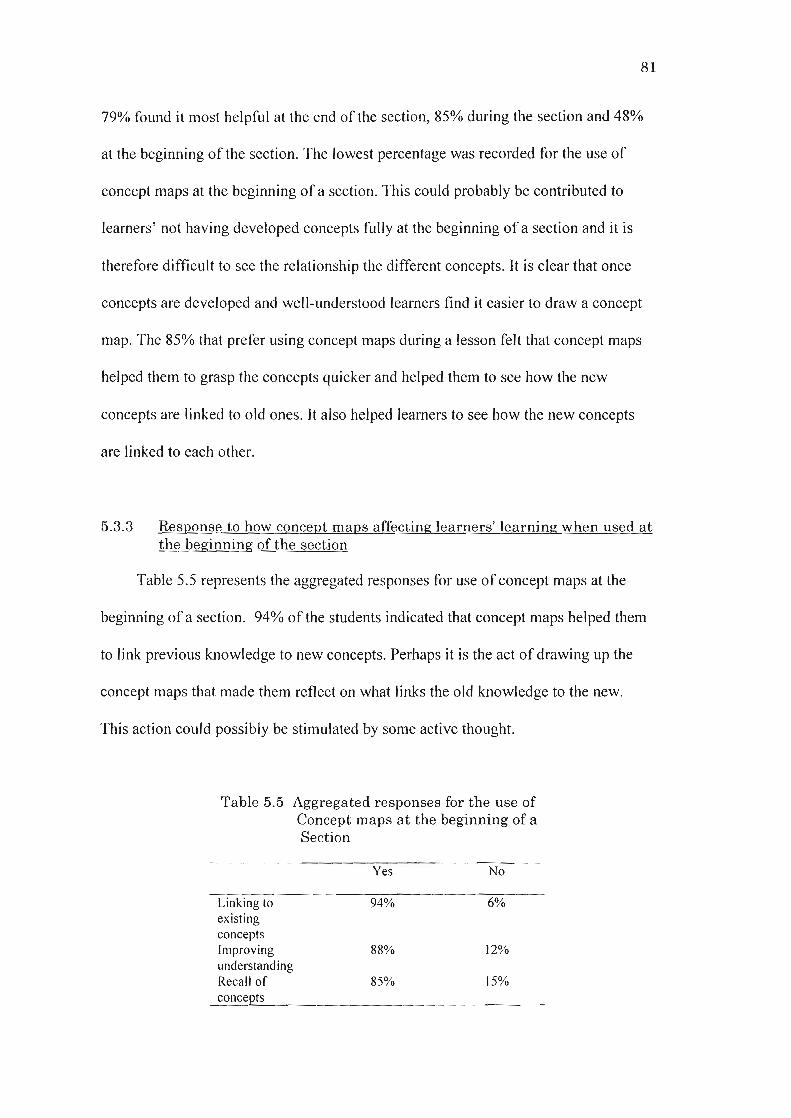
81
79% found it most helpful at the end of the section, 85% during the section and 48%
at the beginning of the section . The lowest percentage was recorded for the use of
concept maps at the beginning of a section. This could probably be contributed to
learners' not having developed concepts fully at the beginning of a section and it is
therefore difficult to see the relationship the different concepts. It is clear that once
concepts are developed and well-understood learners find it easier to draw a concept
map. The 85% that prefer using concept maps during a lesson felt that concept maps
helped them to grasp the concepts quicker and helped them to see how the new
concept s are linked to old ones . It also helped learners to see how the new concepts
are linked to each other.
5.3.3 Response to how concept maps affecting learners' learning when used at
the beginning of the section
Table 5.5 represents the aggregated responses for use of concept maps at the
beginning of a section. 94% of the students indicated that concept maps helped them
to link previous knowledge to new concepts. Perhaps it is the act of drawing up the
concept maps that made them reflect on what links the old knowledge to the new.
This action could possibly be stimulated by some active thought.
Table 5.5 Aggregated re sponses for the use of
Concept maps at the beginning of a
Section
Yes No
Linking to 94% 6%
existingconceptsImproving 88% 12%
understandingRecall of 85% 15%
concepts
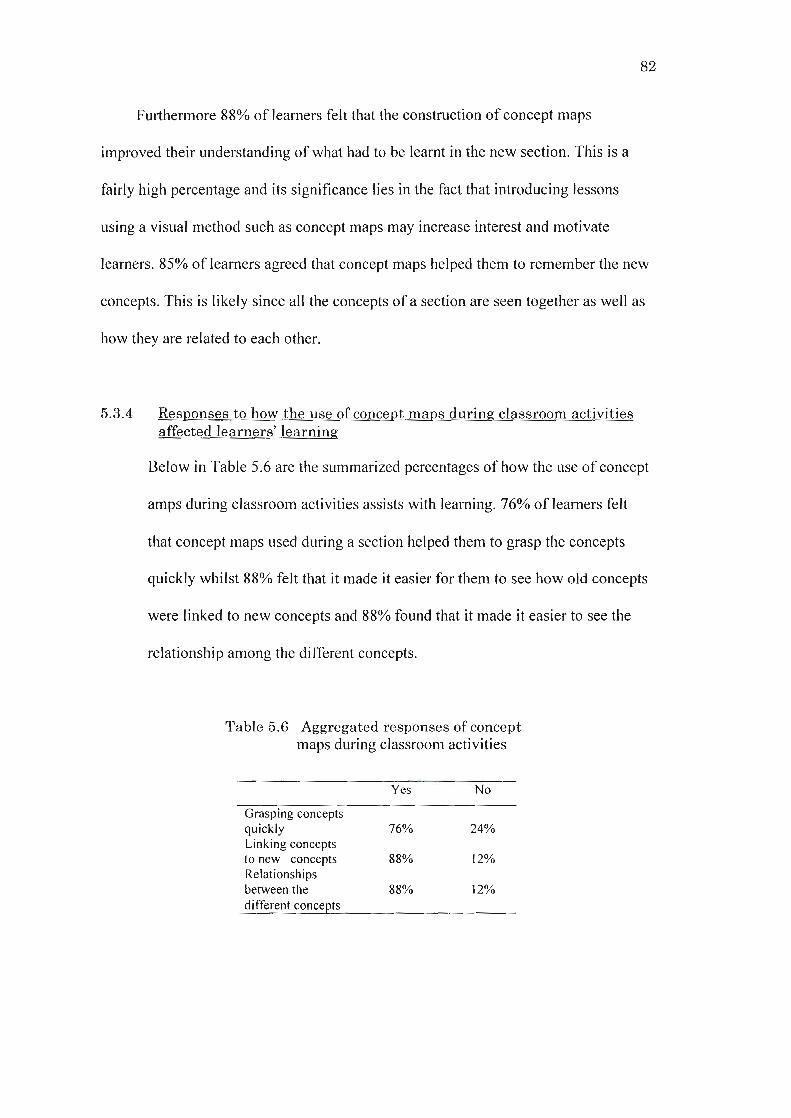
82
Furthermore 88% of learners felt that the construction of concept maps
improved their understanding of what had to be learnt in the new section. This is a
fairly high percentage and its significance lies in the fact that introducing lessons
using a visual method such as concept maps may increase interest and motivate
learners. 85% of learners agreed that concept maps helped them to remember the new
concepts. This is likely since all the concepts of a section are seen together as well as
how they are related to each other.
5.3.4 Responses to how the use of concept maps during classroom activities
affected learners' learning
Below in Table 5.6 are the summarized percentages of how the use of concept
amps during classroom activities assists with learning. 76% of learners felt
that concept maps used during a section helped them to grasp the concepts
quickly whilst 88% felt that it made it easier for them to see how old concepts
were linked to new concepts and 88% found that it made it easier to see the
relationship among the different concepts.
Table 5.6 Aggregated responses of concept
maps during classroom activities
Yes No
Grasping conceptsquickly 76% 24%
Linking conceptsto new concepts 88% 12%
Relationshipsbetween the 88% 12%
different concepts

83
5.3.5 Responses to how the use of concept maps used at the end of a section
affected learners' learning
The responses for the use of concept maps at the end of a section are shown in
Table 5.7. Analysis of the questionnaire reveals that 91% oflearners found it helped
them to see how old concepts are linked to new ones. Again it can be noted that at the
end of the section the learner can appreciate seeing all the concepts and the
relationships that exist among concepts in just one map. This observation is supported
by 85% of learners who claim that concept maps helped them to see the relationship
among the different concepts. In addition 79% of learners found concept maps
Table 5.7 Aggregated responses for the use of
concept maps at the end of a section
Yes No
Linking old 91% 9%
concepts to newconceptsGrasp the 79% 21%
concepts quicklyHelped to see the 85% 15%
relationshipbetween concepts
discussed at the end of the section helped them to grasp the concepts quickly which
assists in understanding how the whole section fits together. This is probably due to
the concept map displaying all the concepts of a section in a single map. Denelle who
felt that concept maps "summarizes all the work so it is easier to learn" supports this.
5.3.6 Responses to whether learners will use concept maps to revise
The reasons quoted by the 82% of learners that will use concept maps when
revising, were varied but insightful. The general feeling was that it made
understanding of mathematical concepts easier and that this method of learning was
quick and easy. This is characterized by the following comments: "It is easier to learn

84
from as less reading is required" (Akshay), "It helps me to fully understand when I'm
revising" (Kraig) and "It will make it easier for me when I'm learning and I will
understand it better" (Nirashika).
The other 18% of learners provided different reasons for how concept maps
helped with their understanding during revising. The reasons could be grouped into
three themes. In the first instance learners claim that it synthesizes and integrates
information, ideas and concepts which assists in memorizing of subject matter. This is
exemplified by the following responses: "I learn quicker because it is easy to
remember" (Vukani) and" It helps me to remember what to learn and it is easy to
learn in this way" (Dalene).
The next theme relates to the linking of concepts that helps to organize
information into meaningful groups. These learners felt that seeing all the concepts at
once, helps to improve their understanding of the topic. Denelle responded, " It shows
me which sub-heading falls under which heading and shows me the joining of
sections", whilst Renita retorted, "I am able to learn better by seeing how all terms
are linked, it is easier to remember" and Zondi reported, "Yes I will use it to revise
because it helps me to understand things better when I know how they 're linked".
The other theme explains that understanding is easy when notes are
summarized. This is typified by the following responses: "I will use it when revising
because it makes it easier for me to learn and understand when terms are summarized
and made into simpler sentences" (Denelle), "It makes it easy to understand, it is less
confusing than looking at chunks of notes" (Ashiel) and "It is easier because there is
less to learn from but you still get a better understanding than if we had to go through
booklets of notes"(Presantha).
85
5.3.7 Responses to whether learners preferred concept map tests to traditional
tests
76% of learners prefer taking concept map tests whilst 24% prefer traditional
tests. The general feeling amongst learners who prefer traditional tests gave the reason
that they prefer it because they've used this format since primary school, however
they claimed they liked using concept maps to revise. This is confirmed by the
following comments: "I prefer writing traditional tests but I like using concept maps
to learn" (Elton) and "I don't understand concept map tests, but it is easier to learn
from a concept map" (Netrisha).
Learners that prefer concept map tests generally felt that they were easier to do
and a fun and enjoyable way to be assessed. This is illustrated by the following
comments: "It is easier than traditional tests" (Suhana) and "Yes I will use it to revise
because it helps me to understand things better when I know how they linked"
(Zondi). Renita wrote, "Concept maps are easier, traditional tests are complicated".
Some felt that concept map tests were a good reflection of their understanding
of how concepts are linked to each other. This is exemplified by the following
comments: "I learn a lot more when I do concept map tests; it shows my
understanding of links between things" (Kamilla) and "Concept maps are useful for
testing because it proves your understanding of where each concept fits" (Leshav).
Others liked using concept maps because it allowed them to express
themselves creatively, hence making maths fun. This is shown by comments such as:
"It is more enjoyable when I can be creative and express myself with colours. It
makes maths fun for me" (Atish) and "Concept maps makes maths fun, when school
is fun the learners will want to learn" (Mitchlin).

86
Whilst some indicated that concept maps allow them to retain knowledge well
after the test is written. This is typified by the following comment, "It is easy to
remember what I have studied, even after I had finished the exam" (Presantha).
The analysis of the concept maps helped me to discover the extent oflearners'
conceptual development, whilst the questionnaire revealed that learners had mixed
feelings about using concept maps during a lesson. However there was overwhelming
support for the use of concept maps at the end of a section as learners found it very
helpful when revising. The questionnaire also revealed that learners found it easier to
remember a section when it was introduced using a concept map. The interview
served to clarify issues that were unclear in the concept maps and to probe ambiguous
comments in the questionnaire.
5.4 SUMMARY
Analysis of the questionnaire and interview revealed that aside from enjoying
concept map activities due to its creative non-competitive nature, there were positive
cognitive and affective outcomes from the group work tasks. Learners appreciated the
positive social factors associated with group work and reported that the support and
assistance of group members helped with their learning. Learners also acknowledge
that the discussion in the group made them re-evaluate their understanding of their
concept maps. Analysis of the group and individual concept maps showed that
concept maps revealed a more integrated and complex structure after the group work
interaction. This provides further evidence that group work assists in improving
learners' cognitive structures. This translates to learners gaining a more in depth
understanding of concepts and cohesion of knowledge for that particular section.
87
Comparison of concept maps done at the beginning and end of the study show
considerable increase in structural complexity and integration. This is an indication of
the cognitive growth amongst learners as time progressed. The number of concepts
and valid links for the latter concept map increased significantly. This indicates
accuracy in understanding of concepts. Furthermore there was an appreciable increase
in the number of examples quoted in the second concept map. Hence demonstrating
that learners' specificity in knowledge was also enhanced as the study progressed.
The analysis of the concept maps helped me to determine the extent oflearners'
conceptual development, whilst the questionnaire revealed that learners displayed
mixed feelings for using concept maps during a lesson . There was overwhelming
support for the use of concept maps at the end of a section as learners found it an
invaluable tool to revise . The interview served to explain issues related to the group
work activities and clarified parts of the questionnaire that I did not fully understand.

88
CHAPTER 6
DISCUSSION, LIMITATIONS AND
RECOMMENDATIONS
The focus of this research was to investigate learners' conceptual development in
mathematics in a grade eight class. This investigation was guided by the following
key research questions:
1. What are the advantages and disadvantages of using concept maps to
teach mathematics? - A literature perspective.
2. Can concept maps facilitate group-work?
3. Are concept maps an effective learning tool for mathematics for grade eight
learners?
4. Can concept maps provide valid information for the teacher about learners'
knowledge of mathematical concepts?
5. How can concept maps assessments be practically applied to classroom
situations?
6. Do concept maps develop grade eight learners' conceptual understanding
through the comparison of successive concept maps?
6.1 DISCUSSION
I will now use the above key questions as a backdrop to discuss my findings,
make recommendations and list the limitations of my study. From the discussion in
the previous chapter I will make general conclusions from the findings of this study
and support these findings from previous research wherever possible. Within the

89
realms of the classroom this study provided remarkable findings about the use of
concept maps . Within the constraints of this study I would like to present the
following conclusions.
6.1.1 Use of concept maps to assess declarative knowledge
The study revealed that concept maps was an effective tool to measure
changes in learners' knowledge structure. Comparison of successive concept maps
helped to determine learners' knowledge acquisition. Learners' conc ept maps
revealed a more integrated and complex structure after the group work interaction.
For example, Shival 's individual concept map in Figure 5.6 showed a substantial
growth in concepts and how they are linked to each other after the group-work session
(see Figure 5.7 for Shival's group concept map on real numbers). This translates to
learners gaining a more in depth understanding of concepts and cohesion of
knowledge for that particular section when learners confer with each other in a group.
Furthermore comparison of concept maps done at the beginning and end of the
study show considerable increase in structural depth and cohesion of concepts. This
was apparent when examining the sample of chosen concept maps on real numbers
that was done at the beginning of the section to concept maps on data handling that
was done at the end of the section. The latter concept maps on data handling included
many more concepts and showed integrated branching and cross-links, indicating
complex cognitive growth as time progressed. Learners' latter concept maps also
revealed elaborate connections and a better quality of linking words, revealing a firm
grasp of concepts and a profound level of understanding.
90
6.1.2 Group-work using concept maps
The use of concept maps proved to be very effective in learning within a
group. Learners benefited immensely from working with their peers as they assisted
each other when concepts were omitted or incorrectly linked. They engaged in
animated discussion about which concepts should be included and which should not
be included. Most importantly even the reserved learners participated in these
discussions. They enjoyed the social dynamics that group work provided and
enhanced their understanding at the same time. Learners especially appreciated
working in groups in this particular instance as they were working with a new
technique. Novak (1990) shows that when learners work in small groups and co
operate in striving to learn the subject matter, encouraging cognitive and affective
results are observed. White and Gunstone (1993) found that concept maps promote
serious debate even amongst learners that generally do not participate in class
discussion. They suggest that this is perhaps due to the "purposeful" and "physical
acts" that building of concept maps involve. In addition they add that although the
intellectual challenge of concept maps cannot be contested, concept maps do not pose
the competitive threat that traditional forms of testing pose. This is probably due to
concept maps not having right or wrong answers.
6.1.3 Affective Factors
Based on evidence obtained from the questionnaire during the study learners
enjoyed the creativity and freedom that concept maps allowed. Generally learners
enjoyed their maths lesson s because concept maps introduced fun and hands on
activities, which were different from traditional maths lessons, were learners worked
through mundane exercises. However, according to the questionnaire there were

91
learners that did not like using concept maps during their lessons. Thi s might be due
to the nature of the knowledge used in concept maps . Concept map tasks do not test
the procedural knowledge that makes many learners nervous. It tests another aspect
the conceptual knowledge. A study conducted by Jegede, Alaiyemola and Okebukola
(cited in Novak, 1990) recorded learners' anxiety levels whilst working on concept
maps. They used the Zuckerman's Affect Adjective Checklist to determine students'
levels of anxiety and found that students using concept mapping displayed a highly
significant reduction in anxiety levels . Another author White and Gunstone (1993)
believes that the friendly and non-threatening nature of concept maps allows learners
to contribute freely to concept map activities yet simultaneously revealing a wealth of
information of their knowledge structure.
6.1.4 Promotes Learning
Learners found concept maps to be a helpful way to learn as all the
information is summarized in one simple map. They concur that concept maps could
be used as a summary of their notes from which it is easier to learn rather than going
through copious amounts of work which was evident from analysis of the
questionnaire. Wandersee (1990) in his article Concept Mapping and the Cartography
ofCognition also outlines the benefit of using concept maps to summarise
information. These findings are consistent with work done by Novak (1990), who
declared that concept maps help learners " learn how to learn". He explains further that
it could be the organisational structure of the material and the easy recognition of how
concepts are inter-related that helps learners make sense of new knowledge.
Some learners found that it was easier to remember information when learnt
from a concept map that was designed by the educator. Learners found that it was

92
easier to remember because they could see the relationships between the concepts,
which helped them understand the section. Willerman and Harg (1991) found similar
findings in their study that used concept maps to introduce a new topic (used concept
map as an advanced organi zer). They found that learners' achievement improved
significantly when introduced with concept maps. They believe that learners retained
the information better due to the visual and organisational nature of the concept maps .
They add that another reason for the effecti veness of using concept maps could be
attributed to the teacher designing the map. Since then the map was more complete
and accurate than a learner-constructed concept map.
Other learners found that when they used concept maps , they could still
remember information well after the test or exam was written. Novak (1990) report
that many educators and learners are surprised to see how this simple tool facilitates
meaningful learning and aids in the retention of knowledge for longer.
Although learners found concept maps helpful to revise and to use during lessons,
some preferred conventional tests to concept map tests. Those that supported this
view offered that they were familiar with conventional type assessments and will
therefore perform better.
6.1.5 Information for the teacher
Concept maps provides a wealth of information to the educator. Examining
learner maps helped me gauge misconceptions and gaps in learner understanding.
This helped me to ascertain whether learner understanding was coherent with what I
expected. It also helped me to judge the shortfalls in my instruction. According to
Baroody and Bartel s (2001) concept mapping can be an invaluable tool for assessing
the meaningful learning of mathematics. They expand that it helps to determine the
93
accuracy and depth of learner understanding. White and Gunstone (1993) claim that
close inspection of concept maps can result in reconsideration of teaching styles to fill
in particular gaps in learners' knowledge structure.
6.1.6. Concept map assessments
Although this study successfully established that concept maps could be used
to determine learners' conceptual development, the practicality of scoring concept
maps is still problematic. In South African schools educators are comfortable with
assigning a score out of a total that can be subsequently expressed as a percentage.
Since concept maps are unique there is a possibility that a concept map could be
scored more than the criterion-referenced concept map. This is possible since there
are innumerable variations to any particular concept map. For an average classroom
educator the number of variations could be quite daunting to assess in terms of time
and intellectually challenging to score divergent concept maps.
It is suggested that an analytical rubric be designed based on the degree of
correctness for each component of the map. For example a score of one could be
assigned for using a linking word, a score of two for a non-descriptive linking word
and a score of three for a relevant, descriptive linking word. A maximum score of
three could be given to each relevant component of the concept map. The total is
achieved by adding the individual scores for each category, which can then be
expressed as a percentage.
Analysis of the questionnaire shows that majority of learners prefer using
traditional types of assessment as opposed to concept map assessments whilst still
acknowledging the benefits of concept mapping to their conceptual development.
Their reason for this preference is that they are familiar with this format since it's the

94
only one they've been exposed to since primary school. This is a sensible reason.
Hence it is suggested that more concept map activities be included in the classroom as
this study and past literature indicates a wealth of value to both the educator and the
learner.
6.2 RECOMMENDATIONS OF THE STUDY
For school educators, the concept map can be added to their repertoire of
instructional and evaluation practices. Conventional techniques test procedural
knowledge whilst concept map tasks evaluate learners' conceptual knowledge, which
is based on the understanding of inter-relationships among concepts. Concept maps
also serve as a heuristic for learning. Examining successive concept maps reveals the
extent oflearners' conceptual development.
In this study the use of concept maps as an advanced organizer proved to be an
effective means to introduce a new topic. Learners found that concept maps designed
by the educator presented information in an organised and visually appealing way that
encouraged learner participation. Moreover learners found that they could retain
information longer since the advance organizer designed by the educator gave
learners better direction to their learning than individually designed concept maps.
However the value of individually designed concept maps by learners cannot
be denied. They allow the educator even whilst observing the construction of concept
maps, to gauge the gaps in learners' knowledge and identify their misconceptions.
This allows the educator to make the necessary adjustments to instruction to remedy
learner difficulties.
This study also revealed that concept maps could be used to facilitate
collaborative learning. The results indicate that when learners worked in groups whilst

95
trying to make sense of which concepts link with each other, positive cognitive and
affective outcomes were recorded.
6.3 LIMITATIONS
My aim for this study was to determine learners' conceptual development. It
would have been ideal to compare successive concept maps of the same topic
however the constraints of completing the syllabus and assessing learners
continuously did not allow me to do this. I therefore examined the structural
complexity of maps constructed for different sections.
This is a small-scale study undertaken in a particular school where a class of
thirty-four learners participated. The context of this school and the background of the
learners are specific to this sample and might or might not be the case in other
situations. Each educator is unique and would approach the teaching of concept maps
differently, which will influence the outcome differently. It is a limitation that the
findings of this study are specific to a particular sample of learners. This sample
cannot be said to be representative of all schools and all grade eight learners in South
Africa. As such the findings may not be generalised to all learners within South
Africa. However I believe that when educators read this study it will assist them to
use concept maps in the various outcomes discussed in this thesis.
6.4 CONCLUSION
This study examined the use of concept maps as a vehicle for exploring learners'
conceptual understanding in mathematics in a grade eight class. One of the findings of
this study indicates that learner' concept maps showed substantial and important

96
changes after the group-work session. Furthermore comparison of successive concept
maps indicates that the latter concept maps increased in structural complexity by way
of more concepts and linkage of concepts. Since concept mapping requires learners to
explicitly describe the connections between concepts, it provides educators with an
invaluable tool to gauge the correctness of learners' knowledge and understanding.
This study also provides support for the use of concept maps as an advanced
organiser. Moreover the study revealed that learners preferred studying from a
concept map prepared by the educator as they then have complete concept maps
available to them for reference and reviewing during a section.
97
REFERENCES
Ali, S., & Kelly, M. (2004). Ethics and social research. In C. Seale (Ed.), Researching
Society and Culture (pp. 116-126). New York: Sage Publications.
Artz, A. F., & Newman, C. M. (1990). How to use Cooperative Learning in the
Mathematics Class. Virginia: The National Council of Teachers of
Mathematics,Inc.
Ausubel, D. P., Novak, J. D., & Hanesian, H. (1968). Educational Psychology
A Cognitive View. New York: Holt, Rinehart and Winston Inc.
Ausubel , D. P., & Robinson, F. G. (1969). School Learning: An Introduction to
Educational Psycholoy. New York: Holt , Rinehart and Winston, Inc.
Bamford, D. A. (2003). The Visual Literacy White Paper. Sydney: Art and Design
University of Technology.
Baralos, G. (c200S). Concept Mapping as Evaluation Tool in Mathematics. Greece:
Centre for Educational Research.
Baroody, A. J., & Bartels, B. H. (2001). Assessing undertanding in mathematics with
concept mapping. Mathematics in School , 30(3).
Bloch, A. (2004). Doing Social Surveys. In C. Seale (Ed.), Researching Society and
Culture (2nd ed., pp. 164-177). New Delhi: Sage Publications.
Boxtel, C., Linden, J., Roelofs, E., & Erkens, G. (2002). Collabative concept
mapping: Provoking and supporting meaningful discourse. Theory Into
Practice, 41(I), 40-46.
Bruner, J. (1990). Acts ofMeaning. Cambridge: MA:Harvard University Press.
Buzan, T. (2006a). The Buzan Study Skills Handbook. Essex: BBC Active.
Buzan, T. (2006b). Mind Mapping. Essex: BBC Active.
Buzan, T., & Buzan, B. (2003). The Mind Map Book. London: BBC Worldwide
Limited.
Carey, S. (1984). Conceptual Change in Childhood. Cambridge: MA: MIT Press.
Charles Stuart University. (2000). How we learn. Professional Development Online.
Available: http:/hcs.csu.edu.au/pro_dev/ [2004,9 January 2004].
Clements, D. H., & Battista, M. T. (1990). Constructivist Learning and Teaching.
Arithmetic Teacher.

98
Cohen, L., Manion, L., & Morrison, K. (2007). Research Methods In Education. New
York: Routledge.
Deese,1. (1965). the structure ofassociations in language and thought. Baltimore:
Johns Hopkins Press.
Doolittle, P. E. (1997 ,2001). Vygotsky's zone ofproximal development as a
theoretical foundation for cooperation learning. "Journal on Excellence in
College Teaching. Available: Funderstanding [2008 , 08/04/2008].
Durrheim, K., & Wassenaar, D. (2002). Puting design into practice: writing and
evaluating research proposals. In M. T. Blanche & K. Durrheim (Eds.),
Research in Practice : Applied Methodsfor the Social Sciences. Cape Town:
University of Cape Town Press.
Edmondson, K. M. (1995). Concept Mapping for the Development of Medical
Curricula. Journal ofResearch in Science Teaching, 32(7), 777-793.
Educational Broadcasting Corporation. (2004). Constructivism as a Paradigm for
Teaching and Learning. thirteenedonline. Available:
http://www.thirteen.org/edonline/concept2class/constructivism/index.html
[2007,01/1 0/2007].
Ernest, P. (1994). What is Social Constructivism in the Psychology of Mathematics
education? In P. Ernest (Ed.), Constructing Mathematical Knowledge:
Epistemology and Mathematics Education. London: Falmer Press.
Fontana, A., & Frey, 1. H. (2000). The Interview: From Structured Questions to
Negotiated Text. In N. K. Denzin & Y. S. Lincoln (Eds .), Handbook of
Qualitative Research. London: Sage publications.
Goldsmith, T., & Johnson, P. (1990). A structural assessment of classroom learning.
In R. Schvaneveldt (Ed.), Pathfinder associative networks: Studies in
knowledge organization (pp. 241-254). Norwood, New Jersey: Ablex
Publishing Corporation.
Greeff, M. (2006). Information Collection:Interviewing. In A. d. Vos (Ed.), Research
at grass roots : For the Social Sciences and Human Service Professions.
Pretoria: Van Schaik.
Greene, J. C. (2008). Is Mixed Methods Social Inquiry a Distincive Methodology?
Journal ofMixed Methods Research, 2(1), 7-22.
Haas, S. C. (2003). Algebra for gifted visual-spatial learners. Gifted Education
Communicator/Spring), 34(1),30-32; 42-43.
Hendron, 1. (2007). Advance & Graphical Organizers: Proven Stratgies Enhanced
through Technology. Goochland County Public Schools. Available:
http://www.glnd.kI2.va.us/resources/graphicalorganizers/ [2008, 27 March
2008].

99
Hennie, E., Rensburg, W. V., & Smit, B. (2004). Finding your way in qualitive
research. Pretoria: Van Shaik.
Holsti, O. R. (1969). Content Analysis for the Social Sciences and Humanties.
Reading, MA: Addison-Wesley.
Howe, M. 1. A. (1991). A Teacher's Guide to the Psychology ofLearning. Cambridge:
Basil Blackwell.
Huitt , W. (2003). Constructivism. Valdosta State University. Available:
httpllchiron.valdosta.edu/whuitt/col/cogsys/construct.html [2008, 04 April
2008].
Ivankova, N. V., Creswell , J. W., & Clark , V. L. P. (2007). Foundations and
approaches to mixed methods research. In K. Maree (Ed .), First Steps In
Research (pp. 253-282). Pretoria: Van Schaik Publishers.
Karoline Afarnasaga-Fuata'i. (2004). Concept Maps and Vee Diagrams as Tools for
Learning New Mathematics Topics. Paper presented at the First International
Conference on Concept Mapping, Pamplona, Spain.
Kemmis, S., & McTaggart, R. (2000). Participatory Action Research. In N. K. Denzin
& Y. S. Lincoln (Eds.), Handbook ofQualitaive Research. London: Sage
Publications Inc.
Klausmeier, H. J., Ghatala, E. S., & Frayer, D. A. (1974). Toward a Theory of
Conceptual Learning and Development, Conceptual Learning And
Development: A Cognitive Vie"w (pp. 4-26) . New York: Academic Press Inc.
Krippendorff, K. (2004). Content Analysis: An Introduction to its Methodology.
London: Sage Publications.
Kumar, R. (2005 ). Research Methodology: A Step-By-Step Guide For Beginners
(second ed.). London: Sage Publications.
Leou, S., & Liu, J. c. (2004). The Study ofConcept Map Implementation For
Enhancing Professional Knowledge Ofa High School Mathematics Teacher.
Paper presented at the First International Conference on Concept Mapping,
Pamplona, Spain.
Malone, l., & Dekkers, J. (1984). The concept map as an aid to instruction in science
and mathematics. School science and Mathematics, 84, 220-231.
Maree, K., & Pieterson, J. (2007). Surveys and the use of questionnaires. In K. Maree
(Ed.) , First Steps in Research (pp. 154-170). Pretoria: Van Shaik Publishers.
Markham, K. M., Mintzes, J. L, & Jones, M. G. (1994). The Concept Map as a
Research and Evaluation Tool:Further Evidence of Validity. Journal of
Research in Science Teaching, 31(1), 91-101.

100
Markow, P. G., & Lonning, R. A. (1998). Usefulness of Concept Maps in College.
Journal ofResearch in Science Teaching, 35(9), 1015-1029.
Matthews, W. 1. (2003). Constructivism in the Classroom: Epistemological, History,
and Empirical Evidence. Teacher Education Quarterly, Summer, 51-64.
McClure, J. R., Sonak, 8., & Suen, H. K. (1999). Concept Map Assessment of
Classroom Learning: Reliability, Validity and Logistical Practicality.
Journal ofResearch in Science Teaching, 36(4), 475-492.
McMahon, M. (c 1999,21 November 1997). Social Constructivism and the World
Wide Web. ASCILITE. Available:
http://www.ascolite.org.au/conferences/perth97/papers/Mcmahon/Mcmahon.
htm [2008, 11/08/2008].
McNiff, J., & Whitehead, 1. (2002). Action Research:Principles and Practice. New
York: Routledge Falmer.
McNiff, J., & Whitehead, J. (2005). Action ResearchJor Teachers: A practical guide.
Suffolk: David Fulton Publishers.
Mouton, J. (2001). How to succeed in your Master's and Doctoral Studies. Pretoria:
Van Shaik.
Mwakependa, W., & Adler, J. (2003). Using Concept Mapping to explore Students
Understanding and experiences of School Mathematics. African Journal ofResearch in SAlT, 7, 51-62.
Publications.
Nieuwenhuis, J. (2007). Qualitative research designs and data gathering techniques. In
K. Maree (Ed.), First Steps in Research (pp. 69-97). Pretoria: Van Schaik
Publishers.
Novak, J. D. (1977). A Theory ofEducation. London: CorneIl University Press.
Novak, J. D. (1990). Concept Mapping: A Useful Tool for Science Education.
Journal o.lResearch in Science Teaching, 27(10), 937-949.
Novak, J. D. (2002). Meaningful Learning: The essential factor for conceptual change
in limited or appropriate or propositional hierachies (liphs) leading to
empowerment of learners. Science Education, 86(4), 548-571.
Novak, J. D., & Canas, A. J. (2006, 12/12/2006). The Theory Underlying Concept
Maps And How to Construct Them:Technical Report IHMC CmapTools .
Florida Institute for Human and Machine Cognition. Available:
http://cmap.ihmc.us/Publications?ResearchPapers?TheoryUnderlyingConce
ptMaps.pdf [2007, 17/07/2007].

101
Novak, J. D. , & Gowin, D. B. (1984). Learning How to Learn. Cambridge:
Cambridge University Press.
Olivier, A. 1. (1992). Handling pupils' misconceptions. In Moodley & Njisane &
Presmeg (Eds.), Mathematics Education for In-service and Preservice
Teachers. Pietermaritzburg: Shuter and Shooter.
Ozdemir, A. S. (2005). Analyzing Concept Maps as an Assessment (Evaluation) Tool
in Teaching Mathematics. Journal ofSocial Sciences, 1(3), pp . 141-149.
Pedro, H. M., Eduardo, G., & Ramon, G. (2003). Concept Maps in Mathematics: A
Possible Framework For Studens' Assessment. Spain: Universitat da
Valencia.
Posner, M., & Raichle, M. (1994). Images of Mind. New York: Scientific American
Library.
Qhobela, M., Rollnick, M., & Stanton, M. (2004). Use ofconcept maps within a
sociocultural setting: lessons from an access programme.
Reason, P. (2001). Learning and Change through Action research. Centre for
Research in Proffesional Practice. Available:
http://www.bath.ac .uk/carpp/publications/actionJesearch.html.
Resnick, L. B., & Ford, W. W. (1981). The Psychology ofMathematics For
Instruction. New Jersey: Lawrence Erlbaum Associates.
Rice , D. C., Ryan, J. M., & Sarnson, S. M. (1998). Using Concept Maps to Assess
Student Learning in the Science Classroom: Must Different Methods
Compete? Journal ofResearch in Science Teaching, 35(10), 1103-1127.
Roth, W. R., & Roychoudhury, A. (1992). The Social Construction of Scientific
Concepts or the Concept Map as Conscription Device and Tool for Social
Thinking in High School Science. Science Education, 76, 531-557.
Royer, J. M., Cisero, C. A. , & Carlo, M. S. (1993). Techniques and Procedures for
Assessing Cognitive Skills. Review ofEducational Research, 63(2), 201
243.
Ruiz-Primo, M. A. , & Shavelson, R. (1996). Problems and Issues in the Use of
Conept Maps in Science Assessment. Journal ofResearch in Science
Teachin g, 33(6),569-600.
Santhanam, E., Leach, c., & Dawson, C. (1998). Concept Mapping: How Should It
Be Introduced, and Is There Evidence for Long Term Benefit? High er
Education, 35(3) , pp . 317-328.
Schostak, J. (2003) . An introduction to Qualitative Research. Available:
http://www.uea.ac.uk/care/elu/Issues/ResearchlReslCont.htm1. [2008,25
August 2008].

102
Silverman, L. K. (2002). Making quick work of maths facts, Upside Down
Brilliance .The Visual-Spatial Learner (pp. 302-305). Denver: DeLeon.
Silverman, L. K. (c2007a). The Power ofImages: Visual-Spatial Learners. The
Visual-Spatial development Centre. Available: http://www.visualspatial.org/
[2007, 13/04/2007].
Silverman, L. K. (c2007b). The Visual Spatial Identifier. Visual-Spatial Development
Centre. Available: www.gifteddeveloprnent.com [2007, 3/04/07].
Smith, M. K. (2007, 21 September 2007). Action Research. The Encyclopedia of
Informal Education. Available: www.infed.org/research/b-actes.htm [2007,
11/10/2007].
Sosulski, M. R., & Lawrence, C. (2008). Mixing Methods for Full-Strength Results.
Journal ofMixed Methods Research, 2(2), 121-148.
Spicer, N. (2004). Combining qualitative and quantitaive methods. In C. Seale (Ed.),
Researching Society and Culture (pp. 294-302). New Delhi: Sage
Publications.
Stemler, S. (2001). An overview of content analysis. Practical Assessment, Research
and Evaluation, 7(17).
Swain, M. (200 I). Educating as Inquiry, A Teacher action Research Site, [On-Line
Journal English Quarterly]. Dr Judith M. Newman. Available:
http://www.lupinworks.com/ar/eq/swain.htmI2007/l 0/12].
Trowbridge, J. E., & Wandersee, J. H. (1998). Theory-Driven Graphic Organisers. In
J. J. Mintzes & 1. H. Wandersee & 1. D. Novak (Eds.), Teachibg Science for
Understanding: A Human Constructivist View. Florida: Academic Press.
Vos, A. S. D. (2006). Combined quantitative and qualitative approach. In A. d. Vos &
H. Strydom & C. Fouche' & C. Delport (Eds.), Research at Grass roots .
Pretoria: Van Schaik Publishers.
Vygotsky, L. S. (1978). Mind in Society : The development ofhigher psychological
processes. Cambridge: Harvard University Press.
Wallace, J. D., & Mintzes, J. J. (1990). The Concept Map as a Research Tool:
Exploring Conceptual Change in Biology. Journal ofResearch in Science
Teaching, 2 7(10), 1033-1052.
Wandersee, J. H. (1990). Concept Mapping and the Cartography of Cognition.
Journal 0.[Research in Science Teaching, 27(10),923-936.
White, R., & Gunstone, R. (1993). Concept Mapping, Probing Understanding.
London: The Falmer Press.

103
Willerman, M., & Harg, R. A. M. (1991). The Concept Map as an Advance
Organiser. Journal DJResearch in Science Teaching, 28(8), 705-711.
WiIliams, C. G. (1998). Using Concept Maps to Assess Conceptual Knowledge of
Function. Journal/or research in Mathematics Education, 29(4), pp. 414
421.
Williams, C. G. (2002). Using Concept Maps To Assess Conceptual Knowledge. In J.
Sowder & B. Schappelle (Eds.), Lessons Learntfrom Research. Reston:
National Council Of Teachers of Mathematics.
Zeilik, M., Schau, c.. Hall, N., Teague, K., & Bisard, W. (1997). Conceptual
astronomy: A novel model for teaching postsecondary science courses.
American Journal DJPhysics, 65(10),987-996.

Appendix A
Appendix B
Appendix C
APPENDICES
Letter of Consent
Interview Schedule
Questionnaire
104
page 103
page 107
page 114
APPENDIX A
Letter of Consent: Parents
Dear Parent
LETTERS OF CONSENT
University of Kwa-Zulu Natal
Edgewood Campus
Pinetown
105
I, Mrs Urmilla Moodley an educator at Wingen Heights Secondary, am currently
undertaking a Masters course in Mathematics Education at the above University. I am
undertaking research of an approach to mathematics teaching to determine whether it
is beneficial to learners' understanding of mathematical concepts. Part of my study is
to assess concept maps constructed by learners, learners have to answer a
questionnaire and some learners will be interviewed.
I request permission to include your child in my research project. All work undertaken
by learners will be used for their CASS and no tuition time will be used to collect
information from them. The questionnaire will be filled during a period when one of
their educators is absent.
Nor will interviews will be conducted during tuition time. They will be conducted
during the breaks or after school, which ever is convenient for your child. Please note
that participating in this interview is voluntary and if your child wishes to withdraw
from the study at any time , he or she may do so.
Thank you.
Yours sincerely
Urmilla MoodIey

106
Parental consent
_______________ , parent/guardian of
grant/do not grant permission for my child/ward to participate in the above research
study. I have read and understand the contents of the above letter.
signature date

107
Letter of Consent: The Principal
University of Kwa-Zulu Natal
Edgewood Campus
Pinetown
The Principal
Wingen Heights Secondary
Shallcross
Re: Request permission to conduct a study with grade 8 mathematics learners
I, Mrs U. Moodley am currently undertaking a Masters degree in Mathematics
Education at the above university. I am undertaking a study into another approach to
teaching and learning. My task is to determine whether the use of concept maps is
beneficial to learners understanding of mathematical concepts. Part of my study is to
assess concept maps constructed by learners. Learners will also be involved in filling
in a questionnaire and some learners will be interviewed.
I request permission to include the learners that I teach in this study. All work
undertaken by learners will be used for their CASS mark and no tuition time will be
used to collect information from them. The questionnaire will be tilled during a period
when one of their educators is absent. Interviews will be conducted during the breaks.
Learners and parents will be informed that participation is voluntary and that the
learners can withdraw from the study at anytime should they wish to do so.
Thank You
Yours Sincerely
U.Moodley
Letter of Consent: Department Official
108
University of Kwa-Zulu Natal
Edgewood Campus
Pinetown
The District Manager
Wingen Heights Secondary
Shall cross
Re: Request permission to conduct a study with grade 8 mathematics learners
T, Mrs U. Moodley am currently undertaking a Masters degree in Mathematics
Education at the above university. I am undertaking a study into another approach to
teaching and learning. My task is to determine whether the use of concept maps is
beneficial to learners understanding of mathematical concepts. Part of my study is to
assess concept maps constructed by learners. Learners wi11 also be involved in filling
in a questionnaire and some learners will be interviewed.
I request permission to include the learners that I teach in this study. All work
undertaken by learners wi11 be used for their CASS mark and no tuition time will be
used to collect information from them. The questionnaire wi11 be filled during a period
when one of their educators is absent. Interviews will be conducted during the breaks.
Learners and parents will be informed that participation is voluntary and that the
learners can withdraw from the study at anytime should they wish to do so.
Thank You
Yours Sincerely
U.Moodley

APPENDIXB
Interview one
INTERVIEW SCHEDULE
109
RESEARCHER: How did you feel about the group work activity when
constructing concept maps?
SINDISWA : I like working in groups.
RESEARCHER: Can you tell me why you like working in a group
SINDlSWA: When we do an activity in a group I understand because they
explain to me when I don't understand.
RESEARCHER: Ok. Thank you.
In the questionnaire you said that you like using concept maps
sometimes in your maths lessons. Can you tell me why?
SINDISWA: Yes sometimes I understand maths and sometimes I don't.
Learner did not want to say any more)

110
Interview Two
RESEARCHER: How did you feel about the group work activity when
constructing concept maps?
CARL: It allows people to contribute to the concept map. It gives us a chance to
share ideas.
RESEARCHER: How did the group work activity help with your understanding
of maths activities?
CARL: I found out what mistakes I made and my classmates helped me correct
them. It also helped me to see the value of concept maps in my
understanding of maths concepts.
RESEARCHER: In the questionnaire you said that you like using concept maps
because it is "fun to do". Could you tell me why is it fun, what
about concept maps do you enjoy so much?
CARL: I find reading my notes boring. Drawing up a concept map is creative
and helps you understand the work clearly.
RESEARCHER: You also said that you will use concept maps when revising
because "it makes it easier to understand". Could you
tell me more about why it is easier to understand?
CARL: A concept map breaks up the topic into different concepts therefore you
know what the topic is made up of and hence understand it better.
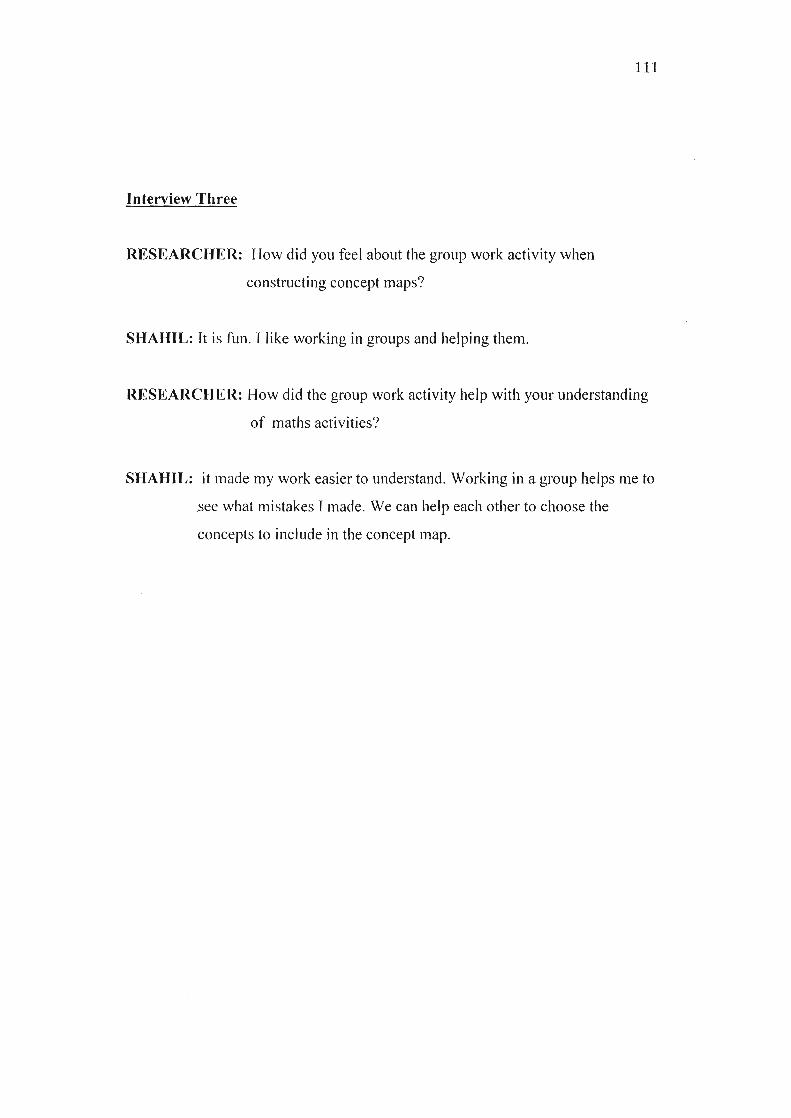
111
Interview Three
RESEARCHER: How did you feel about the group work activity when
constructing concept maps?
SHAHIL: It is fun. I like working in groups and helping them.
RESEARCHER: How did the group work activity help with your understanding
of maths activities?
SHAHIL: it made my work easier to understand. Working in a group helps me to
see what mistakes I made. We can help each other to choose the
concepts to include in the concept map.
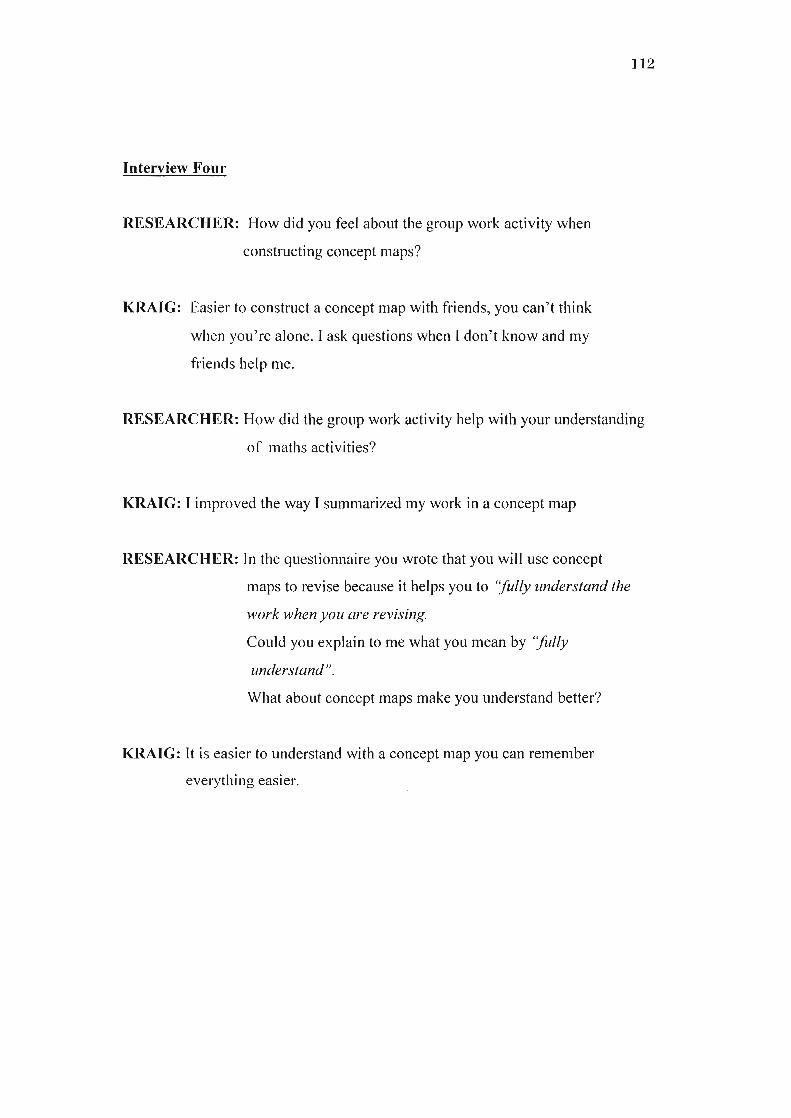
112
Interview Four
RESEARCHER: How did you feel about the group work activity when
constructing concept maps?
KRAIG: Easier to construct a concept map with friends , you can't think
when you're alone . I ask questions when I don't know and my
friends help me.
RESEARCHER: How did the group work activity help with your understanding
of maths activities?
KRAIG: I improved the way I summarized my work in a concept map
RESEARCHER: In the questionnaire you wrote that you will use concept
maps to revise because it helps you to "fully understand the
work when you are revising.
Could you explain to me what you mean by "fully
understand".
What about concept maps make you understand better?
KRAIG: It is easier to understand with a concept map you can remember
everything easier.
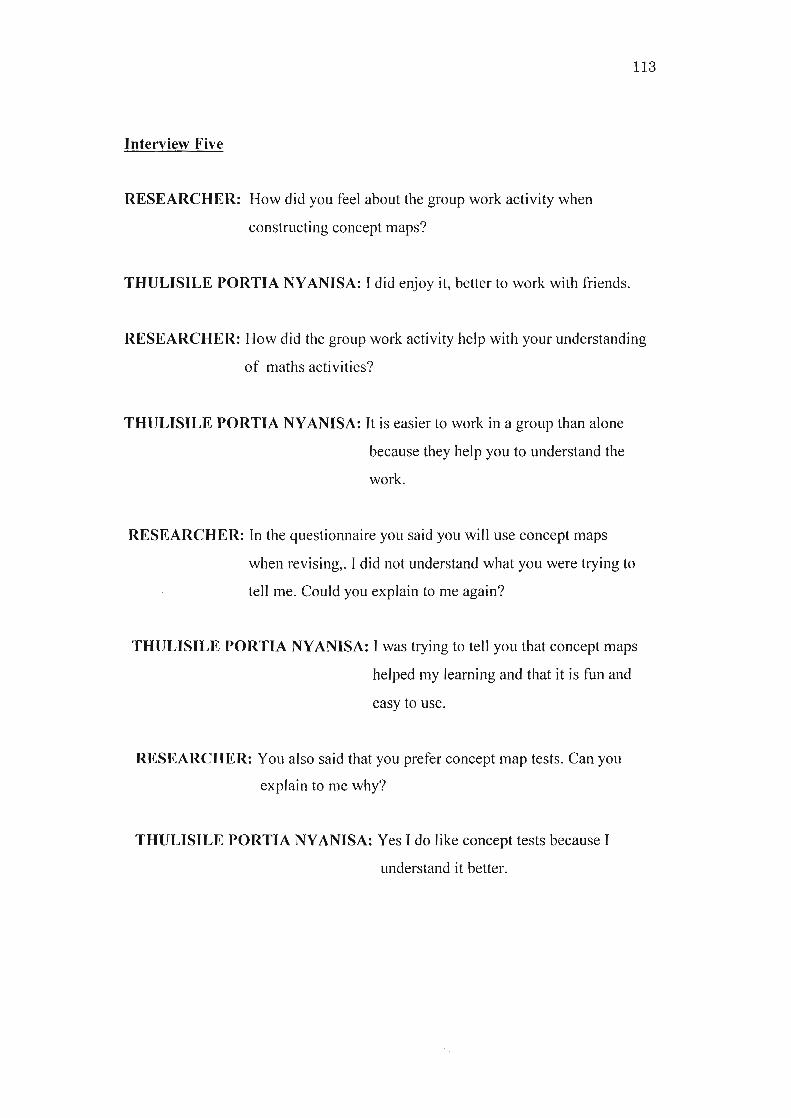
113
Interview Five
RESEARCHER: How did you feel about the group work activity when
constructing concept maps ?
THULISILE PORTIA NYANISA: I did enjoy it, better to work with friends.
RESEARCHER: How did the group work activity help with your understanding
of maths activities?
THULISILE PORTIA NYANISA: It is easier to work in a group than alone
because they help you to understand the
work.
RESEARCHER: In the questionnaire you said you will use concept maps
when revising,. I did not understand what you were trying to
tell me. Could you explain to me again?
THULISILE PORTIA NYANISA: I was trying to tell you that concept maps
helped my learning and that it is fun and
easy to use.
RESEARCHER: You also said that you prefer concept map tests . Can you
explain to me why?
THULISILE PORTIA NYANISA: Yes I do like concept tests because I
understand it better.

114
Interview Six
RESEARCHER: How did you feel about the group work activity when
constructing concept maps?
NKANYISO MNGADI: I feel good we can help each other in a group work.
We can make sure that everybody understands the
work.
RESEARCHER: How did the group work activity help with your understanding
of maths activities?
NKANYISO MNGADI: Group work helps me to understand concepts
because if! don't know I can ask someone who is
In my group.
RESEARCHER: You wrote in the questionnaire that you will use concept
maps sometimes but I did not understand your reasons. Could
you explain to me again please?
NKANYISO MNGADI: because sometimes I understand concept maps and
sometimes I don 't.
RESEARCHER: Can you tell me when you like using concept maps? Give me
just one example of when you liked using concept maps?
NKANYISO MNGADI: I liked making the poster (concept map was on data
handling).
RESEARCHER: Could you give me one example of when you did not like
making concept maps.
NKANYISO MNGADI: I don 't like making concept maps by myself.
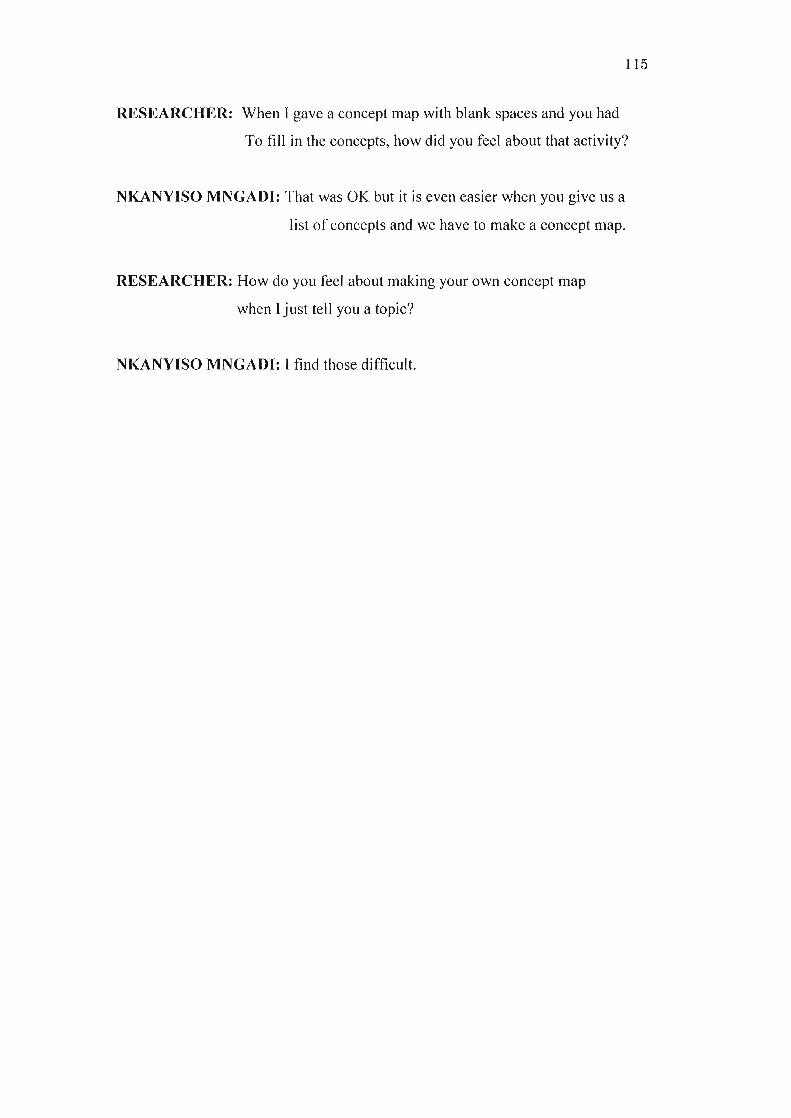
115
RESEARCHER: When I gave a concept map with blank spaces and you had
To fill in the concepts, how did you feel about that activity?
NKANYISO MNGADI: That was OK but it is even easier when you give us a
list of concepts and we have to make a concept map.
RESEARCHER: How do you feel about making your own concept map
when I just tell you a topic?
NKANYISO MNGADI: I find those difficult.

APPENDIX C QUESTIONNAIRE
116
Questionnaire: Learner Views A bout Concep t M aps
IName SurnameMale /female
• The purpose of this questionnaire is to find out whether
concept maps have helped with your understanding of
mathematical concepts
and to determine your views about concept maps.
• Work on your own as I want to know your views on concepts
maps.
• Each question has its own instructions.
1. Some learners have found concept-maps very useful when
learning. Do you like using concept maps in your mathematics
lessons? Put a tick (,r) in the appropriate box.
0
~0-..... "....
0
•
* 00

117
2. Give reasons for your choice above. For example if yes say why.
3. You have worked with concept maps in your mathematics
lessons.
When did you find it most helpful? Put a tick (v") in the
appropriate box for each callout (word bubble).
Oyes
o no
Oyes
o no
Helpful atthe end ofa section
Helpful at thebeginning ofa section
Helpfulduring asection
Oyes
o no

118
It helped meremember thenew concepts
It helped me tolink what Ialready know tothe new concepts
.:When conceptmaps were usedat the beginningof a section howdid it affect yourlearning?
It improved myunderstandingof what I had tolearn in the newsection
4. Consider each response and
tick (v"') 'yes' if you agree
with the response or tick (v"') 'no'
if you disagree with the
response.

119
5. Consider each response and tick (v") 'yes' if you agree with the
response or tick (v") 'no' if you disagree with the response.
When conceptmaps are usedin classroomactivities, howdid it affect yourlearning?
It helpedme tograsp theconceptsquickly.
It made it easier forme to see how oldconcepts are linkedto new concepts.
It helped me to seethe relationshipamong the differentconcepts.
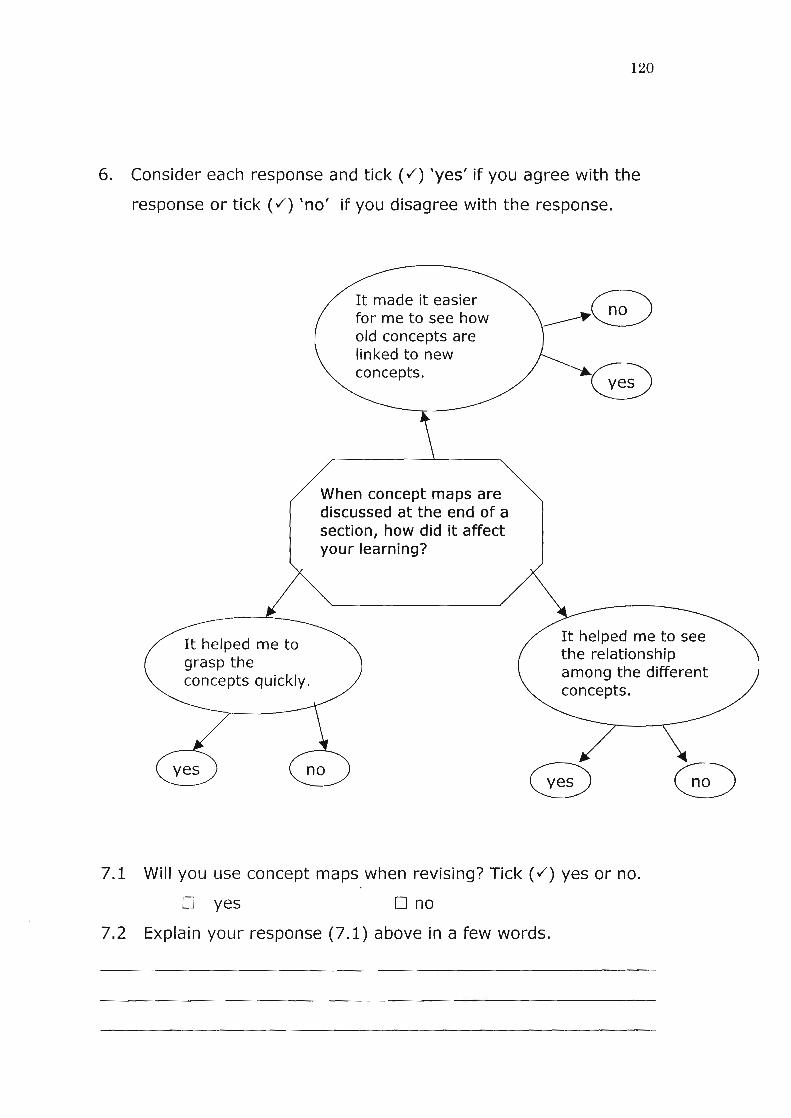
120
6. Consider each response and tick (v"') 'yes' if you agree with the
response or tick (v"') 'no' if you disagree with the response.
It made it easierfor me to see howold concepts arelinked to newconcepts.
It helped me to seethe relationshipamong the differentconcepts.
When concept maps arediscussed at the end of asection, how did it affectyour learning?
It helped me tograsp theconcepts quickly.
7.1 Will you use concept maps when revising? Tick (v"') yes or no.
Dyes 0 no
7.2 Explain your response (7.1) above in a few words.

8.1 Do you prefer concept map tests or traditional tests?
8.2 Expla in your response (8.1) above.
121
->~. . .. ~" .-
~V-~
UNIVERSITY OFKWAZU LU -NATAL
RESEARCH OFFICE (GOVAN MBEKI CENTRE)WESTVILLE CAMPUSTELEPHONE NO.: 031 - 2603587EMAIL : [email protected]
9 SEPTEMBER 2008
MRS. U MOODLEY (204515520)MATHEMATICS, SCIENCE, COMPUTER & TECHNOLOGY EDUC.
Dear Mrs. Moodley
ETHICAL CLEARANCE APPROVAL NUMBER: HSS/0468/08M
I wish toconfirm that ethical clearance has been approved for the following project:
HA study of learners'conceptual development in mathematics in a gradeeight class using the conceptmapapproach"
PLEASE NOTE: Research datashould besecurely stored in the schoolldepartment for a periodof 5 years
Yours faithfully
.. ~~~.~' ~~.l~ .MS. PHUMELELE XIMBA
cc, Supervisor (Dr. VMudaly)cc. Mr. 0 Buchler RIaCEIVED
2008 -10- 02FAC RESEARCH OFFICE
Founding Campuses: l>:!o<! Edgewood Howard College Medical School <,t;;;; Pielermarilzburg ." " Westvllle