a study of the gratifications sought and obtained through...
TRANSCRIPT

Kurskod: SKOM12 Termin: Vårterminen 2017 Handledare: Sara Von Platen Bitr. Handledare: Nils Holmberg Examinator: Henrik Merkelsen
A study of the gratifications sought and obtained through using Enterprise Social Media: an employee perspective
SIMON LEVI CSIKASZ
Lunds universitet Institutionen för strategisk kommunikation
Examensarbete för masterexamen

Enterprise Social media – a Google for organizations? Enterprise social media is perhaps the most sought after communication platform in
organizations today, but initiatives are often taken without knowledge about the actual
use for employees. Therefore, the assumption is that new media requires new types of
behaviours and these behaviours are heavily Unexplored.
ESM is considered to be the new type of communication platform where employees can col-
laborate through both geographical and hierarchal structures. It can benefit the dissemination
of knowledge, strengthening of social ties, work efficiency, level of innovation and more. Yet,
it seems that organization lack in such knowledge, considering the high failure rate and the
fact that ESM might not be able to deliver the expected value.
Data from 170 employees from five different organizations revealed that ESM may not be a
platform where people “hang out” or having “coffee gossip”, as stated before – a network for
informal communication. In this study, data showed that ESM might be more useful as an
informative tool to support work in different ways. This study even goes so far as stating that
the behaviours on ESM were similar to those on search engines – i.e., asking questions and
receiving accurate and relevant answers. What this entails is yet to be explored, but it opens
new possibilities for the way we think and talk about ESM.
It is important to empathise that ESM is equal to user generated content, which is why em-
ployees are important contributors. Without “putting the co-workers in the limelight” ESM
might actually be worthless. At the same time, the behaviours on ESM must be guided
through a clear goal-directedness for ESM use, otherwise employees might refrain from actu-
ally using ESM.
So, by investigating current uses of ESM and understanding different behaviours, it might
actually be easier to create a goal-directedness for communicators or managers, which will
hopefully yield more successful cases of ESM adoption in the future.
Abstract
A study of the gratifications sought and obtained through using
Enterprise Social Media: an employee perspective Although ESM is widely held to have the potential to improve both collaborative
efficiency and to strengthen social ties among employees, around 80% of ESM
implementations fail. This study aims to provide a clearer understanding of why
some people do use ESM, which in turn can lead to more successful implementa-
tions in the future. UGT, Uses and Gratifications Theory was combined with
TAM, Technical Adoption Model, hoping to shed some light on what drives us-
ers/usage. The results show that users primarily seek work-related gratifications,
mainly faster answers/decisions and less meetings, but they also obtain social
gratifications. ESM is almost perceived of as a "search engine", not just to work
better and faster, but also to navigate "the network", to interact with people all
across the organization. These insights hopefully improve the probability of suc-
cessful future implementations, although further research is needed. We recom-
mend using and extending UGT, to identify gratifications sought and obtained at a
more granular level.
Keywords: ESM, UGT, internal communication, digital work, enterprise social
media, uses and gratification theory, Slack, Yammer, Skype for business.
Number of characters (with spaces): 104 360
Sammanfattning
En studie om sökta och erhållna belöningar genom användning av
Enterprise Social Media: ett medarbetarperspektiv Många anser att ESM har potentialen att både förenkla och förbättra samar-
bete, och stärka det ”sociala kapitalet”, men ändå misslyckas 80% av implemen-
tationerna. Denna studie hoppas ge insikter i vad som driver de som ändå använ-
der ESM, med förhoppningen att bidra till fler lyckade framtida implementationer.
UGT, Uses and Gratifications Theory, kombinerades med TAM, Technology Ac-
ceptance Model, för att bättre förstå vad användarna ville ha/fick ut, av ESM. Re-
sultaten visar att det som driver användandet är arbetsrelaterat, framför allt snabb-
bare svar/beslut och färre möten, men att ”sociala belöningar” i hög grad samvari-
erar med de arbetsrelaterade belöningarna. ESM ses nästan som en sökmotor, dels
för att arbeta snabbare och/eller bättre, dels för att ”navigera nätverket”, dvs att
kunna interagera med alla i organisationen. Även om insikterna är användbara bör
framtida studier utöka UGT, så att sökta och erhållna belöningar identifieras än
mer granulärt.
Nyckelord: ESM, UGT, internkommunikation, digital arbete, enterprise social
media, uses and gratification theory, Slack, Yammer, Skype for business.
Antal tecken (inclusive mellanslag): 104 360

Table of contents
Preface ..............................................................................................................................8
1. Introduction to problem .............................................................................................1
1.1 Purpose ....................................................................................................................31.2 Clarifications and concepts ......................................................................................4
2. Previous research .........................................................................................................52.1 Enterprise Social Media ..........................................................................................5
2.2 UGT on ESM and public social media ....................................................................72.2.1 UGT and TAM .................................................................................................8
2.3 Synthesis ..................................................................................................................8
3. Theory .........................................................................................................................10
3.1 Understanding uses and gratification theory .........................................................103.1.1 Assumptions to UGT ......................................................................................113.1.2 Social gratifications in ESM ...........................................................................133.1.3 Work gratifications in ESM ...........................................................................14
3.2 Technology Acceptance Model .............................................................................153.2.1 Personal experiences ......................................................................................153.2.2 Demographics and behavioural use ................................................................163.2.3 Frequency of use ............................................................................................17
3.3 The theoretical model ............................................................................................18
4. Method ........................................................................................................................19
4.1 Research context ....................................................................................................194.2 Sample ...................................................................................................................20
4.3 Survey ....................................................................................................................214.4 Data collection .......................................................................................................21
4.5 Measures ................................................................................................................224.6 Data analysis ..........................................................................................................23
4.7 Reflection ..............................................................................................................24
5. Results .........................................................................................................................25
5.1 Current use of ESM and public social media ........................................................255.2 Gratifications sought and obtained ........................................................................27
5.2.1 Factor analysis of gratifications sought and obtained ....................................29

5.2.2 Further use of ESM ........................................................................................31
5.3 Predictors for work gratifications obtained ...........................................................32
6. Discussion ...................................................................................................................36
6.1 The aim of this study .............................................................................................366.1.1 Gratifications sought and obtained (RQ1) ......................................................366.1.2 Predictors for work gratifications obtained (RQ2) .........................................376.1.3 Conclusion ......................................................................................................39
7 Practical and Theoretical implications .....................................................................407.1 Practical implications ............................................................................................40
7.2 Theoretical implications ........................................................................................417.3 Limitations and future research .............................................................................41
7.4.1 Future research ...............................................................................................42
8. References ..................................................................................................................43
9. Appendix ....................................................................................................................48Appendix 1: Survey .....................................................................................................48
Appendix 2: Open ended questions. ............................................................................55Appendix 3: Dependent variable .................................................................................56
Appendix 4: Independent variables .............................................................................56Appendix 5: Factor analysis ........................................................................................58
Appendix 6: reliability tests .........................................................................................61Appendix 6: Summative index ....................................................................................63
Appendix 7: Bivariate analysis ....................................................................................64Appendix 8: Regression analysis .................................................................................64
Appendix 9: Relationship analysis ..............................................................................67 .....................................................................................................................................68
List of figures
Figure: 1……………………………………………………………………...11
Figure: 2……………………………………………………………………...18
Figure: 3……………………………………………………………………...23
Table: 1……………………………………………………………………….26
Table: 2……………………………………………………………………….27
Table: 3……………………………………………………………………….28
Table: 4……………………………………....……………………………….29
Table: 5……………………………………………………………………….29

Table: 6……………………………………………………………………….30
Table: 7……………………………………………………………………….31
Table: 8……………………………………………………………………….32
Table: 9……………………………………………………………………….33
Table: 10……………………………………………………………...….…...34
Figure 4……………………………………………………………………....35

Preface
I would like to thank Sara von Platen and Nils Holmberg for guiding me in this
project, together with your feedback this paper came together. Sara for being there
all step of the way in terms of content, idea and concepts. Nils for being super
helpful with method and supportive of this quantitative study. I would also like to
thank my dad for taking the time to read all the text and give me feedback. Lastly,
to all respondents and companies that believed in this paper and participated in the
survey!
/Simon

1
1. Introduction to problem
“Change the way you work: Connect everyone in your company and turn ideas in-
to action. Through group discussion, personalised News Feed, and voice and vid-
eo calling, work together and get more done.” (workplace.fb.com)
“We’re on a mission to help people and organizations work better together by
capturing the best of what every person has to offer. Our products enable people
to do the best work of their lives with technology that adapts to their way – not the
other way.” (Jivesoftware.com)
“Where work happens: Whatever work means for you, Slack brings all the pieces
and people you need together so you can actually get things done.” (Slack.com)
The above citations are examples of how it sounds when browsing the websites of
the leading companies in Enterprise Social Media (ESM, a concept that will be
explained later in this study). There seems to be a joint vision, receiving tremen-
dous attention from companies who believe that organizational success largely
depends on new technology and seamless communication within the organization.
As a consequence, ESM strategies, initiatives and implementations have in-
creased widely among organizations around the world, even though there is an
alarmingly high failure rate and even though the true potential of ESM usually is
not realized in organizations - even when an implementation superficially can be
viewed as successful. In a study from 2017, Madsen finds two factors that impede
the use/adoption of ESM; they cannot relate it to everyday work, and the informal
nature of ESM is hard to understand. Then again, employees might also refrain
from using it because they feel that it might threaten their personal privacy since
ESM exposes internal communication to the whole organization (Walden, 2016).
Other scholars have been arguing that ESM should focus more on the social as-

2
pect which indirectly can be tied to a better work performance (Gonzales, Rie-
menschneider & Leidner and Koch, 2013). These uncertainties about the use of
ESM in organizations have, unfortunately, left the field both contradictory and
open, especially considering the rapid continued growth of the sector (Yan, Singh
& Ghose, 2015; Fortune, 2013; Zerfass & Macnamara, 2012; Forbes, 2016; Quan-
Haase & Yong, 2010; Raeth, Smolnik & Urbach, 2015).
This study aims to investigate the uses and gratifications of ESM from an em-
ployee perspective to get a more thorough understanding of ESM use in the or-
ganization, i.e., the study is emphasizing the employee or end-user perspective.
This study is the first to use the Uses and Gratification Theory (UGT, explained
further down in this chapter), to better understand the gratifications sought and
obtained by the users, on an ESM platform.
There is, according to Gartner (2013), a failure rate of 80 % in organizations
who implement an ESM system, indicating that companies are not ready for an
ESM tool, probably in combination with a lack of understanding of how ESM ac-
tually can make work easier for employees. Previous research has called for more
focus on employees while investigating the wide adoption of ESM in organiza-
tions (Coombs, Falkheimer, Heide, & Young, 2016); Koch, Gonzalez & Leidner,
2012). Especially since employee communication on an ESM platform is consid-
ered valuable for organizational success (Madsen, 2017).
Enterprise social media is a platform for internal communication and collabo-
ration within the organization. It builds on the same principle as public social me-
dia (i.e., Facebook, Twitter and Pinterest) but is only visible to co-workers and to-
tally inaccessible for outsiders. Other commonly used terms are social intranets
and internal social media (ISM). Rather than functioning as a channel for which
purpose is to spread information in the organization, ESM operates as a platform
upon which collaboration, social interactions and work happens. While the indus-
try promotes ESM as a new way of working, it is important to understand how
ESM actually can contribute to a more productive and effective workplace for
employees (Leonardi, Huysman & Steinfield, 2013).
A variety of models such as the Technology Acceptance Model (TAM) or the
Unified Theory of Acceptance and Use of Technology (UTAUT) have been de-
ployed to understand the adoption of new technology among consumers and em-
ployees. Another widely used theory for explaining why and how people use dif-

3
ferent media channels is the Uses and Gratification theory (UGT) (Whiting &
Williams, 2013; Quan-haase & Young, 2010). However, when it comes to ESM in
the workplace using UGT, little work has been conducted (Engler & Alpar, 2016;
Wang, Yang & Chen, 2016). UGT has mostly been utilized to understand how
and why consumers choose to use different mediums, mainly traditional media
such as television, printed newspapers and radio. Recently, new media such as the
Internet and Facebook have also been added. Some studies have been using UGT
to investigate employee use of public social media such as Facebook and Twitter
in the workplace, to understand how it may hurt or benefit the company brand.
The studies have been emphasizing the external perspective, i.e. how customers
perceive employees’ social media use.
In contrast to prior research, this study is guided by Uses and Gratification
Theory and, to some extent it is also influenced by the Technology Acceptance
Model (TAM). The two main areas of this study are:
1). To investigate, from an employee use perspective, what gratifications are
sought and obtained from using ESM in the organization, and
2). To be consistent with UGT, the same variables will be measured as in the
UGT research: demographics, personal experiences and current uses (or social
use). The goal is to assess the correlation between these variables and gratifica-
tions obtained by ESM users in the organization.
1.1 Purpose
The purpose of study is to contribute with knowledge about why employees’
make use of ESM in organizations through applying UGT and TAM and also to
investigate the expectancy vs outcome (gratifications sought and gratifications ob-
tained) from an employee perspective. The aim of this paper is to find predictors
for gratifications obtained in ESM. The focus is put on work gratifications ob-
tained since that is essentially what organizations and employees are trying to
achieve. So, in combination with understanding if this behaviour is actually
sought after, the study also tries to create some goal-directedness for ESM.
So, research questions are:

4
• RQ: Why do employees use ESM in the organization? What gratifications are sought and obtained from using ESM?
• RQ: How do demographics, personal experiences, frequency of use and current uses affect gratifications obtained on an ESM platform in the organization?
By carefully choosing companies who use ESM in every part of the organization,
this paper will hopefully yield important results for future adoption and strategies
of ESM. Implications for practitioners are discovered in chapter 7.
There are, of course, some biases, in that people might adopt ESM differently
in different industries. Therefore, this study has targeted a wide variety of indus-
tries/users, but with the same survey and questions. Further limitations and ad-
vantages will be discussed later.
1.2 Clarifications and concepts
In this study, ESM is referring to the three systems (Slack, Skype for business and
Yammer). These systems fit into the accepted ESM definition, i.e. meaning that
people have business profiles not connected to any personal profile, and that the
social network is closed for the outside world, unless permissions is granted. It is
important to emphasize that a social network used within an organization is not
automatically an ESM. Therefore, other media such as Facebook, blogs and direct
messaging are referred to as social networking sites (SNS), social media (SM) or
public social media, in this study. It is also important to state that, in this study,
ESM platforms are treated as homogenous in functionality and usability and are
not compared to each other in any way.
5
2. Previous research
This chapter provides an overview of previous research within enterprise social
media and UGT research. The first section will go through research on ESM in
general to provide a picture of the current knowledge. The second section will
present UGT research where most of the studies have been looking at social me-
dia at large and not specifically ESM-systems. Lastly, a synthesis of previous re-
search is made to sum up what we know about the field at this moment.
2.1 Enterprise Social Media
Kaplan and Haenlein (2010) describe social media as a platform which is built on
web 2.0 technology that enables user generated content. ESM is built on the same
principle as social media but is only available within the organization, the purpose
of which is to enhance collaboration, content sharing and workplace productivity.
Done right, ESM can have a profound effect on organizational efficiency, align-
ment, innovation, collaboration and success. ESM creates opportunities that were
impossible 10 years ago, for example: collaboration in different locations, sharing
content, communicating faster and increased transparency (Young & Hinesly,
2014).
The functions and aims of ESM are discussed in Gressgård (2011), where he
concluded that the first aim for ESM should be to improve the communication in
an organization across an entire enterprise, not only within different business
function. This enables communication between different organizational units and
levels, but may also challenge the formal hierarchy. Hence, ESM can make com-
munication easier both on an individual, group and enterprise level.
According to Leonardi, Huysman and Steinfield (2013) there are three broad
metaphors that have guided researchers in their pursuit of creating an understand-
ing of ESMs: leaky pipe, social lubricant and echo chamber. Leaky pipe alludes to
capacity of social networks to let other people (i.e., not the intended receivers) see
and learn from conversations they otherwise would not see. This is in line with the
6
“openness” that ESM creates. ESM as a social lubricant is referring to its capabil-
ity to enhance and support the establishment of informal networks in the organiza-
tion. It can also enhance social capital, which can be tied to a better work perfor-
mance through knowledge transfer and shared vision (Cao, Guo, Vogel and
Zhang, 2016). Lastly, we have echo chamber, which means that the system recog-
nizes relevant information for each individual, which is beneficial because people
can find more accurate information. At the same time, however, it can lead to
more fragmentation in the organization since it also becomes harder to acquire in-
formation from the whole organization.
Several studies (Gonzales et al., 2013; Cao et al., 2016) strengthened the belief
that ESM should be social rather than a platform strictly dedicated to make work
happen. It is better for employees to interact with fellow colleagues in a more in-
formal and non work-related fashion.
Other studies (walden, 2016; Madsen & Verhoeven, 2016; Raišienė &
Jonušauska, 2011) have found that employees use social media to contact friends
rather than colleagues. It should therefore not be a tool to make new acquaintanc-
es in the organization. Madsen & Verhoeven (2016) even goes so far as to state
that employees might refrain from using ESM because it does not relate to their
every-day work tasks.
Scholars seem to be interested in the benefits that ESM systems might bring,
especially as a social tool. While it is important understand these outcomes – so-
cial vs work-related, it is even more important to understand why these platforms
are used at all, particularly from the end-user perspective. Stei, Sprenger and
Rossmann (2016) investigated the current research state within ESM and conclud-
ed that user behaviour is yet to be explored. Employees are important contributors
to the organization and, in fact, perhaps, the most important asset an organization
has (Simonsson & Heide, 2011). UGT theory is, in this case, an important lens
through which employee use of ESM in the organization can be identified. UGT
presumes that individuals are active communicators who can identify needs and
choose tools accordingly. Next, research on ESM through UGT is presented to
give an overview of the different aspects that UGT has brought to the field.
7
2.2 UGT on ESM and public social media
Uses and gratifications theory has been fruitful in explaining behavioural use of
various media, both inside and outside organizations. From the beginning, focus
has been on the uses of traditional media such as television, printed newspaper
and radio. Lately, the use of UGT has seen a rising trend for research within new
media, which continues to grow, and where research focus has been on the inter-
net and various 2.0 media channels such as Facebook and blogs (Lim and Ting,
2012; Pornsakulvanich and Dumrongsiri, 2013; Quan-Haase and Young, 2010).
Actual UGT research on ESM (designed for organizational use) is almost non-
existent and therefore important to investigate. Most of the studies investigating
behavioural use within ESM using UGT have been focusing on public social me-
dia (Facebook etc.) or blogs and wikis within organizations. Since the drivers
might be similar for the use of ESM as for the use of public social media, some of
those findings will be presented here in order discover potential similarities and
differences in the results. One of the most prevalent studies to investigate the use
of social media among employees is Engler & Alpar (2016). They concluded that
the intention to participate in social networks is most efficiently increased by
simply adding ESM as a “layer” or “forum” where colleagues can collaborate or
chat while continue working. This actually ties them more strongly to functional
business applications. Another study conducted by Zoonen, Meer and Verhoeven
(2014) investigated the production of social- and work-related information in pub-
lic social media and found that employees might use social media to produce and
consume work-related information for which the drivers were to spread infor-
mation, building relationships and organizational ambassadorship. However, be-
ing an ambassador for a company may not be the same in public social media as is
in an ESM platform.
Sundar and Limperos (2013) found out, after cross checking over 20 different
studies using UGT, that many gratifications overlap with each other. Some of
those relating to “new media” are: Social escapism motivation, information moti-
vation, interactive control motivation and socializing motivation. The first one is
called an entertainment gratification which has been proven to be a strong factor
for why people use social media, and the information gratification is apparently
important for the use of the Internet (Korgaonkar & Wolin, 1999; Papacharissi &
8
Rubin, 2000). Since the emerging ESM technology is being introduced within al-
most every enterprise, it is important to understand new behaviours that ESM
might generate into an organization.
2.2.1 UGT and TAM
To extend the UGT model, several researchers have incorporated technology ac-
ceptance model to predict gratifications obtained. For example, Lou and Remus
(2014) created an integrated model of UGT and TAM to asses how the model
would fit to explain behavioural outcomes (gratifications obtained). The results
yielded that it was appropriate to integrate the model for this purpose because of
the two TAM beliefs: perceived ease of use and perceived usefulness were con-
nected to behavioural outcome. In a study conducted by Wang, Yang and Chen
(2016) they investigated why employees engage in social networking sites at work
and found that perceived ease of use and perceived usefulness, together with grati-
fications obtained, did influenced attitude to use these platforms.
2.3 Synthesis
Previous research clearly underlines the potential benefits of using ESM in organ-
izations. It can enable faster communication and work, and it opens up new possi-
bilities of collaboration that we probably do not even know about yet, thanks to
the technical and functional design of ESM. Yet, researchers still try to understand
how ESM actually contributes to organizations. Some scholars, especially within
TAM research, argue that slow adoption is the problem, but ESM solutions are
being adopted around the world in record time. So the gap identified in this study
aims to examine and understand more about behaviours on these systems. They
need to be more fully understood, to create strategies and set goals/KPIs for im-
plementation, introduction and usage of ESMs.
Another problem is that the definition of ESM has not been rigid, resulting in
a body "ESM research", based on very varying tools. Research conducted on self-
labelled ESM platforms such as Slack, Skype for business and Yammer, is still
scarce, which is one of the main arguments for conducting this study, especially in
combination with UGT since it might improve our understanding of this “new
media type”. This study hereby hopes, ultimately, to contribute to goal directed-

9
ness and strategies around implementation and usage of ESM. Rice and Leonardi
(2013) state that in the field of communication, knowledge about ESM is scarce,
and they encourage researchers to find out more about user behaviours on ESM –
with focus on the actual/end users. This study is asking precise-
ly why employees are using ESM, i.e., which (end user) gratifications that are
sought and/or obtained, in order to enrich our understanding and insight into what
is driving usage.

10
3. Theory
“When users are so integral to the production of meaning, researchers are re-
quired to look at the users’ side of the relationship” - (Holub, 1984)
Uses and gratification theory (UGT) has been successful in explaining uses of dif-
ferent mediums and, central to this study, it emphasizes a user-centric approach.
Perhaps one of the most important trends and recent developments for the applica-
tion of UGT is the rise of newer media such as Social media, the Internet, blogs
and other 2.0 media channels. The participative nature of such mediums may be
most suited to investigate through UGT since it actively takes users into account
and presumes that individuals are able to choose between whichever medium that
suits their needs. In addition, the study is influenced by TAM, which takes ease of
use of new technology into account, in response to current criticism towards the
limitations of UGT. So, both gratifications sought after and obtained, in conjunc-
tion with ease of use/understanding, are used to investigate if they are correlated
with a successful implementation of ESM.
3.1 Understanding uses and gratification theory
Katz, Gurevitch and Haas (1973) first came up with the uses and gratification the-
ory (UGT) by investigating behavioural use of mass media. UGT has a positivist
approach in the sense that the theory is based on the relationship between user and
medium and that users are, in fact, capable of identifying their own needs and
therefore also capable of choosing medium accordingly. There is, per definition, a
set of rules to this theory which must be followed in order to make sense of the
world, or to produce actual knowledge about the world. UGT is based on a psy-
chological and social perspective because people often experience different needs
and gratifications in accord with their social and psychological state (See figure
1), which is why UGT empathizes an active role of people in selecting media to
fulfil their own specific needs. Lim and Ting (2012) suggest that the foremost rea-

11
son to use UGT is to explain and understand people's’ needs in order to under-
stand their reasons for using a certain media channel, and, inherently, which grati-
fications that are obtained from those motivations to use the media channel. For
instance, when an audience member has a need for escape, there are specific me-
dia available to gratify this need in a satisfactory manner (Quan-haase & Young,
2010).
There are some underlying assumptions (rules) to this theory that need to be
elaborated in order to understand the actual worth and knowledge outcome of the
theory (see figure 1).
3.1.1 Assumptions to UGT
• Audience is active - An active audience that deliberately chooses mediums in relation to their different functionalities indicate that the adoption of media, or ESM in this case, is goal-directed
• Audience makes motivated choices - Based on previous experiences with the medium and/or general experiences with new technology, the audience can motivate and make conscious choices for selecting media.
• People are different - A medium might gratify different needs depending on the individual’s communication behaviour which, in turn, might be affected by social disposition and psychological factors.
• Media competes with other sources of communication - Media can function as an alternative to other communication sources. In this case, it also competes with other media in terms of functionality and usability.
(Rubin, 2002; Pornsakulvanich & Dumrongsiri, 2013)
(Figure: 1: A model of the uses and gratifications approach after Blumler and
Katz, 1974)
12
Another well cited argument for the use of UGT is that it assumes people to be
more influential than media, meaning that it is more about what people do with
the media than what the media does to the people. UGT is user-centric which also
means ignoring facts such as cultural influences or other external pressures. The
main focus is the individual need to use certain media, no matter how these needs
are generated.
UGT is based on the uses of a medium and gratifications obtained from a me-
dium. In previous studies, satisfaction with a medium, when using UGT, is con-
sidered the sum of all obtained gratifications; what people feel they are achieving
when using a medium. However, Sangwan (2013) criticized this idea since we
cannot know if those gratifications obtained were actually sought after. While an
achieved gratification can be associated with satisfaction, one must know which
gratifications that are sought after in order to really measure satisfaction. And, as
a reaction to the criticism toward UGT, Palmgreen and Rayburn (1979) created a
model called “GS-GO” (gratifications sought and obtained), based on the idea that
there is an expected gratification sought by using a media which may or may not
be inline with the actual outcome (gratifications obtained). So, this study applies
Palmgreen and Rayburn’s (1979) GS-GO model, which is widely held to be a
more correct model to assess gratifications, since gratifications sought might dif-
fer from those obtained. Insight into gratifications sought but not obtained will
provide very valuable input, both to ESM developers and innovators, and to or-
ganizations who seek to reap the potential benefits of ESM.
UGT has been disputed over the years by scholars (Bulmer, 1979; Severin &
Tankard, 1997) claiming that the theory goes too far saying people are free to
choose whichever media they want – not being restricted by social structure or the
context in which the media is studied.
While the criticism may be justified, it is in part contradicted by the fact that
over 80% of ESM projects fail. This may be due to the simple fact that there is no
simple way/recipe for “making people social”. If a user wants to use a certain me-
dium, they may, then, be restricted by company policy or other boundaries. So, in-
stead of asking why such a large number of people choose not to use ESM, we fo-
cus on the gratifications obtained by the minority who do use ESM. For that rea-
son, we feel that is is justified to rely heavily on the uses and gratifications theory.
13
3.1.2 Social gratifications in ESM
ESM is used for either work-related purposes or for social social related purposes,
but might also be used for seeking out information in the organization (Wang &
Kobsa, 2009). Cao et al (2016) stated that, the foremost reason to use social media
in organization is the need for social interactions and to obtain support and a sense
of belonging. They found out that social capital can be an indirect influence on
work performance through knowledge sharing and workplace trust. In another
study conducted by Gonzalez et al (2013) they found out that using ESM for so-
cial purposes, rather than work related purposes, did have a positive effect on the
corporate culture and organizational commitment. They did not, however, find the
same connection for work related use.
Gratifications obtained by using social media often reflect the need for social
interaction while ESM, which could be seen as a closed social media network
within the organization, might be different. Quan-Haase & Young (2010) found
out that Facebook was used among students mostly because of social fulfilment,
whereas instant messaging, which is also a part of an ESM platform, was about
building relationships. While these findings might not relate to employees’ ESM
use in organizations, it provides guidance towards the importance of the social in-
teraction variable. Almost all of the UGT research on various media, both inside
an organization and outside an organization, concludes that the social variable is
important when it comes to behavioural use. With that said, it is used in this study
both as a goal for the use of ESM to answer RQ1, why do employees use ESM,
and to investigate its effect on work gratifications obtained to answer RQ2.
In theory, ESM focusing on achieving social gratifications may be positively
related to work gratifications obtained in the sense that work is improved when
social capital is strengthened. In the physical workplace, social ties are necessary
for overall productivity, and may also be true on a platform such as ESM. It is, af-
ter all, called Enterprise Social Media (Cao et al., 2016). This is why it may be an
important variable when using ESM to obtain work gratifications (Zoonen, Meer
and Verhoeven, 2014; Lim & Ting, 2012).
Hypothesis 1: Social gratifications obtained, as a variable, is positively related
to work gratifications obtained.

14
3.1.3 Work gratifications in ESM
To theorize this construct, research has shown that ESM improves the coordina-
tion of work shared between employees within the enterprise by, for example,
providing functions that help employees fulfil subtasks (Raeth, Smolnik & Ur-
bach, 2015). Another important desired effect, but yet to be fully explored and
understood, is that ESM can create new forms of work by enabling collaborative
cooperation in organisations, by way of functions that range from mutual docu-
ment processing and sharing, to the creation of extensive collaborative work envi-
ronments. In this context, it has also been found that the cooperation is improved
even across hierarchical structures. Yet, there is little to no research that shows
which variables that drive, i.e., are positively related to, a successful implementa-
tion of ESM. This, in turn, increases the challenge for practitioners to successfully
implement ESM
Another function of ESM that has been found, is that it can create and
strengthen ties with colleagues, but also to promote knowledge and resource shar-
ing. This is a typical information gratification that often is cited. (Cao, Vogel,
Guo, Liu, & Gu, 2012; Skeels & Grudin, 2009). DiMicco et al. (2008) indicate
that: ‘‘within the walled garden of the enterprise, employees choose to reach out
and meet new people rather than only connecting with those they know’’. Social
media, therefore, not only strengthens ties but also creates new ones, and is used
for “making sense” in/of the organization. Wang, Yang and Chen (2016) stated
that, while social media is mainly social, personal and entertaining, this might
change within corporations, where ESM also becomes a knowledge network. Re-
lationships are the flow of information and knowledge. Both the collaborative and
the knowledge/information sharing nature that ESM has been designed to achieve
is yet to be fully operationalized, since almost all strategies and implementations
are in early stages, without any real goals. The connection to social ties, and per-
sonal experiences is therefore interesting to understand, and could potentially lead
to more knowledge about the different behaviours on ESM.
To avoid the risk of using a too narrow focus on how users feel about ESM,
regardless of gratification obtained, the Technology Acceptance Model has been
used to study the correlation between “user friendliness” and the successful im-
plementation of ESM. Ease of use can be viewed as a gratification both sought

15
and obtained. but also as a willingness to learn and adopt new technology. This is
examined in RQ2, i.e., what are the predictors for work gratifications obtained.
3.2 Technology Acceptance Model
Technology acceptance model (TAM) is a widely used and influential model con-
structed by Davis (1989). The model presumes that two specific beliefs – per-
ceived usefulness and perceived ease of use – determine one’s behavioural inten-
tion to use a technology. Previous research has also established that ease of use is
an important factor influencing user behaviour of information technologies (Ven-
katesh. 2000).
Recently, UGT and TAM have been integrated in several studies (ref) to
explain user behaviour on media platforms. Even though TAM was initially de-
veloped for new systems, its applications have recently been redirected toward
behavioural use. In spite of the differences between UGT and TAM, these theories
have common elements that elucidate media/IT use and have the potential to be
merged so that they can be further developed for use in new application areas.
This study is merely influenced by TAM because perceived ease of use and use-
fulness seems to be important determinants for gratifications obtained. Thus,
without using the “intention to use” variable, this study utilize these two inde-
pendent variables as predictors for work gratifications obtained. These are further
explained in next chapter.
3.2.1 Personal experiences
Personal experience is an important variable for the acceptance of new technolo-
gy. In TAM, there are two independent variables that have proven to be effectual
on behavioural intention to use a certain medium; these are perceived ease of use
and usefulness (Lou & Remus, 2014). However, Shao has also argued that ease of
use may be an important contributor to achieve greater gratifications, or, as de-
fined in this study, more in line with those gratifications sought after. Even though
the actual definition of perceived ease of use and usefulness does not require any
experience, it is reasonable to assume that technological familiarity increases the
probability that perceived ease of use increases, even if a specific tool is new to
the user. It is established that people choose communication channels for numer-

16
ous reasons, such as experience, simple preferences, ease of use, gratifications, or
just that the communication channel contributes to the success of the overall mes-
sage (Wrench et al., 2008).
Wang, Yang & Chen (2016) conducted a study where the results supported TAM
in that the attitude is influenced by perceived ease of use and perceived usefulness
for SNSs (Social Networking Sites) usage. This can also be applied to ESM, even
though the term SNS usually refers to more “pure” social media platforms, such
as Facebook in the workplace.
Hypothesis 2: Personal experiences are positvely related to work gratifications
obtained
3.2.2 Demographics and behavioural use
The demographics of a population is often investigated in quantitative studies
since it is important to understand how, for example, age might affect the study of
interest. Demographics can often be a major determinant of different behaviours.
Wang Yang & Chen (2016) found out that there were gender differences in time
spent on social networking sites at work. Females would spend more time on Fa-
cebook than males in particular and in social networking sites at work in general.
Several studies have resulted in a significance difference in both time spent on so-
cial media, but also in behavioural use. Females, for example, tended to send
more short messages via mobile phone than did males, according to Dumrongsiri
and Pornsakulvanich (2013).
Age is an important determinator of social media use according to previous re-
search. Although social media are used among all age demographics, a majority of
the users are, in fact, in the span of 18-29 years old (Lenhart, Purcell, Smith, &
Zickuhr, 2010). Today, the use is certainly more widespread, but understanding
the relationship between age and the use of social media is not only important be-
cause younger people are more likely to use social media overall. Research into
various media forms have found that age plays a role in the gratifications sought
by the use of a particular medium. An example was found in Li’s (2007) study
where, the older a blogger was, the less likely they were to blog for self-
expression, self-documentation, or passing time reasons.
17
Hypothesis 3: Females will be positively related to work gratifications ob-
tained.
Hypothesis 4: Age will be positively related to work gratifications obtained.
3.2.3 Frequency of use
According to previous research, frequency of use is one of the strongest predictors
of gratifications obtained (Laura Zizka, 2014). Time spent on a specific medium is
not only a measure of satisfaction, but has been proved to promote different be-
haviours. For example: Junco (2011) found out that the more time students spent
on social media networks, the more involved they were in campus organizations
and real world issues. So, it is important to examine how frequency of use might
be correlated with gratifications obtained. Whether this is positive or negative has
been debated. Yuan (2011), for instance, found that people who tend to stay long-
er on an online platform are more likely to procrastinate than actually doing work.
Frequency of use can also be connected to age and gender. For example, females
are more likely to use mediums such as Facebook more frequently. At the same
time, age is negatively correlated with frequency of use, meaning that younger
people are more extensive users of Facebook (Quan-Haase & Yong, 2010), which
is of importance to this study; it also seems that it might be a determinator of work
or social related outcomes when using ESM. Hagler et al. (2009) found out that e-
mail, which is widely used in all workplaces, has proved to impact the productivi-
ty within the organization.
Ko, Sho and Roberts (2005) showed that time on the website, e.g., frequency
of use, was affected by the content which was offered on the site, convenience of
use, entertainment value and social interaction motivations. As a conclusion, fre-
quency of use was proved to be a direct influence on the attitude towards the site.
Time spent on a given medium is the most frequently used variable to measure
gratifications obtained in uses and gratifications research. Frequency of use is also
often associated with accessibility, and, since technology tends to be more fre-
quently used than less convenient channels, it also enables greater gratifications
obtained. Therefore, time spent, or frequency of use in ESM, was adopted in this
study.

18
Hypothesis 5: Frequency of use is positively related to work gratifications ob-
tained.
3.3 The theoretical model
Assuming that employees are guided to use certain mediums according to
achieved gratifications, this study argues for the use of UGT to understand why
employees use ESM in their organization (RQ1). After cross-checking most of the
UGT research, this study claims that UGT has been absent in an internal context,
and therefore hopes to extend the use of the theory in future studies, but mainly to
contribute with knowledge about employee behaviours in ESM.
Presented below is the theoretical model that is guided by UGT and influenced
by TAM (ease of use and usefulness) to achieve higher explanation rates for the
overall model (RQ2). TAM has been integrated with UGT before, successfully,
and therefore cannot be overlooked when trying to explain certain behavioural
outcomes (work gratifications obtained). Further, all the variables that are includ-
ed have proved to be strong predictors of gratifications obtained and therefore se-
lected as independent variables in this theoretical model. This is a first step to
come closer an understanding of what ESM actually is and can be in an organiza-
tion. Figure 2 (below) is a visual over the variables explained above which gives
an overview of how the model will be tested.
(Figure 2: Theoretical model)

19
4. Method
This section describes how the study is conducted, starting with the context of the
research, a description of the sample and how the survey was constructed Further,
the section will provide information about how the data was collected. After that,
variables will be operationalized and explained in order to legitimize the meas-
urements for the study. Lastly, a data analysis section will be presented in order to
explain how the data will be used and understood. The chapter finishes with a
method reflection.
4.1 Research context
This study is guided by a positivist approach because UGT largely builds on those
principles. In other words, it is built on a set of rules that shape the way we think
about a certain behaviour on a specific medium – for example that: audiences are
active and that media choices are guided by gratifications (Rubin, 2002). Previous
research using UGT has preferred to conduct survey research over interviews or
other data collecting methods, mainly because the theory is seen as positivistic in
social research, but also because scholars want to generalize the results based on a
population, for example students or teachers, and not only a specific case. This
study tries to understand why employees use ESM in an organization which is an
undiscovered field, and it seemed sensible to conduct a survey, using the online
service from SurveyMonkey, to find out characteristics in the population such as
demographics, current uses and social use that may influence employee work grat-
ifications obtained in ESM (Grudz et al., 2016). UGT, by its very nature, targets
those who do use of ESM/media instead of targeting those who do not use ESM.
This study is based on the assumption that UGT will yield more insights than oth-
er possible approaches: understanding which the sought after and obtained gratifi-
cations are, is more useful knowledge than understanding why a large number of
people are unwilling to make use of the new tool, or media. Tailoring an imple-
mentation with knowledge about the personal drivers is more likely to be success-

20
ful, rather than avoiding a set of “don’t’s”. Just because an implementation is “not
wrong”, it doesn’t have to be right, or the best possible implementation. This will
be further elaborated in the reflection chapter.
4.2 Sample
The data was obtained from a total of 170 participants in five different organiza-
tions. The sample frame, the total amount of people who received the survey, was
610 workers with the following distribution: organization 1: 80 N*, organization
2: 40 N, organization 3: 70 N, organization 4: 70 N and organization 5: 350 N.
Recipients were 60,6% males and 39,4% females, within an age range from 19 to
60 years old (M = 2,01), where 48,2% were between 19-30 years old. The total re-
sponse rate was 28% which is fully acceptable considering similar studies where
the response rate usually is around 10% (Manfreda, Bosnjak, Berzelak, Haas, &
Vehovar, 2008). Uncompleted surveys, non-responses, are important indicators
for biases and survey quality, reducing the sample and creating larger error mar-
gins. According to Walliman (2006) non-responses cannot exceed 50% of the to-
tal participants and 20% or less is excellent. In this study, the non-response rate
was 31 N indicating 18% reduction of the total participant sample, therefore an
excellent non-response rate according to Wallimann’s (2006) rating. So, in total,
139 participants finished the survey.
Whether or not the sample frame and the sample size is efficient to generalize
the given population (co-workers who use an ESM tool in the workplace) is hard
to theorize about. Other studies have indicated a minimum sample size of 100-150
to be able to represent a population of, for example students using the internet in
America and Korea (Ko, Cho and Roberts, 2005). Fowler (2009) states that a
sample only can be representative of the sample frame, in this case those 610 co-
workers. The sample frame is drawn from a wide variety of industries, positions
and age groups, which can contribute to making it more representative for the
general population, or maximum sample. The sample must capture a wide variety
of characteristics in order represent the total population.
The method of sampling in this study was similar to what is called “snowball
sampling”, a non-probability sampling method aimed toward getting access to a
closed network. This study gained this access through establishing a manager con-

21
tact, who then agreed to send out the survey to all the employees. Everyone in the
organization had the same chance to get selected to participate in the study.
4.3 Survey
The survey consisted of 22 questions arranged into 4 parts:
• Part 1 captured demographics such as age, occupation and gender, and person-al experiences connected to the Technology Acceptance Model (TAM), to con-trol whether previous experiences with ESM-systems have an impact on behav-ioural use.
• Part 2 dealt with current use in the workplace, in terms of frequency and func-tion.
• Part 3 focused on the needs and expectations (gratifications sought) of using an ESM-system.
• Part 4 measured how well their current system is able to achieve those needs or meet those expectations (gratifications obtained), drawing from previous UGT research, in order to identify some degree of “success” for ESM imple-mentations.
The survey was tested and approved by the managers who distributed the survey
to the rest of the employees. The survey was sent back one time since they experi-
enced that one question about social media use in the workplace was asked two
times in different sections. So, without too much struggle, this was corrected and
the survey was sent out again.
The survey operationalized Palmgren and Rayburn’s (1979) model of gratifi-
cations sought and gratifications obtained “GS-GO”, by using part 3 of the survey
exclusively for gratifications sought from the employees and, in part 4, letting the
participants evaluate actual achieved effect of those gratifications, thus measuring
gratifications obtained. Most of the questions were measured using a five point
Likert scale ranging from 1 = Very dissatisfied to 5 = Very satisfied. Other ques-
tions were measured using either open-ended/qualitative responses, or response
sets using categorical and ordinal scales, for questions such as “which function in
the organization do you belong to?”.
4.4 Data collection
The survey was conducted with five companies, all working and operating in
Sweden. The survey was distributed in April and was open to the beginning of

22
May. All the participating companies are classified as small to medium enterprises
(SME). The same questions were posed to all the companies except one question,
regarding which function the employees belonged to in the organization. The re-
sponse sets were adapted to the company's unique structure. Another difference
between the companies were which system they used as an ESM tool. As a result,
three different ESM systems were identified: Slack, Skype for business and Yam-
mer. The survey was distributed by contacting managers in each organization,
who then were asked to send out an email containing a link to the online survey,
powered by SurveyMonkey, to all the employees. The data took 4 weeks to gath-
er, with two reminder rounds in each organization, in addition to the first round.
The study found reliability in this data collection method in studies such as
Leftheriotis and Giannakos (2013) who investigated how social media can in-
crease employees’ productivity.
4.5 Measures
It is important to have clear measures before building the survey, and, when
measures are clear, produce good questions of those measures (Fowler, 2009).
This study followed the procedure of adapting tested and proven measures from
prior studies (See figure 3), a necessary criterion for the data to be valid and
trustworthy, according to Straub (1989).
(Figure 3: Table of proven measures from prior studies)
The survey consisted of four parts for measuring employee use of ESM. The first
part measured demographics (such as: gender, age and function in the organiza-
tion), and personal use/experiences, taken from the model of TAM, since previous
Socialgratifications WorkgratificationsSoughtaftergratifications Korgaonkar&Wolin,1999;
Papacharissi&Rubin,2000).Quan-Haase&Young(2010)Gonzalezetal(2013)
DiMiccoetal.,2008Sangwan,2005Zoonen,Meer&Verhoeven,2017
Obtainedgratifications Korgaonkar&Wolin,1999;Papacharissi&Rubin,2000).Quan-Haase&Young(2010)Gonzalezetal(2013)
DiMiccoetal.,2008Sangwan,2005Zoonen,Meer&Verhoeven,2017

23
studies (Wang, Yang & Chen, 2016; Grudz et al., 2016) have proved that “ease of
use” and “perceived usefulness” can affect to usage and behaviour in ESM.
The second part was measuring frequency of use, operationalised with three
questions asking: “Days per week spent using both social media and the ESM sys-
tem in the workplace” and “Hours per day spent using the ESM system in the
workplace”. The construct was selected and modelled after Zizka (2014), who
concluded that frequency of use might be the strongest predictor of gratifications
obtained.
Social related use was drawn from several studies within UGT research (Kor-
gaonkar & Wolin, 1999; Papacharissi & Rubin, 2000; Quan-Haase & Young,
2010; Gonzalez et al., 2013). In this study the construct of “social” was divided
into three parts: social use, social interaction and entertainment, since many of
the previous gratifications overlap (Sundar & Limperos, 2013). The social factor
is measured using 12 constructs ranging from social use (e.g. “setting up a social
event”) to social interaction (e.g. “I can connect with others”) and entertainment
(e.g. “It is fun to explore”).
Work related use was drawn from several studies that have tried to build and
investigate work related use in various contexts (Sangwan, 2005; DiMicco et al.,
2008; Zoonen, Meer & Verhoeven, 2017), to secure an accurate scale. Eight vari-
ables were used to measure work gratifications, driven by information motivation:
“information for my exact needs” and “information of high value”. Other exam-
ples of variables in the survey are: “To set up meetings with colleagues about
work projects”, “Post updates in work projects” and “upload credible information
for future use.
4.6 Data analysis
As aforementioned, 610 employees from five different organizations got the
chance to answer the survey, and 170 actually did fill out the survey, with 139
completing the survey.
First, after data was collected from SurveyMonkey and transferred into SPSS,
appropriate measures were taken to assess the validity and reliability of the data,
in accord with Allen, Titsworth and Hunt (2009) recommendations. Scale reliabil-
ity tests were made to check normal distribution, outliers and central tendencies

24
overall. After central tendencies in the variables were analysed, a descriptive
analysis was made to present data about current uses from the population. Lastly,
the research questions were analysed, for RQ1: we used both frequencies and a
factor analysis in order to secure and validate the different gratifications, both
those sought after, and actually obtained gratifications. Since both contained 20
different constructs or questions, the aim was to get three or two factors explain-
ing more than 50% of the variance. And for RQ2: a regression analysis was con-
ducted to test the independent variables against work related use of ESM (the de-
pendent variable). The purpose is to find out how much variance they explain in
the dependent variable, and also the individual relationship between the different
independent variables and the dependent variable.
4.7 Reflection
One of the biggest drawbacks of this study is the fact that the gratifications were
pre-chosen according to previous research. It is possible that this study overlooked
important measures that are even more sought after, it is also possible to extend
this study by conducting in-depth interviews in order to capture possible gratifica-
tions that this study missed.
Another important fact to further elaborate is that this study focus on users of
ESM that are frequently using these systems, thus already adopted the technology.
It is possible that employees that refrain from using ESM is a more interesting
target. But in defence of this study, it does not argue that a slow adoption rate of
ESM is the problem – even if that is the case. This study argues that ESM adop-
tion increases in rapid phase but without any real goal-directedness because em-
ployees, managers and other responsible parties do not know how to use ESM in
the organization. So, in order to understand how they can be used, this study em-
phasise that one must look at successful usage and analyse the behaviours.
In order to find these organization, the sampling is a bit biased because the or-
ganizations using ESM, to a larger extent, are hard to find, thus are similar in size.
Therefore, the sample in this study may not be representing the whole population
but only those 610 employees that was surveyed.
25
5. Results
This chapter aims to present the results from the data set that was collected
through the survey. The first part gives an overview over the descriptive statistics
of the population, followed by RQ1, which presents the factor analysis to retrieve
scores on the gratifications. This is followed by RQ2, presenting the multiple line-
ar regression analysis in order to test the model, and to identify the relationship
between the explaining variables and the dependent variable.
5.1 Current use of ESM and public social media
The participants in this study ranged from 19 to 60 years old, with a majority in
the younger segment between 19-30 years old (48.8%). The gender distribution
was 60.6% males and 39.4% females, probably not an accurate reflection of the
real gender variance in the total population. The participants in this study are
heavy users of social media. 89.4% have used social media longer than 5 years,
while a majority of these have used social media for longer than 10 years. 90.6%
used social media almost everyday in their homes. As for the use of social media
in the workplace, only 44.7% use social media, such as Facebook, at work.
The respondents were familiar with ESM, which strengthens the utility of the
sample, since the organizations were chosen according to their ESM use. While
most of the respondents are using ESM everyday (66.5%). 75,8% of these users
do not spend more than 1 hour per day using it (see table 1).
A question about how they perceived their use of new technology indicated
that 72.9% considered themselves as early adopters or early majority, correlating
with the age of the respondents. A slight negative correlation indicated that
younger people tended to be more early adopters than older people. And the same
goes for the personal experience of ESM. While most people indicated that they
were positive towards the ease and convenience of use for ESM, a strong negative
correlation between age and personal experience indicated that younger people
tended to be more positive towards the use of ESM than older people.

26
The results also confirmed that employees felt ESM (M = 3.69 SD = 0.97) to
be more safe than public social media (M = 2.61 SD = 1,02), which, in fact, seems
important for overall use of a certain medium. Ease of use and convenience of use
were similar for both ESM (M = 4,0 SD = 0,97) and public social media (M = 3,9
SD = 1,02). The study recognized a fairly strong positive correlation between the
two mediums, indicating that the more experience or ease of use a person per-
ceived for public social media, also meant a higher indication for the perceived
ease of use for ESM. The results also indicated that younger people tend to use
public social media at work more frequently than older people.
Population (N = 170) Frequency Percentage Gender Male 103 60.6% Female 67 48.8% Age (M = 34.34, SD = 11.8) 19 – 25 42 25% 26 – 35 40 23,8% 36 – 45 26 15,5% 46 – 50 34 20,2% 51 and more 26 15,5% Function Blue collars 15 8% White collars business 127 74.7% White collars IT 28 16.4% Years of social media use Never 8 4.7% 1-5 years 10 5.9% 5-10 years 78 45.9% 10 years or longer 74 43.5% Frequency of ESM use Never 6 3.5% One or two times 20 11.8% Two or more times 24 14.1% Almost everyday 34 20% Everyday 79 46.5% ESM use in the workplace (M = 1.8, SD = 1.1) No time at all 31 18.2% Barely an hour 98 57.6% 1-2 hours 23 13.5% 2 or more hours 11 6.5% Adoption of new technology Early adopter 26 15.3% The early majority 98 57.6% The late majority 40 23.5% A laggard 5 2.9% Non user 1 0.6% Personal experience of ESM (5 point Likert scale) Easy to use (M = 3.9, SD = 1.02) Safe to use (M = 3.69, SD = 0.97) Perceived usefulness (M = 3.8, SD = 1.1) Personal experience of Public social media (5 point Likert scale) Easy to use (M = 4, SD = 0.97) Safe to use (M = 2.6, SD = 1.02) Perceived usefulness (M = 3.7, SD = 1.04)
(Table 1: Demographics of respondents)

27
5.2 Gratifications sought and obtained
The first question (RQ1) was asking about which gratifications that were sought
and obtained in organizations from using various ESM systems. First, a descrip-
tive analysis was performed to extract the means (M) and standard deviations
(SD) of all the gratifications. The results showed that (see table 2) the first and
most frequent obtained gratification was “gain access to others with expertise in a
particular area” (M = 3.52, SD = 1.25) followed by “Set up meetings with col-
leagues about work projects” (M = 3.44, SD = 1.48). Further, looking at sought
after gratifications (see table 3), the results yielded similar output where “Set up
meetings with colleagues about work projects” (M = 3.66, SD = 1.43) was mostly
sought after followed by “Gain access to others with expertise in a particular area”
(M = 3.53, SD = 1.16). It basically means that expectations seem to be a bit higher
than gratifications actually achieved, even more so for work gratifications than
social gratifications.
Work gratifications Obtained Mean Standard deviation
Post updates on work projects 3,366 1,319
Share information about organizational objec-tives with colleagues
3,094 1,484
Share information about organizational policies and procedures
2,892 1,477
Organize work files 2,237 1,380
Upload credible information for future use 2,550 1,445
Share my expertise in a particular area 3,352 1,226
Gain access to others with expertise in a particu-lar area
3,525 1,251
Set up meetings with colleagues about work projects
3,446 1,489
(Table 2: Work gratifications obtained)
28
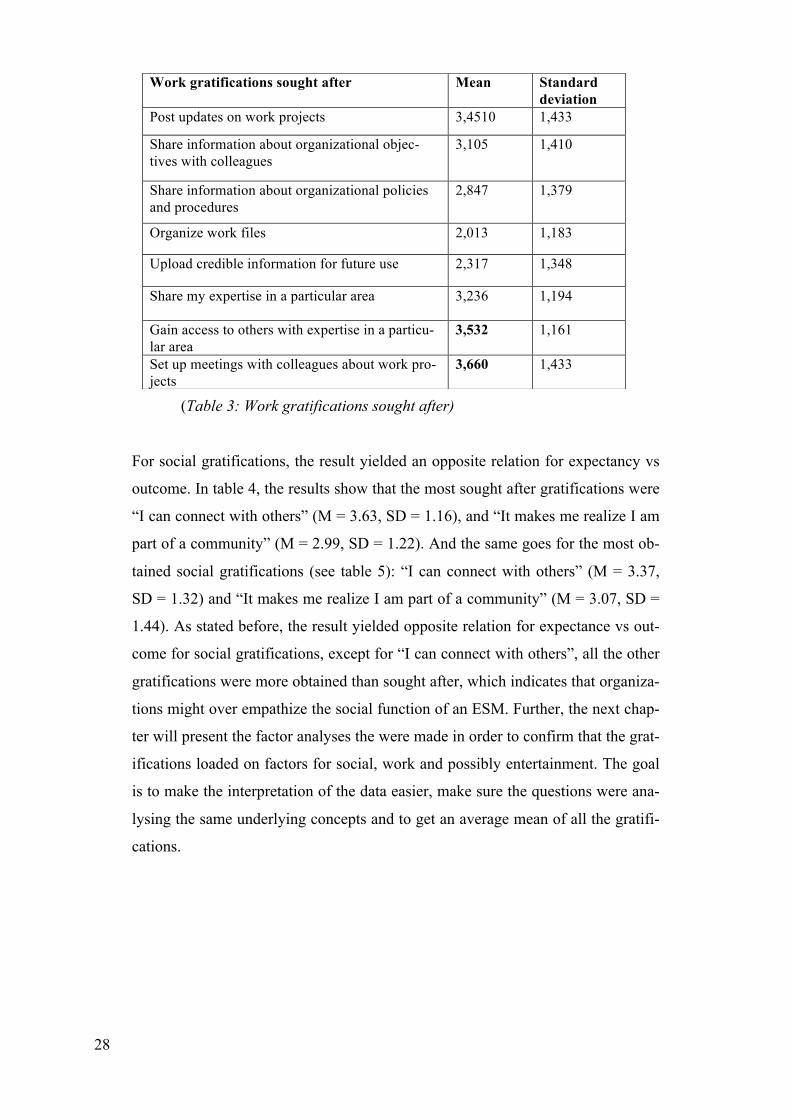
(Table 3: Work gratifications sought after)
For social gratifications, the result yielded an opposite relation for expectancy vs
outcome. In table 4, the results show that the most sought after gratifications were
“I can connect with others” (M = 3.63, SD = 1.16), and “It makes me realize I am
part of a community” (M = 2.99, SD = 1.22). And the same goes for the most ob-
tained social gratifications (see table 5): “I can connect with others” (M = 3.37,
SD = 1.32) and “It makes me realize I am part of a community” (M = 3.07, SD =
1.44). As stated before, the result yielded opposite relation for expectance vs out-
come for social gratifications, except for “I can connect with others”, all the other
gratifications were more obtained than sought after, which indicates that organiza-
tions might over empathize the social function of an ESM. Further, the next chap-
ter will present the factor analyses the were made in order to confirm that the grat-
ifications loaded on factors for social, work and possibly entertainment. The goal
is to make the interpretation of the data easier, make sure the questions were ana-
lysing the same underlying concepts and to get an average mean of all the gratifi-
cations.
Work gratifications sought after Mean Standard deviation
Post updates on work projects 3,4510 1,433
Share information about organizational objec-tives with colleagues
3,105 1,410
Share information about organizational policies and procedures
2,847 1,379
Organize work files 2,013 1,183
Upload credible information for future use 2,317 1,348
Share my expertise in a particular area 3,236 1,194
Gain access to others with expertise in a particu-lar area
3,532 1,161
Set up meetings with colleagues about work pro-jects
3,660 1,433

29
Social gratifications sought after Mean Standard deviation
Set up social events with co-workers after work-ing hours
2,490
1,377
Make friends within the organization 2,513
1,301
Find people with similar interests 1,764
0,951
Chat with others while at work 2,45
2,241
I can connect with others 3,633
1,351
I can expand my social network 2,209 1,115
It makes my realize I am part of a community 2,993
1,226
It allows me to build social capital 2,633
1,168
(Table 4: Social gratifications sought after)
Social gratifications obtained Mean Standard deviation
Set up social events with co-workers after working hours
2,294 1,534
Make friends within the organization 2,525 1,410
Find people with similar interests 2,079 1,479
Chat with others while at work 2,741 1,598
I can connect with others 3,374 1,320
I can expand my social network 2,647 1,483
It makes my realize I am part of a community 3,071 1,447
It allows me to build social capital 2,748 1,474
(Table 5: Social gratifications obtained)
5.2.1 Factor analysis of gratifications sought and obtained
To check whether it was appropriate to reduce data to simplify the analysis, a
principal-components factor analysis was performed with direct oblimin rotation,
to confirm that the gratifications were measuring the same underlying concepts
(i.e., work gratifications, social gratifications, and entertainment gratifications)
The factor analysis was validated using Kaiser-Meyer-Olkin Measure of Sampling
Adequacy (.826) which must be over 0.6 (an indication that the correlation matrix
was sufficient for factoring), and Bartlett's Test of Sphericity (.000) which should
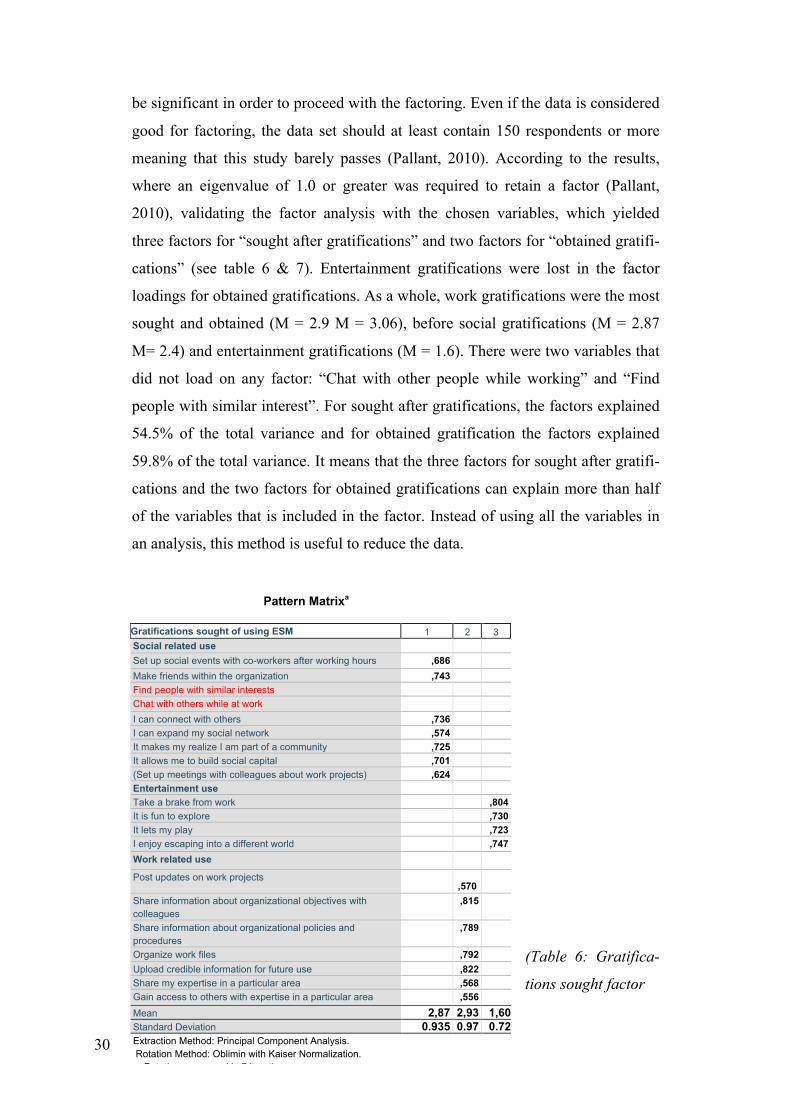
30
be significant in order to proceed with the factoring. Even if the data is considered
good for factoring, the data set should at least contain 150 respondents or more
meaning that this study barely passes (Pallant, 2010). According to the results,
where an eigenvalue of 1.0 or greater was required to retain a factor (Pallant,
2010), validating the factor analysis with the chosen variables, which yielded
three factors for “sought after gratifications” and two factors for “obtained gratifi-
cations” (see table 6 & 7). Entertainment gratifications were lost in the factor
loadings for obtained gratifications. As a whole, work gratifications were the most
sought and obtained (M = 2.9 M = 3.06), before social gratifications (M = 2.87
M= 2.4) and entertainment gratifications (M = 1.6). There were two variables that
did not load on any factor: “Chat with other people while working” and “Find
people with similar interest”. For sought after gratifications, the factors explained
54.5% of the total variance and for obtained gratification the factors explained
59.8% of the total variance. It means that the three factors for sought after gratifi-
cations and the two factors for obtained gratifications can explain more than half
of the variables that is included in the factor. Instead of using all the variables in
an analysis, this method is useful to reduce the data.
(Table 6: Gratifica-
tions sought factor
Pattern Matrixa
Gratifications sought of using ESM 1 2 3
Social related use
Set up social events with co-workers after working hours ,686
Make friends within the organization ,743
Find people with similar interests
Chat with others while at work
I can connect with others ,736
I can expand my social network ,574
It makes my realize I am part of a community ,725
It allows me to build social capital ,701
(Set up meetings with colleagues about work projects) ,624
Entertainment use
Take a brake from work ,804 It is fun to explore ,730 It lets my play ,723 I enjoy escaping into a different world ,747 Work related use
Post updates on work projects ,570
Share information about organizational objectives with
colleagues
,815
Share information about organizational policies and
procedures
,789
Organize work files ,792 Upload credible information for future use ,822 Share my expertise in a particular area ,568 Gain access to others with expertise in a particular area ,556
Mean 2,87 2,93 1,60 Standard Deviation 0.935 0.97 0.72 Extraction Method: Principal Component Analysis.
Rotation Method: Oblimin with Kaiser Normalization.
a. Rotation converged in 7 iterations.

31
(Table7: Gratification obtained factor)
5.2.2 Further use of ESM
The survey also includes open-ended questions that enabled participants to answer
freely about sought and obtained gratifications. The result indicates that an in-
formative need when using ESM is missing in the pre-chosen variables in this
study. Participants expressed a need, or rather an obtained gratification, that ESM
enables quick and accurate information about work. Employees tend to use ESM
to access previous information (it is easier to search for history in ESM than mail,
for example) and also to acquire fast answers about certain work projects or other
work related tasks. In conclusion, a majority of the open-ended answers included
“access to information and to disseminate information in the organization”, exam-
ples are provided in table 8 below, all the answers are available in Swedish in the
appendix. The examples in table 8 are translated from Swedish to English since
the participants answered in Swedish.
Pattern Matrixa Gratifications obtained from using ESM 1 2 Work related use Post updates on work projects ,741 Set up meetings with colleagues about work projects ,540 Share information about organizational objectives with colleagues
,862
Share information about organizational policies and procedures ,876 Organize work files ,592 Upload credible information for future use ,763 Share my expertise in a particular area ,765 Gain access to others with expertise in a particular area ,750 Social related use It is fun to explore ,626 It lets my play ,813
I enjoy escaping into a different world ,879 I can connect with others ,654 I can expand my social network ,784 It makes my realize I am part of a community ,707 It allows me to build social capital ,762 Set up social events with co-workers after working hours ,779 Make friends within the organization ,700 Take a brake from work ,923
Chat with others while at work ,577
Find people with similar interests ,765
Mean 2.48 3.05 Standard deviation 1.11 1.06 Extraction Method: Principal Component Analysis. Rotation Method: Oblimin with Kaiser Normalization.a a. Rotation converged in 5 iterations.
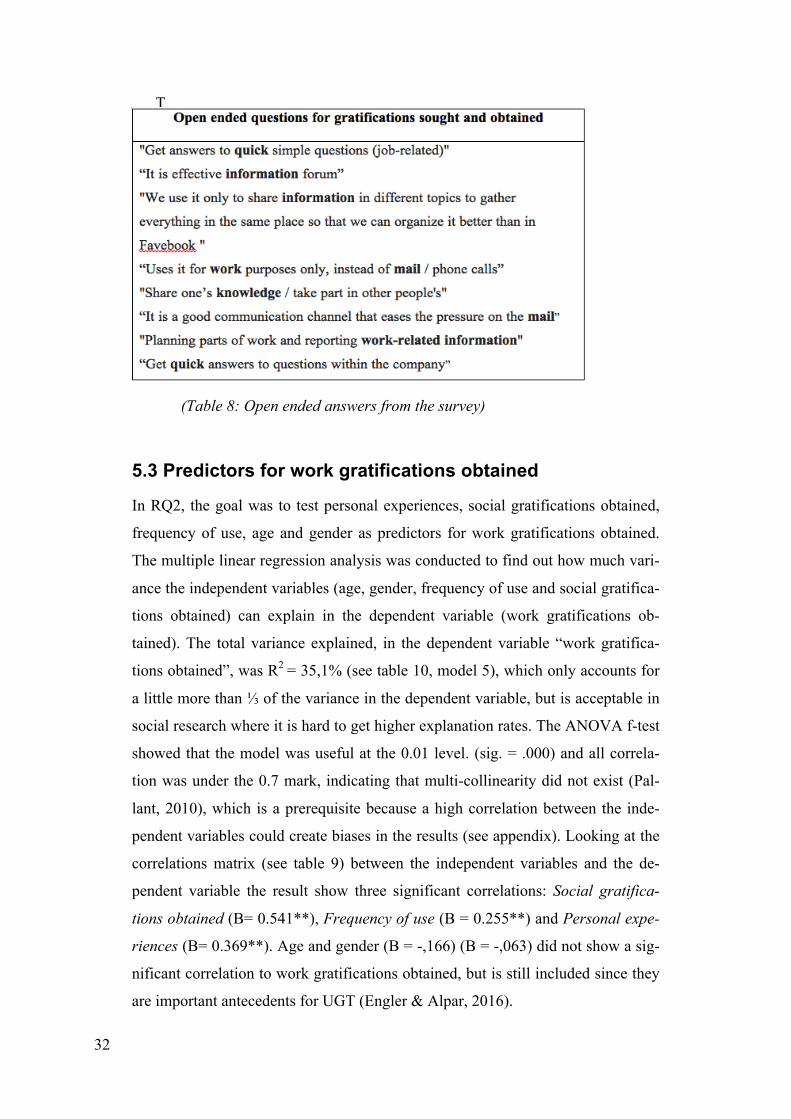
32
T
(Table 8: Open ended answers from the survey)
5.3 Predictors for work gratifications obtained
In RQ2, the goal was to test personal experiences, social gratifications obtained,
frequency of use, age and gender as predictors for work gratifications obtained.
The multiple linear regression analysis was conducted to find out how much vari-
ance the independent variables (age, gender, frequency of use and social gratifica-
tions obtained) can explain in the dependent variable (work gratifications ob-
tained). The total variance explained, in the dependent variable “work gratifica-
tions obtained”, was R2 = 35,1% (see table 10, model 5), which only accounts for
a little more than ⅓ of the variance in the dependent variable, but is acceptable in
social research where it is hard to get higher explanation rates. The ANOVA f-test
showed that the model was useful at the 0.01 level. (sig. = .000) and all correla-
tion was under the 0.7 mark, indicating that multi-collinearity did not exist (Pal-
lant, 2010), which is a prerequisite because a high correlation between the inde-
pendent variables could create biases in the results (see appendix). Looking at the
correlations matrix (see table 9) between the independent variables and the de-
pendent variable the result show three significant correlations: Social gratifica-
tions obtained (B= 0.541**), Frequency of use (B = 0.255**) and Personal expe-
riences (B= 0.369**). Age and gender (B = -,166) (B = -,063) did not show a sig-
nificant correlation to work gratifications obtained, but is still included since they
are important antecedents for UGT (Engler & Alpar, 2016).
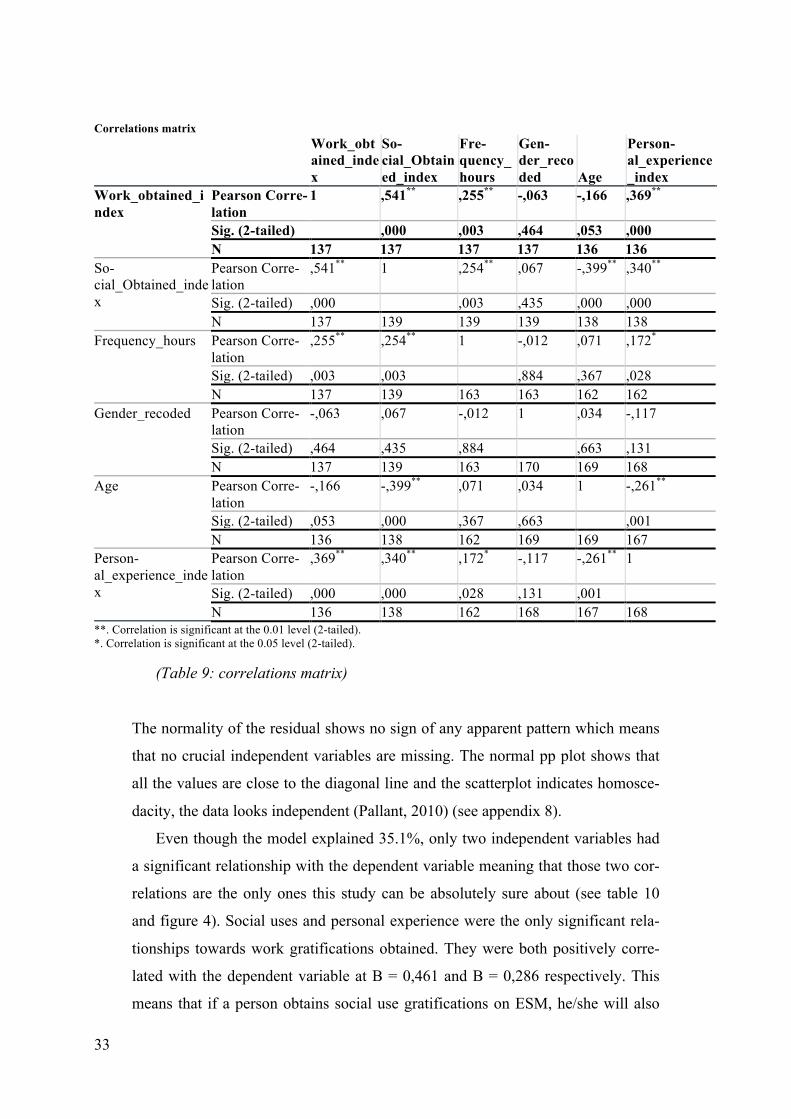
33
Correlations matrix
Work_obtained_index
So-cial_Obtained_index
Fre-quency_hours
Gen-der_recoded Age
Person-al_experience_index
Work_obtained_index
Pearson Corre-lation
1 ,541** ,255** -,063 -,166 ,369**
Sig. (2-tailed) ,000 ,003 ,464 ,053 ,000 N 137 137 137 137 136 136
So-cial_Obtained_index
Pearson Corre-lation
,541** 1 ,254** ,067 -,399** ,340**
Sig. (2-tailed) ,000 ,003 ,435 ,000 ,000 N 137 139 139 139 138 138
Frequency_hours Pearson Corre-lation
,255** ,254** 1 -,012 ,071 ,172*
Sig. (2-tailed) ,003 ,003 ,884 ,367 ,028 N 137 139 163 163 162 162
Gender_recoded Pearson Corre-lation
-,063 ,067 -,012 1 ,034 -,117
Sig. (2-tailed) ,464 ,435 ,884 ,663 ,131 N 137 139 163 170 169 168
Age Pearson Corre-lation
-,166 -,399** ,071 ,034 1 -,261**
Sig. (2-tailed) ,053 ,000 ,367 ,663 ,001 N 136 138 162 169 169 167
Person-al_experience_index
Pearson Corre-lation
,369** ,340** ,172* -,117 -,261** 1
Sig. (2-tailed) ,000 ,000 ,028 ,131 ,001 N 136 138 162 168 167 168
**. Correlation is significant at the 0.01 level (2-tailed). *. Correlation is significant at the 0.05 level (2-tailed).
(Table 9: correlations matrix)
The normality of the residual shows no sign of any apparent pattern which means
that no crucial independent variables are missing. The normal pp plot shows that
all the values are close to the diagonal line and the scatterplot indicates homosce-
dacity, the data looks independent (Pallant, 2010) (see appendix 8).
Even though the model explained 35.1%, only two independent variables had
a significant relationship with the dependent variable meaning that those two cor-
relations are the only ones this study can be absolutely sure about (see table 10
and figure 4). Social uses and personal experience were the only significant rela-
tionships towards work gratifications obtained. They were both positively corre-
lated with the dependent variable at B = 0,461 and B = 0,286 respectively. This
means that if a person obtains social use gratifications on ESM, he/she will also

34
obtain work gratifications for the use of ESM. Since the scale ranged from 0-5 in
satisfaction one could say that: if a person goes from being satisfied to very satis-
fied with social gratifications, they will most likely move half a step on the same
Likert scale with work gratifications satisfaction (see appendix 8). Age and gender
did not have a significant correlation to work gratifications obtained in ESM,
which means that this study cannot be sure that the correlations are correct, but it
is still interesting to state something about their slope. As shown in table 9, they
do increase the explaining rate of the work gratifications obtained, indicating a
contribution to the overall model. B = 0.007 for age and B = -0.159 for gender in-
dicates that females may obtain a higher degree of work gratifications in ESM
than males. And age has almost no correlation at all. So, in contrast to previous
research on age and use of social media (Skeels & Grudin, 2009), age is not a pre-
dictor of work gratifications obtained (see appendix 8). Further, frequency of use
was not significant, but showed a slight positive correlation with work gratifica-
tions obtained (B = 0.247), which, in this sample, means that those spending 1
hour or more on ESM are more likely to obtain work gratifications than those us-
ing it less than an hour (see table 10, and full table in appendix 8).
Coefficients
Model 1 Model 2 Model 3 Model 4 Model 5 Social gratifi-cations ob-tained
,514**
446** ,424**
,432**
,461**
Personal ex-periences
,300**
,285**
,269*
,286*
Frequency of use
,290
,287
,247
Gender -,152
-,159
Age ,007
Intercept 1,78 0,85 0,44 0,57 0,29 N 137 137 137 137 137 R2 (R square) 0,293 0,331 0,342 0,347 0,351
(Table 10: Coefficients from regression analysis).

35
(Figure 4: Hypothesis model tested, significance: * = 0,05 ** = 0,01)
36
6. Discussion
In the discussion, the study elaborates the result in chapter five with previous re-
search. Starting with RQ1, why employees use ESM in the organization, followed
by RQ2, predictors of work gratifications obtained. Lastly, the study presents and
discusses limitations, future research and practical and theoretical contributions.
6.1 The aim of this study
As mentioned in the introduction, the goal of this study is to understand why em-
ployees use ESM in the organization.
By adopting the UGT and TAM models, users could categorize important
needs and outcomes, providing guidance as to the degree of goal-directedness for
ESM in the organization. Secondly, by applying important variables (personal ex-
periences, social gratifications obtained, frequency of use, age and gender) to pre-
dict work gratifications obtained, this study is able to say something about the
population that uses ESM. In the next chapter, the study discusses the data in RQ1
(gratifications sought and obtained) with previous research.
6.1.1 Gratifications sought and obtained (RQ1)
The first question “why do employees use ESM in the organization?” should be
viewed as a descriptive question with the goal to find out employee expectations
and outcomes using ESM. For starters, employees seem to use ESM mainly to
gain access to others’ expertise and plan meetings with colleagues for work pro-
jects. This has, not surprisingly, been discussed in earlier studies (Wang, Yang
and Chen, 2016). Instead of being a “social” network, ESM transforms into a
knowledge network where the relationship is the exchange of knowledge and in-
formation, which is precisely what this study is able to strengthen.
Even though social gratifications generally were not sought after from the em-
ployees, some social gratifications were obtained. The two most obtained social

37
gratifications were “I can connect with others” and “strengthen social capital”,
whereas “making friends in the organization” was the least sought and obtained.
This proves that employees do not use ESM for making friends or to socialize in
that context, which further strengthens the thesis that employees do not desire a
platform to be social but rather to get work done. In other words, this study is
aware that social gratifications are obtained when using ESM, but employees do
not expect or need them to, looking at their sought after gratifications. Several
studies (Gonzales et al., 2013; Cao et al., 2016) have argued that ESM should be
used to socialize in a more informal way with colleagues within the organization,
whereas this study shows that that may not be in line with actual behaviour or ex-
pectations. The positive correlation between social and work gratifications that
was discovered in RQ2 will be discussed further on. This discussion can be relat-
ed to (walden, 2016; Madsen & Verhoeven, 2016; Raišienė & Jonušauska, 2011)
who found that employees rather use social media to contact friends than col-
leagues, which may not be surprising when talking about Facebook, but is an im-
portant insight when talking about an ESM such as Slack.
An interesting finding is that employees are driven to use ESM because they
want to acquire fast and accurate work related information. The open-ended ques-
tions revealed and strengthened the need for a platform to (1) reduce time spent on
email to acquire work related information faster, and ESM does seem to gratify
employees’ need to ask short work related questions more efficiently than using
mail, and, (2) receive and spread information across the organization which, apart
from getting access to others’ expertise and planning meetings, seems to be one of
the most important contribution of ESM.
6.1.2 Predictors for work gratifications obtained (RQ2)
In RQ2, this study sought to find predictors for those who obtained work gratifica-
tions from using ESM. Firstly, the model explained 35.1% of the dependent vari-
able and the study was also able to confirm two of five the hypotheses: that social
gratifications obtained were positively related to work gratifications obtained and
that the personal experiences variable was positively related to work gratifications
obtained. The strongest significant predictor was the social gratifications obtained
variable, which means that some degree of social fulfilment when using ESM can

38
increase work gratifications obtained, yet employees did not seek social gratifica-
tions to any large extent. What this entails is simply that ESM provides a platform
for strengthening social ties, or more conveniently connects people in the organi-
zation, which conversely makes people obtain some degree of social gratifica-
tions. At the same time, employees feel a more urgent need for work gratifications
from using ESM. But even if ESM enables people to do work more quickly,
strong social ties also increases speed and efficiency. Studies have touched upon
this topic, Gonzales et al., (2013) did find that ESM affects the corporate culture
in a positive way, for example.
This study further strengthens the personal experiences (Ease of use and use-
fulness) variable as a predictor of work gratifications obtained. In this study, it
was the second strongest predictor. People who experience or perceive ESM as
useful and easy to use tend to obtain a higher degree of work gratification than
those who do not – which is in line with what previous research has been able to
prove (Lou & Remus, 2014). Worth mentioning is that social gratifications ob-
tained did not have the same correlation with personal experiences indicating that
work gratifications obtained might be connected more strongly to those who truly
understand the nature of ESM and what it encompasses in terms of functionality
and value than those who feel it less useful. It could also indicate that ESM needs
goal setting in order for employees to see it useful, and ease of use in order to
provide more work gratifications.
This study could, however, not find a strong link between frequency of use
and work gratifications obtained. Firstly, the correlation was not significant, sec-
ondly, the descriptive analysis showed that employees use ESM everyday but a
majority only use it only an hour or less. Even if the correlation in the model is
positive indicating that more frequent use is beneficial for work gratifications ob-
tained, only a few percent used it more than one hour. In this case, the more time
you spent in ESM did not seem to actually be a measurement of more work grati-
fications obtained. But for social gratifications obtained, frequency of use was
more strongly correlated, which means that employees who spend more time on
ESM are more likely to contribute and be engaged socially in the organization
through ESM.
An interesting finding from the model was that age did not have a correlation
to work gratifications obtained at all, but it had a higher correlation with social
39
gratifications obtained. So, in line with Li (2007), it seems that the older an ESM
user is, the less likely he/she is to participate in social activities on ESM, and con-
versely younger people are more likely to obtain social gratifications. So, the posi-
tive correlation between social gratifications obtained and work gratifications ob-
tained may be mediated through the age of a user.
6.1.3 Conclusion
In conclusion, the data shows an indication that ESM is used more as a way of
getting work done quickly, than spending hours of the workday talking to other
people. This contradicts studies such as Gonzales et al. (2013) and Cao et al.
(2016) who argue that ESM should instead be used to interact with fellow col-
leagues in a more informal and non work related fashion.
Leonardi, Huysman and Steinfield (2013) talked about three different meta-
phors that have guided researchers in their pursuit toward understanding the
meaning of ESM. In relation to this study, the data clearly shows that one should
not over emphasize the social lubricant metaphor, or echo chamber and leaky pipe
for that matter either. According to this study, it would be more appropriate to talk
about ESM as a search engine for company specific information and knowledge.
When someone needs information, or wants to acquire knowledge about some-
thing fast, people usually use Google to get accurate and fast answers. ESM seems
to function in a similar manner (where the company is the “internet” to be navi-
gated). Employees desire that kind of tool in the organization today to support
their everyday work. This also means that no other media platform can gratify this
need, not even Google. But, it still is user generated content that enables a suc-
cessful and meaningful ESM platform. So, social capital and organizational cul-
ture surely plays an important role in that, and should not be overlooked. Howev-
er, talking about ESM as a search engine could also mean higher expectations on
employees, because in this scenario they would be held accountable for providing
accurate, fast and relevant information, just like our expectations on Google.
40
7 Practical and Theoretical implications
7.1 Practical implications
The single most important contribution of this research to the field of strate-
gic communication is that it enhances our understanding of why employees
do use ESM in organizations.
Since ESM nowadays is part of the internal communication strategy, practitioners
are able to utilize the results in this study as a guidance for implementing, or
maintaining usage of ESM. In other words, it could help identify how social me-
dia coordinators, managers or other responsible parties for the implementation of
ESM, can develop ESM strategies that secure higher employee engagement, and
higher value for the company. While this study does not address adoption of new
technology, which many studies do, the real issue here is that ESM implementa-
tions are embarked upon without any real goal-directedness, and in response to
that, this study presents proof of uses from successful cases. And, most important-
ly, communication practitioners should also benefit from a clearer understanding
of the potential drivers for different uses of ESM, as provided in this study in
RQ2.
This study also sheds light on the fact that ESM can put stress on the organiza-
tion where quick and accurate information is expected, in turn implying that em-
ployees must be “on standby” all the time to answer questions that might come
their way. Observe that this critical part only is an assumption, drawn from the re-
sults in this study, and should not perceived as validated fact. Viewing ESM as an
“ask anything” tool, ie a search tool like Google, is simply in line with the find-
ings of this study, so further studies and goal-directed implementations with this
focus are encouraged by the study.

41
7.2 Theoretical implications
This study both confirms and extends the usefulness of UGT, as a research model
in the field of strategic communication. First off, no other studies have tried to ap-
ply UGT on ESM before, which is a contribution to the existing body of research
and theory itself. This study can present accurate and interesting findings thanks
to using the UGT model, which proves that the model is highly applicable, even
though the model has its origins in "old media". Also, TAM was partly integrated
into UGT to find potential predictors for gratifications obtained, and the model
showed that the two independent variables of TAM were in fact significantly cor-
related with work gratifications obtained, which in turn confirms that applying
TAM and UGT in combination, leads to higher explanation rates. Since UGT has
been found to provide high explanation rates for user behaviours in this study,
strategic communication practitioners are encouraged to utilize this theory to fur-
ther investigate new media.
However, it is important to emphasize that this study finds little or no use
for gender and age as predictors/variables of user behaviour, although the data
shows that there is some (negative) correlation between age and social gratifi-
caions obtained (not sought after). In this study, these variables were not signifi-
cant, which is why it seems desirable to go further, to find other predictors of user
behaviours. So, overall, this study is both a theoretical and practical contribution.
7.3 Limitations and future research
There are a number of limitations that should be taken into consideration when
reading the results in this study. First, this study had a relatively small sample size
which may have implicated the actual relationships in the research model. A larg-
er sample size would have increased the accuracy of the data. Second, this study
aimed towards a larger generalization in the given population, but given the fact
that only a few companies felt mature enough to participate in this study, it was
hard to conduct a probability sampling. The resulting data was therefore only
gathered from small to medium enterprises, limiting general applicability.
Another limitation to this study is that the gratifications sought and obtained
were chosen from previous research, which limited the respondents’ answers.
They did get the chance to respond in open-ended questions, but it could have in-
42
creased the relevance to conduct interviews first, to find further specific gratifica-
tions (sought after), that might have been overlooked in this study. The results al-
so indicate that there are limitations to the overall model that measured satisfac-
tion with work gratifications obtained. While the model explained 35.1% of the
variance in work gratifications obtained there are probably more predictors of
gratifications obtained that were not included in this study; an information gratifi-
cation, for example, which was identified from the open-ended questions. Another
limitation may be that this study included three different ESM systems since data
was gathered from five different companies, which is why the next chapter en-
courage researchers to conduct comparative studies between different ESM sys-
tems, to acquire more specific data of each individual system.
7.4.1 Future research
Future studies are encouraged to increase the understanding of work related use of
ESM by integrating a more extensive theoretical framework, with more predictors
of gratifications obtained. It would also be interesting to make a comparative
study between different ESMs, to discover gratifications sought and obtained at a
more granular level. The results also show that there are important gratifications
that ESM fulfils, which need further attention, both in terms of how it may affect
internal processes (organizational culture, communication, efficiency etc.), but al-
so to dig deeper into the understanding of ESM itself. Scholars are encouraged to
use qualitative methods such as interviews and content analyses to acquire more
knowledge about ESM as a search engine in organizations, and to find suitable
strategies and frameworks for the use of ESM in organizations.
43
8. References
Allen, M., Titsworth, S. and Hunt, S. (2009). Quantitative research in communi-
cation. 1st ed. London: SAGE.
Whiting, A., Williams, D. (2013),"Why people use social media: a uses and grati-
fications approach", Qualitative Market Research: An International Journal,
16(4) pp. 362 – 369
Blumler, J. G. (1979). The role of theory in uses and gratifications studies. Com-
munication research, 6(1), 9-36.
Cao, X., Vogel, D.R., Guo, X., Liu, H. and Gu, J. (2012), “Understanding the In-
fluence of social media in the workplace: an integration of media synchronici-
ty and social capital theories”, 45th Hawaii International Conference on Sys-
tem Sciences (HICSS), pp. 3938-3947.
Cao, X., Guo, X., Vogel, D., & Zhang, X. (2016). Exploring the influence of so-
cial media on employee work performance. Internet Research, 26(2), pp.529-
545
Colbert, A., Yee, N., & George, G. (2016). The Digital Workforce and the Work-
place of the Future. Academy of Management Journal 2016, 59(3), 731–739.
Coombs, W., Falkheimer, J., Heide, M., & Young, P. (2016). Strategic communi-
cation, social media and democracy (1st ed.). London: Routledge, Taylor &
Francis Group.
Dervin, B. & Song, M. (2005). Reaching for phenomenological depths in uses
and gratifications research: a quantitative empirical investigation. Paper pre-
sented at the annual meeting of the International Communication Association,
New York City, May.
Cancialosi, C. (2016). Digital Communication In The Workplace Is No Longer
Optional. Forbes.com. Retrieved 27 June 2017, from
https://www.forbes.com/sites/chriscancialosi/2016/08/01/digital-
communication-in-the-workplace-is-no-longer-optional/#7cc4c6846ded

44
DiMicco, J. M., Millen, D. R., Geyer, W., Dugan, C., Brownholtz, B., & Muller,
M. (2008). Motivations for Social Networking at Work. Proceedings of the
2008 ACM Conference
Engler, T. & Alpar, P. (2016). Does one model fit all? Exploring factors influenc-
ing the use of blogs, social networks, and wikis in the enterprise.
Enterprise Social Networks: Status Quo of Current Research and Future Research
Directions
Gartner Says 80 Percent of Social Business Efforts will not achieve intended ben-
efits through 2015. (2013) Gartner.com.
http://www.gartner.com/newsroom/id/2319215
Gonzales, Riemenschneider, Leidner and Koch (2013) The impact of internal so-
cial media usage on organizational socialization and commitment.
Gressgård, L.J., (2011) "Virtual team collaboration and innovation in organiza-
tions".
Grudz, A., Haythornthwaite, C., Paulin, D., Gilbert, S., & del Valle, M. (2016).
Uses and Gratifications factors for social media use in teaching: Instructors’
perspectives. New Media & Society.
Hanjun Ko, Chang-Hoan Cho, and Marilyn S. Roberts (2005) A Structural Equa-
tion Model of Interactive Advertising
Heide, M. & Simonsson, C. (2011). Putting Coworkers in the Limelight: New
Challenges for Communication Professionals. International Journal Of Stra-
tegic Communication, 5(4), 201-220.
Kaplan, A. & Haenlein, M. (2010). Users of the world, unite! The challenges and
opportunities of Social Media. Business Horizons, 53(1), 59-68.
Katz, E., Blumler, J., & Gurevitch, M. (1973). Uses and Gratifications Re-
search. Public Opinion Quarterly, 37(4), 509.
Koch, H., Gonzalez, E. and Leidner, D. (2012), “Bridging the work/social divide:
the emotional response to organizational social networking sites”, European
Journal of Information Systems, 21(6), pp. 699-717.
Korgaonkar, P. & Wolin, L. (1999) A Multivariate Analysis of Web Usage.
Zizka, L. (2014). Communication Channels: The Effects of Frequency, Duration,
and Function on Gratification Obtained.

45
Leftheriotis, I., & Giannakos, M. N. (2014). Using social media for work: Losing
your time or improving your work?. Computers In Human Behavior, (31)134-
142.
Lenhart, A., Purcell, K., Smith, A., & Zickuhr, K. (2010). Social media and mo-
bile Internet use among teens and young adults. [Web blog post]
Leonardi, P., Huysman, M., & Steinfield, C. (2013). Enterprise Social Media:
Definition, History, and Prospects for the Study of Social Technologies in Or-
ganizations. Journal of Computer-Mediated Communication, 19(1), 1-19.
Li, D. (2007). Why Do You Blog: A Uses-and-Gratifications Inquiry Into Blog-
gers' Motivations. Conference Papers -- International Communication Associ-
ation, 1.
Lim, W. & Ting, D. (2012). E-shopping: An Analysis of the Uses and Gratifica-
tions Theory. Modern Applied Science, 6(5).
Luo, M., & Remus, W. (2014). Uses and gratifications and acceptance of Web-
based information services: An integrated model. Computers in Human Be-
havior, 38, pp. 281-295.
Fowler, F. (2009). Survey research methods (1st ed.). Thousand Oaks ; London:
Sage Publications.
Macnamara, J. & Zerfass, A. (2012). Social Media Communication in Organiza-
tions: The Challenges of Balancing Openness, Strategy, and Management. In-
ternational Journal of Strategic Communication, 6(4), 287-308.
Madsen, V. (2017). The challenges of introducing internal social media – the co-
ordinators’ roles and perceptions. Retrieved 7 March 2017, from
Mäntymäki, M. & Riemer, K. (2017). Enterprise social networking: A knowledge
management perspective. Computer Supported Cooperative Work
(CSCW’08). New York: ACM.
Pallant, J. (2010). SPSS survival manual: a step by step guide to data analysis us-
ing. McGraw-hill
Palmgreen, P., & Rayburn, J. I. (1984). A Comparison of Gratification Models of
Media Satisfaction. Communication monographs, 52(4).
Papacharissi, Z.; Rubin, A. (2000). Predictors of Internet Use. Journal of Broad-
casting Electronic Media 44(2), 175-196.
46
Pornsakulvanich, V., & Dumrongsiri, N. (2013). Internal and external influences
on social networking site usage in Thailand. Computers In Human
Behavior, 29(6), 2788-2795.
Quan-Haase, A. & Young, A. (2010). Uses and Gratifications of Social Media: A
Comparison of Facebook and Instant Messaging. Bulletin Of Science, Tech-
nology & Society, 30(5), 350-361.
Rice, R. E., Leonardi, P. M., (2013) Information and communication technology
in organization, 2000-2011. In L. Putnam, & D. K. Mumby (Eds.) Sage
handbook of organizational communication (3rd ed., pp. 425-448). Thousand
Oaks, CA: Sage.
Sangwan (2005) Virtual Community Success: A Uses and Gratifications Perspec-
tiv. Proceedings of the 38th Annual Hawaii International Conference on Sys-
tem Sciences.
Severin, Werner J. & Tankard, James W (1997). Communication theories: ori-
gins, methods, and uses in the mass media (4th ed). Longman, White Plains,
N.Y
Shao, G. (2009). Understanding the appeal of user-generated media: a uses and
gratification perspective. Internet research, 19(1) pp. 7-25
Shirish, A., Boughzala, I., & Srivastava, S. (2017). Adaptive use of social net-
working applications in contemporary organizations: Examining the motiva-
tions of Gen Y cohorts.
Skeels, M., & Grudin J. (2009). When Social Networks Cross Boundaries: A Case
Study of Workplace Use of Facebook and LinkedIn. In International Confer-
ence on Supporting Group Work, 95-104.
Raeth, P., Smolnik, S., Urbach, N. (2009) Butler, B.S.: Corporate Adoption of
Web 2.0: Challenges, Success, and Impact. Proceedings of the 15th AMCIS,
San Francisco, CA.
Stei, G., Sprenger, S. and Rossmann, A. (2016). Enterprise Social Networks: Sta-
tus Quo of Current Research and Future Research Directions. Springer, Cham,
255
Sundar & Limperos (2013) journal of Broadcasting & Electronic Media 7(4),
2013, pp. 504-525
47
Thompson, K. (2015). Positivism and Interpretivism in Social Re-
search. ReviseSociology. Retrieved 11 May 2017, from
https://revisesociology.com/2015/05/18/positivism-interpretivism-sociology/
Uysal, N. (2016). Social Collaboration in Intranets. International Journal Of
Business Communication, 53(2), 181-199.
Venkatesh, V. (2000). Determinants of Perceived Ease of Use: Integrating Con-
trol, Intrinsic Motivation, and Emotion into the Technology Acceptance Mod-
el. Information Systems Research, 11(4). 342.
van Zoonen, W., van der Meer, T., & Verhoeven, J. (2014). Employees work-
related social-media use: His master's voice. Public Relations Review, 40(5),
850-852.
Madsen, T. & Verhoeven, J. (2016) Self-censorship on Internal Social Media: A
Case Study of Coworker Communication Behavior in a Danish Bank.
Walden, J. (2016). Integrating Social Media into the Workplace: A Study of Shift-
ing Technology Use Repertoires. Journal of Broadcasting & Electronic Me-
dia, 60(2), 347-363.
Wang, Y., & Kobsa, A. (2009). Performance Evaluation of a Privacy-Enhancing
Framework for Personalized Websites. In G. J. Houben, G. McCalla, F. Piane-
si, & M. Zancanaro (Eds.). UMAP, Lecture Notes in Computer Science, 5535,
78-89.
Wang, M.H, Yang, T.Y., Chen Y.S., (2016) How workers engage in social net-
working sites at work: A uses and gratification expectancy perspective. The
international journal of organisational innovation, 8(4).
Watts (2016) Exploring Experiences of Information Overload: The Influence of
Computer-Mediated Communication in the Workplace
Yan, H., Vir Singh, P., & Ghose, A. (2015). A Structural Model of Employee Be-
havioral Dynamics in Enterprise Social Media. Management Science, 61(12),
2825-2844.
Young, A. & Hinesly, M. (2014). Social Media Use to Enhance Internal Commu-
nication. Business and Professional Communication Quarterly, 77(4), 426-
439.

48
9. Appendix
Appendix 1: Survey

49

50

51

52
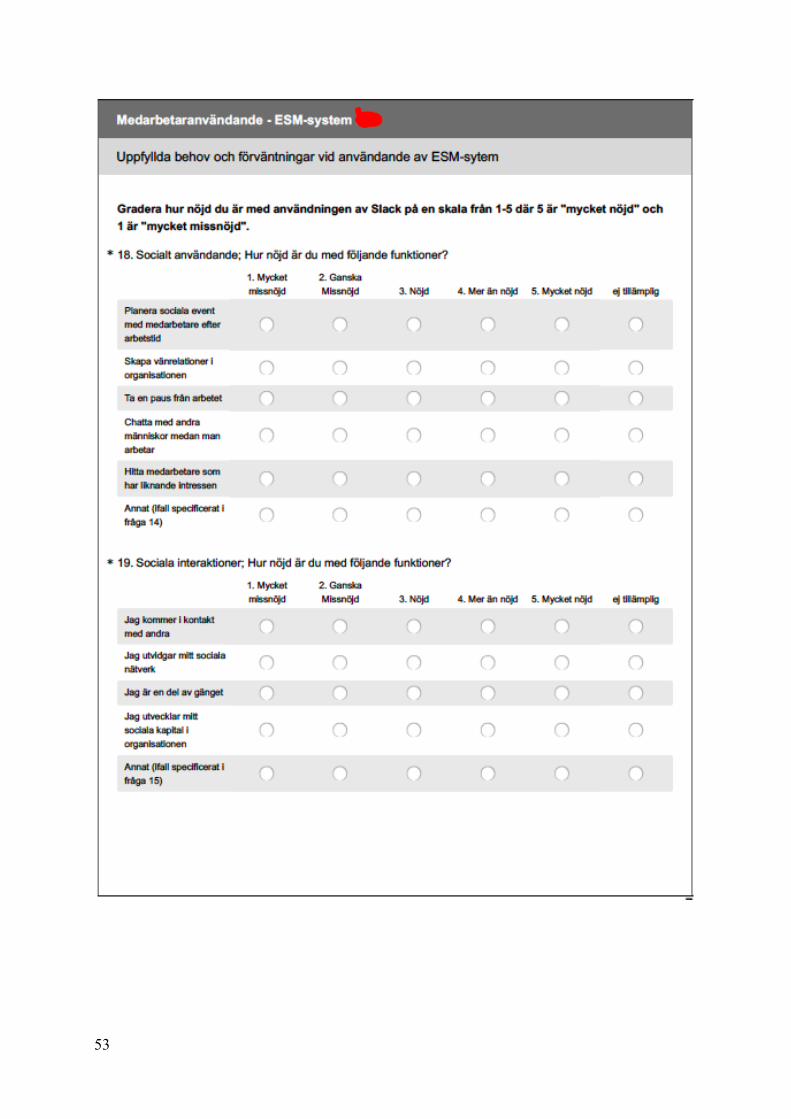
53
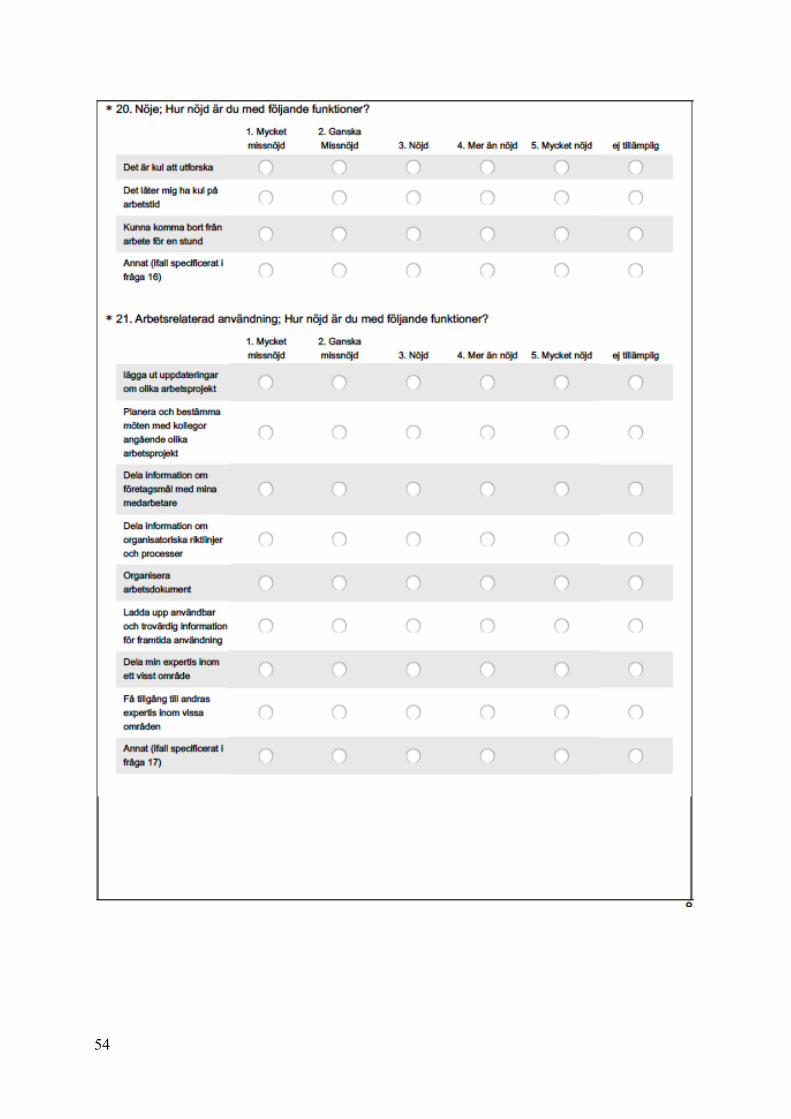
54

55
Appendix 2: Open ended questions.
Open ended question Slack är arbete och ett viktigt arbetsredskap
Få svar på snabba enkla frågor (jobbrelaterade)
Det är en god kommunikations-kanal som lättar trycket på mai-len
För att kunna hålla långsamma diskussioner där historik är A och O, det betydligt bättre for-matet för grupper att arbeta
"pinga" folk som inte svarar på ens mail, fast utan att använda facebook.
Kommunicera med kollegor, partners och kunder kring ar-betsrelaterade frågor
då du enkelt kan dela material, bjuda in nya personer som direkt ser materialet
Ställa enkla, snabba frågor som är för "små" för mail
Kontaktar kollegor för teknikfrå-gor för att få snabba svar. 2017-03-31 08:12
Använder slack i arbetssyfte och diskutera
Snabb kommunikation istället för mail/telefon
Höra om åsikter kring olika be-slut.
Informationsspridning Använder SfB enbart för arbets-relaterad kommunikation
Höra om åsikter kring olika be-slut.
Planera delar av arbetet och rapportera arbetsrelaterad in-formation
Använder det enbart i arbets-syfte istället för mail/tfn samtal 2017-03-30 15:19
Får ta del av intressanta artiklar etc som kollegor delar
Delge information till andra Få snabba svar på frågor inom företaget
Dela information informationsspridning Kunskapskälla Få en bättre bild över vad mina
kollegor arbetar med på dagarna 2017-03-29 21:22
En av de större fördelarna är att historiken jämt är öppen, så man kan fortsätta en diskussion som pågick tidigare utan
Dela med sig av sin kunskap/ta del av andras
det är effektivt informationsforum att först försöka leta upp en mil-jon email som knappt är sökbara
Vi använder det endast till att dela information i olika topics för att samla allt på samma ställe och för att vi kan
Dela information, omvärldsbe-vakning, tips
Få kontakt med medarbetare på annan ort.
organisera det till skillnad mot FB
Dela information

56
Appendix 3: Dependent variable
Descriptive Statistics
N Minimum Maximum Mean Std. Deviation
Work_obtained_index 137 ,00 5,00 3,0566 1,06055
Valid N (listwise) 137
Appendix 4: Independent variables
Descriptive Statistics N Minimum Maximum Mean Std. Deviation
Gender_recoded 170 ,00 1,00 ,6059 ,49010
Age 169 0 60 34,34 11,864
Perso-nal_experience_index
168 1,33 5,00 3,6478 ,74008
Dummy_timmar 163 1,00 2,00 1,8098 ,39366
Valid N (listwise) 161

57
Descriptive Statistics
N Minimum Maximum Mean Std. Deviation
Social_Obtained_index 139 ,00 4,92 2,4814 1,11632
Valid N (listwise) 139

58
Appendix 5: Factor analysis
KMO and Bartlett's Test Kaiser-Meyer-Olkin Measure of Sampling Adequacy. ,877
Bartlett's Test of Spheri-city
Approx. Chi-Square 2185,519
df 190
Sig. ,000

59
KMO and Bartlett's Test Kaiser-Meyer-Olkin Measure of Sampling Adequacy. ,826
Bartlett's Test of Spheri-city
Approx. Chi-Square 1453,412
df 190
Sig. ,000
Pattern Matrixa
Gratifications obtained from using ESM 1 2 Work related use Post updates on work projects ,741 Set up meetings with colleagues about work projects ,540 Share information about organizational objectives with colleagues ,862
Share information about organizational policies and procedures ,876 Organize work files ,592 Upload credible information for future use ,763 Share my expertise in a particular area ,765 Gain access to others with expertise in a particular area ,750 Social related use It is fun to explore ,626
It lets my play ,813
I enjoy escaping into a different world ,879
I can connect with others ,654
I can expand my social network ,784
It makes my realize I am part of a community ,707
It allows me to build social capital ,762
Set up social events with co-workers after working hours ,779
Make friends within the organization ,700
Take a brake from work ,923
Chat with others while at work ,577
Find people with similar interests ,765
Mean 2.48 3.05
Standard deviation 1.11 1.06
Extraction Method: Principal Component Analysis. Rotation Method: Oblimin with Kaiser Normalization.a a. Rotation converged in 5 iterations.
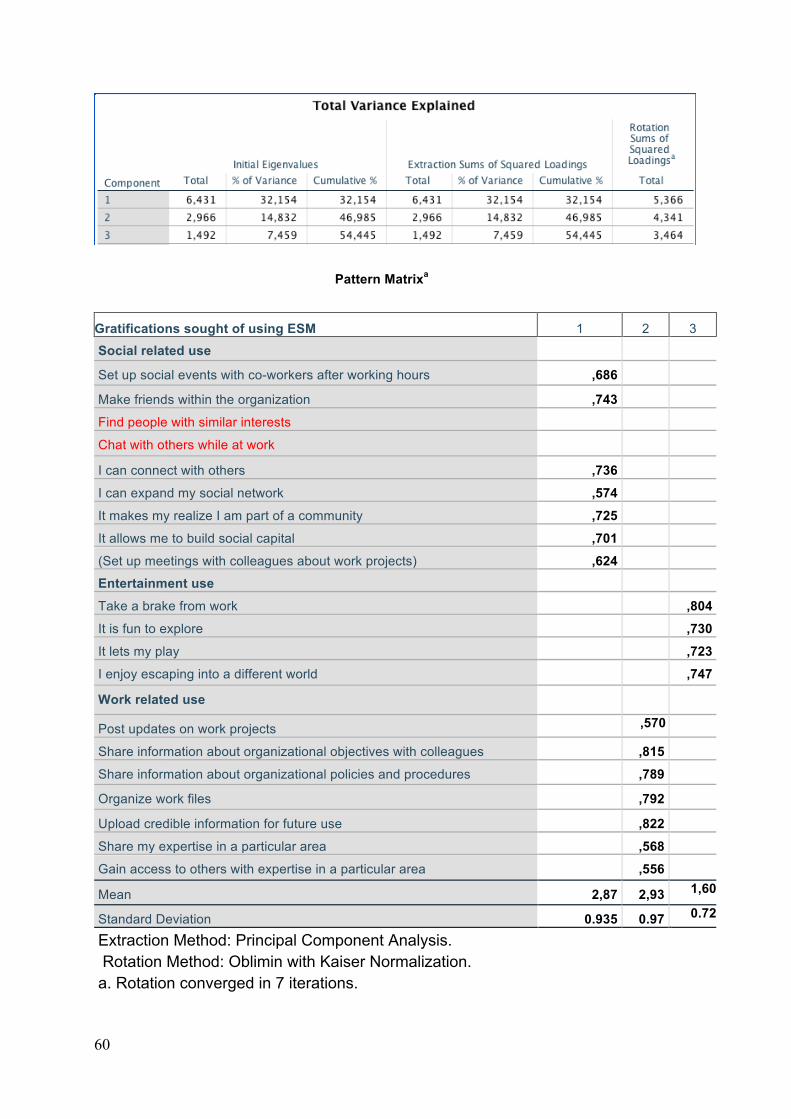
60
Pattern Matrixa
Gratifications sought of using ESM 1 2 3 Social related use
Set up social events with co-workers after working hours ,686
Make friends within the organization ,743
Find people with similar interests
Chat with others while at work
I can connect with others ,736
I can expand my social network ,574
It makes my realize I am part of a community ,725
It allows me to build social capital ,701
(Set up meetings with colleagues about work projects) ,624
Entertainment use
Take a brake from work ,804 It is fun to explore ,730 It lets my play ,723 I enjoy escaping into a different world ,747
Work related use
Post updates on work projects ,570
Share information about organizational objectives with colleagues ,815
Share information about organizational policies and procedures ,789
Organize work files ,792
Upload credible information for future use ,822
Share my expertise in a particular area ,568
Gain access to others with expertise in a particular area ,556
Mean 2,87 2,93 1,60
Standard Deviation 0.935 0.97 0.72
Extraction Method: Principal Component Analysis. Rotation Method: Oblimin with Kaiser Normalization. a. Rotation converged in 7 iterations.

61
Appendix 6: reliability tests
Case Processing Summary N %
Cases Valid 137 80,6
Excludeda 33 19,4
Total 170 100,0
a. Listwise deletion based on all variables in the procedure.
Reliability Statistics
Cronbach's Alpha N of Items
,897 8

62
Case Processing Summary N %
Cases Valid 151 88,8
Excludeda 19 11,2
Total 170 100,0
a. Listwise deletion based on all variables in the procedure.
Reliability Statistics Cronbach's
Alpha N of Items
,850 7
Item-Total Statistics
Scale Mean if Item Deleted
Scale Va-riance if Item
Deleted
Corrected Item-Total Correlation
Cronbach's Alpha if Item
Deleted
Planera sociala event med medarbetare efter arbetstid
17,6358 31,566 ,605 ,830
Skapa vänrelationer i or-ganisationen
17,6225 31,290 ,675 ,819
Jag kan komma i kontakt med andra
16,4967 32,305 ,567 ,835
Jag kan utvidga mitt soci-ala nätverk
17,9338 34,302 ,555 ,836
Jag känner mig som en del av gänget
17,1457 32,539 ,627 ,826
Det tillåter mig att ut-veckla mitt sociala kapital i organisationen
17,5033 32,292 ,688 ,818
Planera och bestämma möten med kollegor an-gående olika arbetspro-jekt
16,4967 31,625 ,568 ,836

63
Appendix 6: Summative index

64
Appendix 7: Bivariate analysis
Correlations matrix
Work_obtained_index
Soci-al_Obtained_index
Fre-quency_hours
Gen-der_recoded Age
Perso-nal_experience_index
Work_obtained_index
Pearson Corre-lation
1 ,541** ,255** -,063 -,166 ,369**
Sig. (2-tailed) ,000 ,003 ,464 ,053 ,000 N 137 137 137 137 136 136
Soci-al_Obtained_index
Pearson Corre-lation
,541** 1 ,254** ,067 -,399** ,340**
Sig. (2-tailed) ,000 ,003 ,435 ,000 ,000 N 137 139 139 139 138 138
Frequency_hours Pearson Corre-lation
,255** ,254** 1 -,012 ,071 ,172*
Sig. (2-tailed) ,003 ,003 ,884 ,367 ,028 N 137 139 163 163 162 162
Gender_recoded Pearson Corre-lation
-,063 ,067 -,012 1 ,034 -,117
Sig. (2-tailed) ,464 ,435 ,884 ,663 ,131 N 137 139 163 170 169 168
Age Pearson Corre-lation
-,166 -,399** ,071 ,034 1 -,261**
Sig. (2-tailed) ,053 ,000 ,367 ,663 ,001 N 136 138 162 169 169 167
Perso-nal_experience_index
Pearson Corre-lation
,369** ,340** ,172* -,117 -,261** 1
Sig. (2-tailed) ,000 ,000 ,028 ,131 ,001 N 136 138 162 168 167 168
**. Correlation is significant at the 0.01 level (2-tailed). *. Correlation is significant at the 0.05 level (2-tailed).
Appendix 8: Regression analysis
Model Summaryf
Model R R Square Adjusted R
Square Std. Error of the Estimate
1 ,541a ,293 ,287 ,89536
2 ,575b ,331 ,321 ,87383
3 ,585c ,342 ,327 ,87004
4 ,589d ,347 ,327 ,87016

65
5 ,593e ,351 ,326 ,87050
ANOVAa
Model Sum of Squa-
res df Mean Square F Sig.
1 Regression 44,418 1 44,418 55,407 ,000b
Residual 107,425 134 ,802
Total 151,843 135
2 Regression 50,287 2 25,143 32,928 ,000c
Residual 101,556 133 ,764
Total 151,843 135
Regression 51,922 3 17,307 22,864 ,000d
Residual 99,921 132 ,757
Total 151,843 135
4 Regression 52,653 4 13,163 17,385 ,000e
Residual 99,190 131 ,757
Total 151,843 135
5 Regression 53,333 5 10,667 14,076 ,000f
Residual 98,510 130 ,758
Total 151,843 135
0. Dependent Variable: Work_obtained_index 1. Predictors: (Constant), Social_Obtained_index 2. Predictors: (Constant), Social_Obtained_index, Personal_experience_index
3. Predictors: (Constant), Social_Obtained_index, Personal_experience_index, Dummy_timmar 4.. Predictors: (Constant), Social_Obtained_index, Personal_experience_index, Dummy_timmar, Gender_recoded 5. Predictors: (Constant), Social_Obtained_index, Personal_experience_index, Dummy_timmar, Gender_recoded, Age

66

67
Appendix 9: Relationship analysis
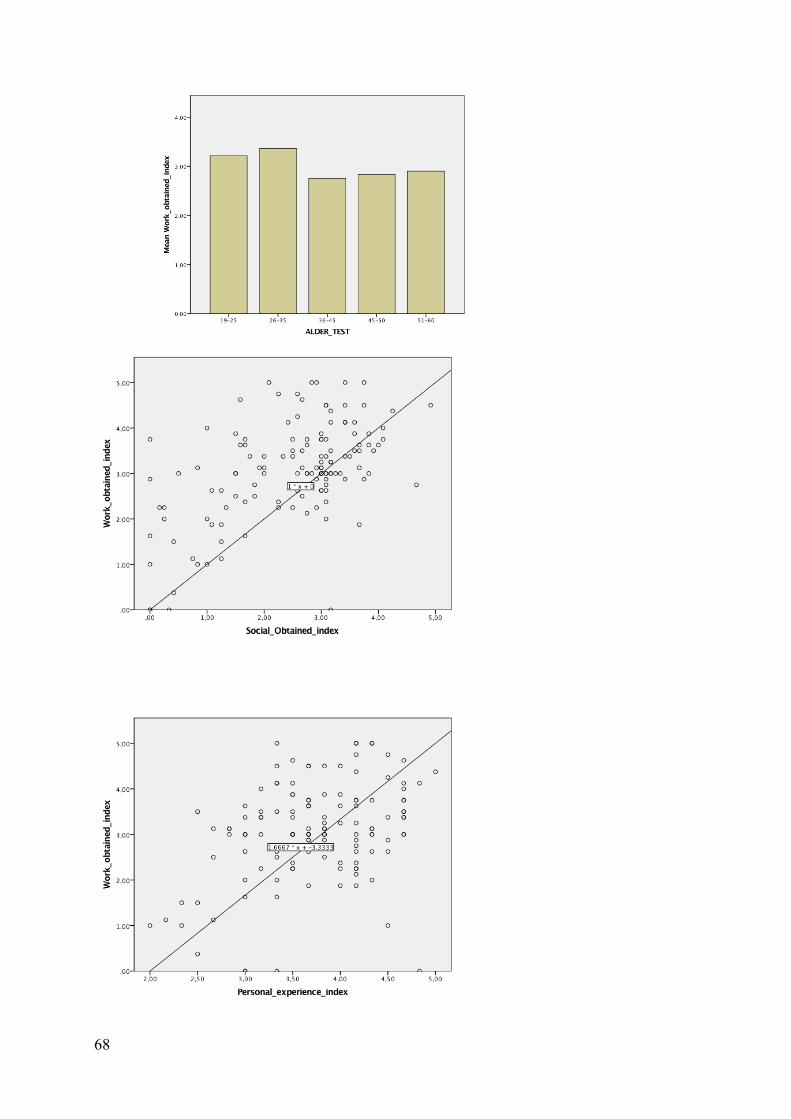
68