a study of the equilibration method of determining
TRANSCRIPT

4.GS-
a. a
Albert ^HJUfLO
JCiH I U A, MAIllflggrf
"1
STATE OF ILLINOISHEXRY HORXER, Governor
DEPARTMENT OF REGISTRATION AND EDUCATIONJOHN J. HALLIHAN, Director
DIVISION OF THE
STATE GEOLOGICAL SURVEYM. M. LEIGHTON. Chief
URBANA
REPORT OF INVESTIGATIONS— NO. 58
A STUDY OF THE EQUILIBRATION METHOD OF
DETERMINING MOISTURE IN COAL FORCLASSIFICATION BY RANK
O. W. Rees, F. H. Reed, and G. W. Land ^.^ '
r^ t •"
PRINTED BY AUTHORITY OF THE STATE OF ILLINOIS
URBANA, ILLINOIS
1939

STATE OF ILLINOISn. Henry Horner, Governor
OF REGISTRATION AND EDUCATION. John J. Hallihax, Director
BOARD OFRESOURCES AND CONSERVATIONJohx J. Hallihax, Chairman
Henry C. Cowles, Ph.D.Forestry
Arthur Cutts Willard, D.Engr.,LL.D., President of the University
oloxy of Illinois
D.Sc,
bLOGICAL SURVEY DIVISIONUrban a
M. Leightox, Ph.D., Chief.-xley, M.S., Assistant to the Chief
Jane Titcomb, M.A., Geological Assistant
GEOLOGICAL RESOURCESCoal
G. H. Cady, Ph.D., Senior GeologistL. C. McCabe, Ph.D.James M. Schopf, Ph.D.Earle F. Taylor, M.S.Charles C. Bolf.y, M.S.
Industrial Minerals
I. E. Lamar, B.S.
H. B. Willman, Ph.D.Douglas F. Stevens, M.E.Robert M. Grogan, M.S.
J. S. Templeton, A.B.
Oil and GasA. H. Bell, Ph.D.G. V. Cohee, Ph.D.Frederick Squires, B S.
Charles W. Carter, Ph.D.F. C. MacKnight, Ph.D.Frank E. Tippie, B.S.
Roy B. Ralston, B.A.
Areal and Engineering GeologyGeorge E. Ek.bi.aw, Ph. D.Harry McDermith, B.S.
Richard F. Fisher, B.A.
Subsurface GeologyL. E. Workman, M.S.
J. Norman Payne, Ph.D.Elwood Atherton, Ph.D.Merlyn B. Buhle, M.S.Gordon Prescott, B.S.
Stratigraphy and Paleontology
J. Marvin Weller, Ph.D.Chalmer L Cooper, M.S.
PetrographyRalph E. Grim, Ph.D.Richards A. Rowland, Ph.D.
PhysicsR. J. Piersol, Ph.D.Donald O. Holland, M.S.Paul F. Elarde, B.S.
Jack Tuttle
GEOCHEMISTRYFrank H. Reed, Ph.D., Chief ChemistW. F. Bradley, Ph.D.G. C. Finger, Ph.D.Helen F. Austin, B.S.
Fuels
G. R. Yohe, Ph.D.Carl Harm an, B.S.
Non-Fuels
J. S. Machin, Ph.D.James F. Yanecek, M.S.
Analytical
O. W. Rees, Ph.D.George \Y. Land, B.Ed.P. \V. Heni.ine, B.S.
Mathew Kalinowski, B.S.Arnold J. Veraguth, M.S.
MINERAL ECONOMICS
\Y. H Yoskuil, Ph.D., Mineral EconomistGrace N Oliver, A.B.
EDUCATIONAL EXTENSION
Don L. Carroll, B.S.
PUBLICATIONS AND RECORDS
George E. Ekblaw, Ph.D.Chalmer L. Cooper, M.S.Dorothy Rose, B.S.
Kathryn K. Dedman, M.A.Alma R. Sweeney, A.B.Frances Harper Lehde, M.S.Meredith M. Calkins
Consultants: Ceramics, Cullen Warner Parmelee, M.S., D.Sc, Universitv of Illinois;
Pleistocene Invertebrate Paleontology, Frank Collins Baker, B.S., Universitv of Illinois.
Topographic Mapping in Cooperation with the United States Geological Survey.
This Report is a Contribution of the Section of Geochemistry, Analytical Division.
September 1, 1939ILLINOIS STATE GEOLOGICAL SURVEY
(A7270—1M—10-39)
3 3051 00005 6881

CONTENTS
PAGE
Introduction 5
Acknowledgments ' 6
F.xperi mental work t 7
Apparatus"
Procedure . . ,. i 8
Results 9
Discussion of results 9
Conclusions 23
Bibliography 28
Appendix A— Determination of the vapor pressures of the saturated salt solutions used in
equilibration tests 29
Apparatus 29
Procedure 31
Calculations ^^
Discussion of results 34
Bibliography 34
TABLES
PAGE
1. Equilibration data tor first six samples studied 10
2. Analyses and moisture values obtained by different procedures for first six samples
studied 12
3. Analyses of fifteen samples used for further equilibration studies 13
4. Data on samples equilibrated in evacuated desiccators in constant temperature 30 C.
water bath 14
5. Data on samples equilibrated in atmosphere of nitrogen at atmospheric pressure in con-
stant temperature (30cC.) air bath 15
6. Moisture values obtained by different methods for fifteen samples 17
7. Residual moisture values after second equilibration ^determined* and per cent increase
in weight of samples during second equilibration. Water bath—desiccators evacuated. 18
8. Residual moisture values after second equilibration 'determined) and per cent increase
in weight ot samples during second equilibration. Air bath— nitrogen atmosphere
—
no evacuation 19
9. Moist mineral-matter-free calorific values as calculated using moisture values obtained
by different methods 25
I. Appendix A—Experimental vapor pressure values 32
[3

ILLUSTRATIONS
FIGURE PAGE
1. Air-hath thermostat 7
2. Water-bath thermostat 8
3. Moisture-humidity curves tor first six coals studied 11
4. Moisture-humidity curves—low-moisture samples, desiccators evacuated, water-hath
thermostat 13
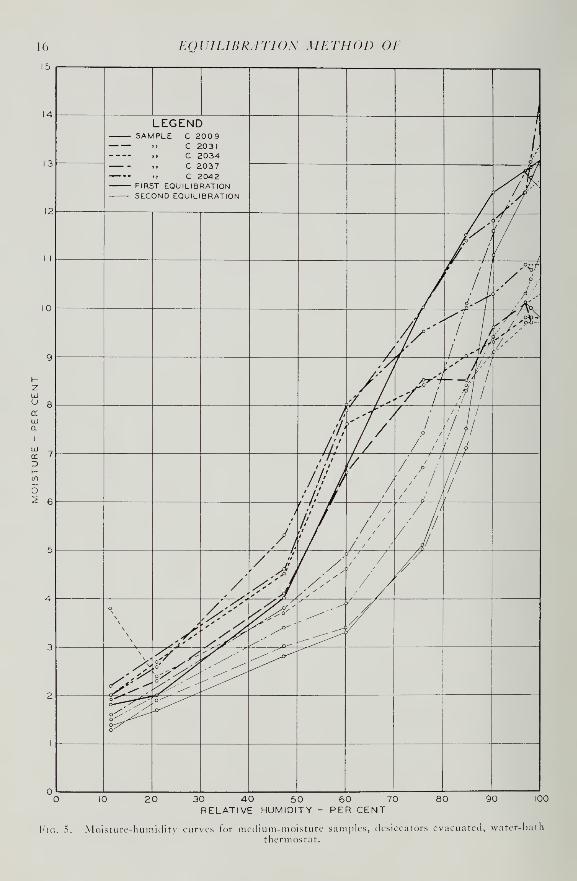
5. Moisture-humidity curves medium-moisture samples, desiccators evacuated, water-
hath thermostat 16
6. Moisture-humidity curves high-moisture samples, desiccators evacuated, water-bath
thermostat 20
7. Moisture-humidity curves—low-moisture samples, nitrogen atmosphere 21
8. Moisture-humidity curves—medium-moisture samples, nitrogen atmosphere 22
9. Moisture-humidity curves- high-moisture samples, nitrogen atmosphere 24
A. Diagrammatic sketch of manometer assembly, side view 30
H. Diagrammatic sketch of manometer assembly, front view 30
C. Diagrammatic sketch of manometer, scale, and alidade, side view 31
I). Manometer assembly 32
E. Diagrammatic sketch showing the geometrical relationship involved in the calculations. ^>^
[4]

A STUDY OF THE EQUILIBRATION METHOD OF
DETERMINING MOISTURE IN COAL FOR
CLASSIFICATION BY RANK
(). W. Rees 1, F. II. Reed2
, and G. \V. Land3
INTRODUCTION
The establishment, in 1936, of the ten-
tative specifications for" Classification
of Coal by Rank" (l) 4 and the advance of
these specifications to standard in 1938
(2), with the provision that the lower rankbituminous coals be classified according
to their moist mineral-matter-free B.t.u.
values, made imperative a reliable methodfor determining true bed moisture. Mostof the methods employed heretofore havedealt with the empirical determination of
the amount of moisture in the coal sampleas presented at the laboratory withoutconsideration of possible excess surface
moisture or of moisture lost during
sampling. Thus values have resulted
which may or may not represent the bedmoisture, which we consider to be the
moisture content of the coal bed as it
occurs naturally under the conditions of
temperature and humidity in the mine.
The equilibration procedure attempts to
determine the moisture in the coal at
100 per cent humidity, which is assumedto be the true bed moisture. Such a pro-
cedure has been used in various connec-
tions but of chief interest here was its
use by Lavine and others (3, 4) in studies
on peat and lignite and by Stansfield and
Gilbart (5) in studies on coal.
At the meeting of the Coal Classifica-
tion Committee of the American Institute
of Mining and Metallurgical Engineers in
Chemist and Head, Analytical Division.2Chief Chemist, Geochemical Section.
'Research Assistant, Analytical Division.
'Numbers in parentheses refer to bibliography at endof report.
New York in 1936 it was proposed that
the equilibration procedure, as outlined
by Stansfield and his coworkers, be madethe standard procedure for determiningmoisture in coals having visible surface
moisture for the classification of NorthAmerican coals by rank. It was the
opinion, however, that the reliability andconvenience of the method should be
further verified before it be accepted as
standard. Because adoption of such a pro-
cedure as standard might invalidate mois-
ture values obtained in the past by other
methods if the values were greatly differ-
ent, it therefore seemed desirable to secure
information concerning the reliability of
values obtained by the equilibration pro-
cedure when applied to high-moisture
coals, such as are common in Illinois, andthe relationship of equilibration values
to values obtained by the present stand-
ard procedure. This work was undertakento provide such information.
In this paper are presented the results
obtained by applying the equilibration
procedure to 21 Illinois coals ranging in
moisture content from 4 to 18 per cent,
as well as values obtained by other pro-
cedures, with which comparisons are
made.A brief review of the development of
the equilibration procedure first proposed
by Stansfield and Gilbart in 1932 (5)
follows.
Dissatisfied with the usual A.S.T.M.method for air-drying coal they attemptedto devise a test which would serve the
dual purpose of preparing the sample for
laboratory handling and for evaluating
the moisture-holding capacity of the coal.
[5]

EQUILIBRATION METHOD OE
Their first procedure, developed in 1907
(6), required the exposure of crushed coal
in shallow trays in a box which also held
trays containing a solution of calcium
chloride of 1.30 sp. gr. At ordinary tem-
peratures this solution has a vapor pres-
sure about 60 per cent that of water at
the same temperature. The coal wasweighed from time to time until a mini-
mum weight was recorded. As this was a
prolonged procedure, requiring six weeksin extreme cases, the method was aban-
doned in 1910. The second method, de-
veloped in 1923 (7), used an air-drying
apparatus which Stansfield and Gilbart
constructed in their laboratory. Crushedcoal was dried in a rapid stream of air
of 60 per cent humidity. The humiditywas controlled by causing the circulating
air to pass up a tube in which calcium
chloride solution ran down a number of
lamp wicks. By this method 48 hours
were sufficient for the attainment of
practical equilibrium. This apparatus
was improved from time to time until
1930, but meanwhile it was found that
temperature control was essential if the
accuracy required for classification pur-
poses was to be attained. Therefore,
early in 1931 a new apparatus was con-
structed (8), in which a uniform tem-
perature of 30° C. could be maintained
and natural gas of 60 per cent humiditycould be circulated. Equilibrium wasreached in this new equipment within 48
hours.
The moisture value obtained after
air-drying at 60 per cent humidity bythe method developed in 1923 wasadopted for coal classification by the
Canadian Department of Customs andExcise (9). In 1931 Stansfield and Gil-
bart developed a vacuum-desiccator pro-
cedure for drying at constant temper-
ature at various definite humidities (5).
Their procedure consisted in equilibrating
different portions of coal at different re-
lative humidities in desiccators at a tem-
perature of 30° C. Various saturated salt
solutions were used for the corresponding
relative humidities as shown in appendix
A, table 1.
Residual moisture in the equilibrated
samples was determined by heating at
105° C. for 3 hours in a vacuum oven
in which an inert atmosphere of natural
gas was maintained at an absolute pres-
sure of about 3 inches of mercury. Thesemoisture values so obtained were plotted
against relative humidity values and the
curves were extrapolated to cut the 100
per cent humidity axis. The moisturevalues corresponding to 100 per cent
humidity were taken as the "true" or
"capacity" moisture values of the coal.
Some work was done in which these
authors attempted to obtain a satisfac-
tory moisture value by equilibrating at
only one relative humidity. In the earlier
work 60 per cent humidity was used buterratic results were obtained so that in
later work a relative humidity of 97 per
cent was used. Moisture values obtained
at a single humidity level were used only
after one or more entire moisture humid-ity curves for the various coal areas in
the province had been obtained. A studyof 54 entire humidity curves of coals with
moisture content ranging from 1 to 32
per cent showed that the moisture re-
tained at 97 per cent humidity averaged
98.6 per cent of the extrapolated "true"
moisture value and seldom varied far
from this value. They therefore calcu-
lated "true" moisture by dividing the
moisture retained at 97 per cent humidityby 0.986 in all cases where they did not
prepare the entire curve. These values
were termed moisture "by calculation."
In some cases the moisture humidity
curves could be extrapolated easily where-
as in other cases irregular curves were
obtained, the extrapolation of which was
impossible. A distinct difference between
dehydration and rehydration curves wasfound.
Acknowledgments
The writers wish to acknowledge the
cooperation and assistance of the manage-ment of the mines in collecting samples.
To Dr. G. H. Cady they express their
appreciation for many helpful suggestions
during the preparation of this report.
The help of Dr. L. C. McCabe and C. C.
Boley in securing samples, and of J. W.Robinson, P. E. Grotts and M. L.
Kalinowski in securing analytical data is
gratefully acknowledged. To Dr. M. M.Leighton, Chief of the Survey, is due the
credit for making this investigation
possible.

DETERMINING MOISTURE IX COAL
Fig. 1.—Air-bath th ermostat.
EXPERIMENTAL WORKThe experimental work of this report
was an application of the equilibration
method of Stansfield and Gilbart for the
determination of bed moisture of Illinois
coal. The procedure adopted and the
equipment used for the first six coals
studied were as nearly as possible those
outlined by Stansfield and Gilbart. Mois-ture determinations for these six samplesof coal were made, using a large air ovento provide constant temperature during
equilibration. Desiccators were evacuatedevery twelve hours. The discrepancies in
the results obtained indicated inadequatetemperature control. Therefore, a con-
stant-temperature water-bath was sub-
stituted for this air oven and equilibra-
tions on 15 other coal samples were made.Again, desiccators were evacuated every
twelve hours. In addition, equilibrations
were made at three or four humidities onthese 15 samples using a nitrogen atmos-phere without evacuation. Below is a
description of the apparatus and an out-
line of the procedure followed in the work.
Apparatus
A double-walled box approximately72 by 26 by 24 inches, outside dimen-sions, was built to serve as a constanttemperature oven for the equilibrations.
The walls of this box were insulated withabout three inches of rock wool, heat wasprovided by light bulbs so placed that
air trom a fan was heated at one end of
the box, passed between the upper walls
to the other end and was admitted to the
chamber proper through a plate in whichmany holes were drilled to give good dis-
tribution. A cooling coil, through whichcool water was passed continuously, wasprovided so that the heating bulbs
worked against this cooling arrangement.A mercury thermo-regulator was used to
control the temperature of the box at
30° C. ± 0.5° C. The box (fig. 1) wasequipped with a side door over its entire
length for convenience in putting in andtaking out desiccators. Later equilibra-
tions were made in a large wafer-baththermostat (fig. 2) at 30° C. + 0.1° C.
Pyrex vacuum desiccators as shown in
the oven (fig. 1) were used for the equili-

EQUILIBRATION METHOD Of
\
'4«^fe> V
JiK iJisapj!^!
*^:
I y^
/
Fig. 2.— Water-bath thermostat.
brations. For determining moisture after
equilibration a Cenco vacuum oven wasused.
Small petri dishes were used to hold the
samples during equilibration. Lids wereprovided for these dishes to protect the
samples during weighing and transfer
from one container to another. Bottles
containing saturated solutions of the
same salts as those used in the desiccators
were used to provide properly humidified
air to desiccators in bringing the pressure
to atmospheric pressure at the end of the
equilibration periods.
Procedure
In studying the application of the
Stansfield and Gilbart method to the de-
termination of moisture in Illinois coals,
it was decided to use fresh face-samples
of low, medium, and high moisture con-
tent. Accordingly, six samples of coal
were collected at intervals of about oneweek and each treated as follows:
1) A sample was cut down from the
face, crushed and ground to J4 inch size,
riffled to one quart in the mine andbrought to the laboratory where it wasfurther crushed to minus 14-mesh, andportions were weighed and equilibrated
for 48 hours at each of the nine different
humidities recommended by Stansfield
and Gilbart.
After equilibration, the samples werereweighed and then dried at 105° C. in
the vacuum oven for three hours. Thepressure in the oven was maintained at
about three inches of mercury by ad-
mitting a slow stream of nitrogen. At the
end of the three-hour period the sampleswere removed from the oven, cooled,
weighed, and the moisture values calcu-
lated. The samples of coal were then re-
equilibrated for 48 hours at the samehumidities after which moisture values
were determined again. Both first andsecond equilibration moisture-values were
plotted against humidity, the curves
were extrapolated to cut the 100 per cent
humidity axis, and the moisture value
obtained was taken as the "true" mois-
ture value of the sample.

DETERMINING MOISTURE IX COA I.
2) Another sample was collected ex-
actly the same as that for 1) for a proxi-
mate analysis. On this sample air dry
loss and the regular A.S.T.M. (10) mois-
ture were determined to give total mois-
ture.
3) A 50 to 75 lb. gross sample wastaken from the freshly exposed face andbrought to the laboratory in a sealed
container, where it was crushed to }/i
inch size and riffled down to a quart
sample. Moisture was then determined
by the usual A.S.T.M. procedure includ-
ing air dry loss, etc.
4) Two 20-mesh samples (approxi-
mately 5 grams each) were prepared in
the mine and placed in weighing bottles
which had been previously weighed in the
laboratory. These samples were brought
to the laboratory where they were weighedand total moisture values were determined
by the A.S.T.M. procedure (10).
5) Two 20-mesh samples were pre-
pared in the mine exactly as in 4) andthese samples were used for total moisture
determinations in the vacuum oven fol-
lowing the same procedure used for de-
termining moisture in the equilibrated
samples.
In all cases except 3) duplicate por-
tions were taken as a precaution andduplicate determinations were made in all
cases. Later, fifteen additional coal
samples were obtained and treated by the
same procedure as outlined above, with
the exception that a water-bath thermo-
stat was used for the equilibrations in
place of the air-bath thermostat. In ad-
dition, portions of these samples wereequilibrated at three or four humidities in
a nitrogen atmosphere without evacua-
tion in the air-bath thermostat.
Results
Equilibration results for the first six
coals studied are given in table 1 andshown graphically in fig. 3. Table 2 pre-
sents proximate analyses of these coals
together with a comparison of moisture
results obtained by different procedures.
Tables 3, 4, 6, and 7 and figures 4, 5, and 6
present data for the 15 samples equili-
brated in the water thermostat. Tables
3, 5, 6, and 8 and figures 7, 8, and 9 pre-
sent data for the 15 samples equilibrated
in nitrogen atmosphere, with no evacu-ation, in the air thermostat.
DISCUSSION OF RESULTS
Six coals were first equilibrated at nine
different humidities, and the moisturecontent of each sample was determined in
the vacuum oven. These values are listed
in table 1 as "Residual moisture in per
cent after first equilibration." The drysamples were then re-equilibrated andmoisture values were determined again.
These are listed in table 1 as "Residualmoisture in per cent after second equili-
bration." A comparison of equilibration
values shows that they are in close agree-
ment in the low humidities, diverge con-
siderably at the intermediate humidities,
and converge again at the high humidi-ties. The values obtained for the secondequilibration are, in general, lower thanthose of the first equilibration, the varia-
tion being greatest for the intermediate
humidities.
Extrapolation of the moisture-humid-ity curves to give 100 per cent humidityvalues gave results of questionable valid-
ity. In the case of sample C-1901A (fig.
3), the slope of the curve at the high
humidities was so steep that extrapolation
gave a result which appeared question-
able. In the case of sample C-1864A (fig.
3), strict adherence to all values gavea curve proceeding downward at the
point of crossing the 100 per cent humid-ity axis. While the moisture value for the
sample equilibrated at 97.7 per cent
humidity was lower than that for the
96.8 per cent humidity by an amountwithin experimental error, it leaves onein doubt as to which way to extend the
curve to cut the 100 per cent humidityaxis. Data obtained on the secondequilibration series on samples C-1901Aand C-1904A (fig. 3) gave such steep
curves at the higher humidities that
values obtained by their extrapolation
seem questionable.
Attempts to draw smooth curves
through the points as plotted were un-
successful, as wavy curves resulted whichwere not easily extrapolated. Therefore,
all points were connected by straight
lines. The slope of the curve as extra-
polated to 100 per cent humidity wasinfluenced little if any by the low or
intermediate humidity values, but wasdetermined by the last two high humiditymoisture values in most cases.

10 EOUILIBRATIOS METHOD Ol
rvj
o <UVOrHlOOOOOfO^ONOOVOlO
w w J3 -f)OO^NN ooooooooH eJ esi
3 3 >
3NTtNH0MDHr-lr-lO 1/5O'
u ^ioOh\OnnnoO»oo>
C/}
w ^ ^ oiNOOOHioa(NO«)ir,aor— oaacocM^ooaooaaaau. -1 o
c < i^- oOn
2 w
<; £ ^ OOOCCONNH(NOX-tHOO00 © io O O © f> *—
i*—I'tinoONOio oococaoMCM^^aax
O o os On rH ,—
'
,_H ^H ,—l
f^^TtONO'-'O^aotioo 't'tocot^ooao^oooc
,_,,_,_, ,-h rtrlHHHrl
^ fOOfOONM-HNOONMr— ^t^OONOOr^-OOOoot^ON ^H ^H ,_, _ ,-H ^ _ _ ,_ _
00 roMTtONNO'tMOOOno ^rooOOOOiOONONOOt^o> HHrtH *—i i—t ^h»-<
HZ o nO On *—lOfO-ifONONfOOW
ON rOHO^OOO^OOONi*)
U6,
00 *-H T—1 *—1 *—1<—
I»—
l i—
1
ID OOOOOrO'Hi^aO'+OO'tt^
CA 00rONOM»\OiOiOOaOvOO
w
-J *H oOOO^OOOLOfO-HONOO^Oto1^
^Tj.ooi^'tTtvOOO't'tO
5 t^- •t rn rt Qv O (N io aa N ro O0
5 ON Of^OOf^'OfOl^f^OfONfO5 u-)
PCoo TfvO'H'tOOOO^t^OOfnnO -f(NOfOrOM'OfC ,tM-tr/;-t
o © © I fOCN-+'vl't, -'-tOMM(NMTHr-iM(N(NM(NfN
'tfNO' lOfO'NI^lON'tt^'f1—1
'5
•Jl<DS<DQ<CC<ffi<CC<eQ<CQ
W
CU7 6 (V) NO to nO O nO
^»<-
c t.
3 <L>
ou
_3 Ph co 3C oo X
<<;<<<< a.ro^O^^-t a/) ox.
5 o nOnOOOOO rtrt
3* 00 00 On On On QN i-, »-.
»-H l—t »—1 *—1 >"H tH <U0J1 1 1 > >L L u u U U •*" <
c co o
oi a!U uJ3.D
3 3cr cr<D <U
. o
O nJ C C
rt£ T3TJ
•^ 03 aj
rr: o*3 <D 05 </J
OVl'", rt
«" c l-H lH
o o
6 6-2*
X oocado
2 « oi
^yo Jooc'33 '35 V- IS1 !A Caj d -m u u C
<; pa m (i, fo co

DETERMINING MOISTURE IN COAL I I
30 40 50 60 70
RELATIVE HUMIDITY - PER CENTFig. 3.- - Moisture-humiditv curves for first six coals studied.

12 EQUILIBRATION METHOD OF
wz
Q
h< coh
O «
C/5
t«J
<C/3
< X>C/3
W0* l_
h*
oiV
*3 OUh
Qfe
<
a -+ o o o o. OC
w ta ^onoi-hoo2: </j
CO *
1—1 1—I T—1 1—1 *—
I
PO "* t- rH Tt VO
w ^tOOOOOOO
w
-J z
y—lt—i t—1 *—I i—
1
pT-H •»—1 *—1 T—1 fV]
Tt CN T—11^- Tf "^t
u <*ONMOO1—
1 •^H THHfS(Naob-oio
£5 pq r^ On vO t— O OnC3 .
O «<—I *—< *—( »—
i
O iO tN Tf lO t^
% < -t O t~» oo o or*5 On © LO O ©fONrt-t<\00
'2§
vOoqooo^MD S ^ ^ Tf ^ ^ ^f
O ~t O <^5 o ^_- •^ fo o a ^ o ")
(_ O <T> Ol t-h -t ,-n
pqQ MMfOMMfN
^00^010j On ^-h ~h O O PO
«s NCtO>00O "-i C-l On *-i Ont-H t—( y—t i—
1
>. "Ttt^t^(Nrta: Q -t-tM-t-t-rf
3 —
^
On On LO 00 t^- <"0
C/)
< gIn
r*5 f> (N C5 ro f5
zc t^ 00 ro r^ sO On03
rj< t^. Tf nO rt1 norf Tf lO ^ Tf rf<
Q -a -hNNOOMX < u OOMOXONto
J- ro -rfi i/~i r<i rn rr-j
lOMt^OCOw— Q f^OO-Hf^O2 -t ~+ rr> -+ -+ -+
c 3 CN O <"0 LO ^h t-i
> < £ N\O'*'*00(Nu f) f) f5 f5 fO f)
^_ 00 O O On -f NO
a *-h <^1 On »H CN CN
I
< ^ %
,
H00-t00OO< £ ooooa^o
V- _ _| ^H ^H
OU
CN o lc NO NO NO
c3oU
<D
xJ2 >.
C- (y ~p <U ^ <U
^O^u^X^nX6 <<<<<<£ m> Tf O *-i <T5 **
nO no O O O O00 00 On On On On
«S V T1 T1 T1 T1 VhJ u u u u u u
2 -'2"o^ .
S .-£
m5 °
.52 o & .
bQ rt <«rt u 4>
.2^ S ^^^SCO H^rr:-
^3
o b ^ > > b£
^^ 03 iy • 3 - J
h^U5 M oO <L>
• . 2 w '
"" tJ T3 r/-,
fiofl Eg si
" id+->
a) a) C3
.5 3T3t3 ^ ^ O
~Au,aj .b .bu-
c aj .—. ri; A- ,c ^3 to 0.0,^^ a;O <u g g S3 S3 Sj
&-1 s I s sg
" g g 0) D > <^

DETERMINING MOISTURE IS COAL 13
20 30 40 50 60 70
RELATIVE HUMIDITY - PER CENTDC
Fig. 4.— Moisture-humidity curves for low-moisture samples, desiccators evacuated, water-bath
thermostat.
Table 3.
—
Analyses of Fifteen- Samples Used for FurtherEquilibration- Studies
T -illCoal
Ash VolatileFixedCarbon
Sulfur B.T.U.
\'nCounty bed
No.As
rec'dDry
Asrec'd
DryAs
rec'dDry
Asrec'd
DryAs
rec'dDry
Unitcoal
C-2009 Vermilion .... 7 10.1 11.7 35.9 41.4 40.6 46.9 3.10 3.58 10.981 12.675 14.634
C-2010 La Salle 2 9.0 10.5 37.0 43.2 39.8 46.3 3.04 3.54 11.085 12.920 14.691
C-2022 Loaan 5 11.4 13.3 34.0 39.7 40.2 47.0 2.843.32 10.571 12.344 14.530
C-2023 Saline 5 9.3 10.1 32.8 35.5 50.2 54.4 2. 98|3.22 12. 106 13.113 14.833
C-2030 Gallatin 5 11.1 11.5 36.7 38.2 48.4 50.3 3.39 3.52 12, 640|13. 13645. 133
C-2031 St. Clair 6 11.6 13.0 37.0 41.5 40.5 45.5 3.69 4 14 11.005 12.355 14.517
C-2034 Franklin 6 8.4 9.3 33.1 36.6 49.0 54.1 1.16 1.28 11.804 13.038 14.535
C-2037 Christian 6 11.2 12.9 35.9 41.3 39.9 45.8 4.48 5.15 10.624 12.205 14.353
C-2039 Marion 6 9.8 11.3 34.9 39.9 42.8 48.8 3.31 3.79 11.000 12.572 14.444
C-2042 Randolph .... 6 10.7 12.0 35.1 39.4 43.3 48.6 2.80 3.14 11.101 12.462 14.424
C-^046 1 Knox 6 9.1 11 .1 32.2 39.2 40.7 49.7 2.953.60 10.248 12.492 14.311
C-2059 1 La Salle (*) 6.5 7.7 35.1 41.5 43.1 50.8 2.15 2.54 11.355 13.411 14.714
C-2064 Gallatin 5 9.0 9.4 36.7 38.4 49.8 52.2 3.193.34 12.736 13.330 14.956
C-2069 Saline 5 11.5 12.1 35.0 36.7 48.8 51.2 3.30 3.46 12.248 12.846 14.904
C-2080 Saline 5 12.3 12.9 36.2 38.0 46.7 49.1 3.49 3.67 12.101 12.706 14.899
'Strip mine.2Loeal below coal No. 6.

14 EQUILIBRATION METHOD OE
Q-^roNOiOPOOoONOON ^H ,-H rf CN 'HiOfO'tsOfO'HOOOOtNOOlO'tiO'tM ^_
W w 3 fOfOi*i, iO^\OOMfnoOOOfOfOi, '*'H'-i«)oOioi"tT)'Tt"tT)"*H s* cs
3 »
S O
>CO
Nir,MO00O(Nr0OOtOM^-tT|"rtio00>Off)fNl00i, T)<ioOCN)O
u '*i<io^ ,OOfOfOOOOOfOfOCN^r-ioooooioi, rt^i<^i<^rt
>
n© icaO ,ONOOO f0^ fO^OOO>XN'HrtiooOfOO iOOOO rt, 0'-, ONp r- O^J O OnOnOOnOnOnOOOnOnOnOnOOOnOnOOOnOnOnOnOnOnOnOnOOOOOOnOnOn
r^ Oo >
H S3
On '"H r~' »—1 1—1^H ^ _ _ ,_
^ ^ oaNfoooooa'HfooON^oiNOooiNtN^ofoooooNONr- ON^ioOOOfONiooOOioOMONioOONfOOOfOOnioioo OOOOOOOOO^OOOOOOCOOOOOOOOOOOOOOO
O v© o§ ON *" ,—
' i—1*—
1T—
11—
1 «— 1 *—1*-H *—
1
6o^rHO'-| tNa iOfO'HfO^OMNf^i"H(Na'H,Of^O>'*l^(NfONO'-lrOfO'* i<iO't^OOf^rOOOOO>'tfONiOO'-| !»a'*i, 't'*'*'*^'*,—
1 ,— 1 ,-H ,—1 ,— 1 ,— 1 ^H -^ ,-|*~Iv-Hi-I«-ItHi-H1—l*HvH
r^ aNOO^N^lOfOOOONOXNONMOOOOOOOlN^fNfOtNO^
O(N(NTf f^'t'tOOtNfC ^00<C*fOMfO^OOMOOTj<Tt<TtTt^'f^t<y5
I-. O00i"MiOf0O'H 'H '-| 00N-)'0000'^C>f0l^'*^l ^(NfNifO^O00vO rfrO'*rt\OOfOfOOOOO(NfNlrHfOOONNi' ^ rf< rf ^t< Tf t*i ro
z
ON _ ^H _llH HH ^^___<^H,—|__,-H
^H ^rtrHCNNa^t^OOOO'HfOriOOOl^NfO't'tN'tNOMWOOOOOl';u
a!
W
Oo-
(NTHf^Mf^(NOlO(N(NaOvO^^'-|rt '-| '-'00\NNrOOt^fO'tfCfOfO
<* iOi^'tOOHNOO!NiOir,ir/ rHO't't^(N(NCfCOOONMi.|5,oO(N-V rHNrnoofno'o^tNfNoot^^oO'HO'-iOOoooofnNfOfrifnfo^fo
<
00 ___,_, t_| tH tHtH.^H tH,_I ,H
-* 0'-i-tioOOOfOiON'0 0'1'NO"t |OOMOO fOO> (*! H 00»NO"ttN•O O "O O iO ^H^ ir; -t M M 00 "O 00 O O '^ O^N O^ O iO vO >i iO f^ N fO f*5 f3 M
oo 00 r*~, • 0'/)OHMooo-to iooa |OHOoNfO'-| -tO fO'H -t, HfNi,"*
On O ro • 00 -h -t ro r>i ,-H sO <T5 t ft' M^- iO 00 fO OO •+ 1^ fO fO M fO M fO ^l
X iO
o. O M O N O -f -t N 00 IC -* C 'O N O CO •+ f^ -f OO N ir, O IO • IO h -t On
-5*1
rj" fN) f«5 N IO f*5 f) M »-i rt •+ t*5 "f f) -f f5 iO • io fO iO fO "t f5 fN rM fN CN *—
I
o Ot^'—| ONiO^<iOOOfN'—iroONt- t< tNCNivOO*ONtSOiO'f*OiOiOf5
o (^rtfSlrHtNfNrO^^^M^rNKN • MfN|(NM(NNMrH^rH^rtrHrt
r^ 00^, OTt^NlON^oaOOfOOOO^^nOO^^C lOON^ tH 0000'—'On
"B * s <oq<OQ<CQ<CQ<DQ<OQ<M<CQ<OQ<PQ<PQ<OQ<Pa<PQ<CQ<CQa*M'S
"5
oU
r^-evjiOiOiONOsOsOsOsOsO £"* iO iO iO
a c _c3OU
O <u
^ ^ cc c/3 rt- 0.
<v a c> J h-
c
R
•r- R
1 -5 | "S c
&H U S Ph ^
_0J C
2 a JS
(L
c
; ; I'.
'. '. '. '. «'• us ' « > • • iONO<» rOO'-H '+ t^ONfNNOON'*ONO OJ 1
K- 1
5 6 0»-ir^r^fO<r)'vo ro rO'*'* L0'ONOoo ^ r;ooooooooooooooo *-.«-^^C^eNC^c^tNCNeNCNlCNC^CStNeN woU u u u u u u u u u u u u u u < <
few J
<D 4)
3 3
6 6-2*
tn tn i-. t/3
>> rt

DETERMINING MOISTURE IX COAL 15
Table 5.— Data on Samples Equilibrated in Atmosphere of Nitrogen* at AtmosphericPressure in Constant Temperature (30° C.) Air Bath
Lab.No.
C 2009
C-2010
C-202 2
C-2023
C-2030
C-2031
O2034
C-2037
C-2039
C-2042
C-2046^
C-20594
C-2064
C-2069
C-2080
AverageAverage
\'ermilion
La Salle .
Logan
Saline. . . .
Gallatin .
St. Clair
Franklin.
Christian
Marion
Randolph.
Knox. . . .
La Salle. .
Gallatin. .
Saline. . . .
Saline. . . .
CoalbedNo.
Equili-
bration
C1)
Humidity values (per cent)
11.2
1.61.41.61.41.71.5
1.61.3.9
.8
1.91.3
2.01.7
1.91.62.01.61.91.51.91.7
1.1
1.01.0.9
59.8
7.1
3.4
2.21.7
7.94.78.84.99.45.28.44.19.24.27.83.43.22.43.22.33.02.1
84.4
11.27.2
13.27.8
13.49.66.05.12.72.49.46.89.08.411.69.611.410.110.08.316.49.513.37.1
3.83.33.S3.33.53.0
97.7
13.012.514.213.414.414.16.56.23.03.010.79.910.19.913.212.713.712.910.810.
17.
16.
14.
13.
4.
4.14.24.13.93.7
100^
13.313.314.414.314.614.86.66.43.13.110.910.410.310.113.513.214.1
Ratio of
moisturevalues
97.7%100%
13.410.910.917.817.614.714.34.34.24.34.24.03.8
.977
940.986
937986953985969968968982952981980978962972963991963989938986930977976977976.975
.974
.981
959
Calcu-lated
moisturevalue3
13.313.014.514.014.714.76.66.53.13.110.910.310.310.313.513.214.013.511.010.917.917.214.813.94.34.34.34.34.03.9
lA Residual moisture after 1st equilibration.B Residual moisture after 2nd equilibration.
2By extrapolation.3Factors 0.981 and 0.959 used respectively for 1st and 2nd equilibration values.4Strip mine.sLocal below coal Xo. 6.
In table 2 are tabulated moisturevalues for these six samples obtained bysix procedures including first and secondequilibrations on each sample. Thesevalues, in general, check very well withthe exception that the second equilibra-
tion value for sample C-1903A is higher
than the other values and both the first
and second equilibration values for sampleC-1904A are lower than the other values.
The first and second equilibration values
check reasonably well in four of the six
samples but for samples C-1901A andC-1903A there is considerable variation.
The difficulties which arose in applying
the equilibration procedure and inter-
preting the results on the first six coats
led us to study the vapor pressures of the
solutions in desiccators used lor equili-
bration. Vapor pressures were determinedlor each solution as used in the desiccator
and then relative humidity values were
calculated. A description of apparatus
and procedure used in these determina-
tions is presented in appendix A. Infor-
mation was obtained in the course ol
these determinations which has a distinct
bearing on the equilibration procedure.
EQUILIBRATION METHOD OF
30 40 50 60 70RELATIVE HUMIDITY - PER CENT
100
Fig. 5.—Moisture-humidity curves for medium-moisture samples, desiccators evacuated, water-hath
thermostat.

DETERMINING MOISTURE IX COAL 17
Table 6.- -Moisture Values Obtained by Different Methodsfor Fifteen Samples
Lab. No. CountyCoalbedNo.
Moisture values obtained by different methods 1
(per cent) Minehumidity
(per cent) 2
A B C D E F G H
C-2009C-2010C-2022C-2023C-2030C-2031C-2034C-2037C-2039C-2042C-2046 4
C-2059 4
C-2064C-2069C-2080
Vermilion. . . .
La Salle
LoganSaline
Gallatin
St. Clair
FranklinChristianMarionRandolph. . . .
KnoxLa Salle
Gallatin
Saline
Saline
7
2
5
5
5
6
6
6
6
6
6
(6)
5
5
5
13.314.314.47.73.810.99.513.012.510.918.015.15.04.85.0
12.613.113.87.73.710.49.412.012.310.217.915.15.04.85.0
13.514.414.67.33.1
' 9A12.912.5 3
11.117.614.54.84.74.8
14.014.915.18.13.711.510.013.413. I 3
11.618.815.15.15.15.1
13.114.015.26.53.110.49.814.317.110.918.614.94.54.34.0
13.114.1
14.96.33.310.69.713.415.211.119.314.44.24.74.1
13.314.414.66.63.110.910.313.514.110.917.814.74.34.34.0
13.314.314:86.43.110.410.113.213.410.917.614.34.24.23.8
95969497929597979392885
48 :-
979696
JA Sample ground to J^-inch. in mine. Total moisture by Air Dry Loss + Regular Moisture.B 50-lb. mine sample crushed to 5^-inch in laboratory. Total moisture by Air Dry Loss + Regular Moisture.C 5-gram sample crushed to 20 mesh in mine. Moisture by A.S.T.M. oven, air atmosphere, 105° C. \
XA hours.D 5-gram sample crushed to 20 mesh in mine. Moisture by vacuum oven 3 inches Hg., X 2 atmosphere, 105° C., 3 hours.E 100 per cent humidity extrapolated moisture values—-1st equilibration, evacuated.F 100 per cent humidity extrapolated moisture values—-2nd equilibration, evacuated.G 100 per cent humidity extrapolated moisture values— 1st equilibration, nitrogen atmosphere.H 100 per cent humidity extrapolated moisture values—2nd equilibration, nitrogen atmosphere,determined with sling psychrometer.^Crushed to 20 mesh in mine; brought to laboratory in large sample bottle and transferred to weighing bottle.4Strip mine.Outdoor humidity."Local below coal No. 6.
An attempt to use the original air ovenwas not successful since it was impossible
to hold the temperature of the desiccators
sufficiently close to 30° C. by this means.It was therefore necessary to use a water-
bath thermostatically controlled at 30°
C. varying not more than + 0.1° C.
Evacuation of the desiccators lowers the
temperature 5° C. or more and in the
air oven, several hours are necessary to
regain the proper temperature. Suchlowering of temperature with slow return
to proper temperature, is important both
in making vapor pressure determinations,
and in the actual equilibration of coal
samples. Lowering of the temperatureby evacuation results in condensation
of moisture on the coal sample and unless
it is left until equilibrium is regained, the
moisture of the sample will be too high.
This is particularly important at the
higher humidities. The use of a water-
bath thermostat was found to effect re-
turn to the desired temperature within
a short time (about one-half hour) after
evacuation and proved satisfactory in the
vapor pressure determinations. Thehumiditv values calculated from the de-
termined vapor pressure values checkedclosely with those used by Stansfield andGilbart. The humidity values used bythem and those determined in this labor-
atory are compared in table I, appendix A.
Having proved to our satisfaction that
the relative humidities in the desiccators
used were satisfactory, provided there
was adequate temperature control, ad-
ditional coal samples were studied. Fif-
teen samples representing low, medium,and high moisture coals of the State wereobtained and treated as outlined above.
Analyses of these samples are shown in
table 3. The samples were equilibrated
for 48 hours in desiccators placed in a
water-bath thermostat, with evacuation
every 12 hours. Results of these determi-
nations are tabulated in table 4 andshown graphically in figures 4, 5 and 6.
As stated above, it was learned that
evacuation lowered the temperature in
the desiccators and that the return to
the desired temperature was slow in an
air-bath thermostat. It was thought that
elimination of evacuation and the use of
an inert atmosphere at normal pressure

18 EQUILIBRATION METHOD 01'
V cwh
H <AUJ uU <;
hiW
Ph 1/3
Bj
Q Oy. h< <u
Q ouj I«
X wQ
<*1
o w
r-1
Oc hUJ <
«Q cc
ft
OoUJ
C/3 w«UJ QH /".
Ph O< u
UJ
ujX
2J ?;
<> *
uj Q
<5 <;
j)
<• U.
;_; OQ h</) XW oC£ w
£
o u,;
lOOOl^fNlOrHTtrHM^Ol^'tOlNNWO"5fNNMOOOOONfOC)fO
NOOO^MON^OMONfOfOfO
^'ta'tMOMfcafNCiNCcoo
00 N >+ N ir; o i^ 00
MMfOIN^rO^fTl
OOONOOiOOMfT)M^^MrtfOrOfO ro<^ro r^^i
-M— O '-' O
l^ On ^ <X> -* On ~+ (N O <N ^ -J" "O fO
1^ Q> 'i O On *t OO h (N M) O r1"0 i1
't^-t'00'ta'OooNi'OOo
t>>Mi/)i/)ir( 000000^ iO"T^
JHU^
c
ajrto"3 rt 4-;^-r: ^H rt1rro« ra K!
0\OM'y)0'-,,tt^ONfNOON ,t^OO'HMfNfOfOfOfO'^'+'+'OOOOOooooooooooooooo(N(N(N(^l(N(N(N(N(N(NrN(NfN(NM
I I I I I I I I I I I I I I Iuuuuuuuuuuuuuuu
u ft
S 2
X
^«io

DETERMINING MOISTURE IN COAL 19
Table 8.
—
Residual Moisture Values After Second Equilibration (determined) and PerCent Increase in Weight of Samples During Second Equilibration. Air Rath—
Nitrogen Atmosphere— No Evacuation
Lab. No. Count 1
CoalbedNo.
Humidity values (per ceni I
11.2
Wt. 1 R.M.2
59.8
Wt. 1 R.M
84.4 97.7
Wt. 1 R.M. 2 Wt R.M
20092010
C-2022C-2023C-2030C-2031C-2034C-2037C-2039C-2042C-2046 3
C-2059 3
C-2064C-2069C-2080
VermilionLa Salle .
LoganSaline. . . .
Gallatin .
St. Clair
Franklin
.
ChristianMarionRandolphKnox. . . .
La Salle. .
Gallatin .
Saline . . .
Saline. . . .
7
2
5
5
5
6
6
6
6
6
6(')
5
5
5
1
1
1
1
1
1
1.4
1.01.0.91
1.41.41.5
1.3.77
3
7
6
6
5
7
3.3 3.4
1.7
1.41.1
1.0.90
2.42.1
4.74.95.24.1
4.33.42.32.32.1
7.27.79.45.32.46.88.59.69.88.29.37.03.33.33.0
7.27.89.65.12.46.88.49.610.18.39.57.1
3.33.33.0
12.313.1
13.96.02.69.99.811.812.810.616.513.44.13.93.8
12.513.414.1
6.23.09.99.912.712.910.516.513.34 1
4. 1
3.7
^Veight increase, per cent.-Residual moisture, per cent.
:iStrip mine.4Local below coal Xo. 6.
within the desiccators might eliminate
this difficulty. Accordingly, portions of
the 15 samples were equilibrated at three
or four humidities in a nitrogen atmos-phere, using the air-bath thermostat.
The results obtained are tabulated in
table 5 and shown graphically in figures
7, 8, and 9. Results obtained in this
way are similar to those obtained in the
former series of determinations. Table 6
presents a comparison of moisture values
obtained by various procedures for these
coals.
As a means of checking whether the
vacuum oven procedure for determiningmoisture accounted, within experimental
error, for the increase in weight of samplesduring second equilibration, a comparisonwas made of vacuum oven moisture values
with the per cent increase in weight of
the dry samples during the second equili-
bration. The comparison of these values
for the 15 samples equilibrated in the
water-bath thermostat is shown in table
7 and for those equilibrated in the nitro-
gen atmosphere, air-bath thermostat, in
table 8. Reference to these tables will
show that the vacuum oven procedureaccounts, within experimental error, for
all moisture taken up by the samples dur-
ing equilibration.
Figures 4, 5, and 6, in which are plotted
the moisture-humidity data for the 15
samples of coal equilibrated in the water-
bath thermostat, show irregular curves
similar to those obtained for the first six
coals. These curves are difficult to extra-
polate, as they are inclined very steeply
upward toward the 100 per cent line in
some instances and downward in others,
leaving doubt as to their proper direction.
The irregularities are greater than the
allowable limits of deviation in the pro-
cedures used, which makes it impossible
to draw smooth curves through the
points. The low and intermediate humid-ity values have little or no influence on
the slope of the curve as extrapolated, for
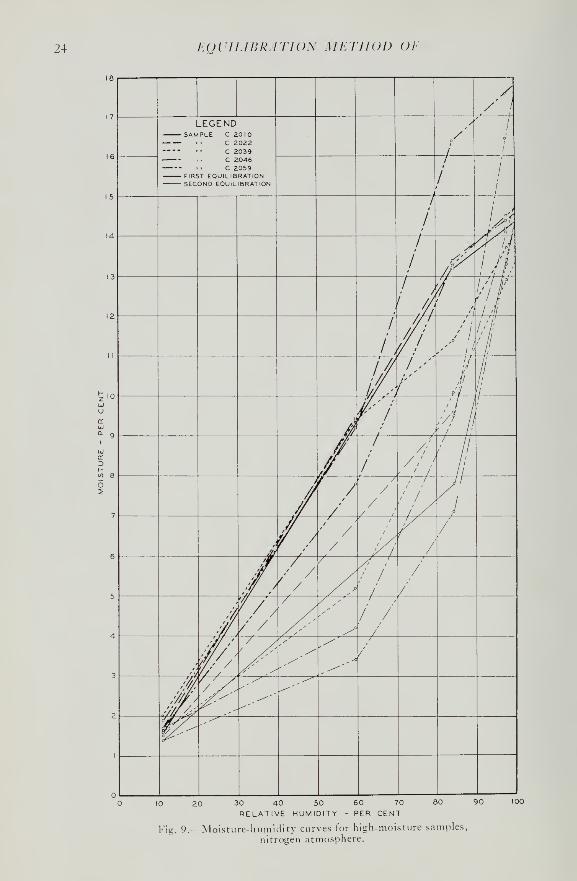
this slope is determined by the last twohigh humidity values. In figures 7, 8, and9 are plotted the moisture-humidity data
for the samples equilibrated in a nitrogen
atmosphere. These curves appear smooth-er than those of figures 4, 5, and 6 be-
cause fewer points were plotted. How-ever, here again the slope of the curve as
extrapolated to cut the 100 per cent hu-
midity axis is determined by the last twopoints. It would seem, therefore, that
equilibrations at low and intermediate
humidities are entirely useless for extra-
polation. Curves whose extrapolation

20 EQUILIBRATION METHOD OF
30 4 50
RELATIVE HUMIDITY60 70
PER CENT
Fig. 6.—Moisture-humidity curves for high-moisture samples, desiccators
evacuated, water-hath thermostat.

DETERMINING MOISTURE IN COAL 21
-<?LEGENDMPLE C 2023
C 2030C 2064C 206 9
C 208ST EQUILIBRATIONCOND EQUILIBRATION
y
.„->^
***i
-****** ^*^ °^
a«**J>'
^o&'^\-""^>"
„ c
-^. --
- r-^ -.
^__ o^
, <^
i^S2? .• 5^^ _-•—--" -^
"^
o—
—
10 20 30 40 50 60 70
RELATIVE HUMIDITY - PER CENT80 90 100
Fig. 7.—Moisture-humidity curves tor low-moisture samples, nitrogen atmosphere.
slope is determined by only two or possi-
bly three points would seem to be un-
reliable.
Stansfield and Gilbart (11) suggested
that after characteristic curves had been
run on many representative coals it was
possible to caluclate an average ratio
between the 97 per cent humidity mois-
ture value and the "true" moisture value
obtained by extrapolation. This ratio
could be used in calculating true mois-
ture values from the 97 per cent humidity
moisture values. By such a procedure
equilibration at only one humidity was
necessary and the value so obtained was
termed moisture "by calculation." Thefactor as determined by Stansfield andGilbart for this calculation was 0.986.
Similar factors have been calculated
from the data in this report. The factors
together with calculated moisture values
are shown in tables 1, 4, and 5. Reference
to tables 1 and 4 will show factors andcalculated moisture values obtained from
the retained moisture values at both 96.8
and 97.7 per cent humidities. The aver-
age factor of first equilibration values at
96.8 per cent humidity for the first six
samples studied (table 1) is 0.971 and for
second equilibration values it is 0.898.
Factors for 97.7 per cent values are
0.979 and 0.930 respectively for first andsecond equilibration data. Considerable
deviation of individual values from the
averages are apparent. In calculating
moisture values, average factors for first
equilibration values were used for first
equilibration data and average factors
for second equilibration values were used
for second equilibration data. The mois-
ture values calculated from 96.8 and 97.7
per cent humidity values check reason-
ably well but appreciable deviations of
these values from the 100 per cent ex-
trapolated values are noted.
Factors for the 15 samples of table 4
are 0.950 and 0.952 respectively for first
and second equilibration data at 96.8 per
cent humidity and 0.960 and 0.957
respectively for first and second equili-
data at 97.7 per cent humidity. Again, in-
dividual factors deviate appreciably from
the average factor. Calculated moisture
values for the two series check verv well

22 EQUILIBRATION METHOD OE
20 30 40 50 60 70 80 90RELATIVE HUMIDITY - PER CENT
Fig. 8.—Moisture-humidity curves for medium-moisture samples, nitrogen atmosphere.
100

DETERMINING MOISTURE IN COAL 23
but vary considerably from the 100 per
cent extrapolated values in some cases.
Factors tor results on samples equilibrated
in a nitrogen atmosphere are available
only for the 97.7 per cent humidity data.
These are shown in table 5. Values ot
0.981 and 0.959 respectively were ob-
tained tor first and second equilibration
data. Calculated moisture values seemto check with the 100 per cent extrap-
olated values somewhat better than dothose of tables 1 and 4.
In table 6 are tabulated moisture values
tor the 15 samples obtained by different
procedures including first and secondequilibration values obtained using evac-
uation and nitrogen atmosphere. In
general the results obtained by various
procedures seem to check reasonably well.
For the most part method B, or total
moisture by Air Dry loss -f- RegularMoisture, gave lowest results. Equili-
bration results for samples C-2023, C-2030, C-2064, C-2069, and C-2080 are,
in general, lower than results obtained byother procedures but the equilibration re-
sults for sample C-2039 are distinctly
higher than the other results for this
sample.
As a test of the suitability of the mois-
ture values obtained in this study tor use
in the rank classification ot Illinois coals,
moist mineral-matter-free B.t.u. values
for all 21 coals studied were calculated onthe basis of each different moisturevalue.
These values, together with ash, sul-
fur, and B.t.u. values reported on the
"as received" basis according to each in-
dividual moisture value, are shown in
table 9.
Reterence to this table will show devia-
tions in moist mineral-matter-free B.t.u.
values in only four of the 21 coals studied,
which are in the critical range for classifi-
cation. Critical moist mineral-matter-freevalues are 11,000, 13,000 and 14,000 B.t.u.
(1, 2). On sample C-1901A, methods A,B, C, and E produced moisture values
leading to calculated heat values greater
than 11,000 B.t.u. whereas methods Dand F gave values leading to calculated
heat values of less than 11,000 B.t.u. Onsample C-1904A, methods A, C, and Dproduced moisture values leading to cal-
culated heat values less than 11,000 B.t.u.
while methods B, E, and F gave moisturevalues leading to calculated heat valuesgreater than 11,000 B.t.u. For coal C-2034, methods A, B, and C gave moisturevalues resulting in calculated heat values
greater than 13,000 B.t.u. but methods I),
E, F, G, and H gave moisture values lead-
ing to calculated heat values less than13,000 B.t.u. On sample C-2080, all
methods but one gave moisture values re-
sulting in calculated heat values greater
than 14,000 B.t.u. Method D gave a
moisture value which resulted in a calcu-
lated heat value less than 14,000 B.t.u.
Coals C-1901A and C 1904A are border-
line coals, and agglomerating and weath-ering characteristics would have to be con-
sidered for classification before such de-
viations would be controlling factors.
In three of the four cases where the heat
values are around critical dividing points,
the deviations ot moist mineral-matter-
free B.t.u. values are within experimentalerror and are therefore not significant.
CONCLUSIONS
The study ot the equilibration pro-
cedure has led to the following conclu-
sions:
1) The equilibration procedure as
applied to the Illinois coals studied pro-
duces data which, when plotted, give
irregular curves. Satisfactory extrapola-
tion of these curves is impossible.
2) Low and medium humidity val-
ues do not appear to affect the slope of
extrapolated curves.
3) Other procedures which are muchsimpler, but may involve slight modifica-
tion of the standard procedure for samp-ling, appear to produce results suitable
for classification by rank.
Although the general equilibration
method does not appear suitable for de-
termining 100 per cent humidity moisturevalues for rank classification, it may be
useful for studying the nature of mois-
ture in coal. The am hors plan to use this
method in studying the nature of the
moisture of banded ingredients of repre-
sentative Illinois coals in an attempt to
throw further light on the nature of
moisture in coal.
24 EQUILIBRATION METHOD OP
Fig. 9.
30 40 50 60 70
RELATIVE HUMIDITY - PER CENT
-Moisture-humidity curves for high-moisture samples,
nitrogen atmosphere.

DETERMINING MOISTURE IS COAL 25
Table 9.—Moist Mineral-Matter-Free Calorific Values as Calculated Using MoistureValues Obtained by Different Methods. (All Coals contain less than 69 percent dry
Mineral-Matter-FREE Fixed Carbon)
Coal Moisture Ash Sultur B.t.u. B.t.u.
Lab. No. Count) bed Method 1 as as as as moistNo. Rec'd Rec'd Rec'd Rec'd M.M. Free
C-1863
A
La Salle 2 (A) 14.6 10.1 3.88 10786 12181(B) 14.2 10.1 3.90 10837 12240(C) 14.4 10.1 3.89 10811 12210(D) 14.7 10.1 3.87 10773 12165(E) 14.3 10.1 3.89 10824 12225(F) 14.4 10.1 3.89 10811 12210
C- 1864
A
Perry 6 (A) 10.5 10.7 3.91 11012 12535(B) 9.9 10.8 3.94 11086 12637(C) 10.2 10.8 3.92 11049 12593(D) 10.5 10.7 3.91 11012 12535(E) 10.4 10.8 3.92 11024 12564(F) 10.0 10.8 3.93 11074 12623
C-1900
A
Saline 5 (A) 7.2 8.4 2.51 12333 13632(B) 6.6 8.4 2.52 12413 13722(C) 7.1 8.4 2.51 12346 13647(D) 7.2 8.4 2.51 12333 13632(E) 6.7 8.4 2.52 12400 13708(F) 7.0 8.4 2.51 12360 13663
C-1901A Henry 6 (A) 18.4 9.7 3.84 9884 11088(B) 17.7 9.8 3.87 9969 11199(C) 18.7 9.7 3.82 9848 11046(D) 19.1 9.6 3.80 9779 10976(E) 18.1 9.7 3.85 9921 11130(F) 19.0 9.6 3.81 9812 10991
C-1903
A
St. Clair 6 (A) 10.5 11.1 3.76 11098 12694(B) 10.6 11.1 3.75 11087 12681
(C) 10.4 11.1 3.76 11110 12708(D) 10.8 11.1 3.75 11061 12651
(E) 10.4 11.1 3.76 11110 12708(F) 11.9 10.9 3.70 10924 12459
C-1904
A
Henry 6 (A) 20.7 10.0 3.25 9636 10838(B) 19.5 10.1 3.30 9782 11019
(C) 20.4 10.0 3.26 9672 10879(D) 20.8 10.0 3.25 9624 10824(E) 18.6 10.3 3.34 9891 11172
(F) 18.8 10.2 3.33 9867 11131
C-2009 Vermilion .... 7 (A) 13.3 10.1 3.10 10989 12398(B) 12.6 10.2 3.13 11078 12516(C) 13.5 10.1 3.10 10964 12369(D) 14.0 10.1 3.08 10901 12297
(E) 13.1 10.2 3.11 11015 12443
(F) 13.1 10.2 3.11 11015 12443(G) 13.3 10.1 3.10 10989 12398(H) 13.3 10.1 3.10 10989 12398
C-2010 La Salle 2 (A) 14.3 9.0 3.03 11072 12324(B) 13.1 9.1 3.08 11227 12515(C) 14.4 9.0 3.03 11060 12310(D) 14.9 8.9 3.01 10995 12222
(E) 14.0 9.0 3.04 11111 12368(F) 14.1 9.0 3.04 11098 12353(G) 14.4 9.0 3.03 11060 12310(H) 14.3 9.0 3.03 11072 12324

26 EQUILIBRATION METHOD OF
Table 9—(Continued)
Coal Moisture Ash Sulfur B.t.u. B.t.u.
Lab. No. County bed Method 1 as as as as moistNo. Rec'd Rec'd Rec'd Rec'd M.M. Free
C-2022 Logan 5 (A) 14.4 11.4 2.84 10566 12103(B) 13.8 11.5 2.86 10641 12206(C) 14.6 11.4 2.84 10542 12075(D) 15.1 11.3 2.82 10480 11988(E) 15.2 11.3 2.82 10468 11974(F) 14.9 11.3 2.83 10505 12017(G) 14.6 11.4 2.84 10542 12075(H) 14.8 11.3 2.83 10517 12031
C-2023 Saline 5 (A) 7.7 9.3 2.97 12103 13535(B) 7.7 9.3 2.97 12103 13535(C) 7.3 9.4 2.98 12156 13612(D) 8.1 9.3 2.96 12051 13476(E) 6.5 9.4 3.01 12261 13732(F) 6.3 9.5 3.02 12287 13779(G) 6.6 9.4 3.01 12248 13717(H) 6.4 9.5 3.01 12274 13763
C-2030 Gallatin 5 (A) 3.8 11.1 3 . 39 12637 14472(B) 3.7 111 3.39 12650 14487(C) 3.1 111 3.41 12729 14580(D) 3.7 111 3.39 12650 14487(E) 3.1 11.1 3.41 12729 14580(F) 3.3 11.1 3.40 12703 14549(G) 3.1 11.1 3.41 12729 14580(H) 3.1 111 3.41 12729 14580
C-2031 St. Clair 6 (A) 10.9 11.6 3 . 69 11008 1 2668(H) 10.4 11.6 3.71 11070 12741
(C)(I)) 11.5 11.5 3 . 66 10934 1 2564
(E) 10.4 11.6 3.7,1 11070 12741
(F) 10.6 11.6 3.70 11045 12711
(G) 10.9 11.6 3 . 69 11008 12668(H) 10.4 116 3.71 11070 12741
C-2034 Franklin. 6 (A) 9.5 8.4 1.16 1 1 799 13004
(B) 9.4 8.4 1.16 11812 13018
(C) 9.4 8.4 1 .16 11812 13018
(D) 10.0 8.4 1.15 11734 12931
(E) 9.8 8.4 1.15 11760 12960(F) 9.7 8.4 1.16 11773 12975
(G) 10.3 8.3 1.15 11695 12873
(H.) 10.1 8.4 1.15 11721 12917
C-2037 Christian 6 (A) 13.0 11.2 4.48 10618 12165
(B) 12.0 11.4 4.53 10740 12340
(C) 12.9 11.2 4.49 10630 12180
(D) 13.4 11.2 4.46 10570 12109
(E) 14.3 11.1 4.41 10460 11964
(F) 13.4 11.2 4.46 10570 12109
(G) 13.5 11.2 4.45 10557 1 2093
(H) 13.2 11.2 4.47 10594 12137
C-2039 Marion 6 (A) 12.5 9.9 3.32 11001 12385
(B) 12.3 9.9 3.32 11026 12414
(C) 12.5 9.9 3.32 11001 12385
(D) 13.1 9.8 3.29 10925 12283
(E) 17.1 9.4 3.14 10422 11649
(F) 15.2 9.6 3.21 10661 11951
(G) 14.1 9.7 3.26 10799 12123
(H) 13.4 9.8 3.28 10887 12239

DETERMINING MOISTURE IN COAL 27
Table 9- (Concluded)
Coal Moisture Ash Sulfur B.t.u. B.t.u.
Lab. No. County bed Method 1 as as as as moistNo. Rec'd Rec'd Rec'd Rec'd M.M. Free
C-2042 Randolph .... 6 (A) 10.9 10.7 2.80 11104 12616(B) 10.2 10.8 2.82 11191 12733(C) 11.1 10.7 2.79 11078 12586(D) 11.6 10.6 2.78 11016 12499(E) 10.9 10.7 2.80 11104 12616(F) 11.1 10.7 2.79 11078 12586(G) 10.9 10.7 2.80 11104 12616(H) 10.9 10.7 2.80 11104 12616
C-2046 Knox 6 (A) 18.0 9.1 2.95 10243 11401(B) 17.9 9.1 2.96 10256 11416(C) 17.6 9.1 2.97 10293 11458(D) 18.8 9.0 2.92 10144 11275(E) 18.6 9.0 2.93 10168 11302(F) 19.3 9.0 2.91 10081 11204(G) 17.8 9.1 2.96 10268 11429(H) 17.6 9.1 2.97 10293 11458
C-2059 La Salic Local (A) 15.1 6.5 2.16 11386 12286below (B) 15.1 6.5 2.16 11386 12286
6 (C) 14.5 6.6 2.17 11466 12388(D) 15.1 6.5 2.16 11386 12286(E) 14.9 6.6 2.16 11413 12330(F) 14.4 6.6 2.17 11480 12404(G) 14.7 6.6 2.17 11440 12360(H) 14.3 6.6 2.18 11493 12418
C-2064 Gallatin 5 (A) 5.0 8.9 3.17 12664 14107(B) 5.0 8.9 3.17 12664 14107(C) 4.8 8.9 3.18 12690 14137(D) 5.1 8.9 3.17 12650 14092(E) 4.5 9.0 3.19 12730 14200(F) 4.2 9.0 3.20 12770 14245(G) 4.3 9.0 3.20 12757 14231(H) 4.2 9.0 3.20 12770 14245
C-2069 Saline 5 (A) 4.8 11.5 3.29 12229 14066(B) 4.8 11.5 3.29 12229 14066(C) 4.7 11.5 3.30 12242 14082(D) 5.1 11.5 3.28 12191 14021
(E) 4.3 11.6 3.31 12294 14160(F) 4.7 11.5 3.30 12242 14082(G) 4.3 11.6 3.31 12294 14160(H) 4.2 11.6 3.31 12306 14174
O2080 Saline 5 (A) 5.0 12.3 3.49 12070 14028(B) 5.0 12.3 3.49 12070 14028
(C) 4.8 12.3 3.49 12096 14059(D) 5.1 12.2 3.48 12058 13996(E) 4.0 12.4 3.52 12198 14198(F) 4.1 12.4 3.52 12185 14183(G) 4.0 12.4 3.52 12198 14198(H) 3.8 12.4 3 53 12223 14228
'A Sample ground to M-inch in mine. Total moisture by Air Dry Loss +Regular Moisture.B 50-lb. mine sample crushed to 34-inch in laboratory. Total moisture by Air Dry Loss -(-Regular Moisture.C 5-gram sample crushed to 20 mesh in mine. Moisture by A.S.T.M. oven, air atmosphere, 105° C. l
1 ^ hours.D 5-gram sample crushed to 20 mesh at mine. Moisure by vacuum oven 3 inches Hg. ,X> atmosphere, 105° C, 3 hours.E 100 per cent humidity extrapolated moisture values— 1st equilibration, evacuated.F 100 per cent humidity extrapolated moisture values—2nd equilibration, evacuated.G 100 per cent humidity extrapolated moisture values— 1st equilibration, nitrogen atmosphere.H 100 per cent humidity extrapolated moisture values—-2nd equilibration, nitrogen atmosphere.

28 EQUILIBRATION METHOD OF
BIBLIOGRAPHY
1. Classification of Coals by Rank (Tentative) D 388-361", A.S.T.M. Standards on Coal and Cokep. 98 (1936).
2. Classification of Coals by Rank, I) 388-38, 1938 Supplement to Book of A.S.T.M. Standardspp. 157-162.
3. Lavine, Irvin, and Gauger, A. \Y., Ind. Fng. Chern. 22, 1226 (1930).
4. I.orian, M., Lavine, I., Mann, C. A., and Gauger, A. W., Ind. F.ng. Chem. 22, 1231 (1930).
5. Stansfield, Edgar, and Gilhart, K. C, Trans. Amer. Inst. Min. and Met. Kngr., Coal Div., 101,
125-143 (1932).
6. Investigations of the Coals of Canada, Dept. of Mines, Ottawa, Rept. 83, p. 130 (1912).
7. Stansfield, E., Trans. Can. Inst. Min. and Met. 26, 292 (1923). Also Research Council of Alberta,Fourth Annual Report 39 (1923).
8. Stansfield, F., and Gilhart, K. C, Trans. Amer. Inst. Min. and Met. Fngr. Coal Div., 101,
p. 138, Appendix I (1932).
9. Appraisers Bull. 2814, Ottawa (Aug. 25, 1923).
10. Standard Methods of Laboratory Sampling and Analysis of Coal and Coke, A.S.T.M. Desig.
I) 271-33.
11. Stansfield, F., and Gilbart, K. C, Private Communication.

DETERMINING MOISTURE IN COIL 20
APPENDIX A
DETERMINATION OF THE VAPOR PRESSURES OF THE SATURATEDSALT SOLUTIONS USED IN EQUILIBRATION TESTS
By O. W. Rees and G. W. Land
The problem of making vapor pressure
determinations on the saturated salt solu-
tions used in the equilibration tests was
complicated by the necessity of obtaining
values for them as used in the moisture
study rather than in cells especially con-
structed for vapor pressure determina-
tions. Following is a description of the
apparatus and procedure used as well as
the results obtained.
Of the many procedures available for
making vapor pressure determinations
two were selected as promising. Thefirst procedure tried was the static methodused by Frowein (1) which used an oil-
filled siphon manometer. This was found
to be unsuitable so the manometer methodapplied by Rayleigh (2) to the measure-ment of low pressure was tried. This
procedure, with certain modifications,
proved to be satisfactory. A description
of the apparatus used in this studyfollows.
APPARATUS
The double-arm manometer was con-
structed of glass, and the two armswere connected at both the top andbottom with glass tubing. From the
tube connecting the bottoms of the mano-meter arms, a long glass tube extendeddown to a mercury well which could beraised and lowered to control the mercurylevel in each arm. The upper connectingtube was provided with a vacuum stop-
cock making it possible to close off onearm from the other. Each arm was pro-
vided with a sealed-in-tungsten contactpoint. These points were connectedthrough push buttons and dry cell batteryto a lamp and scale galvanometer for usein levelling the manometer while en-
closed in an air-bath thermostat. Themanometer assembly was mounted on a
framework pivoted at the center to pro-
vide tilting in either direction. Tilting
was controlled by a screw extendingthrough the bottom of the air-bath
thermostat. A mirror for projecting theangle of tilt was mounted at the hub ofthe tilting device half way between thetwo arms of the manometer. The mano-meter was connected to a McLeod gageby a long slightly flexible glass U-tube.This gage measured the absolute pressurein the system at the beginning of eachdetermination. The flexible glass tubealso connected to the system the desicca-
toi containing the unknown solution.
The temperature of this solution wascontrolled at 30°C. ± 0.1°C. by immersingthe desiccator in a water-bath thermo-stat. A light was mounted on a milli-
meter scale four meters from the mano-meter mirror in such a way that the angle
of tilting was projected by the mirror
through a glass window in the door of
the air-bath thermostat on to the scale
and read by means of a telescope. Fig-
ure A gives a diagrammatic sketch of the
manometer assembly, side view or viewalong the axis of rotation of the mano-meter. Figure B is a diagrammaticsketch of the manometer assembly, front
view or view perpendicular to the axis
of rotation of the monometer. Figure Cis a diagrammatic sketch of the mano-meter, scale, and alidade, side view.
Figure D is a photographic view of the
manometer assembly. "This figure showsa Leeds & Northrup lamp and scale in
position to read the projected tilt of the
manometer. This was later replaced with
a surveyor's alidade which was used for
all measurements reported. A rubber
tube connection to the levelling reservoir
is also shown in this figure. This waslater replaced with a glass tube extending
straight down to the reservoir. Vacuumdesiccators of the type shown in figure I)
were used to contain the saturated solu-
tions whose vapor pressures were meas-
ured.

30 EQUILIBRATION METHOD OF
GALVANOMETER
GLASS U-TUBE
TO MC LEOD GAUGE
AIR BATH BOXMERGURY LEVELING BULB
MERCURY SEALED RUBBER CONNECTION
WATER THERMOSTAT
DESICCATOR
MERCURY RESERVOIR
DRYING TUBE
GALVANOMETER
TO PUMP*
MC LEOD GAUGE
TO WATER PUMP
-0*— MIRROR
AIR BATH BOX
i MERCURY RESERVOIR
GLASSU-TUBE
BFig. A (above).— Diagrammatic sketch of manometer assembly, side view.
Fig. B (below).— Diagrammatic sketch of manometer assembly, front view.

DETERMINING MOISTURE IN COAL 31
TO MC LEOD GAUGE
=!-•— ALIDADE
HORIZONTAL
SCALE
Fig. C.—Diagrammatic sketch of m*an6'metir, scale, and alidade, side view.
PROCEDURE
Saturated solutions for the vapor pres-
sure measurements were prepared by twoprocedures. In the first procedure a
saturated solution was prepared andplaced in the bottom of the desiccator.
An excess of the salt was placed in direct
contact with this solution to insure com-plete saturation at all times. In the
second procedure the dry salt was placed
in the desiccator together with a small
beaker of distilled water. The desiccator
was closed, evacuated, and allowed to
stand until the water in the beaker hadpassed over to the salt. While the first
procedure was more rapid, it producedsolutions containing more entrapped air
bubbles than the second. However, it waspossible to remove these air bubbles byseveral alternate evacuations and re-
turns to atmospheric pressure. Duplicatedeterminations were made on solutions
of each salt prepared by each method.The procedure for the actual vapor
pressure measurements was as follows:
The air and water-bath thermostatwere brought to the desired temperature
(30°C). The desiccator containing the
saturated solution was evacuated by using
an aspirator pump, and placed in the
water bath. When it had reached the
30°C. temperature (determined by a
small Anschutz thermometer placed in-
side the desiccator) it was connected to
the manometer system through the mer-cury-sealed rubber connection (fig. A),
stopcocks G and I (figs. A and B) were
closed and the system was partially
evacuated with a Hyvac pump. Stop-
cock G was then opened and the system,
including the desiccator, was further
evacuated. Pumping was continued for
about ten minutes after which stopcock
G was again closed and with stopcock
I opened, the system was evacuated until
the McLeod gage reading was suitably
low. This value was recorded and stop-
cock J (fig. B) was closed. The mano-meter was then levelled by adjusting the
tilt of the beam with the special screw
(fig. A) until the contact points indi-
cated that the mercury in both arms wasequal in height in the arms. It was neces-
sary to adjust the height of the mercury

32 EQUILIBRATION METHOD 01
Fig. I). Manometer assembly
Table I. Experimental Vapor Pressure Values
1 2 3 4 5 6 7
Differ-
8
Average9
Vapor10
Saturatedsalt
solution
Solution preparedby direct com-
Solution preparedby distillation
encebetween
ot
results
pressures
used byDiffer-
bination method
Vapor pressure, mm.
method
Vapor pressure, mm.
results
from twomethods
fromtwo
methods
Stansflcld
andGilbart
betweencolumns8 and
9
1st 2nd avg. 1st 2nd avg. m m
.
mm. m m
.
KCIO, 31.116 31.066 31.091 31.091 31.070 .021
K 2S0 4 30.801 30.751 30.776 30.751 30.785 30.768 .008 30.772 30 . 800 .028
BaCU.2H 2 28.687 28.637 28.662 28.677 28.639 28.658 .004 28.660 28.600 .060
KC1 26.796 26.890 26.843 26.879 26.874 26.877 .034 26.860 26.900 .040
NaCl 23.997 24.007 24.002 23.972 23.927 23.950 .052 23.976 23 . 900 .076
NH 4NO, 19.090 19.045 19.068 18.978 19.032 19.005 .063 19.037 19.000 .037
Ca(N02)2.4FhO. . . 14.907 14.967 14.937 14.907 14.931 14.919 .018 14.928 14.900 .028
CH,COOK 6.529 6.482 6.506 6.535 6.606 6.571 .065 6.539 6.365 .174
UCI.H2O 3.575 3.523 3 . 549 3.573 3.532 3.552 .003 3.551 3 . 560 .009

DETERMINING MOISTl'Rl-: IN COAL 33
i~^rex I
QC3 a. 2
Fig. E.—-Diagrammatic sketch showing the geometrical relationship involved in the calculations.
reservoir (figs. A and B) during this
levelling process. When proper levelling
was secured the projection from mirror C(fig. C) was read on the scale by use of
the alidade. Stopcock K (fig. A) wasthen closed, shutting off" the back arm of
the monometer from the rest of the sys-
tem, stopcock I was closed, and stopcockG was opened, admitting the unknownvapor pressure to the front arm of the
manometer. The rocker arm was thentilted and the height of the mercuryreservoir adjusted until the contact points
in both arms just touched the mercury.The mirror projection was read and re-
corded and the manometer was adjustedat five-minute intervals until a constantreading was obtained.
From the data obtained as outlinedabove and from certain fixed dimensionsof apparatus vapor pressure calculations
were made.
CALCULATION'S
The dimensional data of the apparatus(figs. C, E) as used in this work, whichwere necessary for vapor pressure calcu-
lations were:
(1) Distance AB = 290.6 mm. (bycathetometer measurement)
(2)
(3)
(4)
(5)
(6)
Distance DC = 413.39 cm.
Scale position (D) level with cen-
ter of mirror = 70.10 cm.
Scale reading (E) corresponding
ing to level position of mano-meter.
Scale reading (F) corresponding
to tilted position of manometer(due to vapor pressure of solu-
tion).
Absolute pressure of system at
beginning of measurement (Mc-Leod gage reading).
Figure E is a diagrammatic sketch
showing the geometrical relationships in-
volved in the calculations. Distance ABis the distance between manometer armsand indicates the level position of the
manometer. A'B' indicates the mano-meter position tilted to compensate for
the vapor pressure (VP) of the unknownsolution; CD is the horizontal distance
from mirror C to the scale; DE and DFare distances on the scale determinedrespectively by the level and tilted
positions of the manometer. Angle a 3 is
the angle passed over by the reflected
beam of light and it is equal to the sumof angles a
yand a 2 . Values for these

34 EQUILIBRATION METHOD OE
two angles maylationships
tan «,
be obtained by the re-
DEand
tan as =
DCDFDC
Numerical values may then be obtainedby reference to standard trigonometrictables. The angle of triangle B'A'L is
the actual angle of tilt and it determinesthe distance B'L which measures thechange in height of the mercury level in
the manometer due to the vapor pressureof the saturated salt solution. By thelaws of reflection, the angle passed overby a reflected beam of light is twice that
passed over by the reflecting surface
when the latter is rotated about an axis
parallel to the surface, therefore:
angle = -~- +2
Having obtained the value for angle 6
and knowing the distance B'A' of triangle
B'A'L it is possible to calculate distance
B'L
sin<? =w or
B'L = B'A' sin 6
The vapor pressure (VP) of the solution
is found by the relationship
VP = B'A' sin + p = B'L + pwhere p is the absolute pressure of the
system at the beginning of the determi-
nation.
To further illustrate this
sample calculation is given:
procedure
A'B' =ABDCDEDFPDEDC 413.39
27.10
290.6 mm.= 413.39 cm.= 27.10 cm.= 60.05 cm.= 0.340 mm.
= tangent ax
0.06555
angle ax
DFDC
=
3°45'
60.05 = tangent a 2= .14526
413.39
angle a 2= 8°16'
angle a3= a
x + a 2= 3°45' + 8°16'
12°1'.
12°1'angle =
2 2= 6°30'
B'L =B'L =V.P. =
A'B' sin = 290.6 sin 6°30".
290.6 X .10468 = 30.420 mm.30.420 + .340 = 30.760 mm.
DISCUSSION OF RESULTS
Reference to table I will show that thedetermined values on solutions made bythe two methods (col. 1, 2, 3, 4, 5, and 6)
mentioned above check very well; theaverage difference between the two meth-ods being .027 mm., the largest difference
.063 mm. and the smallest .003 mm. Theaverages of these values (col. 8) checksatisfactorily those used by Stansfield andGilbart (3). Here the average deviation
is .056 mm. with the largest deviation
.174 mm. and the smallest .009 mm. In
only one case did the determined valuevary from the reported value by morethan 0.1 mm. in vapor pressure. This wasin the case of the potassium acetate solu-
tion, the determined vapor pressure of
which was 0.174 mm. higher than the
reported value; this may have been dueto some difference in the salts used.
BIBLIOGRAPHY
1. Frowein, Zeitsch. physikal, Chem. /, 5
(1887).
2. Raylcigh, Phil. Trans. 196, A, 205 (1901).
3. Stansfield, Edgar and Gilbart, K. D. Privatecommunication.

