a study of the development and issues concerning high ... · a study of the development and issues...
TRANSCRIPT
A STUDY OF THE DEVELOPMENT AND ISSUES CONCERNING HIGH
SPEED RAIL (HSR)
Yong Sang Lee
Korea Railroad Research Institute and
Transport Studies Unit, University of Oxford
Working paper N° 1020
January 2007
Transport Studies Unit Oxford University Centre for the Environment
http://www.tsu.ox.ac.uk/

A Study of the development and issues concerning High Speed Rail (HSR)
Yong Sang LEE (Visiting Scholar, Korea Railroad Research Institute)
<Summary> Since 1964, HSR, which was opened in Japan, has had a huge impact on the world. Historically,
HSR has similar characteristics to the Roman Road, which promoted rapid movement and had a
great influence on international society as transport infrastructure.
Recently the development of HSR has become more rapid because of economic, environmental
and external cost concern, emphasizing Environmentally Sustainable Transport(EST). In
particular, the external cost has become more important factor for justifying HSR.
The successful factors of HSR are high demand and cost minimal construction costs. There are
two successful HSR models, the Japanese and the French. The former operates based on high
demand oriented and the latter focuses on its minimizing costs. The demand orientated model
means HSR carries over 100,000 passengers per day as in Japan and Far East Asian countries.
The cost minimized model focuses on lower operation and construction costs as in France. In
particular, Germany carries both passengers and freight on HSR. The construction costs in
Germany are in between those of Japan and France.
In future, Korea, Taiwan and China HSR will follow Japan’s successful model because of high
population density and concentration of economic activity along railway lines.
This paper supports Vickerman’s argument that HSR is justified where there is a demand of
between 12 million and 15 million railway passenger a year(about 40thousand persons/day)
between two urban centers. This will be shown in the future in Korea, in Taiwan and China.
Finally, this paper reviews that HSR activates at 250km/h for dedicated new lines and 200km/h
for upgraded lines. In particular, it is successful in area of high population density and cost
minimizing technology.
ⅠⅠⅠⅠ. Introduction
The first high-speed rail (HSR) was opened on 1st of October 1964 in Japan. France and Germany followed with their own HSR. Actually 40 years have passed since HSR. During that time, HSR systems have brought some great achievements, playing a major role in transporting inter-city passengers. HSR has resulted in a rapid growth in passenger traffic, with a sharp increase of 62.5% between 1996 and 2004 in the number of passengers in France. In Addition, Germany demonstrated a massive increase of 132.8% in the same period. Moreover the proportion of HSR traffic has been rising; in 2004, Japan showed a 30.9% rise, France 57.3% and Germany 28.2%. In 2004, the Shinkansen which is the Japanese HSR carried 762,671 passengers per day, meanwhile the TGV in France had 249,010 passengers. The growth of HSR has come from the competitive speed, safety and social effects. HSR usually run at a maximum speed of 300km/h and there has never been a fatality in Japan, which has carried 6.2 billion passengers since 1964. Punctuality rates are at 99%. In a competitive transport market between 500km-700km, HSR has a 67% market share in Japan. The success of HSR has brought an increase in rail passenger volumes. In the case of France and Germany, rail passengers have increased by 19% and 20% respectively over the last 8 years. Furthermore, one of the characteristics of HSR is the high induced traffic which rose from 6%-23% with the start of Shinkansen. Similarly, in France, the Sud-Est TGV has also brought 26% induced traffic. As a result, HSR has shown a high profitability, where the balance of one year produced a profit in the opening 3 years in Japan. Also, France was able to recover the investment costs 12years after opening. Based on these distinguished results, HSR networks will be expanded from 13,216km in 2004 to 46,489.3km in 2010, in particular, the Korean HSR was opened in 2004. Taiwan also opened HSR network in January 2007, and China has started construction at the end of 2006.

Recently the development of HSRs has become more rapid because of economic, environmental and external effects, and the emphasis on the green society. In addition, new HSRs like the KTX (Korea Train Express) and Kyushu Shinkansen have been opened. Hence, this paper draws on the analyses of development in HSRs and discusses some recent issues, in particular, the socio-economic effects of HSR in several countries and the influence of transport markets, and will demonstrate the recent effects of HSR including the KTX and Kyushu Shinkansen. Finally, some lessons from the achievements of countries like Japan, France and Germany, where HSRs are run, will be summarized and this describes some of the challenges for sustainable transport.
ⅡⅡⅡⅡ. Literature Review
Vickerman (1997) explains that HSRs have been one of the central features of recent European transport policy. He reviews the effects of the development of HSR networks, identifies the lack of integrated networks and questions the assumptions of improved regional level development. He further demonstrates the increasing concentration of networks in main metropolitan centersi and he argues the requirement for demand of between 12 million and 15 million railway passengers a year (about 40 thousand people/day) between two urban centers to justify HSR. Banister and Berechman(2000) assert that European transport investment policies have focused on trans-European road networks and the HSR networks since 1990, whereas the objective of economic integration and social cohesion was stressed between 1970 and 1990. They demonstrate that the Shinkansen in Japan exerted a strong centralizing effect on employment because of its accessibilityii. Moreover, Sands (1993) analyzes the development effects of HSR stations, focusing on Shinkansen, TGV and ICE. He indicates the effects of HSR networks on employment and population, in particular, in areas close to HSR networksiii. Ishigawa (1985) contends that the Shinkansen had an effect on regional development. However the effects mainly depend on regional power not just on high speed linesiv. Givoni (2006) concludes that HSR is the best designed to substitute conventional railway services on routes where much higher capacity is required and to reduce travel time, further improving the railways service, also against other modes, therefore leading to mode substitution. However, the high investment in HSR infrastructure could not be justified based on its economic development benefits since these are not certain. This paper argues that the effects of HSRs can be found the socio economic effect, mode substitution, in particular, including Kyushu Shinkansen and KTX (Korea Train Express) In addition, Asian countries that have high density populations could operate HSRs more successfully than European countries. Furthermore, I hope to demonstrate the socio-economic effects, including external costs and sustainable transport focusing on HSR needs to find ways to move people, goods and information in ways that reduce the impact on the environment, economy, and society.
ⅢⅢⅢⅢ. Current situation and planning of HSR
1. Rail history and the launch of HSR
Since the nineteenth-century, railways have had as great an influence on society as Roman roads. Railways changed the concept of distance, spread culture and made travel generally available. Moreover railway stations were viewed as a symbol of modernization. Standard time was created and life styles were totally changed by railways. However, cars, which were made in the twentieth-century, had a huge influence on the railway. The development of cars caused a decrease in the demand for travel by rail. Cars have some advantages over the train. They are convenient, with diverse designs and competitive prices. In 1960, oil prices were very low, and the car was an adequate means of establishing rapid economic growth. Therefore, car use increased quickly. This phenomenon was repeated all over the world. Meanwhile, the transport system, which focused on the car, has changed gradually since 1980, because of road congestion, air pollution and high fuel prices. Transport policy has also

changed from a supply policy to a demand policy which limits car use, and has in some cases adopted congestion pricing, and high road taxes. Hence, railways are being revived and made a comeback after the economic stagnation of the 1980s, because many countries are seeking the environmentally-friendly, energy-saving, mass transport systems for economic and social reasons. This is called the Rail Renaissance. While HSR defined operating speeds of over 200km/h according to DThe National Shinkansen Construction Act 1970Din Japan and the European Union (EU) given in Directive 96/48, is 250km/h for brand new lines and 200km/h for upgraded lines in respect of the infrastructure capabilitiesv. In this paper, we suggest that HSR activates the 250km/h for new lines and 200km/h for upgraded lines. In particular, it is successful in respect of high demand and cost minimizing technology. Historically, HSR systems emerged for three basic reasons. First, to overcome the limited capacity of conventional lines, where some new investment was needed and more effective solutions like HSR were required. This is the essential reason for the Tokaido Shinkansen and TGV Sud-Est. Similarly, Korea, China and Taiwan have same reasons. Second, HSRs were contrived to increase speeds on particularly slow sections of conventional lines, where huge costs and low rail technology could not increase speeds. This can be found in the German HSR. Third, HSRs were suggested as ways of improving accessibility to more remote regions, most notably the Sanyo Shinkansen between Osaka and Fukuoka and the first Spanish AVE line, Madrid-Sevilla. Japan launched the first HSR in 1964 for a distance of about 515km between Tokyo and Osaka. By 2004 it has been expanded to 2,387.5km. France HSR was first opened for a distance of 390km in 1981 between Paris and Lyon; it has been enlarged to 6,486km including the conventional lines which are running HSR. In addition, Germany has a 6,686km wide network HSR, which was launched in 1991. There are other HSR networks, Italy with 994km, Spain 1,136km and UK 108km. (See Table1,9) In 2000, the total route of HSR networks was 17,500km, however, Japan, Germany, France have a 15,000km HSR network, which is 85% of the total. <Map1> HSR above 250 maximum speed (km/h)
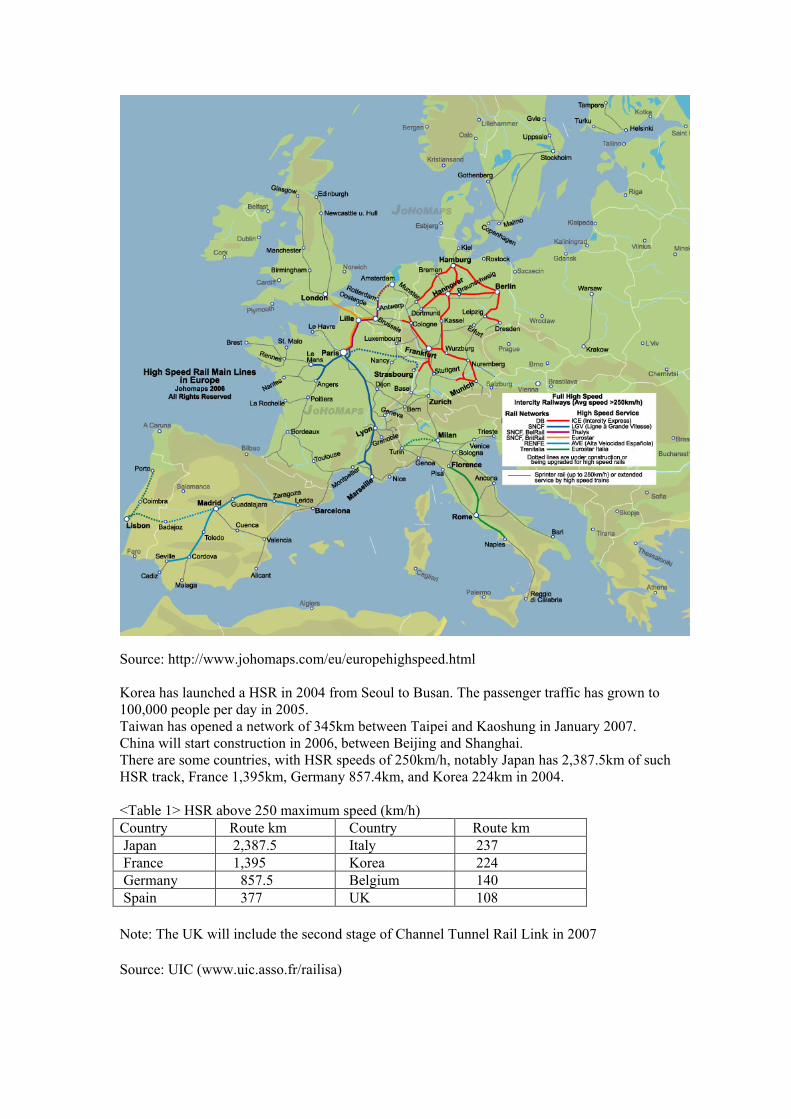
Source: http://www.johomaps.com/eu/europehighspeed.html Korea has launched a HSR in 2004 from Seoul to Busan. The passenger traffic has grown to 100,000 people per day in 2005. Taiwan has opened a network of 345km between Taipei and Kaoshung in January 2007. China will start construction in 2006, between Beijing and Shanghai. There are some countries, with HSR speeds of 250km/h, notably Japan has 2,387.5km of such HSR track, France 1,395km, Germany 857.4km, and Korea 224km in 2004. <Table 1> HSR above 250 maximum speed (km/h)
Country Route km Country Route km
Japan 2,387.5 Italy 237
France 1,395 Korea 224
Germany 857.5 Belgium 140
Spain 377 UK 108
Note: The UK will include the second stage of Channel Tunnel Rail Link in 2007
Source: UIC (www.uic.asso.fr/railisa)
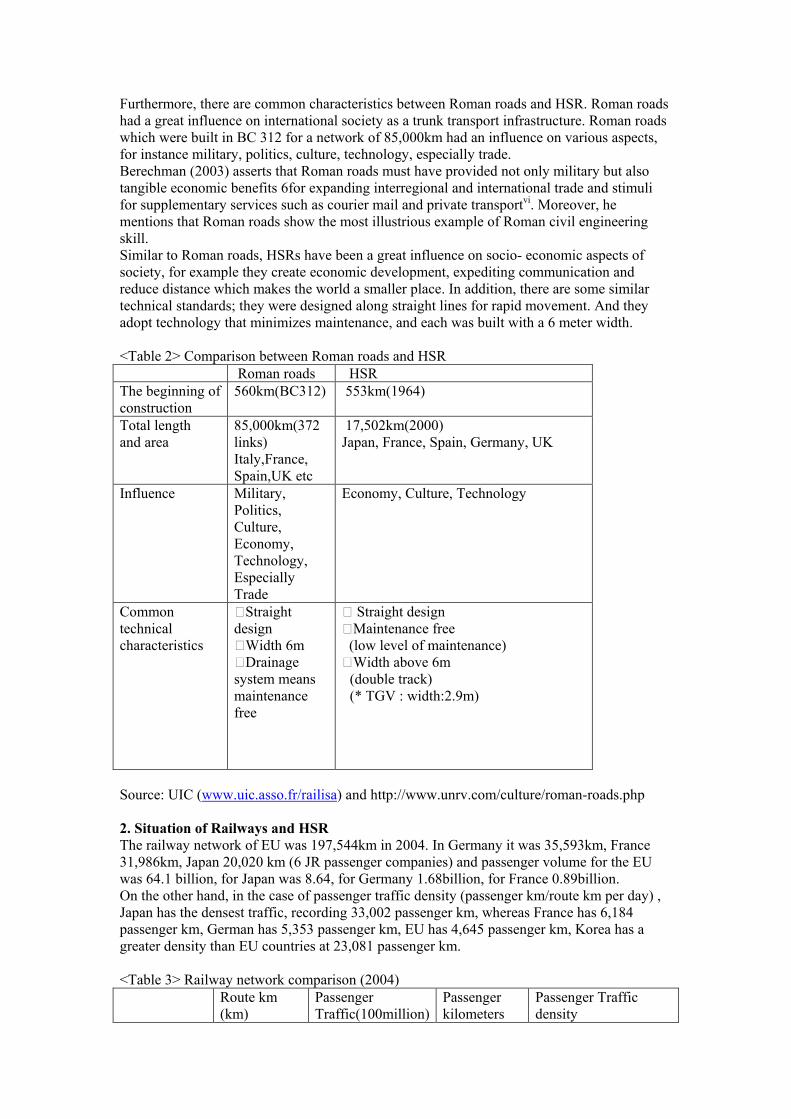
Furthermore, there are common characteristics between Roman roads and HSR. Roman roads had a great influence on international society as a trunk transport infrastructure. Roman roads which were built in BC 312 for a network of 85,000km had an influence on various aspects, for instance military, politics, culture, technology, especially trade. Berechman (2003) asserts that Roman roads must have provided not only military but also tangible economic benefits 6for expanding interregional and international trade and stimuli for supplementary services such as courier mail and private transportvi. Moreover, he mentions that Roman roads show the most illustrious example of Roman civil engineering skill. Similar to Roman roads, HSRs have been a great influence on socio- economic aspects of society, for example they create economic development, expediting communication and reduce distance which makes the world a smaller place. In addition, there are some similar technical standards; they were designed along straight lines for rapid movement. And they adopt technology that minimizes maintenance, and each was built with a 6 meter width. <Table 2> Comparison between Roman roads and HSR
Roman roads HSR
The beginning of construction
560km(BC312) 553km(1964)
Total length and area
85,000km(372 links) Italy,France, Spain,UK etc
17,502km(2000) Japan, France, Spain, Germany, UK
Influence Military, Politics, Culture, Economy, Technology, Especially Trade
Economy, Culture, Technology
Common technical characteristics
DStraight design DWidth 6m DDrainage system means maintenance free
D Straight design DMaintenance free (low level of maintenance) DWidth above 6m (double track) (* TGV : width:2.9m)
Source: UIC (www.uic.asso.fr/railisa) and http://www.unrv.com/culture/roman-roads.php 2. Situation of Railways and HSR
The railway network of EU was 197,544km in 2004. In Germany it was 35,593km, France 31,986km, Japan 20,020 km (6 JR passenger companies) and passenger volume for the EU was 64.1 billion, for Japan was 8.64, for Germany 1.68billion, for France 0.89billion. On the other hand, in the case of passenger traffic density (passenger km/route km per day) , Japan has the densest traffic, recording 33,002 passenger km, whereas France has 6,184 passenger km, German has 5,353 passenger km, EU has 4,645 passenger km, Korea has a greater density than EU countries at 23,081 passenger km. <Table 3> Railway network comparison (2004)
Route km (km)
Passenger Traffic(100million)
Passenger kilometers
Passenger Traffic density
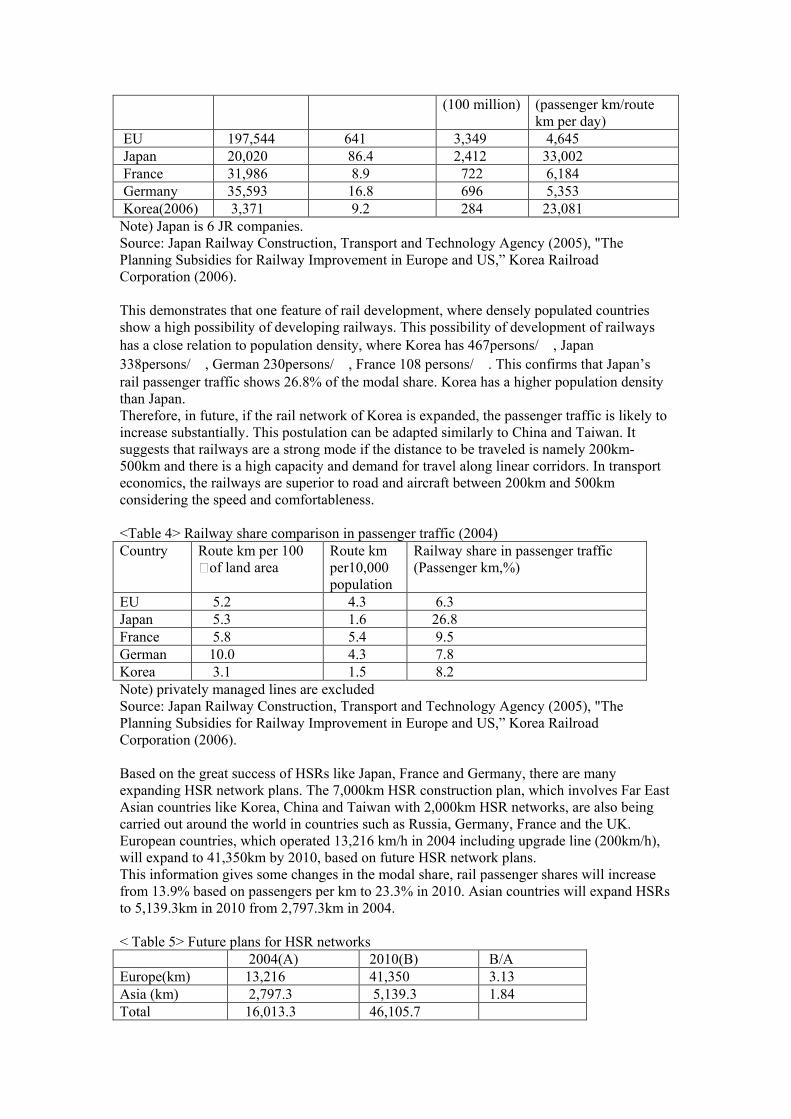
(100 million) (passenger km/route km per day)
EU 197,544 641 3,349 4,645
Japan 20,020 86.4 2,412 33,002
France 31,986 8.9 722 6,184
Germany 35,593 16.8 696 5,353
Korea(2006) 3,371 9.2 284 23,081
Note) Japan is 6 JR companies. Source: Japan Railway Construction, Transport and Technology Agency (2005), "The Planning Subsidies for Railway Improvement in Europe and US,” Korea Railroad Corporation (2006). This demonstrates that one feature of rail development, where densely populated countries show a high possibility of developing railways. This possibility of development of railways
has a close relation to population density, where Korea has 467persons/㎢, Japan
338persons/㎢, German 230persons/㎢, France 108 persons/㎢. This confirms that Japan’s rail passenger traffic shows 26.8% of the modal share. Korea has a higher population density than Japan. Therefore, in future, if the rail network of Korea is expanded, the passenger traffic is likely to increase substantially. This postulation can be adapted similarly to China and Taiwan. It suggests that railways are a strong mode if the distance to be traveled is namely 200km-500km and there is a high capacity and demand for travel along linear corridors. In transport economics, the railways are superior to road and aircraft between 200km and 500km considering the speed and comfortableness. <Table 4> Railway share comparison in passenger traffic (2004)
Country Route km per 100 Dof land area
Route km per10,000 population
Railway share in passenger traffic (Passenger km,%)
EU 5.2 4.3 6.3
Japan 5.3 1.6 26.8
France 5.8 5.4 9.5
German 10.0 4.3 7.8
Korea 3.1 1.5 8.2
Note) privately managed lines are excluded Source: Japan Railway Construction, Transport and Technology Agency (2005), "The Planning Subsidies for Railway Improvement in Europe and US,” Korea Railroad Corporation (2006). Based on the great success of HSRs like Japan, France and Germany, there are many expanding HSR network plans. The 7,000km HSR construction plan, which involves Far East Asian countries like Korea, China and Taiwan with 2,000km HSR networks, are also being carried out around the world in countries such as Russia, Germany, France and the UK. European countries, which operated 13,216 km/h in 2004 including upgrade line (200km/h), will expand to 41,350km by 2010, based on future HSR network plans. This information gives some changes in the modal share, rail passenger shares will increase from 13.9% based on passengers per km to 23.3% in 2010. Asian countries will expand HSRs to 5,139.3km in 2010 from 2,797.3km in 2004. < Table 5> Future plans for HSR networks
2004(A) 2010(B) B/A
Europe(km) 13,216 41,350 3.13
Asia (km) 2,797.3 5,139.3 1.84
Total 16,013.3 46,105.7
Source: UIC (www.uic.asso.fr/railisa)
ⅣⅣⅣⅣ. Development of HSR
1. Successful factors of HSR
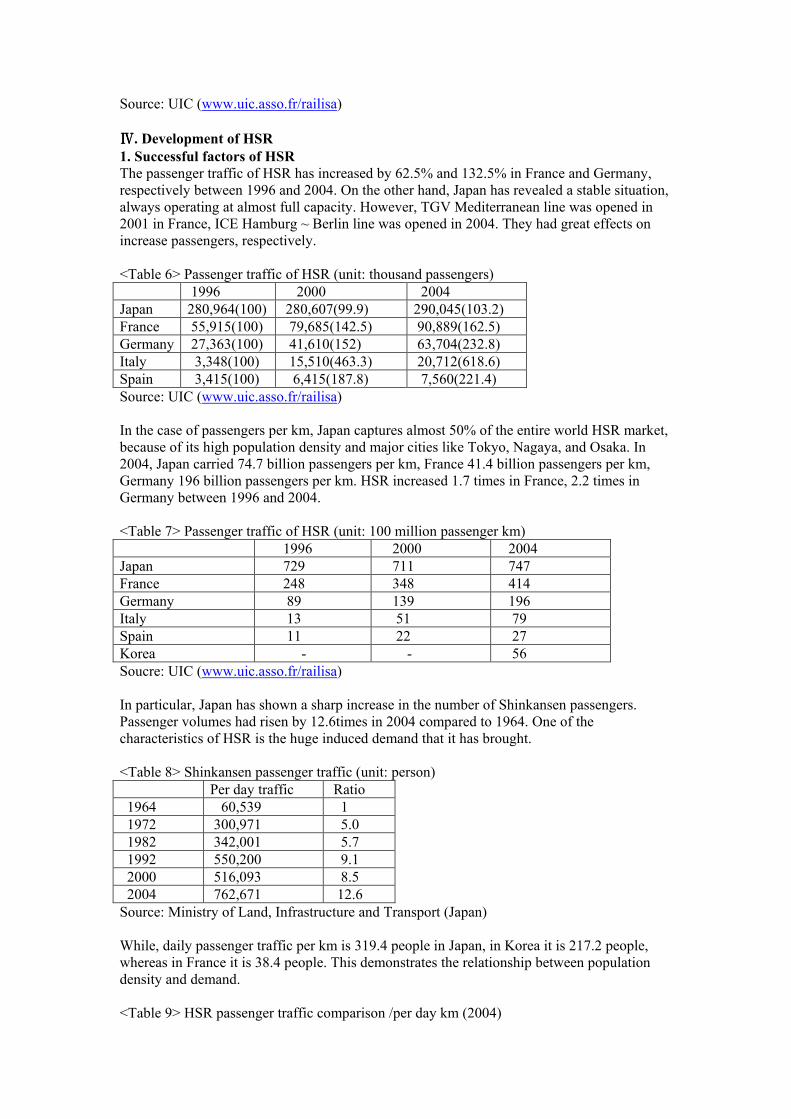
The passenger traffic of HSR has increased by 62.5% and 132.5% in France and Germany, respectively between 1996 and 2004. On the other hand, Japan has revealed a stable situation, always operating at almost full capacity. However, TGV Mediterranean line was opened in 2001 in France, ICE Hamburg ~ Berlin line was opened in 2004. They had great effects on increase passengers, respectively. <Table 6> Passenger traffic of HSR (unit: thousand passengers)
1996 2000 2004
Japan 280,964(100) 280,607(99.9) 290,045(103.2)
France 55,915(100) 79,685(142.5) 90,889(162.5)
Germany 27,363(100) 41,610(152) 63,704(232.8)
Italy 3,348(100) 15,510(463.3) 20,712(618.6)
Spain 3,415(100) 6,415(187.8) 7,560(221.4)
Source: UIC (www.uic.asso.fr/railisa) In the case of passengers per km, Japan captures almost 50% of the entire world HSR market, because of its high population density and major cities like Tokyo, Nagaya, and Osaka. In 2004, Japan carried 74.7 billion passengers per km, France 41.4 billion passengers per km, Germany 196 billion passengers per km. HSR increased 1.7 times in France, 2.2 times in Germany between 1996 and 2004. <Table 7> Passenger traffic of HSR (unit: 100 million passenger km)
1996 2000 2004
Japan 729 711 747
France 248 348 414
Germany 89 139 196
Italy 13 51 79
Spain 11 22 27
Korea - - 56
Soucre: UIC (www.uic.asso.fr/railisa) In particular, Japan has shown a sharp increase in the number of Shinkansen passengers. Passenger volumes had risen by 12.6times in 2004 compared to 1964. One of the characteristics of HSR is the huge induced demand that it has brought. <Table 8> Shinkansen passenger traffic (unit: person)
Per day traffic Ratio
1964 60,539 1
1972 300,971 5.0
1982 342,001 5.7
1992 550,200 9.1
2000 516,093 8.5
2004 762,671 12.6
Source: Ministry of Land, Infrastructure and Transport (Japan) While, daily passenger traffic per km is 319.4 people in Japan, in Korea it is 217.2 people, whereas in France it is 38.4 people. This demonstrates the relationship between population density and demand. <Table 9> HSR passenger traffic comparison /per day km (2004)
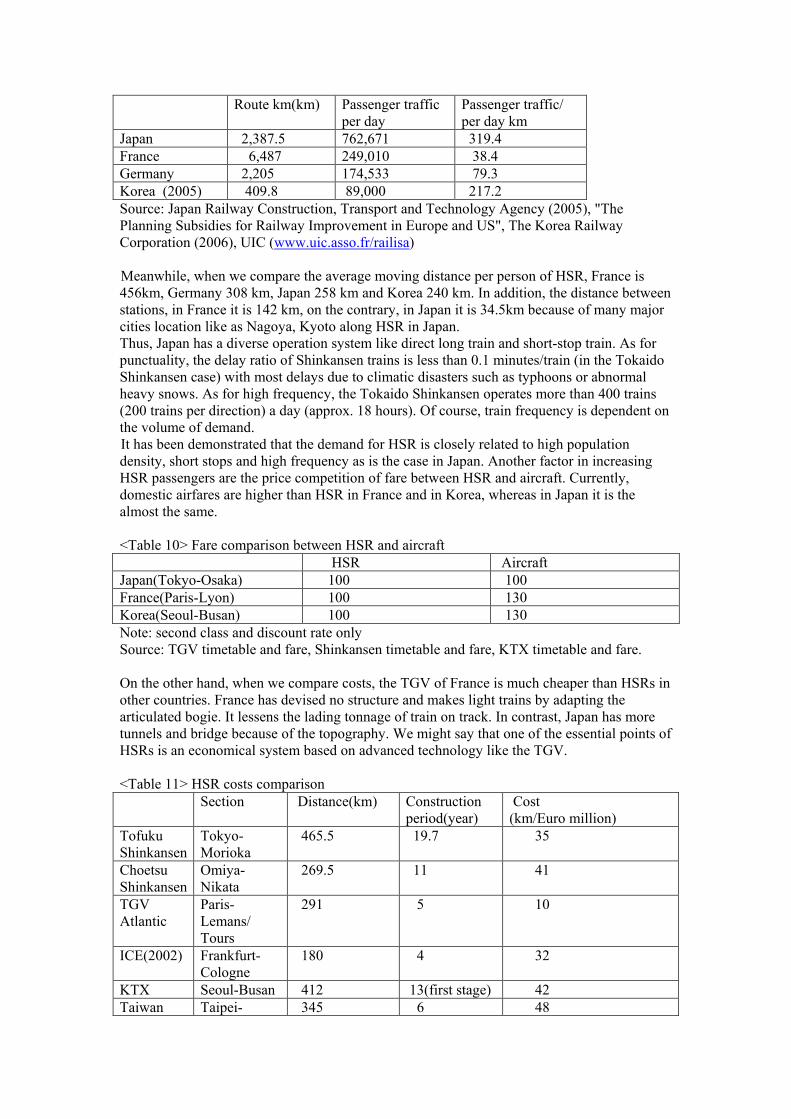
Route km(km) Passenger traffic per day
Passenger traffic/ per day km
Japan 2,387.5 762,671 319.4
France 6,487 249,010 38.4
Germany 2,205 174,533 79.3
Korea (2005) 409.8 89,000 217.2
Source: Japan Railway Construction, Transport and Technology Agency (2005), "The Planning Subsidies for Railway Improvement in Europe and US", The Korea Railway Corporation (2006), UIC (www.uic.asso.fr/railisa) Meanwhile, when we compare the average moving distance per person of HSR, France is 456km, Germany 308 km, Japan 258 km and Korea 240 km. In addition, the distance between stations, in France it is 142 km, on the contrary, in Japan it is 34.5km because of many major cities location like as Nagoya, Kyoto along HSR in Japan. Thus, Japan has a diverse operation system like direct long train and short-stop train. As for punctuality, the delay ratio of Shinkansen trains is less than 0.1 minutes/train (in the Tokaido Shinkansen case) with most delays due to climatic disasters such as typhoons or abnormal heavy snows. As for high frequency, the Tokaido Shinkansen operates more than 400 trains (200 trains per direction) a day (approx. 18 hours). Of course, train frequency is dependent on the volume of demand. It has been demonstrated that the demand for HSR is closely related to high population density, short stops and high frequency as is the case in Japan. Another factor in increasing HSR passengers are the price competition of fare between HSR and aircraft. Currently, domestic airfares are higher than HSR in France and in Korea, whereas in Japan it is the almost the same. <Table 10> Fare comparison between HSR and aircraft
HSR Aircraft
Japan(Tokyo-Osaka) 100 100
France(Paris-Lyon) 100 130
Korea(Seoul-Busan) 100 130
Note: second class and discount rate only Source: TGV timetable and fare, Shinkansen timetable and fare, KTX timetable and fare. On the other hand, when we compare costs, the TGV of France is much cheaper than HSRs in other countries. France has devised no structure and makes light trains by adapting the articulated bogie. It lessens the lading tonnage of train on track. In contrast, Japan has more tunnels and bridge because of the topography. We might say that one of the essential points of HSRs is an economical system based on advanced technology like the TGV. <Table 11> HSR costs comparison
Section Distance(km) Construction period(year)
Cost (km/Euro million)
Tofuku Shinkansen
Tokyo- Morioka
465.5 19.7 35
Choetsu Shinkansen
Omiya-Nikata
269.5 11 41
TGV Atlantic
Paris-Lemans/ Tours
291 5 10
ICE(2002) Frankfurt- Cologne
180 4 32
KTX Seoul-Busan 412 13(first stage) 42
Taiwan Taipei- 345 6 48
Kaoshung
Source: Ministry of Land, Infrastructure and Transport (Japan), Korea Railroad Corporation (2006), Commission for Integrated Transport (2004).
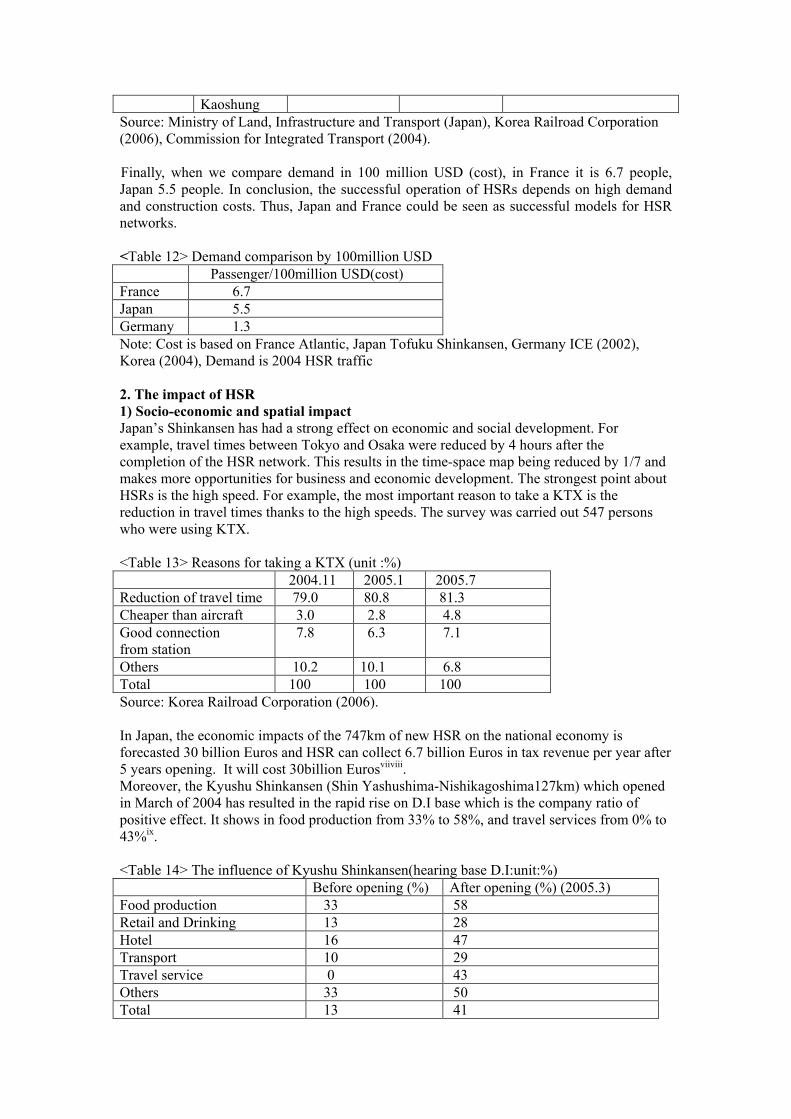
Finally, when we compare demand in 100 million USD (cost), in France it is 6.7 people, Japan 5.5 people. In conclusion, the successful operation of HSRs depends on high demand and construction costs. Thus, Japan and France could be seen as successful models for HSR networks. <Table 12> Demand comparison by 100million USD
Passenger/100million USD(cost)
France 6.7
Japan 5.5
Germany 1.3
Note: Cost is based on France Atlantic, Japan Tofuku Shinkansen, Germany ICE (2002), Korea (2004), Demand is 2004 HSR traffic 2. The impact of HSR
1) Socio-economic and spatial impact
Japan’s Shinkansen has had a strong effect on economic and social development. For example, travel times between Tokyo and Osaka were reduced by 4 hours after the completion of the HSR network. This results in the time-space map being reduced by 1/7 and makes more opportunities for business and economic development. The strongest point about HSRs is the high speed. For example, the most important reason to take a KTX is the reduction in travel times thanks to the high speeds. The survey was carried out 547 persons who were using KTX. <Table 13> Reasons for taking a KTX (unit :%)
2004.11 2005.1 2005.7
Reduction of travel time 79.0 80.8 81.3
Cheaper than aircraft 3.0 2.8 4.8
Good connection from station
7.8 6.3 7.1
Others 10.2 10.1 6.8
Total 100 100 100
Source: Korea Railroad Corporation (2006). In Japan, the economic impacts of the 747km of new HSR on the national economy is forecasted 30 billion Euros and HSR can collect 6.7 billion Euros in tax revenue per year after 5 years opening. It will cost 30billion Eurosviiviii. Moreover, the Kyushu Shinkansen (Shin Yashushima-Nishikagoshima127km) which opened in March of 2004 has resulted in the rapid rise on D.I base which is the company ratio of positive effect. It shows in food production from 33% to 58%, and travel services from 0% to 43%ix. <Table 14> The influence of Kyushu Shinkansen(hearing base D.I:unit:%)
Before opening (%) After opening (%) (2005.3)
Food production 33 58
Retail and Drinking 13 28
Hotel 16 47
Transport 10 29
Travel service 0 43
Others 33 50
Total 13 41
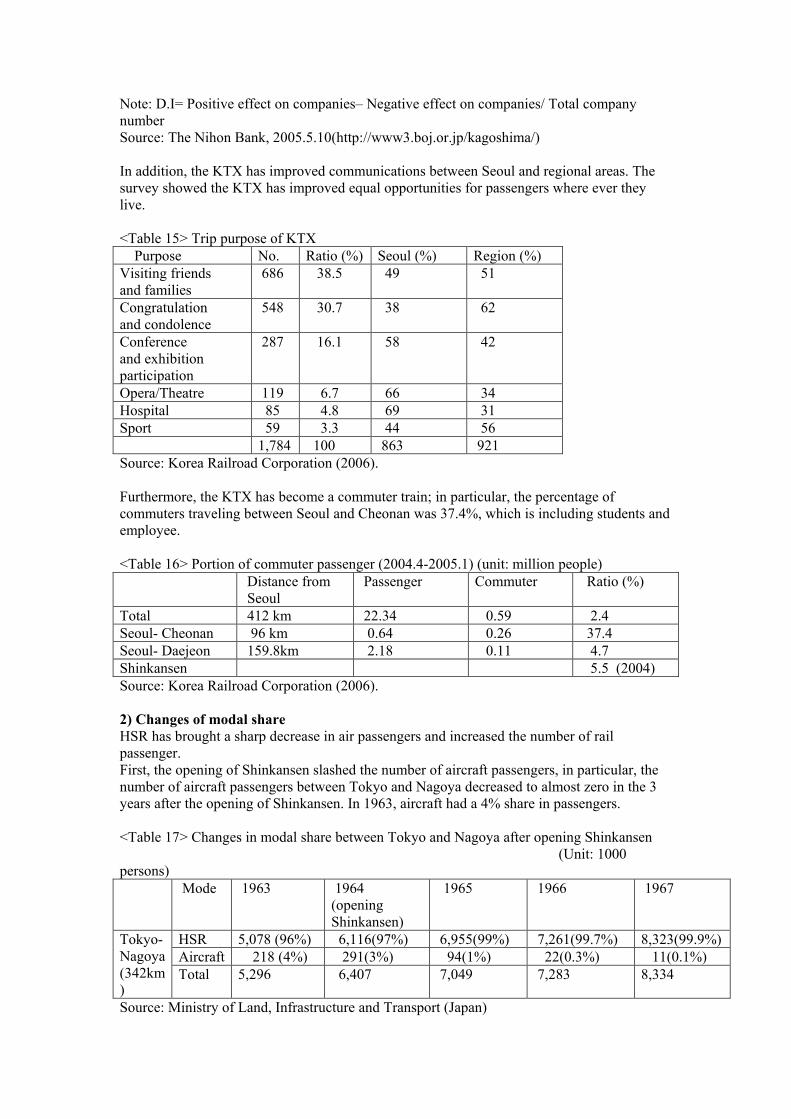
Note: D.I= Positive effect on companies– Negative effect on companies/ Total company number Source: The Nihon Bank, 2005.5.10(http://www3.boj.or.jp/kagoshima/) In addition, the KTX has improved communications between Seoul and regional areas. The survey showed the KTX has improved equal opportunities for passengers where ever they live. <Table 15> Trip purpose of KTX
Purpose No. Ratio (%) Seoul (%) Region (%)
Visiting friends and families
686 38.5 49 51
Congratulation and condolence
548 30.7 38 62
Conference and exhibition participation
287 16.1 58 42
Opera/Theatre 119 6.7 66 34
Hospital 85 4.8 69 31
Sport 59 3.3 44 56
1,784 100 863 921
Source: Korea Railroad Corporation (2006). Furthermore, the KTX has become a commuter train; in particular, the percentage of commuters traveling between Seoul and Cheonan was 37.4%, which is including students and employee. <Table 16> Portion of commuter passenger (2004.4-2005.1) (unit: million people)
Distance from Seoul
Passenger Commuter Ratio (%)
Total 412 km 22.34 0.59 2.4
Seoul- Cheonan 96 km 0.64 0.26 37.4
Seoul- Daejeon 159.8km 2.18 0.11 4.7
Shinkansen 5.5 (2004)
Source: Korea Railroad Corporation (2006). 2) Changes of modal share
HSR has brought a sharp decrease in air passengers and increased the number of rail passenger. First, the opening of Shinkansen slashed the number of aircraft passengers, in particular, the number of aircraft passengers between Tokyo and Nagoya decreased to almost zero in the 3 years after the opening of Shinkansen. In 1963, aircraft had a 4% share in passengers. <Table 17> Changes in modal share between Tokyo and Nagoya after opening Shinkansen
(Unit: 1000 persons)
Mode 1963 1964 (opening Shinkansen)
1965 1966 1967
HSR 5,078 (96%) 6,116(97%) 6,955(99%) 7,261(99.7%) 8,323(99.9%)
Aircraft 218 (4%) 291(3%) 94(1%) 22(0.3%) 11(0.1%)
Tokyo- Nagoya (342km )
Total 5,296 6,407 7,049 7,283 8,334
Source: Ministry of Land, Infrastructure and Transport (Japan)
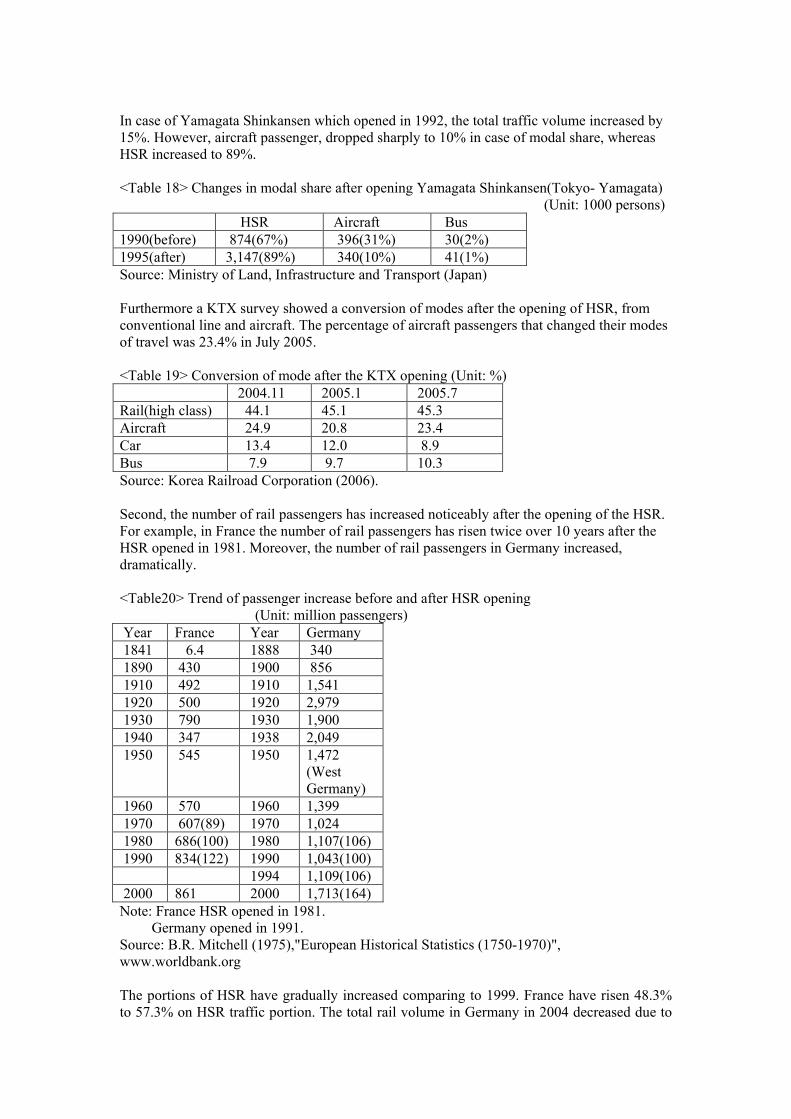
In case of Yamagata Shinkansen which opened in 1992, the total traffic volume increased by 15%. However, aircraft passenger, dropped sharply to 10% in case of modal share, whereas HSR increased to 89%. <Table 18> Changes in modal share after opening Yamagata Shinkansen(Tokyo- Yamagata)
(Unit: 1000 persons)
HSR Aircraft Bus
1990(before) 874(67%) 396(31%) 30(2%)
1995(after) 3,147(89%) 340(10%) 41(1%)
Source: Ministry of Land, Infrastructure and Transport (Japan) Furthermore a KTX survey showed a conversion of modes after the opening of HSR, from conventional line and aircraft. The percentage of aircraft passengers that changed their modes of travel was 23.4% in July 2005. <Table 19> Conversion of mode after the KTX opening (Unit: %)
2004.11 2005.1 2005.7
Rail(high class) 44.1 45.1 45.3
Aircraft 24.9 20.8 23.4
Car 13.4 12.0 8.9
Bus 7.9 9.7 10.3
Source: Korea Railroad Corporation (2006). Second, the number of rail passengers has increased noticeably after the opening of the HSR. For example, in France the number of rail passengers has risen twice over 10 years after the HSR opened in 1981. Moreover, the number of rail passengers in Germany increased, dramatically. <Table20> Trend of passenger increase before and after HSR opening (Unit: million passengers)
Year France Year Germany
1841 6.4 1888 340
1890 430 1900 856
1910 492 1910 1,541
1920 500 1920 2,979
1930 790 1930 1,900
1940 347 1938 2,049
1950 545 1950 1,472 (West Germany)
1960 570 1960 1,399
1970 607(89) 1970 1,024
1980 686(100) 1980 1,107(106)
1990 834(122) 1990 1,043(100)
1994 1,109(106)
2000 861 2000 1,713(164)
Note: France HSR opened in 1981. Germany opened in 1991.
Source: B.R. Mitchell (1975),"European Historical Statistics (1750-1970)", www.worldbank.org The portions of HSR have gradually increased comparing to 1999. France have risen 48.3% to 57.3% on HSR traffic portion. The total rail volume in Germany in 2004 decreased due to
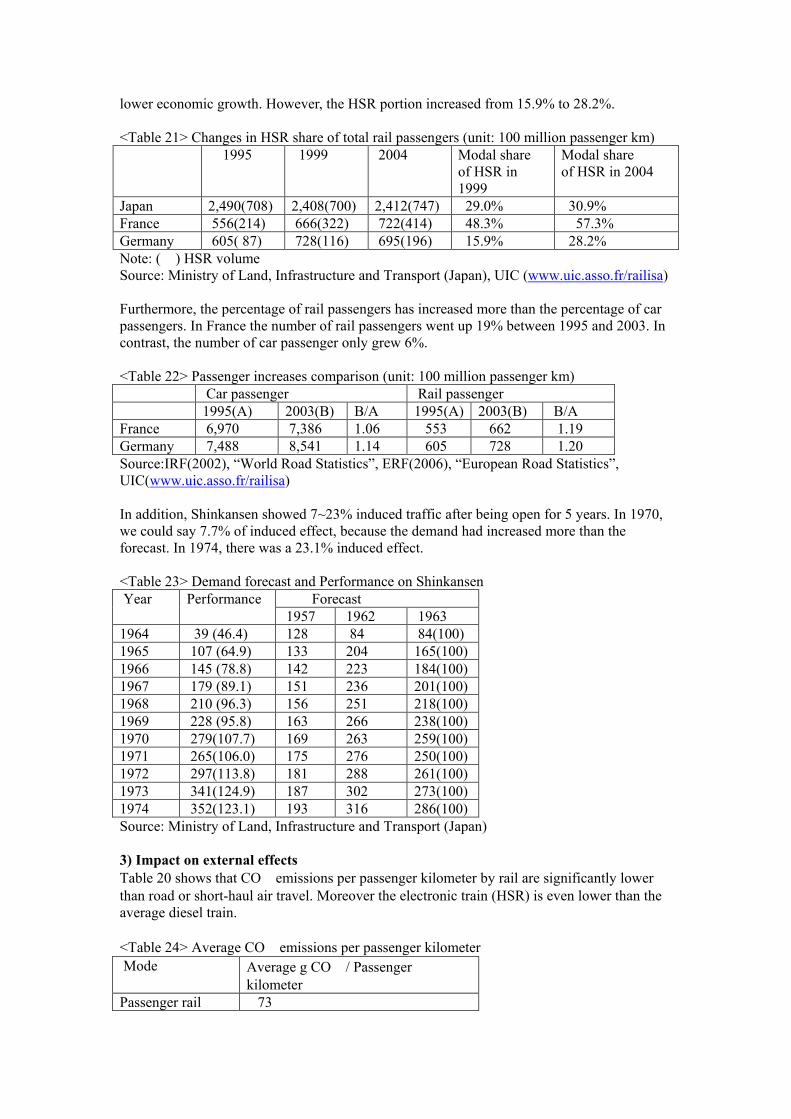
lower economic growth. However, the HSR portion increased from 15.9% to 28.2%. <Table 21> Changes in HSR share of total rail passengers (unit: 100 million passenger km)
1995 1999 2004 Modal share of HSR in 1999
Modal share of HSR in 2004
Japan 2,490(708) 2,408(700) 2,412(747) 29.0% 30.9%
France 556(214) 666(322) 722(414) 48.3% 57.3%
Germany 605( 87) 728(116) 695(196) 15.9% 28.2%
Note: ( ) HSR volume Source: Ministry of Land, Infrastructure and Transport (Japan), UIC (www.uic.asso.fr/railisa) Furthermore, the percentage of rail passengers has increased more than the percentage of car passengers. In France the number of rail passengers went up 19% between 1995 and 2003. In contrast, the number of car passenger only grew 6%. <Table 22> Passenger increases comparison (unit: 100 million passenger km)
Car passenger Rail passenger
1995(A) 2003(B) B/A 1995(A) 2003(B) B/A
France 6,970 7,386 1.06 553 662 1.19
Germany 7,488 8,541 1.14 605 728 1.20
Source:IRF(2002), “World Road Statistics”, ERF(2006), “European Road Statistics”, UIC(www.uic.asso.fr/railisa) In addition, Shinkansen showed 7~23% induced traffic after being open for 5 years. In 1970, we could say 7.7% of induced effect, because the demand had increased more than the forecast. In 1974, there was a 23.1% induced effect. <Table 23> Demand forecast and Performance on Shinkansen
Forecast Year Performance
1957 1962 1963
1964 39 (46.4) 128 84 84(100)
1965 107 (64.9) 133 204 165(100)
1966 145 (78.8) 142 223 184(100)
1967 179 (89.1) 151 236 201(100)
1968 210 (96.3) 156 251 218(100)
1969 228 (95.8) 163 266 238(100)
1970 279(107.7) 169 263 259(100)
1971 265(106.0) 175 276 250(100)
1972 297(113.8) 181 288 261(100)
1973 341(124.9) 187 302 273(100)
1974 352(123.1) 193 316 286(100)
Source: Ministry of Land, Infrastructure and Transport (Japan) 3) Impact on external effects
Table 20 shows that CO㎢emissions per passenger kilometer by rail are significantly lower than road or short-haul air travel. Moreover the electronic train (HSR) is even lower than the average diesel train.
<Table 24> Average CO㎢emissions per passenger kilometer
Mode Average g CO㎢/ Passenger kilometer
Passenger rail 73
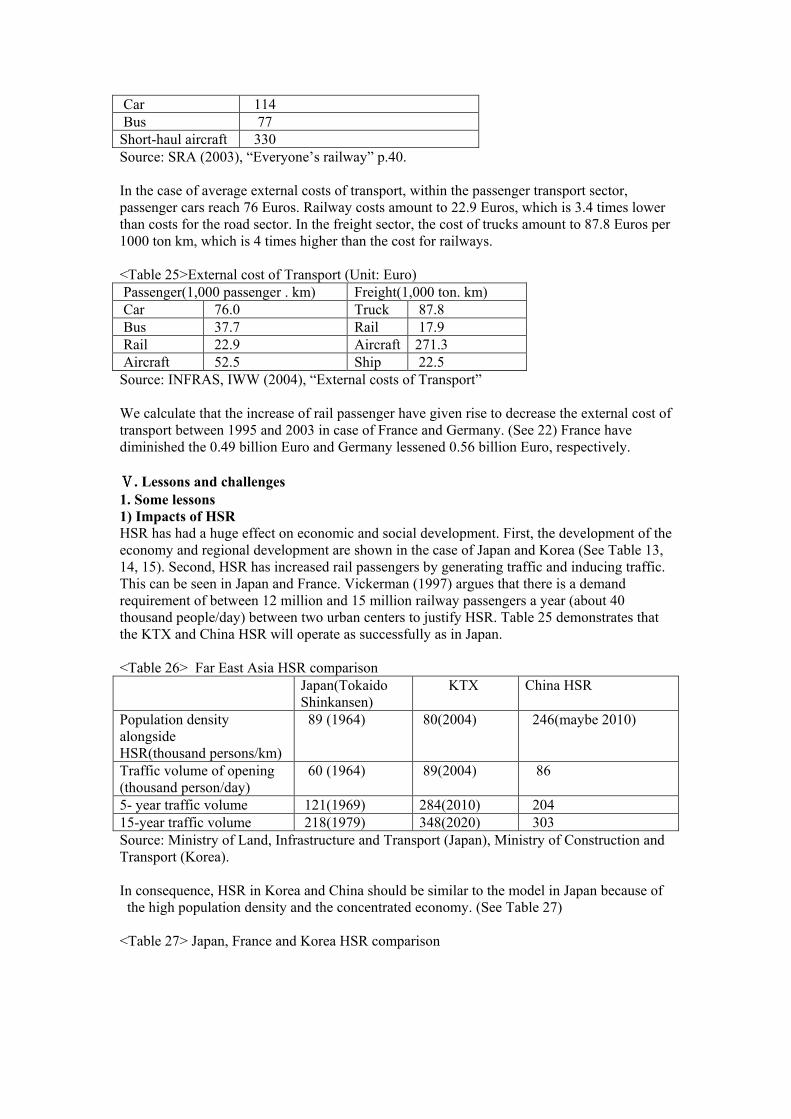
Car 114
Bus 77
Short-haul aircraft 330
Source: SRA (2003), “Everyone’s railway” p.40. In the case of average external costs of transport, within the passenger transport sector, passenger cars reach 76 Euros. Railway costs amount to 22.9 Euros, which is 3.4 times lower than costs for the road sector. In the freight sector, the cost of trucks amount to 87.8 Euros per 1000 ton km, which is 4 times higher than the cost for railways. <Table 25>External cost of Transport (Unit: Euro)
Passenger(1,000 passenger . km) Freight(1,000 ton. km)
Car 76.0 Truck 87.8
Bus 37.7 Rail 17.9
Rail 22.9 Aircraft 271.3
Aircraft 52.5 Ship 22.5
Source: INFRAS, IWW (2004), “External costs of Transport”
We calculate that the increase of rail passenger have given rise to decrease the external cost of transport between 1995 and 2003 in case of France and Germany. (See 22) France have diminished the 0.49 billion Euro and Germany lessened 0.56 billion Euro, respectively.
ⅤⅤⅤⅤ. Lessons and challenges
1. Some lessons
1) Impacts of HSR
HSR has had a huge effect on economic and social development. First, the development of the economy and regional development are shown in the case of Japan and Korea (See Table 13, 14, 15). Second, HSR has increased rail passengers by generating traffic and inducing traffic. This can be seen in Japan and France. Vickerman (1997) argues that there is a demand requirement of between 12 million and 15 million railway passengers a year (about 40 thousand people/day) between two urban centers to justify HSR. Table 25 demonstrates that the KTX and China HSR will operate as successfully as in Japan. <Table 26> Far East Asia HSR comparison
Japan(Tokaido Shinkansen)
KTX China HSR
Population density alongside HSR(thousand persons/km)
89 (1964) 80(2004) 246(maybe 2010)
Traffic volume of opening (thousand person/day)
60 (1964) 89(2004) 86
5- year traffic volume 121(1969) 284(2010) 204
15-year traffic volume 218(1979) 348(2020) 303
Source: Ministry of Land, Infrastructure and Transport (Japan), Ministry of Construction and Transport (Korea). In consequence, HSR in Korea and China should be similar to the model in Japan because of the high population density and the concentrated economy. (See Table 27) <Table 27> Japan, France and Korea HSR comparison
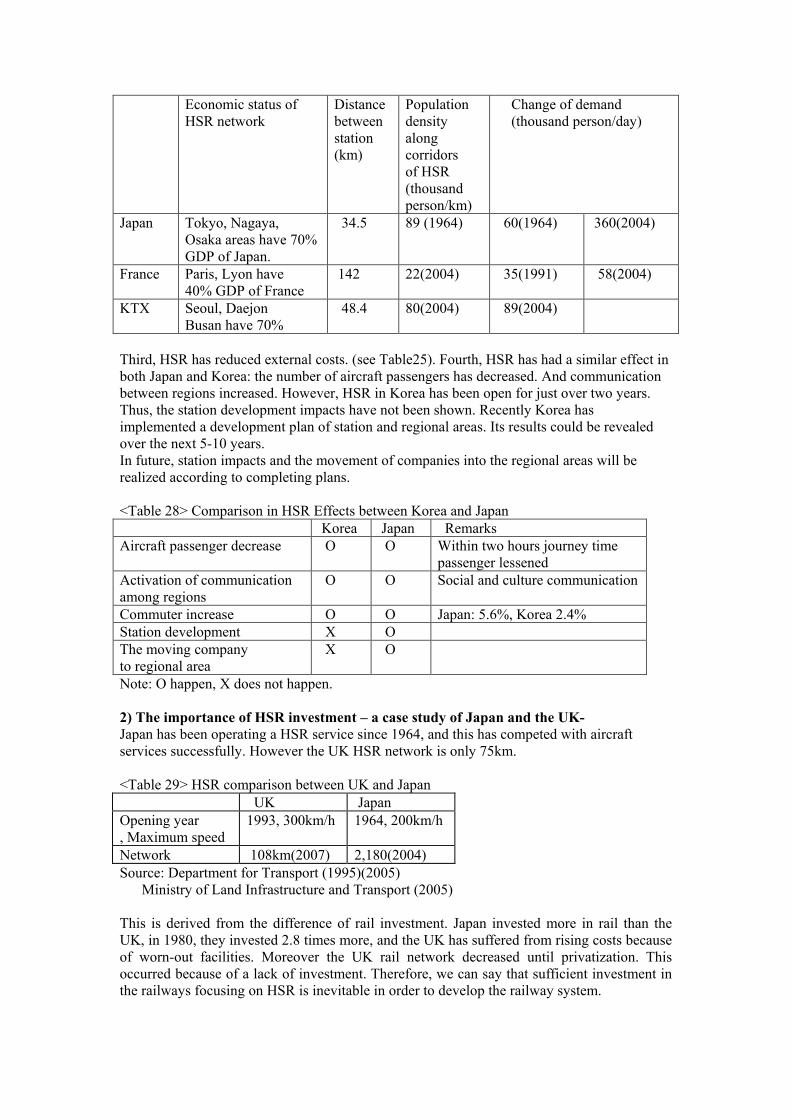
Economic status of HSR network
Distance between station (km)
Population density along corridors of HSR (thousand person/km)
Change of demand (thousand person/day)
Japan
Tokyo, Nagaya, Osaka areas have 70% GDP of Japan.
34.5 89 (1964) 60(1964) 360(2004)
France
Paris, Lyon have 40% GDP of France
142 22(2004) 35(1991) 58(2004)
KTX Seoul, Daejon Busan have 70%
48.4 80(2004) 89(2004)
Third, HSR has reduced external costs. (see Table25). Fourth, HSR has had a similar effect in both Japan and Korea: the number of aircraft passengers has decreased. And communication between regions increased. However, HSR in Korea has been open for just over two years. Thus, the station development impacts have not been shown. Recently Korea has implemented a development plan of station and regional areas. Its results could be revealed over the next 5-10 years. In future, station impacts and the movement of companies into the regional areas will be realized according to completing plans. <Table 28> Comparison in HSR Effects between Korea and Japan
Korea Japan Remarks
Aircraft passenger decrease O O Within two hours journey time passenger lessened
Activation of communication among regions
O O Social and culture communication
Commuter increase O O Japan: 5.6%, Korea 2.4%
Station development X O
The moving company to regional area
X O
Note: O happen, X does not happen. 2) The importance of HSR investment – a case study of Japan and the UK-
Japan has been operating a HSR service since 1964, and this has competed with aircraft services successfully. However the UK HSR network is only 75km. <Table 29> HSR comparison between UK and Japan
UK Japan
Opening year , Maximum speed
1993, 300km/h 1964, 200km/h
Network 108km(2007) 2,180(2004)
Source: Department for Transport (1995)(2005) Ministry of Land Infrastructure and Transport (2005) This is derived from the difference of rail investment. Japan invested more in rail than the UK, in 1980, they invested 2.8 times more, and the UK has suffered from rising costs because of worn-out facilities. Moreover the UK rail network decreased until privatization. This occurred because of a lack of investment. Therefore, we can say that sufficient investment in the railways focusing on HSR is inevitable in order to develop the railway system.

<Table 30> Investment comparison between UK and Japan railways
UK (A)($m.) Japan (B) ($m.) B/A
1960 5,250 886 0.2
1970 1,500 3,574 2.4
1980 2,501 7,086 2.8
1990 1,771 4,628 2.6
2000 7,284 5,362 0.7
Note: £=exchange rate at that time, PPP is converted in 1980,1990 and 2000
Source: Department for Transport (1995) (2005) Ministry of Transport (1987) <Table 31> Networks comparison in UK and Japan railways
The UK(km) Japan(km) Remarks
1825 43
1872 21,558 29
1900 30,079 6,202 Include private rail
1960 29,579 27,909 Include private rail
Before privatization
16,700(1994) 27,900(1986) Include private rail
Source: Department for Transport (1995)(2005) Ministry of Land Infrastructure and Transport (2001) Historically, the railways in the UK had a great impact on economic and social development during the nineteenth and early twentieth-centuries. Passenger volume and freight volume helped develop British railways. Table 31 and Table 32 show the railway development in the UK. However, as I mentioned, the lack of rail investment and underdevelopment of HSR made rail development sluggish. <Table 32>Passenger volume comparison (unit: million persons)
UK France Germany
1861 163 62 -
1911 1,296 494 1,643
Source: B.R. Mitchell (1975),"European Historical Statistics (1750-1970)". <Table 33>Freight volume comparison (unit: thousand tons)
UK France Germany
1861 94,046 27,900 -
1911 525,256 121,000 616,772
Source: B.R. Mitchell (1975),"European Historical Statistics (1750-1970)". 2. Challenges
1) Fund
The TEN (Trans- European Networks), which was carrying out by Maastricht treaty in 1993, was planned to induce the economic development and the solution of the gap of region throughout the HSR. The trans-European transport network (TEN-T) plays a crucial role in securing the free movement of passengers and goods in the European Union. It includes all modes of transport and carries about half of all freight and passenger movements. By 2020, TEN-T will include 89,500 km of roads and 94,000 km of railways, including around 20,000 km of HSR network suitable for speeds of at least 200 km/h. In 2004, the total cost of completing the 30 priority axes by 2020 was estimated at EUR 225 billion, including EUR 112 billion to complete the 14 original projects. However, the remainder cost has to be provided in future. Some ways are driven. For example, the Structural and Cohesion Funds has been provided TEN-T
infrastructure projects in specific regions. In the period 2000–06, these funds will have contributed around EUR 20 billion to TEN-T projects. Furthermore, the European Investment Bank (EIB) has lent around EUR 50 billion to Member States for TEN-T projects over the past decade. In the years up to 2010, it expects to be able to lend the same scale again for TEN-T projects. <Table 34> TEN (Trans-European transport network) plans
Content
Total Route 30 lines, rail network is 22 lines , 21,180km HSR network until 2020.
Cost 225billion Euro
Until 2003 cost 40billion Euro, 3 line complete
Future plan Focused on priority line
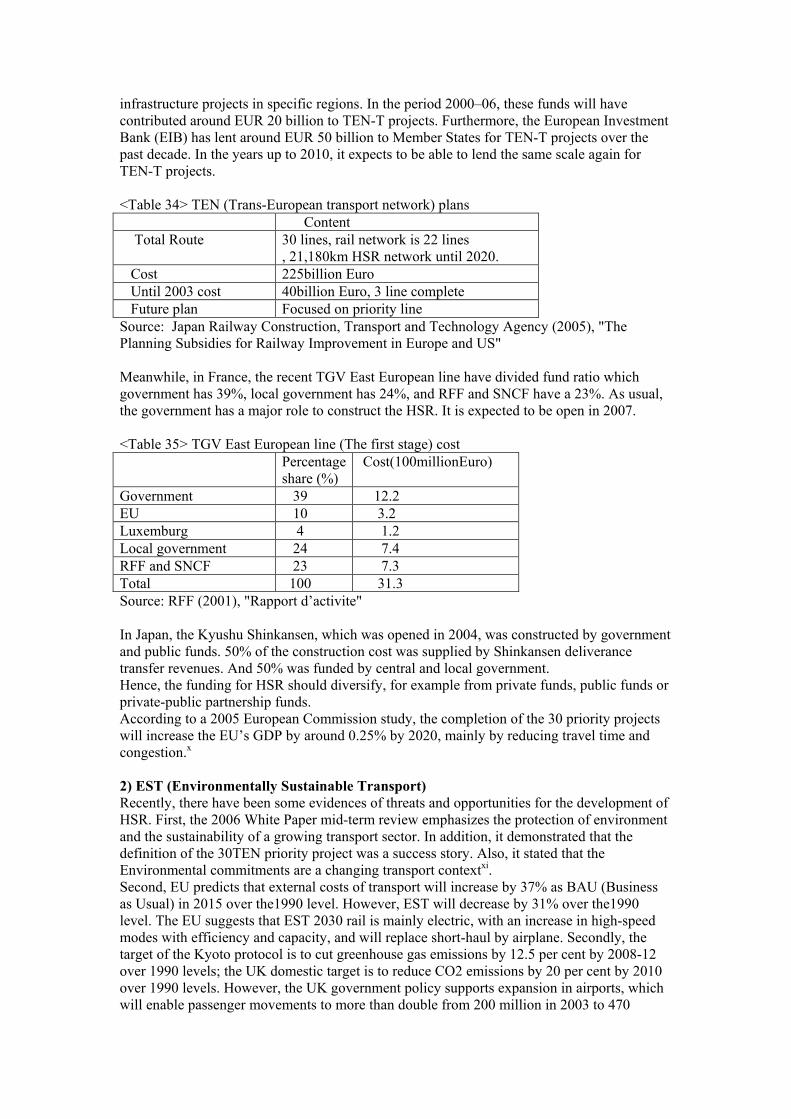
Source: Japan Railway Construction, Transport and Technology Agency (2005), "The Planning Subsidies for Railway Improvement in Europe and US" Meanwhile, in France, the recent TGV East European line have divided fund ratio which government has 39%, local government has 24%, and RFF and SNCF have a 23%. As usual, the government has a major role to construct the HSR. It is expected to be open in 2007. <Table 35> TGV East European line (The first stage) cost
Percentage share (%)
Cost(100millionEuro)
Government 39 12.2
EU 10 3.2
Luxemburg 4 1.2
Local government 24 7.4
RFF and SNCF 23 7.3
Total 100 31.3
Source: RFF (2001), "Rapport d’activite" In Japan, the Kyushu Shinkansen, which was opened in 2004, was constructed by government and public funds. 50% of the construction cost was supplied by Shinkansen deliverance transfer revenues. And 50% was funded by central and local government. Hence, the funding for HSR should diversify, for example from private funds, public funds or private-public partnership funds. According to a 2005 European Commission study, the completion of the 30 priority projects will increase the EU’s GDP by around 0.25% by 2020, mainly by reducing travel time and congestion.x 2) EST (Environmentally Sustainable Transport)
Recently, there have been some evidences of threats and opportunities for the development of HSR. First, the 2006 White Paper mid-term review emphasizes the protection of environment and the sustainability of a growing transport sector. In addition, it demonstrated that the definition of the 30TEN priority project was a success story. Also, it stated that the Environmental commitments are a changing transport contextxi. Second, EU predicts that external costs of transport will increase by 37% as BAU (Business as Usual) in 2015 over the1990 level. However, EST will decrease by 31% over the1990 level. The EU suggests that EST 2030 rail is mainly electric, with an increase in high-speed modes with efficiency and capacity, and will replace short-haul by airplane. Secondly, the target of the Kyoto protocol is to cut greenhouse gas emissions by 12.5 per cent by 2008-12 over 1990 levels; the UK domestic target is to reduce CO2 emissions by 20 per cent by 2010 over 1990 levels. However, the UK government policy supports expansion in airports, which will enable passenger movements to more than double from 200 million in 2003 to 470

million by 2030. The increase in demand derives from the low price of air travel. This controversial policy means that UK domestic targets to reduce CO2 emissions will not be met. Climate change targets aim to reduce the carbon dioxide emissions by 60% by 2050xii which will also not be accomplished without controlling demand. Finally, Stern claims that if we do not act, the overall costs and risks of climate change will be equivalent to the loss of at least 5% of annual global GDP from the present time onwards. In contrast, the cost of action can be limited to around 1% of global GDP each year. Stern suggests that action is needed to reduce global emissions including in the transport sectorxiii. The main issues are curbing car use and increasing public transport, with an emphasis on railways.
ⅥⅥⅥⅥ. Conclusion
Since 1964, HSR, which was opened in Japan, has been a huge impact in the world. Historically, HSR has similar characteristics with Roman Road, which promoted the rapid movement and had a great influence to international society as a trunk transport infrastructure. Recently the development of HSR has become more rapid because of economic, environmental and external impacts, emphasizing Environmentally Sustainable Transport(EST). Especially the external cost is become more important factor to justify the HSR. Actually, Korea has started the new HSR which is 230.9km (West line) in 2006. It will be opened in 2017. In addition, Korea is planning the new line which is running from West coast to East coast. The successful factors of HSR are high population density and cost minimized construction. There are two successful HSR models which are Japan and French model. The former is more demand oriented operation and the latter is focusing on minimizing cost. In future, Korea, Taiwan and China HSR will be shown the Japan’s successful model because of high population density and concentration of economy along lines. This paper supports that Vickerman’s argument which HSR is to justified the requirement for demand of between 12million and 15 million railway passenger a year (about 40thousand persons/day) between two urban centers. It is proved the Korea and coming Taiwan and China. Finally, this paper reviews that HSR is the 250km/h for dedicated new lines and 200km/h for upgraded lines in respect of the infrastructure capabilities, which has merited high population density and cost minimizing technology. <Reference> Banister D. and Berechman J. (2000), Transport Investment and Economic Development, UCL Press, p.19 Berechman J. (2003), Transportation-economic aspects of Roman highway development: the case of Via Appia, Transportation Research Part a 37(2003), pp.453-478 Cairns S & Newson C. (2006), Predict and decide, Environmental Change Institute University of Oxford
European Commission (2005), the economics cost of non-Lisbon, Occasional Paper, No.16 European Commission (2006), Sustainable mobility for our continent: Mid-term review of the European Commission’s 2001 White Paper on Transport
ERF (2006), European Road Statistics
Givoni M. (2006), Development and impact of the Modern High-Speed Train: A Review,
Transport Review, Vol.26, No.5, pp.593-611
Hiraishi KA (2002), Shinkansen and Regional Development, Kotsu Shinbung, p.92
INFRAS, IWW (2004), External costs of Transport
IRF (2002), World Road Statistics Ishikawa (1985), the Regional Adaptation of High-Speed Rail System, the Annuals of City Studies of Japan Vol18

Japan Railway Construction, Transport and Technology Agency (2005), The Planning
Subsidies for Railway Improvement in Europe and US.
Michell BR (1975), European Historical Statistics1870-1970, London Macmillan The Nihon Bank, 2005.5.10(http://www3.boj.or.jp/kagoshima/) Vickerman RW (1997), High-speed rail in Europe: experience and issues for future development, The Annals of Regional Science31, pp21-38.
Vickerman RW (2001), Transport and Economic Development, ECMT Roundtable Sands,BD (1993), The Development Effects of High –Speed Rail Stations and Implication for California, California high speed rail series working paper, pp.19-20
Sands,BD (1993), The development effect of high-speed rail stations and implications for
Japan, Built Environement,19(3/4),pp.257-284
Stern N. (2006), the Economics of Climate Change, Cabinet Office-HM Treasury
SRA (2003), "Everyone's railway" p.22
www.uic.asso.fr.
www.mlit.go.jp.
i Vickerman,1997,pp21-38 ii Banister&Berechman,2000,p.19,p.285 iii Sands,1993, pp.19-20 iv Ishikawa,1985 v European Commission,1996 vi Berechman,2003. vii Hiraishi,2002 viii Ministry of Land, Infrastructure and Transport (Japan) ix The Nihon Bank, 2005.5.10(http://www3.boj.or.jp/kagoshima/) x European Commission,2005. xi European Commission,2006. xii Sally & Carey,2006. xiii Stern,2006.