a study of the contribution of quality control...
TRANSCRIPT
A STUDY OF THE CONTRIBUTION OF QUALITY CONTROL TOWARDS
RESIDENTIAL BUILDING CONSTRUCTION IN MALAYSIA
YONG SHYN YING
A thesis submitted in partial fulfillment of the requirements for the award of
Master of Project Management
Faculty of Engineering and Science
Universiti Tunku Abdul Rahman
November 2016

DECLARATION
I hereby declare that the dissertation is based on my original work except for
quotations and citations which have been duly acknowledged. I also declare that it has
not been previously or concurrently submitted for any other degree at UTAR or other
institutions.
Signature :
Name
:
YONG SHYN YING
ID No.
:
14UEM02603
Date
:

APPROVAL SHEET FOR SUBMISSION
I certify that this project report titled “A STUDY OF THE CONTRIBUTION OF
QUALITY CONTROL TOWARDS RESIDENTIAL BUILDING
CONSTRUCTION IN MALAYSIA” was prepared by YONG SHYN YING has
met the required standard for submission in partial fulfillment of the requirements for
the award of Master of Project Management at Universiti Tunku Abdul Rahman.
Approved by:
Signature :
Supervisor
:
Mr. Lim Chai Chai
Date
:
The copyright of this report belongs to the author under the terms
of the copyright Act 1987 as qualified by Intellectual Property Policy of
University Tunku Abdul Rahman. Due acknowledgement shall always be
made of the use of any material contained in, or derived from, this report.
© 2016, YONG SHYN YING. All right reserved.

ii
ABSTRACT
A STUDY OF THE CONTRIBUTION OF QUALITY CONTROL
TOWARDS RESIDENTIAL BUILDING CONSTRUCTION IN
MALAYSIA
Yong Shyn Ying
The quality control of building construction is a major concern for construction
industry. Quality control is not only an action to be taken but is a transforming
of human behavior. None construction personnel (eg. Property investors) always
concern with the growth of market value of their invested properties and this has
caused quality control exercise become an important role to help to reduce the
defects of residential buildings and to minimize the future maintenance costs of
residential buildings. The methods to reduce defects of residential building in
Malaysia and the techniques to minimize future maintenance costs of residential
building in Malaysia were being studied in this research. The questionnaire was
distributed to 100 persons and received responses from all the 100 persons which
30 persons from developer; 30 persons from consultant; 30 persons from
contractor and 10 persons from non-construction personnel (This 10 persons
only take part for the question of Section A). An average of 5% to 10% of growth
market value of properties which analyzed from the data collected from the 100

iii
respondents. Few methods should be implemented to reduce the defects of
residential building in Malaysia which are design coordination meeting among
consultants, peer review for design, sufficient timeline for design, design
clarification meeting with contractor, value engineering program, weekly site
inspection for quality control, and lastly invite representative from manufacturer
for guidance of new building technology. Last but not least, few techniques need
to be executed to minimize the future maintenance cost which are less
complexity of building design, cost allocation for future maintenance during
design stage, life cycle cost technique, employ skilled workers during
construction, standardize specification of materials used for construction, as-
built drawing and operation manual to be given to building user and lastly
conduct quality assessment with aim for high score.

iv
ACKNOWLEDGEMENTS
I would like to thank everyone who had contributed to the
successful completion of this final year project. Also, I would like to
express my gratitude to my research supervisor, Mr. Lim Chai Chai for
his invaluable advice, guidance and his enormous patience throughout
the development of the research.
Moreover, I would also like to express my gratitude to my loving
parent and friends who had helped and given me encouragement and
supports throughout the course of the project.

v
APPROVAL SHEET
This dissertation/thesis entitled “A STUDY OF THE CONTRIBUTION OF
QUALITY CONTROL TOWARDS RESIDENTIAL BUILDING
CONSTRUCTION IN MALAYSIA” was prepared by YONG SHYN YING
and submitted as partial fulfillment of the requirements for the degree of Master
of Project Management at Universiti Tunku Abdul Rahman.
Approved by:
___________________________
(Mr. Lim Chai Chai)
Date:…………………..
Supervisor
Department of Surveying
Faculty of Engineering and Science
Universiti Tunku Abdul Rahman
vi
FACULTY OF ENGINEERING AND SCIENCE
UNIVERSITI TUNKU ABDUL RAHMAN
Date: __________________
SUBMISSION OF THESIS
It is hereby certified that YONG SHYN YING (ID No: 14UEM02603) has
completed this thesis entitled “A STUDY OF THE CONTRIBUTION OF
QUALITY CONTROL TOWARDS RESIDENTIAL BUILDING
CONSTRUCTION IN MALAYSIA” under the supervision of Mr. Lim Chai
Chai from the Department of Surveying, Faculty of Engineering and Science.
I understand that University will upload softcopy of my thesis in pdf format into
UTAR Institutional Repository, which may be made accessible to UTAR
community and public.
Yours truly,
____________________
(Yong Shyn Ying)

vii
DECLARATION
I hereby declare that the dissertation is based on my original work except for
quotations and citations which have been duly acknowledged. I also declare that
it has not been previously or concurrently submitted for any other degree at
UTAR or other institutions.
Name: YONG SHYN YING
Date: ____________________________

viii
TABLE OF CONTENTS
ABSTRACT ii
ACKNOWLEDGEMENTS iv
APPROVAL SHEET v
SUBMISSION OF THESIS vi
DECLARATION vii
TABLE OF CONTENTS viii
LIST OF TABLES xi
LIST OF FIGURES xii
LIST OF ABBREVIATIONS xiv
LIST OF APPENDICES xv
CHAPTER
1 INTRODUCTION 1
1.1 Background 1
1.2 Problem Statement 2
1.3 Aim & Objective 3
1.4 Scope of Research 4
1.5 Significance of study 4
1.6 Research Methodology 4
1.7 Dissertation Structure 6
1.7.1 Chapter 1 – Introduction 6
1.7.2 Chapter 2 – Literature Review 6
1.7.3 Chapter 3 – Research Methodology 6
1.7.4 Chapter 4 – Results & Discussion 6
1.7.5 Chapter 5 – Conclusion 7
2 LITERATURE REVIEW 8
2.1 Introduction 8
2.2 Growth of Building Construction in Malaysia

ix
2.3 High-Rise Residential Property in Malaysia 10
2.4 Real Estate Sustainability 11
2.5 Building Defects 12
2.6 Managing and Reduce Defects in Construction
Industry 15
2.7 Impact of New Technologies in Construction
Industry 19
2.8 Responsibility of Consultant in Construction 20
2.9 Maintenance of Residential Building 21
2.10 Building Construction Quality Assessment 22
2.10.1 CONQUAS 23
2.10.2 QLASSIC 24
2.10.3 PQP 25
2.11 Standard of Housing Quality 26
2.11.1 Local Authority 27
2.11.2 MHLG 27
2.11.3 CIDB 28
3 RESEARCH METHODOLOGY 31
3.1 Introduction 31
3.1.1 Quantitative Approach 32
3.1.2 Qualitative Approach 32
3.1.3 Mixed Method Approach 33
3.2 Design Framework 33
3.2.1 Questionnaire 34
3.3 Data Analysis 36
3.3.1 Reliability Test 39
3.3.2 ANOVA Test 40
3.3.3 Correlation Coefficient Test 41
4 RESULTS & DISCUSSION 43
4.1 Introduction 43
4.2 Result of Section A 45
4.2.1 Discussion Section A 46

x
4.3 Results of Section B 46
4.3.1 Pearson’s Correlation Test of Section
B 49
4.3.2 Cronbach’s Alpha Reliability Test of
Section B 50
4.3.3 Discussion of Section B 50
4.4 Result of Section C 52
4.4.1 Cronbach’s Alpha Reliability Test of
Section C 53
4.4.2 Pearson’s Correlation Test of Section
C 54
4.4.3 Kruskal-Wallis Test of Section C 56
4.4.4 Discussion of Section C 58
4.5 Result of Section D 61
4.5.1 Cronbach’s Alpha Reliability Test of
Section D 62
4.5.2 Pearson’s Correlation Test of Section
D 64
4.5.3 Kruskal-Wallis Test of Section D 65
4.5.4 Discussion of Section D 67
5 CONCLUSION 71 5.1 Introduction 71
5.2 Methods to Reduce Defects of Residential
Buildings in Malaysia 71
5.3 Techniques to Minimize Future Maintenance
Cost of Residential Building in Malaysia 72
5.4 Conclusion & Recommendation 73
REFERENCES 74
APPENDICES
APPENDIX A A-1
APPENDIX B A-6

xi
LIST OF TABLES
Table
2.1
Point of View of Stakeholders
Page
28
4.1 Group of Respondents 44
4.2 Expectation of Potential Growth Value of Residential Building
When Disposed
45
4.3 Years of Working in Construction Industry 47
4.4 Salary Range given by Company 48
4.5 Descriptive Statistics of Section B 49
4.6 Pearson’s Correlations of Section B 49
4.7 Reliability Statistics of Section B 50
4.8 Inter-Item Correlation Matrix of Section B 50
4.9 Item-Total Statistics of Section B 50
4.10 Reliability Statistics of Section C 53
4.11 Inter-Item Correlation Matrix of Section C 53
4.12 Item-Total Statistics of Section C 54
4.13 Pearson’s Correlations of Section C 54
4.14 Descriptive Statistics of Section C 55
4.15 Mean Ranks of Section C 56
4.16 Kruskal-Wallis H Test of Section C 57
4.17 Reliability Statistics of Section D 62
4.18 Inter-Item Correlation Matrix of Section D 62
4.19 Item-Total Statistics of Section D 63
4.20 Pearson’s Correlations of Section D 64

xii
Table
4.21
Descriptive Statistics of Section D
Page
65
4.22 Mean Ranks of Section D 65
4.23 Kruskal-Wallis H Test of Section D 66

xiii
LIST OF FIGURES
Figures
1.1
Flowchart of Research Methodology
Page
5
3.1 Types of Research Methods 31
3.2 Process of Data Analysis is SPSS 38
3.3 Cronbach’s Alpha Reliability Test 39
3.4 Kruskal-Wallis H Test 40
3.5 Pearson’s Correlation Test 42
4.1 Pie Chart of Group of Respondents 44
4.2 Pie Chart of Expectation Growth Value of Property 45
4.3 Bar Chart of Job Role vs. Years of Working 47
4.4 Bar Chart of Job Role vs. Salary Range 48
4.5 Scatterplot of Section B Analysis 49

xiv
LIST OF ABBREVIATIONS
Abbreviation Meaning
ANOVA Analysis of Variance
BCA Building Construction Authority
BRE Building Research Establishment
CCC Certificate of Completion and Compliance
CF Certificate of Fitness
CIDB Construction Industry Development Board
CIS Construction Industry Standard
CONQUAS Construction Quality Assessment System
CPC Certificate of Practical Completion
DLP Defect Liability Period
GFA Gross Floor Area
GDP Gross Domestic Product
HDA Housing Development Act
IT Information Technology
MHLG Ministry of Housing and Local Government
MS Malaysia Standard
PMBOK Project Management Body of Knowledge
PQP Project Quality Plan
QAQC Quality Assurance and Quality Control

xv
Abbreviation Meaning
QLASSIC Quality Assessment System for Building Construction Work
QP Qualified Person
SPA Sales and Purchase Agreement
SPSS Statistical Package for the Social Science
UBBL Uniform Building By-Law
VP Vacant Possession

xvi
LIST OF APPENDICES
Appendix
A
B
Questionnaire
Data Collection
Page
A-1
A-6

ii

1
CHAPTER ONE
INTRODUCTION
1.1 Background
People had started to get involved in building construction since
centuries ago. However, there are a lot of improvements of history in building
construction from thousand years ago until now. Firstly, they had tried to
improve the durability of the building. As the human from primitive were not
educated and their objectives is just to give themselves a shield to prevent
from attack of wild animals, therefore, the materials used to construct a
building in early time were easy to decay like leaves, sticks, and skins of
animal. After that, some of the human are educated and more innovative then
they were trying to use last longer materials like stone, clay, and timbers, and
lastly they were using more complex materials like concrete, brick, metals and
plastic until now. Secondly, their controls in building air flow, humidity,
brightness, sound level and indoor temperature were getting more accurately
to suit the comfort ability of human. Last but not least, they have tried to get
change in the construction process from fully man power until the
development by using machinery nowadays. The Pyramid of Giza in Egypt is
one of the oldest building listed in “Seven Wonders of the Ancient World”
and the only one still remain completely until now has showed the talent of
human for 3800 years ago. It is the tallest man-made structure in the world

2
which has 160 meters tall. The building was constructed by using 5.5 million
tonnes of lime stone, 8,000 tonnes of granite, and 500,000 tonnes of mortar.
The Pyramid of Giza has proved the success of human in building construction
thousand years ago (Joshua, 2009).
1.2 Problem Statement
The construction industry can be considered as a major contributor to
the economy which also can create career opportunities as well as prosperity.
However due to time and budget constraint, many projects have faced the
defect problems. Although the members of project team nowadays are trained
with the knowledge of project management skill such as Project Management
Body of Knowledge (PMBOK), the construction works still cannot run out
from the defect liability due to quality of work is not up to the satisfaction.
From the Annual Report 2013 announced by Construction Industry
Development Board (CIDB), the average score for Quality Assessment
System for Building Construction Work (QLASSIC) is 72 and there is no one
of the constructed building can score more than 85 marks. Therefore, every
completed building should have a minimum 12 months of defect liability
period (DLP) from main contractor started after the issuance of certificate of
practical completion (CPC). This is to make sure that the contractor still have
chances to rectify their defects which can only be realized after vacant
possession (VP).
A research had been carried out by Building Research Establishment
(BRE) has mentioned that 90% of building failure are due to the problems

3
caused in the design and construction stages. Although the people now are
well educated, defect works still occur because of there may have mistake
done in design stage, different materials used from the one stated in
specification, and the careless work of workers. The defects can be classified
as obvious (can be seen) or hidden (cannot be seen). The obvious defect of
works can be found out easily whereas the hidden defect of works may only be
found after few years such as the cracking of building due to the foundation
work is not done properly. Sometimes human are greedy, contractors always
try to find a way to minimize cost of materials and maximize their own profits
to finish their works and ignore the standard of procedure (SOP). Moreover,
some of the consulting firms are hiring some fresh graduate to become design
engineer and they are lack of experience to handling project but only can use
what they have studied to apply on works and hence caused the mistake done
at design stage. Therefore, there are always some unexpected defects
happened during construction stage like window size cannot fit into the
window, insufficient reinforcement bar concrete cover, wrong position or
missing of power socket and so on. This will reduce the market value of the
building when the owner decide to sell it off as well as the owner may need to
spend portion of money for maintenance in future.
1.3 Aim & Objectives
The aim is to study on the contribution of quality control towards the
construction of residential building in Malaysia.
4
The objectives to carry out this research are:
To identify methods of reduce defects in the residential
building.
To identify techniques of minimize future maintenance cost of
the building.
To determine the increase of market value of the residential
building.
1.4 Scope of Research
Quality control of residential building is very important for not only the
developer but also the purchaser. Although quality control exercises have been
carried out in many ways, there are still some defects detected for the new
build residential building. The research is mainly focus on developers,
consultant and contractors to understand the different points of views from
different categories of construction professional. The data of questionnaire
survey will be collected from at least 30 people from different background.
1.5 Significance of Study
This research is to understand impact of quality control upon the
construction of residential building in Malaysia and the major reasons that
cause the defects works. After this research, there can have some improvement
and awareness on handle defects works in future projects and hence increase
the rate of successfulness in completion with better quality of works.

5
Furthermore, this may help on some cost saving if all the site construction
personnel do the right thing at the first time (no rework).
1.6 Research Methodology
The first of research is start from literature review of the journal, thesis,
and scholarship articles which are relevant to the research topic. From the
literature review, some of the questions of survey questionnaire can be
brainstormed easily.
The research is based on quantitative approach. Quantitative survey is
done from data collection of survey questionnaire and analyzed by using IBM
SPSS software and few tests are carried out by this software such as
Cronbach’s Alpha Reliability test, Analysis of Variance (ANOVA) test,
Kruskal-Wallis test, Correlation analysis and so on. The questionnaire will be
distributed to target audiences from residential building construction
industries. The questions will be prepared and sent to the target audiences by
hand or emails.
START
IDENTIFICATION OF PROBLEM
LITERATURE REVIEW
QUESTIONNAIRE DEVELOPMENT FOR SURVEY
DATA COLLECTION
A
6
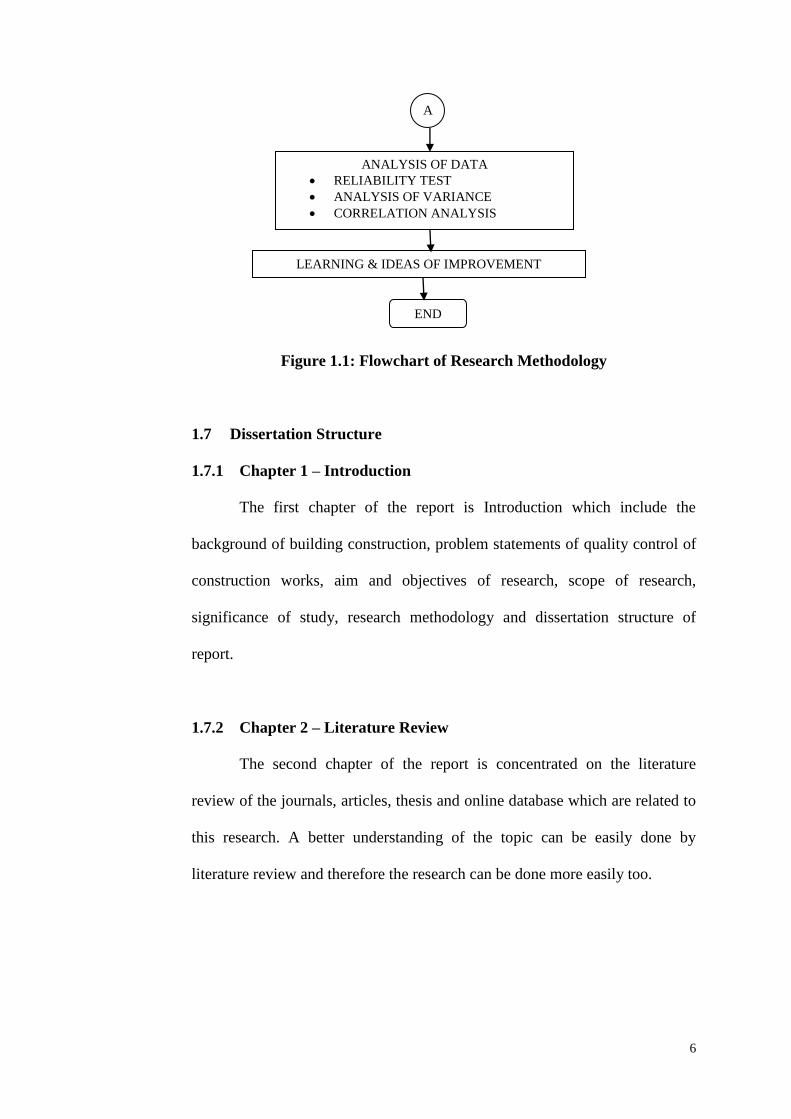
Figure 1.1: Flowchart of Research Methodology
1.7 Dissertation Structure
1.7.1 Chapter 1 – Introduction
The first chapter of the report is Introduction which include the
background of building construction, problem statements of quality control of
construction works, aim and objectives of research, scope of research,
significance of study, research methodology and dissertation structure of
report.
1.7.2 Chapter 2 – Literature Review
The second chapter of the report is concentrated on the literature
review of the journals, articles, thesis and online database which are related to
this research. A better understanding of the topic can be easily done by
literature review and therefore the research can be done more easily too.
ANALYSIS OF DATA
RELIABILITY TEST
ANALYSIS OF VARIANCE
CORRELATION ANALYSIS
LEARNING & IDEAS OF IMPROVEMENT
END
A

7
1.7.3 Chapter 3 – Research Methodology
The third chapter of the report is mainly focus on the methods of carry
out the research and data collection. The result or outcomes of this research
can be easily get from this chapter.
1.7.4 Chapter 4 – Results & Discussion
The fourth chapter of the report is the analysis of the data collected
from Chapter 3. By using the analysis of the data can easily look into the
outcome of this research and the defects can be identified easier. Then, the
results are discussed based on the data collection.
1.7.5 Chapter 5 – Conclusion & Recommendation
The last chapter of the report is to analyze the conclusion have meet
the objectives stated in Chapter 1 after the research is completed and some
recommendations are given to improve the future projects.

8
CHAPTER TWO
LITERATURE REVIEW
2.1 Introduction
Most of the research and journal previously done by others were more
related on the defects of the commercial buildings or housing from other
countries other countries. From the all the information given, a research on
reduce defects and maintenance cost of residential building in Malaysia need
to be done from this thesis.
Furthermore, the previous studies done by other researchers are more
on reduce defects general construction and most common happen mistake that
have to spend more maintenance cost in future. They have also did some
research on the standard quality test that can be applied to check on the quality
of construction done by contractor. From this thesis, we can sort out the
methods to reduce the defects and maintenance cost of residential buildings in
Malaysia and the techniques to minimize the future maintenance cost of
residential buildings.

9
2.2 Growth of Building Construction in Malaysia
Malaysia is a middle-revenue developing country which has changed
from a supplier of raw materials into an economic country with different
sector of industries with higher technology. Malaysia can be said as one of the
country of trading among 20 largest in the world and it has a strategic location
which is at the centre of South-East Asia enables all the investors to do their
trading for the product for regional and international markets (Wood, 2014).
The construction industry of Malaysia can be divided into two parts
which are general construction and trade works. The general construction
include residential, commercial, industrial and other civil construction whereas
trade works includes the activities of electrical works, metal works, sanitary
and sewerage works, plumbing works, air conditioning and refrigeration
works, painting, tiling, flooring works and so on. In year 2010, although the
construction industry gave around only 3% of Gross Domestic Product (GDP),
it still can be said as an important part to the economy of Malaysia as the
relationship with other industries like cable and pipe manufacturing industry,
tile manufacturing industry, as well as the industry of tourism. Therefore,
construction industry can be said as a large contribution towards economy of
Malaysia. The Construction Industry Development Board (CIDB) had handed
in a descriptive master plan in 2007 to allow the construction industry of
Malaysia able to compete in worldwide. However, according to the “Market
Watch 2012” by DE International, construction industry of Malaysia in non-
residential is predicted to increase slightly followed by property of commercial
and industrial as well as hotels. The development of residential in Klang

10
Valley has become higher among the construction activity in Malaysia (Wood,
2014).
On the other hand, due to the program of earth-saving and
environmental friendly is established globally, ‘green technology’ that
appeared in Malaysia this few years have caused many foreign investors to
take part in the construction activity of Malaysia which focus on the
technologies of green building development. The introduction of ‘Green
Building Index’ has lead Malaysia to the way of green technology and energy
efficiency of building is expected to become more advance in future. Due to
the improvement of construction activity, the implementation of information
technology (IT) has also played an important role in maintain the growth of
the construction industry.
2.3 High-Rise Residential Property in Malaysia
Government of Malaysia think that housing is a human necessity and
also an important part of country’s economy. There is always three primary
focus to be concerned in construction industries and the management of
property in so many years. Firstly, the building design and the management of
work after completion is the most important issue to the property managers.
Secondly, the construction work of the building such as duration of works,
budget of works, and the structural design of works is also very important to
the developers and the contractors. Thirdly, the economics of property in
current year as the property owner may try to observe the economics which is
the cost of building operations over the life of building (Dunk, 2004).

11
The development of high-rise residential in Malaysia are implemented
by private and public sector. It has become a trend or lifestyle to stay in high-
rise residential within the urban area in Malaysia as high-rise residential have
many facilities for the tenants to enjoy themselves within the building area.
The demand of high-rise residential have added year by years as the remaining
of land area has become lesser compare to pass few years. However, the
efficiency of management for high-rise residential building are under
expectation as the tenants complained the unsatisfied service for the public
facilities management for example the lift is not working properly, the rubbish
is not collected by following the timetable, and other disputes and damage of
public facilities. The cooperation from all the parties are needed such as the
team of building management and tenants of the building to make the building
to be always in good condition and healthy environment.
2.4 Real Estate Sustainability
The sustainability of real estate can help to increase the market value
of a property. Every stakeholders will have different interest to look into their
benefits. Therefore, they will start to blame each other when they cannot get
their expected sustainability result. From the table below, there are some
different point of views for sustainability from stakeholders (George, 2012):-
Table 2.1: Point of View of Stakeholders
Stakeholders Point of Views

12
Property Owner Owner wish to have a property as sustainable as
possible which can reduce future maintenance cost /
operating cost.
Property Investor Investor wish to have a sustainable property so they
can have higher rental and easier to improve tenant
retention. However, the property price have to be
affordable too.
Property Developer Developer think that the purchaser will only care on
the price of property. If they produce a sustainable
building and the price will be an issue for them to sell
off their property.
Property Designer Designer think that to come out a design of
sustainable building, there must be sufficient time
given to them for study and research.
Property Constructor Constructor think that they are only given instruction
to produce on what developer’s need. There is no
point for them to lower down their profit and produce
a sustainable building as the developer always want to
cut their cost.
Therefore, there is a need of professional property valuation personnel
to justify on the sustainability of real estate market as all the stakeholders are
also not willing to give up on their profit and the advice given by the valuers

13
can be said as optimum and valid (Thomas, 2003). However, for a validity of
valuation, the estimation of the market value of the said property have to be
accurate. The valuation is normally done not only based on the sustainability
of the building but also affected by the environmental issue and cultures
surrounding the building. Market value can be said as the estimation of price
that the property is able to sell in the market based on the condition and
outlook of the building and the nature of market (eg. Potential buyers that will
involve in this market). There is no harm to say that both the property owner
and property investor are most concern on the resale price of the property to
potential buyers or tenant. The valuer have to clearly present what is the
terminology used to estimate the market value of property as this is important
for the clients to understand all the information received so that they can make
a proper decision for their investment plan. The most common valuation
methods used is sales comparison. The property will be priced in somewhere
closer to the selling price of the property surrounding within the same area.
However, the valuer will still look into the age of the building, build up size,
quality of work done on the building and so on.
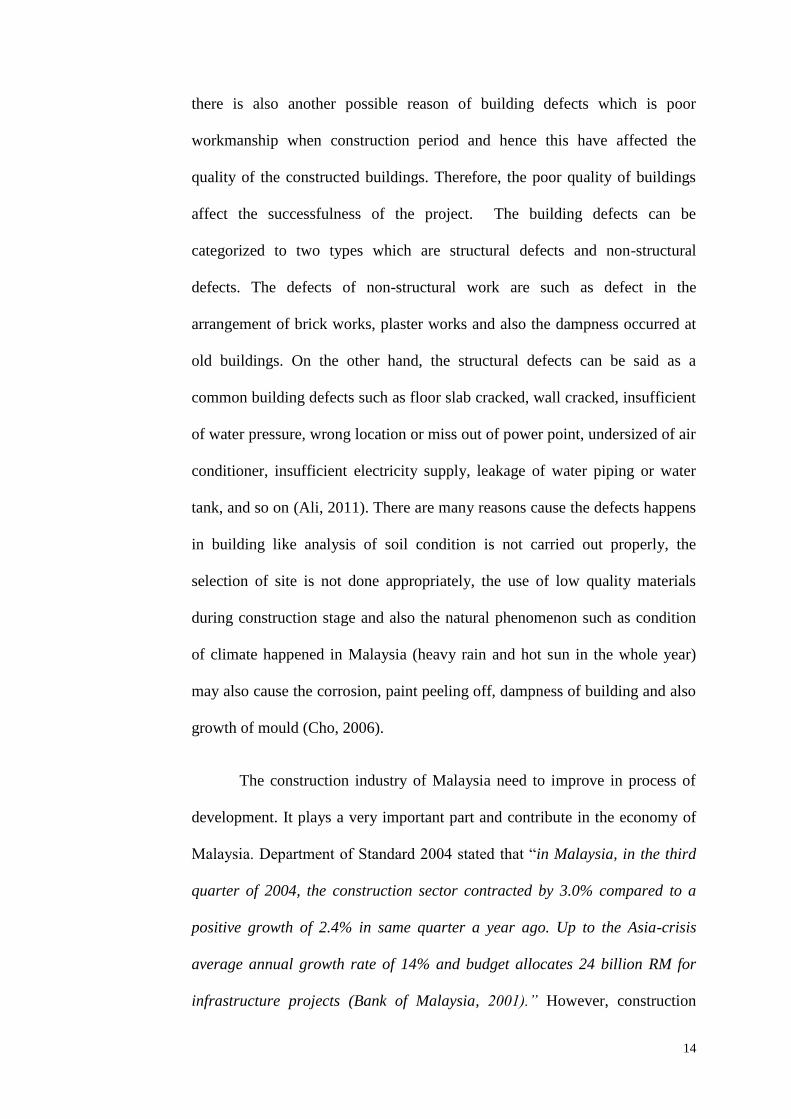
2.5 Building Defects
Every building have occurred some different types defects no matter in
any kind of forms or any age of the buildings. However, defects that occurred
at new buildings may due to the non-compliance of construction standard
whereas for the defects occurred at old buildings may due to the expired of
Defect Liability Period (DLP) and the building age (Ojo, 2008). Furthermore,
14
there is also another possible reason of building defects which is poor
workmanship when construction period and hence this have affected the
quality of the constructed buildings. Therefore, the poor quality of buildings
affect the successfulness of the project. The building defects can be
categorized to two types which are structural defects and non-structural
defects. The defects of non-structural work are such as defect in the
arrangement of brick works, plaster works and also the dampness occurred at
old buildings. On the other hand, the structural defects can be said as a
common building defects such as floor slab cracked, wall cracked, insufficient
of water pressure, wrong location or miss out of power point, undersized of air
conditioner, insufficient electricity supply, leakage of water piping or water
tank, and so on (Ali, 2011). There are many reasons cause the defects happens
in building like analysis of soil condition is not carried out properly, the
selection of site is not done appropriately, the use of low quality materials
during construction stage and also the natural phenomenon such as condition
of climate happened in Malaysia (heavy rain and hot sun in the whole year)
may also cause the corrosion, paint peeling off, dampness of building and also
growth of mould (Cho, 2006).
The construction industry of Malaysia need to improve in process of
development. It plays a very important part and contribute in the economy of
Malaysia. Department of Standard 2004 stated that “in Malaysia, in the third
quarter of 2004, the construction sector contracted by 3.0% compared to a
positive growth of 2.4% in same quarter a year ago. Up to the Asia-crisis
average annual growth rate of 14% and budget allocates 24 billion RM for
infrastructure projects (Bank of Malaysia, 2001).” However, construction

15
field of Malaysia are still lack of skilled and well-trained workers as well as
the knowledgeable workers in the technology of construction industry.
Although there are high demands in building construction, the quality of the
project will be affected by these issues. So, the measurement of quality in the
building construction need to be found out according to the factor and criteria
of possible measures.
2.6 Managing and Reduce Defects in Construction Industry
Defects can usually happen when design stage and also construction
stage or after completion of building. Although the professional designers
(architect, consultant & etc.) are required to design and coordinate well among
each other to prevent defects to be occurred when completion of building, it is
still very hard to have a perfect building with free from defects. Construction
defects can be said as the mistake done in design and construction stage that
will cause losses to project owner’s profit (Azahar, 2011).
Design defect is referred to the information and documentation which
provided by the professional designers is incorrect or not complete. This
defect may cause some variation order which will have cost incurred to the
owner in construction stage. On the other hand, construction defects can be
classified as patent defect and latent defect. Patent defect can be easily found
during inspection such as wall cracking, window frame is not properly
installed and others. Latent defect is the defect that occur only after some
times, for example soil erosion, and concrete footing reinforcement and others.
There is more and more design defects occurred nowadays because of the

16
modern technology. This is because the design can be done by using computer
software with very attractive and trendy building layout. However, there is no
detailing for the method of statement can be provided for this kind of trendy
building and the designers always request the contractor to imagine
themselves to make the thing become real. Besides that, all the designers are
always stand on their own professional expert and reluctant to accept the
opinions from other parties. Furthermore, construction defects can easily
appeared are because all the contractors nowadays always aim for high profit
therefore, they will try to minimize the spending cost to complete the building
and they are always been requested by the developers to complete the building
within the timeline given to them. From this kind of thinking, the work always
cannot be done with quality assurance.
All the stakeholders actually hope to reduce or prevent to the minimum
defects or free from defect in design error or construction stage. There are
some steps that can be implemented to reduce defects when design stage and
construction stage (Gatlin, 2013).
a. Design Stage
i. Production Management
All the design team member are required to gather and
coordinate to complete the design with proper information to
minimize the defects when design stage.

17
ii. Peer Review
Peer review will act like “different pair of eyes” to check on the
discrepancy from the design layout and can have different ideas
or innovative that can be incorporated to the design and hence
help to increase the design quality for construction.
iii. Design Schedule
It is very important for the project owner to let the designer to
have enough time to complete their design. A rushing design
timeline will cause some design error due to the time to
coordinate, review and checking on the design is not sufficient.
iv. Design and Construction Coordination
Before the construction start, it is critical for the consultant and
contractor to communicate each other on the design and the
problem will be facing during construction so that the
consultant can look into the particular design before work done
on site. This can help to correct some design errors as well as
help to reduce construction defects.
v. Value Engineering
It is vital to carry out value engineering as this process can help
the project owner to save some cost. However, all the proposed
changes have to be studied in details so that the quality of

18
design will not be affected while the project owner can save a
portion of money from it.
b. Construction Stage
i. Quality Management
Quality assurance and quality control (QAQC) is very
important for a project during construction. When QAQC
activity is carried out, the chances to gain defect for
construction stage will be lesser. This is because by inspection
from time to time, the work that have done wrongly can be
corrected before completion.
ii. New Building Technology
Some of the contractors have limited experience for new
technology and this will cause the risk to get construction
defects become higher. Therefore, it is good to ask the supplier
or specialist of the new technology to send a representative to
site for observation and provide guidance for the contractor.
This can make sure the contractor are using the right way for
installation.
iii. Cross Checking of Work Done
This is something similar as the peer review in design stage
which the construction personnel for a particular project can

19
actually invite construction personnel from different project to
visit their site. Personnel from other project may help to find
out the mistake they have done in construction as they don’t
know about the exact design of the project and just raised out
the problem found merely based on their own construction
experience.
Therefore, defects can be minimized by doing proper planning
and design coordination. However, communication among stakeholders are
also very important as they can know actually what the need of each and
others is.
2.7 Impacts of New Technologies in Construction Industry
New technologies of construction industry is accelerating and can
bring greater impact in construction activity in the coming years. The new
technologies such as 3D-design and pre-fabrication in property construction
may need the execution of new techniques or professions with the requirement
of creating new training programs, so, there may form a demand of the new
professions. (The Government of Western Australia, 2014) Instead of this, all
the company involve in construction activity have to prepare an additional
financial to spend on the new training development. However, all the new
training to be given to the workers still need to depend on the motivation and
attitude of the workers, therefore, they may also need a longer time for the
20
new technologies to get involve into the construction industry because the
workers need to time accept and understand the new skills in works.
The pre-fabrication model of housing property can give the purchaser a
better concept to understand the design and hence can have bigger opportunity
for the purchaser to buy the property through their impression on the housing
model. Furthermore, the developer can also know what to improve and amend
by looking at the pre-fabrication model.
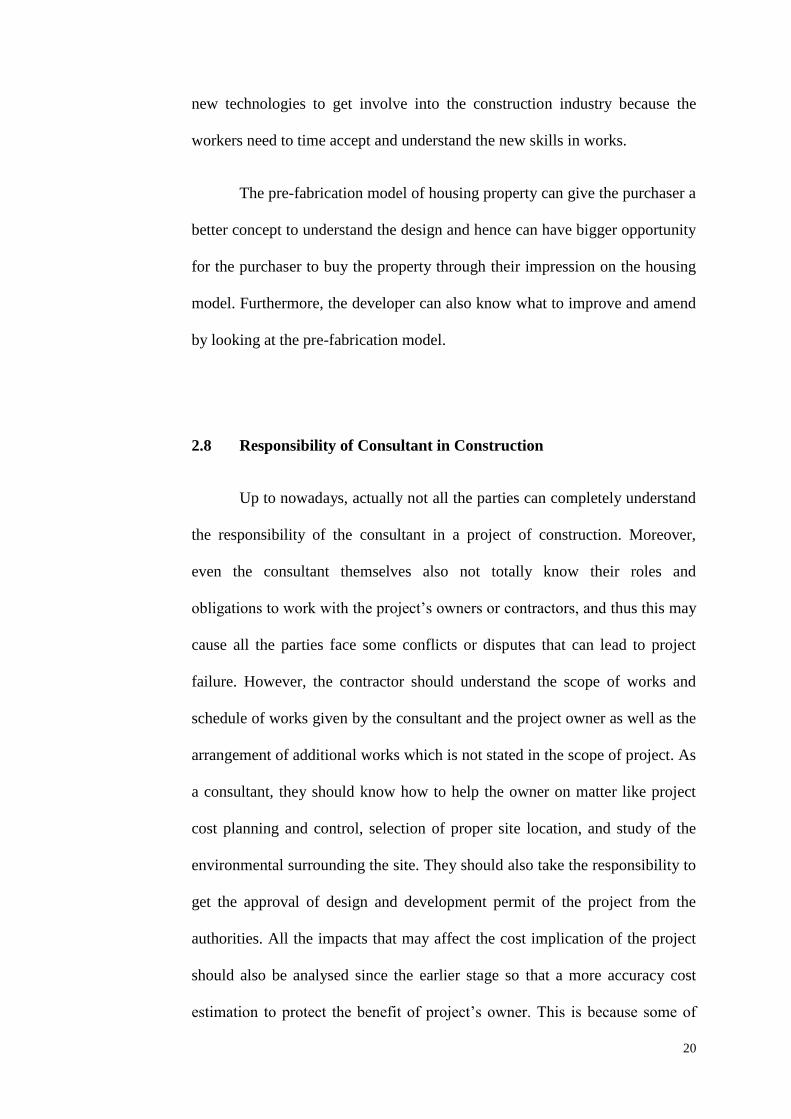
2.8 Responsibility of Consultant in Construction
Up to nowadays, actually not all the parties can completely understand
the responsibility of the consultant in a project of construction. Moreover,
even the consultant themselves also not totally know their roles and
obligations to work with the project’s owners or contractors, and thus this may
cause all the parties face some conflicts or disputes that can lead to project
failure. However, the contractor should understand the scope of works and
schedule of works given by the consultant and the project owner as well as the
arrangement of additional works which is not stated in the scope of project. As
a consultant, they should know how to help the owner on matter like project
cost planning and control, selection of proper site location, and study of the
environmental surrounding the site. They should also take the responsibility to
get the approval of design and development permit of the project from the
authorities. All the impacts that may affect the cost implication of the project
should also be analysed since the earlier stage so that a more accuracy cost
estimation to protect the benefit of project’s owner. This is because some of
21
the projects’ owner may not have professional background which can let them
to understand all the technical issues happened in the project. Furthermore, the
consultant should help the owner to make sure that the contractors have
worked follow the specifications and terms given in their contract and
therefore, consultant need to carry out the inspection of works based on the
site progress to ensure the work done is complied with the standard of quality.
If the complexity of the project is higher, the risk of doing mistake in the
project is also greater, so, the consultant need to put in more effort in the
design stage and pay more attention when the project is under construction.
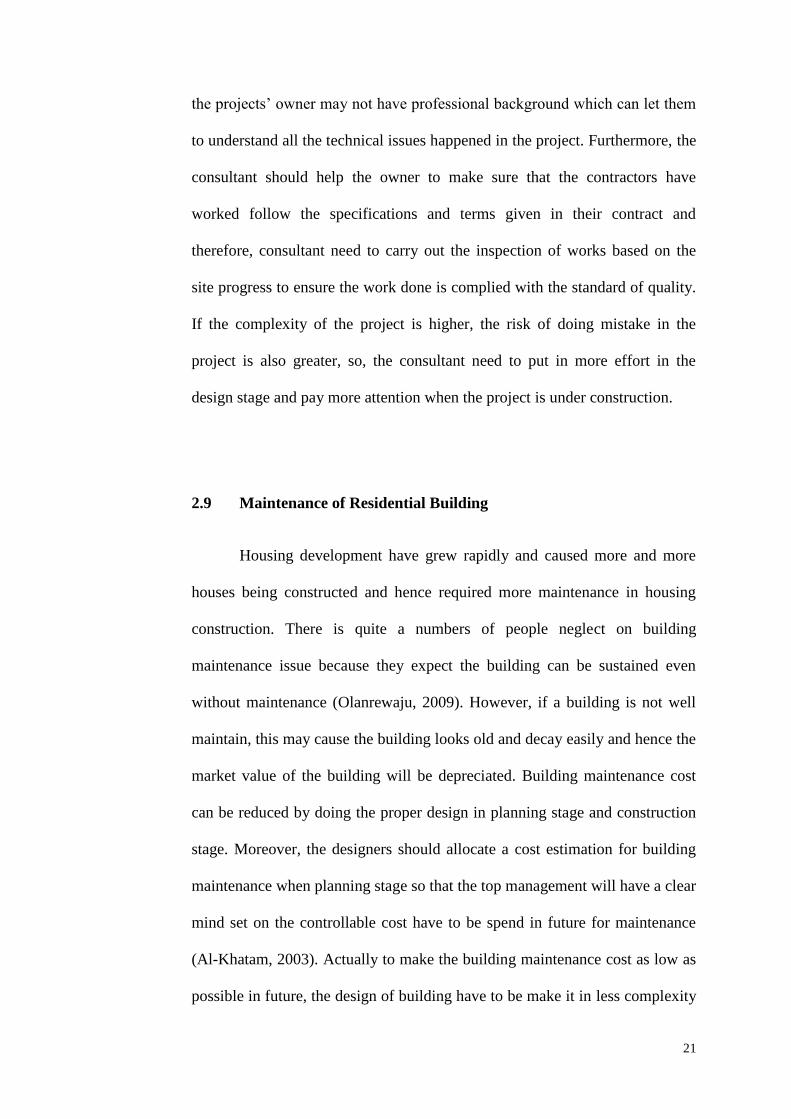
2.9 Maintenance of Residential Building
Housing development have grew rapidly and caused more and more
houses being constructed and hence required more maintenance in housing
construction. There is quite a numbers of people neglect on building
maintenance issue because they expect the building can be sustained even
without maintenance (Olanrewaju, 2009). However, if a building is not well
maintain, this may cause the building looks old and decay easily and hence the
market value of the building will be depreciated. Building maintenance cost
can be reduced by doing the proper design in planning stage and construction
stage. Moreover, the designers should allocate a cost estimation for building
maintenance when planning stage so that the top management will have a clear
mind set on the controllable cost have to be spend in future for maintenance
(Al-Khatam, 2003). Actually to make the building maintenance cost as low as
possible in future, the design of building have to be make it in less complexity

22
(Ahmad, 2013). If the building design is over complex, there will be difficulty
to do regular maintenance. For example, the use of timber flooring may look
like high class for a house, but the timber will be dropped off easily if the
house owner do not use proper way for cleaning. Furthermore, it is necessary
to let the owner understand about life cycle cost techniques (Dunk, 2004). This
will help the project owner to come out with a most economical design and
structural layout because the application of life cycle cost can help the owner
to find out the saving can be done when design stage. Besides that, the use of
unskilled labour in construction actually can lead to poor workmanship of
completed building and this will cause the house owner to spend more on
future maintenance cost. On the other hand, human behaviour is the hardest to
control and which will cause to spend more repairing cost due to all those
wear and tear problem. So, the contractor shall submit their as-built drawing
and operation manual to the building user so that they can take some
precaution on daily usage of the building components. Moreover, it is
important to have a standard of specification for design a building as well as
construction. If all the contractors go for the materials with lower price
without quality, this will be a huge cost to spend in maintenance and repairing
works.
2.10 Building Construction Quality Assessment
There are many types of assessment for the quality of building
construction that can be used to evaluate whether the building is meet with the

23
standard of quality and requirement. Below shown are the most common used
system that have implemented in the industry.
2.10.1 Construction Quality Assessment System (CONQUAS)
CONQUAS was established by Building and Construction Authority
(BCA) and evaluated by a standard requirement from a meeting with the
public sector developers, consultants, contractors and all the professional
parties related in the construction field according to the general specifications
which commonly apply in their projects. The scoring system of CONQUAS
had first carried out at the trial session to make sure the consistency and
accuracy of the score. CONQUAS was developed to ensure the quality of
constructed works achieve the required standards and specification. There are
three aspects evaluated in CONQUAS which are architectural works,
structural works and Mechanical & Electrical (M&E) works. However, heavy
duty works which called under sub-contract are excluded in this assessment.
The assessment is done by laboratory testing, field testing and site inspection.
Furthermore, the materials used on site are also tested to ensure the
performance of the materials meet the standard of quality and safety issue.
Therefore the CONQUAS’s assessors are needed to present calibration
programme and also the BCA’s CONQUAS training to make sure the
accuracy and competency of the assessment. The system is evaluated based on
the gross floor area (GFA) of building. The scoring will be judged based on
the works that were inspected on first time, so, the assessment will not be
evaluated again after the rectification works has completed. This is to

24
encourage the contractors “doing the things right at the first time”. However, it
will be considered as fail in assessment if the items does not meet the
requirement.
2.10.2 Quality Assessment System for Building Construction Work
(QLASSIC)
Besides that, QLASSIC is also a system that is designed to assess the
quality of the workmanship apply on the building of the project according to
their independence standard. QLASSIC has established as Malaysia
Construction Industry Standards (CIS) by the technical members of quality
assessment in construction sectors with the help of Construction Industry
Development Board Malaysia (CIDB) where CIDB has acted as a moderator
for the technical members in the whole process of standard development.
QLASSIC is also evaluate by sampling approach method as similar as
CONQUAS. The assessment of this system is also based on architectural
works, external works and M&E works. Unlike CONQUAS, the assessment of
QLASSIC will be carried out twice which is during construction stage and
when completion of project. This is to ensure the contractor is doing their
work properly from beginning until completion of works. The sampling will
depends on the gross floor area (GFA) of building and 10 meter length section
per location for external work. However, all the plastering works done are
depends on the justification by the project Qualified Person (QP).

25
2.10.3 Project Quality Plan (PQP)
In some of the developers’ company, they will enforce the awarded
contractor to submit PQP once the commencement of work. PQP can help to
understand the project quality requirement such as client’s requirement,
consultant requirement, local authority’s requirement, legal issue and also the
project specification. Below are some of the content which are listed in PQP:-
i. Scope of Works;
ii. Project Stakeholders;
iii. Project Organization Structure;
iv. Roles & Responsibility;
v. Work Programme;
vi. Project Operating System;
vii. Quality Management System;
viii. Methods of Statement;
ix. Inspection Test Plan;
x. Important Checklist; and etc.
From PQP, the contractor can know well on what they should do to
achieve the goal given to them. On the other hand, the consultant and clerk of
works can also monitor and make sure the work done by contractor have
follow standard quality and requirement by referring to PQP.

26
2.11 Standard of Housing Quality
The housing development of Malaysia can be categorized to three
which are statutory bodies, private developers and co-operative societies. They
are administrated by the Housing Development Act (HDA) 1966 if they want
to handle the development for the construction of more than four housing units
(Azlinor, 2008). The purchasers of property have the right to choose for a
quality house with good workmanship and the material used need to be meet
with the standard of Sale and Purchase Agreement (SPA) (Schedule G and H
of the HD Regulations 1989). Purchasers can claim for their remedies from the
developers if they found a problem in the standard of construction which does
not meet Clause 14 (“the building shall be constructed in a good and
workmanlike manner”) of the HD Regulation 1989. There are two types of
remedies in general; first is the remedies under the law of contract, second is
the legislative remedies within the legislative warranty period. Furthermore,
for all the low-cost housing project either is developed by public or private
developer, they must comply with the guidelines set by Construction Industry
Standard (CIS) 1 (for conventional units including single and double storey
houses) and CIS 2 (for sub-divided units, strata buildings). The objective to set
these guidelines is to guarantee that all low-costs property can be constructed
by following the standard requirement that enforced by the government. There
are four components need to be taken as the scope of these standards which
are complete infrastructure, development of community, safety and
development of physical and health. Therefore, the implementation of CIS 1
and CIS 2 can ensure the group of lower income are also given the chances to
own a proper quality of house. Malaysia has three main authorities to control

27
the quality of building which are local authority, Ministry of Housing and
Local Government (MHLG) and Construction Industry Development Board
(CIDB).
2.11.1 Local Authority
First of all, the building plan need to be approved by the local authority
and the local authority have to make sure the developer’s submission has
complied with all the rules and regulations stated in the Uniform Building By-
Laws (UBBL). Furthermore, if the building plan submitted is related to low-
cost housing development then the local authority should check also the
compliance of plan by using Construction Industry Standard (CIS 1 and CIS
2). UBBL has stated that a qualified person to supervise and inspect the
progress of the construction works is meet with the standard quality until the
completion of building. Secondly, Certificate of Completion and Compliance
(CCC) is introduced and it is a new method to process the issuance of
Certificate of Fitness (CF). After the issuance of CCC, the responsibility of
local authority will be transferred to the architect, building planner or engineer
when the completion of the constructed building to check on whether it is
following the plans and specification that approved by the local authority.
2.11.2 Ministry of Housing and Local Government (MHLG)
It is illegal to carry out a housing development without a license.
MHLG is playing an important role for housing development of Malaysia as

28
the license of housing development need to be approved by the MHLG. The
MHLG has the power to control all the activities carry out by the developers.
They have the right to revoke the license of a developer if found that the
developer has done some destructive that harm the interest of the purchasers.
Instead of this, MHLG may use the Housing Development Act (HDA) to
ensure the developers have comply their responsibility stated by the standard
Sales and Purchase Agreement (SPA). On the other hand, three mechanisms
will be used to monitor the progress of construction which are documentation,
site visit, and site inspection. However, site inspection will only be carried out
when there is any complaint received from the purchaser due to lack of
manpower.
2.11.3 Construction Industry Development Board (CIDB)
All the contractors need to have a license by Construction Industry
Development Board Act 1993 (CIDBA). CIDBA has also stipulated the
responsibilities of CIDB. Unlike local authorities and MHLG, CIDB do not
have direct control of the housing development, however, it is the main
authority to control the activities of contractors. The quality of building in
Malaysia is highly depended on the skilled workers engaged to the
construction works. The skilled workers are defined as concreter, bar-bender,
carpenter, bricklayer, mason, plasterer, paver, tiler, painter, joiner, metal
worker, drain layer, glazier, welder, construction plant operator, plumber and
electrician (Section 32(2). All the developers need to have the responsibility to
make sure their contractors are engaging with skilled workers as this may

29
causes a significant impact on the quality of workmanship apply on the houses
constructed. If the developers only look for the tenderer with lowest quotation
but do not care about the contractor’s skilled workers, this may causes the
contractor to have poor commitment to the quality of works from their
workers. The main contractors need to make sure their foreign workers who
want to work in Malaysia must sit for the accreditation test before they get the
certificate of “Perakuan Kemahiran Pekerja Asing” (PKPA). They are
requested to sit for the accreditation of skilled process for every 3 years in
order for them to apply PKPA. So, Immigration Department shall renew their
working permits if the fail in the tests. Instead of this, both local and foreign
workers are also encouraged to sit for the accreditation test and be awarded the
“Sijil Kecekapan Kemahiran” (SKK). There are three procedures to work out
by CIDB in order to accredit the test. Firstly will be short training courses, the
follow by work place assessment and lastly skills test. Disciplinary action such
as suspension or cancellation of licenses will be taken for the contractors who
fail to comply with all these requirements. On the other hand, CIDB also
responsible for the construction materials certification where the quality of the
materials is dependent on whether it is certified by SIRIM Berhad. SIRIM has
the responsibility to develop the standard of products, systems and services
known as Malaysian Standard (MS). The standards of products are approved
as MS if it follows the Standard Malaysia Act, 1996. However, CIDB need to
encourage the technique and materials used in construction to be standardized
but it is not strict to specify the quality of materials used in construction.
Therefore, the contractors or developers can have their own choices to pick

30
any less expensive materials in the market instead of choosing quality
materials.

31
CHAPTER THREE
RESEARCH METHODOLOGY
3.1 Introduction
There are three types of approaches for carry out research, which are:-
Quantitative Approach
Qualitative Approach
Mixed Method Approach
Figure 3.1: Types of Research Methods
Research Methods
Qualitative Methods Mixed Methods Quantitative Methods
Theory Generation Better understanding of
interaction effect
Theory testing on
specified factors
“WHY” “HOW” “WHAT”

32
3.1.1 Quantitative Approach
Quantitative approach is normally done by using data collection by
distribute the survey questionnaire to the target audience for their opinions on
the specified factors. This approach normally has a specified variables for data
analysis and the data collected is measureable. Quantitative survey is a simple
traditional method for a researchers to get the most wanted result with
unbiased approach therefore many researchers feel more comfortable on this
approach. The sample size for this approach is large. Minimum respondents of
questionnaire validity test in quantitative survey are 30 numbers. (Sugiyono,
2012). There are few types of quantitative research methods:-
i. Survey research;
ii. Correlational research;
iii. Casual-comparative research;
iv. Experimental research; and etc.
3.1.2 Qualitative Approach
Qualitative survey is using open-ended questions approach like
interview methods and it is used to improve understanding of particular topics.
This methods required target audience with knowledge of particular research
and they always bring in their personal interest into this research. The sample
size for this approach is very small as all the respondents are chosen to comply
the given measurement. Qualitative method is more suitable for researchers

33
who have more innovation and good in analytical writing. There are few types
of qualitative survey methods:-
i. Case study;
ii. Grounded theory;
iii. Phenomenology;
iv. Historical; and etc.
3.1.3 Mixed Method Approach
Mixed method is the combination research method of quantitative
survey and qualitative survey and therefore this method always required more
time to complete because it need to analyze both types of data collected. There
are few types of mixed method approach:-
i. Triangulation design;
ii. Embedded design;
iii. Explanatory design; and etc.
3.2 Design Framework
The research begins by studying common construction defects that are
usually happened from a completed building. Besides that, the reason of
uncontrollable building maintenance cost is also studied.

34
This research is established to study the contribution of quality control
towards residential building in Malaysia. First of all, the methods to reduce
defects from design and construction stage were identified. Next, the
techniques to help on reduce building future maintenance cost were also
identified. Quantitative survey is used in this research due to more convenient
and saving time. The data collected from this method are measureable and
easier to be analyzed. The survey questionnaire are expected to collect back
from 100 target audiences for validity test. They are 30 respondents from
developer; 30 respondents from consultant; and 30 respondents from
contractor; and last but not least 10 respondents from non-construction
personnel.
3.2.1 Questionnaire
The first question is to check the expectation from respondents
on the potential growth of the property value when they are going to dispose
the building if it is free from defects and less future maintenance cost. There
are 4 choices to be chosen which are: less than 5%; 5% to 7%; 8% to 10%;
and more than 10%. This question is expected to get the answer from public as
everyone have the right to put in their own expectation of market price no
matter you are working in construction industry or not.
The second question is to identify the role of respondents from
construction industry. There are 3 choices to be chosen which are developer,
consultant, contractor and the last one “None of the above”. This question is

35
expected to get equally 30 respondents from every choice (except for “None of
the Above”). For those respondents who answered “None of the above” are
expected to return back the questionnaire as the following questions are out of
their working field or industry for those who are not working as construction
industry.
The third question is to let the respondents to fill in their years of
service in construction industry as different years of experience they gained
will affect their point of view to the following questions. The fourth question
is to check the salary range paid to the respondents by their respective
company as different range of salary may affect the performance of work by
respondents too.
The fifth question is to identify the most useful method that can be
used to reduce the defects of residential building in Malaysia. There are total 7
methods that can reduce defects. Each method can be rated by using scale
from 1 to 5. This scale is using Likert scale which means 1 is the least agree
on the given method and 5 is the most agree on the given method.
The last question is to identify the most useful technique that can help
to reduce future maintenance cost of residential building in Malaysia. There
are total 7 techniques that can help to minimize future maintenance cost. Same
as third question, each technique can be rated by using scale from 1 to 5. This
scale is using Likert scale which means 1 is the least agree on the proposed
technique and 5 is the most agree on the proposed techniques.

36
3.3 Data Analysis
The data collected from all respondents will then be analyzed by using
SPSS (Statistical Package for the Social Sciences). SPSS is a very useful
program which can help to analyze the data easily by using different types of
statistic tests. There will be two types of hypothesis statistic test to analyze
data which are parametric tests and non-parametric tests. Parametric test is
mainly used to test the means of a group of data; while non-parametric test is
used to test the median of a group of data. Besides that, parametric test is used
for bigger group of sample size (>20 samples); while non-parametric test is
used for smaller numbers of sample size (<20 samples). Below shows some of
the hypothesis tests for parametric test and non-parametric test.
a. Parametric Test:-
i. 1-sample t test;
ii. 2-sample t test;
iii. One-Way ANOVA test;
iv. Pearson Correlation Coefficient; and etc.
b. Non-parametric Test:-
i. Wilcoxon test;
ii. Mann-Whitney test;
iii. Kruskal-Wallis median test;

37
iv. Spearman’s rho and etc.
There are three types of data which are commonly collected from
questionnaire:-
i. Interval data – can be collected by independent unit, for
example: age, weight, years of working and etc.
ii. Ordinal data – can be collected by ranking scale (Likert scale),
for example: the respondents are going to answer the question
based on level on satisfaction (eg: 1 = least important; 5= most
important).
iii. Nominal data – can be collected from qualitative statement, for
example: sex, marital status, nationality and etc.
If the data collected only consist of ordinal data or nominal data, then
non-parametric test can only be used for analyze the data and therefore,
Question 5 and 6 will be analyzed by non-parametric test while Question 1 to
4 will be analyzed by parametric test.
Below is the flowchart to show the process of data collection to
analyze data by using SPSS.
Data Collection
Entering Data for analysis
Checking reliability of data internal
consistency by using Cronbach’s
Alpha coefficient test
A
38
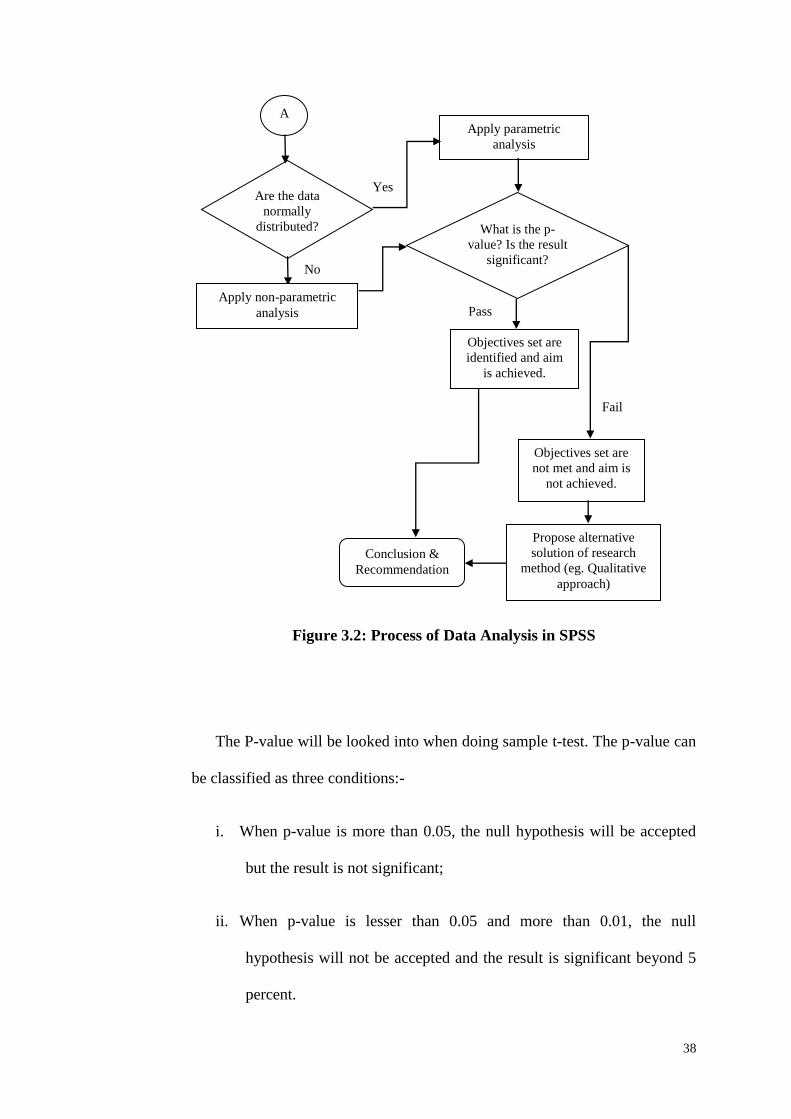
Figure 3.2: Process of Data Analysis in SPSS
The P-value will be looked into when doing sample t-test. The p-value can
be classified as three conditions:-
i. When p-value is more than 0.05, the null hypothesis will be accepted
but the result is not significant;
ii. When p-value is lesser than 0.05 and more than 0.01, the null
hypothesis will not be accepted and the result is significant beyond 5
percent.
Yes
Conclusion &
Recommendation
Are the data
normally
distributed?
No
Apply non-parametric
analysis
Apply parametric
analysis
A
What is the p-
value? Is the result
significant?
Pass
Objectives set are
identified and aim
is achieved.
Fail
Objectives set are
not met and aim is
not achieved.
Propose alternative
solution of research
method (eg. Qualitative
approach)

39
iii. When p-value is lesser than 0.01, the null hypothesis will not be
accepted and the result is significant beyond 1 percent.
3.3.1 Reliability Test
Cronbach’s Alpha test is used for test the internal consistency or
reliability of multiple question with “Likert” scale. Cronbach’s Alpha test
cannot be said as a statistical test, however, it is a coefficient of reliability ()
test. For a set of items that are formed to rate in scale, they will need internal
consistency. These all items shall pointing into same target and they shall
correlated to each other. If = 0 then means that the questions set are all
independent; if coefficient is approach to 1 then means that the internal
consistency of that set of questions set are reliable.
Figure 3.3: Cronbach’s Alpha Reliability Test
Entering Data in SPSS
Look for “Analyze” on top menu bar, then choose “Scale” from the drop
down menu and click “Reliability Analysis”
Choose the variables those need to test into “Item”
box of the pop-up window
Generate Output
If :- > 0.9 = Excellent;
> 0.8 = Good;
> 0.7 = Acceptable;
> 0.6 = Questionable;
> 0.5 = Poor;
< 0.5 = Unacceptable
END

40
3.3.2 Analysis of Variance Test
Generally, for parametric test one-way ANOVA test will be used;
while non-parametric test, Kruskal-Wallis H test will be used. On the other
hands, one-way ANOVA test is suitable to use for dependent value analysis
and normally use to analyze interval data and nominal data. For example,
salary given by company have to depend on the education level of a personnel,
so, salary will be the dependent value and education level of a personnel will
be the factor. However, Kruskal-Wallis H test is used for analyze the ordinal
data (Likert scale) with two or more groups of independent variables. For
example, satisfaction level of salary increment by company towards personnel
of different education level, so, satisfaction level of salary increment (Least
satisfied = 1 to Most satisfied =5) is the ordinal data and personnel of different
education level (Degree, Master, PhD) is the independent variables. Due to the
Question 5 and Question 6 (Refer to Appendix A) are considered as interval
data, so, Kruskal-Wallis H-test is carried out, the mean of every test variable
will be generated out. So that the null hypothesis, H0 can be said as accepted if
p-value is greater than 0.05; while can be said as rejected if p-value is lesser
than 0.05.
Entering Data in SPSS
Look for “Analyze” on top menu bar, then
choose “Nonparametric test” from the drop
down menu and click “K-Independent
Samples”
Drag all the methods into “Grouping
Variable” and Characteristics into “Test
Variable List”
A

41
Figure 3.4: Kruskal-Wallis H Test
3.3.3 Correlation Coefficient Test
Correlation coefficient test is used to test the relationships between two
variables. There are two types of correlation test which are Spearman’s rank
correlation coefficient and Pearson’s coefficient. Spearman’s rank correlation
coefficient is normally used for nonparametric rank statistic test. One the other
hand, Pearson’s r is a statistic that can identify the strength of two variables,
when r:-
- Approach to 1, this means the relationship between two variables is
strong;
- Approach to 0, this means the relationship between two variables is
weak;
If p-value:-
< 0.05, H0 is rejected, there is significant
different.
> 0.05, H0 is accepted, no significant different.
END
Set Confidence Level to 95% and
generate output
A

42
- Positive r value, this means that the first variable increase value then
the second variable also increase value;
- Negative r value, this means that one of the variable increase value,
then the second variable decrease value.
Figure 3.5: Pearson’s Correlation Test
Entering Data in SPSS
Look for “Analyze” on top menu bar, then
choose “Correlate” from the drop down menu
and click “Bivariate”
Choose the variables those need to test into
“Variables” box of the pop-up window and
choose “Two-tailed” test of significance
Generate Output
If r:- Approach to 1, strong relationship;
Approach to 0, weak relationship;
+ r, 1st & 2nd variables increase
value ;
- r, one variable increase value;
second variable decrease value
END
If sig. (2-tailed):-
> 0.05, no statistically significant
correlation between two variables;
< 0.05, there is statistically significant
correlation between two variables

43
CHAPTER FOUR
RESULTS & DISCUSSION
4.1 Introduction
The impact of quality control upon the construction of residential
building in Malaysia was studied and the survey questionnaire have been
collected from 100 numbers of respondents. For the first question set, all the
100 numbers of respondents are taken into account. After that, remaining 90
respondents are needed to answer all the following questions. There are 30
numbers of respondents from Developers; 30 numbers respondents from
Consultants; 30 numbers of respondents from Contractors. The survey
questionnaire can be referred from Appendix A and it has been separated in 3
sections.
- Section A: Expectation of potential growth value of residential
building when disposed.
- Section B: Profile of respondents
- Section C: Methods to reduce defects of residential building
- Section D: Techniques to reduce future maintenance cost of residential
building

44
Table 4.1: Group of Respondents
Frequency Percent Valid Percent
Cumulative
Percent
Valid Consultant 30 30.0 30.0 30.0
Contractor 30 30.0 30.0 60.0
Developer 30 30.0 30.0 90.0
None of
Above 10 10.0 10.0 100.0
Total 100 100.0 100.0
Figure 4.1: Pie Chart of Group of Respondents

45
4.2 Results of Section A
Firstly, the Descriptive Statistic Test by using Frequencies was done
for the Section A of questionnaire which were potential growth of value for
building when dispose. There are three selections of answers for this question
which are 5% to 7%; 8% to 10% and more than 10%.
Table 4.2: Expectation of potential growth value of residential building
when disposed
Frequency Percent Valid Percent
Cumulative
Percent
Valid >10% 9 9.0 9.0 9.0
5% - 7% 43 43.0 43.0 52.0
8% - 10% 48 48.0 48.0 100.0
Total 100 100.0 100.0
Figure 4.2: Pie Chart of Expectation Growth Value of Property

46
4.2.1 Discussion of Section A
From the Pie Chart above, we can see that 48% of the 100 respondents
feel that there will be 8% to 10% of growth value of residential building
without defects and less of future maintenance when they going to dispose the
property, and then follow by 43% feel that there will be 5% to 7% of growth
value and lastly followed by 9% feel that there will be more than 10% of
growth value when disposed. From the result we can see that, there are only
minor of respondents feel that the growth value of the disposed property can
be more than 10% because there are still many other factors can affect the
market value of property for a certain area. For example, development of the
surrounding area which the property located at and also the reputation of
developer for the property.
4.3 Results of Section B
For Section B, a graph analysis was done for years of work in
construction industry from 90 respondents (30 for Developer; 30 for
Consultant; 30 for Contractor). Besides that, Cronbach’s Alpha reliability test
and Pearson Correlation test were done for years of working in construction
industry and salary range given by their respective company. There are four
selections of answers for the question set for years of working in construction
industry which are less than 2 years; 2 to 5 years; 6 to 10 years and more than
10 years. Next, there are also four selections of answers set for the question of
salary range given by company which are less than 3,000; 3,000 to 5,000;
5,001 to 10,000 and more than 10,000.

47
Figure 4.3: Bar Chart of Job Role vs. Years of Working
Table 4.3: Years of Working in Construction Industry
Frequen
cy Percent
Valid
Percent
Cumulative
Percent
Valid < 2yrs 8 8.9 8.9 8.9
2 – 5 yrs 33 36.7 36.7 45.6
6 – 10 yrs 33 36.7 36.7 82.2
>10 yrs 16 17.8 17.8 100.0
Total 90 100.0 100.0

48
Figure 4.4: Bar Chart of Job Role vs. Salary Range
Table 4.4: Salary Range given by Company
Frequency Percent Valid Percent Cumulative Percent
Valid < 3000 8 8.9 8.9 8.9
3000 - 5000 32 35.6 35.6 44.4
5001 - 10000 33 36.7 36.7 81.1
>10000 17 18.9 18.9 100.0
Total 90 100.0 100.0

49
4.3.1 Pearson’s Correlation Test of Section B
Table 4.5: Descriptive Statistics of Section B
Mean Std. Deviation N
Years of Work 2.63 .880 90
Salary 2.66 .889 90
Table 4.6: Pearson Correlations of Section B
Years of Work Salary
Years of Work Pearson Correlation 1 .943**
Sig. (2-tailed) .000
N 90 90
Salary Pearson Correlation .943** 1
Sig. (2-tailed) .000
N 90 90
**. Correlation is significant at the 0.01 level (2-tailed).
Figure 4.5: Scatterplot of Section B Analysis

50
4.3.2 Cronbach’s Alpha Reliability Test of Section B
Table 4.7: Reliability Statistics of Section B
Cronbach's Alpha
Cronbach's Alpha Based
on Standardized Items N of Items
.971 .971 2
Table 4.8: Inter-Item Correlation Matrix of Section B
Years of Work Salary
Years of Work 1.000 .943
Salary .943 1.000
Table 4.9: Item-Total Statistics of Section B
Scale Mean if
Item Deleted
Scale Variance
if Item Deleted
Corrected
Item-Total
Correlation
Squared
Multiple
Correlation
Cronbach's
Alpha if Item
Deleted
Years of Work 2.66 .790 .943 .889 .
Salary 2.63 .774 .943 .889 .
4.3.3 Discussion of Section B
From the bar chart shown above, there are 8 numbers of respondents
working less than 2 years in construction industry who are all working for
consultant. Besides that, there are 33 numbers of respondents working 2 years
to 5 years in construction industry who are 15 numbers from consultant, 10
numbers from contractor and 8 numbers from developer. Next, there are also
33 numbers of respondents working 6 years to 10 years in construction
industry who are 5 numbers from consultant; 14 numbers from contractor and
14 numbers from developer. Lastly, there are 16 numbers of respondents

51
working more than 10 years in construction industry who are 2 numbers from
consultant; 6 numbers from contractor and 8 numbers from developers.
For Pearson’s correlation test did and the results shown above, the r-
value is 0.943 for the relationship of years of working in construction industry
and salary range given by respective company and the sig. (2-tailed) value is
lesser than 0.05. Moreover, from the scatterplot shown for this two variables,
the r-value is 0.889. Therefore, it can conclude that this two variables have a
strong relationship between each other and there is statistically signification
correlation between these two variables. The positive value of r shown that
when the value of first variable increase and the value of second variable also
increase. From the result shown, it can said that when the years of working by
respondents in construction industry, then their salaries paid by their
companies are also increased. It is important for the range of salary paid by
company is based on the years of working by respondents. This is because the
range of salary can improve the efficiency of works by respondents as many
will think that “I am working for what I have been paid”. When the efficiency
of work become lower, then the chances to get mistakes done in work will
become higher. If the mistakes done in work become higher, then there are
more chance to gain defect in design or construction period. Next, Cronbach’s
Alpha reliability test has been done for Section B. The α value is 0.971 and
this consider as “Excellent” so it can be concluded that the internal
consistency of this set of question is reliable.

52
4.4 Result of Section C
For Section C, a question was set to get the respondents’ opinion on
the methods to reduce defects of residential building in Malaysia. This
question was answered by Likert scale which 1= Never Agree; 2= Seldom
Agree; 3= Sometimes Agree; 4= Always Agree and 5= Completely Agree.
Cronbach’s Alpha reliability test, Pearson’s correlation test and one-way
Kruskal-Wallis H test were used to analyse this question. For Kruskal-Wallis
test, a null hypothesis, H0 has been set which are “Methods provided can help
to reduce defects of residential building in Malaysia.” There are seven
methods provided to the respondents to rate on it, which are:-
i. Design Coordination Meeting among Consultants
ii. Peer Review for Design
iii. Sufficient Timeline for Design
iv. Design Clarification Meeting with Contractor
v. Value Engineering Program
vi. Weekly Site Inspection for Quality Assurance and Quality Control
vii. Invite Representative from Manufacturer for Guidance of Particular
New Building Technology

53
4.4.1 Cronbach’s Alpha Reliability Test of Section C
Table 4.10: Reliability Statistics of Section C
Cronbach's Alpha
Cronbach's Alpha Based
on Standardized Items N of Items
.979 .983 7
Table 4.11: Inter-Item Correlation Matrix of Section C
Design
Coordinatio
n Meeting
among
Consultants
Peer
Review for
Design
Sufficient
Timeline
for Design
Design
Clarificatio
n Meeting
with
Contractor
Value
Engineerin
g Program
Weekly
Site
Inspection
for Quality
Assurance
and Quality
Control
Invite
Representat
ive from
Manufactur
er for
Guidance
of
Particular
New
Building
Technolog
y
Design
Coordination
Meeting among
Consultants
1.000 1.000 .861 1.000 .766 1.000 1.000
Peer Review for
Design 1.000 1.000 .861 1.000 .766 1.000 1.000
Sufficient Timeline
for Design .861 .861 1.000 .861 .654 .861 .861
Design Clarification
Meeting with
Contractor
1.000 1.000 .861 1.000 .766 1.000 1.000
Value Engineering
Program .766 .766 .654 .766 1.000 .766 .766
Weekly Site
Inspection for
Quality Assurance
and Quality Control
1.000 1.000 .861 1.000 .766 1.000 1.000
Invite
Representative from
Manufacturer for
Guidance of
Particular New
Building
Technology
1.000 1.000 .861 1.000 .766 1.000 1.000

54
Table 4.12: Item-Total Statistics of Section C
Scale Mean if
Item Deleted
Scale Variance
if Item Deleted
Corrected
Item-Total
Correlation
Squared
Multiple
Correlation
Cronbach's
Alpha if Item
Deleted
Design Coordination
Meeting among
Consultants
29.77 1.192 .986 . .972
Peer Review for Design 29.77 1.192 .986 . .972
Sufficient Timeline for
Design 29.78 1.186 .852 . .981
Design Clarification
Meeting with Contractor 29.77 1.192 .986 . .972
Value Engineering
Program 29.79 1.180 .761 . .991
Weekly Site Inspection for
Quality Assurance and
Quality Control 29.77 1.192 .986 . .972
Invite Representative from
Manufacturer for
Guidance of Particular
New Building Technology
29.77 1.192 .986 . .972
4.4.2 Pearson’s Correlation Test of Section C
Table 4.13: Pearson’s Correlations of Section C
Design
Coordinat
ion
Meeting
among
Consultan
ts
Peer
Review
for Design
Sufficient
Timeline
for Design
Design
Clarificati
on
Meeting
with
Contracto
r
Value
Engineeri
ng
Program
Weekly
Site
Inspection
for
Quality
Assurance
and
Quality
Control
Invite
Represent
ative from
Manufact
urer for
Guidance
of
Particular
New
Building
Technolo
gy
Design
Coordination
Meeting among
Consultants
Pearson
Correlation 1 1.000** .861** 1.000** .766** 1.000** 1.000**
Sig. (2-tailed) .000 .000 .000 .000 .000 .000
N 90 90 90 90 90 90 90

55
Peer Review for
Design
Pearson
Correlation 1.000** 1 .861** 1.000** .766** 1.000** 1.000**
Sig. (2-tailed) .000 .000 .000 .000 .000 .000
N 90 90 90 90 90 90 90
Sufficient
Timeline for
Design
Pearson
Correlation .861** .861** 1 .861** .654** .861** .861**
Sig. (2-tailed) .000 .000 .000 .000 .000 .000
N 90 90 90 90 90 90 90
Design
Clarification
Meeting with
Contractor
Pearson
Correlation 1.000** 1.000** .861** 1 .766** 1.000** 1.000**
Sig. (2-tailed) .000 .000 .000 .000 .000 .000
N 90 90 90 90 90 90 90
Value Engineering
Program
Pearson
Correlation .766** .766** .654** .766** 1 .766** .766**
Sig. (2-tailed) .000 .000 .000 .000 .000 .000
N 90 90 90 90 90 90 90
Weekly Site
Inspection for
Quality Assurance
and Quality
Control
Pearson
Correlation 1.000** 1.000** .861** 1.000** .766** 1 1.000**
Sig. (2-tailed) .000 .000 .000 .000 .000 .000
N 90 90 90 90 90 90 90
Invite
Representative
from
Manufacturer for
Guidance of
Particular New
Building
Technology
Pearson
Correlation 1.000** 1.000** .861** 1.000** .766** 1.000** 1
Sig. (2-tailed) .000 .000 .000 .000 .000 .000
N
90 90 90 90 90 90 90
**. Correlation is significant at the 0.01 level (2-tailed).
Table 4.14: Descriptive Statistics of Section C
Mean Std. Deviation N
Design Coordination Meeting
among Consultants 4.97 .181 90
Peer Review for Design 4.97 .181 90
Sufficient Timeline for Design 4.96 .207 90
Design Clarification Meeting with
Contractor 4.97 .181 90
Value Engineering Program 4.94 .230 90
Weekly Site Inspection for Quality
Assurance and Quality Control 4.97 .181 90
Invite Representative from
Manufacturer for Guidance of
Particular New Building
Technology
4.97 .181 90

56
4.4.3 Kruskal-Wallis H Test of Section C
Table 4.15: Mean Ranks of Section C
Job Role N Mean Rank
Design Coordination
Meeting among Consultants
Developer 30 45.50
Consultant 30 45.50
Contractor 30 45.50
Total 90
Peer Review for Design Developer 30 45.50
Consultant 30 45.50
Contractor 30 45.50
Total 90
Sufficient Timeline for
Design
Developer 30 44.50
Consultant 30 46.00
Contractor 30 46.00
Total 90
Design Clarification Meeting
with Contractor
Developer 30 45.50
Consultant 30 45.50
Contractor 30 45.50
Total 90
Value Engineering Program Developer 30 43.50
Consultant 30 46.50
Contractor 30 46.50
Total 90
Weekly Site Inspection for
Quality Assurance and
Quality Control
Developer 30 45.50
Consultant 30 45.50
Contractor 30 45.50
Total 90
Invite Representative from
Manufacturer for Guidance
of Particular New Building
Technology
Developer 30 45.50
Consultant 30 45.50
Contractor 30 45.50
Total 90

57
Table 4.16: Kruskal Wallis H-Test of Section C
Design
Coordinati
on Meeting
among
Consultant
s
Peer
Review for
Design
Sufficient
Timeline
for Design
Design
Clarificatio
n Meeting
with
Contractor
Value
Engineerin
g Program
Weekly
Site
Inspection
for Quality
Assurance
and
Quality
Control
Invite
Represent
ative from
Manufactur
er for
Guidance
of
Particular
New
Building
Technolog
y
Chi-
Square .000 .000 .517 .000 1.675 .000 .000
df 2 2 2 2 2 2 2
Asymp.
Sig. 1.000 1.000 .772 1.000 .433 1.000 1.000
a. Kruskal Wallis Test
b. Grouping Variable: Job Role
4.4.4 Discussion of Section C
From the Cronbach’s Alpha reliability test done for this question, the α
value is 0.979 and consider as “Excellent” since it is more than 0.9. So, it can
be concluded that the internal consistency of all these variables are reliable.
Next, from the Pearson’s correlation test done, the r-value shown that
all are approaching to 1 whereby it can be concluded that all the variables are
having strong relationships among each other and the sig. (2-tailed) all are less
than 0.05, so there are statistically signification correlation among all the
variables.

58
After that, from the Kruskal-Wallis H test done, the p-value are all
greater than 0.05, so it can be concluded that H0 is accepted and there are no
significant different among all variables. . Therefore it can be said that all the
methods listed for this question are all considered as can reduce the defects of
residential building in Malaysia.
From the mean report as shown above, the mean of “Value
Engineering Program” is having the lowest value which is 43.50, followed by
“Sufficient Timeline for Design” which is 44.50 and the rest are all having
same mean value which are 45.50 and 46.50.
Although for the method “Value Engineering Program” which has
mean rank of 43.50 from Developer which can be considered as high value, it
is still the lowest mean among all methods. Value engineering program is a
method can help to the project owner to save cost while all the proposed
design will be studied before the project is carried out. However, not all the
companies will carry out this process as some of the projects are awarded as
“Design and Build”. The normal practice of design and build is the project
owner will set a budget for the project and the appointed consultants or
contractors have to carry out their work within the budget. This is because
some of the project owners may not have technical background on
construction management so value engineering program cannot be carried out
and they need to fully depend on what the consultants and contractors
provided to them.
Secondly, for the method “Sufficient Timeline for Design” which has a
mean rank of 44.50 from Developer. Sufficient timeline for design is actually

59
important for all the consultants. This is because consultants need more times
to search for the design information which need to be suit for the requirement
set by project owner and also they need time for feasibility study of the
development for the particular area. However, the consultants are always
being chased by the project owner to come out with design due to the project
cannot be delayed for long time and this has caused the consultants always did
some careless mistake in design due to insufficient of time for design.
On the others hand, the rest of methods are having mean of 45.50 and
46.50 which are “Design Coordination Meeting among Consultants”, “Peer
Review for Design”, “Design Clarification Meeting with Contractor”, Weekly
Site Inspection for Quality Assurance and Quality Control”, and lastly “Invite
Representative from Manufacturer for Guidance of Particular New Building
Technology”. These five methods are very important for reduce the defects of
residential building too. The method “Design Coordination Meeting among
Consultants” can help to reduce defects is because during the design
coordination meeting, all the consultants can raise out their queries on design
and voice out necessary opinion for design so that every consultants can have
a very clear picture to proceed on what they should do to help each other in
design but not think like “What other will do if I have designed on this way”.
Two way communication is always very important for people who always
need to work as a group. Therefore, they cannot assume others to follow the
way they have worked. Next, the method of “Peer Review for Design” can
help to minimize the mistake done in design stage as the consultants can asked
their colleagues to cross checking on the design they have done as when they
have faced for the same things for too long time then there are hard for them to

60
find out the mistake of their own design. After that, the method of “Design
Clarification Meeting with Contractor” can help to reduce defects of building
is due to contractor can know clearly the design before they start work and
they can raise out queries if they have found any discrepancy from the design.
Besides that, the method of “Weekly Site Inspection for Quality Assurance
and Quality Control” can help to monitor the work done by contractor at
construction site. The clerk of work can then point out the mistake done on
site and give a timeline for the contractor to rectify it. This can help to ensure
the quality of work and hence reduce the defects of building. Lastly, the
method of “Invite Representative from Manufacturer for Guidance of
Particular New Building Technology” can also help to reduce defects as some
of the materials were new implemented and need to be installed by using a
special skill, for example Polypropylene Random Copolymer (PPR) pipe
which is currently used to replace copper pipe for hot water service. PPR pipe
need a special weld & joint skill to connect the pipe. If the workers on site is
not fully educated, they may spoilt the pipe or cause leakage of pipe in future
as the joining is not done properly. Therefore, the contractor who proposed to
use the materials can invite the supplier of this product to guide their workers
for piping installation on site.
4.5 Result of Section D
For Section D, a question was set to get the respondents’ opinion on
the techniques to minimize future maintenance cost of residential building in
Malaysia. Similar as Section C, this question was answered by Likert scale

61
which 1= Never Agree; 2= Seldom Agree; 3= Sometimes Agree; 4= Always
Agree and 5= Completely Agree. Cronbach’s Alpha reliability test, Pearson’s
correlation test and Kruskal-Wallis H test were also used to analyse this
question. For Kruskal-Wallis test, a null hypothesis, H0 has been set which are
“Techniques provided can help to minimize future maintenance cost of
residential building.” There are seven techniques provided to the respondents
to rate on it, which are:-
i. Less Complexity of Building Design
ii. Cost Allocation for Future Maintenance during Design Stage
iii. Life Cycle Cost Techniques
iv. Employ Skilled / Educated Workers during Construction
v. Standardize Specification of Material Used for Construction
vi. As-Built Drawing and Operation Manual to be given to Building User
vii. Conduct Quality Assessment and aim for High Score
4.5.1 Cronbach’s Alpha Reliablity Test of Section D
Table 4.17: Reliability Statistics of Section D
Cronbach's Alpha
Cronbach's Alpha Based
on Standardized Items N of Items
.965 .965 7

62
Table 4.18: Inter-Item Correlation Matrix of Section D
Less
Complexity
of Building
Design
Cost
Allocation
for Future
Maintenanc
e during
Design
Stage
Life Cycle
Cost
Technique
Employ
Skilled/Edu
cated
Workers
during
Constructio
n
Standardize
Specificatio
n of
Material
Used for
Constructio
n
As-Built
Drawing
and
Operation
Manual to
be given to
Building
User
Conduct
Quality
Assessment
and aim for
High Score
Less Complexity of
Building Design 1.000 .788 .907 .713 .907 .713 .907
Cost Allocation for
Future Maintenance
during Design Stage
.788 1.000 .713 .907 .713 .907 .713
Life Cycle Cost
Technique .907 .713 1.000 .643 1.000 .643 1.000
Employ
Skilled/Educated
Workers during
Construction
.713 .907 .643 1.000 .643 1.000 .643
Standardize
Specification of
Material Used for
Construction
.907 .713 1.000 .643 1.000 .643 1.000
As-Built Drawing
and Operation
Manual to be given
to Building User
.713 .907 .643 1.000 .643 1.000 .643
Conduct Quality
Assessment and aim
for High Score
.907 .713 1.000 .643 1.000 .643 1.000

63
Table 4.19: Item-Total Statistics of Section D
Scale Mean if
Item Deleted
Scale Variance
if Item Deleted
Corrected Item-
Total
Correlation
Squared
Multiple
Correlation
Cronbach's
Alpha if Item
Deleted
Less Complexity of
Building Design 29.61 1.813 .908 . .957
Cost Allocation for Future
Maintenance during Design
Stage
29.61 1.836 .866 . .960
Life Cycle Cost Technique 29.62 1.766 .901 . .957
Employ Skilled/Educated
Workers during
Construction
29.62 1.811 .823 . .963
Standardize Specification
of Material Used for
Construction
29.62 1.766 .901 . .957
As-Built Drawing and
Operation Manual to be
given to Building User
29.62 1.811 .823 . .963
Conduct Quality
Assessment and aim for
High Score
29.62 1.766 .901 . .957
4.5.2 Pearson’s Correlations Test of Section D
Table 4.20: Pearson’s Correlations of Section D
Less
Comple
xity of
Building
Design
Cost
Allocati
on for
Future
Mainten
ance
during
Design
Stage
Life
Cycle
Cost
Techniq
ue
Employ
Skilled/
Educate
d
Workers
during
Construc
tion
Standard
ize
Specific
ation of
Material
Used for
Construc
tion
As-Built
Drawing
and
Operatio
n
Manual
to be
given to
Building
User
Conduct
Quality
Assessm
ent and
aim for
High
Score
Less
Complexity of
Pearson
Correlation 1 .788** .907** .713** .907** .713** .907**

64
Building
Design
Sig. (2-
tailed) .000 .000 .000 .000 .000 .000
N 90 90 90 90 90 90 90
Cost Allocation
for Future
Maintenance
during Design
Stage
Pearson
Correlation .788** 1 .713** .907** .713** .907** .713**
Sig. (2-
tailed) .000 .000 .000 .000 .000 .000
N 90 90 90 90 90 90 90
Life Cycle Cost
Technique
Pearson
Correlation .907** .713** 1 .643** 1.000** .643** 1.000**
Sig. (2-
tailed) .000 .000 .000 .000 .000 .000
N 90 90 90 90 90 90 90
Employ
Skilled/Educate
d Workers
during
Construction
Pearson
Correlation .713** .907** .643** 1 .643** 1.000** .643**
Sig. (2-
tailed) .000 .000 .000 .000 .000 .000
N 90 90 90 90 90 90 90
Standardize
Specification of
Material Used
for
Construction
Pearson
Correlation .907** .713** 1.000** .643** 1 .643** 1.000**
Sig. (2-
tailed) .000 .000 .000 .000 .000 .000
N 90 90 90 90 90 90 90
As-Built
Drawing and
Operation
Manual to be
given to
Building User
Pearson
Correlation .713** .907** .643** 1.000** .643** 1 .643**
Sig. (2-
tailed) .000 .000 .000 .000 .000 .000
N 90 90 90 90 90 90 90
Conduct
Quality
Assessment and
aim for High
Score
Pearson
Correlation .907** .713** 1.000** .643** 1.000** .643** 1
Sig. (2-
tailed) .000 .000 .000 .000 .000 .000
N 90 90 90 90 90 90 90
**. Correlation is significant at the 0.01 level (2-tailed).
Table 4.21: Descriptive Statistics of Section D
Mean Std. Deviation N
Less Complexity of
Building Design 4.94 .230 90
Cost Allocation for Future
Maintenance during Design
Stage
4.94 .230 90
Life Cycle Cost Technique 4.93 .251 90
Employ Skilled/Educated
Workers during
Construction
4.93 .251 90

65
Standardize Specification of
Material Used for
Construction
4.93 .251 90
As-Built Drawing and
Operation Manual to be
given to Building User
4.93 .251 90
Conduct Quality
Assessment and aim for
High Score
4.93 .251 90
4.5.3 Kruskal-Wallis H Test of Section D
Table 4.22: Mean Ranks of Section D
Job Role N Mean Rank
Less Complexity of Building Design Developer 30 45.00
Consultant 30 46.50
Contractor 30 45.00
Total 90
Cost Allocation for Future
Maintenance during Design Stage
Developer 30 45.00
Consultant 30 45.00
Contractor 30 46.50
Total 90
Life Cycle Cost Technique Developer 30 45.50
Consultant 30 45.50
Contractor 30 45.50
Total 90
Employ Skilled/Educated Workers
during Construction
Developer 30 45.50
Consultant 30 45.50
Contractor 30 45.50
Total 90
Standardize Specification of Material
Used for Construction
Developer 30 45.50
Consultant 30 45.50
Contractor 30 45.50
Total 90
As-Built Drawing and Operation
Manual to be given to Building User
Developer 30 45.50
Consultant 30 45.50
Contractor 30 45.50
Total 90
Conduct Quality Assessment and Developer 30 45.50

66
aim for High Score Consultant 30 45.50
Contractor 30 45.50
Total 90
Table 4.23: Kruskal-Wallis H Test of Section D
Less
Complexity
of Building
Design
Cost
Allocation
for Future
Maintenan
ce during
Design
Stage
Life Cycle
Cost
Technique
Employ
Skilled/Edu
cated
Workers
during
Constructio
n
Standardiz
e
Specificati
on of
Material
Used for
Constructio
n
As-Built
Drawing
and
Operation
Manual to
be given to
Building
User
Conduct
Quality
Assessme
nt and aim
for High
Score
Chi-
Square .419 .419 .000 .000 .000 .000 .000
df 2 2 2 2 2 2 2
Asymp.
Sig. .811 .811 1.000 1.000 1.000 1.000 1.000
a. Kruskal Wallis Test
b. Grouping Variable: Job Role
4.5.4 Discussion of Section D
From the Cronbach’s Alpha reliability test done for this question, the α
value is 0.965 and consider as “Excellent” since it is more than 0.9. So, it can
be concluded that the internal consistency of all these variables are reliable.
Next, from the Pearson’s correlation test done, the r-value shown that
all are approaching to 1 whereby it can be concluded that all the variables are
having strong relationships among each other and the sig. (2-tailed) all are less

67
than 0.05, so there are statistically signification correlation among all the
variables.
After that, from the Kruskal-Wallis test done, the p-value are all
greater than 0.05, so it can be concluded that H0 is accepted and there are no
significant different among all variables. Therefore it can be said that all the
techniques listed for this question are all considered as can minimize the future
maintenance cost of residential building in Malaysia.
From the mean report shown above, there are two techniques having
the same mean of 45.00 and the other five techniques having the same mean of
45.50. The two techniques have the same mean rank of 45.00 are “Less
Complexity of Building Design” and “Cost Allocation for Future Maintenance
during Design Stage”. For the technique “Less Complexity of Building
Design” can actually help to reduce the future maintenance cost of building
due to the simpler the design is, the easier the work to be done. Nowadays, all
the building designed are designed by software like AutoCAD and this has
caused the designers to keep on adding in a lot of trendy design which they
think this is can be a trademark of building. However, after the buildings
completed, there will be a lot of future maintenance issue like the materials for
repairing work is not easy to get from market. Moreover, some of the special
design cannot be simply done by normal human being and this will caused a
lot of issue for future maintenance too. Next, the techniques of “Cost
Allocation for Future Maintenance during Design Stage” can help the building
owner to spend lesser for maintenance cost as the cost allocation set by the

68
builder can be captured inside their Defect Liability Period (DLP) and hence
they can prolong their DLP to longer period.
The five techniques with mean of 45.50 are “Life Cycle Cost
Technique”, “Employ Skilled / Educated Workers during Construction”,
“Standardize Specification of Material Used for Construction”, “As-Built
Drawing and Operation Manual to be given to Building User”, and “Conduct
Quality Assessment and aim for High Score”. For the technique “Life Cycle
Cost Technique” is actually help the project owner to come out an economical
design for their building. They can do a feasibility study on their design since
beginning of planning stage until the future maintenance stage and hence this
study can help them to understand very well on what is the design can help to
spend lesser for current as well as future. Next, the technique of “Employ
Skilled / Educated Workers during Construction Stage” can actually help the
contractor to ensure the workmanship apply to the building is up to standard
and quality and hence this can help to reduce unnecessary spending of
repairing cost or maintenance cost in future. Besides that, “Standardize
Specification of Material Used for Construction” is very important as
sometimes the contractor like to use alternative brand which can help them to
gain cost saving and indirectly increase their profit margin. This is because the
alternative brand used by contractor may not same quality as what have
specified and when time getting longer this may cause issue for the building
owner to spend their own money to change it. After that, “As-Built Drawing
and Operation Manual to be given to Building Owner” is helpful due to the
building owner can take extra precaution when they are using the device or
products of the building. Lastly, the technique of “Conduct Quality

69
Assessment and aim for High Score” is actually very helpful in quality
assurance of the building. Quality Assessment such as CONQUAS and
QLASSIC have set a minimum score for the contractor to achieve. However,
if high score is set for the contractor to achieve then they cannot simply carry
out their work without any standard requirement or quality. This can help to
reduce defects of building and hence to minimize the future maintenance cost
of building too.

70
CHAPTER FIVE
CONCLUSION
5.1 Introduction
All the aim and objectives of this research are concluded in this
chapter. The impact of quality control upon the construction of residential
building in Malaysia was studied. The methods to reduce defects and
techniques to reduce future maintenance cost of residential building in
Malaysia were also discussed.
5.2 Methods to Reduce Defects of Residential Buildings in Malaysia
From the results analysed from survey questionnaire, all the methods
specified in the question are considered as equally effective to help in reduce
the defects of residential building. There are few can be applied during
construction stage such as design coordination meeting among consultants,
peer review of design, sufficient timeline for design, design clarification
meeting with contractor and value engineering program. On the others hand,
there are few methods can be applied during construction stage which are
weekly site inspection for quality assurance and invite representative from
manufacturer for guidance of new building technology. For a project to be
success, it need to plan, implement and monitor by using sufficient of time and

71
also communication among each and others. By applying all these methods
start from planning stage up to construction stage, the chances for defects to
occur in building will be minimized.
5.3 Techniques to Minimize Future Maintenance Cost of Residential
Buildings in Malaysia
All the techniques listed in the question are considered as useful to
help in reduce future maintenance cost of residential building. Some of them
can be executed during planning stage such as less complexity of building
design, cost allocation for future maintenance during design stage, life cycle
cost technique, and standardize specification of materials used for
construction. On the others hand, there are few methods can be executed
during construction stage which are employ skilled / educated worker during
construction, as-built drawing and operation manual to be given to building
user and conduct quality assessment and aim for high score. For contractors, if
a building is constructed with quality but not quantity while for designers, if a
building is designed based on reality but not imagination, then the future
maintenance cost actually can be reduced a lot. The building owner maybe just
need to spend a small portion of money to touch up their building appearance
after many years later but not to frustrate on all the fussy things and thinking
of how to maintain on it or change it. This is very important to enforce to do
the things right at the first time.

72
5.4 Conclusion and Recommendation
Quality control is not only an action to be taken but is a transforming
of human behaviour. It can be said has high impact towards the construction of
residential buildings in Malaysia. This is because quality control of
construction works can help to reduce the defects occur in residential
buildings and minimize the future maintenance cost of buildings and therefore
the market value of the property will also increase due to these factors.
This research done only shown the point of view from the 100
respondents but cannot be said as this can be represented the overall of
construction industry. For future research, it is recommended the researcher
can wider the area of research to do for more types of buildings such as
industry, high-rise buildings and so on, however not only in Malaysia but also
for other countries. Future researcher can also do on mixed approach study so
they can understand better on how the methods of reduce defects and
techniques to minimize future maintenance cost are actually being applied in
construction industry and the constraint faced by the construction personnel
when carry out the methods. From these, it can be seen clearer whether the
cultures from other countries is the same as Malaysia and also the concern of
different types of buildings.

73
REFERENCES
Abdul Lateef, Olanrewaju. (2009). Building maintenance management in
Malaysia. Journal of Building Appraisal. Vol. 4. 207 – 214.
Abdul Rahman, H., Berawi, M. A., Berawi, A. R., Mohamed, O.,
Othman, M., and Yahya, I. A. (2006). Delay mitigation in the Malaysian
construction industry. Journal of Construction Engineering and
Management. Vol. 132. 125-133.
Abdulmohsen Alhammed, Sadi. (1997). The effects of faulty design on
building maintenance. Journal of Quality Management. Vol. 3, 29 – 39.
Ali, A.S. and Wen, K.H. (2011). Building Defects: Possible solution for
poor construction workmanship. Journal of Building Performance. Vol. 2.
Ali, Malsarah, Jaafar., Ab. Nasir., Kammarudin, Ibrahim., and Abdul
Rahman, Hamzah. (2012). Construction quality of school buildings using
the industrialized building system. Malaysian Construction Research
Journal. Vol. 11 – No. 2.
Al-Khatam, Jalal A. (2003). Building Maintenance Cost. College of
Environmental Design, Construction Engineering and Management.
Aras Agus Salim, Nuzaihan., Muhamad Salleh, Naziah, and Zahari, Nurul
Fadzila. (2016). Design Failure Affecting Maintenance Management on
Public Higher Education Institution in Malaysia. MATEC Web of
Conferences. Vol. 66.
Azahar, N., Karim, N.A., Hassan, S.H. and Eman, J. (2011). A study of
contribution factors to building failures and defects in construction
industry. Procedia Engineering. Vol. 20.

74
Block, Kenneth M. and Cullan, John Patrick. (2010). Statutes of
Limitations for Design and Construction Defects. New York Lam Journal.
Vol. 244 – No. 92.
Cho, Y. J., Hyun, C. T., Lee, S. B. and Diekmann, J. (2006).
Characteristics of contractor’s liabilities for defects and defective works
in Korean public projects Journal of Professional Issues in Engineering
Education and Practice, Vol. 132, Issue 2, pp. 180-186.
Cornish, Rosie. (2006). Oneway analysis of variance. Mathematics
Learning Support Centre.
Creswell, J.W. (2003). Research Design: Qualitative, Quantitative, and
Mixed Methods Approaches. 2nd Ed. SAGE Publications.
Dunk, A.S., (2004). Product life cycle cost analysis: the impact of
customer profiling, competitive advantage, and quality of IS information.
Management Accounting Research, Vol. 15. pp.401- 414.
Ekambaram, Palaneeswaran, Thomas Ng, and Mohan Kumaraswamy.
(2006). Client satisfaction and quality management systems in contractor
organizations. Journal of Building and Environment. Vol. 41. 1557-1570.
Garth, Andrew. (2008). Analysing data using SPSS. Sheffeild Hallam
University.
Gatlin, Frank. (2013). Identifying & Managing Design and Construction
Defects. Construction Insight from Hindsight. Issue 5.
Hatzichristos, Thomas. (2003). Real estate appraisal: a review of
valuation methods. Journal of Property Investment & Finance Vol. 21,
pp. 383 – 401.

75
Hauke, Jan. (2011). Comparison of values of Pearson’s and Spearman’s
correlation coefficients on the same sets of data. Quaestiones
Geographicae. Vol. 30.
Joshua, J. M. (2009). The Seven Wonders. Ancient History Encyclopedia.
Koehn, E. & Datta, N. (2003). Quality, environmental and health and
safety management systems for construction engineering. Journal of
Construction Engineering and Management. Vol. 129, 562-569.
Krejcie, Robert V. (1970). Determining Sample Size for Research
Activities. Educational and Psychological Measurement Vol.30, 607 –
610.
Low, S.P. (2001). Improving maintenance and reducing building defects
through ISO 9000. Journal of Quality in Maintenance Engineering. Vol.
7. pp. 6 – 24.
Neely, E. (1991). Life Cycle Maintenance Costs by Facility Use.
Journal of Construction Engineering & Management, Vol. 117.
Ojo, Ayodeji S. (2008). Defect Liability Period: Employer’s right and
contractor’s liabilities examined. Ministry of National Development
Mahe, Seychelles.
Raymond, C.M. (1991). Preventive Maintenance of Buildings, Chapman
and Hall.
Simon, S.M. (1979). Construction Contracts and Claims. McGraw-Hill
Book Company.
Sufian, Ahmad. (2013). Some common maintenance problems and
building defects: Our experiences. Procedia Engineering. Vol. 54.

76
Sufian, Azlinor. And Ab. Rahman, Rozanah. (2008). Quality housing:
Regulatory and administrative framework in Malaysia. Journal of
Economics and Management. Vol. 2. 141 – 156.
Sugiyono. (2012). Qualitative and Quantitative Research Methods.
R&D Bandung: Alfabeta.
Sweet, J.J. (1993). Avoiding or Minimizing Construction Litigation.
Wiley Law Publication.
The Government of Western Australia. (2014). The Impact of New
Technologies on the Construction Industry. Construction Training Fund.
Tope Femi, Okuntade. (2014). Effect of Faulty Construction on Building
Maintenance. International Journal of Technology Enhancements and
Emerging Engineering Research. Vol.2 Issue 3.
Warren-Myers, George. (2012). The value of sustainability in real
estate: a review from a valuation perspective. Journal of Property
Investment & Finance Vol. 30, pp. 115-144.
Wood, L.C. (2014). Defects in Affordable Housing Projects in Klang
Valley Malaysia. Journal of Performance of Constructed Facilities. Vol.
28. 272 - 285.

A-1
APPENDICES
APPENDIX A: Questionnaire
SURVEY: The Contribution of Quality Control towards Residential
Building in Malaysia
This questionnaire consists of 4 Sections:-
Section A: The expectation growth of value for residential building
Section B: Profile of respondents
Section C: Methods used to reduce defects of residential building
Section D: Techniques used to reduce future maintenance cost of residential
building
Dear Sir / Madam,
Your sincere help is much needed from me to participate in this research study
about “The Contribution of Quality Control towards Residential Building in
Malaysia”.
Your cooperation is much appreciated.
Thank you.
Yong Shyn Ying
Master of Project Management, Faculty of Engineering and Science
Universiti Tunku Abdul Rahman
Email: [email protected]

A-2
SECTION A
1. With the defects free and the minimization of maintenance cost of
residential building, what do you think is the potential growth of value
when you are going to sell the building?
(To be rated by following the percentage of purchase price)
i. Less than 5%
ii. 5% to 7%
iii. 8% to 10%
iv. More than 10%

A-3
SECTION B
2. What is your job role in construction industry? (If the answer chosen is
“None of the above”, please return this questionnaire to me.)
i. Developer
ii. Consultant
iii. Contractor
iv. None of the above
3. How many years have you worked in construction industry?
i. Less than 2 years
ii. 2 years to 5 years
iii. 6 years to 10 years
iv. More than 10 years
4. What is your current salary paid by your company?
i. Less than RM 3, 000
ii. RM 3,000 to RM 5,000
iii. RM 5,001 to RM 10,000
iv. More than RM 10,000

A-4
SECTION C
5. Below listed are the methods can help to reduce defects of residential
building in Malaysia. (Please rate your answers by following the scale
given)
1 – Never Agree; 4 – Always Agree;
2 – Seldom Agree; 5 – Completely Agree
3 – Sometimes Agree;
Item Description 1 2 3 4 5
i. Design Coordination Meeting among Consultants
ii. Peer Review for Design
iii. Sufficient Timeline for Design
iv. Design Clarification Meeting with Contractor
v. Value Engineering Program
vi. Weekly Site Inspection for Quality Assurance and
Quality Control
vii. Invite Representative from Manufacturer for
Guidance of Particular New Building Technology

A-5
SECTION D
6. Below listed are the techniques can help to minimize future maintenance
cost of residential building in Malaysia. (Please rate your answers by
following the scale given)
1 – Never Agree; 4 – Always Agree;
2 – Seldom Agree; 5 – Completely Agree
3 – Sometimes Agree;
Item Description 1 2 3 4 5
i. Less Complexity of Building Design
ii. Cost Allocation for Future Maintenance during
Design Stage
iii. Life Cycle Cost Technique
iv. Employ Skilled / Educated Workers during
Construction
v. Standardize Specification of Materials used for
Construction
vi. As-Built Drawing and Operation Manual to be
Provided to Building User
vii. Conduct Quality Assessment with the Aim of
High Score
~ END OF QUESTIONNAIRE~

A-6
APPENDIX B: Data Collection
Section A
Job Role Growth Value Job Role Growth Value Job Role Growth Value
None 5% - 7% Consultant 5% - 7% Contractor 8% - 10%
None 5% - 7% Consultant 5% - 7% Contractor 8% - 10%
None 5% - 7% Consultant 5% - 7% Contractor 8% - 10%
None 5% - 7% Consultant 8% - 10% Contractor 8% - 10%
None 8% - 10% Consultant 8% - 10% Contractor 8% - 10%
None 8% - 10% Consultant 8% - 10% Contractor 8% - 10%
None 8% - 10% Consultant 8% - 10% Contractor 8% - 10%
None 8% - 10% Consultant >10% Contractor 8% - 10%
None >10% Consultant 5% - 7% Contractor 8% - 10%
None >10% Consultant 8% - 10% Contractor 8% - 10%
Developer 8% - 10% Consultant 5% - 7% Contractor 5% - 7%
Developer 8% - 10% Consultant 5% - 7% Contractor 5% - 7%
Developer 5% - 7% Consultant 5% - 7% Contractor 5% - 7%
Developer 8% - 10% Consultant 8% - 10% Contractor >10%
Developer 5% - 7% Consultant 8% - 10% Contractor 5% - 7%
Developer 8% - 10% Consultant 5% - 7%
Developer 8% - 10% Consultant 5% - 7%
Developer 8% - 10% Consultant 8% - 10%
Developer 8% - 10% Consultant 8% - 10%
Developer 8% - 10% Consultant >10%
Developer 8% - 10% Consultant >10%
Developer 8% - 10% Consultant 5% - 7%
Developer 5% - 7% Consultant 5% - 7%
Developer 5% - 7% Consultant 5% - 7%
Developer 5% - 7% Consultant 8% - 10%
Developer 5% - 7% Consultant 8% - 10%
Developer 5% - 7% Consultant 8% - 10%
Developer >10% Consultant 5% - 7%
Developer 5% - 7% Consultant 5% - 7%
Developer 5% - 7% Contractor 8% - 10%
Developer 5% - 7% Contractor 8% - 10%
Developer 5% - 7% Contractor 8% - 10%

A-7
Section B
Job Role Years Salary Job Role Years Salary Job Role Years Salary
Developer 3 3 Consultant 1 1 Contractor 2 2
Developer 4 4 Consultant 1 1 Contractor 2 2
Developer 3 3 Consultant 1 1 Contractor 2 3
Developer 3 3 Consultant 4 3
Developer 2 2 Consultant 3 3
Developer 2 2 Consultant 2 2
Developer 2 2 Consultant 2 2
Developer 2 2 Consultant 2 2
Developer 3 3 Consultant 2 2
Developer 3 3 Consultant 3 2
Developer 3 3 Consultant 3 3
Developer 3 3 Consultant 1 1
Developer 4 4 Consultant 1 1
Developer 4 4 Consultant 4 3
Developer 4 4 Consultant 2 2
Developer 3 3 Consultant 2 2
Developer 3 3 Consultant 2 2
Developer 3 3 Consultant 3 3
Developer 3 3 Contractor 4 4
Developer 3 3 Contractor 3 4
Developer 3 3 Contractor 3 3
Developer 2 2 Contractor 3 3
Developer 2 2 Contractor 3 3
Developer 2 2 Contractor 3 4
Developer 2 2 Contractor 2 2
Developer 4 4 Contractor 2 2
Developer 4 4 Contractor 2 2
Developer 4 4 Contractor 3 4
Developer 4 4 Contractor 3 3
Developer 3 3 Contractor 3 3
Consultant 2 2 Contractor 3 3
Consultant 1 1 Contractor 3 3
Consultant 3 3 Contractor 2 2
Consultant 2 2 Contractor 2 2
Consultant 2 2 Contractor 2 2
Consultant 2 2 Contractor 2 3
Consultant 2 2 Contractor 4 4
Consultant 1 1 Contractor 4 4
Consultant 1 1 Contractor 4 4
Consultant 2 2 Contractor 3 3
Consultant 2 2 Contractor 3 3
Consultant 2 2 Contractor 3 3

A-8
Section C
Job Role i ii iii iv v vi vii
Developer 5 5 5 5 5 5 5
Developer 5 5 5 5 5 5 5
Developer 5 5 5 5 5 5 5
Developer 5 5 5 5 5 5 5
Developer 5 5 5 5 5 5 5
Developer 5 5 5 5 5 5 5
Developer 5 5 5 5 5 5 5
Developer 5 5 5 5 5 5 5
Developer 5 5 5 5 5 5 5
Developer 5 5 5 5 5 5 5
Developer 4 4 4 4 4 4 4
Developer 5 5 5 5 5 5 5
Developer 5 5 5 5 5 5 5
Developer 5 5 5 5 5 5 5
Developer 5 5 5 5 5 5 5
Developer 5 5 5 5 5 5 5
Developer 5 5 5 5 5 5 5
Developer 5 5 5 5 5 5 5
Developer 5 5 5 5 5 5 5
Developer 5 5 5 5 5 5 5
Developer 5 5 5 5 4 5 5
Developer 5 5 5 5 4 5 5
Developer 5 5 5 5 5 5 5
Developer 5 5 5 5 5 5 5
Developer 5 5 4 5 5 5 5
Developer 5 5 5 5 5 5 5
Developer 5 5 5 5 5 5 5
Developer 5 5 5 5 5 5 5
Developer 5 5 5 5 5 5 5
Developer 5 5 5 5 5 5 5
Consultant 5 5 5 5 5 5 5
Consultant 5 5 5 5 5 5 5
Consultant 5 5 5 5 5 5 5
Consultant 5 5 5 5 5 5 5
Consultant 5 5 5 5 5 5 5
Consultant 5 5 5 5 5 5 5
Consultant 5 5 5 5 5 5 5
Consultant 5 5 5 5 5 5 5
Consultant 5 5 5 5 5 5 5
Consultant 5 5 5 5 5 5 5
Consultant 5 5 5 5 5 5 5
Consultant 5 5 5 5 5 5 5
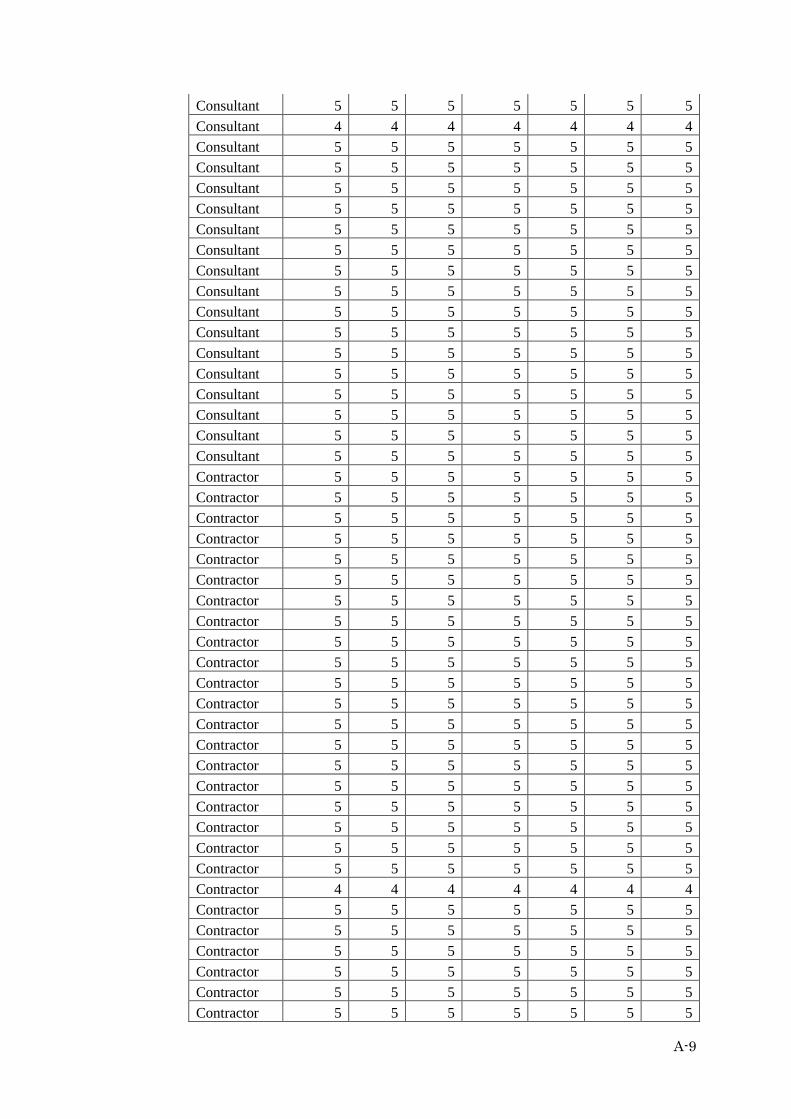
A-9
Consultant 5 5 5 5 5 5 5
Consultant 4 4 4 4 4 4 4
Consultant 5 5 5 5 5 5 5
Consultant 5 5 5 5 5 5 5
Consultant 5 5 5 5 5 5 5
Consultant 5 5 5 5 5 5 5
Consultant 5 5 5 5 5 5 5
Consultant 5 5 5 5 5 5 5
Consultant 5 5 5 5 5 5 5
Consultant 5 5 5 5 5 5 5
Consultant 5 5 5 5 5 5 5
Consultant 5 5 5 5 5 5 5
Consultant 5 5 5 5 5 5 5
Consultant 5 5 5 5 5 5 5
Consultant 5 5 5 5 5 5 5
Consultant 5 5 5 5 5 5 5
Consultant 5 5 5 5 5 5 5
Consultant 5 5 5 5 5 5 5
Contractor 5 5 5 5 5 5 5
Contractor 5 5 5 5 5 5 5
Contractor 5 5 5 5 5 5 5
Contractor 5 5 5 5 5 5 5
Contractor 5 5 5 5 5 5 5
Contractor 5 5 5 5 5 5 5
Contractor 5 5 5 5 5 5 5
Contractor 5 5 5 5 5 5 5
Contractor 5 5 5 5 5 5 5
Contractor 5 5 5 5 5 5 5
Contractor 5 5 5 5 5 5 5
Contractor 5 5 5 5 5 5 5
Contractor 5 5 5 5 5 5 5
Contractor 5 5 5 5 5 5 5
Contractor 5 5 5 5 5 5 5
Contractor 5 5 5 5 5 5 5
Contractor 5 5 5 5 5 5 5
Contractor 5 5 5 5 5 5 5
Contractor 5 5 5 5 5 5 5
Contractor 5 5 5 5 5 5 5
Contractor 4 4 4 4 4 4 4
Contractor 5 5 5 5 5 5 5
Contractor 5 5 5 5 5 5 5
Contractor 5 5 5 5 5 5 5
Contractor 5 5 5 5 5 5 5
Contractor 5 5 5 5 5 5 5
Contractor 5 5 5 5 5 5 5

A-10
Contractor 5 5 5 5 5 5 5
Contractor 5 5 5 5 5 5 5
Contractor 5 5 5 5 5 5 5

A-11
Section D
Job Role i ii iii iv v vi vii
Developer 5 5 5 5 5 5 5
Developer 5 5 5 5 5 5 5
Developer 5 5 5 5 5 5 5
Developer 5 5 5 5 5 5 5
Developer 5 5 5 5 5 5 5
Developer 5 5 5 5 5 5 5
Developer 5 5 5 5 5 5 5
Developer 5 5 5 5 5 5 5
Developer 5 5 5 5 5 5 5
Developer 4 4 4 4 4 4 4
Developer 5 5 5 5 5 5 5
Developer 5 5 5 5 5 5 5
Developer 5 5 5 5 5 5 5
Developer 5 5 5 5 5 5 5
Developer 5 5 5 5 5 5 5
Developer 5 5 5 5 5 5 5
Developer 5 5 5 5 5 5 5
Developer 5 5 5 5 5 5 5
Developer 5 5 5 5 5 5 5
Developer 5 5 5 5 5 5 5
Developer 4 4 4 4 4 4 4
Developer 5 5 5 5 5 5 5
Developer 5 5 5 5 5 5 5
Developer 5 5 5 5 5 5 5
Developer 5 5 5 5 5 5 5
Developer 5 5 5 5 5 5 5
Developer 5 5 5 5 5 5 5
Developer 5 5 5 5 5 5 5
Developer 5 5 5 5 5 5 5
Developer 5 5 5 5 5 5 5
Consultant 5 5 5 5 5 5 5
Consultant 5 5 5 5 5 5 5
Consultant 5 5 5 5 5 5 5
Consultant 5 5 5 5 5 5 5
Consultant 5 5 5 5 5 5 5
Consultant 5 5 5 5 5 5 5
Consultant 5 5 5 5 5 5 5
Consultant 5 5 5 5 5 5 5
Consultant 5 5 5 5 5 5 5
Consultant 5 4 5 4 5 4 5
Consultant 5 5 4 5 4 5 4
Consultant 5 5 5 5 5 5 5

A-12
Consultant 5 5 5 5 5 5 5
Consultant 5 5 5 5 5 5 5
Consultant 5 5 5 5 5 5 5
Consultant 5 5 5 5 5 5 5
Consultant 5 5 5 5 5 5 5
Consultant 5 5 5 5 5 5 5
Consultant 5 5 5 5 5 5 5
Consultant 5 5 5 5 5 5 5
Consultant 4 4 4 4 4 4 4
Consultant 5 5 5 5 5 5 5
Consultant 5 5 5 5 5 5 5
Consultant 5 5 5 5 5 5 5
Consultant 5 5 5 5 5 5 5
Consultant 5 5 5 5 5 5 5
Consultant 5 5 5 5 5 5 5
Consultant 5 5 5 5 5 5 5
Consultant 5 5 5 5 5 5 5
Consultant 5 5 5 5 5 5 5
Contractor 5 5 5 5 5 5 5
Contractor 5 5 5 5 5 5 5
Contractor 4 5 4 5 4 5 4
Contractor 5 5 5 4 5 4 5
Contractor 5 5 5 5 5 5 5
Contractor 5 5 5 5 5 5 5
Contractor 5 5 5 5 5 5 5
Contractor 5 5 5 5 5 5 5
Contractor 5 5 5 5 5 5 5
Contractor 5 5 5 5 5 5 5
Contractor 4 4 4 4 4 4 4
Contractor 5 5 5 5 5 5 5
Contractor 5 5 5 5 5 5 5
Contractor 5 5 5 5 5 5 5
Contractor 5 5 5 5 5 5 5
Contractor 5 5 5 5 5 5 5
Contractor 5 5 5 5 5 5 5
Contractor 5 5 5 5 5 5 5
Contractor 5 5 5 5 5 5 5
Contractor 5 5 5 5 5 5 5
Contractor 5 5 5 5 5 5 5
Contractor 5 5 5 5 5 5 5
Contractor 5 5 5 5 5 5 5
Contractor 5 5 5 5 5 5 5
Contractor 5 5 5 5 5 5 5
Contractor 5 5 5 5 5 5 5

A-13
Contractor 5 5 5 5 5 5 5
Contractor 5 5 5 5 5 5 5
Contractor 5 5 5 5 5 5 5
Contractor 5 5 5 5 5 5 5