a study of the attitude, self-efficacy, effort and...
TRANSCRIPT

Discovery – SS Student E-Journal Vol. 1, 2012, 154-183
154
A Study of the Attitude, Self-efficacy, Effort and Academic
Achievement of CityU Students towards Research Methods and
Statistics
Lilian K.Y. Li
Abstract
The present research aims to study the relationship between social science
students’ attitude towards research methods and statistics, self-efficacy, effort
and academic achievement. Self-administered questionnaire was chosen as the
primary data collection method and a sample of 153 students from Department
of Applied Social Studies in the City University of Hong Kong were invited to
complete the survey. After analyzing the data collected, Pearson’s correlation
coefficient reflected that there was a positive correlation between all the four
variables – attitude towards research methods and statistics, self-efficacy, effort
and academic achievement. Also, a multiple regression analysis was conducted
to estimate the prediction power of attitude and self-efficacy on effort. The result
showed that both attitude and self-efficacy could significantly predict effort.
However, when another multiple regression analysis was conducted to estimate
the prediction power of attitude, self-efficacy and effort on academic
achievement, it was found that effort failed to predict academic achievement. To
conclude, in the present study, effort could only be regarded as an indirect factor
but not a necessary factor in bridging the relationship between attitude, self-
efficacy and academic achievement.
Introduction
The title of the current research is “A study of the attitude, self-efficacy, effort and
academic achievement of CityU students towards research methods and statistics”. It
is known that all of the students coming from the Department of Applied Social
Studies (namely the departments of Psychology, Applied Sociology, Criminology and
Social Work) are required to take a basic research methods and statistics course.
However, many of the students do not know they are required to study research
methodology and statistics beforehand and the emphasis placed on statistics and
research-related skills has indeed surprised them. Some of the students even develop a
“phobia” towards this academic subject that they tend to feel nervous and
uncomfortable when they are required to deal with statistics and research-related
problems.
In order to get an in-depth understanding about CityU students’ views towards
research methods and statistics, the current research aims at investigating the
relationship between their attitude, self-efficacy, and effort they put into studying
research methods and statistics as well as their academic achievement.
Research objectives and research questions
In the present study, there are primarily two objectives. First, the current research
intends to test whether “effort” is significantly related to “attitude” and “self-efficacy”.
Second, the study aims to test whether “effort” serves as a mediated factor between
attitude, self-efficacy and academic achievement.
Being correspondent with the stated two research objectives, four research
questions are derived:
1. Does attitude play a role in affecting students’ academic effort?

Discovery – SS Student E-Journal Vol. 1, 2012, 154-183
155
2. Does self-efficacy play a role in affecting students’ academic effort?
3. Does students’ academic effort play a role in affecting their academic
achievement?
4. Does effort play a mediating role between attitude, self-efficacy and academic
achievement?
Research hypotheses
There are four main hypotheses in the present study, which are listed as follows:
H1: The more positive one’s attitude towards research methods, the more effort he/she
will put into the subject.
H2: The more positive one’s attitude towards statistics, the more effort he/she will put
into the subject.
H3: The higher one’s academic self-efficacy, the more effort he/she will put into the
subject.
H4: The more effort one puts into the subject, the higher he/she will achieve
academically.
Literature review
The relationship between attitude, self-efficacy and academic achievement has always
been a topic of interest in social sciences, particularly in the fields of educational and
social-psychological researches. However, little researches were conducted on
studying the relationship between attitude, self-efficacy and effort. Therefore, it is
hoped that the present research can provide further insights on the phenomenon.
Relationship between attitude and effort
As aforementioned, most of the existing literature focused on studying the
relationship between attitude, self-efficacy and academic achievement. Even though
there were very few researches studying the relationship between attitude and effort,
one study did prove that there was a significant relationship between the two variables.
In an Australian study, the researchers would like to explore the relationship
between students’ attitude towards mathematics and the amount of effort they would
put into studying the subject (Hemmings and Kay 2010, p. 48). A sample of 56
Australian secondary school students were recruited to fill out a questionnaire, and the
results indicated that their mathematics attitude was significantly associated with the
amount of effort they would expend in the subject.
Relationship between self-efficacy and effort
From past literature, very few researches focused on investigating the relationship
between self-efficacy and effort. However, one research suggested that a positive
relationship could be observed between the two variables. For example, in a study
conducted in Spain (Valle et al. 2009, p. 101), the researchers aimed at studying the
relationship between university students’ self-efficacy for performance and learning
and their effort regulation. It was found that when students possessed a higher self-
efficacy, they were more likely to put more effort into their academic studies.
Relationship between effort and academic achievement
After reviewing past literature, it was found that there was no general consensus about
the relationship between effort and academic achievement. Some of the studies
suggested that there was a positive relationship between the two variables, while some

Discovery – SS Student E-Journal Vol. 1, 2012, 154-183
156
other studies suggested that there was a negative relationship between the two
variables. In a study conducted in America, the researcher was interested in studying
how both individual factors (like effort) and structural factors (like school
environment) could affect students’ academic performance (Stewart 2008, p. 185). It
was found that the amount of effort that students exerted in their studies was
positively associated with their academic performance.
Even though most studies stated that there was a positive relationship between
effort and academic achievement, there were few studies arguing the opposite. For
example, in a study conducted by Chassie et al. (2004), they studied the relationship
between university students’ effort (in term of the time they spent in learning) and
their academic performance (in term of the grades they achieved). After controlling
some external variables like learning ability and prior academic achievement, the
results indicated that effort was significantly and negatively correlated with academic
performance.
Relationship between attitude and academic achievement
From past literature, it was found some scholars developed a theory that could be used
to explain the relationship between attitude and academic achievement. According to
Fishbein, he constructed the value-expectancy model by arguing that a person’s
attitude determined his/her intended behavior, which could ultimately affect the
outcome. Based on the model, he stated that a person would hold certain attitudes
towards an object by evaluating it. After going through this process, the person then
decided whether to hold a favorable or unfavorable view towards it. Indeed, such a
positive or negative attitude could further influence the person’s intentions to engage
in various behaviors with regard to that particular object (Fishbein and Ajzen 1975, p.
14). Based on the person’s intended behavior, this could be regarded as a significant
predictor of the final outcome.
In addition to the theoretical arguments, there were indeed numerous
researches conducted on testing the relationship between attitude and academic
achievement. Based on the past literature, there was a general consensus that attitude
could be regarded as a significant predictor of one’s academic achievement. Most of
these researches illustrated the more positive one’s attitude towards an academic
subject, the higher the possibility for him/her to perform well academically. In a
research conducted in the U.S., the researchers studied the relationship between
students’ attitudes and academic achievement in college mathematics by inviting 218
freshmen to complete a set of questionnaire. The result indicated that students’
attitudes were highly correlated with their achievement in college calculus (House
1995, p. 112). In another longitudinal study also conducted in the U.S., the
researchers assessed the relationship between attitude towards mathematics and
achievement in mathematics. It was found that attitude had a powerful influence on
students’ academic achievement (Reynolds and Walberg 1992, p. 307).
Even though most of the studies suggested that there was a positive
relationship between attitude and academic achievement, there were other researchers
arguing that students’ attitude might not be a significant predictor of their academic
achievement. In a study conducted by Mickelson (1990), he stated that whether
attitude could significantly predict one’s academic achievement depended on a
number of variables, particularly the ethnic background and social class (p. 44).
Correspondingly, Ma and Kishor (1997) also argued that the statement “attitude was a
significant predictor of academic achievement” was indeed a paradox. Attitude might
not necessarily predict one’s academic achievement as it also depended on different
Discovery – SS Student E-Journal Vol. 1, 2012, 154-183
157
factors, like race, sample selection and sample size (p. 26). All in all, although there
were countless researches studying the relationship between attitude and academic
achievement, a unanimous result could not be obtained. Therefore, further
investigation is needed to confirm the relationship between attitude and academic
achievement.
Relationship between self-efficacy and academic achievement
As previously mentioned, the relationship between self-efficacy and academic
achievement has been a topic of interest in social sciences researches. Based on past
literature, there was a general agreement that self-efficacy was strongly related to
one’s academic achievement. For example, in Turner, Chandler and Heffer’s study
(2009), they assessed the influence of parenting styles, achievement motivation and
self-efficacy on college students’ academic achievement (p. 338). The results
indicated that self-efficacy was a significant predictor of one’s academic achievement.
Also, in Lent, Larkin and Brown’s research (1986), they also supported that academic
self-efficacy was a reliable predictor of one’s educational performance (p. 265).
Although the vast majority of the existing literature supported the notion that
there was a significant relationship between self-efficacy and academic achievement,
there were also few researches did not support such an argument. In a study
conducted by Strelnieks (2005), she found that whether self-efficacy could influence
one’s academic achievement depended on some external factors, like gender and
socio-economic status (p. 13). After analyzing the data collected, the researchers
found that self-efficacy could only successfully predict females’ academic
achievement while it failed to accurately foresee males’ educational performance.
Apart from this finding, it was also shown that self-efficacy could only predict the
academic achievement of students with higher socio-economic status. As reflected in
the above research findings, it could be seen that there were inconsistencies in
contemporary understanding on the relationship between self-efficacy and academic
achievement. Even though most of the existing studies supported there was a strong
correlation between the two variables, there were still researches arguing the opposite.
Therefore, further investigation is required to demonstrate a clearer understanding
between the two constructs.
Limitations of previous studies
After reviewing the literature, it was found that three limitations can be summarized
from these past studies. First of all, most of the studies are restrained to foreign
countries, particularly America. Owing to dissimilarities in social norms and cultural
values, the findings obtained from these studies may not be really applicable and
useful to explain the case of Hong Kong. Apart from this, many of the researches
restrained “academic achievement” to mathematics only and very few of them
focused on studying research methods-related subjects. Last but not least, although
many researches were already conducted on studying this social phenomenon, there
are still flaws in our understanding as there is no consensus on the relationship
between the four variables: attitude, self-efficacy, effort and academic achievement.
Since there are very few studies studying the direct relationship between 1) attitude
and effort and 2) self-efficacy and effort, it is hoped that the present study can provide
insights on this adequately studied issue by including a new element – effort in the
present study.

Discovery – SS Student E-Journal Vol. 1, 2012, 154-183
158
Conceptual framework
As the title of the current research is “A study of the attitude, self-efficacy,
effort and academic achievement of CityU students towards research methods and
statistics”, it is therefore utterly important to illustrate the relationship between the
four variables: attitude, self-efficacy, effort and academic achievement. In order to
reveal clearly how the variables relate to each other, their relationship will be
reflected in the conceptual framework shown below:
Figure 1. Conceptual framework of the present study.
Indeed, three theories are modified to help construct the conceptual framework
of the present study, which are known as the motivational theory, attribution theory
and the self-efficacy theory. The theories adopted can be used for explaining the
relationship between 1) attitude and effort, 2) self-efficacy and effort and 3) effort and
academic achievement.
Motivational theory
First and foremost, the motivational theory can be used to explain the relationship
between attitude and effort. Different researches were carried out and the results
revealed that when students considered learning activities as meaningful and relevant,
this could help increase their intrinsic motivation (Gardner 1983, Sizer 1992, 1996,
Cooperman 1994, and Seifert and O’Keefe 2001, cited Elliot et al. 2005, p. 27). On
the basis of these researches, it can be assumed that students’ attitude towards an
academic subject plays a role in affecting their intrinsic motivation, like effort.
Therefore, the theory can be applied in the present study: when students possess a
positive attitude towards research methods and statistics (e.g. the subject is
meaningful and relevant to their academic studies and future career), they are more
likely to put more effort into studying the subject. On the contrary, when students

Discovery – SS Student E-Journal Vol. 1, 2012, 154-183
159
possess a negative attitude towards research methods and statistics (e.g. the subject is
meaningless and irrelevant to their academic studies and future career), they are less
likely to exert extra effort into studying the subject.
Self-efficacy theory
In order to explain the relationship between self-efficacy and effort, the self-efficacy
theory can be used. According to Bandura, self-efficacy is defined as “an individual’s
belief or conviction that they can successfully achieve at a designated level on an
academic task or attain a specific academic goal” (Feltz et al. 2007, p. 14). Bandura
stated that self-efficacy played a role in determining how individuals felt, thought and
motivated themselves, which then ultimately affected the behavior and the outcome.
On the basis of this theory, the present research assumes that when one’s self-
efficacy towards research methods and statistics is high, he/she tends to put greater
effort into studying the subject, which eventually results in a good grade. To put it in
details, it means that when a student possesses a high self-efficacy towards research
methods and statistics, it means that he/she has confidence in mastering the subject.
With such a positive self-efficacy, this will simultaneously affect the student’s
behavior. Since the student thinks he/she is capable of doing well, this will lead to a
series of favorable behaviors. For example, the student attends all the lectures and
works hard on this subject. Derived from such favorable behaviors, it is expected that
the student is likely to achieve a good result in the subject.
On the contrary, when one’s self-efficacy towards research methods and
statistics is low, he/she is less likely put great effort into the subject, which eventually
results in a low grade. To put it in details, it means that when a student possesses a
low self-efficacy towards research methods and statistics, it means that he/she does
not have confidence in mastering the subject. With such a negative self-efficacy, this
will at the same time affect the student’s behavior. Since the student thinks he/she is
incapable of doing well in statistics, this will lead to a series of unfavorable behaviors.
For example, the student refuses to attend the lectures and works hard on this subject.
Derived from such unfavorable intended behaviors, it is expected that the student is
less likely to obtain a good result in the subject.
Attribution theory
Last but not least, concerning the relationship between effort and academic
achievement, the attribution theory is adopted. According to this theory, it states that
individuals are considered as active beings that “seek to understand and master their
environment and themselves” (Elliot et al. 2005, p. 17). Based on this assumption, it
is argued that the outcome of individuals’ behavior can be determined by both
external attributions and internal attributions. External attributions refer to those
factors that individuals are unable to control (e.g. difficulty of the task) while internal
attributions refer to those factors that individuals are able to control (e.g. effort, like
the amount of time students spent on homework). According to this model, both
internal attributions and external attributions play a role in affecting individuals’
subsequent behavior, like task engagement and persistence (Elliot et al. 2005, p. 18).
However, some researchers argued that internal attributions played a more influential
role than external attributions. It was found that when students considered themselves
as exert great effort into studying the academic subject and hard working, they also
tended to achieve better academically (Blatchford 1996, Lightbody et al. 1996, Gipps
and Tunstall 1998, cited Elliot et al. 2005, p. 18).
Discovery – SS Student E-Journal Vol. 1, 2012, 154-183
160
In the present research, the focus is also placed on the internal attribution –
effort and its’ role in affecting students’ academic achievement. It is assumed that
when students put more effort into studying research methods and statistics, they are
more likely to perform better in the subject. In contrast, when students exert less
effort into studying research methods and statistics, they are less likely to achieve a
satisfactory result.
Conceptualization and Operationalization
Conceptualization
As stated in the research title “a study of the attitude, self-efficacy, effort and
academic achievement of CityU students towards research methods and statistics, it
can be seen that there are primarily four variables that need to be conceptualized
concretely, which are attitude, self-efficacy, effort and academic achievement.
Attitude (Independent variable)
According to Fishbein, attitude was conceptualized as “learned predispositions to
respond to an object or class of objects in a favorable or unfavorable way” (Fishbein
1967, p. 257). In the present research, attitude is specifically defined as respondents’
attitude towards research methods and statistics.
Self-efficacy (Independent variable)
According to Bandura, self-efficacy was defined as “beliefs in one’s capabilities to
organize and execute the courses of action required to produce given attainments”
(Bandura 1977 cited Feltz et al. 2007). In the present study, self-efficacy is further
refined as “academic self-efficacy”. Academic self-efficacy refers to “an individual’s
belief (conviction) that they can successfully achieve at a designated level on an
academic task or attain a specific academic goal” (Institute for Applied Psychometrics,
2008). In the present research, self-efficacy is further defined as respondents’
academic self-efficacy in dealing with the 2027 research methods and statistics course.
Effort (Mediated variable)
According to Carbonaro, he defined effort as the “amount of time and energy that
students expend in meeting the formal academic requirements established by their
teacher and/or school” (Carbonaro 2005, p. 28). In the current study, effort refers to
the amount of effort that students expend in the 2027 research methods and statistics
course.
Academic achievement (Dependent variable)
Based on past literature, there were numerous definitions of academic achievement.
Generally speaking, academic achievement was defined as “a student’s academic
performance in school” (Chen 2007, p. 23). In the current research, academic
achievement mainly refers to the respondents’ actual grade in the 2027 research
methods and statistics course, their confidence in dealing with research methods and
statistics as well as their knowledge related to research methods and statistics.
Operationalization

Discovery – SS Student E-Journal Vol. 1, 2012, 154-183
161
Different scales were borrowed from western scholars as a means to measure the four
main variables – attitude, self-efficacy, effort and academic achievement. With
reference to the measurement of attitude towards research methods and statistics, the
Attitude Toward Research Scale (ATRS) was adopted. For the measurement of
academic self-efficacy, the College Academic Self-efficacy Scale was used. While
concerning the measurement of effort, one of the subscales from the ATRS was
modified and used. Last but not least, for the measurement of academic achievement,
five questions were specially designed to measure the variable.
Attitude towards research methods and statistics
The Attitude Toward Research Scale (ATRS) is adopted to measure respondents’
attitude towards research methods and statistics (Walker 2010, p. 19). The Cronbach’s
Alpha for the original scale is .85 and the scale is composed of 28 items, in which 14
of them measure respondents’ attitude towards research methods while the remaining
14 items measure respondents’ attitude towards statistics. The ATRS adopts a 7-point
Likert scale (1 = strongly disagree, 7 = strongly agree) and higher scores indicate
more positive attitude towards research methods and statistics.
The scale is composed of 4 sub-scales, which are known as affect, cognitive
competence, value and interest:
(a) Affect
This subscale is comprised of 6 items, which aims at measuring students’ feelings
concerning research methods and statistics. The subscale items are listed as follows:
Table 1. Scale items for attitude towards research methods and statistics (affect).
Scale items Answer
1. I like statistics. Close-ended questions
with a 7-point likert
scale (1 = strongly
disagree, 7 = strongly
agree), in which
respondents are required
to indicate their level of
agreement with each
questionnaire item.
2. I like research methods.
3. I feel insecure when I have to deal with statistics
problems.
4. I feel insecure when I have to deal with research
methods-related problems.
5. I am under stress during statistics class.
6. I am under stress during research methods class.
(b) Cognitive competence
This subscale is comprised of 8 items, which aims at measuring students’ attitudes
about their intellectual knowledge and skills when applied to research methods and
statistics. The subscale items are listed as follows:

Discovery – SS Student E-Journal Vol. 1, 2012, 154-183
162
Table 2. Scale items for attitude towards research methods and statistics (cognitive
competence).
Scale items Answer
1. I can learn statistics. Close-ended questions
with a 7-point likert
scale (1 = strongly
disagree, 7 = strongly
agree), in which
respondents are required
to indicate their level of
agreement with each
questionnaire item.
2. I can learn research methods.
3. I find it difficult to understand statistical concepts.
4. I find it difficult to understand research methods.
5. I find statistics formulas easy to understand.
6. I find research methods concepts easy to understand.
7. I think statistics is a complicated subject.
8. I think research methods is a complicated subject.
(c) Value
This subscale is comprised of 6 items, which aims at measuring students’ attitude
about the usefulness, relevance, and worth of research methods and statistics in
personal and professional life. The subscale items are listed as follows:
Table 3. Scale items for attitude towards research methods and statistics (value).
Scale items Answer
1. I think statistics is worthless. Close-ended questions
with a 7-point likert
scale (1 = strongly
disagree, 7 = strongly
agree), in which
respondents are required
to indicate their level of
agreement with each
questionnaire item.
2. I think research methods are worthless.
3. Statistics should be a required part of my professional
training.
4. Research methods should be a required part of my
professional training.
5. Statistical skills make me more employable.
6. Research methods skills make me more employable.
(d) Interest
This subscale is comprised of 8 items, which aims at measuring students’ level of
individual interest in research methods and statistics. The subscale items are listed as
follows:
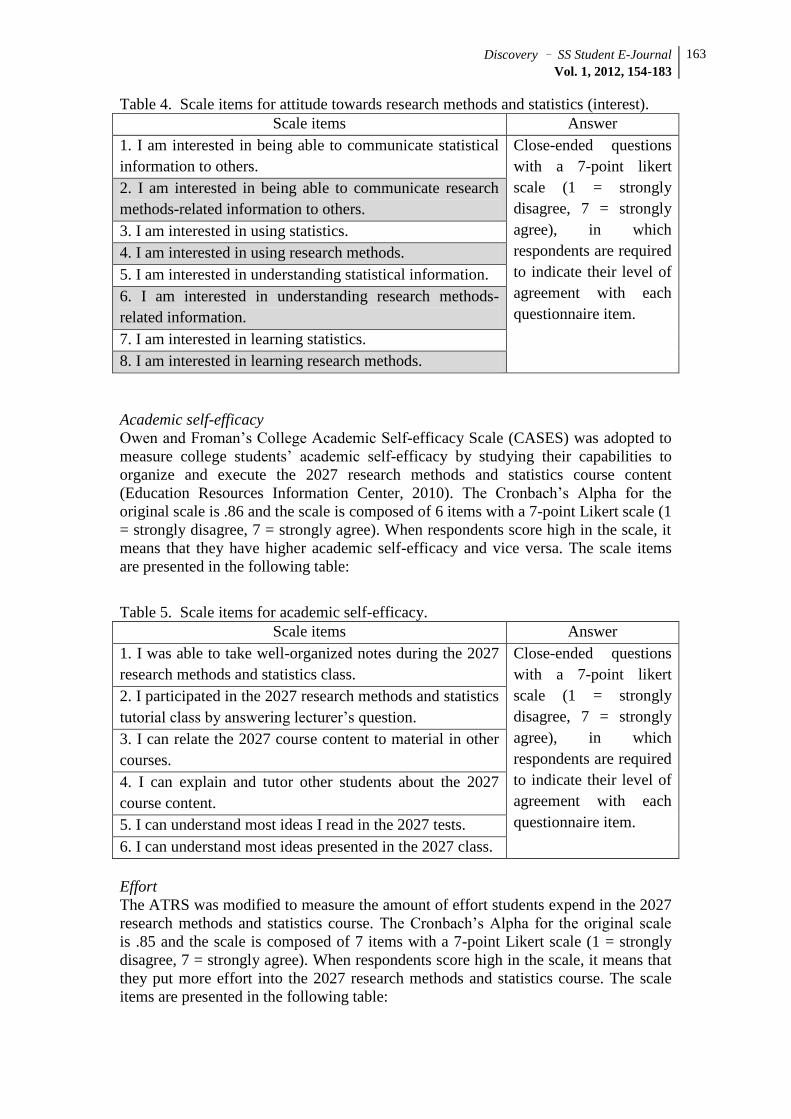
Discovery – SS Student E-Journal Vol. 1, 2012, 154-183
163
Table 4. Scale items for attitude towards research methods and statistics (interest).
Scale items Answer
1. I am interested in being able to communicate statistical
information to others.
Close-ended questions
with a 7-point likert
scale (1 = strongly
disagree, 7 = strongly
agree), in which
respondents are required
to indicate their level of
agreement with each
questionnaire item.
2. I am interested in being able to communicate research
methods-related information to others.
3. I am interested in using statistics.
4. I am interested in using research methods.
5. I am interested in understanding statistical information.
6. I am interested in understanding research methods-
related information.
7. I am interested in learning statistics.
8. I am interested in learning research methods.
Academic self-efficacy
Owen and Froman’s College Academic Self-efficacy Scale (CASES) was adopted to
measure college students’ academic self-efficacy by studying their capabilities to
organize and execute the 2027 research methods and statistics course content
(Education Resources Information Center, 2010). The Cronbach’s Alpha for the
original scale is .86 and the scale is composed of 6 items with a 7-point Likert scale (1
= strongly disagree, 7 = strongly agree). When respondents score high in the scale, it
means that they have higher academic self-efficacy and vice versa. The scale items
are presented in the following table:
Table 5. Scale items for academic self-efficacy.
Scale items Answer
1. I was able to take well-organized notes during the 2027
research methods and statistics class.
Close-ended questions
with a 7-point likert
scale (1 = strongly
disagree, 7 = strongly
agree), in which
respondents are required
to indicate their level of
agreement with each
questionnaire item.
2. I participated in the 2027 research methods and statistics
tutorial class by answering lecturer’s question.
3. I can relate the 2027 course content to material in other
courses.
4. I can explain and tutor other students about the 2027
course content.
5. I can understand most ideas I read in the 2027 tests.
6. I can understand most ideas presented in the 2027 class.
Effort
The ATRS was modified to measure the amount of effort students expend in the 2027
research methods and statistics course. The Cronbach’s Alpha for the original scale
is .85 and the scale is composed of 7 items with a 7-point Likert scale (1 = strongly
disagree, 7 = strongly agree). When respondents score high in the scale, it means that
they put more effort into the 2027 research methods and statistics course. The scale
items are presented in the following table:

Discovery – SS Student E-Journal Vol. 1, 2012, 154-183
164
Table 6. Scale items for effort.
Scale items Answer
1. Apart from completing the stated 2027 course
assignments, I also completed extra exercises related to
research methods and statistics.
Close-ended questions
with a 7-point likert
scale (1 = strongly
disagree, 7 = strongly
agree), in which
respondents are required
to indicate their level of
agreement with each
questionnaire item.
2. Apart from reading the stated 2027 lecture notes, I also
read extra readings/information related to research
methods and statistics.
3. I worked hard to complete the 2027 course.
4. I studied hard and prepared well for every 2027 test.
5. In order to get full understanding on the 2027 course
content, I read the lecture notes more than once.
6. I attended every 2027 class section on time.
7. I paid close attention to what the lecturer said in class.
Academic achievement
Five questions are specially designed to measure the variable, which aims at studying
students’ knowledge about research methods and statistics, their confidence in dealing
with statistics and research methods-related problems as well as their actual course
grade. The scale items are presented in the following table:
Table 7. Scale items for academic achievement.
Scale items Answer
1. After completing the 2027 course, I have increased
statistical knowledge.
Close-ended questions
with a 7-point likert
scale (1 = strongly
disagree, 7 = strongly
agree), in which
respondents are required
to indicate their level of
agreement with each
questionnaire item.
2. After completing the 2027 course, I have increased
research methods-related knowledge.
3. After completing the 2027 course, I have more
confidence in dealing with statistics problems.
4. After completing the 2027 course, I have more
confidence in dealing with research methods-related
problems.
5. My actual course grade of the 2027 course is ___. Close-ended question, in
which respondents are
required to indicate their
actual course grade by
selecting from 14
options (ranging from
A+ to F).
Discovery – SS Student E-Journal Vol. 1, 2012, 154-183
165
Survey Design and Sampling
Survey Design
In the present research, quantitative research method was adopted. Concerning the
primary data collection method, self-completed questionnaire was chosen because it
was comparatively timesaving and had the benefit of collecting responses from a
large group of subjects with a relatively low cost (Dahlberg and McCaig 2010, p. 161).
Sampling
In the present research, the targeted sample was students who are currently studying
at the City University of Hong Kong. However, the sample population was further
confined to students coming from the Department of Applied Social Studies, which
was composed of the Department of Applied Sociology, Psychology, Social Work
and Criminology. The primary reason for targeting students majoring in these four
subjects was due to the fact that all of them had already completed the 2027 research
methods and statistics course. Concerning the number of samples selected for
participating in the present research, 153 data was collected in total.
Regarding the sampling method, convenience sampling and snowball
sampling were adopted in the process of selecting samples from the target population.
Concerning convenience sampling, it was a sampling method in which samples were
selected on the basis of easy availability. Since the researcher was from the
Department of Applied Social Studies, she could easily approach students studying
the four main streams. After distributing the questionnaires to those students she
personally came in touch with, she then invited the respondents to further recruit
subjects from among their acquaintances to fill out the questionnaire, which was
known as the snowball sampling.
Pilot test
Pilot test is a crucial part before asking the respondents to fill out the questionnaires,
and there are numerous benefits for carrying out pilot tests. Apart from assuring the
validity and the reliability of the questionnaire, it can also ensure the questions are
clearly worded, and that the respondents comprehend the questionnaire in the right
way (Dahlberg and McCaig 2010, p. 181).
To conduct the pilot test, the researcher distributed 30 pilot questionnaires to her
fellow classmates, who were Applied Sociology Year 3 students. After the
respondents completed the pilot questionnaire, they were invited to provide feedbacks
regarding the pilot test. For example, they were asked how long it took them to fill out
the questionnaire, whether they found the questionnaire items clear or confusing, and
whether any improvements could be made, etc. After collecting respondents’
feedbacks, the researcher carefully read the suggestions provided by the respondents
and made corresponding adjustments to the questionnaire items. With reference to the
collection of pilot questionnaires, the researcher chose to collect them in person once
the questionnaires were completed. As there were only 30 sets of pilot questionnaires
being distributed, collecting them in person was a swift way for gathering information
(Dahlberg and McCaig 2010, p. 162).
Data collection
Discovery – SS Student E-Journal Vol. 1, 2012, 154-183
166
Throughout the data collection procedure, respondents’ privacy was protected as their
anonymity was assured. First and foremost, respondents were not required to provide
sensitive and detailed personal information, like their full name. Instead, respondents
only needed to indicate their sex, major, year of study, ways of getting into university
as well as A-level major.
Apart from this, in order to further protect respondents’ anonymity, they were
not required to hand in the questionnaire to the researcher directly but to put the
completed questionnaire in a collection box. Through such measures, there was no
way for the researcher to identify which set of questionnaire was completed by a
particular respondent, and their anonymity was guaranteed.
Moreover, even though the scales adopted in the questionnaire were borrowed
from western scholars, in order to facilitate respondents’ comprehension of the
questionnaire items, they were translated to Chinese. Indeed, there was another
advantage for adopting the Chinese translation. Since Chinese was regarded as the
respondents’ first language, they did not need to spend extra time to comprehend the
questionnaire items and therefore, the questionnaire completion procedure was
simultaneously facilitated.
Data Processing and Data Analysis
Level of measurement
In the present study, all the scales adopted are regarded as interval level of
measurement, which include the scales measuring 1) attitude towards research
methods and statistics, 2) academic self-efficacy, 3) effort as well as 4) academic
achievement. All the scales are composed of items with equal unit of measurement,
which can be ranked accordingly.
Data analysis
In the present research, there are four main variables included in hypotheses testing,
which are attitude, self-efficacy, effort as well as academic achievement and they
were subjected to in-depth data analysis. For those variables that are not included in
hypotheses testing, like respondents’ demographic background, they are mainly used
for providing descriptive information.
In analyzing the relationship between the variables, SPSS 19.0 was used and
four main analyses were conducted:
1. Reliability test was conducted to estimate the reliability of the scales adopted
in the present study.
2. Descriptive statistics were used to reveal the demographic characteristics of
the respondents.
3. Pearson’s correlation coefficient was used to indicate whether the 4 main
variables were significantly related to each other (H1, H2, H3 and H4).
4. Multiple regression analyses were used to estimate 1) the prediction power of
attitude and self-efficacy on effort and 2) the prediction power of attitude, self-
efficacy, and effort on academic achievement.
Findings

Discovery – SS Student E-Journal Vol. 1, 2012, 154-183
167
After using SPSS 19.0 to process the data collected, four sets of analyses were
undergone:
1. Descriptive statistics were used to display the socio-demographic
characteristics of the respondents.
2. Reliability tests were conducted to determine whether the scales adopted in the
present study were reliable.
3. Pearson’s correlation coefficient was carried out as a means to estimate the
relationship between the four variables of the present study, which were
known as attitude, self-efficacy, effort and academic achievement.
4. Multiple regression analysis was done to estimate the predictability of the
above-mentioned variables.
Descriptive statistics about respondents’ socio-demographic background
There were totally 153 students participated in the present study, in which all of them
came from the City University of Hong Kong. Concerning the gender of the
participants, the distribution of male and female was proportionate, in which 49.7% of
them were male while 50.3 % of them were male. As indicated in the table, all of the
students came from the Department of Applied Social Studies. Nearly half of the
respondents studied Applied Sociology (42.5%), followed by Social Work (26.1%),
Criminology (16.3%) and Psychology (15.0%). Concerning respondents’ year of
study, almost half of them were Year 3 students (45.8%), while the remaining 32.7%
and 21.6% were Year 2 and Year 1 students respectively. Among the participants,
most of them studied arts for A-level major (58.2%), followed by science (22.2%),
and commerce (13.1%). For those respondents who chose not applicable (6.5%), it
meant that they did not take the Advanced level examination.
Table 8. Socio-Demographic Characteristics of the Study Sample of 153 Students. Socio-Demographic Characteristics Percent
Gender (N=153)
Male 49.7
Female 50.3
Major (N=153)
Applied Sociology 42.5
Psychology 15.0
Social Work 26.1
Criminology 16.3
Year of Study (N=153)
Year 1 21.6
Year 2 32.7
Year 3 45.8
A-level Major (N=153)
Science 22.2
Arts 58.2
Commerce 13.1
Not Applicable 6.5
Reliability test of the scales
Discovery – SS Student E-Journal Vol. 1, 2012, 154-183
168
As earlier mentioned, the scales adopted in the present study were borrowed and
modified from scales used in past studies. Since modification was involved, the
reliability of the scales might be affected. Therefore, it was necessary to conduct
reliability tests as a means to ensure the scales were reliable enough.
After conducting the reliability tests, it was found that the modified scales
were quite reliable as the Cronbach’s Alpha ranged from .603 to .954. Therefore, it
could be said that even though the scales had been modified, they could still sustain a
satisfactory level of reliability.
Table 9. Reliability among all scales.
Scale Number of items Cronbach’s Alpha
Attitude towards research methods
(Sub-scale) Affect
(Sub-scale) Cognitive competence
(Sub-scale) Value
(Sub-scale) Interest
Attitude towards statistics
(Sub-scale) Affect
(Sub-scale) Cognitive competence
(Sub-scale) Value
(Sub-scale) Interest
Self-efficacy
Effort
Academic achievement
14
3
4
3
4
14
3
4
3
4
6
7
4
.915
.791
.795
.603
.948
.924
.790
.829
.612
.954
.904
.788
.896
Descriptive statistics of the scales
After providing an overview of the scales adopted in the present study, each scale will
be discussed in details in the following parts.
Independent variable 1: Attitude towards research methods and statistics
In order to present a clearer overview of the variable “attitude towards research
methods and statistics”, the variable will be sub-divided into two parts: attitude
towards research methods and attitude towards statistics. As shown in the table 10, the
total mean score for attitude towards research methods is M = 51.07 and the item with
highest mean score is “I think research methods are worthless” (M = 5.29). As shown
in table 11, concerning the attitude towards statistics, the total mean score is M =
47.52 and the item with highest mean score is “I think statistics is worthless” (M =
5.24).

Discovery – SS Student E-Journal Vol. 1, 2012, 154-183
169
Table 10. Mean scores and standard deviation for “attitude towards research
methods”. Reliability Number of items Cronbach’s Alpha Attitude towards research methods 14 .915 Items Mean SD
1. I like research methods. 3.25 1.484 2. I feel insecure when I have to deal with research
methods-related problems. 3.17 1.261
3. I am under stress during research methods class. 3.11 1.336
4. I can learn research methods. 4.17 1.332
5. I find it difficult to understand research methods. 3.50 1.308
6. I find research methods concepts easy to
understand.
3.54 1.400
7. I think research methods are a complicated
subject.
2.75 1.121
8. I think research methods are worthless. 5.29 1.301
9. Research methods should be a required part of
my professional training.
4.90 1.062
10. Research methods skills make me more
employable.
4.82 1.060
11. I am interested in being able to communicate
research methods-related information to others.
3.05 1.549
12. I am interested in using research methods. 3.05 1.462
13. I am interested in understanding research
methods-related information.
3.11
1.579
14. I am interested in learning research methods. 2.59 1.238
Total attitude towards research methods 51.07 12.845
Table 11. Mean scores and standard deviation for “attitude towards statistics”. Reliability Number of items Cronbach’s Alpha Attitude towards statistics 14 .924 Items Mean SD
1. I like statistics. 2.89 1.624 2. I feel insecure when I have to deal with statistics
problems. 2.96 1.395
3. I am under stress during statistics class. 2.92 1.460
4. I can learn statistics. 3.93 1.419
5. I find it difficult to understand statistics. 3.03 1.333
6. I find statistical concepts easy to understand. 2.81 1.351
7. I think statistics is a complicated subject. 2.38 1.147
8. I think statistics is worthless. 5.24 1.302
9. Statistics should be a required part of my
professional training.
4.88 1.124
10. Statistical skills make me more employable. 4.70 1.170
11. I am interested in being able to communicate
statistical information to others.
2.82 1.363
12. I am interested in using statistics. 3.26 1.512
13. I am interested in understanding statistical
information.
3.21
1.413
14. I am interested in learning statistics. 3.29 1.546
Total attitude towards statistics 47.52 13.662

Discovery – SS Student E-Journal Vol. 1, 2012, 154-183
170
Independent variable 2: Academic self-efficacy
As reflected in the following table, the total mean score for academic self-efficacy is
M = 23.22 and the item with the highest mean score is “I was able to take well-
organized notes during the 2027 research methods and statistics class” (M = 4.25).
Table 12. Mean scores and standard deviation for “academic self-efficacy”. Reliability Number of items Cronbach’s Alpha Academic self-efficacy 6 .904
Items Mean SD
1. I was able to take well-organized notes during
the 2027 research methods and statistics class.
4.25 1.222
2. I participated in the 2027 research methods and
statistics tutorial class by answering lecturer’s
question.
3.69 1.439
3. I can relate the 2027 course content to material
in other courses.
3.97 1.386
4. I can explain and tutor other students about the
2027 course content.
3.71 1.385
5. I can understand most ideas I read in the 2027
tests.
3.75 1.316
6. I can understand most ideas presented in the
2027 class.
3.85 1.245
Total academic self-efficacy 23.22 6.379
Mediated variable: Effort
As shown in the table below, the total mean score for effort is M = 28.54 and the item
with the highest mean score is “I attended every 2027 class section on time” (M =
4.91).
Table 13. Mean scores and standard deviation for “effort”. Reliability Number of items Cronbach’s Alpha Effort 7 .788 Items Mean SD
1. Apart from completing the stated 2027 course
assignments, I also completed extra exercises
related to research methods and statistics.
2.78 1.642
2. Apart from reading the stated 2027 lecture notes,
I also read extra readings/information related to
research methods and statistics.
3.01 1.672
3. I worked hard to complete the 2027 course. 4.63 1.450
4. I studied hard and prepared well for every 2027
test.
4.53 1.328
5. In order to get full understanding on the 2027
course content, I read the lecture notes more than
once.
4.08 1.480
6. I attended every 2027 class section on time. 4.91 1.528
7. I paid close attention to what the lecturer said in
class
4.60 1.330
Total effort 28.54 6.942

Discovery – SS Student E-Journal Vol. 1, 2012, 154-183
171
Dependent variable: Academic achievement
As seen in table 14, the total mean score for academic achievement is M = 16.84 and
the item with highest mean score is “after completing the 2027 course, I have
increased statistical knowledge” (M = 4.57).
Table 14. Mean scores and standard deviation for “academic achievement”. Reliability Number of items Cronbach’s Alpha Academic achievement 4 .896 Items Mean SD
1. After completing the 2027 course, I have
increased statistical knowledge.
4.57 1.196
2. After completing the 2027 course, I have
increased research methods-related knowledge.
4.52 1.113
3. After completing the 2027 course, I have more
confidence in dealing with statistics problems.
3.86 1.222
4. After completing the 2027 course, I have more
confidence in dealing with research methods-
related problems.
3.90 1.226
Total academic achievement 16.84 4.153
Correlation analysis
Pearson’s correlation coefficient was used for testing the hypotheses stated in the
present study and this part mainly summarizes the correlation between the concerned
variables. However, it should be noted that “attitude towards research methods and
statistics” are presented in separate findings. Also, “actual achievement” is divided
into two parts “actual grade” and “increase in knowledge and confidence in dealing
with research methods and statistics” because the measurement is different for the two
scales.
As can be seen in the graph below, the correlation intensity between the
variables is clearly presented.
Table 15. Respondents’ attitude towards research methods, attitude towards statistics,
academic self-efficacy, effort and academic achievement.
Measure 1 2 3 4 5 6
1. Attitude towards research
methods
-- .844* .589* .512* .475* .542*
2. Attitude towards statistics -- -- .641* .542* .478* .671*
3. Academic self-efficacy -- -- -- .683* .475* .728*
4. Effort -- -- -- -- .482* .556*
5. Academic achievement (Actual
grade)
-- -- -- -- -- -
6. Academic achievement (Increase
in confidence and knowledg)
-- -- -- -- -- -
* p < .01 (2-tailed)

Discovery – SS Student E-Journal Vol. 1, 2012, 154-183
172
H1: The more positive one’s attitude towards research methods, the more effort
he/she will put into the subject
Pearson’s correlation coefficient showed that the attitude towards research
methods (r(153) = .512) was statistically significant and moderately correlated with
effort. Therefore, hypothesis 1 was supported.
H2: The more positive one’s attitude towards statistics, the more effort he/she will put
into the subject
Pearson’s correlation coefficient showed that the attitude towards statistics
(r(153) = .542) was also statistically significant and moderately correlated with effort.
Therefore, hypothesis 2 was supported.
H3: The higher one’s academic self-efficacy, the more effort he/she will put into the
subject
Pearson’s correlation coefficient showed that academic self-efficacy (r(153)
= .683) was statistically significant and strongly correlated with effort. Therefore,
hypothesis 3 was supported.
H4: The more effort one puts into the subject, the higher he/she will achieve
academically
Pearson’s correlation coefficient showed that effort (r(153) = .482) was
statistically significant and moderately correlated with academic achievement (actual
grade). Also, it was found that when students put more effort into studying research
methods and statistics, they were likely to indicate an increase in knowledge and
confidence in dealing with the subject (r(153) = .556).
Apart from testing the stated hypotheses, it was found that extra findings could
be obtained after conducting the correlation analysis:
Relationship between attitude towards research methods & attitude towards statistics
Correlation analysis displayed that there was a significantly positive relationship
between attitude towards research methods and attitude towards statistics (r(153)
= .844). This meant that the more positive one’s attitude towards research methods,
he/she also tended to have a positive attitude towards statistics.
Relationship between attitude towards research methods & statistics and academic
self-efficacy
It was also found that was a moderately positive correlation between attitude towards
research methods & statistics and academic self-efficacy. The more positive one’s
attitude towards research methods, his/her academic self-efficacy also tended to be
higher (r(153) = .589). Similarly, when one’s attitude towards statistics was positive,
he/she also tended to have higher academic self-efficacy (r(153) = .641).
Relationship between attitude towards research methods & statistics and academic
achievement
Discovery – SS Student E-Journal Vol. 1, 2012, 154-183
173
Apart from this, it was also discovered that there was a positive correlation between
attitude towards research methods & statistics and academic achievement. When a
student’s attitude towards research methods is positive, he/she tended to indicate an
increase in knowledge and confidence in dealing with the subject (r(153) = .542), and
he/she was likely to achieve a higher grade in the 2027 research methods & statistics
course (r(153) = .475).
Similarly, when a student’s attitude towards statistics is positive, he/she
tended to indicate an increase in knowledge and confidence in dealing with the
subject (r(153) = .671), and he/she was likely to achieve a higher grade in the 2027
research methods & statistics course (r(153) = .478).
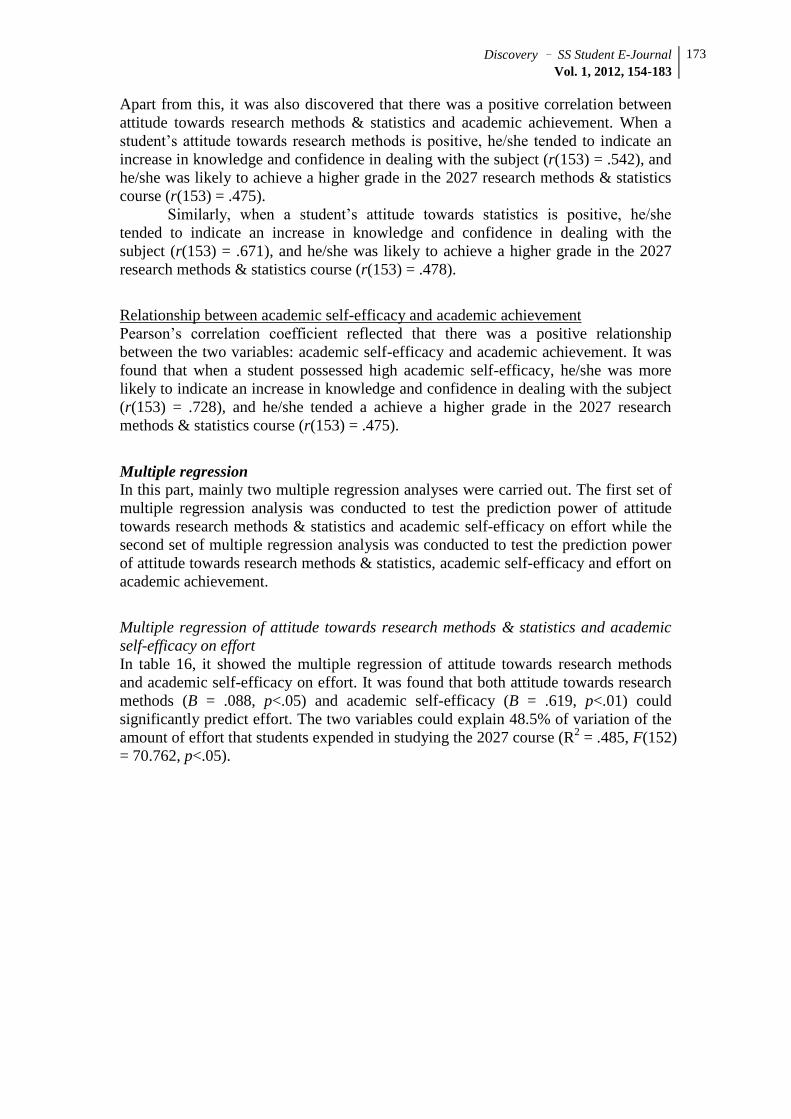
Relationship between academic self-efficacy and academic achievement
Pearson’s correlation coefficient reflected that there was a positive relationship
between the two variables: academic self-efficacy and academic achievement. It was
found that when a student possessed high academic self-efficacy, he/she was more
likely to indicate an increase in knowledge and confidence in dealing with the subject
(r(153) = .728), and he/she tended a achieve a higher grade in the 2027 research
methods & statistics course (r(153) = .475).
Multiple regression
In this part, mainly two multiple regression analyses were carried out. The first set of
multiple regression analysis was conducted to test the prediction power of attitude
towards research methods & statistics and academic self-efficacy on effort while the
second set of multiple regression analysis was conducted to test the prediction power
of attitude towards research methods & statistics, academic self-efficacy and effort on
academic achievement.
Multiple regression of attitude towards research methods & statistics and academic
self-efficacy on effort
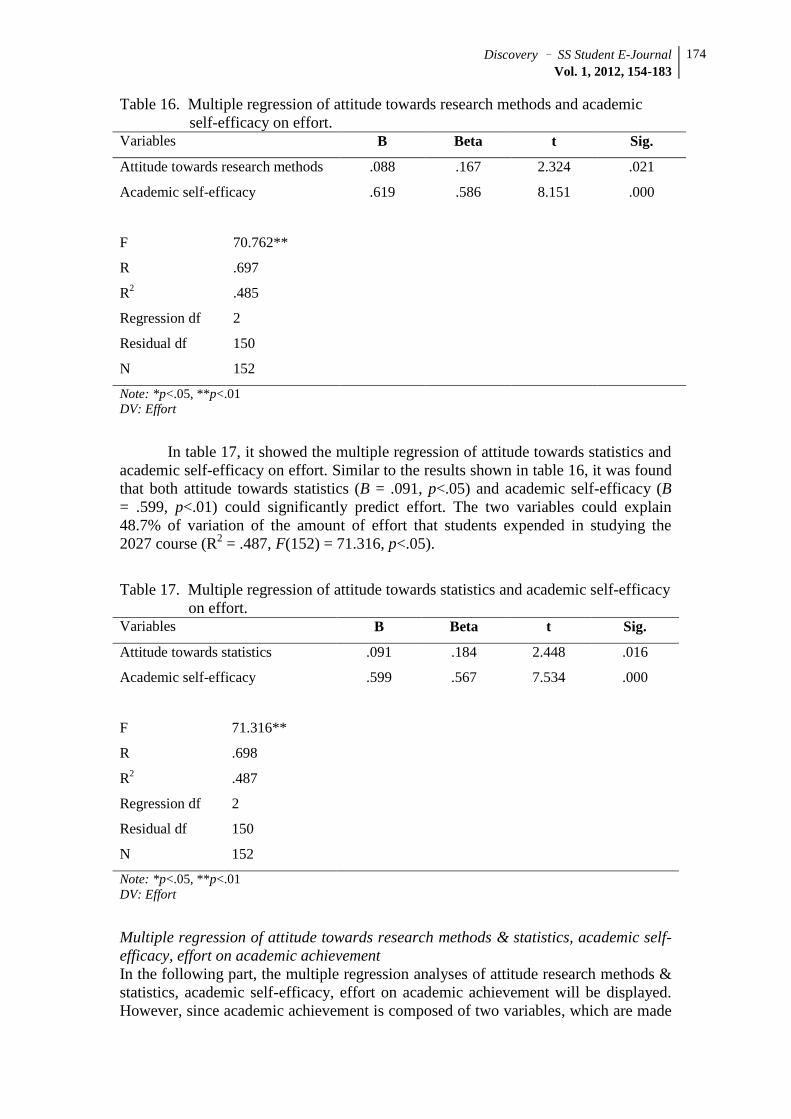
In table 16, it showed the multiple regression of attitude towards research methods
and academic self-efficacy on effort. It was found that both attitude towards research
methods (B = .088, p<.05) and academic self-efficacy (B = .619, p<.01) could
significantly predict effort. The two variables could explain 48.5% of variation of the
amount of effort that students expended in studying the 2027 course (R2 = .485, F(152)
= 70.762, p<.05).
Discovery – SS Student E-Journal Vol. 1, 2012, 154-183
174
Table 16. Multiple regression of attitude towards research methods and academic
self-efficacy on effort. Variables B Beta t Sig.
Attitude towards research methods .088 .167 2.324 .021
Academic self-efficacy .619 .586 8.151 .000
F 70.762**
R .697
R2 .485
Regression df 2
Residual df 150
N 152
Note: *p<.05, **p<.01
DV: Effort
In table 17, it showed the multiple regression of attitude towards statistics and
academic self-efficacy on effort. Similar to the results shown in table 16, it was found
that both attitude towards statistics (B = .091, p<.05) and academic self-efficacy (B
= .599, p<.01) could significantly predict effort. The two variables could explain
48.7% of variation of the amount of effort that students expended in studying the
2027 course (R2 = .487, F(152) = 71.316, p<.05).
Table 17. Multiple regression of attitude towards statistics and academic self-efficacy
on effort. Variables B Beta t Sig.
Attitude towards statistics .091 .184 2.448 .016
Academic self-efficacy .599 .567 7.534 .000
F 71.316**
R .698
R2
.487
Regression df 2
Residual df 150
N 152
Note: *p<.05, **p<.01
DV: Effort
Multiple regression of attitude towards research methods & statistics, academic self-
efficacy, effort on academic achievement
In the following part, the multiple regression analyses of attitude research methods &
statistics, academic self-efficacy, effort on academic achievement will be displayed.
However, since academic achievement is composed of two variables, which are made

Discovery – SS Student E-Journal Vol. 1, 2012, 154-183
175
of different scale measurements: 1) knowledge and confidence in dealing with
research methods and statistics and 2) actual 2027 course grade. Therefore, it is
necessary to conduct separate multiple regressions on this variable.
Part 1: Multiple regression analyses of attitude towards research methods, academic
self-efficacy, effort on academic achievement (knowledge and confidence)
In table 18, it showed the multiple regression analysis of attitude towards research
methods, academic self-efficacy and effort on academic achievement (knowledge and
confidence). It was found that only attitude towards research methods (B = .038,
p<.01) and academic self-efficacy (B = .153, p<.01) could significantly predict
academic achievement (confidence and knowledge). The two variables could explain
45.6% of variation of students’ academic achievement (knowledge and confidence in
dealing with the subject) (R2 = .456, F(152) = 43.454, p<.05).
Table 18. Multiple regression of attitude towards research methods, academic self-
efficacy and effort on academic achievement (knowledge and confidence). Variables B Beta t Sig.
Attitude towards research methods .038 .231 3.066 .003
Academic self-efficacy .153 .481 5.420 .000
Effort .016 .054 .650 .516
F 43.454
R .683
R2 .456
Regression df 3
Residual df 149
N 152
Note: *p<.05, **p<.01
DV: Academic achievement (knowledge and confidence)
Multiple regression of attitude towards statistics, academic self-efficacy, effort on
academic achievement (knowledge and confidence)
As indicated in table 19, similar findings could be obtained. It was found that only
attitude towards statistics (B = .051, p<.01) and academic self-efficacy (B = .173,
p<.01) could significantly predict academic achievement (confidence and knowledge).
The two variables could explain 61.6% of variation of students’ academic
achievement (knowledge and confidence in dealing with the subject) (R2 = .616,
F(152) = 82.244, p<.05).

Discovery – SS Student E-Journal Vol. 1, 2012, 154-183
176
Table 19. Multiple regression of attitude towards statistics, academic self-efficacy and
effort on academic achievement (knowledge and confidence). Variables B Beta t Sig.
Attitude towards statistics .051 .316 4.737 .000
Academic self-efficacy .173 .514 6.707 .000
Effort .015 .047 .668 .505
F 82.244
R .790
R2 .616
Regression df 3
Residual df 149
N 152
Note: *p<.05, **p<.01
DV: Academic achievement (knowledge and confidence)
Part 2: Multiple regression analyses of attitude towards research methods, academic
self-efficacy, effort on academic achievement (actual 2027 course grade)
In table 20, it showed the multiple regression analysis of attitude towards research
methods, academic self-efficacy and effort on academic achievement (actual 2027
course grade). It was found that only attitude towards research methods (B = .092,
p<.01) and academic self-efficacy (B = .355, p<.01) could significantly predict
academic achievement (actual course grade). The two variables could explain 59.6%
of variation of the actual 2027 course grade that students obtained (R2 = .596, F(152)
= 73.267, p<.05).
Table 20. Multiple regression of attitude towards research methods, academic self-
efficacy and effort on academic achievement (actual 2027 course grade). Variables B Beta t Sig.
Attitude towards research methods .092 .263 4.016 .000
Academic self-efficacy .355 .518 6.712 .000
Effort .059 .091 1.258 .211
F 73.267
R .772
R2 .596
Regression df 3
Residual df 149
N 152
Note: *p<.05, **p<.01
DV: Academic achievement (actual 2027 course grade)
Discovery – SS Student E-Journal Vol. 1, 2012, 154-183
177
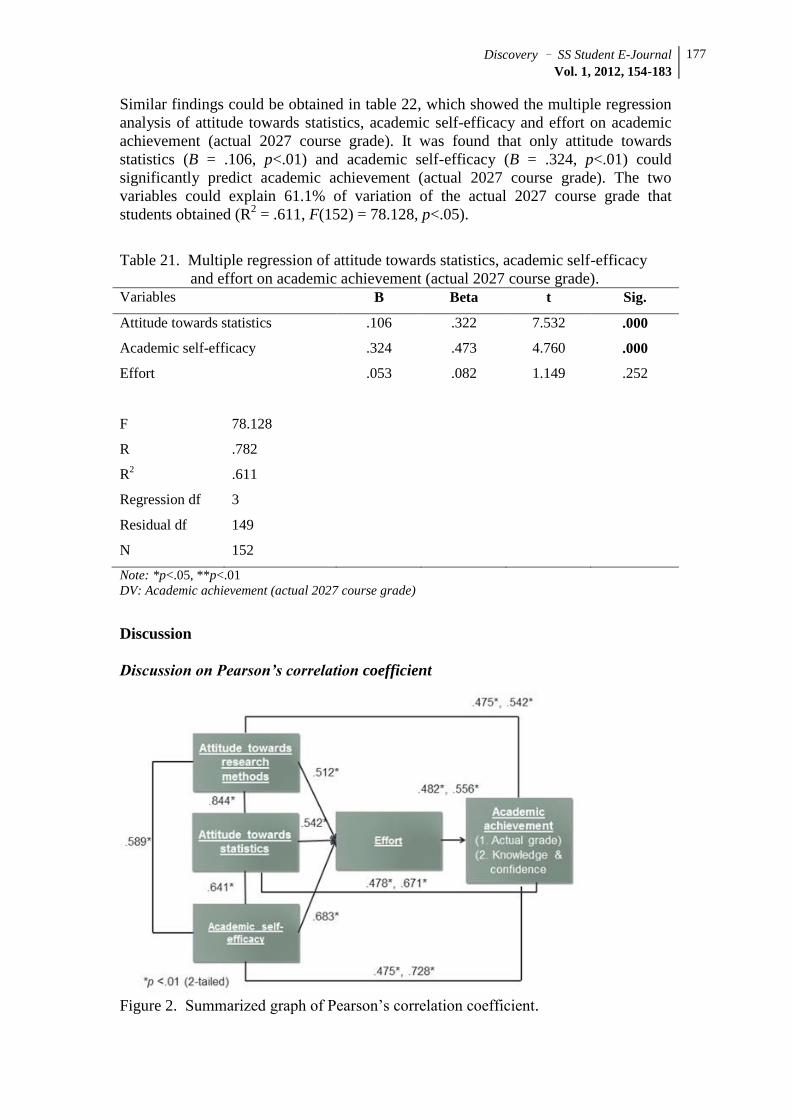
Similar findings could be obtained in table 22, which showed the multiple regression
analysis of attitude towards statistics, academic self-efficacy and effort on academic
achievement (actual 2027 course grade). It was found that only attitude towards
statistics (B = .106, p<.01) and academic self-efficacy (B = .324, p<.01) could
significantly predict academic achievement (actual 2027 course grade). The two
variables could explain 61.1% of variation of the actual 2027 course grade that
students obtained (R2 = .611, F(152) = 78.128, p<.05).
Table 21. Multiple regression of attitude towards statistics, academic self-efficacy
and effort on academic achievement (actual 2027 course grade). Variables B Beta t Sig.
Attitude towards statistics .106 .322 7.532 .000
Academic self-efficacy .324 .473 4.760 .000
Effort .053 .082 1.149 .252
F 78.128
R .782
R2 .611
Regression df 3
Residual df 149
N 152
Note: *p<.05, **p<.01
DV: Academic achievement (actual 2027 course grade)
Discussion
Discussion on Pearson’s correlation coefficient
Figure 2. Summarized graph of Pearson’s correlation coefficient.
Discovery – SS Student E-Journal Vol. 1, 2012, 154-183
178
Present findings are consistent with past literature
(a) Attitude and self-efficacy are respectively related to effort
The present research discovers that when students possess a positive attitude towards
research methods and statistics, they tend to put more effort into studying the subject.
Similarly, students with a high self-efficacy towards research methods and statistics,
they also tend to put more effort into studying the subject. Indeed, these two findings
are similar to existing literature.
Concerning the relationship between attitude and effort, in a research
conducted in Washington, the researcher studied the relationship between students’
attitude towards science and the amount of effort they would expend in completing a
computer science program. The results indicated that there was a positive relationship
between attitude and effort, and attitude could be regarded as a reliable predictor of
effort (Center for Educational Technologies, 2007).
With reference to the relationship between self-efficacy and effort, similar
findings are found in existing literature. According to Bandura’s developmental
analysis of self-efficacy, he stated that there was a positive relationship between self-
efficacy and effort, in which self-efficacy affected how much effort individuals would
expend (Flavell, 1981, p. 200).
(b) Effort is related to academic achievement
In the present research, it is found that there is a positive correlation between effort
and academic achievement, in which similar findings are existent in past literature.
For example, in a study conducted in the U.S., the researchers stated that Asian
American students tended to exert more effort in their studies (e.g. spent more time
working on assignments, attended more lessons outside school) and they achieved
better academically when compared to other minority students (Peng and Wright,
1994, p. 348).
Present findings are consistent with the stated hypotheses
As stated in the hypotheses, it was assumed that there was a positive relationship
between 1) attitude towards research methods and effort, 2) attitude towards statistics
and effort, 3) academic self-efficacy and effort and finally, 4) effort and academic
achievement.
As aforementioned, Pearson’s correlation coefficient demonstrated that there
was a positive relationship (ranging from moderately to strongly) between the
concerned variables and that all the stated hypotheses were supported.
Present extra findings are consistent with past literature
(a) Attitude and self-efficacy are related to each other
In the present research, it is found that when students’ attitude towards research
methods and statistics are positive, their self-efficacy is also higher. Indeed, such a
finding is consistent with past researches. For example, in a study conducted by
Delcourt and Kinize, they found that if students held positive attitude towards an
academic subject (e.g. they found it comfortable to study the subject and they thought
the subject was useful to their studies and future career, they tended to possess higher
self-efficacy in studying the subject.

Discovery – SS Student E-Journal Vol. 1, 2012, 154-183
179
(b) Attitude is related to academic achievement
From the present research, it is found that attitude is moderately and positively
correlated with academic achievement, which provides support to past literature. For
example, a research proved that students who possessed a positive study attitude were
more likely to demonstrate higher academic performance than those who had a less
positive attitude towards studies. In addition, the research also showed that 98.7% of
the underachievers tended to possess a less favorable attitude towards their studies
(Moghni and Riaz 1994, Hamachak 1998, cited Bakar 2010).
(c) Academic self-efficacy is correlated with academic achievement
The present study demonstrates that academic self-efficacy and academic
achievement are positively correlated, which is found to be consistent with most of
the existing literature. For example, in a study conducted in the U.S., the researchers
examined the effect of self-efficacy on first-year university students’ academic
achievement (Chemers et al. 2001, p. 55). After analyzing the data collected, it was
shown that the higher one’s self-efficacy, the better the academic performance he/she
could achieve.
Discussion on multiple regression analyses
Multiple regression of attitude towards research methods & statistics and academic
self-efficacy on effort
As shown in the results, it is found that both attitude towards research methods and
attitude towards statistics as well as academic self-efficacy can significantly predict
effort. As aforementioned, in a research conducted in Washington, the researcher
studied the relationship between students’ attitude towards science and the amount of
effort they would expend in completing a computer science program. The results
indicated that attitude could be regarded as a reliable predictor of effort (Center for
Educational Technologies 2007).
Concerning self-efficacy’s prediction power on effort, in a research studying
the relationship between one’s self-efficacy and health behaviors, it was found that
self-efficacy could successfully predict one’s effort in engaging in health behaviors
(Fuchs and Schearzer 1995 cited Conner and Norman 1995).
Multiple regression of attitude towards research methods & statistics, academic self-
efficacy, effort and academic achievement
After conducting the second set of multiple regression analysis, an interesting finding
is obtained. As earlier mentioned, it is found that attitude and academic self-efficacy
could significantly predict effort in the first set of regression analysis. However, in the
second set of regression analysis, it is discovered that only attitude and academic self-
efficacy can significantly predict academic achievement while effort fails to do so.
Indeed, such a finding is contradictory with most of the existing literature, in which
most of them stated that effort could significantly predict academic achievement.
Even so, it was found that there was a past study stating that effort could not
successfully predict achievement. The researchers examined the relationship between
university students’ effort (measured in term of the amount of time students spent in
learning) and academic performance (grades achieved by the respondents). The
results indicated that effort failed to predict respondents’ academic performance
(Chassie et al. 2004, p. 232).
Discovery – SS Student E-Journal Vol. 1, 2012, 154-183
180
All, in all, the present result finding indicates that even though effort does
relate to attitude and effort, it fails to be an important factor in predicting academic
achievement. Therefore, effort can only be regarded as an indirect factor, but not a
necessary factor in bridging the relationship between attitude, self-efficacy and
academic achievement.
Limitations and recommendations
Limitations of the present study
Indeed, three limitations can be observed in the present study, which include limited
representativeness in terms of sample size, sampling method as well as social
desirability bias, and absence of a pre-test study.
Limited sample size
First and foremost, there were only 153 respondents participated in the present
research, which could not be regarded as a large sample size. Also, all of the
respondents came from the same university – City University of Hong Kong.
Therefore, the opinions collected from them could not be generalized to a larger
population, like all the university students in Hong Kong and the data collected was
considered as limited in representativeness because of its’ homogeneity.
Sampling method
Owing to limited resources, the researcher adopted two non-probability sampling
methods, which were known as convenience sampling and snowball sampling. Under
non-probability sampling, not every sample had the equal chance of being selected.
Therefore, the sampling method could also be regarded as another limitation, which
reduced the representativeness of the present study.
Social desirability bias
In the present research, the data collection method was self-completed questionnaire
and there was a methodological flaw for adopting this method. Since respondents
filled out the questionnaire on their own, it was possible for them to give answers that
are considered favorable as a means to impress the researcher.
Absence of a pre-test study
Since the present study only took place after the respondents had completed the 2027
research methods and statistics course, a comparison could not be made. If a pre-test
was available, the researcher could observe whether there was a change in attitude,
self-efficacy and effort that students expended in studying research methods &
statistics before and after taking the 2027 course.
Recommendations for future studies
In order to further improve the study on this area, some recommendations are
suggested:
Large and heterogeneous sample

Discovery – SS Student E-Journal Vol. 1, 2012, 154-183
181
First and foremost, in order to improve the representativeness of future studies, it is
suggested that researchers should invite students who need to study research methods
and statistics from all the 9 universities in Hong Kong to participate in the study.
Since the respondents respectively represent distinctive universities in Hong Kong,
the data collected will be more heterogeneous. Therefore, the results generated from
the study can be generalized to represent a larger population – general university
students in Hong Kong.
Apart from including a larger and more heterogeneous sample, it is also
suggested that researchers should adopt a probability sampling method, like random
sampling in collecting data. For example, researchers can make the data collected
more representative by randomly recruit a proportionate amount of students from each
university to participate in the study.
Focus on studying the role of “effort”
In addition, in the present research, the statement that “effort” serves as a mediated
factor between attitude, self-efficacy and academic achievement is still under question.
The correlation analysis proved that there was a positive relationship between attitude,
self-efficacy and effort. Similarly, after conducting the multiple regression analysis, it
was found that both attitude and self-efficacy could significantly predict effort.
However, when the researcher conducted another multiple regression analysis to test
whether all the three variables (attitude, self-efficacy and effort) could significantly
academic achievement, it was found that effort failed to predict academic
achievement.
Therefore, the role of “effort” in serving as a mediated factor between attitude,
self-efficacy and academic achievement needs to be further studied. All in all, it is
suggested that future researchers can focus on studying this area by testing whether
“effort” genuinely serves as a mediated factor by bridging the relationship between
attitude, self-efficacy and academic achievement.
More researches need to be conducted in Hong Kong
Last but not least, even though the topic of attitude, self-efficacy, effort and academic
achievement has been a popular topic in the fields of socio-educational researches, a
vast majority of these studies were conducted in foreign countries, particularly in the
U.S. and European countries.
On the contrary, in Hong Kong, there are few researches concerning this area
of study. Therefore, it is therefore suggested that researchers can get an in-depth
understanding on Hong Kong’s phenomenon by studying the attitude, self-efficacy,
effort and academic achievement of university students in Hong Kong.
Conclusion
First and foremost, the present research proves that all the four variables (attitude,
self-efficacy, effort and academic achievement) are positively correlated with one
other. However, even though they are related to one another, multiple regression
analyses display some interesting findings. For the first set of multiple regression
analysis, it is found that attitude and self-efficacy can significantly predict effort.
However, in the second set of regression analysis, when all the three variables
(attitude, self-efficacy and effort) are considered as independent variables while
academic achievement is considered as the dependent variable, it is discovered that
effort cannot predict academic achievement. Therefore, effort can only be regarded as
Discovery – SS Student E-Journal Vol. 1, 2012, 154-183
182
an indirect factor that can influence both attitude and self-efficacy, but not necessarily
academic achievement.
Apart from this, the present research also further consolidates the direct
relationship between attitude, self-efficacy and academic achievement as suggested in
past literature. It is observed that attitude has a direct effect on academic achievement
while self-efficacy also has a direct effect on academic achievement.
Acknowledgement
Starting from the beginning of constructing the research topic to the end of writing the final report,
I owe many thanks to those people who accompanied and offered me support as I went through
this journey.
First and foremost, I would like to express my sincere gratitude to my supervisor, Dr.
Alfred Choi for his guidance and support. Without his constructive comments, suggestions and
corrections on my research project, I honestly do not think the whole research would have been
completed smoothly. Apart from this, I would also like to thank my dear friends, Cathy, Tracy,
Edmond, Winter, Derek, Rita, Victor, Debbie, Mandy, and Timmy for teaching me the true
meaning of the word “friendship” by giving me unlimited emotional support. In addition, I would
like to thank my family for their unconditional love, guidance and support and words cannot
express how much I love them. Last but not least, I would also like to show appreciation to my
fellow schoolmates who were willing to spend time on filling out my questionnaires, which helped
contribute to the success of the present research.
Biographic Note
Miss Lilian K.Y. Li is the 2012 graduate of Bachelor of Social Sciences (Honours) in Applied
Sociology at City University of Hong Kong. Her email address is [email protected].
References
Bakar, K.A., Tarmizi, R.A., Mahyuddin, R., Elias, H., Wong, S.L., and Ayub, A.F.M., 2010.
Relationships between university students’ achievement motivation, attitude and academic
performance in Malaysia. Procedia – Social and Behavioral Sciences, 2 (2), 4906-4910.
Carbonaro, W., 2005. Tracking, students’ effort, and academic achievement: a magazine of theory
and practice. Sociology of Education, 78 (1), 27-49.
Chassie, M.B., O’Conner, E.J., and Walther, F., 2004. Expended effort and academic performance.
Testing of Psychology, 7 (4), 231-233.
Center for Educational Technologies., 2007. Science-related attitudes and effort in the use of
educational software by high school students. Available from: http://www.cet.edu/pdf/
attitudes.pdf [Accessed 6 April 2012].
Chen, J., 2007. How the Academic support of parents, teachers and peers contribute to a student’s
achievement (The Case of Hong Kong). New York: The Edwin Mellen Press.
Chemers, M.M., Hu, L., and Garcia, B.F., 2001. Academic self-efficacy and first-year college
student performance and adjustment. Journal of Educational Psychology, 93, 55-64.
Conner, M. and Norman, P., 1995. Predicting Health Behaviour: Research and Practice with
Social Cognition Models. Buckingham: Open University Press.
Dehlberg, L. and McCaig, C., 2010. Practical Research and Evaluation: A Start-to-Finish Guide for Practitioners. Singapore: SAGE publications.
Delcourt, M.A. and Kinzie, M.B., 1993. Computer technologies in teacher education: The
measurement of attitudes and self-efficacy. Journal of Research and Development in Education, 27, 35-41.
Education Resources Information Center. (2010). Development of a college academic self-efficacy scale. Available from: http://www.eric.ed.gov/ERICWebPortal/search/detailmini. jsp?_
nfpb=true&_&ERICExtSearch_SearchValue_0=ED298158&ERICExtSearch_SearchType_0=no
&accno=ED298158 [Accessed 31 October 2011]. Elliot, J.G., Hufton, N.R., Willis, W., and Illushin, L., 2005. Motivation, engagement and
educational performance. Britain: Palgrave.

Discovery – SS Student E-Journal Vol. 1, 2012, 154-183
183
Fishbein, M. and Ajzen, I., 1975. Belief, attitude, intention, and behavior: an introduction to
theory and research. Canada: Addison-Wesley.
Fishbein, M., 1967. Readings in attitude theory and measurement. America: Kohn Wiley & Sons,
Inc.
Feltz, D., Short, S., and Sullivan, P., 2008. Self-efficacy in sport – research and strategies for
working with athletes, teams, and coaches. United States: Human Kenetics.
Flavell, J.H., 1981. Social cognitive development: frontiers and possible futures. United States:
Cambridge University Press.
Hemmings, B. and Kay, R., 2010. Prior achievement, effort, and mathematics attitude as
predictors of current achievement. The Australian Educational Researcher, 37 (2), 41-58.
House, J.D., 1995. The predictive relationship between academic self-concept, achievement
expectancies, and grade performance in college calculus. The Journal of Social Psychology 135,1, 111-112.
Institute for Applied Psychometrics., 2008. Academic self-efficacy: definition and conceptual
background. Available from: http://www.iapsych.com/acmcewok/Academicself-
efficacy.html [Accessed 11 November 2011].
Lent, R.W., Larkin, K.C., and Brown, S.D., 1986. Self-efficacy in the prediction of academic
performance and perceived career options. Journal of Counseling Psychology, 33 (3), 265-
269.
Ma, X. and Kishor, N., 1997. Assessing the relationship between attitude toward Mathematics and
achievement in mathematics. Journal for Research in Mathematics Education, 28 (1), 26-47.
Mickelson, R.A., 1990. The attitude-achievement paradox among black adolescents. Sociology of
Education, 63 (1), 44-61.
Peng, S.S. and Wright, D., 1994. Explanation of academic achievement of Asian American
students, 87 (6), 346-352.
Reynolds, A.J. and Walberg, H.J., 1992. A process model of mathematics achievement and
attitude. Journal for Research in Mathematics Education, 23 (4), 306-328.
Stewart, E.B., 2008. School structural characteristics, student effort, peer associations, and
parental involvement – the influence of school- and individual-level factors on academic
achievement. Education and Urban Society, 40 (2), 179-204.
Strelnieks, M., 2005. The relationship of students’ domain specific self-concepts and self-efficacy
to academic performance. Unpublished doctoral dissertation. Marquette University,
Wisconsin.
Turner, E.A., Chandler, M., and Heffer, R.W., 2009. The influence of parenting styles,
achievement motivation and self-efficacy on academic performance in college students.
Journal of College Student Development, 50 (3), 337-346.
Valle, A., et al., (2009). Academic goals and learning quality in higher education students. The
Spanish Journal of Psychology, 12 (1), 96-105.
Walker, D.A., 2010. A confirmatory factor analysis for the attitude toward research scale. Multiple
Linear Regression Viewpoints, 36 (1), 18-27.