a study of principals‘ instructional leadership …
TRANSCRIPT
A STUDY OF PRINCIPALS‘ INSTRUCTIONAL LEADERSHIP BEHAVIORS AND
BELIEFS OF GOOD PEDAGOGICAL PRACTICE AMONG EFFECTIVE
CALIFORNIA HIGH SCHOOLS SERVING SOCIOECONOMICALLY
DISADVANTAGED AND ENGLISH LEARNERS
by
Jamon Frederick Peariso
Liberty University
A Dissertation Presented in Partial Fulfillment
Of the Requirements for the Degree
Doctor of Education
Liberty University
April, 2011

ii
A STUDY OF PRINCIPALS‘ INSTRUCTIONAL LEADERSHIP BEHAVIORS AND
BELIEFS OF GOOD PEDAGOGICAL PRACTICE AMONG EFFECTIVE
CALIFORNIA HIGH SCHOOLS SERVING SOCIOECONOMICALLY
DISADVANTAGED AND ENGLISH LEARNERS
by
Jamon Frederick Peariso
APPROVED BY:
Committee Chair Angela M. Smith, Ed.D.
___________________________
Committee Member Casey S. Reason, Ph.D.
___________________________
Committee Member Terri L. Nuckols, Ed.D.
___________________________
Chair of Graduate Studies Scott B. Watson, Ph.D.
___________________________

iii
ABSTRACT
Jamon Frederick Peariso. A STUDY OF PRINCIPALS‘ INSTRUCTIONAL
LEADERSHIP BEHAVIORS AND BELIEFS OF GOOD PEDAGOGICAL PRACTICE
AMONG EFFECTIVE CALIFORNIA HIGH SCHOOLS SERVING
SOCIOECONOMICALLY DISADVANTAGED AND ENGLISH LEARNERS. (Under
the direction of Angela M. Smith, Ed.D.) School of Education, April, 2011.
This mixed methods descriptive and causal-comparative study investigates what
instructional leadership behaviors effective California high school principals have and
what their beliefs are in regards to pedagogy, related issues, and professional issues,
either constructivist or instructivist in nature, in the environment of the current NCLB
accountability era. Differences found in eight specific demographic variables were
analyzed in combination with data obtained from principals‘ responses on the Principal
Instructional Management Rating Scale (PIMRS) and the Principal Beliefs Survey (PBS,
a variation of the Teacher Beliefs Survey).
The population comprised of principals whose schools have met their API growth
targets for two consecutive school years school wide and for socioeconomically
disadvantaged, English learner subgroups. A volunteer rate of 51% (N = 36) was obtained
from a population of 71.
Results indicate that effective high school principals frequently engaged in
instructional leadership behaviors. Concerning pedagogy, principals held eclectic beliefs,
but were united in the beliefs of accountability and the importance of a prescriptive, well
designed curriculum. Subjects‘ gender, ethnicity, and the percentage of instructional

iv
leadership delegated were not significantly different in regards to principals‘ instructional
leadership practices or pedagogical beliefs. Significant differences were found among a
few specific instructional leadership practices and pedagogical beliefs based on subjects‘
education level, overall years as a classroom teacher, subject taught as a teacher, overall
years as the current principal, and overall years of administrative experience. From the
findings, a contingency model of principals‘ pedagogical beliefs was developed.
Additionally, reliability testing was performed on both instruments.

v
DEDICATION
First and foremost, I would like to dedicate this dissertation to my wife Sarrah. Her
unwavering support and belief in me has been the well from which I have drawn my
persistence to get the job done. Her patience and love transcends all that would be
expected from a loving wife and a best friend. Thank you and I love you. I would also
like to dedicate this dissertation to my three sons Jacob, Cole, and Evan, with the
understanding of this simple truth; the Lord will not open doors we are not prepared to
enter. I would also like to dedicate this dissertation to my mother, Nancy. Your personal
qualities of hard work and self-sacrifice for the good of your children will always be an
example to me. Finally, to my grandfather Garth, who taught me that successful
leadership always starts with integrity.
vi
ACKNOWLEDGEMENTS
As one who often reflects upon my weaknesses, it is imperative I acknowledge
those who made this possible for me and gave me valuable assistance, insights,
motivation, and advise along the way. First and foremost, I would like to acknowledge
the source of all that I have been blessed with in my life. My loving Heavenly Father has
shown me patience, consistent forgiveness, and spiritual insights that have been the
foundation of who I am and what I can become.
Professionally, I would like to acknowledge my colleague and mentor Roger Graf.
He has inspired my interest in logic, the art of argument and philosophy. His professional
integrity will always be an example to me.
Finally, I would like to acknowledge my committee chair and committee members,
Dr. Smith, Dr. Reason, and Dr. Nuckols. Thank you for the support, insights, and
freedom to pursue my interests and progress thought this process. Thank you for all your
time and effort in my behalf.

vii
TABLE OF CONTENTS
Page
APPROVAL PAGE ............................................................................................................ ii
ABSTRACT ....................................................................................................................... iii
DEDICATION .....................................................................................................................v
ACKNOWLEDGMENTS ................................................................................................. vi
TABLE OF CONTENTS .................................................................................................. vii
LIST OF TABLES ............................................................................................................ xii
LIST OF FIGURES ......................................................................................................... xiv
CHAPTER ONE: INTRODUCTION ..................................................................................1
Background of Study ...............................................................................................1
Problem Statement ...................................................................................................8
Professional Significance of Study ..........................................................................9
Research Questions and Null Hypotheses .............................................................10
Overview of the Methodology ...............................................................................17
Definition of Terms................................................................................................20
Organization of the Dissertation ............................................................................23
CHAPTER TWO: REVIEW OF RELATED LITERATURE ...........................................25
The Accountability Era ..........................................................................................25
Effective Schools Research ....................................................................................32
Instructional Leadership.........................................................................................40
Principal Instructional Management Rating Scale .................................................49
viii
Defining the School Mission .....................................................................49
Managing the Instructional Program .........................................................50
Promoting a Positive School Learning Climate .........................................50
Instructional Leadership‘s Effects on Student Achievement .................................51
Direct Effects of Leadership on Student Achievement ..............................52
Mediated and Reciprocal Effects on Student Achievement ......................53
Principals‘ Beliefs and Philosophy of Teaching and Learning ..................55
Education Wars: Instructivism vs. Constructivism ................................................61
Constructivism Success or Failure: The Debate ........................................65
The Constructs of Constructivism .............................................................71
Leadership Effectiveness: Other Influential Variables ..........................................73
Summary ................................................................................................................77
CHAPTER THREE: METHODOLOGY ..........................................................................78
Study Design ..........................................................................................................78
Participants .............................................................................................................86
Procedures ..............................................................................................................89
Instrumentation ......................................................................................................92
Demographic Questionnaire ......................................................................92
Principal Beliefs Survey ............................................................................93
Principal Instructional Management Rating Scale .....................................98
Data Analysis Procedures ....................................................................................102
Summary ..............................................................................................................104

ix
CHAPTER FOUR: FINDINGS .......................................................................................106
Demographic Information ....................................................................................106
Research Question One ........................................................................................113
Research Question Two .......................................................................................123
Research Question Three and Null Hypotheses...................................................126
Research Question Four and Null Hypotheses ....................................................128
Research Question Five and Null Hypotheses .....................................................129
Research Question Six and Null Hypotheses .......................................................131
Research Question Seven and Null Hypotheses ..................................................133
Research Question Eight and Null Hypotheses ...................................................136
Research Question Nine and Null Hypotheses ....................................................137
Research Question Ten and Null Hypotheses ......................................................140
Research Question Eleven and Null Hypotheses .................................................141
Research Question Twelve and Null Hypotheses ................................................143
Research Question Thirteen and Null Hypotheses ..............................................144
Research Question Fourteen and Null Hypotheses ..............................................146
Research Question Fifteen and Null Hypotheses.................................................148
Research Question Sixteen and Null Hypotheses ................................................149
Research Question Seventeen and Null Hypotheses ...........................................152
Research Question Eighteen and Null Hypotheses ..............................................154
Additional Findings .............................................................................................155
Summary ..............................................................................................................156

x
CHAPTER FIVE: SUMMARY AND DISCUSSION ....................................................159
Problem Statement ...............................................................................................159
Review of Methodology ......................................................................................160
Summary of the Findings .....................................................................................163
Research Question One ............................................................................163
Research Question Two ...........................................................................164
Research Question Three through Ten ....................................................165
Research Question Eleven through Eighteen ...........................................167
Discussion of the Findings ...................................................................................170
Recommendations for Educational Leaders ........................................................177
Suggestions for Future Study ...............................................................................178
Limitations and Assumptions ..............................................................................180
Summary ..............................................................................................................183
REFERENCES ................................................................................................................184
APPENDICES .................................................................................................................209
Appendix A: Liberty University IRB Approval ..................................................209
Appendix B: Permission to Use the PIMRS ........................................................210
Appendix C: Permission to Use the PBS .............................................................211
Appendix D: "Effective" California High Schools 2007-2008 to 2008-2009
School Years ........................................................................................................212
Appendix E: Pre-Notice Letter ............................................................................213
Appendix F: Survey Cover Letter ........................................................................214

xi
Appendix G: Questionnaire Packet ......................................................................215
Appendix H: Survey Reminder Postcard .............................................................227
Appendix I: Survey Reminder E-mail .................................................................228
Appendix J: ANOVA Descriptive Statistics Tables ............................................229
Appendix K: Subjects‘ Instructional Leadership Comments ...............................263

xii
LIST OF TABLES
Page
Table 1: Hallinger‘s Domains with Corresponding Leadership Practices: A
Summary ............................................................................................................................48
Table 2: Descriptive Statistics of Subjects' High Schools .................................................90
Table 3: Item Mapping of the PBS ....................................................................................97
Table 4: Reliability Estimates for the PIMRS Subscales.................................................101
Table 5: Frequency of Principals‘ Gender, Ethnicity, and Education .............................108
Table 6: Frequency of Years as a Classroom Teacher and Primary Subject Taught .......109
Table 7: Frequency of Years as Current Principal and Overall Years in
Administration .................................................................................................................110
Table 8: Frequency of Percentages of Instructional Leadership Delegated ....................112
Table 9: Descriptive Statistics for Job Function I: Frame the School Goals ...................114
Table 10: Descriptive Statistics for Job Function II: Communicate the School Goals ...115
Table 11: Descriptive Statistics for Job Function III: Supervise & Evaluate
Instruction ........................................................................................................................116
Table 12: Descriptive Statistics for Job Function IV: Coordinate the Curriculum..........117
Table 13: Descriptive Statistics for Job Function V: Monitor Student Progress .............118
Table 14: Descriptive Statistics for Job Function VI: Protect Instructional Time ...........118
Table 15: Descriptive Statistics for Job Function VII: Maintain High Visibility ............119
Table 16: Descriptive Statistics for Job Function VII: Provide Incentives for
Teachers ...........................................................................................................................120

xiii
Table 17: Descriptive Statistics for Job Function IX: Promote Professional
Development ....................................................................................................................121
Table 18: Descriptive Statistics for Job Function X: Provide Incentives for
Learning ...........................................................................................................................121
Table 19: Descriptive Statistics for the Principal Instructional Leadership Job
Functions ..........................................................................................................................122
Table 20: Agreement with Beliefs, Means and Standard Deviations for All
Principals..........................................................................................................................124
Table 21: PIMRS Job Function Found Significantly Different to Educational Level .....131
Table 22: Summary of Significant Post Hoc Analysis ....................................................169

xiv
LIST OF FIGURES
Page
Figure 1: Contingency Model of Principals‘ Pedagogical Beliefs...................................175

1
CHAPTER ONE: INTRODUCTION
This mixed methods descriptive and causal-comparative study analyzed effective
California public high school principals‘ leadership behaviors and beliefs, serving among
student populations of socioeconomically disadvantaged and English learners. In
particular, this study focused on principals‘ instructional leadership behaviors and their
beliefs toward good pedagogical practice, either a constructivist or instructivist
viewpoint. The first chapter of the dissertation presents the background of the study,
specifies the problem this study attempts to answer, and describes the professional
significance of the study. The conclusion of this chapter provides a brief overview of the
methodology and defines key terms.
Background of the Study
Three major transforming landmarks in public education have occurred in the past
three decades (Hoy & Miskel, 2008). The first landmark was the federal government‘s
bipartisan report by the National Commission for Excellence in Education (1983) called
A Nation at Risk, which identified the need for public schools to improve. The second
transformational event was the state level academic standards movement of the 1990s.
The third landmark was intertwined with the first two, namely the passage of the No
Child Left Behind Act (NCLB) of 2001, which increased school accountability.
A Nation at Risk, state academic standards, and NCLB have caused the role of
educational leaders, particularly the school site principal, to be refocused, adjusted, and
reinvented. Most of the transformational changes to the role of the principal have been
focused toward the technical core responsibility of the school. Hoy and Miskel (2008)

2
stated this technical core is the process of educational leaders focusing on the teaching
and learning of the school. This focus on teaching and learning has led to the
development of a popular leadership construct called instructional leadership. The
paramount focus of instructional leadership is to foster students‘ attainment of basic core
skills and knowledge (Day, Leithwood, & Sammons, 2008; Fuller, Loab, Arshan, Chen,
& Yi, 2007; Leithwood, Harris, & Hopkins, 2008). Principals, as instructional leaders,
are called to evaluate teachers on their effectiveness, establish professional growth
opportunities, evaluate the effectiveness of curriculum, and develop the academic culture
of the school. Thus, principals need to understand and articulate what is required to be
effective and successful in these responsibilities.
The eventual construct of instructional leadership derived from effective schools
research of the 1970s and 1980s. Effective schools research sought after commonalities
effective schools had with each other. From these commonalities, researchers developed
inferences, and therefore, developed the construct of instructional leadership and
emphasized its importance in the field of educational leadership (Hoy & Miskel, 2008).
The evolving role of the principal as an instructional leader has created further
inquiries into the precise effects of instructional leadership on student achievement, either
direct or indirect. Direct effects of educational leadership are defined as leaders‘
practices that can have effects on school outcomes, and these effects can be measured
apart from other related variables (Witziers, Bosker, & Kruger, 2003). Indirect effects of
educational leadership are defined as a leaders‘ contribution which is mediated by other
people, events, and organizational and cultural factors (Witziers et al.). Current empirical

3
research has revealed that school leadership is second only to classroom instruction
among all school-related factors that influence the learning of students (Leithwood et al.,
2008). Although research in instructional leadership has progressed in discovering its
effects on student achievement, current research is still not clear on instructional
leadership‘s direct or indirect effect of student achievement.
Current research concludes there is little if any significant correlation between
principals‘ direct instructional leadership and student achievement (Bartlett, 2008; Day,
Leithwood, & Sammons, 2008; Leithwood et al., 2008). Therefore, research has focused
on indirect instructional leadership practices (Waters, Marzano, & McNulty, 2003;
Witziers et al., 2003). According to Hallinger and Heck (1996), ―The fact that leadership
effects on school achievement appear to be indirect is neither cause for alarm or
dismay…achieving results through others is the essence of leadership‖ (p. 39).
Despite the inconclusive research of the direct effects of instructional leadership on
student achievement and the relatively burgeoning research on its indirect effects,
Leithwood, Louis, Anderson, and Wahlstrom (2004) stated that leaders‘ ability to
improve learning is not a new or controversial idea, but the questions which are less clear
today are ―How leadership matters, how important those effects are in promoting the
learning of children, and what [are] the essential ingredients of successful leadership?‖
(p. 3).
Waters et al. (2003), through an extensive meta-analysis, defined effective
educational leadership–in the sense of the ultimate goal being student achievement–
through several key characteristics. Many of these characteristics outlined in Waters et

4
al.‘s research have to do with the educational leader in a specific role as an instructional
leader: (a) allocates resources and provides curriculum development, (b) focuses on
instruction and assessment, (c) possesses knowledge of curricular methods, (d) is visibly
present, (e) provides effective communication, input, affirmation, and relationships with
staff, (f) serves a role as a change agent and optimizer, (g) monitors and evaluates
effectively, (h) possess flexibility and situational awareness, and (i) provides intellectual
stimulation for staff.
Leithwood et al. (2004) have also inferred, through a review of literature, that to
create academic achievement, an instructional leader must adopt the following goals:
create and sustain a competitive school, empower others to make significant decisions,
provide instructional guidance, and develop and implement strategic and school-
improvement plans. Current research has confirmed the findings of Leithwood et al.
(Blasé & Blasé, 1999; Crum & Sherman, 2008; Horst & Martin, 2007; Leithwood &
Jantzi, 2008; Marks & Printy, 2003; Wahlstrom & Louis, 2008).
Jenkins (2009) further suggested that instructional leaders go beyond their
traditional role of school managers and administrators and place large focus and time
developing knowledge and the implementation of curriculum, instruction, and
assessment. Jenkins added that effective instructional leaders are those who are resource
providers by providing instructional resources, being good communicators, and being
visibly present. Datnow and Castellano (2001) also stated that the principal has a major
influence on the direction of decision making towards reforming the school, which thus,
has created an increased focus on teaching and learning.

5
Although the construct of instructional leadership has been criticized as being
nothing more than a slogan, rather than a well-defined set of leadership practices,
Leithwood et al. (2004) found that the model of instructional leadership researched and
conceptualized by Hallinger (2000) has been the most empirically-sound in the field of
educational leadership. Hallinger‘s model of instructional leadership consists of three
dimensions: defining the school‘s mission, managing the instructional program, and
promoting a positive learning climate. These three instructional leadership dimensions
are further delineated into 10 functions of instructional leadership: framing the school‘s
goals, communicating the school‘s goals, supervising and evaluating instruction,
curricular coordination, monitoring student progress, protecting instructional time,
providing incentives for teachers, providing incentives for learning, promoting
professional development, and maintaining high visibility.
It can be rhetorically asked, if a principal as an instructional leader is to
successfully set the direction, vision, and goals of a school; develop teachers through
support, modeling, and supervision; and allocate resources, how is this to be
accomplished unless the principal possesses a strong understanding and theoretical base
of pedagogical practices in which the teachers are to employ? According to Jenkins
(2009), principals need to know different models of teaching and the theoretical reasons
for adopting a particular teaching model. Hill (2002), after a review of the literature on
instructional leadership, concurred with Jenkins. Hill stated,
Principals need a strong theoretical foundation of current knowledge about teaching
and learning, practical knowledge of the beliefs and understandings of staff in the

6
school, and applied knowledge of how to bring about development and change in
those beliefs and understandings. (p. 64)
As Tisdell and Taylor (1999) have said, ―One‘s educational philosophy is imbedded both
in what one believes about teaching and learning, and what one actually does in their
practice‖ (p. 6).
One would suspect the field of education, namely those in leadership, would base
their practices on what has been proven empirically to advance academic achievement
opposed to practices based on popular ideologies. Unfortunately, this has not been the
case (Carnine, 2000; Pajares, 1992; Slavin, 2005). Hirsch (2001a) concluded the field of
education is in the midst of an ―education war‖ so to speak. The war is over ideology,
which falls within two major camps, both claiming ―research‖ and moral superiority to
back their claims. The opposing sides of this ideological and pedagogical argument can
be generally classified in two common approaches (Carnine, 2000). The first approach is
called ―student-centered‖ constructivism with its foundation based on the belief that
students construct their own knowledge while teachers serve a role as facilitator. The
second approach is ―teacher-centered‖ instructivism with the basic premise that
intellectual knowledge is passed from teacher to student.
The essence of the education war is over desired student goals and outcomes. The
disagreement is between the primacy of the child versus the primacy of the subject
matter, spontaneous versus formal approaches to schooling, and between education
designed to transform the nation‘s cultural heritage versus preserving it (Olson, 1999;
Edmondson, 2006). Those who insist on teacher-centered instructivism do so based on

7
empirical grounds as to what actually works in accomplishing student achievement and
obtainment of knowledge (Becker & Gersten, 2001; Gersten & Keating, 1987; Izumi &
Coburn, 2001; Kim & Axelrod, 2005).
Student-centered constructivism generally places academic achievement
secondary or equal to other desired goals, which are intended to develop the ―whole
child.‖ Advocates of the whole child aims of public education desire to move past
subject-centered curriculum and address the moral, social, emotional, and aesthetic needs
of students (Noddings, 2005). Constructivist and whole child education is carried through
by adopting pedagogies and practices which fit within the prescribed ideology despite, at
times, a lack of empirical research supporting their claims of effectiveness, specifically in
areas of academic achievement (Hirsch, 2001b; Kozloff, 2005; Stone, 2002; Walberg,
2002; Alferink, 2007; Izumi & Coburn, 2001; Mayer, 2004; Kirschner, Sweller, & Clark,
2006). Tobias (2009) further observed that those who insist on student-centered
constructivism provide ―stimulating rhetoric for the constructivist position, but relatively
little research supporting it‖ (p. 346).
In regards to how constructivism effects instructional leadership, Henderson and
Slattery (2007) have suggested that those who adhere to a constructivist view in their
leadership practice focus on the need to ―negate the dehumanizing malpractice that
dominates our schools and classrooms…[by] ethical response…, acknowledg[ing] the
importance of education as empowering and furthering human development‖ (p. 2). This
―empowering‖ is to be accomplished through self-examination to produce greater social-
justice by raising teachers‘ consciousness about the origins of their pedagogies and by the

8
inquiry model, which will create ―future leaders who are wise, as opposed to simply
knowledgeable‖ (p. 2).
Leithwood (2008) characterized Henderson and Slattery‘s (2007) type of
educational leadership as ―next practices‖ opposed to ―best practices.‖ Henderson and
Slattery presupposed that by adhering to an applied ideology, leadership‘s influence will
produce desired results, which will include student achievement. Rather, Leithwood calls
for instructional leaders to foster systematic and empirically researched practices which
strive to follow and discover best practices through empirical means. Along this line of
reasoning, Carnine (2000) suggested that educational leaders and practitioners should
adopt the medical profession‘s ethic of primum non nocere or ―first, do no harm‖ as the
cardinal principle in the reform efforts of educational leaders.
Problem Statement
Therefore, the purpose of this study is to describe what instructional leadership
behaviors effective high school principals bear, what these principals‘ beliefs are in
regards to good pedagogy—either constructivist or instructivist in nature—and what
differences exist between these behaviors and beliefs and eight specific demographic
variables. Principals‘ instructional behaviors and beliefs were analyzed in the context of
the current NCLB accountability era, thus characterizing effective schools as those that
progress towards academic achievement for all students particularly those who have
traditionally underachieved, such as the socioeconomically disadvantaged and English
learner subgroups. It is not known how, or to what extent, the role and influence
principals‘ beliefs toward the two prominent pedagogical approaches of constructivism or

9
instructivism play in their effectiveness as educational leaders. Thus, this study set out to
empirically delineate what effective high school principals‘ instructional leadership
behaviors and beliefs of good pedagogical practice are in the high-stakes accountability
era.
Professional Significance of the Study
Instructional leadership and its direct or indirect effects on student achievement
has been a popular area of study by researchers in the field of educational leadership
(Leithwood, 2005). The accountability requirements of NCLB have placed significant
pressures upon public high school leadership, from the state level down to the school site
principal. Thus, these pressures have caused further interest in instructional leadership
and its impact on student achievement (Timar, 2003).
Current research has extensively looked at what effective schools do in regards to
leadership practices and what pedagogical or curricular instructional practices are
fostered and applied in such schools by teachers (Buehl & Fives, 2009; Levine, 1991;
Murphy, Delli & Edwards, 2004). According to Harris, Cavanagh, Reynolds, and
Giddings (2004), contemporary views of educational leadership are increasingly focused
on two aspects of the role of school principals: the effective qualities of school leaders
and the attention given to pedagogy within the school. Harris et al. further stated that
effective leadership of teacher instruction and student learning is contingent on the
philosophical orientation of the principal.
Therefore, this mixed methods descriptive and causal-comparative study analyzed
an area of instructional leadership which has been widely neglected, namely the beliefs of

10
good pedagogical practice of effective principals and their instructional leadership
behaviors. This study also gives current empirical evidence toward effective schools
research, particularly in what principals practice and believe in dealing with the mandates
of the NCLB accountability era mandates to have all students learn, especially students
from the traditionally poor performing subgroups of socioeconomic disadvantaged and
English learners.
Further significance is provided in this study by delineating the difference in
principals‘ instructional leadership practices and pedagogical beliefs by several
demographic variables which have shown to effect leadership outcomes, such as the
principals‘ gender, ethnicity, highest educational level obtained, years as an
administrator, years as a principal, years as a classroom teacher, subject taught as a
classroom teacher, and the amount of instructional leadership delegated.
Research Questions and Null Hypotheses
The general research question this study attempts to answer is, ―What are
effective California high school principals‘ self-reported instructional leadership
behaviors and pedagogical beliefs (constructivist or instuctivist) in the accountability era
and what are the differences in these behaviors and beliefs in regards to eight specific
variables?‖
In particular,
1RQ What are effective high school principals‘ perceptions of their own
instructional leadership behaviors in the following 10 dimensions as
measured by the Principal Instructional Management Rating Scale:

11
framing the school‘s goals, communicating the school‘s goals,
coordinating the curriculum, supervising and evaluating instruction,
monitoring student progress, protecting instructional time, providing
incentives for teachers, providing incentives for learning, promoting
professional development, and maintaining high visibility?
2RQ What are effective high school principals‘ beliefs of good pedagogical
practice with a preference of either an instructivist or constructivist
dimension as measured on the Principal Beliefs Survey?
3RQ Are there significant differences in high school principals‘ perceptions of
their own instructional leadership behaviors as measured by the 10
Principal Instructional Management Rating Scale dimensions based on the
principals‘ gender?
0H 3.1 through 3.10 There are no statistically significant differences in
effective high school principals‘ perceptions of their own
instructional leadership behaviors as measured by the 10 Principal
Instructional Management Rating Scale dimensions based on the
principals‘ gender.
4RQ Are there significant differences in high school principals‘ perceptions of
their own instructional leadership behaviors as measured by the 10
Principal Instructional Management Rating Scale dimensions based on the
principals‘ ethnicity?

12
0H 4.1 through 4.10 There are no statistically significant differences in
effective high school principals‘ perceptions of their own
instructional leadership behaviors, as measured by the 10 Principal
Instructional Management Rating Scale dimensions based on the
principals‘ ethnicity.
5RQ Are there significant differences in high school principals‘ perceptions of
their own instructional leadership behaviors as measured by the 10
Principal Instructional Management Rating Scale dimensions based on the
principals‘ educational level?
0H 5.1 through 5.10 There are no statistically significant differences in
effective high school principals‘ perceptions of their own
instructional leadership behaviors as measured by the 10 Principal
Instructional Management Rating Scale dimensions based on the
principals‘ educational level.
6RQ Are there significant differences in high school principals‘ perceptions of
their own instructional leadership behaviors as measured by the 10
Principal Instructional Management Rating Scale dimensions based on the
principals‘ overall number of years as an administrator?
0H 6.1 through 6.10 There are no statistically significant differences in
effective high school principals‘ perceptions of their own
instructional leadership behaviors as measured by the 10 Principal

13
Instructional Management Rating Scale dimensions based on the
principals‘ overall number of years as an administrator.
7RQ Are there significant differences in high school principals‘ perceptions of
their own instructional leadership behaviors as measured by the 10
Principal Instructional Management Rating Scale dimensions based on the
principals‘ number of years as principal at their current location?
0H 7.1 through 7.10 There are no statistically significant differences in
effective high school principals‘ perceptions of their own
instructional leadership behaviors as measured by the 10 Principal
Instructional Management Rating Scale dimensions based on the
principals‘ number of years as principal at their current location.
8RQ Are there significant differences in high school principals‘ perceptions of
their own instructional leadership behaviors as measured by the 10
Principal Instructional Management Rating Scale dimensions based on the
principals‘ number of years as a classroom teacher?
0H 8.1 through 8.10 There are no statistically significant differences in
effective high school principals‘ perceptions of their own
instructional leadership behaviors, as measured by the 10 Principal
Instructional Management Rating Scale dimensions based on the
principals‘ number of years as a classroom teacher.
9RQ Are there significant differences in high school principals‘ perceptions of
their own instructional leadership behaviors as measured by the 10

14
Principal Instructional Management Rating Scale dimensions based on the
principals‘ subject taught as a teacher?
0H 9.1 through 9.10 There are no statistically significant differences in
effective high school principals‘ perceptions of their own
instructional leadership behaviors, as measured by the 10 Principal
Instructional Management Rating Scale dimensions based on the
principals‘ subject taught as a teacher.
10RQ Are there significant differences in high school principals‘ perceptions of
their own instructional leadership behaviors as measured by the 10
Principal Instructional Management Rating Scale dimensions based on the
principals‘ extent of instructional leadership delegated?
0H 10.1 through 10.10 There are no statistically significant differences in
effective high school principals‘ perceptions of their own
instructional leadership behaviors, as measured by the 10 Principal
Instructional Management Rating Scale dimensions based on the
principals‘ extent of instructional leadership delegated.
11RQ Are there significant differences in high school principals‘ beliefs of good
pedagogical practice as measured by the 14 beliefs presented in the
Principal Beliefs Survey based on the principals‘ gender?
0H 11.1 through 11.14 There are no statistically significant differences in
effective high school principals‘ beliefs of good pedagogical

15
practice as measured by the 14 beliefs presented in the Principal
Beliefs Survey based on the principals‘ gender.
12RQ Are there significant differences in high school principals‘ beliefs of good
pedagogical practice as measured by the 14 beliefs presented in the
Principal Beliefs Survey based on the principals‘ ethnicity?
0H 12.1 through 12.14 There are no statistically significant differences in
effective high school principals‘ beliefs of good pedagogical
practice as measured by the 14 beliefs presented in the Principal
Beliefs Survey based on the principals‘ ethnicity.
13RQ Are there significant differences in high school principals‘ beliefs of good
pedagogical practice as measured by the 14 beliefs presented in the
Principal Beliefs Survey based on the principals‘ educational level?
0H 13.1 through 13.14 There are no statistically significant differences in
effective high school principals‘ beliefs of good pedagogical
practice as measured by the 14 beliefs presented in the Principal
Beliefs Survey based on the principals‘ educational level.
14RQ Are there significant differences in high school principals‘ beliefs of good
pedagogical practice as measured by the 14 beliefs presented in the
Principal Beliefs Survey based on the principals‘ overall years as an
administrator?
0H 14.1 through 14.14 There are no statistically significant differences in
effective high school principals‘ beliefs of good pedagogical

16
practice as measured by the 14 beliefs presented in the Principal
Beliefs Survey based on the principals‘ overall years as an
administrator.
15RQ Are there significant differences in high school principals‘ beliefs of good
pedagogical practice as measured by the 14 beliefs presented in the
Principal Beliefs Survey based on the principals‘ number of years as
principal at their current location?
0H 15.1 through 15.14 There are no statistically significant differences in
effective high school principals‘ beliefs of good pedagogical
practice as measured by the 14 beliefs presented in the Principal
Beliefs Survey based on the principals‘ number of years as
principal at their current location.
16RQ Are there significant differences in high school principals‘ beliefs of good
pedagogical practice as measured by the 14 beliefs presented in the
Principal Beliefs Survey based on the principals‘ number of years as a
classroom teacher?
0H 16.1 through 16.14 There are no statistically significant differences in
effective high school principals‘ beliefs of good pedagogical
practice as measured by the 14 beliefs presented in the Principal
Beliefs Survey based on the principals‘ number of years as a
classroom teacher.
17
17RQ Are there significant differences in high school principals‘ beliefs of good
pedagogical practice as measured by the 14 beliefs presented in the
Principal Beliefs Survey based on the principals‘ subject taught as a
teacher?
0H 17.1 through 17.14 There are no statistically significant differences in
effective high school principals‘ beliefs of good pedagogical
practice as measured by the 14 beliefs presented in the Principal
Beliefs Survey based on the principals‘ subject taught as a teacher.
18RQ Are there significant differences in high school principals‘ beliefs of good
pedagogical practice as measured by the 14 beliefs presented in the
Principal Beliefs Survey based on the principals‘ extent of instructional
leadership delegated?
0H 18.1 through 18.14 There are no statistically significant differences in
effective high school principals‘ beliefs of good pedagogical
practice as measured by the 14 beliefs presented in the Principal
Beliefs Survey based on the principals‘ extent of instructional
leadership delegated.
Overview of the Methodology
The intention of this overview of methodology is to provide a general explanation
of methods employed in this study. A detailed explanation of the methodology is
provided in chapter three. This mixed methods descriptive and causal-comparative study
is based on descriptive and inferential statistical analysis of effective California high

18
school principals‘ responses on one Likert-type survey and another survey on a bipolar
adjective scale along with eight specific demographic variables. The study design is
causal-comparative in nature since the study attempted to describe and then determine the
cause or reason for a preexisting condition (Ary, Jacobs, Razavieh, & Sorensen, 2006). In
the case of this study, the preexisting condition is effective California high school
principals of schools serving significant student populations of socioeconomically
disadvantaged and English learner student populations per eight specific demographic
variables.
The first survey is called the Principal Instructional Management Rating Scale
(PIMRS), comprised of 50 items, which refer to specific principal instructional leadership
behaviors identified by effective schools research within the dimensions of defining the
mission of the school, managing the instructional program, and promoting a positive
learning climate (Hallinger & Murphy, 1985). The PIMRS is divided into ten subscales,
each containing five questions measuring a different leadership function within each
subscale. The PIMRS ratings are intended to measure perceptions of leadership activity,
not the quality of instructional leadership (Hallinger & Murphy, 1987). Appendix G
contains a copy of the PIMRS instrument. Permission to use the PIMRS was granted by
its creator, Dr. Philip Hallinger (Appendix B).
The second survey is called the Principal Beliefs Survey (PBS) containing 14
items which assess, via a forced choice continuum, a principal‘s preference toward one of
two pedagogical beliefs (Appendix G). The preferences are divided as either an
instructivist approach (more explicit, teacher-centered instruction) or a constructivist

19
approach (less explicit, student-centered instruction). Dr. Vicki Snider of the University
of Wisconsin-Eau Claire was the creator of the PBS and provided permission for its use
in this study (Appendix C). The name of the PBS has been changed from its original
name, Teacher Beliefs Survey, to signify the new intended subjects of the survey in this
study.
The population of this study comprised of principals of effective California high
schools. Ninety public high schools met the established criteria of this study. Effective
high schools were defined as those schools in the state of California who have reached or
exceeded their state Academic Performance Index (API) growth targets for the school
years of 2007-2008 and 2008-2009. This researcher further delineated the populations‘
high schools as those who had a numerically significant population of socioeconomically
disadvantaged and English learners who were counted as a subgroup on the API.
Therefore, besides the requirement of meeting or exceeding their overall API growth
targets, high schools must also have met their two API subgroups of socioeconomic
disadvantaged students and English learners growth targets to be considered an effective
high school for this study.
The population was further limited to principals who have served in their current
captivity for the last three consecutive years. The criteria of a minimum of three years
was to control the possible variable of a recent change of leadership, since the assumption
is made that the school‘s effectiveness was due in part to the leadership practices of the
current principal. Nineteen of the 90 principals did not meet the minimum requirement of

20
three years of consecutive service. Therefore, the total population of this study was
established at 71.
A return rate of 58% was achieved. Out of the returned questionnaires, three
principals stated their declination to participate in their response and two questionnaire
packets returned were not usable due to incompleteness or confusion in completing the
surveys. Therefore, N =36 (51%) complete and usable questionnaire data sets were
obtained, comprising this study‘s volunteer sample.
The data gathered from the two surveys, along with the demographic questions,
were then analyzed through descriptive and inferential statistical analysis. The analysis
methods, specific subject selection, and procedures are presented in detail in chapter
three.
Definition of Terms
Academic Performance Index (API): The academic performance measurement
system the state of California uses to rank individual public schools, which was created
by the passing of the Public Schools Accountability Act in 1999. The API score range is
200-1000 with the overall target of having all schools reach the 800 level. The API is
calculated for each student and by subgroups such as race, socioeconomic status,
disabilities, and English learner status. Each year schools are required to meet API
growth targets or face sanctions if goals are not met. The API is used to determine if
Adequate Yearly Progress (AYP) is made as required by the No Child Left Behind Act.
Adequate Yearly Progress (AYP): A accountability system mandated by the No
Child Left Behind Act of 2001, which requires each state to ensure that all schools,

21
districts, and states make Adequate Yearly Progress. Meeting AYP goals are determined
by meeting or exceeding each year‘s goals of established targets based on specific criteria
unique to each state.
Accountability Era: The movement to hold states, districts, and schools accountable
for the academic achievement of students beginning in the 1990s to the present. Based on
fears that the present and future students of the United States are not remaining
competitive in the world, the accountability era has lead to reform movements fostering
academic standards and research-based instructional practices.
Constructivism: A view of learning which states that learners develop their own
understanding of the way the world works rather than having it delivered to them by
others (most commonly teachers) in a pre-organized form (Eggen & Kauchak, 2001).
Pedagogically, constructivism in practice supports ―student-centered,‖ discovery,
problem-based, inquiry-based, experiential, collaborative, minimally guided teaching.
Contingency model of leadership: A model of leadership which states that a
leader‘s behavior which is effective is contingent on the traits and skills of the leader and
the characteristics of the situation (Hoy & Miskel, 2008).
Direct instruction: (See instructivism).
Distributive leadership: Leadership practices which ―rely on multiple sources of
leadership across the organization to guide and complete numerous tasks that vary in size,
complexity, and scope‖ (Hoy & Miskel, 2008, p. 439).
Effective high school principals: This study defines effective high school principals
as those principals who serve in high schools with a significant student population of

22
socioeconomically disadvantaged and English learners in the state of California who have
reached or exceeded their state Academic Performance Index (API) growth targets for
back to back school years of 2007-2008 and 2008-2009. In addition to meeting or
exceeding their overall API targets, the two API subgroups of socioeconomic
disadvantaged students and English learners must also have been met or exceeded.
Effective schools research: Research in education which analyzes unique
characteristics and processes schools have in common where all students are
academically successful regardless of sociological variables (Andrews & Morefield,
1991).
Instructivism: Either a formal or informal non-constructivist, ―teacher-centered,‖
direct or explicit instruction, traditional/classical model of teaching, backed by research,
which uses teacher explanation and modeling combined with student practice and
feedback to foster the acquisition of concepts, skills, and knowledge (Eggen & Kauchak,
2001).
Instructional leadership: Educational leadership which focuses on the technical
core responsibilities of schools, namely teaching and learning, by defining the school‘s
mission, managing the instructional program, and promoting a positive school learning
climate (Hoy & Miskel, 2008).
Integrated leadership: The combining of transformational leadership dimensions
and instructional leadership actions into one model of educational leadership (Marks &
Printy, 2003).
23
Leadership content knowledge: A leadership construct, which is ―knowledge of
subjects and how students learn them that is used by administrators when they function as
instructional leaders‖ (Stein & Nelson, 2003, p. 445).
No Child Left Behind Act (NCLB): A bipartisan bill passed by Congress and signed
into law in 2001 which enacted a federal accountability system based on standards-based
education reform. NCLB requires states that receive federal education funding to develop
standards and assessments of those standards (U.S. Department of Education, 2004).
Pedagogic leadership: A theory which suggests educational leaders must have an
understanding and working knowledge of research-based curriculum and instruction,
instructional practices, organization of schools for greater school learning, and supplying
teachers with opportunities for growth and development (Bottoms, 2003).
Student-centered instruction: See constructivism.
Teacher-centered instruction: See instructivism.
Transformational leadership: A leadership model which seeks to be proactive, raise
awareness of collective interests, and achieve high achievement outcomes by idealized
influence, inspirational motivation, intellectual stimulation, and individualized
consideration (Hoy & Miskel, 2008).
Organization of the Dissertation
In chapter one, the background of the study, the problem statement, the
professional significance of the study, an overview of the methodology, and definitions of
key terms have been presented. Chapter two provides a review of literature and related
research pertaining to the study. Chapter three provides a detailed explanation of the

24
methodology used in the study. The results and analysis of the study are provided in
chapter four. A summary, the study‘s limitations, assumptions, and conclusions drawn
from the findings are included in chapter five along with a discussion and
recommendations for further study.

25
CHAPTER TWO: REVIEW OF RELATED LITERATURE
According to the federal 2001 No Child Left Behind Act (NCLB), all public school
students must test proficient or above by the 2013-2014 school year on statewide tests
(California Department of Education, 2009c). NCLB is the culmination of an
accountability movement that attempts to hold states, districts, and schools accountable
for all students‘ achievement. Progressing along simultaneously with the accountability
movement, researchers have studied what effective schools are doing to meet the
increasing pressures of this accountability. Ruebling, Stow, Kayona, and Clarke (2004)
suggested that leadership behavior and practices are the root problem when a school
organization is not successful in achieving its primary goals, such as effectively
implementing the curriculum required by the state and local policy makers and when the
quality of student learning is in question.
The accountability era has stimulated major reinventions and readjustments of the
role of the school site principal, causing most of the pressure to create academic
achievement to fall upon them. Thus, the accountability era has transformed the role of
principal to place greater emphasis on the core responsibility of schools—the teaching
and learning of students—with the principals‘ primary focus placed on their role as an
instructional leader. The role of the principal as an instructional leader must now focus on
actual systematic results and student academic achievement.
The Accountability Era
The Elementary and Secondary Education Act (ESEA) of 1965 was federal
education policy based on the principle of equality in distribution of federal funds with

26
few stipulations or accountability measures of student achievement or progress (DeBray-
Pelot & McGuinn, 2009). Between 1965 and 1994, the national politics of education
evolved into a struggle between liberal groups, desiring federal spending and program
expansion, and conservative groups, who were philosophically opposed to any role of the
federal government in education (DeBray-Pelot & McGuinn).
With publication of a pivotal report called A Nation at Risk in 1983 (National
Commission of Excellence in Education), the equality in spending (with little
accountability) and the policy of limited federal intervention in schools began to be
challenged. This report placed focus on national concerns about the level and quality of
student achievement, particularly in the subjects of math and science, and its impact on
the future productivity and competitiveness of the United States in the global economy.
The trepidation that the United States was losing its global intellectual and
innovative competitiveness resulted in pressure from policy makers, high-level business
groups, government, and civic leaders for the adoption of national goals and standards
(Timar, 2003). These reforms came to be known as the accountability movement, which
contained three principle components: ―1) a primary emphasis on measured student
performance as the basis for school accountability; 2) the creation of relatively complex
systems of standards by which data on student performance are compared by school and
by locality; and 3) the creation of systems of reward and penalties and intervention
strategies to introduce incentives for performance‖ (Elmore, Abelmann, & Fuhrman,
1996, p. 65).

27
A Nation at Risk ignited an explosion of first wave state-level reforms based on
the recommendations of the report, such as reforming graduation requirements, extending
the school day and year, new career path options for teaching, high-school graduation
exams, raising teacher pay, reducing class size, decentralizing and/or centralizing the
management of districts, targeting resources to students in poverty, and ending social
promotion, to name a few (Hoy & Miskel, 2008; Walberg & Bast, 2003).
The desire to correct what was seen as public schools‘ rising tide of low
expectations gave way to some nostalgic inconsistencies in public perceptions. Evers
(2001) suggested that many Americans believe public school systems performed well in
the 1950s through the 1960s and then declined in subsequent decades. What is often
forgotten is that the 1950s and the 1960s experienced some of the most academically
weak fads such as ―life adjustment,‖ which had curriculum and courses like, ―How to Get
Along on a Date.‖ Another failed fad of this time was the progressive ―open-classrooms‖
experiment which allowed children to move about the classroom with relative freedom,
where there was little distinction between work and play, and a decreased emphasis on
didactic teaching.
Reforms, based on the recommendations of A Nation at Risk, were pivotal in the
reduction of these types of curricula and models. With the decrease in academically weak
fads, an increase in what came to be known as the minimum competency movement
became widely popular with the public (Loveless, 2001). The call by A Nation at Risk to
have minimum standards, as the report advised, could be met through gaining an
academic skill independent of the specific curricular content though which the skill is

28
taught (Hirsch, 2009). Contemporary cognitive science refutes this assessment and
suggests that only through domain-specific knowledge and practice, successful
comprehension and critical thinking can be developed (Hirsch).
Glatthorn and Jailall (2009) further criticized the reforms fostered by A Nation at
Risk on the premise that many were established by state officials, who are far removed
from local schools and free from the burden of accountability. With the lack of
accountability, these state level reforms were typically random, fragmented, and
contradictory. Walberg and Bast (2003) suggested that the results of this first wave of
reforms have been disappointing in the fact that test scores, which A Nation at Risk
warned about, remained poor after initial efforts. Nevertheless, there is a general
consensus on the value of A Nation at Risk, as it ushered in the accountability movement
and increased pressure to create and implement accountability systems at the federal and
state levels. These federal and state level accountability systems have been generally
bipartisan and popular with the public at large.
Through the mentioned pressures of the accountability movement, a second wave
of reforms was developed, including such efforts as the creation of national goals and
academic standards. This second wave of reforms was officially brought forth through
legislation in 1994 called The Goals 2000: Educate America Act and the Improving
America's Schools Act (reauthorization of ESEA of 1965), which set goals for standards-
based and outcomes-based education reforms (DeBray-Pelot & McGuinn, 2009; Timar,
2003).

29
These initial accountability steps in 1994 were popularized by the fact that
American schools in general produced the worst achievement results at the third-highest
expenditures among economically advanced countries (Walberg, 2001). This low
achievement in the face of increasing costs fed into a bipartisan consensus in Congress in
favor of many of the provisions the accountability movement called for. The result of this
pressure was a reauthorization of the ESEA of 1965, called the No Child Left Behind Act
of 2001 (NCLB), signed into law by President George W. Bush. NCLB is based upon
four pillars of reform: (a) stronger accountability for results, (b) more freedom for states
and communities, (c) proven education methods, and (d) more choices for parents (U.S.
Department of Education, 2004). An important feature of NCLB accountability is the
shift in governance from a system of local political accountability to state administrative
accountability. This shift reorients public education from resources allocated toward
results produced as a way of holding schools accountable for the academic achievement
of students (Cohen, 1996; Timar, 2003).
NCLB further mandates that statewide testing programs produce results by
subgroups based on ethnicity, special education classification, English language learners,
and the socioeconomically disadvantaged at each school site. Schools who fail to meet
adequate yearly progress (AYP) targets for two consecutive years or more would face
sanctions and possible school choice options for parents. NCLB calls for curricular
content to be standardized, for teachers to use best practices based on scientifically and
empirically researched methods, and for students to demonstrate 100 percent proficiency
30
in basic skills of core subjects by the 2013-2014 school year (California Department of
Education, 2009c; Schoen & Fusarelli, 2008).
In 1999, the state of California, on the cutting edge of the accountability
movement, established the Public Schools Accountability Act (PSSA). The goal of the
PSSA was to assure that each student received a high quality education consistent with
state-wide content and performance standards with a meaningful assessment system and
reporting program requirement (California State Legislature, 1999). The PSSA contains
three main provisions. The first provision is the production of a single-number score for
each school, its Academic Performance Index (API), which is determined by student
scores on statewide assessments. The second provision awards schools and districts for
meeting or exceeding API growth targets. The third provision establishes intervention
programs for schools who fail to meet their growth targets (Timar, 2003). Upon the
passage of NCLB, California easily conformed to the new federal requirements since it
already passed the PSSA a few years previously.
NCLB and state accountability measures intended to comply with NCLB have
caused educational leaders, particularly principals, unparalleled pressures to increase
achievement for all students under their stewardship. Timar (2003) outlined just a few of
the issues principals face within this accountability era, particularly in the state of
California:
Over the past 5 years, schools have been flooded with new programs and
mandates. The state now bans social promotion and requires schools to provide
remedial instruction for students during the summer. Students must pass a high
31
school exit examination in order to receive a diploma. The State Board of
Education requires all students to take algebra in the eighth grade. These
requirements come on top of class size reductions, high-stakes accountability, and
increasing restrictions in funding. At the same time, the demographic context of
education is changing rapidly: the student population is becoming more diverse,
many students are not proficient in English, and some districts face acute teacher
and administration shortages. (p. 189)
With the pressures the accountability era brings to current school leadership, it
has become imperative that effective organizational systems, curriculum, pedagogy, and
practices are followed and adhere to the requirements of state and federal mandates. An
approach made common by researchers has been to empirically study what effective
schools are doing and if commonalities and specific generalities can be drawn regardless
of race, culture, or socioeconomics. These findings then, in turn, could be applied to all
schools in their reform efforts. This area of research, known as effective schools research,
has been popular since the late 1970s.
The federal commission that developed NCLB also established a definition of
highly effective principals (HEP) which links the quality of teachers to the quality of the
principal by classifying an effective principal as someone who can lead efforts to create
change, can create and sustain high student achievement, and has the skills required to
turn around a low-performing school (Glatthorn & Jailall, 2009). This description of an
HEP was derived from effective school research. Murphy (2005) further added that the
Interstate School Leadership Licensure Consortium (ISLLC), which established

32
comprehensive standards for educational leadership practices widely used in the licensure
and instruction of principals, was based on research of effective and productive school
systems.
Effective Schools Research
Effective schools research has developed into a major area of focus by identifying
successful traits, practices, and procedures employed in highly effective schools.
Edmonds (1979; 1982) among others (Brookover et al., 1979; Rutter et al., 1979)
popularized effective schools research in the attempt to move past earlier research which
suggested that genetics, socioeconomic status, and societal or racial background was an
accurate indicator of student success rather than the effort and effects of schools,
teachers, and educational leadership (Coleman et al., 1966; Jensen, 1969; Terman, 1916).
Edmonds (1979) reported that the differences in the performance of students were
associated with factors under the control of schools and that ―administrative behaviors,
policies, and practices in the schools appeared to have a significant impact on school
effectiveness‖ (p. 16). Andrews and Morefield (1991) further added that effective schools
researchers postulate that differences in the level of cognition upon entry into the school
system is due to a student‘s cognitive environment or the differences in the student‘s
cultural dimensions of cognition and the school system‘s expected cognitive outcomes.
Hence, schools have the ability to function as a mechanism to eliminate these differences
or deficiencies. Effective schools research has found specific conditions of what
educators have done collectively, opposed to what teachers do individually, to increase

33
achievement over time. These conditions are commonly referred to as the correlates of
schools as first identified by Edmonds (1979) research.
Effective schools research, conducted by Edmonds (1979), produced seven
correlates of effective schools: (a) safe and orderly environment, (b) climate of high
expectations, (c) instructional leadership, (d) clear and focused mission, (e) opportunity
to learn and student time on task, (f) frequent monitoring of student progress, and (g)
home-school relations (Lezotte, 1991).
Current literature supports the supposition that all children can produce an increase
in achievement levels including those subgroups of students who are from areas which
have traditionally high levels of failure (Popp, 2004). Popp‘s research is representative of
this, which shows that over 4,500 high-poverty and high-minority schools have reading
and/or math scores in the top third of all schools in their respective states, according to
the data collected in the American Institutes for Research database.
Despite the evidence of effective schools research, it is not without criticism.
Thomas and Bainbridge (2001) suggested five fallacies of effective schools research. The
evidence presented by Thomas and Bainbridge is largely based on misconceptions and
misapplications developed by education practitioners, consumers, and promoters of
effective schools research.
The first fallacy is the idea that all children can learn. The fallacy lies in the belief
that all children can learn the same curriculum at the same time and the same level
opposed to the belief that all children can learn basic curriculum at some level if
sufficient resources are provided. The second fallacy discussed by Thomas and

34
Bainbridge (2001) is that of the principal as an instructional leader. Thomas and
Bainbridge argued that instructional effectiveness is the responsibility of teachers, and
principals are to support instruction and best practices. The third fallacy is setting
standards by exceptions. Thomas and Bainbridge suggested that a common practice by
effective schools promoters is the notion that exceptional situations of success can be
replicated by all children in all situations instead of the reality that those exceptions occur
under special circumstances that may be difficult to replicated unless proper resources are
available. Uniform academic standards for all children is the fourth fallacy since it is
common knowledge, as Thomas and Bainbridge suggested, that children develop at
different paces and a uniform criterion is ineffective. The last fallacy is the concept of
teachers needing to work harder rather than smarter by following whatever fad is forced
upon them because of their apparent lack of ability to innovate and adjust without top
down leadership practices.
The issues discussed by Thomas and Bainbridge (2001) regarding the misuse or
misapplication of effective schools research does not negate the fact that much of the
fallacies run contrary to what has been discovered through empirical means by effective
schools research. Research in most scientific-based fields, which uses the scientific
method, could be misinterpreted, misapplied, or misconstrued by practitioners or
promoters. Nevertheless, this does not negate the empirical findings when analyzed
correctly. Since the 1970s, effective schools research has matured, and additional insights
have been gained. Current research has found additional commonalities along with the

35
substantiation of past effective schools research, particularly, Edmond‘s seven correlates
of effective schools.
In a review of research and practice of effective schools, Levine (1991) found nine
systematic efforts which effective schools, or those who are involved in significant
improvement projects, performed: (a) there is substantial staff development, (b) priority
is placed on improvement of instruction, (c) leadership avoids getting bogged down in
elaborate schemes or staff-wide training on detailed instructional techniques, (d)
improvement goals are sharply focused to avoid overloading teachers and schools, (e)
significant technical assistance is provided, (f) school programs are data-driven, (g)
leadership avoids rigidity and reliance on bureaucratic processes, (h) the school uses
materials, methods, and approaches which have been proven, and (i) success is based on
―direct autonomy.‖
Current effective school research has discovered many important commonalities in
regards to educational leadership and curriculum practices. Oberman, Arbeit, Praglin, and
Goldstein (2005) discovered, upon researching high-achieving schools challenged with
high poverty levels, high number of English learners, and fewer resources, three key
factors to their success: (a) the use of consistent curricula coupled with frequent
diagnostic tests, (b) the adoption of best teaching practices, and (c) the investment in
teacher improvement. Upon an effective schools review of research, Perez and Socias
(2008) determined that high-performing schools had five common characteristics: (a)
strong instructional leadership, (b) frequent monitoring of student progress, (c) shared

36
goals and professional community, (d) parental involvement, and (e) a positive and
academically focused school climate.
Williams et al. (2005) conducted a large effective schools research project under
the direction of EdSource, Stanford University, University of California, Berkeley, and
the American Institutes for Research, which collected data from over 5,500 teachers and
257 principals. Williams et al.‘s research focused on California elementary schools
serving similar student populations and discovered the following results:
1. Prioritizing Student Achievement. Schools who set high expectations for
students had well defined plans for instructional improvement, placed high
priority on meeting the state API goals and federal AYP goals, and set
measurable goals for exceeding the mandates had exceeded the growth targets
on the API.
2. Implementing a Coherent, Standards-based Curriculum and Instructional
Program. Schools who were more likely to be high-achieving schools had the
following in common: school wide instructional consistency within grades,
curricular alignment from grade-to-grade, classroom instruction guided by state
standards, curriculum materials in math and language arts aligned to the state
standards, addressed the needs of English language learners, and evaluation of
the principal based on the extent the instruction is aligned with the district
curriculum were more likely to be high-achieving schools.
3. Using Assessment Data to Improve Student Achievement and Instruction.
Effective-schools research has found a strong correlation with higher API

37
scores schools and/or districts that use extensive assessment data to: improve
instruction and student learning, develop strategies to follow up on the progress
of selected students, and to evaluate principals based on student achievement.
4. Ensuring Availability of Instructional Resources. Schools which have teachers
with at least five years of teaching experience and principals‘ number of years
of experience have been found to correlate with high student achievement.
Another factor which also has been found to correlate with student achievement
is schools which have principals who provide up-to-date instructional materials
along with supplementary instruction for struggling students.
In addition to the four specific findings, Williams et al. (2005) found the principal
played a key role in the success of schools. In particular, principal leadership is at the
core of accountability-driven reform by the focus being placed on the effective
management of the school improvement process with principals acting as the managers of
school improvement efforts. Ellis et al. (2007) performed a similar large-scale study,
which took place in urban areas within Massachusetts, and found near identical results to
those of Williams et al. (2005).
Ellis et al. (2007) found nine specific commonalities among high performing
schools: (a) a balanced emphasis on leadership and staffing, school culture, and
curriculum and instruction; (b) leaders actively pursued new strategies and resources they
believed would lead to improvement; (c) leaders hired and supported well-qualified and
highly-motivated staff; (d) positive staff cultures were displayed; (e) positive student
culture and a safe and nurturing environment was fostered; (f) intense focus was placed

38
on English and math with curriculum aligned to the state standards; (g) intense focus on
intervention and remediation of students with academic deficits; (h) assessment data was
used to drive instruction; and (i) focus was placed on implementation at the school and
classroom level.
McEwan (2009), through a synthesis of effective schools research—which included
research on effective instruction and instructional leadership, case studies of highly
effective schools, and personal interviews of teachers, principals, district administration,
and consultants in the highly effective districts and schools—developed ten traits
effective schools have mastered. The following are McEwan‘s findings: (a) strong
instructional leadership is displayed; (b) research-based instruction is delivered by highly
effective teachers; (c) clear academic focus is fostered which encompasses the vision,
mission, and goals of all stake holders; (d) relational trust or positive personal and
professional relationships are developed; (e) collaboration is achieved between
administrators, teachers, and students; (f) high expectations are applied; (g) all students
are provided the opportunity to learn; (h) standards-based curriculum is aligned with
instruction and assessment; (i) gains are achieved in individual growth of all students and
overall high achievement school wide; and (j) high levels of internal accountability are
implemented with demands for continuous improvement.
Effective schools research has become a central position of discourse taking place
in many countries around the world. Thirty years ago, the premise that schools made no
difference gave way to the current view, that schools affect students‘ development and
that there are observable regularities in schools that can add value to and improve schools

39
in general. This fact is a testament of the evidence for the widespread adoption of the
suppositions made in effective schools research (Teddlie & Reynolds, 2000).
The prevalent and reoccurring thread found in effective school research is the
importance of leadership, particularly instructional leadership. Andrews and Morefield
(1991) suggested a good school is an instructionally effective school which has unity of
purpose (shared vision), parent and community involvement in the school, and a culture
that better reflects the culture of its clientele.
After a review of empirical research from 1980 to 1995, Hallinger and Heck (1996)
said, ―Research on school effectiveness concluded that strong administrative leadership
was among those factors within the school that makes a difference in student learning‖
(p. 5). Therefore, to better understand effective schools, one must understand
instructional leadership. Crum and Sherman (2008) have suggested that outstanding
principals focus on the students and their learning.
Edmonds (as cited in McEwan, 2009) indicated, ―There may be schools out there
that have strong instructional leaders, but are not yet effective; however, we have never
yet found an effective school that did not have a strong instructional leader as the
principal‖ (p. 12). Andrews and Soder (1987) further added that schools led by principals
who were perceived by their teachers to be strong instructional leaders exhibited
significantly greater gains in achievement in reading and mathematics than did schools
led by average and weak instructional leaders. Few would argue against the effects
instructional leadership has on student achievement, but two questions have plagued
40
researchers: what is the actual usable and effective construct of instructional leadership,
and what is the relationship between instructional leadership and student achievement?
Instructional Leadership
From American colonial history to the early 20th
century, the principal of schools
served as the head teacher responsible for the technical core responsibilities of schools:
teaching and learning. The early 20th
century brought Taylorism and assembly line-like
scientific management, which transformed schools into larger and more specialized
systems to adapt to the growing economic needs of the nation. This transformation also
changed the role of the principal by separating its focus on teaching and learning to more
of a managerial role. Gains in behavioral psychology and progressive pedagogy ensured
that teachers could be effectively trained through a certification process. With
increasingly more powerful teachers‘ unions, administrative meddling in teaching and
learning was effectively refrained (Hill, 2002).
The 1960s and 1970s witnessed a transformation in the role of principal. The
mechanism which led to this transformation was federal funding, which created mandates
for principals to be responsible for the education of special populations, such as bilingual
and special education, and the Cold War‘s call for better mathematics and science
education (Hallinger, 1992). Beck and Murphy (1993) summed up the evolution of the
principal from the 1920s to the 1990s as thus: 1920s, values broker; 1930s, scientific
manager; by the 1960s, bureaucratic executive; the 1970s, humanistic facilitator; and the
1980s on, instructional leader. The problem of the traditional role of the principal, as

41
Murphy (1999) suggested, is that ―organizationally clueless teachers and educationally
uninformed administrators provided a poor foundation for school success‖ (p. 5).
As discussed in the literature above, the accountability movement and effective
schools research of the 1970s and 1980s called for principals to be engaged in leading the
school‘s instructional program and focusing staff attention on students‘ academic
outcomes. Researchers then elaborated on this supposition in their attempts to describe
what it means to exercise instructional leadership (Hallinger, 1992). Instructional
leadership‘s new orthodoxy asserted that principals need particular knowledge related to
the core function of schools, teaching and learning, based on the characteristics provided
by effective schools research. With this knowledge, leaders were expected to alter their
management behavior into one oriented toward instruction (Hill, 2002).
Knowing one should focus on instructional leadership is not the same as knowing
what instructional leadership is. Hence, a workable construct of instructional leadership
needed to be empirically established to move the theory into a practical form.
Instructional leadership at its foundation was initially defined as a critical focus of
attention by leaders on the behaviors of teachers as they engage in activities directly
affecting the academic growth of students (Leithwood, Jantzi, & Steinbach, 1999).
Early models of instructional leadership saw the principal as a heroic leader,
engaged in top-down management and bending the school community to his or her vision
(Camburn, Rowan, & Taylor, 2003). Instructional leadership of the 1980s was principal-
centered, often accompanied by images of gallant leaders single-handedly keeping the
school on track (Lashway, 2002).

42
In 1982, Persell, Cookson, and Lyons conducted an extensive literature review on
effective principals between 1970 and 1980 and presented their findings to the National
Institute of Education. Persell et al. found that effective principals are those who exhibit
instructional leadership practices such as a commitment to academic goals, academic
expectations, school climates that facilitate learning, time utilization, and principals‘
instructional leadership (defined as one who makes decisions on instructional strategies).
Andrews and Soder (1987) described effective instructional leaders as those who
performed at high levels in the following four areas:
1. Resource provider—principal directs stakeholders in achieving the school‘s
vision and goals and serves as a broker of resources such as materials,
information, or opportunities.
2. Instructional resource—principal sets expectations and is actively engaged in
the continued improvement of the instructional program, staff development, and
classroom circumstances which foster active learning.
3. Communicator—principals model commitment to the school goals, articulate a
school vision towards instructional goals, and sets and adheres to clear
performance standards for instruction and teacher behavior.
4. Visible presence—the principal is physically visible in all aspects of the school.
Duke (1987) further described instructional leaders as those who were effective in
the following areas: teacher supervision and evaluation, staff and teacher professional
development, instructional management and support, resource management, quality
control of the instructional program, coordination, and trouble shooting.

43
Snyder‘s (1983) version of instructional leadership focused on actions opposed to
behaviors or skills. Snyder suggested that effective instructional leaders plan school-wide
goals, develop an action plan, and achieve, assess, and evaluate effectively.
According to Ylimaki (2007), instructional leadership models of the 1980s were
criticized for being too directive and principal-centered. By the mid-1990s, attention
began to shift toward a new transformational model of leadership that focuses on
empowering others (Harris, Leithwood, Day, Sammons, & Hopkins, 2007; Leithwood &
Jantzi, 2005; Mangin, 2007). This shift in focus to transformational and distributive
leadership models of instructional leadership was not the only area of instructional
leadership expansion. Currently, research has begun to look at instructional leadership at
the district level by developing a construct and researching its effects on student
achievement (Rorrer, Skrla, & Scheurich, 2008).
MacNeill, Cavanagh, and Silcox (2003) have criticized the limitations of many of
the conceptual constructs of instructional leadership. Two areas they criticize are
instructional leadership‘s concern with principal leadership instead of distributive or
transformational leadership and its focus on the actions of teachers opposed to actual
student learning. These criticisms posed by MacNeill et al., among other aforementioned
criticisms, have been reconciled by instructional leadership‘s evolution into
encompassing transformational/distributive leadership models.
Hallinger (2003) stated that the models of transformational and instructional
leadership have the following in common: creating a shared sense of purpose in the
school; developing a climate of high expectations and a school culture focused on the

44
improvement of teaching and learning; shaping the reward structure of the school to
reflect the goals set for staff and students; organizing and providing a wide range of
activities aimed at providing intellectual stimulation and development for staff; having a
visible presence in the school; and modeling the values that are being fostered in the
school.
The conceptual differences between instructional and transformational leadership
are as follows: the target of change (i.e. first-order or second-order effects); the extent to
which the principal emphasizes a coordination and control strategy versus an
―empowerment‖ strategy; and the degree to which leadership is located in an individual
(i.e. instructional leader) or is shared (i.e. transformational) (Hallinger, 2003).
More recent constructs have blended the two transformational/distributive and
instructional leadership models. One such construct is known as integrated leadership,
which has shown to have a substantial influence on school performance measured by the
quality of its pedagogy and the achievement of its students (Marks & Printy, 2003).
Leithwood (2005) stated, ―At least a half dozen…leadership models appear repeatedly in
educational leadership literature…Nevertheless, two models currently vie for most of the
attention among practicing educators—instructional and transformational models‖ (p. 6).
Marks and Printy‘s integrated leadership model has been viewed as an effective way to
blend the two.
Marks and Printy‘s (2003) theoretical underpinnings of integrated leadership is that
although transformational and instructional leadership are analytically distinct, they
cohere in practice. The principal as a transformational leader works toward arousing

45
strong commitment from all in the organization to work toward the common goal of
school improvement. The principal as an instructional leader collaborates with the
organization‘s personnel to accomplish the core responsibility of the school, teaching and
learning. Therefore, integrated leadership cleaves to the transformational influence of the
principal and the shared leadership actions of the principal and the teachers.
This integration of contemporary instructional leadership with transformational
and distributive leadership models has been explicated through contingency approaches
to leadership (Hallinger, 2003; Hoy & Miskel, 2008). The contingency model suggests
first, the particular characteristics of the situation coalesce with the traits and skills of the
leader to produce leader behavior and effectiveness. Second, situational, environmental,
and organizational factors directly impact effectiveness (Hoy & Miskel). Thus, in one set
of circumstances, one type of leader is effective, but under another set of circumstances, a
different type of leader is effective.
Hallinger (2003) further added, ―The type of leadership that is suitable to a certain
stage of the journey may well become a limiting or even counter-productive force as the
school develops‖ (p. 345-346). As an explication, an academically struggling poor urban
school, which may initially need strong top-down instructional leadership, might need to
evolve into a bottom-up or transformational model once the school produces success. The
solution to appropriating the correct model of leadership in education would be to link the
type of leadership to the needs of the school context (Hallinger). Instructional leadership
has thus progressed and evolved from the notion of the principal as a heroic figure to a
more complex model focusing on the improvement of teaching and learning, distributive

46
and shared leadership, and transformational leadership, which is comprised of inspired
motivation, intellectual stimulation, and individualized consideration (Hoy & Miskel,
2008).
Although instructional leadership has evolved and has been readjusted, it still has
held its empirical ground. As evidence, a recent meta-analysis was conducted by
Robinson, Lloyd, and Rowe (2008) who found that the average effect of instructional
leadership on student outcomes was three to four times that of transformational
leadership. Therefore, the more principals focus their professional relationships, their
work, and their learning of the core business of teaching and learning, the greater their
influence on student outcomes have been.
As discussed above, initial efforts were made by researchers such as Andrews and
Soder (1987) and Duke (1987), among others, to establish a precise meaning and
construct of instructional leadership. Leithwood‘s (2005) review of research suggests that
Hallinger‘s (1983; 2008) and Hallinger‘s and Murphy‘s (1985) model provides the most
empirical evidence to date. Hallinger‘s leadership domains contain three categories of
behaviors with each encompassing 10 additional specific practices. Hallinger‘s (1983;
2008) leadership domains are (a) defining the school‘s mission, which includes framing
and then communicating the school‘s goals; (b) managing the instructional program,
which includes supervising and evaluating instruction, coordinating the curriculum, and
monitoring student progress; and (c) promoting a positive school learning climate, which
encompasses protecting instructional time, promoting professional development,

47
maintaining high visibility, providing incentives for teachers, and providing incentives
for learning.
Research conducted by Sheppard (1996) has answered the criticism of instructional
leadership‘s heroic view of principals and the required docility of stakeholders,
particularly in regards to Hallinger‘s (1983; 2008) leadership domains. Sheppard found
that Hallinger‘s leadership domains fostered transformational characteristics and was
affirmed in both elementary and high school settings as an accurate conceptualization of
instructional leadership.
Current research further formalizes Hallinger‘s (1983; 2008) leadership domains.
Cotton (2003) conducted an extensive qualitative narrative review of 81 empirical
research reports from 1980 to 2003 and identified 25 categories of principal behaviors
which positively affected student achievement. Another major research study conducted
by Waters, Marzano, and McNulty (2003) was a quantitative meta-analysis of 70 studies
involving 2,894 schools, 1.1 million students, and 14,000 teachers over a 30 year period.
Waters et al. found 21 specific leadership responsibilities which affect student
achievement. Haggard (2008) performed a comparative analysis of Hallinger‘s (1983;
2008) leadership domains with Cotton‘s (2003) 25 categories and Waters et al.‘s (2003)
21 leadership responsibilities. Haggard‘s findings indicate they align and validate each
other (See Table 1 for the relationships between the three domains of instructional
leadership).

48
Table 1
Hallinger's Domains with Corresponding Leadership Practices: A Summary

49
Principal Instructional Management Rating Scale
The refinement of the construct of instructional leadership by Hallinger‘s (1983;
2008) instructional leadership domains gave way to the construction of an instrument to
gage principals‘ instructional leadership behaviors. This instrument is called the Principal
Instructional Management Rating Scale (PIMRS) which is based on the three dimensions
and 10 functions outlined previously. Witziers et al. (2003) stated that these functions are,
in turn, translated into behaviors which comprise the items in the questionnaire. The
concept of instructional management refers to the principal‘s actions, which are intended
to drive others to perform tasks in such a way that the school goals are achieved,
specifically in terms of student achievement.
Other research findings have continued to substantiate the three dimensions of
Hallinger‘s (1983, 2008) leadership domains. Following are some examples of current
research per the three domains of defining the school mission, managing the instructional
program, and promoting a positive school learning climate. For example, Horst and
Martin (2007) found that principals in successful rural schools with high poverty largely
were successful by focusing on aspects from all three of Hallinger‘s dimensions,
specifically, integrity and courage, focus and vision, expectations and data evaluation,
resources and empowerment, role modeling, and collaboration.
Defining the school mission. Regarding defining the school mission, Leithwood et
al. (2004) found that the leadership practices involved in setting the school‘s direction
and mission account for the largest proportion of a leader‘s impact. Graczewski,
Knudson, and Holtzman (2009) also found a positive correlation with principals (as

50
instructional leaders) who create a coherent school-wide vision and engage in
instructional improvement with effective teacher professional development that is
coherent and focused on content and curriculum. DiPaola and Tschannen-Moran (2005)
found that principals generally buffer the school from the influences of the community at
large. DiPoala and Tschannen-Moran suggested that effective schools are those who
buffer and build bridges with the community to effectively define the school‘s goals and
mission.
Managing the instructional program. Stiggins and Duke (2008) provided an
excellent example of the importance of managing the instructional program. Stiggins and
Duke have concluded that a well prepared principal ensures that assessments are of high
quality and used effectively and that classroom assessments are the foundation of a truly
effective system in this era of accountability. Therefore, principals must be sufficiently
assessment literate to fulfill these growing responsibilities.
Promoting a positive school learning climate. The last of the three instructional
leadership dimensions is promoting a positive school learning climate. Blasé and Blasé
(1999) found that promoting effective professional development was the most influential
instructional leadership practice among elementary and secondary schools. Research
conducted by Graczewski, Knudson, and Holtzman (2009) found a connection between
principals‘ school-wide vision and engagement in instructional improvement and
effective teacher professional development. Silins and Murray-Harvey (1999) discovered
that the most successful schools were those with predominantly transformational

51
leadership practices which promoted positive teacher perceptions of school organizations
and of students‘ learning, attitudes, and school involvement.
In regards to collaboration and a positive working and school climate, Quint, Akey,
Rappaport, and Willner (2007) stated that ―a direct relationship was observed between
the role that principals played in professional development for teachers related to
academic rigor and clear expectations and higher implementations of these principles in
reading lessons‖ (p. 4). O‘Donnell and White (2005) concluded that teacher perceptions
of principal behaviors focused on improving school learning climate were identified as
predictors of student achievement. Last, Barnett and McCormick‘s (2004) research
produced results which showed that relationships existed between leadership and school
learning culture, and these relationships highlight the importance of individual principal-
teacher relationships in schools.
Instructional Leadership’s Effects on Student Achievement
After an extensive research project on leadership‘s effects on student achievement,
Leithwood et al. (2004) have concluded that the total direct and indirect effects of
leadership on student learning account for a quarter of total school effects. This makes
the leadership of a school second only to classroom instruction among all school-related
factors that influence what students learn. Waters et al.‘s (2003) extensive meta-analysis
of leadership‘s effects on student achievement came to the same conclusion.
Direct effects of educational leadership are defined as leaders‘ practices which can
affect school outcomes, and these effects can be measured apart from other related
variables (Witziers et al., 2003). Indirect effects of educational leadership are defined as a

52
leaders‘ contribution which is mediated by other people, events, and organizational and
cultural factors (Witziers et al.).
Hallinger and Heck (1998) developed a more precise classification of instructional
leadership‘s effects on student achievement. Hallinger and Heck developed three
classifications of principal effects on student and school outcomes:
1. Direct effects—where the principal‘s actions influence school outcomes.
2. Mediated effects—where principal actions affect outcomes indirectly through
other variables.
3. Reciprocal effects—where the principal affects teachers and teachers affect the
principal, and through these processes outcomes are affected. (p. 162-163)
Hallinger and Heck (1998) differentiated indirect effects of leadership on student
achievement as mediated effects and reciprocal effects. Reciprocal effects falls in line
with the contingency model of instructional leadership, and mediated effects are similar
to Witziers et al.‘s (2003) indirect effects classification.
Direct effects of leadership on student achievement. Research on direct effects
of leadership on student achievement is mixed. Bartlett (2008) conducted a direct effects
correlational study comparing the principal‘s instructional leadership practices to student
achievement. Bartlett found that there was no significant relationship between specific
instructional leadership practices and student achievement. On the other hand, Kaplan,
Owings, and Nunnery (2005) found that principal quality is linked statistically and
practically to student achievement.

53
A meta-analysis conducted by Witziers et al. (2003) on the direct effects of
instructional leadership on student achievement found a small positive effect which
confirms earlier findings on the limitations of the direct approach. Day, Leithwood, and
Sammons (2008) provided evidence that there are differences in direct effects among
elementary schools versus secondary schools, such as middle schools and high school.
Day et al. found that direct effects of leadership on student outcomes are more common
in elementary school settings than in secondary schools because of the more intimate
setting of most elementary schools opposed to secondary schools.
Although direct relationships typically account for a small proportion of the total
student achievement variability, they are of sufficient magnitude to be of interest and
additional investigation. Despite the need of additional research concerning direct effects
of principals, this has largely been deserted and the focus has been placed on the possible
indirect relationships principals have through their interactions with teachers and the
school environment (Nettles & Herrington, 2007).
Mediated and reciprocal effects of leadership on student achievement.
Andrews and Soder (1987) found that students‘ reading and math scores were
significantly greater in schools that had strong instructional leaders opposed to those who
had average or weak instructional leadership. More specifically, Smylie, Lazarus, and
Brownlee-Conyers (1996) concluded that teacher empowerment and staff collaboration
resulting in increased student achievement largely occurred when teachers were involved
in curriculum and instruction development.

54
Hallinger and Heck‘s (1998) analysis of 40 published journal articles, dissertation
studies, and papers presented at peer-reviewed conferences between 1980-1995 found
principals exercised a measurable, though indirect, effect on school effectiveness and
student achievement. The measurable indirect effect was specifically regarding the
principal‘s role in guiding the school‘s direction through vision, mission, and goals.
Leithwood et al. (2008) also found that school leaders improve teaching and learning
indirectly through their influence on staff motivation, commitment, and working
conditions.
Quinn (2002) confirmed an indirect effect of instructional leaderships‘ influence on
student achievement. Quinn found that instructional leadership dimensions—resource
provider, instructional resource, communicator, and visible presence—correlated highly
with actual teacher practices.
As previously noted, Waters et al. (2003) conducted a meta-analysis of nearly every
study which looked at relationships between leadership and student achievement since
the 1970s. Findings revealed significant relationships between many leadership practices
and student achievement. In particular, the top three leadership practices that correlated
with student achievement were situational awareness (the leader knows current and
potential problems), intellectual stimulation (the leader possesses knowledge of
pedagogical theories and practices and incorporates them into the school culture), and
input (teachers are involved in a distributive leadership model).
Leithwood and Mascall (2008) conducted research, including well over 2,500
teachers and 90 elementary and high schools, and discovered collective leadership

55
explained a significant proportion of the variation in student achievement across schools.
Specifically, they found leadership of higher-achieving schools influenced all school
members and other stakeholders to a significantly greater degree than that of lower-
achieving schools.
Not all the current research was conclusive on the indirect effects of leadership on
student achievement. Miller and Rowan (2006) found, through studying relationships
between contingency instructional leadership and growth in student achievement in
elementary and secondary schools, that the reciprocal effect was not a particularly
powerful determinant of student achievement at either of these levels of schooling.
Principals’ Beliefs & Philosophy of Teaching and Learning
A common assumption in defining leadership is that a leader exerts social
influence over others to structure activities a particular way within an organization. It is
also widely understood that one‘s beliefs motivate one to act. In the sense of leadership,
one‘s beliefs about causality, fairness, intelligence, consequences of actions, and ability
to control various situations dictates what, why, and how a leader‘s social influence is
realized on the members of the organization (Hoy & Miskel, 2008).
It needs to be remembered that the technical core function of schools is the
process of teaching and learning. Teaching and learning happens when experience
produces a stable change in a student‘s knowledge or behavior (Hoy & Miskel, 2008).
Instructional leadership is a form of educational leadership which focuses on this
technical core of teaching and learning. Research in instructional leadership has neglected
looking into the importance of instructional leaders‘ beliefs, understandings, and
56
philosophical views of this technical core and its impact on student outcomes. Nelson,
Stimpson, and Jordan (2007) suggested that ―to date little attention has been paid to the
subject matter knowledge and pedagogical beliefs of those leaders responsible for such
subject-related leadership tasks as setting a vision for the school…, recruiting and hiring
teachers, selecting curricula, [and] communication with stakeholders, etc.‖ (p. 40).
Principals‘ beliefs and value systems are attracting increased focused as an area of
importance in understanding how effective leadership is practiced. Combs, Miser, and
Whitaker (2006) said, ―People behave according to their belief systems. A leader‘s
authenticity therefore depends on the nature of his or her belief system as well as the
ability to share it meaningfully‖ (p. 170). Deal and Peterson (1999) added that the
principal‘s role is to express his or her values for their school at the organizational and
the individual teacher level to the point that those values will be accepted and utilized.
With the understanding that ―one‘s educational philosophy is imbedded both in
what one believes about teaching and learning, and what one actually does in their
practice‖ (Tisdell & Taylor, 1999, p. 6), it can be asseverated that principals‘ beliefs
directly affects the school‘s goals, mission, and vision. In turn, the principals‘ beliefs and
philosophical views indirectly affect teachers and their practices and thus, student
achievement.
Borba (2009) found that successful educational leaders are those who are first
excellent and effective teachers. Borba suggested one of the first steps in preparing to
become an effective principal with the skills necessary to create effective instructional
programs is becoming an excellent and effective teacher. MacNeill et al. (2003) further

57
emphasized that effective leadership must understand how students learn and have the
freedom of designing, implementing, and assessing the educational activities so that all
students‘ needs are met. MacNeill et al. (2003) proposed a new instructional leadership
construct called pedagogic leadership, with the following conceptual framework:
1. Commitment to a shared vision and sense of mission about student learning.
2. Application of expert knowledge about student learning and development.
3. The engagement and empowerment of teachers.
4. The creation and sharing of knowledge throughout the school.
5. Application of a re-culturing approach towards school improvement.
6. Emphasis on pedagogic rather than administrative functions by the principal.
Further, MacNeill et al. (2003) found principals with strong pedagogical
knowledge and capacity building skills were dynamic and successful in developing
places for teaching and learning versus schools whose principals lacked those qualities or
attempted to quickly acquire them, therefore making uneven progress. Research by
Ylimaki (2007) has confirmed the pedagogic leadership excogitation of MacNeill et al.
Sherman and Crum (2007) also found that principals who possessed common
beliefs about reading instruction and acted upon those beliefs, accelerated students‘
reading success in their schools. Further, these principals facilitated school-wide reading
practice and set the tone for teachers‘ instruction. The principals‘ priorities were
expressed in their daily actions.
According to pedagogic leadership, principals must understand and have a working
knowledge of research-based curriculum and instruction, a variety of instructional
58
practices, the ability to organize schools for greater student learning, and support for
teachers with opportunities for growth and development (Bottoms, 2003).
Harris, Reynolds, Cavanagh, and Giddings (2004) stated,
Professional values, attitudes and resultant behaviors of principals are a
manifestation of their educational philosophy. Putatively, this involves, knowledge
about pedagogy, willingness to improve the school pedagogy, and concern for
student educational outcomes are assumed to be a consequence of deeply held
beliefs about schooling and the learning of children. In turn, these beliefs are
reinforced and sustained through participation in the school‘s instructional
program. (para. 1)
Effective leadership of teacher and student learning, according to Harris et al.
(2004), is contingent on the philosophical orientation of the principal. The philosophical
orientation of the principal is developed through a typology of educational philosophies,
namely professional foci (leadership, teacher instruction, and student learning),
philosophical viewpoints (ontological, epistemological, and methodological views), and
educational philosophies (e.g. humanist, critical-humanist, and critical-emancipator).
Stein and Nelson (2003) also developed a new construct, along similar lines of
pedagogic leadership, called leadership content knowledge. Leadership content
knowledge is the knowledge of subjects and how students learn them, which is used by
administrators when they function as instructional leaders. Stein and Nelson further
added,
59
The construct of leadership content knowledge opens entirely new realms of
thought about leadership—connecting it directly to the core function of schooling,
learning and teaching—and raising the question whether generic studies of
leadership can really get at the heart of what it means to lead schools. Without
knowledge that connects subject matter, learning, and teaching to acts of
leadership, leadership floats disconnected from the very processes it is designed to
govern. (p. 446)
Hill (2002) emphasized a general design for improving learning outcome, which
contains nine critical elements and follows the ideas of pedagogical leadership and
content knowledge leadership. At its foundation are instructional leaders‘ ―beliefs and
understandings,‖ which are built upon a strong foundation of theoretical and practical
knowledge about teaching and learning. With principals‘ ―beliefs and understandings‖
being the foundation and beginning point in improving student learning outcomes, Hill
(2002) outlined nine elements which are directly affected by it: leadership and
coordination, standards and targets, monitoring and assessment, classroom teaching
strategies, professional learning teams, school and classroom organization, intervention
and special assistance, home, school, and community partnerships. Therefore, current
knowledge of teaching and learning is vital if principals are to develop a school culture
that encompasses high expectations for student achievement and in fostering confidence
in the ability of individual teachers and the school to actualize those expectations (Hill).
Hill‘s (2002) point is further made by Southworth (2002) who discussed the belief
and understanding requirement of effective leadership development:
Instructional leadership requires individuals to have high levels of knowledge and
understanding of curricula, pedagogy, student and adult learning. This observation
has implications for the nature of leadership programs and suggests that they

60
include such material; alongside whatever technical knowledge they provide about
management and leadership processes. (p. 87)
Hill (2002) further outlined the role, capabilities, and knowledge educational leaders need
to have regarding teaching and learning. It is noted that although the knowledge base
required for effective instructional leadership is extensive and overlaps with knowledge
expectations for teachers, it also covers additional areas not typically covered in
university courses used toward credentialing or postgraduate degrees in the field of
teacher education and principal leadership (Hill).
Therefore, the maxim that ―leadership matters‖ in regards to academic achievement
leads to the supposition that the philosophical and educational beliefs of a leader,
likewise, matter in one‘s role as an instructional leader. Thus, it could be further asked,
which philosophical and ideological views matter more and positively correlates with
academic achievement? Kirschner et al. (2006) discussed the philosophical
underpinnings and outcomes of constructivist practices and philosophy and compared
them to more traditional models. Nevertheless, Kirscher et al. pointed out that empirical
research shows it does makes a difference.
Researchers have looked at what teachers believe but have neglected investigating
what principals believe and its impact. Research is replete with the understanding that
teachers‘ beliefs drive instructional pedagogy, and instructional pedagogy directly affects
student achievement (Buehl & Fives, 2009; Fang, 1996; Hermans, Van Braak, & Van
Keer, 2006; Pajares, 1992; Witcher, Onwuegbuzie, Collins, Witcher, Minor, & James,
2002; Woolley, Benjamin, & Woolley, 2004). Research has largely ignored principals‘
beliefs and their indirect effects on student achievement despite that fact that principals
must now focus on the technical core of teaching and learning as instructional leaders
and, therefore, understand the issues, philosophy, ideology, and research behind the two

61
general opposing views of teaching and learning, namely instructivism and
constructivism, and the long fought ideological war between the two.
Education Wars: Instructivism vs. Constructivism
The earliest forms of constructivism can be attributed to Italian philosopher
Gaimbattista Vico in the early 18th
century, and more current forms to the works of
Vygotsky, Dewey, Piaget, and Bruner (Tobias & Duffey, 2009). Constructivism is
defined as ―a view of learning suggesting that learners develop their own understanding
of the topics they study instead of having it delivered to them by others (most commonly
teachers) in an already organized form‖ (Eggen & Kauchak, 2001, p. 115). Mayer (2009)
concisely defined it this way: ―Constructivism is a theory of learning in which the learner
builds knowledge structures in working memory by engaging in active cognitive
processing during learning‖ (p. 198). Glatthorn and Jailall (2009) stated that
constructivist education as commonly experienced today contains the following nine
basic tenets:
1) learning is not a passive, receptive process but is instead an active, meaning-
making process; 2) thus, learning at its best involves conceptual change—
modifying one‘s previous understanding of concepts so that they are more
complex and more valid; 3) in this sense, learning is always subjective and
personal; 4) learning is also situated or contextualized; 5) learning is social; 6)
learning is affective; 7) the nature of the learning task is crucial; 8) learning is
strongly influenced by the learner‘s development; and 9) learning at its best
involves metacognition. (p. 140-141)

62
Applied constructivism can, therefore, be classified as student-centered,
minimally-guided, discovery learning, project-based, instructional practice with the
theory behind it suggesting knowledge is ―constructed‖ by the learner. A common theme
in the application of constructivism is the need to destruct old realities if desired new
realities are to appear. This may appear as educational nihilism or ―values clarification‖
in which students are taught to construct a new ethical framework by setting aside
traditional ethics and values. The underlying motivation to such pedagogy is often found
irrationally hostile to traditional pedagogy (Edmondson, 2006).
On the other side of the pedagogical spectrum is traditional pedagogy, which is
classified as an instructivist, direct-instruction model. Eggen and Kauchak (2001) defined
instructivist pedagogy:
A teacher-centered strategy that uses teacher explanation and modeling combined
with student practice and feedback to teach concepts and skills. It is teacher
centered in the sense that the teacher identifies lesson goals and initially explains
the content and models the skills for the students. Students are actively involved in
developing initial understanding and practicing to mastery. (p. 275)
This hostility towards more traditional forms of pedagogy has been, to a large
extent, the cause of what is known as the ―education war,‖ also known as the great debate
over traditional explicit instruction (instructivism) versus progressive (constructivism)
education. This education war between these two prevailing views has been ideologically
fought since the late 1800s. The pedagogical war between constructivism and
instructivism at the base level is a debate between the primacy of the child versus the

63
primacy of subject matter, between spontaneous and formal approaches to schooling, and
between education formulated to preserve the nation‘s cultural heritage versus
transforming it (Olson, 1999).
The central source of the debate is in the pervasive disagreement among citizens
and experts in society about what the nature and goals of education should be (Owens &
Valesky, 2007). Stone (2002) suggested that mainstream progressive educators view
―schooling as an instrument of social and economic reform‖ (p. 39) in opposition to
parents and industries who, in general, want academic results.
Hirsch (2001a) purported that historically, progressive education, and therefore
constructivist pedagogy, is based on romanticism, which is a quasi-religious outlook.
Romanticism attempts to characterize ―nature‖ as being better than what is deemed
―artificial.‖ Therefore, romanticism applied to the field of education relies on ―natural
impulses‖ and sees social custom and human reason as ―evil.‖ Hirsch stated that ―when
writing was invented, ‗natural‘ education went down the drain of history. From then on,
children were destined to learn artificially…This is civilization—the name of the
game…All civilization is artificial‖ (p. 22).
There are distinctions between different philosophical forms that fall within
constructivism in contemporary educational practice. Maturationism, for example, is one
radical form, which is a romantic notion that child development should be a totally
natural process, as intimated by enlightenment French philosopher Jean-Jacques
Rousseau (DeVries, Zan, Hildebrandt, Edmiaston, & Sales, 2002; Gutek, 2005). This
view of constructivism is often implied as its ideological base as in Hirsch‘s (2001a)

64
arguments against constructivism. DeVries et al. suggested that what is commonly known
as constructivism is not always that radical; it is based on the process of adults facilitating
interactions that assist students‘ construction of meaning. Therefore, students gain
knowledge through the facilitation of adults.
To complicate the matter, constructivism tends to be void of a well-specified
instructional theory or an articulation of learning principles (Tobias & Duffy, 2009). This
overarching philosophy that students learn through actively constructing their own
knowledge and meaning allows itself for easy adaption to such extreme views as
maturationism, among others. This leads to the core problem of an infinite cycle of
innovations, fads, failures, and reforms, of which variants or refinements have been
around for over a century (Stone, 2002).
The accountability era has brought a new dimension to the education war. For
example, the language of the NCLB, which contains 1,184 pages, is bristled with 246
references to the word ―research‖ and 116 references to the terms ―scientific‖ or
―scientifically‖ in describing the kinds of approaches to instruction that were desired by
Congress in enacting the law (Owens & Valesky, 2007). This scientifically based
research NCLB calls for is research that involves the application of rigorous, systematic,
and objective procedures to obtain reliable and valid knowledge relevant to education
activities and programs, which have been accepted by peer-reviewed journals or
approved by a panel of independent experts through a comparably rigorous, objective,
and scientific review (Bernhardt, 2004). This requirement for widespread academic
achievement based on scientifically derived pedagogy has caused a bellowing effect on

65
the education war which, as Hirsch (2001a) suggested, can be classified as a kind of
ideological or even a quasi-religious war.
In regards to the accountability era, with the mandate of increased student
achievement, it can be presumed that ―best-practices‖ must be understood, implemented,
and practiced for one to be an effective instructional leader and therefore, to have an
effective school. What is meant by best practices is not formulating the best way to
implement an ideology or theory, but implementing what provides academic
achievement. Therefore, what are the current empirical arguments for what works best,
putting the dogmas, ideologies, and beliefs aside?
Constructivism Success or Failure: The Debate
At the 2007 annual convention of the American Educational Research Association
(AERA), a debate was held which looked at the merits of constructivism. The debate was
the result of an article published in the Educational Psychologist by Kirschner, Sweller,
and Clark (2006). The article reasoned that constructivist type approaches to instruction
cannot be effective considering the established knowledge of human cognitive
architecture.
Kirschner et al. (2006) contended that according to a widely accepted information-
processing model on learning in cognitive psychology, beginner and novice learners
cannot process information effectively in minimally guided, learning by doing instruction
(i.e. discovery, problem-based, experiential, and inquiry-based learning) due to the limits
of working memory. Minimally guided learning, as Kirschner et al. indicated, is more
suitable for those who have expert content knowledge because their working memory is

66
free to analyze, critique, discover, and make inferences. Kirschner et al. (2006)
concluded,
After a half century of advocacy associated with instruction using minimal
guidance, there appears no body of research supporting the technique. In so far as
there is any evidence from controlled studies, it almost uniformly supports direct,
strong instructional guidance rather than constructivist-based minimal guidance
during the instruction of novice to intermediate learners. Even for students with
considerable prior knowledge, strong guidance while learning is most often found
to be equally effective as unguided approaches. Not only is unguided instruction
normally less effective; there is also evidence that it may have negative results
when student acquire misconceptions or incomplete or disorganized knowledge. (p.
83-84)
Kirschner et al.‘s (2006) article resulted in other papers being published which
defended the constructivist views and further retorts by Kirschner et al. (Tobias & Duffy,
2009). The effect of these exchanges and the subsequent debate at the 2007 convention of
the AERA was a book called Constructivist Instruction: Success or Failure? (Tobias &
Duffy, 2009), which presented both sides of the argument in debate form of some of the
leading thinkers and researchers on cognitive psychology and educational research on
this hotly debated topic. The main points of the book are presented below.
The arguments and evidence in favor of constructivism are presented by Jonassen
(2009), Herman and Gomez (2009), Wise and O‘Neill (2009), Gresalfi and Lester (2009),
Schwartz, Lindgren, and Lewis (2009), and Spiro and DeSchryver (2009). The arguments

67
and evidence opposed to constructivist instruction are presented by Sweller (2009),
Kirschner (2009), Clark (2009), Mayer (2009), Rosenshine (2009), Fletcher (2009), and
Klahr (2009).
Jonassen (2009) established the argument for constructivist learning by stating that
(a) learning is the process of processing, storing, and retrieving information; (b) learning
is a biochemical activity in the brain; (c) learning is a relatively permanent change in
behavior or behavioral dispositions; (d) learning is an ontogenesis of knowledge
construction; (e) learning is about conceptual change; (f) learning is about problem
solving; (g) learning is about social negotiation; (h) learning is based on human activity;
and (i) learning is tuning perceptions to environmental affordances. Jonassen‘s main
argument against Kirschner et al.‘s (2006) findings was that Kirschner et al. rested upon a
unitary view of learning, therefore ignoring other forms as outlined above.
Herman and Gomez (2009) stated that motivation, the social context of the
classroom, and the role of guidance play critical roles in the instructional process to
which critics of constructivist instruction look past. Wise and O‘Neill (2009) suggested
that the quality of guidance (high or low levels) is just one aspect in the success or failure
of constructivist instruction. Wise and O‘Neill suggested two other aspects should also be
considered, namely context and timing of guidance. Gresalfi and Lester (2009) added that
the contrast between constructivist and explicit direct instruction is in the type of
guidance offered opposed to the amount of guidance.
Schwartz et al. (2009) suggested that constructivist instructional practices are ideal
when what is learned prepares students for what will be learned in the future. Schwartz et

68
al. formed this conclusion by presenting findings which have shown that constructivist
success becomes more apparent over time. Schwartz et al. also conceded that
constructivist instruction is not ideal if the objective is an immediate ability to problem
solve.
Spiro and DeSchryver (2009) also conceded that constructivist instruction may not
be ideal in all situations. In particular, in well-structured domains such as mathematics,
explicit instruction is better suited. Spiro and DeSchryver did argue that in ill-structured
domains, or domains which are impossible to fully explain and completely structure (e.g.
history, medicine, law, literary interpretation), a form of constructivist instruction is
superior. Spiro and DeSchryver supported a ―middle path‖ between explicit direct
instruction and extreme forms of constructivism, which is called cognitive flexibility
theory (CFT). CFT presents flexible instruction through multiple contexts,
representations, and crisscrossing various domains.
Sweller‘s (2009) criticisms of constructivist instruction are based on the premise
that it runs counter to evolutionary information-processing principles. In particular,
constructivist learning methods make assumptions that secondary knowledge (intentional
school learning) occurs the same way and as easily as primary knowledge (learning to
speak, listen, etc.). Sweller went on to suggest that a cognitive architecture which
supports inquiry-based learning techniques, such as constructivist instruction, also
supports the idea of withholding information from learners to their ultimate detriment.
Kirschner (2009) argued that constructivist instruction suggests that epistemology
and pedagogy are one and the same. Kirschner outlined problems in using a ―domain‘s

69
epistemology as its pedagogy‖ (p. 145). Kirschner stated there is a difference in learning
science versus doing science, as an example. Adult experts possess content knowledge
and conditionalized knowledge while student beginners/novices do not. Therefore,
having students learn science primarily by acting like scientists (i.e. learning by doing)
lies in a failure to distinguish between learning and doing.
Clark (2009) pointed out that many who advocate constructivist instruction also
concede the need for instructional support, modeling, and guidance as advocated in
traditional models of instruction. The disagreement among researchers is that one
advocates the role of the teacher to challenge the learner‘s thinking opposed to directing
or proceduralizing the thinking. As Clark pointed out, the other side states that such
practices tend to violate cognitive architecture by overloading working-memory.
Mayer (2009) criticized constructivist discovery learning by its inability to
effectively differentiate between behavioral activity and cognitive activity. Mayer noted
the former does very little in promoting learning. Mayer stated, ―The constructivist
teaching fallacy occurs when someone assumes that active learning is caused by active
instructional methods and passive learning is caused by passive methods of instruction‖
(p. 195).
Rosenshine (2009), in his review of over 50 years of experimental and correlational
research, found that much of the research is consistent with Kirschner et al.‘s (2006)
findings on cognitive architecture and the issues of overloading working memory. Along
the same line, Fletcher (2009) discussed how traditional drill and practice, known as
―drill and kill‖ by constructivists, has ample empirical evidence of its general success, its

70
success with contemporary ―intelligent tutoring systems,‖ and even evidence of students‘
positive attitudes toward it.
Klahr (2009) presented his findings which show direct instruction‘s superiority to
discovery learning, but Klahr also noted the major issues and problems with advocating
one method over another due to the lack of an explicit operational definition of the many
faces and facets of constructivism. Klahr does advocate that ―direct instruction should be
used whenever we have evidence that is both efficient and effective in the short and long
term‖ (p. 306).
In reflecting and summing up the extensive debate presented in the book,
Constructivist Instruction: Success or Failure?, Tobias (2009) stated the following:
In comparison to constructivists, advocates for explicit instruction seem to justify
their recommendations more by references to research than rhetoric. Constructivist
approaches have been advocated vigorously for almost two decades now, and it is
surprising to find how little research they have stimulated during that time. (p. 346)
Just as instructional leadership has evolved into realms of transformational
leadership, which can be explained through a contingency schema, the use of traditional
direct instructional approaches versus constructivist approaches, to an extent, can also be
explained through a contingency schema. Duffy (2009) noted that the success or failure
of constructivist instruction is generally in the eye of the beholder. This can be seen in
noting ―the failure to communicate with direct-instruction researchers [by] ignoring the
extensive guidance provided in the constructivist environments while the constructivist

71
seem to ignore the role of information processing in general and memory limitations in
particular in the learning process‖ (Tobias & Duffy, 2009, p. 9).
The Constructs of Constructivism
The issues many have with constructivism is not to a large extent constructivism as
debated above, but rather empirically unfounded ideologies and philosophies that
coincide with the presuppositions of constructivism. These beliefs start out as corollaries
of constructivism which then develop into what is commonly understood as constructivist
instruction. Phillips (1995) developed a taxonomy for differentiating between the three
common constructs of constructivism he called ―the good, the bad, and the ugly.‖
Phillips (1995) stated that constructivism has become a kind of secular religion and
that most forms of constructivism are modern forms of progressivism. Phillips further
asserted,
As in all living religions, constructivism has many sects—each of which harbors
some distrust of its rivals. This descent into sectarianism, and the accompanying
growth in distrust of nonbelievers, is probably the fate of all large-scale movements
inspired by interesting ideas. (p. 5)
Phillips (1995) outlined the ―ugly‖ aspect of constructivism as sectarianism, which
involves the tendency to distrust or dismiss any theory or possible ways of learning which
does not fit the prescribed ideology even in the face of empirical fact or evidence. Meyer
(2009) emphasized this ―ugly‖ aspect of constructivism by its claims to be a
―postespistemology‖ which replaces ―traditional‖ concepts of knowledge. Meyer
suggested evidence of this through many colleges of education which increasingly

72
request or even demand pre-service teachers to be weaned off traditional approaches and
to adopt constructivist views of knowledge. Green and Gredler (2002) also reiterated the
―ugliness‖ of constructivism by suggesting that constructivism has emerged both in
literature on learning and in school reform efforts, despite no strong supporting research
base.
Next, the ―bad‖ aspect of constructivism is the tendency of the differing forms of
constructivist epistemology toward the justification of one‘s knowledge as being a matter
of sociopolitical processes or consensus. Put another way, it is the tendency toward
relativism as more radical forms of constructivism do, such as critical race theory
(Phillips, 1995).
Specifically applied to education, Hyslop-Margison and Strobel (2008) stated the
―bad‖ occurs when students make claims as fact or present opinions that teachers
commonly fail to question or when teachers do not press for evidence or warrant for a
student‘s position. This type of scenario often may devolve into the relativist view that
one perspective is just as good as another. Relativism in the classroom establishes the
habit of students lacking concern for evidence or the importance of such being
deemphasized.
Last, Phillips (1995) suggested the ―good‖ aspect of constructivism is the
emphasis on the necessity for active participation by the learner, together with the
recognition of the social nature of learning. This ―good‖ aspect is what was largely
debated in the book, Constructivist Instruction: Success or Failure?

73
The debate over the variations of constructivism and instructivism is far from a
conclusion. Pedagogical beliefs have become as polarizing and quasi-religious as other
political, quasi-religious, and quasi-scientific movements, such as environmentalism and
the proper role of government in a democracy. The accountability movement has caused
a kind of level playing field, so to speak, for the debate between pedagogies, even if one
side argues on the playing field‘s importance in and of itself. In the meantime,
accountability is here. Millions of students are in tens of thousands of schools, and their
leadership is being held accountable.
Many of the stakeholders and educational researchers are calling to do what is
equitable for all students, doing the least harm and doing what has been proven
scientifically, especially in regards to those from disadvantaged situations (Alferink,
2007; Heward, 2003; Hirsch, 2009; Kauffman & Sasso, 2006; Kim & Axelrod, 2005).
Carnine (2000) thus attempted to answer the question, why do some educational experts
resist effective practices? Carnine stated, ―Until education becomes the kind of
profession that reveres evidence, we should not be surprised to find its experts dispensing
unproven methods, endlessly flitting from one fad to another‖ (p. 3).
Leadership Effectiveness: Other Influential Variables
A principal‘s pedagogical beliefs and instructional leadership behaviors are two
important variables in understanding causes for a principal‘s effectiveness in the
accountability era. As in most leadership research, there are many variables which can
influence effectiveness. Eight noteworthy variables have also been shown to impact a
principal‘s leadership effectiveness which will be a component of this study. In

74
particular, gender, ethnicity, educational obtainment, classroom teaching experience,
primary subject taught as a classroom teacher, years of experience as a principal at their
current location, overall years as an administrator, and the percentage of instructional
leadership responsibilities delegated to others and to whom.
Regarding gender, either male or female, numerous researchers have found that the
variable of gender can have a significant impact on the results of a study and that
different genes, hormones, and brain structures exist between males and females, which
in turn, can cause differences in personalities and behaviors (Kimura, 2002; McCarthy,
Auger, & Perrot-Sinal, 2002; Cahill, 2005; Brizendine, 2006; Kruger, 2008). Specifically
regarding educational leadership, Austin (2008) found that gender differences impact the
values held by educational leaders, and the styles and approaches to management are
distinguishable between male and female educational leaders. Austin further found that
these distinguishable gender differences can influence decision making and institutional
effectiveness.
Ethnicity has also been found to impact leadership outcomes. Social scientists have
repeatedly found that different cultures have different values, beliefs, and attitudes
(Babbie, 1994). Shah (2010) stated that people from different ethnic backgrounds
perceive and practice educational leadership differently by drawing upon their beliefs,
values, and sources of knowledge. Hofstede‘s (1993, 2001) research has shown that a
leader‘s ideas about planning, motivation, evaluation, and achieving goals are culturally
specific. Estrada, Frame, and Williams (2004) further found that one‘s race and cultural

75
background can affect the strategies used to deal with the problems that may arise in a
cross-cultural educational setting.
Research on one‘s highest level of educational obtainment has also been found to
affect one‘s educational leadership. Baker and Cooper (2005) found that principals with
strong academic backgrounds were 3.3 times more likely to recruit, select, and retain
teachers with similar academic attributes. Baker and Cooper suggested this is important
since the literature from economic and educational policy research indicates that teachers
with strong academic backgrounds produce better student outcomes. Fernandez et al.
(2007) also found that a principal‘s educational attainment had a significant influence on
their school‘s standardized test scores and student attendance rates.
The backgrounds of educational leaders as classroom teachers have also shown to
affect leadership outcomes. In particular, the years of experience as classroom teachers
and the primary subjects taught. Besides the fact that California Education Code 44270
requires candidates pursuing an Administrative Services Credential to have a minimum
of three years of classroom teaching experience (or its equivalent), these variables of
subject taught and years in the classroom are important indicators to successful
instructional leadership. For example, Borba (2009) stated that effective and successful
instructional leadership is more effectively attained after numerous years of successful
teaching. Williams et al. (2005) found schools which have teachers with at least five
years of teaching experience have been found to correlate with high student achievement.
According to Kelley and Peterson (2002), individuals with extensive backgrounds as
teachers, who have experience as curriculum specialists or coordinators, or who have

76
spent considerable time on instruction-related activities are being sought after and hired
more frequently than individuals without such experience.
Not only are years of teaching and curriculum experience used in principal
recruitment, but the subject taught in those years are also equally important in the
recruitment of principals and their success as instructional leaders. LaPointe and Davis
(2006) found that successful principals tended to have strong backgrounds as literacy or
math coaches, curriculum specialists, or in special education and are less likely to have
backgrounds in physical education, health education, or athletics (coaching or directing).
The number of years as a principal at their current site and the overall years as an
administrator are two other variables which have been shown to effect educational
leadership outcomes. Fernandez et al. (2007) found that principal tenure on the job was
the variable that most significantly affected the performance on academic gains,
standardized test accountability scores, teacher turnover, and student attendance rates.
Williams et al. (2005) found that principals‘ years of experience correlate with high
student achievement. Clark, Martorell, and Rockoff (2009) also found a positive
relationship between principal experience and school performance, particularly for math
test scores and student absences, and that policies which cause principals to leave their
jobs early (early retirement or move into district administration) are harmful to school
performance.
The percentage of instructional leadership responsibilities delegated to others is
another variable worth consideration. As discussed previously, principal-centered
instructional leadership has been strongly influenced by transformational leadership that

77
focuses on empowering others (Harris, Leithwood, Day, Sammons, & Hopkins, 2007;
Leithwood & Jantzi, 2005; Mangin, 2007). The amount of, and specifically to whom,
instructional leadership is delegated to others provides an added level of depth in
understanding how successful principals practice their instructional leadership in today‘s
accountability era.
Summary
In conclusion, the accountability era has brought federal and state
mandates of academic success for all students. Evidence through effective schools
research of the past several decades has called for principals to be instructional leaders.
Instructional leadership has been researched, refined, and conceptualized. In a principal‘s
role as an instructional leader, the vision and mission of the school site is intently focused
on teaching and learning. What principals believe and know in regards to teaching and
learning affects the visions and missions of schools and thus, the teaching and learning
within the schools. Those beliefs and understandings are indirectly important to
accomplishing student achievement. Therefore, the intent of this study is to find the
answer to the following question: The general research question this study attempts to
answer is, What are effective CA high school principals‘ self-reported instructional
leadership behaviors and pedagogical beliefs (constructivist or instuctivist) in the
accountability era and what are the differences in these behaviors and beliefs in regards to
eight specific variables?
78
CHAPTER THREE: METHODOLOGY
This chapter describes the methodology and procedures employed in this causal-
comparative study. In the current climate of high-stakes testing and accountability, this
study has set out to discover the significant instructional leadership behaviors and
pedagogical beliefs of principals. In particular, this study attempts to describe the
behaviors and beliefs of effective high school principals in the state of California with
significant student populations of socioeconomically disadvantaged and English learners.
Further, casual relationships between these behaviors and beliefs and eight specific
demographic variables were also analyzed. The chapter will be divided into the following
areas: study design, participants, data gathering methods, instrumentation, and data
analysis methods.
Study Design
The study design was causal-comparative in nature since the study attempts to
describe and then determine the cause or reason for a preexisting condition (Ary, Jacobs,
Razavieh, & Sorensen, 2006). In the case of this study, the preexisting condition is
effective California high school principals of schools serving significant student
populations of socioeconomically disadvantaged and English learner student populations
per eight specific demographic variables.
Therefore, the study set out to answer the following question: What are effective
California high school principals‘ self-reported instructional leadership behaviors and
pedagogical beliefs (constructivist or instuctivist) in the accountability era and what are
the differences in these behaviors and beliefs in regards to eight specific variables?

79
In particular,
1RQ What are effective high school principals‘ perceptions of their own
instructional leadership behaviors in the following 10 dimensions as
measured by the Principal Instructional Management Rating Scale:
framing the school‘s goals, communicating the school‘s goals,
coordinating the curriculum, supervising and evaluating instruction,
monitoring student progress, protecting instructional time, providing
incentives for teachers, providing incentives for learning, promoting
professional development, and maintaining high visibility?
2RQ What are effective high school principals‘ beliefs of good pedagogical
practice with a preference of either an instructivist or constructivist
dimension as measured on the Principal Beliefs Survey?
3RQ Are there significant differences in high school principals‘ perceptions of
their own instructional leadership behaviors as measured by the 10
Principal Instructional Management Rating Scale dimensions based on the
principals‘ gender?
0H 3.1 through 3.10 There are no statistically significant differences in
effective high school principals‘ perceptions of their own
instructional leadership behaviors as measured by the 10 Principal
Instructional Management Rating Scale dimensions based on the
principals‘ gender.

80
4RQ Are there significant differences in high school principals‘ perceptions of
their own instructional leadership behaviors as measured by the 10
Principal Instructional Management Rating Scale dimensions based on the
principals‘ ethnicity?
0H 4.1 through 4.10 There are no statistically significant differences in
effective high school principals‘ perceptions of their own
instructional leadership behaviors, as measured by the 10 Principal
Instructional Management Rating Scale dimensions based on the
principals‘ ethnicity.
5RQ Are there significant differences in high school principals‘ perceptions of
their own instructional leadership behaviors as measured by the 10
Principal Instructional Management Rating Scale dimensions based on the
principals‘ educational level?
0H 5.1 through 5.10 There are no statistically significant differences in
effective high school principals‘ perceptions of their own
instructional leadership behaviors as measured by the 10 Principal
Instructional Management Rating Scale dimensions based on the
principals‘ educational level.
6RQ Are there significant differences in high school principals‘ perceptions of
their own instructional leadership behaviors as measured by the 10
Principal Instructional Management Rating Scale dimensions based on the
principals‘ overall number of years as an administrator?

81
0H 6.1 through 6.10 There are no statistically significant differences in
effective high school principals‘ perceptions of their own
instructional leadership behaviors as measured by the 10 Principal
Instructional Management Rating Scale dimensions based on the
principals‘ overall number of years as an administrator.
7RQ Are there significant differences in high school principals‘ perceptions of
their own instructional leadership behaviors as measured by the 10
Principal Instructional Management Rating Scale dimensions based on the
principals‘ number of years as principal at their current location?
0H 7.1 through 7.10 There are no statistically significant differences in
effective high school principals‘ perceptions of their own
instructional leadership behaviors as measured by the 10 Principal
Instructional Management Rating Scale dimensions based on the
principals‘ number of years as principal at their current location.
8RQ Are there significant differences in high school principals‘ perceptions of
their own instructional leadership behaviors as measured by the 10
Principal Instructional Management Rating Scale dimensions based on the
principals‘ number of years as a classroom teacher?
0H 8.1 through 8.10 There are no statistically significant differences in
effective high school principals‘ perceptions of their own
instructional leadership behaviors, as measured by the 10 Principal

82
Instructional Management Rating Scale dimensions based on the
principals‘ number of years as a classroom teacher.
9RQ Are there significant differences in high school principals‘ perceptions of
their own instructional leadership behaviors as measured by the 10
Principal Instructional Management Rating Scale dimensions based on the
principals‘ subject taught as a teacher?
0H 9.1 through 9.10 There are no statistically significant differences in
effective high school principals‘ perceptions of their own
instructional leadership behaviors, as measured by the 10 Principal
Instructional Management Rating Scale dimensions based on the
principals‘ subject taught as a teacher.
10RQ Are there significant differences in high school principals‘ perceptions of
their own instructional leadership behaviors as measured by the 10
Principal Instructional Management Rating Scale dimensions based on the
principals‘ extent of instructional leadership delegated?
0H 10.1 through 10.10 There are no statistically significant differences in
effective high school principals‘ perceptions of their own
instructional leadership behaviors, as measured by the 10 Principal
Instructional Management Rating Scale dimensions based on the
principals‘ extent of instructional leadership delegated.

83
11RQ Are there significant differences in high school principals‘ beliefs of good
pedagogical practice as measured by the 14 beliefs presented in the
Principal Beliefs Survey based on the principals‘ gender?
0H 11.1 through 11.14 There are no statistically significant differences in
effective high school principals‘ beliefs of good pedagogical
practice as measured by the 14 beliefs presented in the Principal
Beliefs Survey based on the principals‘ gender.
12RQ Are there significant differences in high school principals‘ beliefs of good
pedagogical practice as measured by the 14 beliefs presented in the
Principal Beliefs Survey based on the principals‘ ethnicity?
0H 12.1 through 12.14 There are no statistically significant differences in
effective high school principals‘ beliefs of good pedagogical
practice as measured by the 14 beliefs presented in the Principal
Beliefs Survey based on the principals‘ ethnicity.
13RQ Are there significant differences in high school principals‘ beliefs of good
pedagogical practice as measured by the 14 beliefs presented in the
Principal Beliefs Survey based on the principals‘ educational level?
0H 13.1 through 13.14 There are no statistically significant differences in
effective high school principals‘ beliefs of good pedagogical
practice as measured by the 14 beliefs presented in the Principal
Beliefs Survey based on the principals‘ educational level.

84
14RQ Are there significant differences in high school principals‘ beliefs of good
pedagogical practice as measured by the 14 beliefs presented in the
Principal Beliefs Survey based on the principals‘ overall years as an
administrator?
0H 14.1 through 14.14 There are no statistically significant differences in
effective high school principals‘ beliefs of good pedagogical
practice as measured by the 14 beliefs presented in the Principal
Beliefs Survey based on the principals‘ overall years as an
administrator.
15RQ Are there significant differences in high school principals‘ beliefs of good
pedagogical practice as measured by the 14 beliefs presented in the
Principal Beliefs Survey based on the principals‘ number of years as
principal at their current location?
0H 15.1 through 15.14 There are no statistically significant differences in
effective high school principals‘ beliefs of good pedagogical
practice as measured by the 14 beliefs presented in the Principal
Beliefs Survey based on the principals‘ number of years as
principal at their current location.
16RQ Are there significant differences in high school principals‘ beliefs of good
pedagogical practice as measured by the 14 beliefs presented in the
Principal Beliefs Survey based on the principals‘ number of years as a
classroom teacher?

85
0H 16.1 through 16.14 There are no statistically significant differences in
effective high school principals‘ beliefs of good pedagogical
practice as measured by the 14 beliefs presented in the Principal
Beliefs Survey based on the principals‘ number of years as a
classroom teacher.
17RQ Are there significant differences in high school principals‘ beliefs of good
pedagogical practice as measured by the 14 beliefs presented in the
Principal Beliefs Survey based on the principals‘ subject taught as a
teacher?
0H 17.1 through 17.14 There are no statistically significant differences in
effective high school principals‘ beliefs of good pedagogical
practice as measured by the 14 beliefs presented in the Principal
Beliefs Survey based on the principals‘ subject taught as a teacher.
18RQ Are there significant differences in high school principals‘ beliefs of good
pedagogical practice as measured by the 14 beliefs presented in the
Principal Beliefs Survey based on the principals‘ extent of instructional
leadership delegated?
0H 18.1 through 18.14 There are no statistically significant differences in
effective high school principals‘ beliefs of good pedagogical
practice as measured by the 14 beliefs presented in the Principal
Beliefs Survey based on the principals‘ extent of instructional
leadership delegated.

86
Participants
The design employed in this study describes what effective principals practiced and
believed in regards to instructional leadership and teaching pedagogy and how eight
specific demographic variables effected those practices and beliefs. Therefore, the first
step was to delineate the study‘s population by setting the parameters of what is
considered an effective principal in the state of California.
The population was first limited to all principals from all public high schools who
have reported Academic Performance Index (API) scores in the state of California. To
determine which high schools were effective, the researcher compiled, sorted, and filtered
data from the API data files obtained from the Dataquest website of the California
Department of Education (2009d).
The California state indicator, the API, ―is a single number, ranging from a low of
200 to a high of 1000, which reflects a school‘s… performance level, based on the results
of statewide testing. Its purpose is to measure the academic performance and growth of
schools…The API is calculated by converting a student‘s performance on statewide
assessments across multiple content areas into points on the API scale. These points are
then averaged across all students and all tests. The result is the API‖ (California
Department of Education, 2009a, p. 5).
Therefore, the baseline of what was considered an ―effective‖ principal in this
study was based on those principals whose schools have met or exceeded the overall API
growth targets and growth targets for the subgroups of socioeconomically disadvantaged
and English learner students in the school years of 2007-2008 and 2008-2009. The
87
study‘s population was further limited to the principals whose school sites had a
numerically significant student population of English learners and socioeconomically
disadvantaged students. Historically, these populations have consistently underachieved
and are thus the main focus of reform efforts in the accountability era.
Numerical significance of English learners and socioeconomically disadvantaged
students in this study adhered to the state of California‘s definition of numerically
significant subgroups as 100 or more students with valid STAR Program scores or 50 or
more students with valid STAR Program scores who make up at least 15 percent of the
total valid STAR Program scores of the school (California Department of Education,
2009b).
The study‘s population was also limited to principals who have been employed at
their current site for a minimum of three years. The criteria of a minimum of three years
was to control the possible variable of a recent change of leadership, since the assumption
is made that the school‘s effectiveness was due in part to the leadership practices of the
current principal.
For the 2007-2008 and 2008-2009 school years, the population that met the above
criteria for student demographic and API achievement included 90 high schools. The 90
high schools that met the criteria are listed in Appendix D. It was also determined
through School Accountability Report Cards (SARC) and follow up phone calls that 19
principals of the 90 high schools did not meet the requirement of a minimum of three
years of service as a principal at their current school. Therefore, the total population
established in this study was 71.

88
A priori power sample size procedures were not conducted in this study since the
total population was considered rather small. Therefore, all 71 high school principals
obtained from the above criteria were invited to participate in this study. Those who
volunteered to participate were asked to answers questions on the Principals Instructional
Management Rating Scale (PIMRS), the Principal Beliefs Survey (PBS), and
demographic questions concerning the subjects‘ gender, ethnicity, educational level,
overall years as an administrator, years as principal at their current location, years as a
classroom teacher and subject taught, and the percentage of instructional leadership
delegated to others and to whom. There was also a space available for comments.
An incentive plan was included to encourage each subject to complete all of the
surveys for analysis. Each subject who participates was entered into a random drawing
for a cash donation in the amount of $100.00 to the charity of their choice either in their
name or anonymous, based on their preference.
From the population of 71 principals, 36 principals volunteered to participate in this
study, which comprised 51% on the population. All 36 volunteer subjects were principals
of comprehensive public, non-charter high schools. The 2009 student populations of the
schools ranged from a low of 285 to a high of 4,000 with the mean of 2,243 students. The
percentage of student population, which was classified as socioeconomically
disadvantaged (SED), ranged from a low of 6% of the student population to a high of
92%. The mean of SED students was about half of all students at 47%. The percentage of
students classified as English learners (EL) was a low of 4% to a high of 55%, with the
mean of 21%.

89
All California high schools are required to meet their established API growth
targets each year until they are able to obtain the 800 level. Once at 800 API or over, the
requirement is to maintain that level (California Department of Education, 2009a). The
subjects‘ high schools had a two year mean growth API gain of 45 points with the mean
2007 base API of 698 to the mean 2009 API of 743. The two year mean growth API gain
for the SED subgroup was 58 points with a mean 2007 base API at 645 to a mean 2009
API of 704. Finally, the two year mean growth API gain for the EL subgroup was 57
points with a mean 2007 base API at 614 to a mean 2009 API of about 671. Table 2
contains the full descriptive statistics for the subjects‘ high schools.
Procedures
Upon approval granted to the researcher from the Liberty University IRB
(Appendix A), a pre-notice letter was mailed to all subjects in the population (N = 71).
The pre-notice letter followed the research by Dillman (2000), which suggests multiple
contacts and a prior notice maximizes return rates among mailed surveys. The pre-notice
letter is located in Appendix E. The following week, the questionnaire packet was mailed
which contained a cover letter, an instructions page, a demographic questionnaire page,
the PIMRS instrument, the PBS instrument, and directions for returning the questionnaire
packet. The cover letter is located in Appendix F, and the questionnaire packet is located
in Appendix G. The packet was mailed to all subjects at their places of employment.

90
Table 2
Descriptive Statistics of Subjects' High Schools
N M Min. Max. SD
2009 Student Population 36 2243.31 285 4000 673.92
Percent SED Students 36 47.39% 6.0% 92.0% 23.41%
Percent EL Students 36 21.11% 4.0% 55.0% 10.82%
API Two Year Growth 36 44.64 8.0 76.0 16.85
2009 API Score 36 743.08 619.0 879.0 65.85
2008 API Score 36 720.03 588.0 870.0 66.28
2007 API Score 36 698.39 549.0 861.0 69.01
SED Two Year Growth 36 58.56 -2.0 114.0 24.25
2009 SED API Score 36 704.28 618.0 817.0 49.99
2008 SED API Score 36 676.86 587.0 810.0 50.61
2007 SED API Score 36 645.42 543.0 809.0 52.04
EL Two Year Growth 36 57.53 16.0 123.0 24.49
2009 EL API Score 36 671.28 590.0 831.0 59.36
2008 EL API Score 36 646.22 573.0 811.0 60.66
2007 EL API Score 36 613.72 541.0 804.0 60.75
The cover letter followed Babbie‘s (1990), Dillman‘s (2000), and Rea‘s and
Parker‘s (2005) suggestions to increase participation by containing the following
information: participative value, identification/credibility, basis of selection, goals and
objectives of study, a token of appreciation, and a statement of confidentiality. Included
in the packet was a return self-addressed stamped envelope. Consent was assumed by the

91
principals‘ voluntary participation. All surveys were coded with an assigned number so
that the researcher could track who completed the surveys for possible follow-up on those
subjects who did not mail back completed surveys in the designated timeframe. The
survey responses are kept in a locked filing cabinet by the researcher for a five year
period and then will be destroyed.
For those subjects who did not respond in the initial two weeks after the mailing
of the questionnaire packet, the following procedures were conducted which follow
Dillman (2000) and Rea and Parker (2005) research to increase responses: (a) a follow-up
post card was mailed to subjects who have not responded in the two week period
(Appendix H); (b) four weeks from the initial mailing, a second follow-up notice was
mailed containing the cover letter, the questionnaire packet, and another self-addressed
stamped return envelope; and (c) six weeks from the first mailing, a reminder email was
sent (Appendix I).
The research was conducted from the beginning of May through the end of June
of 2010. Upon eight weeks from the initial mailing, a return rate of 58% (41) was
obtained. Out of the 41 returned questionnaire packets, two were not usable (incomplete
or excessive errors were made), and three stated their declination to participate.
Therefore, 36 compete and usable data sets were obtained and formed the sample of this
study, or 51% of the population as mentioned previously.

92
Instrumentation
Demographic Questionnaire
A demographic questionnaire page was created as part of the questionnaire packet
to obtain the independent variable data used in this study. In particular, the demographic
questions asked for the respondent‘s gender (male or female), ethnicity (African-
American, Asian, Caucasian, Hispanic, or other), highest educational level obtained
(Bachelors, Masters, Specialist, or Doctorate), number of years served as a classroom
teacher, primary subject taught as a classroom teacher, number of years as a principal at
their current location, number of overall years as an administrator, and what percentage
(from 0 to 100) the subjects delegate their instructional leadership responsibilities to
others and to whom.
The eight demographic questions established the independent variables in this
study. Several of these demographic questions were open-ended in nature. Thus, for
greater simplification in the statistical analysis of these independent variables, the data
were organized into categorical ranges based on the subjects‘ responses as follows: (a)
gender (male and female), (b) ethnicity (Caucasian, Hispanic, and other), (c) highest level
of education obtained (masters degree and doctorate degree), (d) number of years as a
classroom teacher (0-5 years, 6-12 years, and 20 plus years), (e) primary subject taught as
a classroom teacher (math, social science, English language arts, K-6th grade, physical
education, science, English second language, and other), (f) number of years as the
current site principal (3-4 years, 5-6 years, and 7-8 plus years), (g) total overall years as
an administrator (3-10 years, 11-15 years, 16-20 years, and 21 plus years), and (h) the

93
percentage of instructional leadership delegated to others (50% or more
retained/delegated to administrators, or 50% or more balanced between teachers and
administrators).
Principal Beliefs Survey
The dependent variables in this study were established through data collected from
two survey instruments. The first instrument was a 14 item forced-choice continuum
survey on a bipolar adjective scale. This forced-choice survey presented opposing views
on issues of pedagogy in addition to related educational and professional issues. The
issues and practices presented in the survey are in line with practices consistent with
constructivism, or progressive, student-centered instruction, and instructivism, or explicit,
teacher-centered instruction (Snider & Schumitsch, 2006; Snider & Roehl, 2007).
This survey, called the Teacher Beliefs Survey, was developed by Dr. Vicki Snider
of the University of Wisconsin-Eau Claire and used in research as reported in Snider and
Schumitsch (2006) and Snider and Roehl (2007). For use in this study, the name of this
instrument was changed to the Principal Beliefs Survey (PBS) to signify the new
intended subjects. The demographic information page with the survey was also changed
to reflect the desired independent variables of this study (See Appendix G).
The actual 14 items remained as originally designed except for question three. ―In
early grades‖ was deleted from the question since this study analyzed beliefs of high
school principals. Therefore, item three reads, ―Small class size is the primary factor
leading to higher academic achievement [versus] Small class size is not the primary
factor leading to higher academic achievement.‖ Since a slight change was made on the

94
instrument and the intended subjects of the survey was different (principals instead of
teachers), the instrument was tested for its reliability by the researcher of this study. The
complete version of the PBS is located in Appendix G, and permission to use the
instrument is located in Appendix C.
The PBS was designed in this unusual format rather than a Likert-type scale
because the issues are polarizing. The intent of this instrument was to force respondents
to pick a position on the given topic or else indicate that they did not have one. If a
Likert-type instrument would have been used listing 28 instead of 14 items, respondents
could have agreed with almost all of them given the nature of the statements (Snider &
Schumitsch, 2006).
The items on the survey were also counter-balanced from right to left so that
related, but opposing beliefs appeared on both sides. For each pair of bipolar statements,
the subjects had the option of selecting one of two choices if they agreed with the
statement of the left, ―Exactly what I believe‖ and ―Somewhat like what I believe.‖ The
same two choices were available for the statement on the right. If the subject was
balanced or undecided, he or she was able to select the middle choice, ―I‘m balanced
between these beliefs.‖ All five possible selections were numbered (one through five) for
scoring, similar to Likert-type survey instruments. For data analysis of the PBS, the raw
data obtained from the 14 items were un-counter-balanced. Therefore, a one (―Exactly
what I believe‖) or two (―Somewhat like what I believe‖) would signify a constructivist
belief, a three would signify a balanced belief, and a four (―Somewhat like what I

95
believe‖) and five (―Exactly what I believe‖) would signify an instructivist belief. The
last part of the survey allowed for comments.
The 14 items on the PBS are divided along the constructivist/instructivist view of
pedagogical issues, related issues, and professional issues. Pedagogical issues are those
which are related to the emotional ideological battle referred to in chapter two,
constructivism versus not constructivism or instructivism. Items 2, 5, 9, 11, and 13 refer
to pedagogical issues based on constructivism, defined as learners construct their own
knowledge based on their own experiences and previous beliefs. Therefore, teaching
practices that facilitate knowledge construction such as authentic exploration, engaging
activities, interactive group work, and student ownership of the learning process would be
seen as best practices (Snider & Roehl, 2007). On the other end of the spectrum, non-
constructivist or instructivist perspectives are those often referred to as positivist,
reductionist, behavioral, traditional content-driven, skills, bottom-up transmission
instruction, direct instruction, behaviorism, and explicit instruction (Snider & Roehl).
Snider and Roehl (2007) referred to related issues (items 1, 3, 4, 7, and 8) as those
highly popular classroom practices which cut across pedagogical lines if one is suspected
of lacking a firm intellectual foundation of pedagogical practices, such as (a) adapting
instruction to students‘ learning style, (b) using an eclectic approach, (c) emphasizing
self-esteem, (d) mixed-ability grouping, and (e) small class size. Snider and Roehl
suggested evidence supporting the efficacy of any of these common practices are limited
or, at best, mixed; nevertheless, they appear to possess widespread support.

96
Professional items (6, 10, 12, and 14) refer to teacher accountability and
professional development issues during the current NCLB accountability era. The
accountability movement is based on the presumption that increasing academic
achievement is the primary function of schools, with the expectation that all students can
learn and that teachers and schools should be held accountable for student achievement
outcomes (Snider & Roehl, 2007). Table 3 provides complete item mapping of the PBS.
The PBS had gone under item analysis for its content validity conducted by its
authors, via a pilot test, among a heterogeneous group of 35 teachers. Based on the pilot
test, some questions were reworded, and some items were omitted if over 80% of the
respondents did not take a position (Snider & Schumitsch, 2006).
Since the reliability of the PBS had not been tested in previous applications and one
of the questions was changed to represent the new intended subjects, reliability was tested
in this study. The reliability test of the PBS was among a heterogeneous group of 22
professional educators from a comprehensive high school in Kern County, California
who were not subjects in this study. The pilot test was given twice, one week apart with
alternate forms. The data was then organized to align the items and beliefs.
The data was analyzed for its test-retest correlation coefficient of stability
(measures the consistency or stability of the instrument) and equivalence (the consistency
of the items from administration to administration). Coefficients, generally, should be at
least .70 or higher to be deemed ―adequate,‖ and many researchers require a cut-off of .80
for a ―good scale‖ (Garson, 2010; Rudner & Schafer, 2001). The test-retest reliability
coefficient for the PBS was calculated at .94, which is well above acceptable levels.

97
Table 3
Item Mapping of the PBS
Internal consistency measurements that focus on the degree to which the individual
items correlate with each other (or its homogeneity) would not be appropriate as a test of

98
reliability for the PBS since each item is, in essence, two opposing views to which the
subject must select a side or state they do not have one.
Principal Instructional Management Rating Scale
The second instrument used in this study was the Principal Instructional
Management Rating Scale (PIMRS) which was developed by Hallinger (1983). A copy
of the PIMRS is located in Appendix G. Permission to use the instrument was granted by
its creator, Dr. Hallinger, which is located in Appendix B.
The PIMRS assesses principals‘ instructional leadership behaviors through a
Likert-type, 50 item survey containing three dimensions of instructional leadership:
defining the school‘s mission, managing the instructional program, and promoting a
positive school learning climate (Hallinger, 2008). These dimensions were further
delineated into 10 instructional leadership job functions, each of which was measured by
behaviorally anchored items.
Hallinger (1999) outlined the steps taken to construct the scale items for the
PIMRS:
1. First, an extensive analysis of research on the role of the principal as an
instructional manager. The research reviewed was largely based on effective
schools research which students were able to succeed beyond what would be
expected given their socioeconomic background. From this, eleven job
functions were developed which reflect the areas of responsibility of the
principal. Since the initial development of this instrument, the 11th
job

99
function—developing academic standards—was eventually dropped, since most
states have taken over this function as a result of NCLB.
2. Next, expert opinions were derived from district level administrators and school
site principals to generate a list of critical job behaviors within each of the job
functions.
3. The list created from the previous step was then supplemented with research
findings by the author within each of the job functions.
4. This list of critical job related behaviors, containing behavioral statements
concerning the principal‘s role as instructional manager, were rewritten to
describe discrete behaviors for use as questionnaire items.
5. Finally, each of the behavioral statements were adjusted grammatically so it
would fit the following stem and response category of a ―1‖ to ―5‖ response
scale: 1 representing ―almost never‖; 2, ―seldom‖; 3, ―sometimes‖; 4,
―frequently‖; and 5, ―almost always.‖
Content validity was initially established by Hallinger (1999) through a panel of
three principals and one vice principal who had not been involved in the procedures to
generate the job behaviors. A minimum average agreement of 80% among the group was
set. Each panel member was asked to assign each item to the category in which they felt
it belonged. If a panel member felt any item did not fit in any of the categories, it was left
unassigned. After the process was complete, the items were reviewed by another
educational management expert. Selected items were discarded to decrease the number of
items in certain categories and the length of the questionnaire overall. Numerous other

100
studies have also tested the PIMRS for face validity, content validity, and discriminant
validity, all to the affirmative (Hallinger, 2008).
Concerning the reliability of the PIMRS, all ten subscales‘ alpha coefficients fell
within a low of .78 to a high of .90 using Cronbach‘s test of internal consistency, or
homogeneity (Hallinger, 1999). The reliability of the PIMRS instrument as a whole was
not measured since the individual subscales were developed to represent related but
discrete job functions (Hallinger, 1999). The reliability coefficients of the 10 subscales of
the PIMRS were further tested using the data collected in this study. The alpha
coefficients fell within a low of .56 to a high of .79. Table 4 contains the reliability
coefficients for the subscales of the PIMRS using the Cronbach‘s Alpha.
There is a possible explanation for the lower coefficients obtained from this study‘s
data. The more homogeneous the group was in regards to the trait being measured, the
lower the reliability coefficient will be (Ary et al., 2006). Hallinger‘s (1999) data was
derived from more numerous and heterogeneous subjects, such as principals and teachers,
while this study was limited to specific principals at specific educational sites.
Regardless of the difference in reliability coefficients, modest coefficients in the
range of .50 to .70 are generally still considered valid when the variable being measured
is difficult to obtain such as in measuring personalities, aptitudes, and behaviors, as in the
PIMRS (Avry et al., 2006). The PIMRS has been proven valid and reliable over the past
25 years and has been used in well over 125 studies reported since the early 1980s
(Hallinger, 2008; Leithwood, 2005).

101
Table 4
Reliability Estimates for the PIMRS Subscales
As previously mentioned in the creation of the PIMRS, the instrument is scored on
a Likert-type scale of one to five for each five individual items within the 10 instructional
leadership subscales indicating the frequency with which the specific behavior is
practiced by the subject. For each five items within the 10 subscales a number one
represents ―almost never;‖ a number two represents ―seldom,‖ a number three represents
―sometimes;‖ a number four represents ―frequently;‖ and a number five represents
―almost always.‖ For each variable group of respondents, the mean is calculated for each

102
item within a subscale along with the grand mean (the mean of means) of all five items
within a specific subscale.
Data Analysis Procedures
Microsoft Excel and PASW Statistics 18.0 software were used to organize and
analyze the data. The data were specifically analyzed using descriptive and inferential
statistics. Research questions one and two were analyzed through descriptive statistics
such as measures of central tendency and measures of dispersion. Since research
questions 3 through 18 asked if there were differences between the multiple dependent
variables obtained from each survey instrument and one independent variable, a
MANOVA was the ideal statistical analysis of choice to test the null hypotheses. The
MANOVA statistic can find a significant main effect in combinations of dependent
variables, which an individual ANOVA would not detect. MANOVA also takes into
account any intercorrelations among the dependent variables (Afifi, Clark, & May, 2004;
Boslaugh & Watters, 2008). The relatively small volunteer sample size and unequal sizes
of the independent variable groups in this study are two particular violations of
MANOVA assumptions which could not be overlooked, thus, disqualified its use in this
study (Afifi, Clark, & May, 2004).
A factorial ANOVA, which analyzes the combined effect of two or more different
independent factors on a dependent variable, was not utilized in this study either. As
noted before, this study set out to initially describe what effective principals in California
believe, how they behave in regards to pedagogy and instructional leadership, and the
causes and comparisons of those beliefs and behaviors to eight demographic variables,

103
respectively. Analyzing interactions between independent variables would be beyond the
scope of the stated research questions and will be left for future research with narrow
focused independent variables.
Therefore, the statistical analysis employed is this study for research questions 3
though 18 was a separate one-way ANOVA for each dependent variable to each
independent variable. The one-way ANOVA measured the amount of the total variability
of the dependent variables of the principals from the 10 job functions of the PIMRS and
the 14 belief preference questions on the PBS, which can be attributed to the differences
and the eight different demographic categories (independent variables). The ANOVA
does have a few advantages over the MANOVA, despite the limitations mentioned
above, in that is can be difficult to determine the impact of the independent variable to a
single dependent variable with a MANOVA. Further, the ANOVA is more robust in the
violation of its assumptions (Boslaugh & Watters, 2008; Rea & Parker, 2005). After
conducting the ANOVAs, if significant differences were found at p < .05, post hoc
analyses were conducted to discover which particular means differed significantly at p <
.05.
Since this study is descriptive and causal-comparative/ex-post facto in nature and
the researcher had no control over the variation in demographic independent variables or
the relatively small population of principals who met the study criteria, a priori power
testing was not conducted, and the entire population of effective principals were asked to
participate as mentioned previously. Post hoc power analysis, in particular, observed
power, which is used in detecting Type II errors, was also not calculated in this study.

104
According to Colgave and Ruxton (2002), Hoenig and Heisey (2001), Zumbo and Hubley
(1998), and Levine and Ensom (2001), the calculated p value and the ß values have a
one-to-one correspondence in a given statistical test. Therefore, if one already has the p
value calculated, ß provides no further information and is deemed meaningless. This
point stated another way, ―Computing the observed power after observing the p value
should cause nothing to change about our interpretation of the p value…Higher observed
power does not imply stronger evidence for a null hypothesis that in not rejected‖
(Hoenig & Heisey, p. 20-21). The American Psychological Association (2010) suggests
using ―confidence intervals to justify conclusions concerning effect size‖ (p. 31).
Summary
This mixed methods descriptive and causal-comparative study is based on
descriptive and inferential statistical analysis of 36 effective California high school
principals‘ responses on eight specific demographic questions; the 50 item PIMRS
Likert-type survey, which looks at principals self-reported instructional leadership
behaviors; and the PBS, a survey on a bipolar adjective scale which asked principals to
select their beliefs of different pedagogical practices, in line with either constructivist or
instructivist beliefs.
For this study, ―effective‖ principals were defined as those whose schools have met
or exceeded the overall API growth targets and growth targets for the subgroups of
socioeconomically disadvantaged and English learner students in the school years of
2007-2008 and 2008-2009. The population in this study was also limited to principals
who had been employed at their current site for a minimum of three years since the

105
assumption is made that their instructional leadership had an effect on their schools‘
achievement.
As noted, demographic information was gathered and statistically analyzed for
significant differences between the data gathered from the survey instruments: the
principals‘ gender, ethnicity, educational level, overall years as an administrator, years as
principal at their current location, years as a classroom teacher and subject taught, and the
extent of instructional leadership delegated to others. The next chapter presents the
results obtained from these methods.

106
CHAPTER FOUR: FINDINGS
As stated in chapter one, in the current climate of high-stakes testing and
accountability, this mixed methods descriptive and causal-comparative study examined
the instructional leadership behaviors and the pedagogical beliefs of principals. In
particular, this study analyzed the self-reported behaviors and beliefs of effective
California high school principals with significant student populations of
socioeconomically disadvantaged and English learners and eight specific demographic
variables. This chapter is organized in terms of the 18 specific research questions posed
in chapter one. First, the 36 volunteer subjects‘ descriptive demographic statistics will be
reported. Then, descriptive and inferential statistical analysis of the research questions
and null hypotheses will follow.
Demographic Information
Ninety high schools in the state of California met this study‘s requirement of
possessing a significant student population of socio-economically disadvantaged and
English learners which met or exceeded their API growth targets schoolwide and for
these two mentioned subgroups. Of the 90 high schools, 71 schools had principals who
have been the site principal for a minimum of three years. These 71 principals of
effective high schools comprise the population of this study and all were invited to
participate. Forty-one (56%) surveys were returned, from which 36 data sets were
deemed usable and therefore established the volunteer rate of 51% (N = 36).
The first section of the questionnaire contained eight demographic questions which
established the independent variables of this study. The eight demographic questions
107
were concerning the subjects‘ (a) gender, (b) ethnicity, (c) highest level of education
obtained, (d) number of years as a classroom teacher, (e) primary subject taught as a
classroom teacher, (f) number of years as the current site principal, (g) total overall years
as an administrator, and (h) the percentage of instructional leadership delegated to others
and to whom.
Tables 5 through 8 contain the frequencies and percentages of the responses in each
demographic category. As displayed in Table 5, two-thirds of the subjects were male
while one-third of them were female. Along similar lines, Caucasian (66.7%) was the
dominate ethnicity, while most of the rest were Hispanic (30.6%). Thirty (83%) of the
subjects had master degrees while 6 (about 17%) had earned doctorate degrees. There
were no subjects with just a bachelor degree or who possessed an education specialist
degree.
When asked about the number of years as a classroom teacher, the majority of
subjects fell in the 6 to 12 year range (58%) with a mean at 9.3 years of teaching
experience. Ten (28%) of the subjects were classroom teachers for five years or less, and
14% had extensive experience at over 20 years. Most subjects were teachers of core
subjects (72.3%) such as mathematics, science, English language arts, and social science.
Out of those core subjects, social science (30.6%) and English language arts (25%) were
the two most common. Table 6 provides the frequencies and percentages of this data. For
the purpose of further inferential statistical analysis, all subjects taught with a frequency
of one have been combined into an ―other‖ category.

108
Table 5
Frequency of Principals’ Gender, Ethnicity, and Highest Education
Demographic Ind. Variable F %
Gender Female 12 33.3
Male 24 66.7
Total 36 100
Ethnicity African-American 0 0
Asian-American 0 0
Caucasian 24 66.7
Hispanic 11 30.6
Other 1 2.8
Total 36 100
Highest Education B.A./B.S. 0 0
M.A./M.S./M.Ed. 30 83.3
Ed.S. 0 0
Ph.D./Ed.D. 6 16.7
Total 36 100

109
Table 6
Frequency of Years as a Classroom Teacher and Primary Subject Taught
Demographic Ind. Variable f %
Years as a Classroom
Teacher
0-5 years 10 27.8
6-12 years 21 58.3
13-19 years 0 0
20 ≤ years 5 13.9
M = 9.3 Total 36 100
Primary Subject Taught Career/Tech. Ed. 1 2.8
English Language Arts 9 25.0
English Second Language 2 5.6
Elementary (K-6) Ed. 3 8.3
Mathematics 4 11.1
Physical Education 2 5.6
Science 2 5.6
Social Science 11 30.6
Foreign Language 1 2.8
Special Education 1 2.8
Total 36 100
Table 7 provides frequencies and percentages of the number of years the subjects
have been principals at their current sites and the overall number of years they have been
employed as administrators. The majority of subjects (58.3%) have been at their current
site for three to four years with the mean at just over 4 years. Only 13.9% of subjects fell
in the seven plus year range. In regards to overall administration experience, the subjects
were more diverse with 41.7% at three to 10 years, 30.6% at 11 to 15 years, and 19.4% at
16 to 20 years. The mean for overall years of administration experience was 12.8 years.

110
Table 7
Frequency of Years as Current Principal and Overall Years in Administration
Demographic Ind. Variable f %
Principal at Current Site 3-4 years 21 58.3
5-6 years 10 27.8
7-8 years 4 11.1
9 ≤ years 1 2.8
M = 4.5 Total 36 100
Overall Years in Admin. 3-10 years 15 41.7
11-15 years 11 30.6
16-20 years 7 19.4
21 ≤ years 3 8.3
M = 12.8 Total 36 100
The final demographic question asked subjects to provide the percentage (0-100%)
they delegate their instructional leadership responsibilities to others at their site.
Instructional leadership was defined for them as educational leadership which focuses on
the technical core responsibilities of schools, namely teaching and learning, by defining
the school‘s mission, managing the instructional program, and promoting a positive
school learning climate. The subjects were free to fill in their percentage of instructional
leadership delegation for the following positions: teacher leaders, department chairs,
assistant principals, curriculum directors, and other with the ability to fill in what the
other stands for.
In organizing the data obtained from this question, the assumption was made that if
the percentage of instructional leadership delegated did not add up to 100%, the
remaining percentage of instructional leadership was therefore retained by the principal.
111
Several subjects noted instructional coaches, which were combined with the category of
teacher leaders in this study. The judgment was made that an instructional coach is
usually a non-administrative position, whereas the category of curriculum directors often
serves the same function but is an administrator. The distinction between administrative
and teacher positions is important, since California public schools have a strong union
system and collective bargaining rights, which affects what teachers and administrators
can and cannot do (Myslinski, 2009).
The data obtained from this question was further categorized into four distinct
percentage ranges for easier statistical treatment. The means, frequencies, and
percentages of each category are provided in Table 8. Overall, most subjects kept their
instructional leadership responsibilities within the ranks of administration. The mean of
instructional leadership retained by the principal was 44%, and the mean of delegation to
an assistant principal was 23%. Regarding the use of curriculum directors, 88.9% (0-5%
category) of subjects stated they used them rarely if at all.
The mean for delegating instructional leadership to teachers or instructional
coaches was 14%. A little over 58% of the subjects delegated to teachers or instructional
coaches 0 to 15%, while 30.6% did it 16 to 30%. Delegation to department chairs was a
little less than teachers or instructional coaches with a mean delegation at 13%. Some
other categories were mentioned with 91.7% of subjects delegating to them 0 to 15% (M
= 4%) of the time. These other categories mentioned were overall informal collaborative
environment, professional development activities, counselors/student services, and
parents/community members.

112
Table 8
Frequency of Percentages of Instructional Leadership Delegated
Ind. Variable Ranges f %
Teaches/Instructional Coaches 0-15% 21 58.3
16-30% 11 30.6
31-45% 3 8.3
46-60% 1 2.8
M = 14% Total 36 100
Department Chairs 0-15% 24 66.7
16-30% 7 19.4
31-45% 4 11.1
46-60% 1 2.8
M = 13% Total 36 100
Assistant Principals 0-15% 11 30.6
16-30% 15 41.7
31-45% 5 13.9
46-60% 5 13.9
M = 23% Total 36 100
Curriculum Directors 0-5% 32 88.9
6-10% 2 5.6
11-15% 1 2.8
16-20% 1 2.8
M = 2% Total 36 100
Retained by Principal 0-25% 12 33.3
26-50% 8 22.2
51-75% 11 30.6
75-100% 5 13.9
M = 44% Total 36 100
Other 0-15% 33 91.7
16-30% 1 2.8
31-45% 1 2.8
46-60% 1 2.8
M = 4% Total 36 100
Note. ―Other‖ is collaborative environment, professional development,
counselors/student services, and parents/community.

113
The demographic variable of the percentage of delegation of instructional
leadership responsibilities of the subjects was further simplified and modified for further
statistical analysis as subjects who delegate or retain their instructional leadership in the
administration ranks (51% or higher, n = 24) and those subjects who are balanced in their
delegation between administration and teachers (50% or lower, n = 12).
Research Question One
Research question one states,
1RQ What are effective high school principals‘ perceptions of their own
instructional leadership behaviors in the following 10 dimensions as
measured by the Principal Instructional Management Rating Scale:
framing the school‘s goals, communicating the school‘s goals,
coordinating the curriculum, supervising and evaluating instruction,
monitoring student progress, protecting instructional time, providing
incentives for teachers, providing incentives for learning, promoting
professional development, and maintaining high visibility?
This question was answered through descriptive statistical analysis of the subjects‘
(N = 36) responses on the PIMRS. Tables 10 through 20 will present the grand mean and
standard deviation for each of the 10 job functions and the mean and standard deviation
for each of the five behaviors associated with the specific job function.
Table 9 reveals the means and standard deviations of the first job function, framing
the school goals. Overall and for each of the five associated behaviors, the subjects were
frequently engaged in the behavior of framing the school goals. Falling in the low end of

114
being ―frequently‖ engaged with the largest standard deviation was question three
regarding using needs assessments or other methods to get staff input on goal
development (M = 4.17, SD = 0.94). Questions one and four were in the high end of
―frequently‖ engaged (M = 4.81, SD = 0.40; M = 4.81, SD = 0.40), which are associated
with establishing annual school-wide goals and using data on student performance to
develop academic goals.
Table 9
Descriptive Statistics for Job Function I: Frame the School Goals
Principal Instructional Leadership Behaviors N M SD
I. Frame the School Goals 36 4.53 0.40
1. Develop a focused set of annual school-wide goals 36 4.81 0.40
2. Frame the school‘s goals in terms of staff
responsibilities for meeting them
36 4.31 0.67
3. Use needs assessment or other formal and informal
methods to secure staff input on goal development
36 4.17 0.94
4. Use data on student performance when developing
the school‘s academic goals
36 4.81 0.40
5. Develop goals that are easily understood and used by
teachers in the school
36 4.58 0.60
The second job function‘s (communicating the school goals) means and standard
deviations are located in Table 10. The mean of this job function was in the ―frequently‖
range (M = 4.23, SD = 0.49). The highest mean out of the five association behaviors was
discussing the school‘s academic goals with teachers at faculty meetings (M = 4.72, SD =
0.45). The subjects less frequently (M = 3.72, SD = 1.03) communicated those goals
through posted media or to students directly (M = 3.94, SD = 1.04).

115
As displayed in Table 11, the mean was in the ―frequently‖ range (M = 4.29, SD =
0.44) for supervise and evaluate instruction. One behavior within this function which
subjects only ―sometimes‖ did was to use student work in evaluating classroom
instruction (M = 3.60, SD = 0.87). Well within the ―frequently‖ range were all other
behaviors in this job function with pointing out specific strengths in teacher‘s
instructional practices in post-observation feedback, receiving the highest mean of 4.67
(SD = 0.54).
Table 10
Descriptive Statistics for Job Function II: Communicate the School Goals
Principal Instructional Leadership Behaviors N M SD
II. Communicate the School Goals 36 4.23 0.50
6. Communicate the school‘s mission effectively to
members of the school community
36 4.19 0.62
7. Discuss the school‘s academic goals with teachers
at faculty meetings
36 4.72 0.45
8. Refer to the school‘s academic goals when making
curricular decisions with teachers
36 4.56 0.61
9. Ensure that the school‘s academic goals are
reflected in highly visible displays in the school (e.g.,
posters or bulletin boards emphasizing academic
progress)
36 3.72 1.03
10. Refer to the school‘s academic goals or mission in
forums with students (e.g., in assemblies or
discussions)
36 3.94 1.04

116
Table 11
Descriptive Statistics for Job Function III: Supervise & Evaluate Instruction
Principal Instructional Leadership Behaviors N M SD
III. Supervise & Evaluate Instruction 36 4.29 0.44
11. Ensure that the classroom priorities of teachers are
consistent with the goals and direction of the school
36 4.39 0.65
12. Review student work products when evaluating
classroom instruction
36 3.61 0.87
13. Conduct informal observations in classrooms on a
regular basis (informal observations are unscheduled,
last at least 5 minutes, and may or may not involve
written feedback or a formal conference)
36 4.42 0.81
14. Point out specific strengths in teacher‘s
instructional practices in post-observation feedback
(e.g., in conferences or written evaluations)
36 4.67 0.54
15. Point out specific weaknesses in teacher‘s
instructional practices in post-observation feedback
(e.g., in conferences or written evaluations)
36 4.36 0.76
Regarding the job function of coordinating the curriculum, a mean was also in the
―frequently‖ engaged range (M = 4.21, SD = 0.43). The highest behavior mean for this
job function was 4.75 with a standard deviation of 0.44 for drawing upon school-wide
testing results when making curricular decisions. The area where the subjects had the
lowest mean in the ―sometimes‖ engaged range was in the behavior of participating
actively in the review of curricular materials (M = 3.61, SD = 0.76). This job function and
its associated behaviors means and standard deviations can be found in Table 12.

117
Table 12
Descriptive Statistics for Job Function IV: Coordinate the Curriculum
Principal Instructional Leadership Behaviors N M SD
IV. Coordinate the Curriculum 36 4.21 0.43
16. Make clear who is responsible for coordinating the
curriculum across grade levels (e.g., the principal, vice
principal, or teacher-leaders)
36 4.36 0.64
17. Draw upon the results of school-wide testing when
making curricular decisions
36 4.75 0.44
18. Monitor the classroom curriculum to see that it
covers the school‘s curricular objectives
36 4.06 0.67
19. Assess the overlap between the school‘s curricular
objectives and the school‘s achievement tests
36 4.28 0.70
20. Participate actively in the review of curricular
materials
36 3.61 0.77
Table 13 provides the means and standard deviations for the job function of
monitoring student progress with its five associated behaviors. All behavior means and
the mean overall fell within the range of ―frequently.‖ The one exception was the
behavior of meeting individually with teachers to discuss student progress, with the mean
in the ―sometimes‖ range (M = 3.58, SD = 1.0).
Concerning the job function and associated behaviors for protecting instructional
time, Table 14 provides the means and standard deviations. The mean and standard
deviation for this job function fell at the low end of ―frequently‖ (M = 4.03, SD = 0.43).
The subjects‘ means all fell within the ―frequently‖ range for protecting instructional time
in regards to limiting public address announcements, procedures for tardy or truant
students, and encouraging teachers to use instructional time for its intended purpose.
There were two exceptions, namely, ensuring students are not called to the office during

118
instructional time (M = 3.22, SD = 0.70) and limiting the intrusion of extra- or co-
curricular activities on instructional time (M = 3.8, SD = 0.56).
Table 13
Descriptive Statistics for Job Function V: Monitor Student Progress
Principal Instructional Leadership Behaviors N M SD
V. Monitor Student Progress 36 4.22 0.56
21. Meet individually with teachers to discuss student
progress
36 3.58 1.00
22. Discuss academic performance results with the
faculty to identify curricular strengths and weaknesses
36 4.25 0.77
23. Use tests and other performance measures to
assess progress toward school goals
36 4.50 0.61
24. Inform teachers of the school‘s performance
results in written form (e.g., in a memo or newsletter)
36 4.44 0.94
25. Inform students of school‘s academic progress 36 4.31 0.67
Table 14
Descriptive Statistics for Job Function VI: Protect Instructional Time
Principal Instructional Leadership Behaviors N M SD
VI. Protect Instructional Time 36 4.03 0.43
26. Limit interruptions of instructional time by public
address announcements
36 4.25 0.69
27. Ensure that students are not called to the office
during instructional time
36 3.22 0.70
28. Ensure that tardy and truant students suffer
specific consequences for missing instructional time
36 4.22 0.76
29. Encourage teachers to use instructional time for
teaching and practicing new skills and concepts
36 4.61 0.49
30. Limit the intrusion of extra- and co-curricular
activities on instructional time
36 3.83 0.56
The job function of maintaining high visibility and its associated five behaviors are
located in Table 15. This job function fell in the range of ―sometimes‖ (M = 3.83, SD =

119
0.55). Two of the three behaviors dealing with hands-on, direct contact with students
(behaviors 34 and 35) fell in the ―seldom‖ and ―sometimes‖ range. The subjects had the
highest means in the behavior of attending or participating in extra- and co-curricular
activities (M = 4.69, SD = 0.47) and in taking time to talk informally with students and
teachers during breaks and recess (M = 4.58, SD = 0.55).
Table 15
Descriptive Statistics for Job Function VII: Maintain High Visibility
Principal Instructional Leadership Behaviors N M SD
VII. Maintain High Visibility 36 3.83 0.55
31. Take time to talk informally with students and
teachers during recess and breaks
36 4.58 0.55
32. Visit classrooms to discuss school issues with
teachers and students
36 4.19 0.89
33. Attend/participate in extra- and co-curricular
activities
36 4.69 0.47
34. Cover classes for teachers until a late or substitute
teacher arrives
36 3.33 1.29
35. Tutor students or provide direct instruction to
classes
36 2.36 1.07
The means and standard deviations for the job function and associated behaviors of
providing incentives for teachers in located in Table 16. The subjects tended to only
―sometimes‖ or ―seldom‖ award teachers in a formal way by acknowledging teachers‘
exceptional performance by writing memos for their personnel file (M = 2.94, SD =
1.29), create professional growth opportunities for teachers as a reward for special
contributions to the school (M = 3.28, SD = 1.34), and reward special efforts of teachers
with opportunities for professional recognition (M = 3.97, SD = 1.03). The subjects had

120
much higher means in regards to informal incentives such as complimenting teachers
privately for their efforts or performance (M = 4.75, SD = 0.44).
Table 16
Descriptive Statistics for Job Function VIII: Provide Incentives for Teachers
Principal Instructional Leadership Behaviors N M SD
VIII. Provide Incentives for Teachers 36 3.83 0.64
36. Reinforce superior performance by teachers in
staff meetings, newsletters, and/or memos
36 4.22 0.68
37. Compliment teachers privately for their efforts or
performance
36 4.75 0.44
38. Acknowledge teachers‘ exceptional performance
by writing memos for their personnel file
36 2.94 1.29
39. Reward special efforts by teachers with
opportunities for professional recognition
36 3.97 1.03
40. Create professional growth opportunities for
teachers as a reward for special contributions to the
school
36 3.28 1.34
Table 17 provides the means and standard deviations for the job function and five
associated behaviors of promoting professional development. The behaviors all fell
within a mean of 3.81 to 4.56 with a job function mean of 4.26 (SD = 0.57) in the
―frequently‖ range.
The last job function and its associated behaviors are providing incentives for
learning. Table 18 provides the means and standard deviations for this job function and
associated behaviors. This job function had a mean of 3.85 (SD = 0.77), which falls in the
―sometimes‖ to ―frequently‖ range. The area which had the lowest mean, but a relatively
large standard deviation, was contacting parents to communicate improved or exemplary
student performance or contributions (M = 3.22, SD = 1.20). The behavior with the

121
highest mean (M = 4.53, SD = 0.85) was recognizing students who do superior work with
formal recognition such as an honor roll.
Table 17
Descriptive Statistics for Job Function IX: Promote Professional Development
Principal Instructional Leadership Behaviors N M SD
IX. Promote Professional Development 36 4.26 0.57
41. Ensure that inservice activities attended by staff
are consistent with the school‘s goals
36 4.56 0.70
42. Actively support the use in the classroom of skills
acquired during inservice training
36 4.22 0.72
43. Obtain the participation of the whole staff in
important inservice activities
36 4.19 0.95
44. Lead or attend teacher inservice activities
concerned with instruction
36 4.50 0.74
45. Set aside time at faculty meetings for teachers to
share ideas or information from inservice activities
36 3.81 1.01
Table 18
Descriptive Statistics for Job Function X: Provide Incentives for Learning
Principal Instructional Leadership Behaviors N M SD
X. Provide Incentives for Learning 36 3.85 0.77
46. Recognize students who do superior work with
formal rewards such as honor roll or mention in the
principal‘s newsletter
36 4.53 0.85
47. Use assemblies to honor students for academic
accomplishments or for behavior or citizenship
36 4.00 1.10
48. Recognize superior student achievement or
improvement by seeing in the office the students with
their work
36 3.47 1.25
49. Contact parents to communicate improved or
exemplary student performance or contributions
36 3.22 1.20
50. Support teachers actively in their recognition
and/or reward of student contributions to and
accomplishments in class
36 4.03 0.77

122
In conclusion, Table 19 provides an overview of the grand means and standard
deviations for the ten instructional leadership job functions. The subjects performed the
following job functions ―frequently‖: framing the school goals, communicating the
school goals, supervising and evaluating instruction, coordinating the curriculum,
monitoring student progress, protecting instructional time, and promoting professional
development. Three of the job functions were found to be performed within the
―sometimes‖ range, but well within one standard deviation from the ―frequently‖ range,
namely maintaining high visibility, providing incentives for teachers, and providing
incentives for learning.
Table 19
Descriptive Statistics for the Principal Instructional Leadership Job Functions
Principal Instructional Leadership Behaviors N M SD
I. Frame the School Goals 36 4.53 0.40
II. Communicate the School Goals 36 4.23 0.50
III. Supervise & Evaluate Instruction 36 4.29 0.44
IV. Coordinate the Curriculum 36 4.21 0.43
V. Monitor Student Progress 36 4.22 0.56
VI. Protect Instructional Time 36 4.03 0.43
VII. Maintain High Visibility 36 3.83 0.55
VIII. Provide Incentives for Teachers 36 3.83 0.64
IX. Promote Professional Development 36 4.26 0.57
X. Provide Incentives for Learning 36 3.85 0.77

123
Research Question Two
Research question two states,
2RQ What are effective high school principals‘ beliefs of good pedagogical
practice with a preference of either an instructivist or constructivist
dimension as measured on the Principal Beliefs Survey?
This question was answered through descriptive statistical analysis of the subjects‘
(N = 36) responses on the PBS which uses a forced choice continuum survey structure.
The PBS asked subjects to choose the extent of their belief on 14 questions, each
containing opposing views on an issue, relating to specific beliefs that generally fall in a
constructivist or instructivist belief system. Subjects also had the option of stating they
were balanced or undecided between the opposing beliefs.
Before the data obtained from the subjects‘ responses were analyzed, the item
stems were rearranged and aligned so all statements which are philosophically consistent
with constructivism were given the value of one or two, and the statements consistent
with instructivism were given the numerical value of four or five. Table 20 displays the
percent agreement with each position or if they were ―balanced‖ or ―undecided‖ by
circling the number ―three,‖ along with the mean and standard deviation. For most items,
about one-third (M = 31.34%, SD = 16.68) of the subjects indicated they were balanced
or undecided.
Three questions revealed a strong consensus among subjects of 75% or more. The
largest agreement of 80.6% (M = 4.11, SD = 0.95) was concerning the belief that
following a prescriptive, well-designed curriculum provides the best opportunity for

124
effective instruction. The next consensus was 77.8% (M = 4.11, SD = 1.06) of subjects
agreed in the belief that all children can become functionally literate and mathematically
competent (excluding those with severe disabilities). Seventy-five percent (M = 2.11, SD
= 1.14) of subjects believed individual learning styles should be an important factor in
deciding how and what is taught.
Table 20
Agreement with Beliefs, Means and Standard Deviations for All Principals

125
The three following questions revealed the subjects‘ strong agreement in the range
of 50.0% to 66.7%. Small class size is not the primary factor leading to higher academic
achievement was the belief of 66.7% (M = 3.67, SD = 1.17) of the subjects. Along a
similar percentage, 66.6% (M = 2.39, SD = 1.18) of subjects believe an eclectic or
balanced approach to instruction is best. Finally, 50.0% (M = 2.56, SD = 1.16) of subjects
believed teachers should facilitate learning rather than teach directly.
Subjects‘ beliefs regarding the other eight questions were more diverse. Regarding
pedagogical issues, 36.1% (M = 3.14, SD = 1.20) of the subjects believed systematic and
direct teaching is best to ensure success for all students in obtaining critical skills and
concepts, while 41.7% were balanced between this belief and providing authentic
learning experiences. Concerning the belief that conceptual understanding and critical
thinking should be emphasized even when students lack proficiency in basic skills or
factual knowledge, 41.7% (M = 2.70, SD = 1.12) of subjects agreed. Modeling and
guided practice, followed by practice and review, was believed as best by 33.4% (M =
3.22, SD = 1.10) of subjects. Concerning related issues, 36.1% (M = 3.39, SD = 1.17) of
subjects believed achievement impacts self-esteem, while 55.6% of the subjects were
balanced between this belief and the opposite, that self-esteem impacts achievement.
Regarding ability grouping of students being good or bad, 47.2% of the subjects were
balanced between the belief, while 27.8% (M = 2.83, SD = 0.97) of subjects believed
ability grouping was harmful.
The last category of questions was based on professional issues which dealt with
teacher accountability and professional development. The belief that great teachers

126
produce high achievement found 41.6% (M = 3.42, SD = 1.16) of subjects in agreement.
Regarding the view that education and training was better than experience, 30.5% (M =
3.14, SD = 1.02) of subjects agreed. Last, 36.1% (M = 3.14, SD = 1.02) of subjects
believed scientifically conducted research is the best guide for determining what and how
to teach.
Concerning research question two, what are effective high school principals‘
beliefs of good pedagogical practice with a preference of either an instructivist or
constructivist dimension as measured on the Principal Beliefs Survey? Overall, in nine of
the 14 questions, the mean sided with the instructivist view. Concerning professional
issues dealing with teacher accountability and professional development, the researcher
concluded that a majority of subjects had an instructivist belief with a mean of 3.45. The
subjects‘ beliefs about pedagogical issues and related issues (practices or beliefs not
generally backed scientifically or have mixed results) were mixed with means of 3.14 and
2.88 respectfully.
Research Question Three
Research question three states,
3RQ Are there significant differences in high school principals‘ perceptions of
their own instructional leadership behaviors as measured by the 10
Principal Instructional Management Rating Scale dimensions based on the
principals‘ gender?
0H 3.1 through 3.10 There are no statistically significant differences in
effective high school principals‘ perceptions of their own

127
instructional leadership behaviors as measured by the 10 Principal
Instructional Management Rating Scale dimensions based on the
principals‘ gender.
To answer research question three, the null hypotheses were tested using a one-
way ANOVA, which investigates the differences of the independent variable (IV) of
gender (male or female) to each of the 10 job functions of the PIMRS individually.
ANOVA assumptions, such as homogeneity of variances, have been met unless otherwise
noted in the findings presented below. Descriptive statistics disaggregated by the IV of
gender, either male (n = 24) or female (n = 12), are shown in Appendix J, Table J1.
One-way ANOVA significance levels were set at p < .05, with the following
results presented for each of the 10 PIMRS job functions serving as the dependent
variables: 0H 3.1, Frame the School Goals, F(1, 34) = 0.27, p = .606, 2 = .008; 0H 3.2,
Communicate the School Goals, F(1, 34) = 0.22, p = .641, 2 = .006; 0H 3.3, Supervise
and Evaluate Instruction, F(1, 34) = 0.07, p = .794, 2 =.002; 0H 3.4, Coordinate the
Curriculum, F(1, 34) = 0.05, p = .830, 2 = .001; 0H 3.5, Monitor Student Progress, F(1,
34) = 0.06, p = .805, 2 = .002; 0H 3.6, Protect Instructional Time, F(1, 34) = 0.15, p =
.704, 2 = .004; 0H 3.7, Maintain High Visibility, F(1, 34) = 0.02, p = .899, 2 = .000;
0H 3.8, Provide Incentives for Teachers, F(1, 34) = 0.78, p = .385, 2 = .022; 0H 3.9,
Promote Professional Development, F(1, 34) = 0.38, p = .571, 2 = .010; and 0H 3.10,
Provide Incentives for Learning, F(1, 34) = 0.53, p = .472, 2 = .015. Based on these
results, the evidence was insufficient to reject all 10 null hypotheses.

128
Research Question Four
Research questions four states,
4RQ Are there significant differences in high school principals‘ perceptions of
their own instructional leadership behaviors as measured by the 10
Principal Instructional Management Rating Scale dimensions based on the
principals‘ ethnicity?
0H 4.1 through 4.10 There are no statistically significant differences in
effective high school principals‘ perceptions of their own
instructional leadership behaviors, as measured by the 10 Principal
Instructional Management Rating Scale dimensions based on the
principals‘ ethnicity.
To answer Research Question Four, the null hypotheses were tested using a one-
way ANOVA, which investigates the differences of the IV of ethnicity (Caucasian or
Hispanic) to each of the 10 job functions of the PIMRS individually. ANOVA
assumptions, such as homogeneity of variances, have been met unless otherwise noted in
the findings presented below. Descriptive statistics disaggregated by the IV of ethnicity,
either Caucasian (n = 24) or Hispanic (n = 11), are shown in Appendix J, Table J2.
One-way ANOVA significance levels were set at p < .05, with the following results
presented for each of the 10 PIMRS job functions serving as the DV‘s: 0H 4.1, Frame the
School Goals, F(2, 33) = 2.619, p = .088, 2 = .137; 0H 4.2, Communicate the School
Goals, F(2, 33) = 0.405, p = .670, 2 = .024; 0H 4.3, Supervise and Evaluate Instruction,
F(2, 33) = 0.033, p = .967, 2 = .002; 0H 4.4, Coordinate the Curriculum, F(2, 33) =

129
0.130, p = .879, 2 = .008; 0H 4.5, Monitor Student Progress, F(2, 33) = 2.066, p = .143,
2 = .111; 0H 4.6, Protect Instructional Time, F(2, 33) = 0.296, p = .746, 2 = .018;
0H 4.7, Maintain High Visibility, F(2, 33) = 0.330, p = .721, 2 = .020; 0H 4.8, Provide
Incentives for Teachers, F(2, 33) = 1.032, p = .367, 2 = .059; 0H 4.9, Promote
Professional Development, F(2, 33) = 0.109, p = .897, 2 =.007, and 0H 4.10, Provide
Incentives for Learning, F(2, 33) = 0.388, p = .682, 2 = .023. Based on these results, the
evidence was insufficient to reject all 10 null hypotheses.
Research Question Five
Research question five states,
5RQ Are there significant differences in high school principals‘ perceptions of
their own instructional leadership behaviors as measured by the 10
Principal Instructional Management Rating Scale dimensions based on the
principals‘ educational level?
0H 5.1 through 5.10 There are no statistically significant differences in
effective high school principals‘ perceptions of their own
instructional leadership behaviors as measured by the 10 Principal
Instructional Management Rating Scale dimensions based on the
principals‘ educational level.
To answer research question five, the null hypotheses were tested using a one-way
ANOVA, which investigates the differences of the IV of highest education obtained
(Masters or Doctorate Degree) to each of the 10 job functions of the PIMRS individually.
ANOVA assumptions, such as homogeneity of variances, have been met unless otherwise

130
noted in the findings presented below. Descriptive statistics disaggregated by the IV of
highest education level, either masters degree (n = 30) or doctorate degree (n = 6), are
shown in Appendix J, Table J3.
One-way ANOVA significance levels were set at p < .05, with the following results
presented for each of the 10 PIMRS job functions serving as the DVs: 0H 5.1, Frame the
School Goals, F(1, 34) = 0.437, p = .513, 2 = .013; 0H 5.2, Communicate the School
Goals, F(1, 34) = 0.150, p = .701, 2 = .004; 0H 5.3, Supervise and Evaluate Instruction,
F(1, 34) = 0.018, p = .895, 2 = .001; 0H 5.4, Coordinate the Curriculum, F(1, 34) =
0.807, p = .375, 2 = .023; 0H 5.5, Monitor Student Progress, F(1, 34) = 1.079, p = .306,
2 =.031; 0H 5.6, Protect Instructional Time, F(1, 34) = 2.857, p = .100, 2 =.078;
0H 5.7, Maintain High Visibility, F(1, 34) = 0.026, p = .873, 2 = .001; 0H 5.8, Provide
Incentives for Teachers, F(1, 34) = 4.873, p = .034, 2 = .125; and 0H 5.10, Provide
Incentives for Learning, F(1, 34) = 0.559, p = .460, 2 = .018. Regarding 0H 5.9, the DV
Promote Professional Development violated the homogeneity of variance assumption of
ANOVA as evident by the Levene‘s test, F(1, 34) = 30.451, p < .001. Therefore, Welch
and Brown-Forsythe F-ratio were reported with the result of F(1, 5.22) = 1.689, p = .247,
2 = .151.
Based on these results, the evidence was insufficient to reject 0H 5.1, 5.2, 5.3, 5.4,
5.5, 5.6, 5.7, 5.9, and 5.10. 0H 5.8, concerning the job function of Providing Incentives
for Teachers (p = .034, p < .05), was found significantly different concerning educational
level. Therefore, this null hypothesis was rejected. Examination of the descriptive

131
statistics in Table 21 shows that subjects with a master degree were more engaged in
providing incentives for teachers then those with doctorate degrees.
Table 21
PIMRS Job Function Found Significantly Different to Education Level
PIMRS Job Function:
Providing Incentives for Teachers
N M (SD) 95% CI
Master Degree 30 3.93(0.62) [3.70, 4.17]
Doctorate Degree 6 3.33(0.53) [2.78, 3.89]
Total 36 3.83(0.64) [3.62, 4.05]
Note. CI = Confidence Interval.
Research Question Six
Research question six states,
6RQ Are there significant differences in high school principals‘ perceptions of
their own instructional leadership behaviors as measured by the 10
Principal Instructional Management Rating Scale dimensions based on the
principals‘ overall number of years as an administrator?
0H 6.1 through 6.10 There are no statistically significant differences in
effective high school principals‘ perceptions of their own
instructional leadership behaviors as measured by the 10 Principal
Instructional Management Rating Scale dimensions based on the
principals‘ overall number of years as an administrator.
To answer research question six, the null hypotheses were tested using a one-way
ANOVA, which investigates the differences of the IV of overall years as an administrator
(3-10 years, 11-15 years, 16-20 years, or 21≤ years) to each of the 10 job functions of the
132
PIMRS individually. ANOVA assumptions, such as homogeneity of variances, have been
met unless otherwise noted in the findings presented below. Descriptive statistics
disaggregated by the IV of overall years as an administrator, either 3-10 years (n = 15),
11-15 years (n = 11), 16-20 years (n = 7), or 21 ≤ years (n = 3) are shown in Appendix J,
Table J4.
One-way ANOVA significance levels were set at p < .05, with the following results
presented for each of the 10 PIMRS job functions serving as the DVs: 0H 6.2,
Communicate the School Goals, F(3, 32) = 1.932, p = .144, 2 = .153; 0H 6.3, Supervise
and Evaluate Instruction, F(3, 32) = 1.056, p = .381, 2 = .090; 0H 6.4, Coordinate the
Curriculum, F(3, 32) = 2.184, p = .109, 2 = .170; 0H 6.6, Protect Instructional Time,
F(3, 32) = 0.336, p = .799, 2 = .031; 0H 6.7, Maintain High Visibility, F(3, 32) = 0.382,
p = .767, 2 = .035; 0H 6.8, Provide Incentives for Teachers, F(3, 32) = 0.313, p = .816,
2 = .028; 0H 6.9, Promote Professional Development, F(3, 32) = 1.572, p = .215, 2 =
.128; and 0H 6.10, Provide Incentives for Learning, F(3, 32) = 0.408, p = .748, 2 = .037.
0H 6.1, Frame the School Goals, violated the homogeneity of variance assumption of
ANOVA as evident by the Levene‘s test, F(3, 32) = 5.725, p = .003. Therefore, Welch
and Brown-Forsythe F-ratio were reported with the result of F(3, 12.92) = 5.201, p =
.014, 2 = .180 and F(3, 23.74) = 3.274, p = .039, 2 = .180 respectively. 0H 6.5,
Monitor Student Progress, also violated the homogeneity of variance assumption of
ANOVA as evident by the Levene‘s test, F(3, 32) = 3.094, p = .041. Therefore, Welch
and Brown-Forsythe F-ratio were reported with the result of F(3, 9.787) = 1.647, p =
.242, 2 = .180 and F(3, 26.209) = 2.261, p = .105, 2 = .180 respectively.

133
Based on these results, the evidence was insufficient to reject 0H 6.2, 6.3, 6.4, 6.5,
6.6, 6.7, 6.8, 6.9, and 6.10. 0H 6.1, concerning the job function of Framing the School
Goals, (Welch F-ratio p = .014, Brown-Forsythe F-ratio p = .039, p < .05), was found
significantly different concerning the overall number of years in administration.
Therefore, this null hypothesis was rejected.
Post hoc analysis was conducted to ascertain which particular factors of the IV
were significantly different. Since the variables violated the homogeneity of variance
assumption, Games-Howell post hoc analysis was utilized as it does not assume that
population variances are equal or that the sample sizes are equal. Games-Howell post hoc
comparisons of the four groups indicated that the 20 ≤ years in administration group (M =
4.87, 95% CI [4.58, 5.15]) were significantly more engaged in the behavior of framing
the school goals than the 3-10 years in administration group (M = 4.36, 95% CI [4.10,
4.62]), p = .011. Comparisons between the 11-15 years in administration (M = 4.56, 95%
CI [4.39, 4.74]), 16-20 years in administration (M = 4.71, 95% [4.35, 5.08]), and the
other two groups were not statistically significant at p < .05.
Research Question Seven
Research question seven states,
7RQ Are there significant differences in high school principals‘ perceptions of
their own instructional leadership behaviors as measured by the 10
Principal Instructional Management Rating Scale dimensions based on the
principals‘ number of years as principal at their current location?

134
0H 7.1 through 7.10 There are no statistically significant differences in
effective high school principals‘ perceptions of their own
instructional leadership behaviors as measured by the 10 Principal
Instructional Management Rating Scale dimensions based on the
principals‘ number of years as principal at their current location.
To answer research question seven, the null hypotheses were tested using a one-
way ANOVA, which investigates the differences of the IV of overall years as current
principal (3-4 years, 5-6 years, or 7-8 ≤ years) to each of the 10 job functions of the
PIMRS individually. ANOVA assumptions, such as homogeneity of variances, have been
met unless otherwise noted in the findings presented below. Descriptive statistics
disaggregated by the IV of overall years as current principal, either 3-4 years (n = 21), 5-
6 years (n = 10), or 7-8 ≤ years (n = 5) are shown in Appendix J, Table J5.
One-way ANOVA significance levels were set at p < .05, with the following results
presented for each of the 10 PIMRS job functions serving as the DVs: 0H 7.2,
Communicate the School Goals, F(2, 33) = 2.335, p = .113, 2 = .124; 0H 7.3, Supervise
and Evaluate Instruction, F(2, 33) = 2.685, p = .083, 2 = .140; 0H 7.4, Coordinate the
Curriculum, F(2, 33) = 1.930, p = .161, 2 = .105; 0H 7.6, Protect Instructional Time,
F(2, 33) = 0.527, p = .595, 2 = .031; 0H 7.7, Maintain High Visibility, F(2, 33) = 0.815,
p = .451, 2 = .047; 0H 7.8, Provide Incentives for Teachers, F(2, 33) = 0.417, p = .662,
2 = .025; 0H 7.9, Promote Professional Development, F(2, 33) = 2.573, p = .092, 2 =
.135; and 0H 7.10, Provide Incentives for Learning, F(2, 33) = 0.452, p = .640, 2 = .027.
0H 7.1, Frame the School Goals, violated the homogeneity of variance assumption of

135
ANOVA as evident by the Levene‘s test, F(2, 33) = 6.878, p = .003. Therefore, Welch
and Brown-Forsythe F-ratio were reported with the result of F(2, 19.18) = 11.367, p =
.001, 2 = .124 and F(2, 30.12) = 4.367, p = .022, 2 = .124 respectively. 0H 7.5,
Monitor Student Progress, also violated the homogeneity of variance assumption of
ANOVA as evident by the Levene‘s test, F(2, 33) = 3.890, p = .030. Therefore, Welch
and Brown-Forsythe F-ratio were reported with the result of F(2, 18.79) = 7.272, p =
.005, 2 = .126 and F(2, 28.99) = 4.210, p = .025, 2 = .126 respectively.
Based on these results, the evidence was insufficient to reject 0H 7.2, 7.3, 7.4, 7.6,
7.7, 7.8, 7.9, and 7.10. 0H 7.1 and 7.5, concerning the job function of Framing the School
Goals (Welch F-ratio p = .001, Brown-Forsythe F-ratio p = .022, p < .05) and Monitoring
Student Progress (Welch F-ratio p = .005, Brown-Forsythe F-ratio p = .025, p < .05),
were found significantly different concerning the overall number of years as current
principal. Therefore, these two null hypotheses were rejected.
Post hoc analysis was conducted to ascertain which particular factors of the IV
were significantly different. Since the variables violated the homogeneity of variance
assumption, Games-Howell post hoc analysis was utilized as it does not assume that
population variances are equal or that the sample sizes are equal.
Games-Howell post hoc comparisons of the three groups to the DV of Framing the
School Goals indicated that the 7-8 ≤ years group (M = 4.88, 95% CI [4.74, 5.02]) was
significantly more engaged in the behavior of framing the school goals than both the 3-4
years group (M =4.49, 95% CI [4.28, 4.69]), p = .004, and the 5-6 years group (M = 4.46,

136
95% CI [4.25, 4.67]), p = .005. Comparisons between the 3-4 year group and the 5-6 year
group yielded no statistical significance at p < .05.
Concerning the DV of Monitoring Student Progress in comparisons of the three
groups, the Games-Howell post hoc test indicated that the 7-8 ≤ years group (M = 4.64,
95% CI [4.43, 4.85]) were significantly more engaged in the behavior of Monitoring
Student Progress than the 3-4 years group (M = 4.08, 95% CI [3.79, 4.36]), p =.004.
Comparisons between the 5-6 year group (M = 4.30, 95% CI [3.98, 4.62]) and the other
two groups were not statistically significant at p < .05.
Research Question Eight
Research question eight states,
8RQ Are there significant differences in high school principals‘ perceptions of
their own instructional leadership behaviors as measured by the 10
Principal Instructional Management Rating Scale dimensions based on the
principals‘ number of years as a classroom teacher?
0H 8.1 through 8.10 There are no statistically significant differences in
effective high school principals‘ perceptions of their own
instructional leadership behaviors, as measured by the 10 Principal
Instructional Management Rating Scale dimensions based on the
principals‘ number of years as a classroom teacher.
To answer research question eight, the null hypotheses were tested using a one-way
ANOVA, which investigates the differences of the IV of overall years as a classroom
teacher (0-5 years, 6-12 years, or 20 ≤ years) to each of the 10 job functions of the

137
PIMRS individually. ANOVA assumptions, such as homogeneity of variances, have been
met unless otherwise noted in the findings presented below. Descriptive statistics
disaggregated by the IV of overall years as a classroom teacher, either 0-5 years (n = 10),
6-12 years (n = 21), or 20 ≤ years (n = 5) are shown in Appendix J, Table J6.
One-way ANOVA significance levels were set at p < .05, with the following results
presented for each of the 10 PIMRS job functions serving as the DVs: 0H 8.1, Frame the
School Goals, F(2, 33) = 0.017, p = .983, 2 =.001; 0H 8.2, Communicate the School
Goals, F(2, 33) = 0.010, p = .990, 2 = .001; 0H 8.3, Supervise and Evaluate Instruction,
F(2, 33) = 0.580, p = .565, 2 = .34; 0H 8.4, Coordinate the Curriculum, F(2, 33) =
0.204, p = .816, 2 = .012; 0H 8.5, Monitor Student Progress, F(2, 33) = 0.151, p = .860,
2 = .009; 0H 8.6, Protect Instructional Time, F(2, 33) = 1.085, p = .350, 2 = .62;
0H 8.7, Maintain High Visibility, F(2, 33) = 0.952, p = .396, 2 = .055; 0H 8.8, Provide
Incentives for Teachers, F(2, 33) = 1.810, p = .180, 2 = .099; and 0H 8.9, Promote
Professional Development, F(2, 33) = 0.365, p = .697, 2 = .022. 0H 8.10, Provide
Incentives for Learning, violated the homogeneity of variance assumption of ANOVA as
evident by the Levene‘s test, F(2, 33) = 3.487, p = .042. Therefore, Welch and Brown-
Forsythe F-ratio were reported with the result of F(2, 10.06) = 0.248, p = .785, 2 = .014
and F(2, 16.91) = 0.218, p = .806, 2 = .014 respectively. Based on these results, the
evidence was insufficient to reject each of the 10 null hypotheses.

138
Research Question Nine
Research question nine states,
9RQ Are there significant differences in high school principals‘ perceptions of
their own instructional leadership behaviors as measured by the 10
Principal Instructional Management Rating Scale dimensions based on the
principals‘ subject taught as a teacher?
0H 9.1 through 9.10 There are no statistically significant differences in
effective high school principals‘ perceptions of their own
instructional leadership behaviors, as measured by the 10 Principal
Instructional Management Rating Scale dimensions based on the
principals‘ subject taught as a teacher.
To answer research question nine, the null hypotheses were tested using a one-way
ANOVA, which investigates the differences of the IV of subject taught as a teacher
(mathematics, social science, English language arts, K-6th
grade, physical education,
science, English second language, or other) to each of the 10 job functions of the PIMRS
individually. ANOVA assumptions, such as homogeneity of variances, have been met
unless otherwise noted in the findings presented below. Descriptive statistics
disaggregated by the IV of subject taught as a teacher, either Mathematics (n = 4), Social
Science (n = 11), English Language Arts (n = 9), K-6th
Grade (n = 3), PE (n = 2), Science
(n = 2), ESL (n = 2), and Other (n = 3) are shown in Appendix J, Table J7.
One-way ANOVA significance levels were set at p < .05, with the following results
presented for each of the 10 PIMRS job functions serving as the DVs: 0H 9.1, Frame the

139
School Goals, F(7, 28) = 0.537, p = .799, 2 = .118; 0H 9.2, Communicate the School
Goals, F(7, 28) = 0.383, p = .904, 2 = .087; 0H 9.4, Coordinate the Curriculum, F(7,
28) = 0.382, p = .905, 2 = .087; 0H 9.6, Protect Instructional Time, F(7, 28) = 0.627, p =
.729, 2 = .136; 0H 9.7, Maintain High Visibility, F(7, 28) = 1.439, p = .229, 2 = .265;
0H 9.8, Provide Incentives for Teachers, F(7, 28) = 0.183, p = .987, 2 = .044; 0H 9.9,
Promote Professional Development, F(7, 28) = 0.285, p = .995, 2 = .066; and 0H 9.10,
Provide Incentives for Learning, F(7, 28) = 3.520, p = .008, 2 = .468. 0H 9.3, Supervise
and Evaluate Instruction, violated the homogeneity of variance assumption of ANOVA as
evident by the Levene‘s test, F(7, 28) = 2.579, p = .035. Therefore, Welch and Brown-
Forsythe F-ratio were reported with the result of F(7, 5.50) = 0.070, p = .999, 2 = .007
and F(7, 4.15) = 0.026, p = 1.000, 2 = .007 respectively. 0H 9.5, Monitor Student
Progress, also violated the homogeneity of variance assumption of ANOVA as evident by
the Levene‘s test, F(7, 28) = 2.477, p = .041. Therefore, Welch and Brown-Forsythe F-
ratio were reported with the result of F(7, 5.54) = 0.483, p = .817, 2 = .122 and F(7,
9.51) = 0.647, p = .711, 2 = .122 respectively.
Based on these results, the evidence was insufficient to reject 0H 9.1, 9.2, 9.3, 9.4,
9.5, 9.6, 9.7, 9.8, and 9.9. 0H 9.10, concerning the job function of Providing Incentives
for Learning (p = .008, p < .05), was found significantly different concerning the subject
taught as a teacher. Therefore, this null hypothesis was rejected.
Post hoc analysis was conducted to ascertain which particular factors of the IV
were significantly different. Since the variables had a homogeneous variance but unequal
group sizes, Tukey-Kramer post hoc analysis was utilized. Tukey-Kramer post hoc

140
comparisons of the six groups indicated that the K-6th
Grade teacher group (M = 4.73,
95% CI [4.16, 5.31]) were significantly more engaged in the behavior of Providing
Incentives for Learning than the PE teacher group (M = 2.80, 95% CI [0.56, 5.34]), p =
.041. Comparisons between the social science teachers (M = 3.66, 95% CI [3.21, 4.10]),
ELA (M = 4.36, 95% CI [3.92, 4.80]), science teachers (M = 3.40, 95% CI [-1.68, 8.48]),
ESL teachers (M = 4.40, 95% CI [1.86, 6.94]), other teachers (M = 3.53, 95% CI [1.47,
5.60]), and the other two groups were not statistically significant at p < .05.
Research Question Ten
Research question ten states,
10RQ Are there significant differences in high school principals‘ perceptions of
their own instructional leadership behaviors as measured by the 10
Principal Instructional Management Rating Scale dimensions based on the
principals‘ extent of instructional leadership delegated?
0H 10.1 through 10.10 There are no statistically significant differences in
effective high school principals‘ perceptions of their own
instructional leadership behaviors, as measured by the 10 Principal
Instructional Management Rating Scale dimensions based on the
principals‘ extent of instructional leadership delegated.
To answer research question ten, the null hypotheses were tested using a one-way
ANOVA, which investigates the differences of the IV of instructional leadership
delegated to others (retained by administration or balanced between administration and
teachers) to each of the 10 job functions of the PIMRS individually. ANOVA

141
assumptions, such as homogeneity of variances, have been met unless otherwise noted in
the findings presented below. Descriptive statistics disaggregated by the IV of
instructional leadership delegated to others, either retained by administration (n = 24) or
balanced between administration and teachers (n = 12), are shown in Appendix J, Table
J8.
One-way ANOVA significance levels were set at p < .05, with the following
results presented for each of the 10 PIMRS job functions serving as the DVs: 0H 10.1,
Frame the School Goals, F(1, 34) = .000, p = 1.000, 2 = .000; 0H 10.2, Communicate
the School Goals, F(1, 34) = 1.435, p = .239, 2 = .041; 0H 10.3, Supervise and Evaluate
Instruction, F(1, 34) = 0.136, p = .715, 2 = .004; 0H 10.4, Coordinate the Curriculum,
F(1, 34) = 0.188, p = .668, 2 = .005; 0H 10.5, Monitor Student Progress, F(1, 34) =
0.249, p = .621, 2 = .007; 0H 10.6, Protect Instructional Time, F(1, 34) = 0.003, p =
.957, 2 = .000; 0H 10.7, Maintain High Visibility, F(1, 34) = 0.412, p = .525, 2 = .012;
0H 10.8, Provide Incentives for Teachers, F(1, 34) = 0.190, p = .665, 2 = .006; 0H 10.9,
Promote Professional Development, F(1, 34) = 1.350, p = .253, 2 = .038; and 0H 10.10,
Provide Incentives for Learning, F(1, 34) = 0.131, p = .720, 2 = .004. Based on these
results, the evidence was insufficient to reject each of the 10 null hypotheses.
Research Question Eleven
Research question eleven states,
11RQ Are there significant differences in high school principals‘ beliefs of good
pedagogical practice as measured by the 14 beliefs presented in the
Principal Beliefs Survey based on the principals‘ gender?

142
0H 11.1 through 11.14 There are no statistically significant differences in
effective high school principals‘ beliefs of good pedagogical
practice as measured by the 14 beliefs presented in the Principal
Beliefs Survey based on the principals‘ gender.
To answer Research Question Eleven, the null hypotheses were tested using a
one-way ANOVA, which investigates the differences of the IV of gender (male or
female) to each of the 14 PBS beliefs individually. ANOVA assumptions, such as
homogeneity of variances, have been met unless otherwise noted in the findings
presented below. Descriptive statistics disaggregated by the IV of gender, either male (n
= 24) or female (n = 12), are shown in Appendix J, Table J9.
One-way ANOVA significance levels were set at p < .05, with the following results
presented for each of the 14 PBS beliefs serving as the DVs: 0H 11.1, authentic learning
versus systematic instruction (PBS2), F(1, 34) = 0.038, p = .847, 2 = .001; 0H 11.2,
conceptual understanding versus basic skills (PBS5), F(1, 34) = 0.707, p = .406, 2 =
.020; 0H 11.3, facilitate versus teach directly (PBS9), F(1, 34) = 1.038, p = .316, 2 =
.030; 0H 11.4, activities versus modeling and practice (PBS11), F(1, 34) = 0.045, p =
.843, 2 = .001; 0H 11.5, curriculum stifles versus provides opportunity (PBS13), F(1,
34) = 1.569, p = .219, 2 = .044; 0H 11.6, learning styles relevant versus irrelevant
(PBS1), F(1, 34) = 1.302, p = .262, 2 = .037; 0H 11.7, small class size primary versus
not primary (PBS3), F(1, 34) = 0.089, p = .768, 2 = .003; 0H 11.8, self-esteem first
versus achievement first (PBS4), F(1, 34) = 2.089, p = .158, 2 = .058; 0H 11.9, ability
grouping harmful versus necessary (PBS7), F(1, 34) = 0.129, p = .721, 2 = .004;

143
0H 11.10, eclectic instruction versus one best way (PBS8), F(1, 34) = 0.245, p = .624,
2 = .007; 0H 11.11, fun versus achievement (PBS6), F(1, 34) = 0.838, p = .366, 2 =
.024; 0H 11.12, factors prevent versus all children can learn (PBS10), F(1, 34) = 0.782, p
= .383, 2 = .022; 0H 11.13, experience versus education and training (PBS12), F(1, 34)
= 0.853, p = .362, 2 = .024; and 0H 11.14, teaching is an art versus science (PBS14),
F(1, 34) = 0.052, p = .821, 2 = .002. Based on these results, the evidence was
insufficient to reject each of the 14 null hypotheses.
Research Question Twelve
Research question twelve states,
12RQ Are there significant differences in high school principals‘ beliefs of good
pedagogical practice as measured by the 14 beliefs presented in the
Principal Beliefs Survey based on the principals‘ ethnicity?
0H 12.1 through 12.14 There are no statistically significant differences in
effective high school principals‘ beliefs of good pedagogical
practice as measured by the 14 beliefs presented in the Principal
Beliefs Survey based on the principals‘ ethnicity.
To answer research question twelve, the null hypotheses were tested using a one-
way ANOVA, which investigates the differences of the IV of ethnicity (Caucasian or
Hispanic) to each of the 14 PBS beliefs individually. ANOVA assumptions, such as
homogeneity of variances, have been met unless otherwise noted in the findings
presented below. Descriptive statistics disaggregated by the IV of ethnicity, either
Caucasian (n = 24) or Hispanic (n = 11), are shown in Appendix J, Table J10.

144
One-way ANOVA significance levels were set at p < .05, with the following results
presented for each of the 14 PBS beliefs serving as the DVs: 0H 12.1, PBS2, F(2, 33) =
0.015, p = .986, 2 = .001; 0H 12.2, PBS5, F(2, 33) = 1.743, p = .191, 2 = .096;
0H 12.3, PBS9, F(2, 33) = 0.363, p = .698, 2 = .022; 0H 12.4, PBS11, F(2, 33) = 0.355,
p = .704, 2 = .021; 0H 12.5, PBS13, F(2, 33) = 1.039, p = .365, 2 = .059; 0H 12.6,
PBS1, F(2, 33) = 0.374, p = .691, 2 = .022; 0H 12.7, PBS3, F(2, 33) = 0.042, p = .959,
2 = .003; 0H 12.8, PBS4, F(2, 33) = 0.083, p = .920, 2 = .005; 0H 12.9, PBS7, F(2, 33)
= 0.015, p = .985, 2 = .001; 0H 12.10, PBS8, F(2, 33) = 0.069, p = .933, 2 = .004;
0H 12.11, PBS6, F(2, 33) = 1.194, p = .316, 2 = .067; 0H 12.12, PBS10, F(2, 33) =
1.352, p = .273, 2 = .076; 0H 12.13, PBS12, F(2, 33) = 0.750, p = .480, 2 = .043; and
0H 12.14, PBS14, F(2, 33) = 0.159, p = .853, 2 = .010. Based on these results, the
evidence was insufficient to reject each of the 14 null hypotheses.
Research Question Thirteen
Research question thirteen states,
13RQ Are there significant differences in high school principals‘ beliefs of good
pedagogical practice as measured by the 14 beliefs presented in the
Principal Beliefs Survey based on the principals‘ educational level?
0H 13.1 through 13.14 There are no statistically significant differences in
effective high school principals‘ beliefs of good pedagogical
practice as measured by the 14 beliefs presented in the Principal
Beliefs Survey based on the principals‘ educational level.

145
To answer research question thirteen, the null hypotheses were tested using a one-
way ANOVA, which investigates the differences of the IV of highest education level
(Master or Doctorate Degree) to each of the 14 PBS beliefs individually. ANOVA
assumptions, such as homogeneity of variances, have been met unless otherwise noted in
the findings presented below. Descriptive statistics disaggregated by the IV of highest
education level, either master degree (n = 30) or doctorate degree (n = 6), are shown in
Appendix J, Table J11.
One-way ANOVA significance levels were set at p < .05, with the following results
presented for each of the 14 PBS beliefs serving as the DVs: 0H 13.1, PBS2, F(1, 34) =
0.647, p = .427, 2 = .019; 0H 13.2, PBS5, F(1, 34) = 0.748, p = .393, 2 = .022;
0H 13.3, PBS9, F(1, 34) = 0.016, p = .900, 2 = .000; 0H 13.4, PBS11, F(1, 34) = 0.018,
p = .894, 2 = .001; 0H 13.5, PBS13, F(1, 34) = 1.215, p = .278, 2 = .035; 0H 13.6,
PBS1, F(1, 34) = 0.017, p = .898, 2 = .000; 0H 13.8, PBS4, F(1, 34) = 1.236, p = .274,
2 = .035; 0H 13.9, PBS7, F(1, 34) = 1.962, p = .170, 2 = .055; 0H 13.10, PBS8, F(1,
34) = 0.251, p = .620, 2 = .007; 0H 13.11, PBS6, F(1, 34) = 0.036, p = .850, 2 = .001;
0H 13.12, PBS10, F(1, 34) = 0.077, p = .784, 2 = .002; 0H 13.13, PBS12, F(1, 34) =
0.903, p = .349, 2 = .026; and 0H 13.14, PBS14, F(1, 34) = 0.005, p = .943, 2 = .000.
0H 13.7, PBS3, violated the homogeneity of variance assumption of ANOVA as evident
by the Levene‘s test, F(1, 34) = 6.027, p = .019. Therefore, Welch and Brown-Forsythe
F-ratio were reported with the result of F(1, 14.33) = 1.349, p = .264, 2 = .017
respectively. Based on these results, the evidence was insufficient to reject each of the 14
null hypotheses.

146
Research Question Fourteen
Research question fourteen states,
14RQ Are there significant differences in high school principals‘ beliefs of good
pedagogical practice as measured by the 14 beliefs presented in the
Principal Beliefs Survey based on the principals‘ overall years as an
administrator?
0H 14.1 through 14.14 There are no statistically significant differences in
effective high school principals‘ beliefs of good pedagogical
practice as measured by the 14 beliefs presented in the Principal
Beliefs Survey based on the principals‘ overall years as an
administrator.
To answer research question fourteen, the null hypotheses were tested using a
one-way ANOVA, which investigates the differences of the IV of overall years in
administration (3-10 years, 11-15 years, 16-20 years, or 21≤ years) to each of the 14 PBS
beliefs individually. ANOVA assumptions, such as homogeneity of variances, have been
met unless otherwise noted in the findings presented below. Descriptive statistics
disaggregated by the IV of overall years in administration, either 3-10 years (n = 15), 11-
15 years (n = 11), 16-20 years (n = 7), or 21≤ years (n = 3), are shown in Appendix J,
Table J12.
One-way ANOVA significance levels were set at p < .05, with the following results
presented for each of the 14 PBS beliefs serving as the DVs: 0H 14.1, PBS2, F(3, 32) =
1.997, p = .134, 2 = .158; 0H 14.2, PBS5, F(3, 32) = 1.084, p = .370, 2 = .092;

147
0H 14.3, PBS9, F(3, 32) = 0.690, p = .565, 2 = .061; 0H 14.4, PBS11, F(3, 32) = 0.802,
p = .502, 2 = .070; 0H 14.5, PBS13, F(3, 32) = 0.681, p = .570, 2 = .060; 0H 14.6,
PBS1, F(3, 32) = 0.513, p = .676, 2 = .046; 0H 14.7, PBS3, F(3, 32) = 2.103, p = .119,
2 = .165; 0H 14.8, PBS4, F(3, 32) = 0.265, p = .850, 2 = .024; 0H 14.9, PBS7, F(3, 32)
= 3.124, p = .039. 2 = .227; 0H 14.10, PBS8, F(3, 32) = 0.698, p = .560, 2 = .061;
0H 14.11, PBS6, F(3, 32) = 0.367, p = .777, 2 = .033; 0H 14.12, PBS10, F(3, 32) =
1.134, p = .350, 2 = .096; 0H 14.13, PBS12, F(3, 32) = 0.113, p = .952, 2 = .011; and
0H 14.14, PBS14, F(3, 32) = 0.513, p = .676, 2 = .046.
Based on these results, the evidence was insufficient to reject 0H 14.1, 14.2, 14.3,
14.4, 14.5, 14.6, 14.7, 14.8, 14.10, 14.11, 14.12, 14.13, and 14.14. 0H 14.9, regarding the
belief of PBS7 ability grouping harmful versus necessary (p = .039, p < .05), was found
significantly different concerning the overall number of years in administration.
Therefore, the null hypothesis was rejected.
Post hoc analysis was conducted to ascertain which particular factors of the IV
were significantly different. Since the variables had a homogeneous variance, but unequal
group sizes, Tukey-Kramer post hoc analysis was utilized. Tukey-Kramer post hoc
comparisons of the four groups indicate that the 20 ≤ years in administration group (M =
1.33, 95% CI [-0.10, 2.77]) was significantly different in the belief of PBS7, ability
grouping harmful versus necessary, than the 3-10 years in administration group (M =
3.00, 95% CI [2.53, 3.47]), p = .029, and the 11-15 years in administration group (M =
3.00, 95% CI [2.40, 3.60]), p = .035. Comparisons between 16-20 years in administration
(M = 2.86, 95% [1.87, 3.85]), and the other three groups were not statistically significant

148
at p < .05. In particular, subjects who have taught for 20 plus years signified a strong
belief that ability grouping is inequitable and destructive to motivation compared to the
subjects who had less years in administration (3-10 years and 11-15 years) who were
balanced between this belief and that ability grouping is necessary to foster success and
motivation.
Research Question Fifteen
Research question fifteen states,
15RQ Are there significant differences in high school principals‘ beliefs of good
pedagogical practice as measured by the 14 beliefs presented in the
Principal Beliefs Survey based on the principals‘ number of years as
principal at their current location?
0H 15.1 through 15.14 There are no statistically significant differences in
effective high school principals‘ beliefs of good pedagogical
practice as measured by the 14 beliefs presented in the Principal
Beliefs Survey based on the principals‘ number of years as
principal at their current location.
To answer research question fifteen, the null hypotheses were tested using a one-
way ANOVA, which investigates the differences of the IV of overall years as current
principal (3-4 years, 5-6 years, or 7-8 ≤ years) to each of the 14 PBS beliefs individually.
ANOVA assumptions, such as homogeneity of variances, have been met unless otherwise
noted in the findings presented below. Descriptive statistics disaggregated by the IV of

149
overall years as principal at current location, either 3-4 years (n = 21), 5-6 years (n = 10),
or 7-8 ≤ years (n = 5), are shown in Appendix J, Table J13.
One-way ANOVA significance levels were set at p < .05, with the following results
presented for each of the 14 PBS beliefs serving as the DVs: 0H 15.1, PBS2, F(2, 33) =
2.137, p = .134, 2 = .115; 0H 15.2, PBS5, F(2, 33) = 3.168, p = .055, 2 = .161;
0H 15.3, PBS9, F(2, 33) = 1.456, p = .246, 2 = .081; 0H 15.4, PBS11, F(2, 33) = 0.138,
p = .871, 2 = .008; 0H 15.5, PBS13, F(2, 33) = 0.267, p = .767, 2 = .016; 0H 15.6,
PBS1, F(2, 33) = 0.524, p = .597, 2 = .031; 0H 15.7, PBS3, F(2, 33) = 0.590, p = .560,
2 = .035; 0H 15.8, PBS4, F(2, 33) = 0.118, p = .889, 2 = .007; 0H 15.9, PBS7, F(2, 33)
= 0.731, p = .489, 2 = .042; 0H 15.10, PBS8, F(2, 33) = 1.529, p = .232, 2 = .085;
0H 15.11, PBS6, F(2, 33) = 0.909, p = .413, 2 = .052; 0H 15.12, PBS10, F(2, 33) =
1.525, p = .233, 2 = .085; 0H 15.13, PBS12, F(2, 33) = 3.031, p = .062, 2 = .155; and
0H 15.14, PBS14, F(2, 33) = 1.377, p = .267, 2 = .077. Based on these results, the
evidence was insufficient to reject each of the 14 null hypotheses.
Research Question Sixteen
Research question sixteen states,
16RQ Are there significant differences in high school principals‘ beliefs of good
pedagogical practice as measured by the 14 beliefs presented in the
Principal Beliefs Survey based on the principals‘ number of years as a
classroom teacher?
0H 16.1 through 16.14 There are no statistically significant differences in
effective high school principals‘ beliefs of good pedagogical

150
practice as measured by the 14 beliefs presented in the Principal
Beliefs Survey based on the principals‘ number of years as a
classroom teacher.
To answer research question sixteen, the null hypotheses were tested using a one-
way ANOVA, which investigates the differences of the IV of overall years as a
classroom teacher (0-5 years, 6-12 years, or 20 ≤ years) to each of the 14 PBS beliefs
individually. ANOVA assumptions, such as homogeneity of variances, have been met
unless otherwise noted in the findings presented below. Descriptive statistics
disaggregated by the IV of overall years as a classroom teacher, either 0-5 years (n = 10),
6-12 years (n = 21), or 20 ≤ years (n = 5), are shown in Appendix J, Table J14.
One-way ANOVA significance levels were set at p < .05, with the following results
presented for each of the 14 PBS beliefs serving as the DVs: 0H 16.1, PBS2, F(2, 33) =
.055, p = .946, 2 = .003; 0H 16.2, PBS5, F(2, 33) = 1.173, p = .322, 2 = .066;
0H 16.3, PBS9, F(2, 33) = .016, p = .984, 2 = .001; 0H 16.4, PBS11, F(2, 33) = .178, p
= .838, 2 = .011; 0H 16.5, PBS13, F(2, 33) = .329, p = .722, 2 = .020; 0H 16.6, PBS1,
F(2, 33) = .524, p = .597, 2 =.031, 0H 16.7, PBS3, F(2, 33) = .590, p = .560, 2 = .035;
0H 16.8, PBS4, F(2, 33) = 1.748, p = .190, 2 = .096; 0H 16.10, PBS8, F(2, 33) = .752, p
= .479, 2 = .044; 0H 16.11, PBS6, F(2, 33) = 7.573, p = .002, 2 = .315; 0H 16.12,
PBS10, F(2, 33) = .658, p = .524, 2 = .038; 0H 16.13, PBS12, F(2, 33) = 1.543, p =
.229, 2 = .086; and 0H 16.14, PBS14, F(2, 33) = .611, p = .549, 2 = .036. 0H 16.9,
PBS7, violated the homogeneity of variance assumption of ANOVA as evident by the
Levene‘s test, F(2, 33) = 4.954, p = .013. Therefore, Welch and Brown-Forsythe F-ratio

151
were reported with the result of F(2, 11.79) = 4.484, p = .036, 2 = .162, and F(2, 19.72)
= 4.842, p = .019, 2 = .162 respectively.
Based on these results, the evidence was insufficient to reject 0H 16.1, 16.2, 16.3,
16.4, 16.5, 16.6, 16.7, 16.8, 16.10, 16.12, 16.13, and 16.14. 0H 16.11, regarding the
beliefs of PBS6 fun versus achievement (p = .002, p < .05), and 0H 16.9, PBS7 ability
grouping harmful versus necessary (Welch F-ratio, p = .036, p < .05, and Brown-
Forsythe F-ratio, p = .019, p < .05), were found significantly different concerning the
overall number of years as a classroom teacher. Therefore, these two null hypotheses
were rejected.
Post hoc analysis was conducted to ascertain which particular factors of the IV
were significantly different to the DV of PBS6, fun versus achievement. Since the
variables had a homogeneous variance but unequal group sizes, Tukey-Kramer post hoc
analysis was utilized. Tukey-Kramer post hoc comparisons of the three groups indicate
that the 20 ≤ years as a classroom teacher group (M = 2.00, 95% CI [0.76, 3.24]) was
significantly different in the belief of PBS6, great teachers make learning fun versus great
teachers produce student achievement, than the 0-5 years as a classroom teacher group
(M = 4.10, 95% CI [3.57, 4.63]), p = .001, and the 6-12 years as a classroom teacher
group (M = 3.43, 95% CI [2.94, 3.92]), p = .017. Comparisons between 0-5 years as a
classroom teacher group and the 6-12 years as a classroom teacher were not statistically
significant at p < .05. In particular, subjects who had taught for 20 plus years signified a
strong belief that great teachers care about students and makes learning fun and
interesting compared to the subjects who had fewer years as a classroom teacher (0-5

152
years, and 6-12 years) who had the belief and that a great teacher cares about students
and produces high achievement outcomes.
Post hoc analysis concerning the DV PBS7 ability grouping harmful versus
necessary and the IV years as a classroom teacher violated the homogeneity of variance
assumption. Therefore, Games-Howell post hoc analysis was utilized as it does not
assume that population variances are equal or that the sample sizes are equal. Games-
Howell post hoc comparisons of the three groups indicate that the 6-12 years as a
classroom teacher group (M = 2.52, 95% CI [2.03, 3.01]) was significantly different in
the belief of PBS7, ability grouping harmful versus necessary, than the 0-5 years as a
classroom teacher group (M = 3.40, 95% CI [3.03, 3.77]), p = .013. Comparisons
between 20 ≤ years as a classroom teacher group (M = 3.00, 95% CI [2.12, 3.16]) and the
other two groups were not statistically significant at p < .05. In particular, subjects who
had taught for 6-12 years indicated a strong belief that ability grouping is inequitable and
destructive to motivation compared to the subjects who had 0-5 years as a classroom
teacher who believed ability grouping is necessary to foster success and motivation.
Research Question Seventeen
Research question seventeen states,
17RQ Are there significant differences in high school principals‘ beliefs of good
pedagogical practice as measured by the 14 beliefs presented in the
Principal Beliefs Survey based on the principals‘ subject taught as a
teacher?

153
0H 17.1 through 17.14 There are no statistically significant differences in
effective high school principals‘ beliefs of good pedagogical
practice as measured by the 14 beliefs presented in the Principal
Beliefs Survey based on the principals‘ subject taught as a teacher.
To answer research question seventeen, the null hypotheses were tested using a
one-way ANOVA, which investigates the differences of the IV of subject taught as a
teacher (mathematics, social science, English language arts, K-6th
grade, physical
education, science, English second language, or other) to each of the 14 PBS beliefs
individually. ANOVA assumptions, such as homogeneity of variances, have been met
unless otherwise noted in the findings presented below. Descriptive statistics
disaggregated by the IV of subject taught as a teacher, either Mathematics (n = 4), Social
Science (n = 11), English Language Arts (n = 9), K-6th
Grade (n = 3), Physical Education
(n = 2), Science (n = 2), English Second Language (n = 2), or other (n = 3) are shown in
Appendix J, Table J15.
One-way ANOVA significance levels were set at p < .05, with the following results
presented for each of the 14 PBS beliefs serving as the DVs: 0H 17.1, PBS2, F(7, 28) =
0.594, p = .755, 2 = .129; 0H 17.2, PBS5, F(7, 28) = 0.482, p = .840, 2 = .107;
0H 17.3, PBS9, F(7, 28) = 0.702, p = .670, 2 = .149; 0H 17.4, PBS11, F(7, 28) = 0.593,
p = .756, 2 = .129; 0H 17.5, PBS13, F(7, 28) = 2.076, p = .080, 2 = .342; 0H 17.6,
PBS1, F(7, 28) = 0.286, p = .954, 2 = .067; 0H 17.7, PBS3, F(7, 28) = 0.632, p = .725,
2 = .136; 0H 17.8, PBS4, F(7, 28) = 1.515, p = .197, 2 = .275; 0H 17.9, PBS7, F(7, 28)
= 1.534, p = .197, 2 = .277; 0H 17.10, PBS8, F(7, 28) = 0.812, p = .585, 2 = .169;
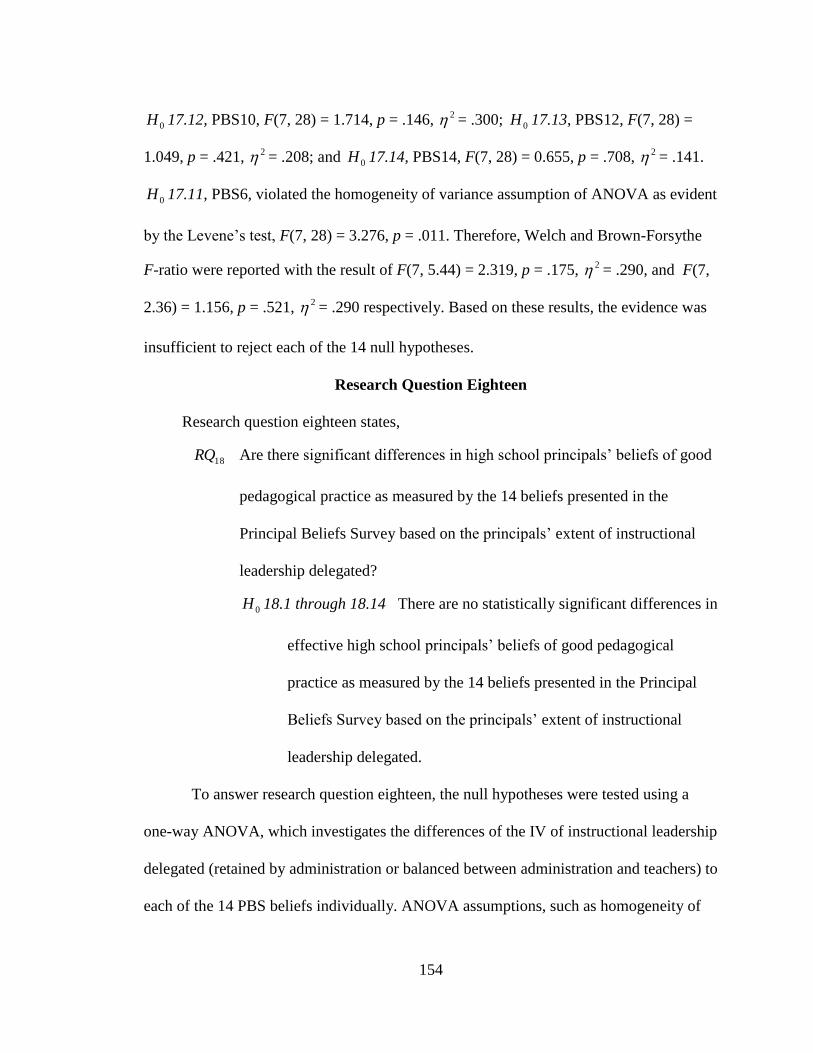
154
0H 17.12, PBS10, F(7, 28) = 1.714, p = .146, 2 = .300; 0H 17.13, PBS12, F(7, 28) =
1.049, p = .421, 2 = .208; and 0H 17.14, PBS14, F(7, 28) = 0.655, p = .708, 2 = .141.
0H 17.11, PBS6, violated the homogeneity of variance assumption of ANOVA as evident
by the Levene‘s test, F(7, 28) = 3.276, p = .011. Therefore, Welch and Brown-Forsythe
F-ratio were reported with the result of F(7, 5.44) = 2.319, p = .175, 2 = .290, and F(7,
2.36) = 1.156, p = .521, 2 = .290 respectively. Based on these results, the evidence was
insufficient to reject each of the 14 null hypotheses.
Research Question Eighteen
Research question eighteen states,
18RQ Are there significant differences in high school principals‘ beliefs of good
pedagogical practice as measured by the 14 beliefs presented in the
Principal Beliefs Survey based on the principals‘ extent of instructional
leadership delegated?
0H 18.1 through 18.14 There are no statistically significant differences in
effective high school principals‘ beliefs of good pedagogical
practice as measured by the 14 beliefs presented in the Principal
Beliefs Survey based on the principals‘ extent of instructional
leadership delegated.
To answer research question eighteen, the null hypotheses were tested using a
one-way ANOVA, which investigates the differences of the IV of instructional leadership
delegated (retained by administration or balanced between administration and teachers) to
each of the 14 PBS beliefs individually. ANOVA assumptions, such as homogeneity of

155
variances, have been met unless otherwise noted in the findings presented below.
Descriptive statistics disaggregated by the IV of instructional leadership delegated, either
retained by administration (n = 24) or balanced between administration and teachers (n =
12), are shown in Appendix J, Table J16.
One-way ANOVA significance levels were set at p < .05, with the following results
presented for each of the 14 PBS beliefs serving as the DVs: 0H 18.2, PBS5, F(1, 34) =
3.016, p = .092, 2 = .081; 0H 18.3, PBS9, F(1, 34) = 1.264, p = .269, 2 = .036;
0H 18.4, PBS11, F(1, 34) = 3.572, p = .067, 2 = .095; 0H 18.5, PBS13, F(1, 34) =
1.913, p = .176, 2 = .053; 0H 18.6, PBS1, F(1, 34) = 1.069, p = .308, 2 = .030;
0H 18.7, PBS3, F(1, 34) = 0.000, p = 1.000, 2 = .000; 0H 18.8, PBS4, F(1, 34) = .047, p
= .830, 2 = .001; 0H 18.9, PBS7, F(1, 34) = 0.000, p = 1.000, 2 = .000; 0H 18.10,
PBS8, F(1, 34) = 0.039, p = .845, 2 = .001; 0H 18.11, PBS6, F(1, 34) = 0.368, p = .548,
2 = .011; 0H 18.12, PBS10, F(1, 34) = 0.012, p = .914, 2 = .000; 0H 18.13, PBS12,
F(1, 34) = 0.013, p = .910, 2 = .000; and 0H 18.14, PBS14, F(1, 34) = 0.052, p = .821,
2 = .002. 0H 18.1, PBS2, violated the homogeneity of variance assumption of ANOVA
as evident by the Levene‘s test, F(1, 34) = 5.507, p = .025. Therefore, Welch and Brown-
Forsythe F-ratio were reported with the result of F(1, 16.23) = 2.319, p = .1.506, 2 =
.054 respectively. Based on these results, the evidence was insufficient to reject each of
the 14 null hypotheses.
Additional Findings
At the end of the questionnaire packet, a space was provided for subjects to make
comments. Two subjects made comments regarding the PBS instrument. One stated that

156
the instrument was confusing while the other suggested they had a contingency view of
pedagogical belief and that the answers to the questions depended on the individual
teacher.
Three more subjects commented on their instructional leadership philosophy. All
three subjects made similar comments that their responsibility was to establish the school
goals, vision, culture, and accountability and then collaboratively work out the details on
how those goals, vision, and culture are implemented at the teacher and student level.
Appendix K contains their exact comments.
Summary
In this chapter, an introduction was given regarding the statistical analyses that
were to be discussed. This was followed by demographic analysis of the subjects,
descriptive statistical analysis of the 10 job functions and their related behaviors from the
PIMRS, descriptive statistical analysis of the 14 beliefs from the PBS, and inferential
statistical analysis by comparing the means of the DV (the revealed behaviors from the
PIMRS and the beliefs from PBS) with the IV (the data from the eight demographic
questions) with a one-way ANOVA comparing each DV to each IV. If a statistically
significant difference was found at p < .05 among independent variables containing three
or more factors, post hoc analyses were performed to discover which factors were
significantly related.
Demographic analysis revealed effective principals (N = 36) in this study were
predominantly male (66.7%), Caucasian (66.7%), have an earned master degree (83.3%),
spent six through 12 years as a classroom teacher (58.3%), and as teachers, primarily

157
taught social science (30.6%), English language arts (25.0%), or mathematics (11.1%). A
majority of the principals (86.1%) had been principals at their current site for three to six
years, with 72.3% of them having administration experience between 3 to 15 years. A
majority of principals retained their instructional leadership responsibilities (n = 24),
while the rest of the principals (n = 12) fostered a balanced approach of sharing
instructional leadership responsibilities.
Results from descriptive statistical analysis of the principals‘ responses on the
PIMRS revealed that they frequently engaged in all 10 job functions of instructional
leadership with a few minor exceptions within a standard deviation. Descriptive statistical
analysis of the principals‘ responses on the PBS revealed that principals had eclectic
beliefs regarding pedagogy, related issues, and professional issues related to
accountability. Overall, principals believed in a balanced approach in the implementation
of pedagogical beliefs and an instructivist view of accountability and the use of well
designed curriculum.
Inferential statistical analysis was then used to compare the means of the results of
the PIMRS, the PBS (DV), and data obtained from the eight demographic questions (IV).
The results indicated there were no statistically significant differences between the
subjects‘ gender, ethnicity, and instructional leadership delegated in regards to the
subjects‘ responses on the PIMRS and the PBS.
Significant differences were found regarding the subjects‘ highest educational level
and the instructional leadership behavior of providing incentives for teachers. Regarding
framing the school goals of the PIMRS, a significant difference was found in the IV of

158
the overall years in administration and overall years as principal at their current site.
Significance was found among the overall years as principal at their current location to
the PIMRS instructional leadership behavior of monitoring student progress. The primary
subject taught as a classroom teacher was also found significantly different to the
instructional leadership behavior of providing incentives for learning.
Concerning the DV of the PBS, the subjects‘ total years in administration were
significantly different regarding the belief that ability grouping is harmful to students
versus necessary. Likewise, the subjects‘ total years as a classroom teacher were found
significantly different regarding the belief that great teachers make learning fun versus
producing student achievement and regarding the belief that ability grouping is harmful
to students versus necessary.
The next chapter will present a discussion of these results in addition to the
implications of the study, implications for education, ideas for further research, and the
limitations and assumptions of the study.

159
CHAPTER 5: SUMMARY AND DISCUSSION
In the previous chapter, the presentation and analysis of data were reported.
Chapter five restates the research problem and reviews the research methods used in this
study. Then this chapter summarizes the results and discusses their implications. The
purpose of the latter sections is to expand upon the concepts that were studied in an effort
to provide further understanding of their possible influence on effective schools research,
in particular instructional leadership and the pedagogical beliefs of principals. Finally,
recommendations for educational leaders, suggestions for further research, and the
study‘s limitations and assumptions will be presented.
Problem Statement
The purpose of this study was to establish what instructional leadership behaviors
effective high school principals have and what these principals‘ beliefs are in regards to
pedagogy and related issues, either constructivist or instructivist in nature. Principals‘
instructional behaviors and beliefs were analyzed in the context of the current NCLB
accountability era, thus characterizing effective schools as those who progress towards
academic achievement for all students, particularly those who traditionally underachieve,
such as the socioeconomically disadvantaged and English learner subgroups.
It was not known how, or to what extent, the role and influence principals‘ beliefs
toward the two prominent pedagogical approaches of constructivism or instructivism play
in their effectiveness as educational leaders. Therefore, this study set out to empirically
delineate, not only what effective high school principals‘ instructional leadership

160
behaviors are, but also what effective principals‘ beliefs of pedagogical practices are in
the high-stakes accountability era along the lines of eight specific demographic variables.
Review of Methodology
This mixed methods descriptive and causal-comparative study was based on
descriptive and inferential statistical analysis of subjects‘ responses on two surveys and
eight demographic questions. The population delineation was first based on principals of
effective California high schools who met this study‘s criteria. Ninety public high schools
met the initial established criteria of this study. Effective high schools were defined as
those high schools in the state of California who reached or exceeded their state
Academic Performance Index (API) growth targets for the school years of 2007-2008 and
2008-2009. This study further delineated the subjects‘ high schools as those who had a
numerically significant population of socioeconomically disadvantaged and English
learners who were counted as a subgroup on the API. Therefore, besides the requirement
of meeting or exceeding their overall API growth targets, high schools must have also
met their two API subgroups of socioeconomic disadvantaged students and English
learners growth targets to be considered an effective high school.
This study also limited the population to principals of the 90 schools who had
served in their current captivity as site principal for the last three consecutive years. The
criteria of a minimum of three years was to control the possible variable of a recent
change of leadership, since the assumption is made that the school‘s effectiveness was
due in part to the leadership practices of the current principal. Nineteen of the 90

161
principals did not meet the minimum requirement of three years of consecutive service.
Therefore, 71 principals were established as this study‘s population.
As previously mentioned, the 71 principals were asked to answer eight
demographic questions, questions on one Likert-type survey, and another survey on a
bipolar adjective scale. The first survey was the Principal Instructional Management
Rating Scale (PIMRS), comprised of 50 items which refer to specific principal
instructional leadership behaviors identified by effective schools research within the
dimensions of defining the mission of the school, managing the instructional program,
and promoting a positive learning climate (Hallinger & Murphy, 1985). The PIMRS is
divided into 10 subscales, each containing five questions measuring a different leadership
job function within each subscale. The PIMRS ratings are intended to measure
perceptions of leadership activity, not the quality of instructional leadership (Hallinger &
Murphy, 1987).
The second survey used was the Principal Beliefs Survey (PBS) containing 14
items which assess, via a forced choice continuum, a principal‘s preference toward one of
two pedagogical beliefs. The preferences were divided as either an instructivist approach
(more explicit, teacher-centered instruction) or a constructivist approach (less explicit,
student-centered instruction). The name of the PBS has been changed from its original
name, Teacher Beliefs Survey, to signify the new intended subjects of the survey in this
study.
The PIMRS has undergone extensive reliability and validity testing. The
instrument has not undergone reliability testing as a whole since the individual subscales

162
were designed to represent related but specific instructional leadership functions. The
alpha coefficients for each subscale ranged from .78 to .90 (Hallinger & Murphy, 1987).
The PIMRS was further tested for its reliability using data obtained from this study.
Those results were presented in chapter three. The PBS was tested for validity previously
but has not undergone reliability testing. Therefore, the PBS was tested for its reliability
using a test-retest correlation coefficient of stability and equivalence. The PBS was found
to be reliable with a coefficient of .94.
The demographic questions and two survey instruments were placed together into
a questionnaire packet and mailed to each subject at his or her place of business with a
stamped, self-addressed return envelope and a cover letter in early May of 2010.
Complete details of the follow-up procedures were discussed in chapter three. By the end
of June of 2010, a return rate of 58% was achieved. Three principals stated their
declination to participate in their response and two questionnaire packets returned where
not usable do to incompleteness or confusion in completing the surveys. Therefore, 51%
(N = 36) complete and usable questionnaire data sets were obtained for statistical
analysis.
The data gathered from the two surveys, along with the demographic information,
were then analyzed through descriptive and inferential statistical analysis. These results
were presented in detail in chapter four. Following are the research questions and a
summary of the findings.

163
Summary of the Findings
Demographic analysis revealed effective principals (N = 36) in this study were
predominantly male (66.7%), Caucasian (66.7%), have an earned master degree (83.3%),
spent six through 12 years as a classroom teacher (58.3%), and as teachers, primarily
taught social science (30.6%), English language arts (25.0%), or mathematics (11.1%). A
majority of the principals (86.1%) had been principals at their current site for three to six
years, with 72.3% of them having administration experience between 3 to 15 years. A
majority of principals retained their instructional leadership responsibilities (n = 24),
while the rest of the principals (n = 12) fostered a balanced approach of sharing
instructional leadership responsibilities.
The general research question this study set out to answer was, What are
effective CA high school principals‘ self-reported instructional leadership behaviors and
pedagogical beliefs (constructivist or instuctivist) in the accountability era and what are
the differences in these behaviors and beliefs in regards to eight specific variables?
From this question, 18 specific research questions were developed and answered.
Following are summaries of the findings for each of the four research questions.
Research Question One
Research question one states, what are effective high school principals‘ perceptions
of their own instructional leadership behaviors in the following 10 dimensions as
measured by the Principal Instructional Management Rating Scale: framing the school‘s
goals, communicating the school‘s goals, coordinating the curriculum, supervising and
evaluating instruction, monitoring student progress, protecting instructional time,

164
providing incentives for teachers, providing incentives for learning, promoting
professional development, and maintaining high visibility?
Research question one was answered through descriptive statistical analysis of
central tendency and dispersion. Results from the statistical analysis of the principals‘
responses on the PIMRS revealed that they ―frequently‖ framed the school goals,
communicated the school goals, supervised and evaluated instruction, coordinated the
curriculum, monitored student progress, protected instructional time, and promoted
professional development. Principals ―sometimes‖ maintained high visibility, provided
incentives for teachers, and provided incentives for learning.
Research Question Two
Research question two states, what are effective high school principals‘ beliefs of
good pedagogical practice with a preference of either an instructivist or constructivist
dimension as measured on the Principal Beliefs Survey?
Research question two was also answered through descriptive statistics of central
tendency and dispersion. Statistical analysis of the principals‘ responses on the 14
questions of the PBS revealed that principals had eclectic beliefs regarding pedagogy,
related issues, and professional issues related to accountability. The majority of principals
tended to believe in an instructivist context regarding professional issues, such as great
teachers produce high achievement (41.6%) versus great teachers make learning fun and
interesting (13.9%), all children can learn basic skills (77.8%), education and training is
more important than experience (30.5%, 47.2% balanced), and scientifically conducted

165
research should be used in determining the best teaching methods (36.1% with 38.9%
balanced between the beliefs).
Principals‘ pedagogical beliefs were mixed overall between constructivism and
instructivism. The two exceptions were a vast majority of principals (80.6%) believed
following a prescriptive but well-designed curriculum provides the best opportunity for
effective instruction and that this does not stifle teacher creativity or reduce students‘
motivation. The other exception was the belief that teachers should emphasize conceptual
understanding and critical thinking in the classroom even when students lack proficiency
in basic skills or factual knowledge. This was the belief of 50% of the principals with
25% balanced and 25% feeling that fluency in basic skills and factual knowledge form
the foundation for conceptual understanding and critical thinking.
Related issues, or those highly popular classroom practices with little or mixed
evidence of their efficacy, found principals once again eclectic in their beliefs. The
largest consensus was 75% of principals believed that learning styles are an important
factor in deciding how and what to teach. The majority of principals (66.6%) also
believed an eclectic or balanced instructional approach was best and that small class size
was not an important factor to academic success (66.7%).
Research Questions Three through Ten
Research questions three through ten were answered by rejecting or failing to reject
the null hypotheses stated for each research question. Each research question dealt with
one of the eight IVs and the DVs from the PIMRS, while the null hypotheses stated that
there were no statistically significant differences in effective high school principals‘

166
perceptions of their own instructional leadership behaviors and each of the IVs. Statistical
significance was determined through inferential statistical analysis using a one-way
ANOVA which determined significance at p < .05.
All null hypotheses failed to be rejected except for the null hypotheses from the
following research questions: five ( 0H 5.8), six ( 0H 6.1), seven ( 0H 7.1 and 7.5), and
nine ( 0H 9.10). Concerning research question five ( 0H 5.8), subjects with a master
degree (M = 3.93, 95% CI [3.70, 4.17]) provided incentives for teachers significantly
more than subjects with a doctorate degree (M = 3.33, 95% CI [2.78, 3.89]) at p = .034, p
< .05.
Post hoc analysis of research question six ( 0H 6.1) found that subjects with 20 or
more years of overall administrative experience (M = 4.87, 95% CI [4.58, 5.15]) were
significantly more engaged in framing the school goals than subjects with 3 to 10 years in
administrative experience (M = 4.36, 95% CI [4.10, 4.62]) at p = .011, p < .05.
Concerning research question seven ( 0H 7.1 and 7.5), post hoc analysis found that
subjects with seven to eight years of experience as principals at their current site (M =
4.88, 95% CI [4.74, 5.02]) were significantly more engaged in framing the school goals
than subjects with three to four years of experience as principals at their current site (M =
4.49, 95% CI [4.28, 4.69]) at p = .005, p < .05. In addition, subjects with seven to eight
years of experience as principals at their current site (M = 4.64, 95% CI [4.43, 4.85])
were significantly more engaged in monitoring student progress than subjects with three
to four years of experience as principals at their current site (M = 4.08, 95% CI [3.79,
4.36]) at p = .004, p < .05.
167
Post hoc analysis of Research Question Nine ( 0H 9.10) found that subjects who
were K-6th
grade teachers (M = 4.73, 95% CI [4.16, 5.31]) were more engaged in
providing incentives for learning than subjects who were physical education teachers (M
= 2.80, 95% CI [0.56, 5.34]) at p = .041, p < .05. Table 22 provides a summary of all the
rejected null hypotheses with the findings of post hoc analyses.
Research Questions Eleven through Eighteen
Research Questions Eleven through Eighteen were answered by rejecting or failing
to reject the null hypotheses stated for each research question. Each research question
dealt with one of the eight IVs and the DVs from the PBS, while the null hypotheses
stated that there were no statistically significant differences in effective high school
principals‘ beliefs toward teaching pedagogy, either instructivist or constructivist in
nature, for each of the IVs. Statistical significance was determined through inferential
statistical analysis using a one-way ANOVA which determined significance at p < .05.
All null hypotheses failed to be rejected except for the null hypotheses of Research
Questions Fourteen ( 0H 14.9) and Sixteen ( 0H 16.9 and 19.11). Post hoc analysis of
Research Question Fourteen ( 0H 14.9) revealed that subjects with 20 or more years in
administrative experience (M = 1.33, 95% CI [-0.30, 2.77]) were significantly more likely
to believe ability grouping is inequitable and destructive to motivation compared to those
with three to 10 years of administrative experience (M = 3.00, 95% CI [2.53, 3.47]) at p =
.029, p < .05, and those with 11 to 15 years of administrative experience (M = 3.00, 95%
CI [2.40, 3.60]) at p = .035, p < .05, who were balanced between ability grouping is
harmful and ability grouping is necessary to foster success and motivation.

168
Concerning Research Question Sixteen ( 0H 16.9 and 19.11), post hoc analysis
found that subjects who have 20 or more years of experience as classroom teachers (M =
2.00, 95% CI [0.76, 3.24]) believed significantly more that great teachers make learning
fun and interesting compared to subjects with zero to five years of classroom teaching
experience (M = 4.10, 95% CI [3.57, 4.63]) at p = .001, p < .05, and subjects with six to
12 years of classroom teaching experience (M = 3.43, 95% CI [2.94, 3.92]) at p = .017, p
< .05, whose beliefs were more in line with great teachers produce high student
outcomes. In addition, subjects with six to 12 years of classroom teaching experience (M
= 2.52, 95% CI [2.03, 3.01]) were significantly more likely to believe that ability
grouping is harmful in comparison to whose with zero to five years of classroom teaching
experience (M = 3.40, 95% CI [3.03, 3.77]) at p = .013, p < .05, who believed ability
grouping is necessary to foster success and motivation. Table 22 provides a summary of
all the rejected null hypotheses with the findings of post hoc analyses.

169
Table 22
Summary of Significant Findings and Post Hoc Analyses

170
Discussion of the Findings
The following findings will be explored in detail: (a) effective high school
principals are actively and frequently engaged in all facets of instructional leadership; (b)
in several cases, experienced principals fostered specific aspects of instructional
leadership more than those principals with less experience; (c) effective high school
principals are varied in their pedagogical beliefs and do not believe one particular way or
philosophy with consistency; (d) effective high school principals are united in the belief
of what is taught is more important than how it is taught; and (e) effective high school
principals are united in the belief of producing student achievement and accountability.
Concerning the finding that effective high school principals are actively and
frequently engaged in all facets of instructional leadership, this study‘s findings are in
alignment with other research that suggests that instructional leadership is firmly
entrenched in what effective schools do as reported in previous effective school research
(Edmonds, 1979; Ellis et al. 2007; McEwan, 2009; Levine, 1991; Socias, 2008; Williams
et al., 2005). The principals‘ gender, ethnicity, years of experience as a teacher and
administrator, and level of delegation of the principals‘ core leadership responsibility of
the teaching and learning of the school were not determining factors in the frequency of
instructional leadership practiced among the subjects in this study. A few noted
exceptions were found in this study regarding educational level and subjects taught by the
principals when they served as teachers.
This study also provides insights into the debate discussed in chapter two
concerning two models of educational leadership, instructional or transformational. For

171
example, Hallinger (2003) suggested that a key difference between the two leadership
models is that instructional leadership emphasizes a coordinated and control strategy
versus an ―empowerment‖ strategy as employed in transformational leadership. The
findings of this study show that effective principals tended to retain for themselves or
their administration team most of the responsibility of the school‘s technical core of
teaching and learning (such as curriculum and accountability), but relinquished some
control in regards to the technical core‘s application in the classroom (such as pedagogy).
Therefore, this study confirms the integrated leadership model developed by Marks and
Printy (2003), which suggests that although the theoretical underpinnings of
transformational leadership and instructional leadership are analytically distinct, they
generally cohere in practice.
As discovered through inferential statistical analysis, experienced principals
fostered specific aspects of instructional leadership significantly more than those
principals with less experience in particular, framing the school goals and monitoring
student progress. These findings indicate that although instructional leadership behaviors
were common among all principals of effective high schools regardless of experience,
principals with additional experience in administration confirmed research which found
positive relationships between the level of principal experience and school performance,
specifically academic gains, teacher turnover, and student attendance rates (Fernandez et
al. ,2007, Clark, Martorell, & Rockoff, 2009).
The number of years in administration and years as principal at their current site
were deemed an important demographic variable since Fernandez, et al. (2007) found that

172
principal tenure on the job was the most important variable that significantly affected the
performance on academic gains, standardized test accountability scores, teacher turnover,
and student attendance rates. Clark, Martorell, and Rockoff (2009) also found a positive
relationship between principal experience and school performance, particularly for math
test scores and student absences, and that policies which cause principals to leave their
jobs early (early retirement or move into district administration) are harmful to school
performance.
The next finding for discussion is that effective high school principals are varied in
their pedagogical beliefs or they do not believe one particular way or philosophy. Just as
in principals‘ instructional leadership practices, principals‘ pedagogical beliefs were not
significantly different concerning the eight demographic variables, with a few exceptions.
This shows that principals lack of a firm grounding or following in any single
pedagogical philosophy. Some strongly held beliefs even seem to be contradictory. For
example, only 5.6% of principals believed that a prescriptive curriculum stifles teacher
creativity and reduces student motivation, while the majority believed that following a
prescriptive, but well-designed curriculum provides the best opportunity for effective
instruction, which is supported by research (Brock & Groth, 2003; Heward, 2003). A
majority of principals in this study also firmly believed in a balanced approach between
authentic learning and systematic instruction, teachers should facilitate learning rather
than teach it directly, learning styles are an important factor in deciding how and what to
teach, and eclectic instruction is best.

173
It is not clear from this research how these successful principals rectify the
contradictions in their beliefs of prescribing a specific curriculum along with providing
authentic (not prescribed) learning experiences. Another example of confusion in beliefs
presented in this study is the belief that one can facilitate or allow for self-discovery, thus
developing one‘s own understanding, in a prescribed ridged curriculum without teaching
it directly. Current cognitive psychology questions the efficacy of these commonly held
beliefs as expressed by the principals of this study (Willingham, 2009). What cognitive
psychology does empirically know is that factual knowledge precedes skill, memory is
the residue of thought, proficiency requires practice, cognition is fundamentally different
early and late in training, and children are more alike than different in terms of learning
and learning styles, among others (Willingham, 2009).
Contemporary educational practice has attempted to fuse these contradictions
(Evers, Izumi, & Riley, 2001). As an example of this attempted fusing, principals in this
study were largely undecided (47.2%) or leaned toward the idea that ability grouping is
harmful (27.8%). According to Snider and Roehl (2007) and Hastings (1992), ability
grouping is often seen as a moral issue opposed to an issue of fostering achievement. The
opponents of ability grouping suggest it leads to tracking students, which harms minority
students, instead of ability grouping‘s rationale of grouping students at their instructional
level in order to foster success effectively and efficiently. Therefore, the contemporary
answer to the issue is to place students in heterogeneous groups and differentiate
instruction (homogeneous subgroups within a classroom) instead of just placing them in
homogeneous groups as a whole class.

174
An assumption of the instructional leadership theories of pedagogic leadership and
leadership content knowledge, as discussed in chapter two, is that the principal must
understand and have a working knowledge of research-based curriculum and instruction,
a variety of instructional practices, and even specific knowledge of subjects and how
students learn them (Bottoms, 2003; Harris et al., 2004; Stein & Nelson, 2003) These
areas of knowledge are contingent on the philosophical orientation of the principal which
develops through a typology of educational philosophies, such as: professional foci,
philosophical viewpoints, and educational philosophies (Harris et al.) Findings presented
from this research indicate that principals have eclectic beliefs towards both of the two
specific theories of constructivism and instructivism; therefore, effective principals‘
instructional leadership is not necessarily contingent upon such beliefs.
What is known from this study is the fact that effective principals perceive they are
frequently and effectively (since they are principals of effective schools) instructional
leaders. Looking at the findings from this study in their totality, along with the comments
made by a few subjects, it appears effective principals are not concerned with processes
or application as much as they are concerned with developing the big picture (vision,
goals, culture, and frameworks) and the production of actual results.
The practical instructional leadership of the subjects leads to the next two findings
of this study. First, effective high school principals are united in the belief that what is
taught is more important than how it is taught. Second, effective high school principals
are united in the belief that accountability and producing student achievement are
paramount. As discussed previously, the largest common belief among all principals was
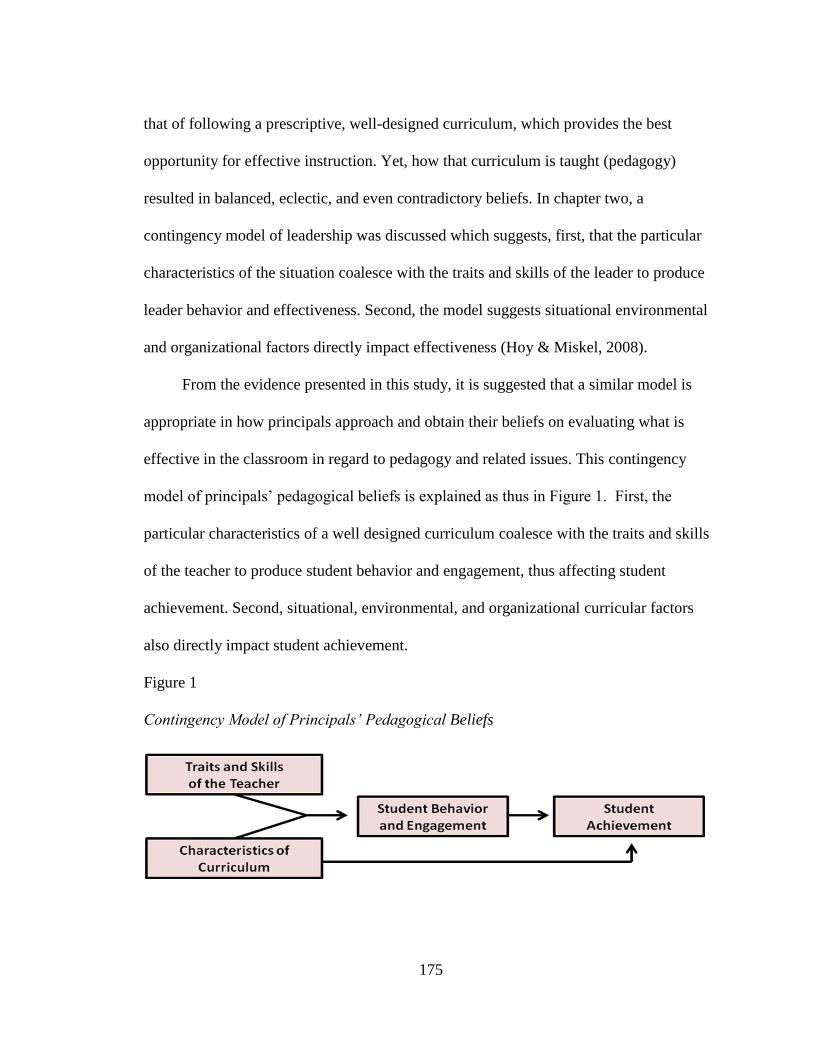
175
that of following a prescriptive, well-designed curriculum, which provides the best
opportunity for effective instruction. Yet, how that curriculum is taught (pedagogy)
resulted in balanced, eclectic, and even contradictory beliefs. In chapter two, a
contingency model of leadership was discussed which suggests, first, that the particular
characteristics of the situation coalesce with the traits and skills of the leader to produce
leader behavior and effectiveness. Second, the model suggests situational environmental
and organizational factors directly impact effectiveness (Hoy & Miskel, 2008).
From the evidence presented in this study, it is suggested that a similar model is
appropriate in how principals approach and obtain their beliefs on evaluating what is
effective in the classroom in regard to pedagogy and related issues. This contingency
model of principals‘ pedagogical beliefs is explained as thus in Figure 1. First, the
particular characteristics of a well designed curriculum coalesce with the traits and skills
of the teacher to produce student behavior and engagement, thus affecting student
achievement. Second, situational, environmental, and organizational curricular factors
also directly impact student achievement.
Figure 1
Contingency Model of Principals’ Pedagogical Beliefs

176
Last, the finding that effective high school principals are united in the belief of
accountability and producing student achievement is evident in the strong beliefs in great
teachers produce student achievement, all students can learn basic skills, the importance
of education (content knowledge) and training for teachers, and scientifically conducted
research is the best guide for determining what and how to teach. This also coincides with
the contingency model of principals‘ pedagogical beliefs and the several comments made
by the principals in this study (Appendix J), in that curricular and pedagogical
considerations are based on student achievement data and analyzed through a
collaborative or distributive model (Hoy & Miskel, 2008).
The principals‘ strong united belief in accountability also relates well to Hill‘s
(2002) general design for improving learning outcomes. In Hills‘ design, beliefs and
understandings are anchored in the center position and interrelate (like a web visually) to
nine critical elements affected by it: leadership and coordination, standards and targets,
monitoring and assessment, classroom teaching programs, professional learning teams,
school and class organization, intervention and special assistance, and home, school, and
community partnerships.
This study suggests that one of the most consistent beliefs and understandings of
effective principals is that the bottom line, the underlining core, is producing student
achievement. This bottom line of student achievement then affects all the facets of
instructional leadership practices and all the critical elements as mentioned above.

177
Recommendations for Educational Leaders
One of the criticisms of effective schools research is that of setting standards by
exceptions. This is the notion that exceptional situations of success can be replicated by
all children in all situations instead of the reality that those exceptions occur under special
circumstances that may not be replicable unless proper resources are available (Thomas
& Bainbridge, 2001). Great pains were made in this study to formulate criteria that did
not include schools of exceptional affluence or alternative organizational design (such as
private schools). All schools are traditional public high schools and receive their general
funding in the same general manner. Regardless of other factors, such as community
wealth and support, all schools in this study had to obtain specific achievement criterion
for their socioeconomic and English language student populations which have historically
underachieved for whatever reason. What this study does, along with similar effective
schools research, is provide an empirical look into the commonalities effective school
principals practice and believe.
Therefore, this study provides important insights into what behaviors and beliefs
should be emulated. Instructional leadership as defined and outlined in the PIMRS should
be fostered. One of the intended uses of the PIMRS instrument is to serve as a
professional development tool within the district and school site. It would be advisable
for any principal to obtain permission to use this valuable tool and honestly gauge one‘s
instructional leadership practices.
Regarding beliefs, this study has added new insight into what effective principals
believe in regards to pedagogy, related issues, and professional issues. The inferences

178
made in this study provide evidence that effective principals have a common belief in
prescriptive, well designed curriculum (the content of what is taught), and accountability,
which lays the foundation to all other instructional leadership practices. Consequently,
educational leaders who desire to be successful in today‘s accountability era should also
hold such beliefs.
A final recommendation is for all principals to gain further knowledge in the
philosophical underpinnings of educational pedagogy, to question common assumptions,
and be a consistent consumer of educational research. Logically speaking, if certain
practices (although popular) lack empirical efficacy, maybe even schools already
classified effective would benefit from avoiding them and instead foster solid, time
tested, and empirically proven practices among their leadership teams and teachers. As
noted previously, the educational edict should be, as the medical profession: first, do no
harm.
Suggestions for Future Study
This mixed methods descriptive and causal-comparative study analyzed what
effective California high school principals do in regards to their instructional leadership
practices and what they believe in regards to their pedagogy, related issues, and
professional issues concerning a constructivist or instructivist view in the current
accountability era. As with most empirical inquiries, the results produce more questions
than it set out to answer. The limitations of this study also create further areas of future
inquiry as discussed in the following section.

179
Since the achievement data used in this study was ex post facto in nature, the
effective schools in this study should be revisited in five years to follow the academic
achievement over a longer period and the retention rates of principals along with the
consistency of their instructional leadership behaviors and pedagogical beliefs. Also, a
larger sample of subjects from similar schools across multiple states would give a broader
view and the ability to use more focused statistical analysis and to increase the ability to
generalize the findings.
Future research should also examine schools who were underachieving and then,
over time, became effective. A criticism of effective schools research is that it looks at
the practices of those who have achieved effective status but neglects the process of
getting there.
Another area of future study would be to look further into principals‘ instructional
leadership practices by comparing their self-perceptions to the perceptions of teachers
serving under them and district leadership serving over them. This will allow for a more
accurate look at what principals actually practice. Another aspect is to compare
instructional leadership practices with similar but underachieving schools to analyze the
differences and similarities. It could very well be that less-effective schools also have
principals who frequently practice good instructional leadership behaviors. Therefore,
this would assist to help better understand the effects of instructional leadership and other
variables not analyzed in this study.
Along similar lines, the same method could be applied to principals‘ pedagogical
beliefs. Researchers could have teachers under the principal and district supervisions over

180
the principal take the PBS but with the direction to assess their perceptions of the
principals‘ beliefs. This would assist in more effectively analyzing the assumption that
principals‘ beliefs directly or indirectly affects the vision, mission, curriculum, and
pedagogy of the school, therefore student achievement.
Since many principals in this study suggested delegation of their instructional
leadership responsibilities and behaviors to other administrators, another area of
suggested research is to look at instructional leadership in the realm of distributive and
professional learning communities. What are the beliefs of assistant principals and
instructional coaches and their impact on the pedagogical practices of the teachers and
the effects on student achievement?
Limitations and Assumptions
The study had the following limitations:
1. As with all causal-comparative research, the lack of manipulation,
randomization, and control factors creates difficulty to establishing cause-effect
relationships.
2. The population established in this study was initially small, which created an
even smaller volunteer sample of 36. Various statistical analyses and alternative research
designs, which would have been deemed more insightful or effective, could not be
utilized in this study because of violations of assumptions from the small numbers in the
variable groups.
3. The subjects who met the criteria as effective were a small number from only
one state. Each state has its own accountability assessment system, which often adjusts

181
and changes from year to year. It also becomes a difficult task to compare and generalize
what is deemed effective and the results obtained from the analysis of effective schools in
one state to what is considered effective in another state or region based on state
accountability systems as the criterion. Therefore, results may not be generalizeable to all
states.
4. The achievement data used in this study was ex post facto in nature and only
used API data from the past two consecutive years, thereby limiting other possible highly
effective schools which could have had one low achieving year in one of the two years of
API reporting used in this study.
5. The PIMRS instrument does not measure a principal‘s effectiveness; rather, it
assesses the degree to which a principal is providing instructional leadership in his or her
school. Similarly, concerning the difficulty in achieving an acceptable response rate from
mailed surveys, this study limited the subjects to just principals of effective schools in
self-reporting their instructional leadership behaviors. The accuracy of the PIMRS
instrument in stating the instructional leadership behaviors of principals is increased if
teachers serving under them or district supervisors serving over them are also surveyed
since, it has been found, that subjects tend to overstate their instructional leadership
behaviors (Hallinger, 1999).
6. Relatively large percentages of the principals chose the undecided or balanced
approach on many of the pedagogical questions in the PBS instrument. It is not known if
their intention was that they were pragmatically balanced between the two or that they

182
were actually undecided, which could mean they lacked a depth of knowledge about the
different pedagogy, philosophy, or research to make an informed decision.
7. The time in which this study was conducted and the response rate obtained was
another limitation. The study was conducted at the closing of the 2009-2010 school year,
which fell between the state testing window and preparation for graduation. Feedback
received through emails and phone calls told a similar story that the month of May and
June were extremely busy for the subjects. Another factor exacerbating the situation was
that the state of California was going though major budget shortfalls due to the economic
downturn and major decreases in tax revenue. The California education budget revisions
were being reported during this time. This added to the time constraints of the principals,
since they were dealing with possible budget cuts and staff reductions. Despite these
issues, a modest return rate was achieved of 56% with a usable return rate of 51% of the
population of 71. According to Ary et al. (2006), for surveys by mail, a return rate of
40% to 75% is common.
This study also included the following assumptions:
1. The state of California‘s API is an accurate gauge of students‘ academic
achievement.
2. The selected principals‘ leadership directly or indirectly affected their schools‘
academic achievement.
3. The selected principals responded accurately and honestly regarding their
instructional leadership behaviors on the PIMRS instrument, their pedagogical beliefs on
the PBS instrument, and their responses on the eight demographic questions.

183
4. The selected principals understood the vocabulary and concepts associated with
instructional leadership and pedagogical practices.
5. The data collected accurately measured the principals‘ instructional leadership
behaviors and beliefs toward pedagogy.
6. The interpretation of the data accurately reflected the self-perceptions and beliefs
of the subjects.
Summary
The research problem, research methods, results, and a discussion of the findings
were presented. Findings from this study indicate the following: (a) effective high school
principals are actively and frequently engaged in all facets of instructional leadership; (b)
in several cases, experienced principals fostered specific aspects of instructional
leadership more than those principals with less experience; (c) effective high school
principals are varied in their pedagogical beliefs and do not believe one particular way or
philosophy with much consistency; (d) effective high school principals are united in the
belief of what is taught is more important than how it is taught; and (e) effective high
school principals are united in the belief of producing student achievement and
accountability. In conclusion, recommendations for educational leaders, suggestions for
further research, and the limitations and assumptions were presented.

184
References
Afifi, A., Clark, V., & May, S. (2004). Computer-aided multivariate analysis (4th
ed.).
Boca Raton, FL: Chapman and Hall.
Alferink, L. A. (2007). Educational practices, superstitious behavior, and mythed
opportunities. The Scientific Review of Mental Health Practice, 5(2), 21-30.
American Psychological Association (2010). Publication manual of the American
Psychological Association (6th
ed.). Washington, DC: American Psychological
Association.
Andrews, R. L., & Morefield, J. (1991). Effective leadership for effective schools.
Education and Urban Society, 23(3), 270-278.
Andrews, R., & Soder, R. (1987). Principal leadership and student achievement.
Educational Leadership, 44(6), 9-11.
Ary, D., Jacobs, L. C., Razavieh, A., & Sorensen, C. (2006). Introduction to research in
education (7th
ed.). Belmont, CA: Thomson Wadsworth.
Austin, C. C. (2008). Gender and educational leadership. The International Journal of
Learning, 15(11), 287-300.
Babbie, E. (1990). Survey research methods (2nd
ed.). Belmont, CA: Wadsworth
Publishing.
Babbie, E. (1994). The sociological spirit (2nd
ed.). Belmont, CA: Wadsworth Publishing.
Baker, B. D., & Cooper, B. S. (2005). Do principals with stronger academic backgrounds
hire better teachers? Policy implications for improving high-poverty schools.
Educational Administration Quarterly, 41(3), 449-479.

185
Barnett, K., & McCormick, J. (2004). Leadership and individual principal-teacher
relationships in schools. Educational Administration Quarterly, 40(3), 406-434.
Bartlett, J. C. (2008). Principal leadership practices: A correlation study of specific
instructional leadership practices and student achievement in the Tennessee
Gateway Tests. (Doctoral dissertation, Liberty University). Retrieved from
http://digitalcommons.liberty.edu/doctoral/60/
Beck, L. G., & Murphy, J. (1993). Understanding the principalship: Metaphorical
themes, 1920s-1990s. New York: Teachers College Press.
Becker, W. C., & Gersten, R. (2001). Follow-up on follow through: The later effects of
the direct instruction model on children in fifth and sixth grades. Journal of Direct
Instruction, 19(1), 75-92.
Bernhardt, V. L. (2004). Data analysis for continuous school improvement (2nd
ed.).
Larchmont, NY: Eye on Education.
Blasé, J., & Blasé, J. (1999). Principals‘ instructional leadership and teacher
development: Teachers‘ perspectives. Educational Administration Quarterly,
35(3), 349-378.
Borba, M. F. (2009). What‘s teaching got to do with it? Leadership, 38(5), 16-37.
Boslaugh, S., & Watters, P. (2008). Statistics. Sebastopol, CA: O‘Reilly Media, Inc.
Bottoms, G. (2003). What school principals need to know about curriculum and
instruction. ERS Spectrum, 21(1), 29-31.
Brizendine, L. (2006). The female brain. New York, NY: Morgan Road Books.

186
Brock, K. J., & Groth, C. (2003). ―Becoming effective‖: Lessons from one state‘s
initiative in schools serving low income children. Journal of Educational for
Students Placed as Risk, 8(1), 167-190.
Brookover, W. B., Beady, C., Flood, P. Schweitzer, J., & Wisenbaker, J. (1979). School
social systems and student achievement: Schools can make a difference. New
York: Praeger.
Buehl, M. M., & Fives, H. (2009). Exploring teachers‘ beliefs about teaching knowledge:
Where does it come from? Does it change? The Journal of Experimental
Education, 77(4), 367-407.
Cahill, L. (2005). His brain, her brain. Scientific American, 292(5), 40–47.
California Department of Education. (2009a). 2008-2009 Academic Performance Index
reports: Information guide. Retrieved from
http://www.cde.ca.gov/ta/ac/ap/documents/infoguide08.pdf
California Department of Education. (2009b). 2008-2009 Glossary-Base API. Retrieved
from http://www.cde.ca.gov/ta/ac/ap/glossary09b.asp#ga10
California Department of Education. (2009c). Overview of California’s 2008-09
accountability progress reporting system. Sacramento, CA: Author.
California Department of Education. (2009d). Dataquest. Retrieved from
http://dq.cde.ca.gov/dataquest/.
California State Legislature. (1999). The public schools accountability act. Statutes of
1999 (chap. 3). Sacramento, CA: Author.

187
Camburn, E., Rowan, B., & Taylor, J. E. (2003). Distributed leadership in schools: The
case of elementary schools adopting comprehensive school reform models.
Education Evaluation and Policy Analysis, 25(4), 347-373.
Carnine, D. (2000). Why education experts resist effective practices (and what it would
take to make education more like medicine). Washington, DC: Thomas B.
Fordham Foundation.
Clark, D., Martorell, P., & Rockoff, J. (2009). School principals and school performance
(Working Paper No. 38). Retrieved from CALDER Urban Institute website:
http://www.urban.org/UploadedPDF/1001427-school-principals.pdf
Clark, R. E. (2009). How much and what type of guidance is optimal for learning from
instruction? In S. Tobias & T. M. Duffy (Eds.), Constructivist instruction:
Success or failure? (pp. 158-183). New York, NY: Routledge.
Cohen, D. (1996). Standards-based school reforms: Policy, practice and performance. In
H. Ladd (Ed.), Holding schools accountable: Performance based reform in
education (pp. 99-127). Washington, DC: Brookings Institute.
Colegrave, N., & Ruxton, G. D. (2002). Confidence intervals are a more useful
complement to nonsignificant tests than are power calculations. Behavioral
Ecology, 14(3), 446-450.
Coleman, J. S., Campbell, C. J., Hobson, C. J., McPartland, J., Mood, A. M., Weinfeld, F.
D., & York, R. L. (1966). Equality of educational opportunity. Washington, DC:
National Center for Educational Statistics, Office of Education.

188
Combs, A. W., Miser, A. B., & Whitaker, K. S. (2006). On becoming a school leader: A
person-centered challenge. Alexandria, VA: Association for Supervision and
Curriculum.
Cotton, K. (2003). Principals and student achievement: What research says. Alexandria,
VA: Association for Supervision and Curriculum Development.
Crum, K. S., & Sherman, W. H. (2008). Facilitating high achievement: High school
principals‘ reflections on their successful leadership practices. Journal of
Educational Administration, 46(5), 562-580.
Datnow, A. & Castellano, M. E. (2001). Managing and guiding school reform:
Leadership in Success for All Schools. Educational Administration Quarterly,
37(2), 219-249.
Day, C., Leithwood, K., & Sammons, P. (2008). What we have learned, what we need to
know more about. School Leadership and Management, 28(1), 83-96.
Deal, T. E., & Peterson, K. D. (1999). Shaping the school culture: The heart of
leadership. San Francisco, CA: Jossey-Bass.
DeBray-Pelot, E., & McGuinn, P. (2009). The new politics of education: Analyzing the
federal education policy landscape in the post-NCLB era. Educational Policy,
23(1), 15-42.
DeVries, R., Zan, B., Hildebrandt, C., Edmiaston, R., & Sales, C. (2002). Developing
constructivist early childhood curriculum: Practical principles and activities.
New York: Teacher College Press.

189
Dillman, D. A. (2000). Mail and internet surveys: A tailored design method (2nd ed.).
New York: John Wiley & Sons, Inc.
DiPaola, M. F., & Tschannen-Moran, M. (2005). Bridging or buffering? The impact of
schools‘ adaptive strategies on student achievement. Journal of Educational
Administration, 43(1), 60-71.
Duffy, T. M. (2009). Building lines of communication and a research agenda. In S.
Tobias & T. M. Duffy (Eds.), Constructivist instruction: Success or failure? (pp.
351-367). New York, NY: Routledge.
Duke, D. L. (1987). School leadership and instructional improvement. New York:
Random House.
Edmonds, R. (1979). Effective schools for the urban poor. Educational Leadership,
37(1), 15-24.
Edmonds, R. (1982). Programs of school improvement: An overview. Educational
Leadership, 40(3), 8-11.
Edmondson, H. T. (2006). John Dewey and the decline of American education: How the
patron saint of schools has corrupted teaching and learning. Wilmington, DE: ISI
Books.
Eggen, P. D., & Kauchak, D. P. (2001). Strategies for teachers: Teaching content and
thinking skills (4th
ed.). Needham Heights, MA: Allyn and Bacon.

190
Ellis, S., Gaudet, R., Shultz, G., Kaufman, L., Hoover, M., Spencer, M., & Su, D. (2007).
Gaining traction: Urban educators’ perspectives on the critical factors
influencing student achievement in high and low performing urban public
schools. Hadley, MA: University of Massachusetts Donahue Institute and the
Office of Educational Quality and Accountability.
Elmore, R., Abelmann, C., & Fuhrmann, S. (1996). The new accountability in state
education reform: From process to performance. In H. Ladd (Ed.), Holding
schools accountable: Performance based reform in education. (pp. 65-98).
Washington, DC: Brookings Institute.
Estrada, D., Frame, M. W., & Williams, C. B. (2004). Cross-cultural supervision:
Guiding the conversation toward race and ethnicity. Journal of Multicultural
Counseling and Development, 32(1), 307-319.
Evers, W. M. (2001). Standards and accountability. In T. M. Moe (Ed.), A Primer on
America’s Schools. (pp. 205-248). Stanford, CA: Hoover Institution Press.
Evers, W. M., Izumi, L. T., & Riley, P. A. (Eds.). (2001). School reform: The critical
isuses. Stanford, CA: Hoover Institution Press.
Fang, Z. (1996). A review of research on teacher beliefs and practices. Educational
Research, 38(1), 47-65.
Fernandez, K., et al. (2007). Principal performance in Texas: Tools for measuring
effective school leadership. College Station, TX: Texas A&M University.

191
Fletcher, J. D. (2009). From behaviorism to constructivism: A philosophical journey from
drill and practice to situated learning. In S. Tobias & T. M. Duffy (Eds.),
Constructivist instruction: Success or failure? (pp. 242-263). New York, NY:
Routledge.
Fuller, B., Loeb, S., Arshan, N., Chen, A., & Yi, S. (2007). California principals’
resources: Acquisition, deployment, and barriers. Stanford, CA: Institute for
Research on Education Policy & Practice. Retrieved from
http://irepp.stanford.edu/documents/GDF/STUDIES/13-Fuller/13-Fuller(3-
07).pdf
Garson, G. D. (2010). Reliability analysis. Retrieved from
http://faculty.chass.ncsu.edu/garson/PA765/reliab.htm#internal
Gersten, R., & Keating, T. (1987). Long-term benefits from direct instruction.
Educational Leadership, 44(6), 28-31.
Glatthorn, A. A., & Jailall, J. M. (2009). The principal as curriculum leader: Shaping
what is taught and tested (3rd
ed.). Thousand Oaks, CA: Corwin Press.
Graczewski, C., Knudson, J., & Holtzman, D. J. (2009). Instructional leadership in
practice: What does it look like, and what influence does it have? Journal of
Education for Students at Risk (JESPAR), 14(1), 72-96.
Green, S. K., & Gredler, M. E. (2002). A review and analysis of constructivism for
school-based practice. School Psychology Review, 31(1), 53-70.

192
Gresalfi, M. S., & Lester, F. (2009). What‘s worth knowing in mathematics? In S. Tobias
& T. M. Duffy (Eds.), Constructivist instruction: Success or failure? (pp. 264-
290). New York, NY: Routledge.
Gutek, G. L. (2005). Historical and philosophical foundations of education: A
biographical introduction (4th
ed.). Upper Saddle River, NJ: Pearson Merrill
Prentice Hall.
Haggard, R. L. (2008). The instructional leadership practices of principals in K-8 schools
and their impact on student learning outcomes (Doctoral dissertation). Retrieved
from ProQuest Dissertation and Theses database. (UMI No. 3329704)
Hallinger, P. (1983). Assessing the instructional management behavior of principals.
(Doctoral dissertation). Retrieved from ProQuest Dissertations and Theses
database. (UMI No. AAT 8320806)
Hallinger, P. (1992). The evolving role of American principals: From managerial to
instructional to transformational leaders. Journal of Educational Administration,
30(3), 35-49.
Hallinger, P. (1999). Instructional management rating scale: Resource manual PIMRS
version 2.2. Bangkok, Thailand: Author.
Hallinger, P. (2000, April). A review of two decades of research of the principalship
using the “Principal Instructional Management Rating Scale”. Paper presented at
the annual meeting of the American Educational Research Association, Seattle,
WA.

193
Hallinger, P. (2003) Leading educational change: Reflections on the practice of
instructional and transformational leadership. Cambridge Journal of Education,
33(3), 329-351.
Hallinger, P. (2008, March). Methodologies for studying school leadership: A review of
25 years of research using the Principal Instructional Management Rating Scale.
Paper presented at the meeting of the American Educational Research
Association. Retrieved from
http://www.philiphallinger.com/papers/PIMRS_Methods_47.pdf
Hallinger, P., & Heck, R. H. (1996). Reassessing the principal‘s role in school
effectiveness: A review of empirical research, 1980-1995. Educational
Administration Quarterly, 32(1), 5-44.
Hallinger, P., & Heck, R. H. (1998). Exploring the principal‘s contribution to school
effectiveness: 1980-1995. School Effectiveness and School Improvement, 9(2),
157-191.
Hallinger, P., & Murphy, J. (1985). Assessing the instructional management behaviors of
principals. Elementary School Journal, 86(2), 217-247.
Hallinger, P. & Murphy, J. (1987). Assessing and developing principal instructional
leadership. Educational Leadership, 45(1), 54-61.
Harris, A., Leithwood, K., Day, C., Sammons, P., & Hopkins, D. (2007). Distributed
leadership and organizational change: Reviewing the evidence. Journal of
Educational Change, 8(4), 337-347.

194
Harris, M., Cavanagh, R. F., Reynolds, P. S., & Gidding, G. J. (2004). Understanding
what principals value about leadership, teaching and learning: A philosophical
approach. Paper presented at the Annual Conference of the Australian
Association for Research in Education. Melbourne, Australia.
Henderson, J. G., & Slattery, P. (2007). Understanding curriculum and pedagogy in
relation to concepts of curriculum leadership. Journal of Curriculum & Pedagogy,
4(2), 1-5.
Herman, P., & Gomez, L. M. (2009). Taking guided learning theory to school. In S.
Tobias & T. M. Duffy (Eds.), Constructivist instruction: Success or failure? (pp.
62-81). New York, NY: Routledge.
Hermans, R., Van Braak, J., & Van Keer, H. (2008). Development of the beliefs about
primary education scale: Distinguishing a developmental and transmissive
dimension. Teaching and Teacher Education, 24(1), 127-139.
Heward, W. L. (2003). Ten faulty notions about teaching and learning that hinder the
effectiveness of special education. The Journal of Special Education, 36(4), 186-
205.
Hill, P. W. (2002). What principals need to know about teaching and learning. In M. S.
Tucker & J. B. Codding (Eds.), The principal challenge: Leading and managing
schools in an era of accountability (pp. 43-76). San Fransisco, CA: Jossey-Bass.
Hirsch, E. D. (2009). The making of Americans: Democracy and our schools. New
Haven, CT: Yale University Press.

195
Hirsch, E. D. (2001a). The roots of the education wars. In T. Loveless (Ed.), The Great
Curriculum Debate: How should we teach reading and math? (pp. 13-24).
Washington, DC: Brookings Institution Press.
Hirsch, E. D. (2001b). Romancing the child: Progressivism‘s philosophical roots.
Education Matters, 1(1), 1-5.
Hoenig, J. M., & Heisey, D. M. (2001). The abuse of power: The pervasive fallacy of
power calculations for data analysis. The American Statistician, 55(1), 19-24.
Hofstede, G. (2001). Culture’s consequences: Comparing values, behaviors, institutions,
and organizations across nations. (2nd
ed.). Thousand Oaks, CA: Sage Publishing.
Hofstede, G. (1993). Cultural constraints in management theories. Academy of
Management Executive, 7(1), 81-94.
Horst, M. D., & Martin, B. N. (2007). A case study: Leadership and its effects on
achievement of children from poverty in a rural setting. The Rural Educator,
28(3), 33-40.
Hoy, W. K., & Miskel C. G. (2008). Educational administration: Theory, research, and
practice (8th
ed.). New York, NY: McGraw Hill.
Hyslop-Margison, E. J., & Strobel, J. (2008). Constructivism and education:
Misunderstandings and pedagogical implications. The Teacher Educator, 43(1),
72-86.
Izumi, L. T., & Coburn, K. G. (2001). Facing the classroom challenge: Teacher quality
and teacher training in California’s schools of education. San Francisco: Pacific
Research Institute for Public Policy.

196
Jenkins, B. (2009). What it takes to be an instructional leader. Principal, 88(3), 34-37.
Jensen, A. R. (1969). How much can we boost IQ and scholastic achievement? Harvard
Educational Review, 39(1), 1-123.
Jonassen, D. (2009). Reconciling a human cognitive architecture. In S. Tobias & T. M.
Duffy (Eds.), Constructivist instruction: Success or failure? (pp. 13-33). New
York, NY: Routledge.
Kaplan, L. S., Owings, W. A., & Nunnery, J. (2005). Principal quality: A Virginia study
connecting Interstate School Leaders Consortium Standards with student
achievement. NASSP Bulletin, 89(643), 28-44.
Kauffman, J. M., & Sasso, G. M. (2006). Toward ending cultural and cognitive relativism
in special education. Exceptionality, 14(2), 65-90.
Kelley, C., & Peterson, K. D. (2002). The work of principals and their preparation:
Addressing critical needs for the twenty-first century. In M. S. Tucker & J. B.
Codding (Eds.), The principal challenge: Leading and managing schools in an
era of accountability (pp. 247-306). San Francisco, CA: Jossey-Bass.
Kim, T., & Axelrod, S. (2005). Direct instruction: An educators‘ guide and a plea for
action. The Behavior Analyst Today, 6(2), 111-120.
Kimura, D. (2002). Sex hormones influence human cognitive pattern.
Neuroendocrinology Letters, 23(4), 67-77.
Kirschner, P. (2009). Epistemology or pedagogy, that is the question. In S. Tobias & T.
M. Duffy (Eds.), Constructivist instruction: Success or failure? (pp. 144-157).
New York, NY: Routledge.

197
Kirschner, P. A., Sweller, J., & Clark, R. E. (2006). Why minimal guidance during
instruction does not work: An analysis of the failure of constructivist, discovery,
problem-based, experiential, and inquiry-based teaching. Educational Psychology,
41(2), 75-86.
Klahr, D. (2009). ―To everything there is a season, and a time to every purpose under the
heavens‖: What about direct instruction? In S. Tobias & T. M. Duffy (Eds.),
Constructivist instruction: Success or failure? (pp. 291-310). New York, NY:
Routledge.
Kozloff, M. A. (2005). Fads in general education: Fad, fraud, and folly. In J. Jacobson, R.
Foxx, & J. Mulick (Eds.), Controversial therapies for developmental disabilities:
Fad, fashion, and education science in professional practice. New York:
Routledge.
Kruger, M. L. (2008). School Leadership, sex and gender: Welcome to difference.
International Journal of Leadership in Education, 11(2), 155-168.
LaPointe, C., & Davis, S. (2006, November). School leadership study: Developing
successful principals. Paper presented at the Annual Convention of the University
Council for Educational Administration, San Antonio, TX. Retrieved from
http://seli.stanford.edu/research/documents/ucea_papers/sls_ucea_leaders.pdf
Lashway, L. (2002). Developing instructional leaders. ERIC Educational Reports.
Retrieved from
http://findarticles.com/p/articles/mi_pric/is_200207/ai_1107165330/

198
Leithwood, K. (2005). Educational leadership: A review of the research. Philadelphia,
PA: The Laboratory for Student Success, Temple University Center for Research
in Human Development and Education.
Leithwood, K. (2008). Should educational leadership focus on best practices or next
practices? Journal of Educational Change, 9(1), 71-75.
Leithwood, K., Harris, A., & Hopkins, D. (2008). Seven strong claims about successful
school leadership. School Leadership and Management, 28(1), 27-42.
Leithwood, K., & Jantizi, D. (2005). A review of transformational school leadership
research, 1996-2005. Leadership and Policy in Schools, 4(3), 177-199.
Leithwood, K., & Jantzi, D. (2008). Linking leadership to student learning: The
contributions of leader efficacy. Educational Administration Quarterly, 44(4),
496-528.
Leithwood, K., Jantzi, D., & Steinbach, R. (1999). Effective school leaders: How to
evaluate for changing times. Buckingham, UK: Open University Press.
Leithwood, K., Seashore Louis, K., Anderson, S., & Wahlstrom, K. (2004). How
leadership influences student achievement. Minneapolis, MN: Center for Applied
Research and Educational Improvement and Ontario Institute for Studies in
Education.
Leithwood, K., & Mascall, B. (2008). Collective leadership effects on student
achievement. Educational Administration Quarterly, 44(4), 529-561.
Levine, D. U. (1991). Creating effective schools: Findings and implications from
research and practice. Phi Delta Kappa, 72(5), 389-393.
199
Levine, M. & Ensom, M. H. (2001). Post hoc power analysis: An idea whose times has
passed? Pharmacotherapy, 21(4), 405-409.
Lezotte, L. W. (1991). Correlates of effective schools: The first and second generation.
Okemos, MI: Effective Schools Products, Ltd.
Loveless, T. (2001). A tale of two math reforms: The politics of the new math and the
NCTM Standards. In T. Loveless (Ed.), The great curriculum debate: How should
we teach reading and math? (pp. 184-209). Washington, DC: Brookings
Institution Press.
Luo, M. (2008). Structural equation modeling for high school principals‘ data-driven
decision making: An analysis of information use environment. Educational
Administration Quarterly, 44(5), 603-634.
MacNeill, N., Cavanagh, R. F., & Silcox, S. (2003). Pedagogic principal leadership.
Management in Education, 17(4), 14-17.
Mangin, M. M. (2007). Facilitating elementary principal‘s support for instructional
teacher leadership. Educational Administration Quarterly, 43(3), 319-357.
Marks, H. M., & Printy, S. M. (2003). Principal leadership and school performance: An
integration of transformational and instructional leadership. Educational
Administration Quarterly, 39(3), 370-397.
Marzano, R. J., Waters, T., & McNulty, B. A. (2005). School leadership that works:
From research to results. Alexandria, VA: Association for Supervision and
Curriculum Development.

200
Mayer, R. E. (2009). Constructivism as a theory of learning versus constructivism as a
prescription for instruction. In S. Tobias & T. M. Duffy (Eds.), Constructivist
instruction: Success or failure? (pp. 184-200). New York, NY: Routledge.
Mayer, R. E. (2004). Should there be a three-strikes rule against pure discovery learning?
American Psychologist, 59(1), 14-19.
McCarthy, M. M., Auger, A. P., & Perrot-Sinal, T. S. (2002). Getting excited about
GABA and sex differences in the brain. Trends in Neuroscience, 25(6), 307–311.
McEwan, E. K. (2009). 10 traits of highly effective schools: Raising the achievement bar
for all students. Thousand Oaks, CA: Corwin Press.
Meyer, D. L. (2009). The poverty of constructivism. Educational Philosophy and Theory,
41(3), 332-341. doi: 10.1111/j.1469-5812.2008.00457.x
Murphy, J. (1999). Reconnecting teaching and school administration: A call for a unified
profession. Paper presented at the annual meeting of the American Educational
Research Association, Montreal. Retrieved from
http://www.ucea.org/storage/review/spring1999.pdf
Murphy, J. (2005). Unpacking the foundations of ISLLC standards and addressing
concerns in the academic community. Educational Administration Quarterly,
41(1), 154-191.
Murphy, P. K., Delli, L. M., & Edwards, M. N. (2004). The good teacher and good
teaching: Comparing beliefs of second-grade students, preservice teachers, and
inservice teacher. The Journal of Experimental Education, 72(2), 69-92.
Myslinski, M. (2009). The right to a good contract. California Educator, 14(2), 24-26.

201
National Commission for Excellence in Education. (1983). A nation at risk: The
imperative for educational reform. Washington, DC: Government Printing Office.
Nelson, B. S., Stimpson, V. C., & Jordan, W. J. (2007). Leadership content knowledge
for mathematics of staff engaged in key school leadership functions. Paper
presented at the annual meetings of the University Council of Education
Administration, Washington, DC.
Nettles, S. M., & Herrington, C. (2007). Revisiting the importance of the direct effects of
school leadership on student achievement: The implications for school
improvement policy. Peabody Journal of Education, 82(4), 724-736.
Noddings, N. (2005). What does it mean to educate the whole child? Educational
Leadership, 63(1), 8-13.
Oberman, I., Arbeit, C., Praglin, C., & Goldstein, S. (2005). Challenged schools,
remarkable results: Three lessons from California’s highest achieving high
schools. San Francisco, CA: Springboard Schools.
O‘Donnell, R. J., & White, G. P. (2005). Within the accountability era: Principals‘
instructional leadership behaviors and student achievement. NASSP Bulletin,
89(645), 56-71.
Olson, L. (1999). Tugging at tradition. Education Week, 18(32), 25-29.
Owens, R. G., & Valesky, T. C. (2007). Organizational behavior in education: Adaptive
leadership and school reform (9th
ed.). Boston, MA: Allyn and Bacon.
Pajares, M. F. (1992). Teachers‘ beliefs and educational research: Cleaning up a messy
construct. Review of Educational Research, 62(3), 307-332.

202
Perez, M., & Socias, M. (2008). Highly successful schools: What do they do differently
and at what cost? Education Finance and Policy, 3(1), 109-129.
Persell, C. H., Cookson, P. W., & Lyons, H. (1982). Effective principals: What do we
know from various educational literatures? Paper presented at the National
Conference on the Principalship, convened by the National Institute of Education,
Washington, DC. Retrieved from ERIC database (Ed224177).
Phillips, D. C. (1995). The good, the bad, and the ugly: The many faces of
constructivism. Educational Researcher, 24(7), 5-12.
Popp, P. A. (2004). Reading on the go! Volume 1: Students who are highly mobile and
reading instruction. Greensboro, NC: SERVE Center at the University of North
Carolina.
Quinn, D. M. (2002). The impact of principal leadership behaviors on instructional
practice and student engagement. Journal of Educational Administration, 40(5),
447-467.
Quint, J. C., Akey, T. M., Rappaport, S., & Willner, C. J. (2007). Instructional
leadership, teaching quality, and student achievement: Suggestive evidence from
three urban school districts. Oakland, CA: MDRC.
Rea, L. M., & Parker, R. A. (2005). Designing & conducting survey research: A
comprehensive guide (3rd
ed.). San Francisco, CA: Jossey-Bass.
Robinson, V. M. J., Lloyd, C. A., & Rowe, K. J. (2008). The impact of leadership on
student outcomes: An analysis of the differential effects of leadership types.
Educational Administration Quarterly, 44(5), 635-674.

203
Rorrer, A. K., Skrla, L., & Scheutich, J. J. (2008). District as instructional actors in
educational reform. Educational Administration Quarterly, 44(3), 307-358.
Rosenshine, B. (2009). The empirical support for direct instruction. In S. Tobias & T. M.
Duffy (Eds.), Constructivist instruction: Success or failure? (pp. 201-220). New
York, NY: Routledge.
Rudner, L. M., & Schafer, W. D. (2001). Reliability. Eric Digest. Retrieved from
http://www.ericdigests.org/2002-2/reliability.htm
Ruebling, C. E., Stow, S. B., Kayona, F. A., & Clarke, N. A. (2004, Spring). Instructional
leadership: An essential ingredient for improving student learning. The
Educational Forum. Retrieved from
http://findarticles.com/articles/mi_qa4013/is_200404/ai_n9406491/
Rutter, M., Maughan, B., Mortimore, P., Ouston, J., & Smith, A. (1979). Fifteen
thousand hours: Secondary schools and their effects on children. Cambridge,
MA: Harvard University Press.
Schoen, L., & Fusarelli, L. D. (2008). Innovation, NCLB, and the fear factor: The
challenge of leading 21st-century schools in an era of accountability. Educational
Policy, 22(1), 181-203.
Schwartz, D. L., Lindgren, R., & Lewis, S. (2009). Constructivism in an age of non-
constructivism assessments. In S. Tobias & T. M. Duffy (Eds.), Constructivist
instruction: Success or failure? (pp. 34-61). New York, NY: Routledge.

204
Shah, S. J. A. (2010). Re-thinking educational leadership: Exploring the impact of culture
and belief systems. The International Journal of Leadership in Education, 13(1),
27-44.
Sheppard, B. (1996). Exploring the transformational nature of instructional leadership.
Alberta Journal of Educational Research, 42(4), 325-344.
Sherman, W. H., & Crum, K. S. (2007). Student achievement: Elementary principal
catalysts—instructional leadership in reading. International Journal of
Educational Reform, 16(4), 390-410.
Silins, H. C., & Murray-Harvey, R. (1999). What makes a good senior secondary school?
Journal of Educational Administration, 37(4), 329-344.
Slavin, R. E. (2005). Evidence-based reform in education: Promise and pitfalls. Mid-
Western Educational Researcher, 18(1), 8-13.
Smylie, M. A., Lazarus, V., & Brownlee-Conyers, J. (1996). Instructional outcomes of
school-based participative decision making. Educational Evaluation and Policy
Analysis, 18(3), 181-198.
Snider, V. E., & Roehl, R. (2007). Teachers‘ beliefs about pedagogy and related issues.
Psychology in Schools, 44(8), 873-886. doi: 10.1002/pits.20272
Snider, V. E., & Schumitsch, R. (2006). A comparison of teacher attitudes and beliefs
about issues in education across conventional and direct instruction schools.
Journal of Direct Instruction, 6(1), 17-33.
Snyder, K. J. (1983). Instructional leadership for productive schools. Educational
Leadership, 40(5), 32.

205
Southworth, G. (2002). Instructional leadership in schools: Reflections and empirical
evidence. School Leadership & Management, 22(1), 73-91.
Spiro, R. J., & DeSchryver, M. (2009). Constructivism: When it is the wrong idea and
when it‘s the only idea. In S. Tobias & T. M. Duffy (Eds.), Constructivist
instruction: Success or failure? (pp. 106-123). New York, NY: Routledge.
Stiggins, R., & Duke, D. (2008). Effective instructional leadership requires assessment
leadership. Phi Delta Kappan, 90(4), 285-291.
Stine, M. K, & Nelson, B. S. (2003). Leadership content knowledge. Educational
Evaluation and Policy Analysis, 25(4), 423-448.
Stone, J. E. (2002). Teacher training and pedagogical methods. In L. Izumi & W. Evers
(Eds.), Teacher Quality (pp. 33-54). Sanford, CA: Hoover Institution Press.
Sweller, J. (2009). What human cognitive architecture tells up about constructivism. In S.
Tobias & T. M. Duffy (Eds.), Constructivist instruction: Success or failure? (pp.
127-143). New York, NY: Routledge.
Teddlie, C., & Reynolds, D. (2000). The international handbook of school effectiveness
research. New York, NY: Falmer Press.
Terman, L. (1916). The measurement of intelligence. Boston: Houghton Mifflin.
Timar, T. B. (2003). The ―new accountability‖ and school governance in California.
Peabody Journal of Education, 78(4), 177-200.
Tisdell, E. J., & Taylor, E. W. (1999). Adult education philosophy informs practice. Adult
Learning, 11(2), 6-10.

206
Thomas, M. D., & Bainbridge, W. L. (2001). The contamination of the effective schools
movement. School Administrator, 58(3), 55.
Tobias, S. (2009). An eclectic appraisal of the success or failure of constructivist
instruction. In S. Tobias & T. M. Duffy (Eds.), Constructivist instruction: Success
or failure? (pp. 335-350). New York, NY: Routledge.
Tobias, S., & Duffy, T. M. (2009). The success or failure of constructivist instruction: An
introduction. In S. Tobias & T. M. Duffy (Eds.), Constructivist instruction:
Success or failure? (pp. 3-10). New York, NY: Routledge.
U.S. Department of Education. (2004). Four pillars of NCLB. Retrieved from
http://www.ed.gov/nclb/overview/intro/4pillars.html
Wahlstrom, K. L., & Louis, K. S. (2008). How teachers experience principal leadership:
The role of professional community, trust, efficacy, and shared responsibility.
Educational Administration Quarterly, 44(4), 458-495.
Walberg, H. J. (2001). Achievement in American schools. In T. M. Moe (Ed.), A Primer
of American Schools (pp. 43-67). Stanford, CA: Hoover Institution Press.
Walberg, H. J. (2002). Teaching methods. In L. Izumi & W. Evers (Eds.), Teacher
quality (pp. 55-72). Stanford, CA: Hoover Institution Press.
Walberg, H. J., & Bast, J. L. (2003). Education and capitalism: How overcoming our fear
of markets can improve America’s schools. Stanford, CA: Hoover Institution
Press.

207
Waters, J. T., Marzano, R. J., & McNulty, B. A. (2003). Balanced leadership: What 30
years of research tells us about the effect of leadership on student achievement.
Aurora, CO: Mid-Continent Research for Education and Learning.
Williams, T., Kirst, M., Haertel, E., et al. (2005). Similar students, different results: Why
do some schools do better? A large survey of California elementary schools
serving low-income students. Mountain View, CA: EdSource.
Willingham, D. T. (2009). Why don’t students like school?: A cognitive scientist answers
questions about how the mind works and what it means for the classroom. San
Francisco, CA: Jossey-Bass.
Wise, A. F., & O‘Neill, K. (2009). Beyond more versus less: A reframing of the debate
on instructional guidance. In S. Tobias & T. M. Duffy (Eds.), Constructivist
instruction: Success or failure? (pp. 84-105). New York, NY: Routledge.
Witcher, L. A., Onwuegbuzie, A. J., Collins, K. M. T., Witcher, A. E., Minor, L. C., &
James, T. L. (2002). Relationship between teacher efficacy and beliefs about
education. Paper presented at the Annual Meeting of the Mid-South Educational
Research Association, Chattanooga, TN.
Witziers, B., Bosker, R. J., & Kruger, M. L. (2003). Educational leadership and student
achievement: The elusive search for an association. Educational Administration
Quarterly, 39(3), 398-425.

208
Woolley, S. L., Benjamin, W., & Woolley, A. W. (2004). Construct validity of a self-
report measure of teacher beliefs related to constructivist and traditional
approaches to teaching and learning. Educational and Psychological
Measurement, 64(2), 319-331.
Ylimaki, R. M. (2007). Instructional leadership in challenging US schools. International
Studies in Educational Administration, 35(3), 11-19.
Zumbo, B. D., & Hubley, A. M. (1998). A note on misconceptions concerning
prospective and retrospective power. The Statistician, 47(2), 385-388.

209
Appendix A
Liberty University IRB Approval

210
Appendix B
Permission to use the PIMRS

211
Appendix C
Permission to Use the PBS

212
Appendix D
―Effective California High Schools 2007-2008 to 2008-2009 School Year

213
Appendix E
Pre-Notice Letter

214
Appendix F
Survey Cover Letter

215
Appendix G
Questionnaire Packet

216
Appendix G
Questionnaire Packet (Continued)
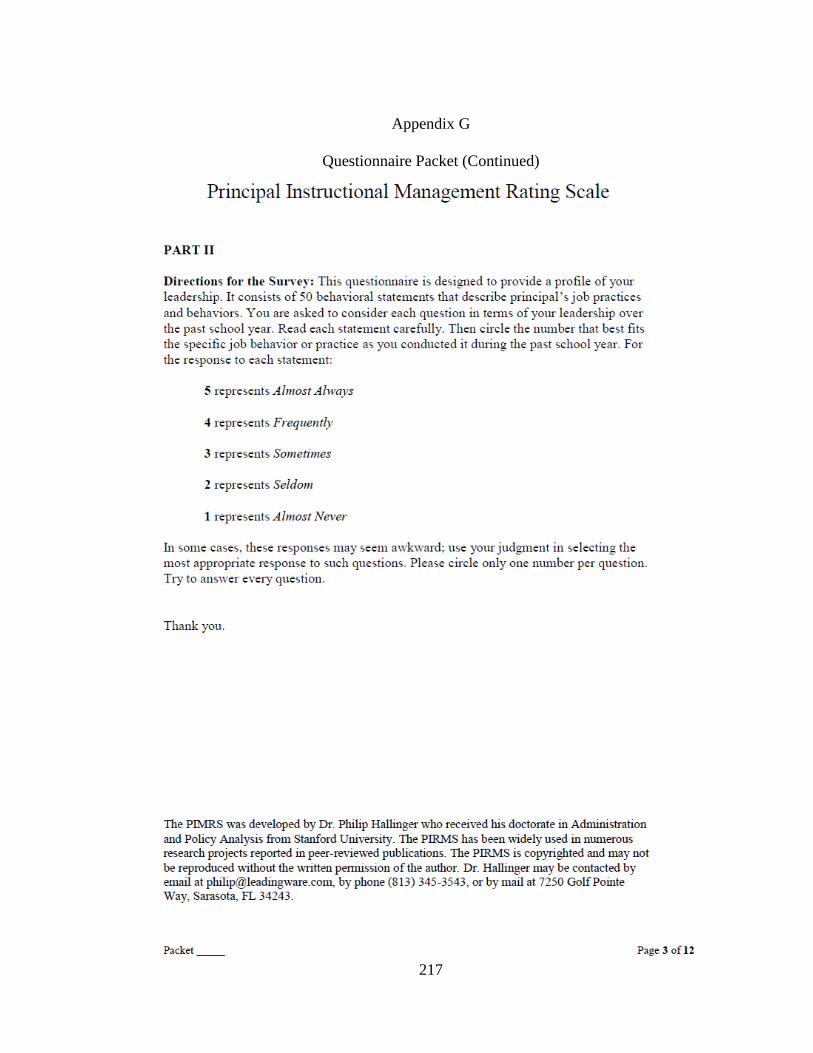
217
Appendix G
Questionnaire Packet (Continued)

218
Appendix G
Questionnaire Packet (Continued)

219
Appendix G
Questionnaire Packet (Continued)

220
Appendix G
Questionnaire Packet (Continued)

221
Appendix G
Questionnaire Packet (Continued)

222
Appendix G
Questionnaire Packet (Continued)

223
Appendix G
Questionnaire Packet (Continued)

224
Appendix G
Questionnaire Packet (Continued)

225
Appendix G
Questionnaire Packet (Continued)

226
Appendix G
Questionnaire Packet (Continued)

227
Appendix H
Survey Reminder Postcard

228
Appendix I
Survey Reminder E-Mail

229
Appendix J
ANOVA Descriptive Statistics Tables
Table J1
Descriptive Statistics of PIMRS Job Functions to Gender

230
Appendix J (Continued)
ANOVA Descriptive Statistics Tables
Table J2
Descriptive Statistics of PIMRS Job Functions to Ethnicity

231
Appendix J (Continued)
ANOVA Descriptive Statistics Tables
Table J2 (Continued)
Descriptive Statistics of PIMRS Job Functions to Ethnicity
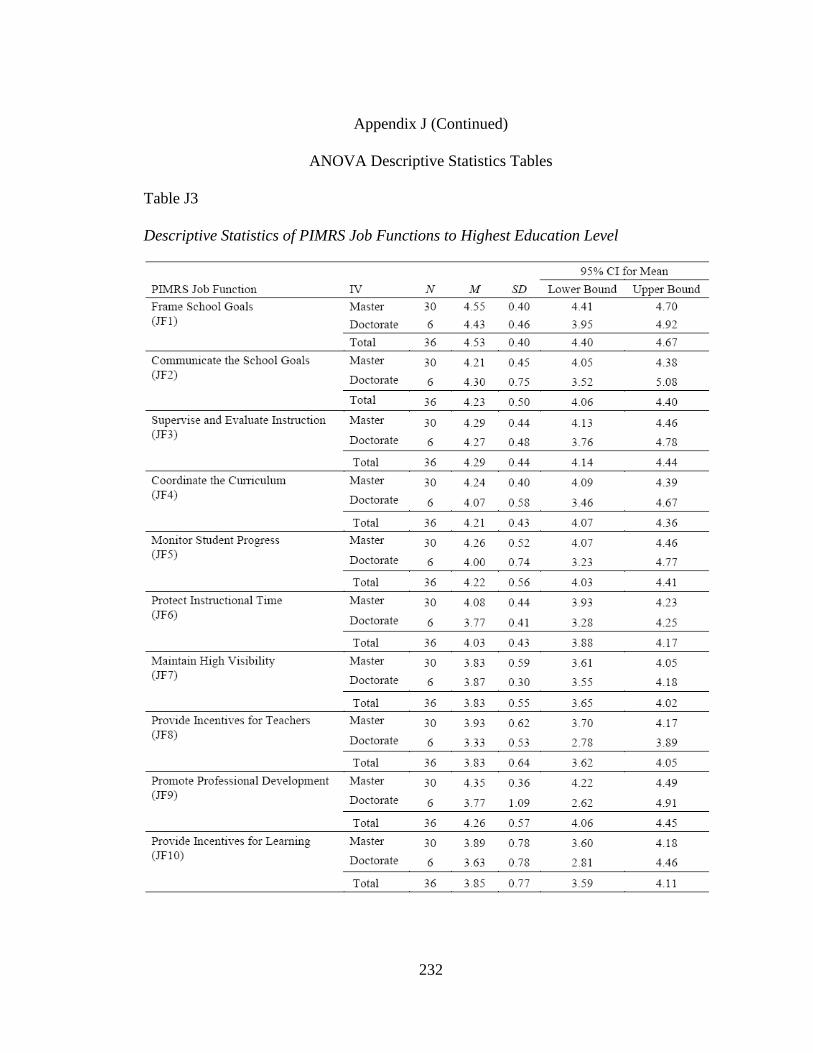
232
Appendix J (Continued)
ANOVA Descriptive Statistics Tables
Table J3
Descriptive Statistics of PIMRS Job Functions to Highest Education Level

233
Appendix J (Continued)
ANOVA Descriptive Statistics Tables
Table J4
Descriptive Statistics of PIMRS Job Functions to Overall Years in Administration

234
Appendix J (Continued)
ANOVA Descriptive Statistics Tables
Table J4 (Continued)
Descriptive Statistics of PIMRS Job Functions to Overall Years in Administration

235
Appendix J (Continued)
ANOVA Descriptive Statistics Tables
Table J5
Descriptive Statistics of PIMRS Job Functions to Overall Years as Current Principal

236
Appendix J (Continued)
ANOVA Descriptive Statistics Tables
Table J5 (Continued)
Descriptive Statistics of PIMRS Job Functions to Overall Years as Current Principal

237
Appendix J (Continued)
ANOVA Descriptive Statistics Tables
Table J6
Descriptive Statistics of PIMRS Job Functions to Overall Years as Classroom Teacher

238
Appendix J (Continued)
ANVOA Descriptive Statistics Tables
Table J6 (Continued)
Descriptive Statistics of PIMRS Job Functions to Overall Years as Classroom Teacher

239
Appendix J (Continued)
ANOVA Descriptive Statistics Tables
Table J7
Descriptive Statistics of PIMRS Job Functions to Subject Taught as Teacher

240
Appendix J (Continued)
ANOVA Descriptive Statistics Tables
Table J7 (Continued)
Descriptive Statistics of PIMRS Job Functions to Subject Taught as Teacher

241
Appendix J (Continued)
ANOVA Descriptive Statistics Tables
Table J7 (Continued)
Descriptive Statistics of PIMRS Job Functions to Subject Taught as Teacher

242
Appendix J (Continued)
ANOVA Descriptive Statistics Tables
Table J7 (Continued)
Descriptive Statistics of PIMRS Job Functions to Subject Taught as Teacher

243
Appendix J (Continued)
ANOVA Descriptive Statistics Tables
Table J8
Descriptive Statistics of PIMRS Job Functions to Instructional Leadership Delegated

244
Appendix J (Continued)
ANOVA Descriptive Statistics Tables
Table J9
Descriptive Statistics of PBS Beliefs to Gender

245
Appendix J (Continued)
ANOVA Descriptive Statistics Tables
Table J9 (Continued)
Descriptive Statistics of PBS Beliefs to Gender

246
Appendix J (Continued)
ANOVA Descriptive Statistics Tables
Table J10
Descriptive Statistics of PBS Beliefs to Ethnicity

247
Appendix J (Continued)
ANOVA Descriptive Statistics Tables
Table J10 (Continued)
Descriptive Statistics of PBS Beliefs to Ethnicity

248
Appendix J (Continued)
ANOVA Descriptive Statistics Tables
Table J11
Descriptive Statistics of PBS Beliefs to Education

249
Appendix J (Continued)
ANOVA Descriptive Statistics Tables
Table J11 (Continued)
Descriptive Statistics of PBS Beliefs to Education

250
Appendix J (Continued)
ANOVA Descriptive Statistics Tables
Table J12
Descriptive Statistics of PBS Beliefs to Overall Years in Administration

251
Appendix J (Continued)
ANOVA Descriptive Statistics Tables
Table J12 (Continued)
Descriptive Statistics of PBS Beliefs to Overall Years in Administration

252
Appendix J (Continued)
ANOVA Descriptive Statistics Tables
Table J12 (Continued)
Descriptive Statistics of PBS Beliefs to Overall Years in Administration

253
Appendix J (Continued)
ANOVA Descriptive Statistics Tables
Table J13
Descriptive Statistics of PBS Beliefs to Overall Years as Principal at Current Location

254
Appendix J (Continued)
ANOVA Descriptive Statistics Tables
Table J13 (Continued)
Descriptive Statistics of PBS Beliefs to Overall Years as Principal at Current Location

255
Appendix J (Continued)
ANOVA Descriptive Statistics Tables
Table J14
Descriptive Statistics of PBS Beliefs to Overall Years as Classroom Teacher

256
Appendix J (Continued)
ANOVA Descriptive Statistics Tables
Table J14 (Continued)
Descriptive Statistics of PBS Beliefs to Overall Years as Classroom Teacher

257
Appendix J (Continued)
ANOVA Descriptive Statistics Tables
Table J15
Descriptive Statistics of PBS Beliefs to Subject Taught as a Teacher

258
Appendix J (Continued)
ANOVA Descriptive Statistics Tables
Table J15 (Continued)
Descriptive Statistics of PBS Beliefs to Subject Taught as a Teacher

259
Appendix J (Continued)
ANOVA Descriptive Statistics Tables
Table J15 (Continued)
Descriptive Statistics of PBS Beliefs to Subject Taught as a Teacher

260
Appendix J (Continued)
ANOVA Descriptive Statistics Tables
Table J15 (Continued)
Descriptive Statistics of PBS Beliefs to Subject Taught as a Teacher

261
Appendix J (Continued)
ANOVA Descriptive Statistics Tables
Table J16
Descriptive Statistics of PBS Beliefs to Instructional Leadership Delegated

262
Appendix J (Continued)
ANOVA Descriptive Statistics Tables
Table J16 (Continued)
Descriptive Statistics of PBS Beliefs to Instructional Leadership Delegated

263
Appendix K
Subjects‘ Instructional Leadership Comments
Comments by Subject A
Earlier in my career, I used to say that teaching was more art than science and
teachers with a capital ―T‖ were born, not made. I‘ve shifted that somewhat, although I
believe there are personalities and internal values that predispose some teachers to be
more powerful and effective.
Part of our success comes from embracing and preaching just two simple values:
High standards/expectations and a nurturing environment. When offered in balance and
supported by teamwork and distributed leadership/accountability, great things happen.
Comments by Subject B
I believe the role of the principal is to create the rigidity on a school campus. This
means the goals or expectations and outcomes, with specificity. Once this happens, those
within the system (including the principal) have the freedom to create best practices and
to achieve goals and outcomes. For example, course and unit organizers define what will
be taught, emphasized and for how long. Teachers work together with data to use best
practices and materials to make it happen. The outcomes will drive change to improve
outcomes.

264
Appendix K (Continued)
Subjects‘ Instructional Leadership Comments
Comments by Subject C
My school plan is very simple.
1. Accountability-Students, teachers, parents, administration, and all other
employees-Make expectations very clear and simple. Mention them every day.
Hold everyone accountable for what they are supposed to do.
2. The state standards ARE the core curriculum. Noting else. It does not matter
what teachers ―think‖ students should know—The standards ARE the
curriculum.
3. Frequent assessments: Benchmark assessments given every five to six weeks.
Six to eight over the year. All are scanned through ―Data Director‖ and
analyzed by administration and teachers. All data is shared among teachers in
the department.
4. Teamwork. ―Collaborative Time‖ is given to discuss, analyze, and revise
instruction.
5. Provide additional opportunities for high achievers—more honor and AP
classes.
6. Provide additional support for low achievers. Extra math or English support.
7. Extra-curricular—encourage participation with ALL students in athletics, band,
choir, theater, dance, and other clubs!