a study of mathematics anxiety amongst primary pre · pdf filea study of mathematics anxiety...
TRANSCRIPT

A Study of Mathematics Anxiety Amongst Primary
Pre-service Teachers enrolled in a Dutch Teacher
Training Program
Reshmi Pradeep
Thesis submitted for fulfillment of the requirements of
the Master of Mathematics and Science Education
Thesis supervisor:
drs. André Heck
UNIVERSITEIT VAN AMSTERDAM
Science Park 904, 1098 XH Amsterdam
The Netherlands


i
Abstract
This thesis is about mathematics anxiety of pre-service teachers enrolled in a teacher-
training program at a primary school teacher training college (PABO) in the
Netherlands, who prepared to become primary school teachers. The main purpose of
my research was:
• to investigate if there were any indications of mathematics anxiety in Dutch
pre-service teachers enrolled in the study year 2010-2011 in the teacher-
training program at the PABO of the Hogeschool van Amsterdam (HvA); If
so,
• to find out if there was a relationship between the students’ mathematics
anxiety level and their performance in the mandatory mathematical skills test
called WISCAT-pabo; and
• to explore if they were able to overcome their anxiety and to perform better in
a skills test through training sessions and tutoring by peers.
In addition to the measurement of mathematics anxiety of first-year students and the
exploration of the effectiveness of the given support to overcome this anxiety and/or
pass the mathematical skills test, I also explored the Pedagogical Content Knowledge
of prospective teachers who were further in their teacher-training program regarding
the subject of mathematics anxiety. Through workshops with third-year students, I
investigated what they knew about mathematics anxiety, whether they recognized it in
their pupils (when they are practicing teaching at school), and what they thought one
could do about it.

ii

iii
Acknowledgements
This master thesis certainly would not exist without the encouragement, valuable
advice, and guidance that I got from my supervisor André Heck, starting with the
preparation of the research study and ending with the final writing of the thesis. So, I
would first like to express my sincere gratitude to André Heck for all his hard work,
patience and support.
My sincere thanks go to Erwin Janssen and Peter Ale, the cooperating teachers
who helped me to conduct my research project at the PABO of the HvA. I also thank
Ed van den Berg for organizing my contact with the HvA. I should not forget to thank
all students who participated in my research experiment.
Special thanks go to Mary Beth Key for supporting and inspiring me during
my study and providing me with the confidence in all my times of need. I also thank
my fellow students in the Master of Mathematics and Science Education for the
amicable atmosphere in the students’ room.
Last but not the least, I thank my family especially my husband and children
for their patience, understanding and constant support throughout my study.

iv

v
Contents
Abstract ................................................................................................................................................. i
Acknowledgements ........................................................................................................................ iii
1 Introduction ........................................................................................................................... 1
2 Literature Review and Theoretical Background ....................................................... 5
2.1 Mathematics Anxiety .................................................................................................................. 5
2.1.1 Definition .............................................................................................................................. 5
2.1.2 Origin ...................................................................................................................................... 6
2.1.3 Cognitive Consequences ................................................................................................. 7
2.1.4 Presence in Primary Pre-Service Teachers ............................................................ 7
2.1.5 Measurement ...................................................................................................................... 9
2.2 Test Anxiety ................................................................................................................................. 11
2.2.1 Definition ............................................................................................................................ 11
2.2.2 Origin .................................................................................................................................... 11
2.2.3 Cognitive Consequences ............................................................................................... 12
2.2.4 Measurement .................................................................................................................... 12
3 Research Questions ........................................................................................................... 15
4 Research Design and Methods ....................................................................................... 17
4.1 School Setting .............................................................................................................................. 17
4.2 Quantitative Research Instruments ................................................................................... 18
4.2.1 Mathematics Anxiety Rating Scale ........................................................................... 19
4.2.2 Test Anxiety Scale ........................................................................................................... 20
4.3 Reliability and Validity of the Anxiety Tests .................................................................. 21
4.4 Qualitative Research Instruments ...................................................................................... 22
4.4.1 Semi-Structured Interviews with First-Year Students .................................... 22
4.4.2 Workshop with the Third Year Student Teachers ............................................. 23
4.5 How I Answered the Research Questions ....................................................................... 24
4.6 Data Analysis Methods ............................................................................................................ 25
4.7 Timeline of the Research ........................................................................................................ 25
5 Data Analysis and Findings ................................................................................................. 27
5.1 Findings for Pre- and Posttest .............................................................................................. 27
5.1.1 Data Collection and Data Analysis Procedure ..................................................... 27
5.1.2 Results of the Pre- and Posttest ................................................................................ 28
5.1.3 Assumptions of the t-Test Analysis for Pre- and Posttest .............................. 29
5.1.4 t-Test Analysis: Comparing Pre- and Posttest Scores ...................................... 30
5.2 Psychometric Analysis of the Math Anxiety Tests ....................................................... 31
5.2.1. Reliability ........................................................................................................................... 31
5.2.2 Factor Analysis of the Math Anxiety Test .............................................................. 32
5.2.3 Correlation between MAS and AMAS components ........................................... 33
5.3 Findings for the Test Anxiety Inventory .......................................................................... 34
5.3.1 Data Collection and Data Analysis Procedure ..................................................... 34
5.3.2 Results of the Test Anxiety Inventory .................................................................... 34
5.4 Psychometric Analysis of the Test Anxiety Inventory ................................................ 35
5.4.1 Reliability ........................................................................................................................... 35
5.4.2 Factor Analysis of the Test Anxiety Test ............................................................... 36
5.5 Findings of the WISCAT- pabo Tests ................................................................................. 36
5.5.1 Data Collection and Data Analysis Procedure ..................................................... 36
5.5.2 Results of the First and Second WISCAT-pabo Test ......................................... 37

vi
5.6 Correlation of Math Anxiety, Test Anxiety, and Test Performance ....................... 38
5.6.1 Correlation of Math Anxiety Test and First WISCAT-pabo Test.......................... 38
5.6.2 Correlation of the Anxiety Tests (Pretest & TAI) and the First
WISCAT-pabo Test. ......................................................................................................... 39
5.6.3 Comparison of the Results on the Math Anxiety Scale and the Test
Anxiety Scale. ..................................................................................................................... 40
5.7 Findings from the Interviews ............................................................................................... 40
5.8 Findings from the Discussions in the Workshop .......................................................... 43
5.9 Comparison of Math Anxiety Test Scores and Self-Ratings ..................................... 46
6 Discussions and Conclusions .......................................................................................... 47
7 Limitations and Recommendations ............................................................................. 55
7.1 Limitations ................................................................................................................................... 55
7.2 Implications and Recommendations ................................................................................. 55
References......................................................................................................................................... 59
Appendix A Questionnaire ...................................................................................................... 65
Appendix B Original MAS ......................................................................................................... 67
Appendix C Original AMAS ..................................................................................................... 69
Appendix D Original TAI .......................................................................................................... 71
Appendix E Dutch Version of Math Anxiety Test ............................................................ 73
Appendix F Dutch Version of Test Anxiety Test ............................................................. 77
Appendix G Workshop I: PowerPoint Slides and Handout ....................................... 81
Appendix H Workshop II: Powerpoint Slides ................................................................... 95

1
1 Introduction
Despite its importance and applications in everyday life, mathematics is often
considered as a difficult subject. Research has demonstrated that many students have
learning difficulties and show poor performance in mathematics. One of the attribu-
ted reasons is the anxiety that an individual may have towards mathematics. The
following provisionary definition of mathematics anxiety may be used: Mathematics
anxiety is a state of a sinking feeling, uncertainty and despair at doing arithmetic and
mathematics. Mathematics anxiety is an important factor that affects student achieve-
ment and attitude towards mathematics (See, for example, Hembree, 1990). It may
for example lead to poor performance and avoidance of mathematics.
Preis and Biggs (2001) described mathematics avoidance and performance as
a cycle as illustrated in Figure 1.
Figure 1. The cyclic nature of mathematics avoidance and mathematics performance.
In the first phase, the person experiences a negative feeling to mathematics related
situations which could be a result of their past negative experiences with mathemat-
ics. This leads to the second phase in which the person begins to avoid mathematical
situations, followed by phase three which involves poor mathematical preparations,
and finally there is phase four characterized by poor mathematics performance. This

2
cycle becomes repetitive and difficult to break when the math anxious individuals
conclude for themselves that they cannot sustain in any math related situations.
Research indicates that mathematics anxiety develops in a child mainly at the
elementary school level, at the time that there occurs a shift from concrete to more
abstract thinking (See, for example, Jackson & Leffingwell, 1999). It is important
that mathematics anxiety is identified in a child as early as possible and that mathe-
matics teachers know how to become aware of mathematics anxiety amongst their
pupils and how to deal with it in the classroom. Many causes of teachers’ influence
on the development of mathematics anxiety by their pupils have been proposed in the
research literature. Some of them are: (a) lack of content knowledge of teachers;
(b) attitudes of classroom teachers towards mathematics; (c) the teaching methods;
and (d) mathematics anxiety in teachers.
These findings actually triggered my motivation to conduct research about
mathematics anxiety. During the two years that I worked as a mathematics teacher in
India, I realized that many students showed aversion towards mathematics. As a
novice teacher myself, I had no knowledge about mathematics anxiety nor did my
fellow teachers at school. It was during my study in the Master of Mathematics and
Science Education at the University of Amsterdam that I got more insight in the oc-
currence of mathematics anxiety and the negative role it plays in the development of
a child. I wanted to learn more about it and also about the role that teachers play in
this.
As was noted in the previous two paragraphs, mathematics anxiety is not just
limited to students, but it can even exist in teachers. According to Williams (1988),
mathematics anxiety has its roots in teaching and teachers and has been tied to poor
academic performance of students, as well as to the effectiveness of elementary
teachers. According to Levine (1993), anxiety for teaching mathematics is a frequent
fear of pre-service teachers. Mathematics teaching anxiety may reflect real or
perceived knowledge deficits in mathematics content as well as in mathematics
teaching skills, memories of past occurrences of mathematics failure or presence of
mathematics anxiety in the teacher itself.
It is generally assumed that there are several causes of mathematics anxiety,
categorized as personal, societal, environmental and pedagogical (See, for example,
Trujillo & Hadfield, 1999). My research study focused on the pedagogical aspects
and it concerned mathematics anxiety of pre-service teachers enrolled in a teacher-

3
training program at PABO1 in the Netherlands, who prepare to become primary
school teachers. Considering the results of previous studies of other researchers,
which indicate that teachers transmit their math anxiety to the students, the main
purpose of my research was:
• to investigate if there were any indications of mathematics anxiety in Dutch
pre-service teachers enrolled in the study year 2010-2011 in the teacher-
training program at the PABO of the Hogeschool van Amsterdam (HvA); If
so,
• to find out if there was a relationship between the students’ mathematics
anxiety level and their performance in a mathematical skills test; and
• to explore if they were able to overcome their anxiety and to perform better in
a skills test through training sessions and tutoring by peers.
The mathematics anxiety level was assessed through a self-report instrument taken
from the research literature and proven to be suitable for use with primary school pre-
service teachers. The mathematical skills test referred to above is WISCAT-pabo.2
The purpose of the WISCAT-pabo was to determine the arithmetic skills and knowl-
edge of the pre-service teachers up to the level of final year at the primary school.
This test is mandatory for all Dutch students in the first year of PABO and they must
pass this test in order to be allowed to continue the teacher-training program. Because
this test is so important for the pre-service teachers, I also explored the test anxiety of
students failing the skills test, because this may be an additional factor.
In addition to the measurement of mathematics anxiety of first-year students
and the exploration of the effectiveness of given support to overcome this anxiety or
pass the skills test, I also explored the pedagogical content knowledge (PCK) of
prospective teachers when they are further in their teacher training program. Through
a workshop I shared my knowledge and understanding of mathematics anxiety with
the student teachers and discussed with them the symptoms, causes, and assessment
of mathematics anxiety. In conjunction with the workshop, the pre-service teachers
were asked to observe their pupils during a one-week of teaching at school, and
report any indications of mathematics anxiety. I also discussed with them their own
1 PABO- Pedagogische Academie Basisonderwijs (In Dutch) = Primary school teacher train-ing college. 2 WISCAT-pabo is a computerized adaptive testing of the basic arithmetic and mathematics level of first-year PABO students.

4
observations during their practice teaching sessions and the strategies they would
adopt to deal with and overcome math anxiety in their future classrooms.

5
2 Literature Review and Theoretical Background
In this chapter, I give a short overview of the research literature about mathematics
anxiety, test anxiety, and their presence in primary school pre-service teachers.
Henceforth, I use the terms ‘math anxiety’ and ‘mathematics anxiety’ interchange-
ably.
2.1 Mathematics Anxiety In this section, I review the research literature about the causes, symptoms and
measurement of math anxiety. I also look into cognitive aspects of math anxiety and
its presence in primary school pre-service teachers.
2.1.1 Definition Bessant (1995) described mathematics anxiety as a multidimensional concept having
both cognitive and affective roots. The cognitive domain contributes to the learning-
approach framework for exploring the students’ difficulties in learning mathematics
and for linking math anxiety with evaluation of mathematical skills. The affective do-
main contributes to the framework for examining mathematics affect, attitudes and
the larger, more vague concept of anxiety.
A number of definitions of mathematics anxiety can be found in the research
literature. They are all related to each other in their main aspects. For example,
Richardson and Suinn (1972) described mathematics anxiety as “feelings of tension
and anxiety that impair the ability to manipulate numbers and solve mathematical
problems in a wide variety of ordinary life and academic situations” (p.551).
Similarly, Tobias (1981) characterized math anxious individuals as those who mis-
trust their problem solving abilities and experience a high level of stress when called
upon to use those abilities, particularly in public. Trujillo and Hadfield (1999)
defined math anxiety as a state of discomfort that occurs in response to situations
involving mathematical tasks that are perceived as threatening to self-esteem.
Mathison (1977) defined math anxiety as an irrational fear of mathematics that
ranged from a simple discomfort associated with numerical operations to total avoid-
ance of mathematics classes. Ashcraft and Kirk (2001) explained that for example;
the claim of statistics students who do poor at an exam that “they become confused,

6
are unable to focus on the task at hand, or keep thinking about how poor they are at
math” is entirely consistent with their major result: “Math anxiety disrupts the on-
going, task-relevant activities of working memory, slowing down performance and
degrading its accuracy” (p. 236). According to Ertekin, Dilmac, and Yazici (2009),
“anxiety is a state of arousal that surfaces through bodily, emotional, and mental
changes an individual experiences when faced a stimulus” (p. 1189). These feelings
of anxiety can lead to fear, distress, shame, inability to cope, sweaty palms, nervous
stomach, difficulty in breathing, and loss of ability to concentrate (Hembree, 1990;
Malinsky, et al., 2006). Other symptoms include tension, nervousness, worrying,
edginess, impatience, confusion, fear, and developing a mental block (Pérez-Tyteca,
et al., 2009). Therefore the fear of mathematics, also referred to as math anxiety,
reflects an internal aversion to any form of mathematical data or fear of working with
numbers or equations that interfere with the performance of an individual and inhibit
subsequent learning (Kelly & Tomhave, 1985; Hembree, 1990).
To sum up all the different versions of the definition of math anxiety, I would
say that it is a state of discomfort or fear of working with numbers and solving math-
ematical problems that leads to an aversion and avoidance of mathematics and any
mathematics related situations.
2.1.2 Origin Trujillo and Hadfield (1999) wrote the following about the origin of mathematics
anxiety (p. 219): “According to Hadfield and McNeil (1994) the causes of mathe-
matics anxiety can be divided into three areas: environmental, intellectual, and perso-
nality factors. Environmental factors include negative experiences in the classroom,
parental pressure, insensitive teachers, mathematics presented as rigid sets of rules,
and nonparticipatory classrooms (Dossel, 1993; Tobias, 1990). Intellectual factors in-
clude being taught with mismatched learning styles, student attitude and lack of per-
sistence, self-doubt, lack of confidence in mathematical ability, and lack of perceived
usefulness of mathematics (Cemen, 1987; Miller & Mitchell, 1994). Personality fac-
tors include reluctance to ask questions due to shyness, low self esteem, and viewing
mathematics as a male domain (Cemen, 1987; Gutbezahl, 1995; Levine, 1995; Miller
et al., 1994).”
According to Ashcraft, Kirk and Hopko (1998), “early reports suggested that
mathematics anxiety is a non-intellectual factor, in the sense that it was observed

7
even in otherwise successful students, which nonetheless had serious consequences
for educational and career-related choices” (p. 176). From this, it can then be seen
that the origins of negative beliefs and anxiety about mathematics are as diverse as
are the individuals experiencing math anxiety.
2.1.3 Cognitive Consequences From a cognitive point of view, mathematics anxiety has the most pronounced detri-
mental effect on arithmetical performance when the problems are relatively complex
(Ashcraft & Faust, 1994; Ashcraft & Kirk, 2001). Difficulty of material at this level
is seen when working with parts of numbers, such as those with two column addi-
tions that require carry operations or multiplication problems or memorizing multi-
plication tables. As the complexity of the problem increases, there is an increased
possibility of losing track during calculations. In other words, the disruption of math
anxious individuals is attributed to disturbance in working memory processes.
Math anxiety can interrupt and even make everyday activities of an individual
difficult, for instance balancing a checkbook, developing a household budget or sim-
ply calculating a restaurant bill. In academic settings, math anxiety affects an indi-
vidual in any school related activities, in classrooms and standardized test taking,
resulting in what Ashcraft and Faust (1994) called ‘global avoidance’ (See also,
Ashcraft & Ridley, 2005). In other words, math anxious individuals may avoid any
mathematics courses or subjects involving mathematics. This may mean that math
anxious individuals do not gain competence or mastery of mathematical operations
and it may directly influence their performance in mathematics (Hembree, 1990).
However, there are some students who suffer from math anxiety and yet study regu-
larly, work hard in the classroom and finish their homework on time but are unable to
present what they know because of the math anxiety in them. Some researchers be-
lieve that intrusive thoughts and worries about completing mathematical problems
may interfere with working memory (Ashcraft & Kirk, 2001) and so they lack the
ability to excel or perform well.
2.1.4 Presence in Primary Pre-Service Teachers Math anxiety is widespread among existing primary school teachers and pre-service
teachers (e.g., Malinsky et al., 2006; Çatlioğlu, et al., 2009; Sloan, 2010). Research
suggests that primary school pre-service teachers experience high levels of mathe-
matics anxiety in comparison with other university students (See, for example, Kelly

8
& Tomhave, 1985; Trujillo & Hadfield, 1999; Vinson, 2001; Bursal & Paznokas,
2006; Swars, Daane & Giesen, 2006). Swetman, Munday and Windham (1993) found
that primary school teachers experiencing a high level of mathematics anxiety spent
less time on planning and dedicated fewer hours to mathematics related activities.
Research by Bush (1981) and Hembree (1990) indicated that math anxiety has
implications for teacher practices in mathematics and teachers’ willingness to em-
brace innovations. Their research revealed that teachers with high levels of mathe-
matics anxiety tend to use more ‘traditional’ and teacher-centered approaches such as
lecture based lessons, teaching from the textbooks, rote memorization, and the
teaching of basic skills rather than concepts in mathematics. It was found that these
teachers devote more time to seatwork, assign the same work to everyone, focus only
on whole group instruction, and spend less time toward problem-solving techniques
and strategies (cf., Gresham, 2008). In other words, negative attitudes of teachers
toward mathematics can have negative impacts on mathematics teaching, with the
result that teachers’ math anxiety is transferred to their pupils (Tobias, 1981; Vinson,
2001). Years before, Martinez (1987) has already noted that “Math-anxious teachers
can result in math-anxious students” (p. 117). These negative attitudes of teachers are
deeply rooted in the teachers’ experience as pupils at school and as students in the
teacher-training institute. In a study conducted by Brady and Bowd (2005) with 238
primary pre-service teachers indicated that the confidence of the pre-service teachers
in teaching mathematics was related to their mathematics anxiety and their prior
mathematics learning experiences at school level. Uusimaki and Nason (2004) also
found that for most of the Australian primary pre-service teachers participating in
their study, the math anxiety could be attributed to their primary school experiences
in learning mathematics. Pre-service teachers enter the teaching profession with rela-
tively stable commitments to their beliefs. According to Smith (1996), these beliefs
are often coupled with feelings of alienation and fear in mathematics settings and
anxiety about the prospects of teaching it. Consequently, what teachers do in their
mathematics lessons reflects their own thoughts and beliefs about the subject
(Fernandes, 1995). This is a cause for alarm considering that, teachers who possess
medium or high levels of mathematics anxiety may unintentionally transmit their
avoidance and fear of mathematics to their students (Wood, 1988).
The implementation of effective instructional practices by a mathematics
teacher, such as focus on the process rather than the product (as prescribed by

9
NCTM), has been linked to the level of mathematics anxiety of the teacher (Bush,
1981; Karp, 1991). Hackworth (1985) phrased it as follows: “The disproportionately
large number of mathematically anxious teachers at the elementary school level is
often said to influence not only the effectiveness of instruction, but may promote the
early onset of mathematics anxiety among students” (p. 8). Some of the possible
factors contributing to the anxiety feeling in the pre-service teacher’s are: prior
school experiences such as their experiences as a mathematics student, the influence
of prior teachers at school and of teacher preparation programs (Raymond, 1997).
The implication of such negative beliefs and negative experiences about
teaching and learning mathematics on many primary teacher education students has
resulted in the continuity of the math anxiety phenomenon.
2.1.5 Measurement Math anxiety is commonly assessed through self-report instruments. Richardson and
Suinn (1972) designed the Math Anxiety Rating Scale (MARS), which is a 98-item
self-rating scale test to measure mathematics anxiety of college students. This
instrument uses a 5-point Likert scale with questions that test students on their degree
of anxiety in a given situation. The statements pertain to the respondent’s everyday
life and situations that require them to think and do the tasks mathematically. MARS
was once considered as the best available measure of mathematics anxiety with the
highest validity and reliability. But the contemporary view (See, for example, Hopko
et al., 2003; Bai, 2010; and other references mentioned below) seems to be that
MARS has two major shortcomings: (1) it is a test that takes long time to administer
and to score; and (2) it was developed with unidimensional representation of negative
affect toward mathematics.
Many researchers have investigated mathematics anxiety using the MARS
test, but further studies revealed that there might be more than one underlying
construct in math anxiety (cf., Bessant, 1995; Baloğlu & Zelhart, 2007). In order to
overcome the above-mentioned shortcomings, researchers started to develop several
shorter, multidimensional versions of MARS. For example, Betz’s (1978) Mathemat-
ics Anxiety Scale (MAS), adapted from Fennema and Sherman’s (1976) Mathematics
Attitude Scale, was set up as a 10-items bidimensional instrument. Items in both
positive and negative wordings in MAS were intended to identify the bidimensional
affects, positive and negative, toward mathematics. Betz (1978) gave the following

10
description of MAS: “The scale is intended to assess feeling of anxiety, dread,
nervousness, and bodily symptoms related to doing mathematics’’ (p. 442). One of
the most recent instruments assessing mathematics anxiety is Hopko et al.’s (2003)
Abbreviated Math Anxiety Rating Scale (AMAS), an adapted version of MARS-
Revised with only 9 items. Table 2.1 lists some of the most commonly used
mathematics anxiety instruments and short versions. Special purpose versions of
MARS have been developed for various target groups; they are also included in
Table 2.1.
Full name Abbreviation #items Reference
Mathematics Anxiety Rating Scale MARS 98 Richardson, & Suinn (1972)
Revised Mathematics Anxiety Rating Scale RMARS 25 Alexander & Martay (1989)
Mathematics Anxiety Rating Scale Revised MARS-R 24 Plake & Parker (1982)
Revised MARS-R Revised
MARS-R
24 Hopko (2003)
Mathematics Anxiety Rating Scale Short
Version
MARS-SV 30 Suinn & Winston (2003)
Mathematics Anxiety Rating Scale for
Adolescents
MARS-A 98 Suinn & Edwards (1982)
Mathematics Anxiety Rating Scale for
Elementary School
MARS-E 26 Suinn, Taylor & Edwards
(1988)
Mathematics Attitude Scale MAS 12 Fennema & Sherman (1976)
Mathematics Anxiety Questionnaire MAQ 11 Wigfield & Meece (1988)
Mathematics Anxiety Scale MAS 10 Betz (1978)
Math Anxiety Scale-Revised MAS-R 14 Bai et al. (2009)
Abbreviated Mathematics Anxiety Scale AMAS 9 Hopko et al. (2003)
Table 2.1. A list of commonly used mathematics anxiety assessment instruments.
11
2.2 Test Anxiety In this section, I briefly review the research literature about the definition, origin and
measurement of test anxiety, and its relationship with math anxiety.
2.2.1 Definition Poor performance in any mathematics related tests could not just be attributed to
math anxiety, but also to so-called test anxiety. Zeidner (1998) adopted the charac-
terization of the construct of test anxiety from Sieber, O’Neil and Tobias (1977) and
defined it as follows: “The term ‘Text Anxiety,’ as a scientific construct, refers to the
set of phenomenological, physiological and behavioral responses that accompany
concern about possible negative consequences or failure on an exam or similar
evaluative situation’’ (p. 17). Spielberger and Vagg (1995) defined test anxiety as
“the stress associated with examination situations (stress), the subjective inter-
pretation of a test as more or less threatening for a particular person (threat), and the
emotional states that are evoked in test situations” (p. 6). Test anxiety is assumed to
be more than a dislike of tests and an internal aversion that may interfere with
performance (Ball, 1995). However, I do consider test anxiety as a fear for taking
tests which arouses in an individual either due to poor preparation for test taking
situations or due to the thought of failing in an examination.
2.2.2 Origin Test anxiety is considered to be a multidimensional construct and is related to the
stress associated with evaluative situations (Mandler & Sarason, 1952). In other
words, it is the stress experienced by an individual when subjected to tests. There are
two types of test anxiety: (1) anticipatory test anxiety, felt when thinking about and
studying for a test; and (2) situational test anxiety, felt while taking a test. Arem
(1993) identified the following three reasons for test anxiety as: (1) lack of prepara-
tion for a test; (2) poor test-taking strategies; and (3) psychological pressures.
A number of researchers have found that there exists a relationship between
math anxiety and test anxiety (See, for example, Dew, Galassi & Galassi, 1984). In a
study conducted by Bush (1981) he found that, despite a dislike of mathematics or
mathematical methods, doing calculations or solving problems rarely caused anxiety.
On the contrary, it was preparation for mathematics tests and taking mathematics
tests that caused students to react with anxiety. Therefore, Bush contended that math
anxiety is no more than subject-specific test anxiety. However, a majority of the

12
literature that I reviewed on mathematics anxiety and test anxiety asserted that, while
the two anxieties are related, they are separate constructs. In the next subsection, I go
further into this issue.
2.2.3 Cognitive Consequences Liebert and Morris (1967) considered two components of test anxiety: worry and
emotionality. Worry is a cognitive concern associated with performance and conse-
quences of performance, while emotionality refers to physiological reactions evoked
by stress. In their research, Liebert and Morris found that the worry component was
negatively related to test performance, and that there was little or no relationship
between emotionality and performance. Dew, Galassi and Galassi (1983) also investi-
gated the relationship between math anxiety and test anxiety, in particular, the worry
and emotionality components of test anxiety. Over 700 university students completed
in their study the Mathematics Anxiety Rating Scale (MARS), the Fennema-Sherman
Mathematics Anxiety Scale (MAS), the Sandman Anxiety Toward Mathematics
(ATMS), and the Test Anxiety Inventory (TAI). In their investigation whether or not
the math anxiety scales measured a construct distinct from test anxiety (worry and
emotionality), they found that the math anxiety measures were more closely related
to one another than to test anxiety. Therefore, Dew and colleagues (1983) concluded
that the two constructs are not the same, but related.
2.2.4 Measurement Test anxiety is commonly assessed through self-report instruments. Mandler and
Sarason (1952) designed the first instrument called the Test Anxiety Questionnaire. It
originally consisted of 42 questions, but it was revised by the authors into 37-items
rating-scale format. The Test Anxiety Questionnaire is divided into three sections:
(1) group intelligence tests; (2) individual intelligence tests; and (3) course examina-
tions.
One of the most popular test anxiety instruments is the Test Anxiety Scale.
The original scale, developed by Sarason (1958) consisted of 21 true/false items,
which had been rewritten from the Test Anxiety Questionnaire. Sarason and Ganzer
(1962) later presented a 16-item Test Anxiety Scale, which correlated .93 with the
37-item scale developed by Samson, Pederson and Nyman (1968). The factor analy-
sis of the Test Anxiety Scale revealed two factors: (1) worry; and (2) emotionality,
Liebert and Morris (1967) hypothesized and found an inverse relationship between

13
worry and performance expectancy and no relationship between emotionality and
performance expectancy. The instrument that they used, the Worry-Emotionality
Questionnaire, is a 10-item scale made up of Test Anxiety Questionnaire items,
which were modified to refer to the participant’s immediate feelings. Five of the
items form the Worry Scale, with the remaining five items forming the Emotionality
Scale. Participants respond to the items on a 5-point Likert scale.
More recently, Spielberger and colleagues (1978) developed the Test Anxiety
Inventory (See also, Spielberger, 1980). They used items from the Test Anxiety Scale
and items written by the authors to measure worry and emotionality. Participants
respond to the items on a 4-point scale, and the Test Anxiety Inventory yields an
Emotionality and Worry score as well as a Total Test Anxiety score. Worry is the
cognitive component of anxiety, while emotionality is the affective and behavioral
component. Here, worry is characterized as concern about one’s performance, one’s
perceived lack of competence (failure) and one’s comparison to others. Emotionality
is characterized by one’s reaction to a situation, particularly one’s reaction to a test.
The Test Anxiety Inventory total correlates .82 for males and .83 for females with the
Test Anxiety Questionnaire. Spielberger and colleagues (1978) presented standard
deviations and reliability coefficients as well as correlations between Test Anxiety
Inventory scores and grades, study skills, and other measures of anxiety.

14

15
3 Research Questions
After reviewing the literature on math anxiety and its presence in the pre-service
teachers, I wanted to first investigate if there were any indications of mathematics
anxiety in Dutch pre-service teachers starting with their teacher-training program.
Research studies have reported a strong correlation between the math anxiety of an
individual with that of their performance in mathematics test. Therefore, I wanted to
explore whether math anxiety of first year students had an influence on their
performance in the first WISCAT-pabo test. Only students who failed the first
WISCAT-pabo test and students who wanted to score a better mark attended the
training sessions conducted by the staff of HvA. I was also interested to see if this
group of first year student teachers were test anxious and whether test anxiety had an
influence in their performance of the first WISCAT-pabo test. In addition, I wanted
to investigate if the first year student teachers who failed in the first WISCAT-pabo
test found the training sessions and the peer tutoring given to them beneficial enough
to perform better in the second test, and also if it helped them in reducing their math
anxiety level. Apart from the first year teachers, I was also keen to explore the
Pedagogical Content Knowledge (PCK) of the third year pre-service teachers in the
PABO regarding math anxiety, as they were taught a lesson on Special Education
Needs in their Didactics course, at the same time of my research. I wanted to find out
if these students were aware of symptoms of math anxiety and if they were able to
identify it in their pupils.
To sum up, I intended to answer in my research study the following research
questions:
1. Does the standardized math anxiety tests indicate the existence of math anxie-
ty amongst first year elementary pre-service teachers when they enter the
teacher-training program?
2. Is there a correlation between students’ results on the first math anxiety test
and their performance in the first WISCAT-pabo test?

16
3. For those students who participate in the trainings sessions after the first
WISCAT-pabo test (those who failed and those who wanted to improve their
test score) and take the test anxiety test, what are the students’ results on the
math anxiety test and the test anxiety test? Are there correlations between the
three test results?
4. How do results on the second WISCAT-pabo test compare with results of the
first WISCAT-pabo test for those students who take the training sessions and
the peer tutoring?
5. How do results on the second math anxiety test compare with the result of the
first math anxiety test for those students who take the training sessions and
the peer tutoring?
6. What pedagogical content knowledge about mathematics anxiety do third
year pre-service teachers have?
(a) Did they observe mathematics anxiety amongst their pupils during
their teaching practice sessions?
(b) If so, what instructional strategies did they think of and/or have they
used in their lessons in order to deal with their pupils’ anxiety.
17
4 Research Design and Methods
In this chapter I give a detailed description of the school setting in which my research
took place and also describe the quantitative and qualitative research instruments that
I have used to collect the data. I also discuss the design of my workshop for third-
year pre-service teachers. In the following subsections, I outline the description of
how the research instruments have been used to answer the research questions and
the methods I have used to analyze the data. In the last section I give the timeline of
the activities as planned in my research.
4.1 School Setting The research took place at the primary school teacher training college, PABO, at the
Hogeschool van Amsterdam (HvA). Like in any PABO in the Netherlands, the focus
in their mathematics lessons was not so much on learning the discipline itself, but
more on learning to teach arithmetic and basic mathematics at primary school level in
accordance with the Realistic Mathematics Education (RME) approach. Along with
their lessons, the pre-service teachers had practice teaching sessions in Dutch schools
in and around Amsterdam. At the beginning of the semester, the pre-service teachers
had to take the online skills test called WISCAT-pabo, which tests their mathematical
knowledge up to the level of Group 8 mathematics.3 This test is nationwide adminis-
tered and scored by CITO.4 The test contains 40 questions in four domains, namely:
(1) mental arithmetic; (2) basic operations; (3) fractions, ratios, percentages; and
(4) measuring and geometry. The first 15 questions in this test are of the same level
of difficulty for all the candidates. Based on their performance and scores of these 15
questions, the computer adjusts the level of difficulty from the 16th question onwards
according to the ability level of the student. The results of this online test are obtained
from CITO within 2 hours after submission of all tests. If a candidate clears the test
with 103 points then (s) he has obtained enough points for the first year. If a student
passes the test with 125 points then (s) he has scored enough points for 3 years and
may become a peer tutor. If a candidate fails in the first round of the test then (s) he 3 In the Dutch system of schooling, Group 8 is the last year in the primary level (age group: 11-12 yr.). 4 CITO, the Central Institute for Test Development based in the Netherlands, is one of the world’s leading testing and assessment companies.

18
must reappear for an exam in the second semester failing which (s) he appears for the
re-test towards the end of the first year. During this period, the student teachers are
given special attention and individual tutoring on elementary mathematics by the
teaching faculty and also by peers of the HvA. The student teachers must pass the
WISCAT-pabo test at some moment during the first year in order to be able to
continue their education in the teacher training program.
The participants of my research study were 108 first-year pre-service students
and some third-year students of the 4-year teacher-training program. Of the 108 par-
ticipants, (87) were females and (21) were males and they were of the age group 17-
24 years. The participants had different educational backgrounds. There was one
group of about 30 older people (doing the program on a part time basis) who were not
fresh out of secondary school but had to take a break in their careers for various per-
sonal reasons.
4.2 Quantitative Research Instruments All first year students of the teacher-training program were invited to complete a
standardized test on mathematics anxiety. I used a combination of two standardized
tests. The main reasons for combining two existing short math anxiety tests instead of
developing my own test were: (1) to be able to compare my results with results from
research literature; and (2) to reduce as much as possible the potential dependence of
results on the choice of a particular test (I expected that the results for both tests
would correlate). The math anxiety tests were used as pretest (before the first
WISCAT-pabo) and posttest (before the second WISCAT-pabo, after training
sessions and peer tutoring). Math anxiety of a student was tested once or twice,
depending on whether the student passed the WISCAT-pabo test already at the first
time or not. The math anxiety tests were administered before the first and second
WISCAT-pabo test, respectively.
In addition, I also used a test anxiety inventory to assess the test anxiety of
participants. The test anxiety test was also obligatory for those pre-service teachers
present at the training sessions. Since there was no provision to conduct math anxiety
and test anxiety tests in a digital format, the two instruments were administered
through pencil and paper.

19
Since existing research (see, for example, Dew et al., 1984) suggests both
positive and negative relationship between mathematics anxiety and test anxiety, my
research study was planned in such a way that it would allow to:
1) distinguish math anxiety from test anxiety according to standardized tests;
2) explore existence of math anxiety and/or test anxiety in pre-service teachers
enrolled in primary teacher training program.
For better understanding of the above mentioned quantitative research instruments, I
will explain in detail the structure of the mathematics anxiety rating scale and the test
anxiety inventory in the following subsections.
4.2.1 Mathematics Anxiety Rating Scale For the mathematics anxiety test, I combined two short standardized math anxiety
tests, which have been used in previous studies to measure math anxiety in college
students of large sample size. The two scales were chosen on the basis of their use in
the literature and relevance to this particular study. The two tests used were Mathe-
matics Anxiety Scale (MAS see Appendix B) and the Abbreviated Math Anxiety
Scale (AMAS see Appendix C). There were two main reasons for this combination of
tests for my target group:
1) to see that the results of the two standardized tests to measure mathematic
anxiety are similar (i.e. the identified math anxiety level should ideally not
depend much on the instrument used)
2) to check if the two tests are correlated with the math skills test (WISCAT-
pabo) as a separate test and as a combination.
My hypothesis is that the choice of math anxiety test does not influence too much the
identified level of math anxiety.
The Mathematics Anxiety Scale (MAS), adapted from Fennema and
Sherman’s (1976) Mathematics Attitude Scale, consists of 10 items on a 5-point
Likert scale. The first five items are worded positively and the next five are worded
negatively. Test takers have to rate from five possible choices: strongly agree, agree,
neutral, disagree and strongly disagree. I assigned the following numeric values to the
positively phrased questions: strongly disagree=5, disagree=4, neutral=3, agree=2,
and strongly agree=1. I assigned the following numeric values to the negatively
phrased questions so that high scores indicate a positive attitude: strongly disagree=1,
20
disagree=2, neutral=3, agree=4, and strongly agree=5. In this way, the Scores range
from 10 to 50 and higher the score, the higher is the level of math anxiety.
The Abbreviated Math Anxiety Rating Scale (AMAS), an adapted version of
MARS-Revised with only 9 items is also a 5-point Likert type scale ranging from 1
(low anxiety) to 5 (high anxiety). Test takers must choose from the five possible
choices and I assigned the following value for the choices: not at all=1, a little bit=2,
a bit=3, fairly much=4, very much=5. The total score represents the summation of the
9 items. Since my test was a combination of the MAS and AMAS the range of the
scores for the 19 questions varied from 19 to 95. The higher the score, the higher the
level of math anxiety.
4.2.2 Test Anxiety Scale In order to find out if the participants were test anxious, the Test Anxiety Inventory
(TAI), which was developed by Charles Spielberger (1980), was used. It is a self-
report inventory, commonly used to measure test anxiety and it consists of 20 items.
In addition to measuring the overall anxiety level in test situations, the TAI subscales
assess worry and emotionality as major components of test anxiety. The description
of the sub-scales, number of items and example items of the Test Anxiety Inventory
is given below. See Appendix D for the Test Anxiety Inventory questionnaire.
Sub-scales
Scope
No.of
items
Example items
Emotionality
Behavioral or physical reactions to testing situations such as fear, nervousness and physical discomfort
8
2. While taking examination I have an uneasy upset feeling
Worry
Cognitive concerns about performance, such as worry about the testing situation or negative performances
8
6. The harder I work at taking a test the more confused I get
TAI -Total
General feeling about the test anxiety in addition to items already included in emotionality and worry scale. (Total score on the Test anxiety Inventory).
20
(16+4*)
13.During important tests I am so tense that my stomach gets upset.
* There were 4 items in the scale not included in any sub-construct but were part of
the Total score in the Test anxiety Inventory.

21
The participants taking TAI choose from four possible choices: almost never=1,
sometimes=2, often=3, and almost always=4 that represent how often they experience
the feeling described in each statement. The Test Anxiety Inventory (TAI) has a
minimum score of 20 and a maximum score of 80. The scores for the first question
are: 4 (low anxiety), 3, 2, 1 (high anxiety) for the given choices, respectively. The
scores for the questions 2 through 20 are: 1 (low anxiety), 2, 3 and 4 (high anxiety) in
the ordering of the choices. The purpose of using TAI is to account for variance in
performance in the math skills test and examine the relationship between test anxiety
and math anxiety.
4.3 Reliability and Validity of the Anxiety Tests The MAS test has been found to have a strong internal consistency and stability. Betz
(1978) reported a reliability coefficient of .92 using the split half method. Dew et al.
(1983) reported Cronbach’s alpha of .72 and a 2 –week test-retest reliability of .87 on
a sample of 769 undergraduates. Also, after comparing the MAS with other mathe-
matics anxiety measures Dew et al. (1983) and Dew, Galassi, & Galassi (1984)
reported that MAS had acceptable internal consistency and test-retest reliability and
that it was the only one of four mathematics anxiety scales (including the MARS)
that accounted for a significant portion of the variance in mathematics performance.
Hopko et al. (2003) conducted a study to develop and establish the psychometric
properties of the AMAS and found that the internal consistency and test-retest
reliability was very strong. A two-week test-retest reliability for the AMAS test was
.85 and a factor analysis yielded a two factor structure, learning mathematics anxiety
and mathematics evaluation anxiety accounting for 70 % of the overall variance in
scores. In a recent study by Hopko (2003), learning math anxiety (LMA) which is
anxiety about the process of learning and math evaluation anxiety (MEA), which is
more related to testing situations, have been acknowledged as critical elements of
math anxiety.
Spielberger (1980) calculated alpha coefficients for the TAI test on under-
graduate students. An alpha coefficient of .95 was reported for females and .94 was
reported for males. The internal consistency reliability coefficients range from .93 to
.96 and correlations with other measures of test anxiety range from r= .85 to r= .95
with the Test Anxiety Scale (TAS; Sarason, 1978). Spielberger compared TAI scores

22
for 195 male and 72 female navy recruits with scores on recruit training
examinations. Negative correlation results of -.34 and -.19 respectively were obtained
when recruitment scores and anxiety scores were compared. Spielberger concluded
that test anxiety has a negative effect on academic achievement.
The questionnaires of the two standardized math anxiety tests (MAS and
AMAS) and also the test anxiety test (TAI) were translated into Dutch and adapted to
the Dutch education system (see Appendices E and F). The fairness of the transla-
tions of the tests was assessed by two educational researchers and three PhD students
in mathematics and science education (all native speakers of Dutch). These five
persons were well acquainted with the Dutch curriculum and therefore were able to
review the fairness of the translation from English to Dutch and the adaptation to the
Dutch context. In general they agreed with the translations and I adopted some
suggestions made. However, there was no time for doing a small-scale trial and so the
standardized tests were administered directly.
4.4 Qualitative Research Instruments In this section, I discuss the qualitative instruments that I used for my research study.
In the first subsection I give the details of the semi-structured interviews with the first
year pre-service teachers. Then I discuss the design of the workshop for the third year
student teachers.
4.4.1 Semi-Structured Interviews with First-Year Students I observed some classes of the training sessions that the first year pre-service teachers
took as a preparation for the second WISCAT-pabo test. The training sessions were
mainly attended by the student teachers who had failed in the first WISCAT-pabo
test, but some students who had a pass mark in the first WISCAT-pabo test also
attended the sessions for the purpose of getting more practice and a better score in the
re-test. I interviewed some pre-service teachers who volunteered for this and had a
fairly low score in the first WISCAT-pabo test. Some of the questions asked in the
interviews were:
1. What are your feelings towards mathematics?
2. Did you like the mathematics lessons when you were in your school? If not,
why? (Is it because of the teacher, friends or the subject itself)

23
3. Have you had any negative experiences in your mathematics classroom when
you were a student?
4. Did you always get help from your teacher when you had difficulty in
understanding concepts being taught in class?
5. Have you ever felt confident before a test and when it actually comes to taking
a test, do you forget most of the concepts that you knew so well.
6. Do you get nervous when you are timed for a test? Does it go away when the
test is over?
7. Have you felt “totally blank” during tests although you had prepared well?
8. Do you think you can understand mathematics better in the HvA?
9. Why do you think you could not perform well in the WISCAT test?
10. Do you think the training sessions and peer tutoring in the HvA has helped
you this semester? Why?
The questions were asked in random order and not necessarily in the above
order. The first four questions (1-4) were asked to gather information about the pre-
service teachers’ feelings towards mathematics, their past experiences in school as
students and the behavior and attitude of their mathematics teachers when the pre-
service teachers approached them as students for help. The next three questions (5, 6
and 7) were asked to find out the feelings of the pre-service teachers during test
taking situations. The last three questions (8, 9, 10) were asked to find for the
possible reason they thought that accounted for their poor performance in the first
WISCAT-pabo test and how they were benefitted by the peer tutoring and optional
training sessions in the HvA.
4.4.2 Workshop with the Third Year Student Teachers In order to explore the PCK of third-year students about math anxiety I conducted a
workshop on 2 different days. I prepared PowerPoint slides and a handout (Appendix
G and H) in order to share my knowledge and understanding of math anxiety with the
student teachers. I also gave the participants two articles (Jackson & Leffingwell,
(1999); Rossnan (2006) regarding math anxiety as reference reading. The purpose of
the workshop was two-fold: (1) make the student teachers aware of the existence of
math anxiety; and (2) discuss with the student teachers their personal experiences
during the practice teaching sessions and discuss strategies how to deal with pupils
having math anxiety. The workshop on Day 1 took place the week before the pre-

24
service teachers went to schools for a week of full-time responsibility of teaching a
class. The student teachers were given two assignments, to be carried out during their
practice teaching sessions:
Assignment 1: Look for any symptoms of math anxiety during your one-week teaching session and write them down. Assignment 2: Think of the instructional strategies you may adopt in order to deal with pupils with math anxiety in your classrooms
The workshop on Day 2 was a follow-up workshop in which the two
assignments concerning the observations of the pre-service teachers during their
practice sessions and their strategies to help pupils overcome math anxiety were
discussed. The outline of the workshop is as follows:
Day 1
Discussion of
1. pre-service teachers’ content knowledge about math anxiety;
2. symptoms, origin and development of math anxiety;
3. teaching techniques that cause math anxiety;
4. different instruments used to measure math anxiety.
Day 2
Discussion of
1. personal experiences and classroom observation;
2. teacher’s role in helping pupils overcome math anxiety;
3. teaching strategies to reduce math anxiety in classrooms.
The workshop sessions were videotaped and the discussion about their knowledge
and observations of math anxiety was also audio-recorded.
4.5 How I Answered the Research Questions The first research question about the indication of math anxiety in the first year
elementary pre-service teachers was answered using standard quantitative methods
and statistics. I also considered the semi-structured interviews to get a deeper
understanding about the possible causes of pre-service teachers math anxiety.

25
The second question and third questions about the correlation of the
WISCAT-pabo test with the first math anxiety test and test anxiety test and also the
correlation between all the three tests were answered quantitatively.
The fourth research question about the comparison of the results on the
second WISCAT-pabo test with the result of the first WISCAT-pabo test for those
students who took the training sessions and the peer tutoring were answered
quantitatively (using the statistical methods) and qualitatively (semi-structured
interviews).
The fifth research question about the reduction in the math anxiety level of
the pre-service teachers who took the training sessions and the peer tutoring was
answered quantitatively.
The sixth research question regarding the PCK of third year pre-service
teachers is of qualitative nature. This question was answered through the discussions
during the workshop sessions that has been video recorded.
4.6 Data Analysis Methods Statistical and qualitative methods that I used to answer my research question were:
• Shapiro-Wilk test to check the normality of the data distribution;
• Pretest and posttest were compared via a t-test analysis;
• WISCAT-pabo tests were compared via the Wilcoxon signed-rank test
analysis;
• Psychometric tests for the math anxiety and test anxiety instruments;
• One-tailed Pearson correlation test to measure the relationship between math
anxiety score, test anxiety score and WISCAT-pabo score;
• Audio recordings of the semi-structured interviews;
• Video- and audiotapes of the workshop discussions.
4.7 Timeline of the Research For ease of understanding, I give an outline of the ordering in time of the different
activities that I carried out in my research study and the timing of the first and second
WISCAT-pabo test.

26
Math anxiety Pretest September 2010
1. First WISCAT-pabo test October 2010
2. Interviews with 1st year students
1. Test anxiety test November 2010
2. Workshop for 3rd year students
Math anxiety Posttest December 2010
Second WISCAT-pabo test January 2011

27
5 Data Analysis and Findings
In this chapter I first present the data collected and the results of the analysis of the
data obtained from the first and second administered mathematics anxiety scale [both
equal and consisting of the Abbreviated Mathematics Anxiety Scale (AMAS) and the
Mathematics Anxiety Scale (MAS)]. Since the first and second administration of the
mathematic anxiety scale is used in a t-test analysis to explore the effect of the
training sessions and peer tutoring I refer to these tests also as pre- and posttest. For
this t-test analysis it is important that assumptions such as homogeneity of variance
(that is, standard deviations of the scores in pre- and posttest are approximately
equal) and normality of the distribution of the scores (in both tests) are met. I first
check this, and then I explore the separate scoring on MAS and AMAS components,
compare their reliability and factor analysis with literature results, and explore the
level of correlation between these two tests. In the next section, I analyze the results
of the Test Anxiety Inventory (TAI) and compare my results of the reliability and
factor analysis of TAI with that of the literature results. In the subsequent sections,
the scores of the marks obtained by first year pre-service teachers in the WISCAT-
pabo test are presented and I explore the possible relationship between these test
scores and the scores on the anxiety tests. The qualitative results of the interviews
and the discussions of the workshop are also presented in this chapter.
5.1 Findings for Pre- and Posttest This section is organized as follows: First I report on the process of data collection
and what data I use in my data analysis. In the next subsections I present the results
of the pre- and posttest, and I compare the scores.
5.1.1 Data Collection and Data Analysis Procedure Data for the pretest were collected during the compulsory mathematics class and
during the optional training sessions. Due to some practical difficulties, data in the
pretest were obtained for only 108 students out of a total of 180 students in the first
year. Since the math anxiety test was not obligatory, 76 of them filled out the ques-
tionnaire before the first WISCAT-pabo test and 32 filled it out after the first
WISCAT-pabo test. Those students who attended the optional training sessions and
received peer tutoring were expected to take the posttest. Only 30 of them actually

28
appeared for the posttest. No data were obtained for the rest of the students, as they
did not seem to come to HvA. The pre-service teachers who passed the first
WISCAT-pabo test and had a low score in the pretest were excluded in the pre- and
posttest comparison because they obviously did not participate anymore in the
posttest and the second WISCAT-pabo test. However, there were 8 pre-service
teachers who had passed the first WISCAT-pabo test, but were math anxious
according to the pretest. Since they had already obtained a pass score in the
WISCAT-pabo test, they did not attend the training sessions and so were unavailable
for any interviews or further investigations.
5.1.2 Results of the Pre- and Posttest I analyzed the data both with the statistical software STATA 9 and SPSS 18, just to
have redundancy in my data analysis. Since I used a combination of two standardized
tests, the sum of the scores on MAS and AMAS was considered as the final score on
the math anxiety test. The mean value and standard deviation of the scores on the
combined mathematics anxiety scale (MAS and AMAS) in the pretest and posttest is
provided in Table 5.1. From this table one easily gets the impression that there is not
much difference between the scores in pre- and posttest. I come back to this in
Subsection 5.1.4.
Mean SD N
Pretest: (before WISCAT)
(after WISCAT)
51.5
46.5
14.4
18.4
76
32
Posttest 51.2 15.7 30
Table 5.1. Math anxiety score means and standard deviations for pre- and posttest.
I categorized participants scoring one standard deviation more than the mean
as highly math anxious. In order to find the number of pre-service teachers who are
math anxious according to the combined test used in my study, the two data sets
(anxiety test administered before and after WISCAT-pabo test) have been analyzed
separately. 12 out of 76 participants who took the math anxiety test before the
WISCAT-pabo test were found math anxious according to the test scoring and 7 out
of 32 students who took the math anxiety test after the WISCAT-pabo test were
found math anxious according to the test scoring. In other words, these data suggest
that about 16% of the students can be categorized as math anxious according to our

29
criterion. Assuming that the data of scores are normally distributed, this is a percent-
age in the order that one may expect.
5.1.3 Assumptions of the t-Test Analysis for Pre- and Posttest Prior to conducting the t-test analysis in which pre- and posttest scores are compared,
data were subjected to tests of multivariate normality. I used the Shapiro-Wilk statis-
tic to check normality of the test scores of those students who took the math anxiety
test before the WISCAT-pabo test. The obtained p-value of .73 was greater than
alpha=.05, which suggests that the distribution of the scores is normal. When the
combined scores are split into two parts, namely, the MAS and AMAS scores, then
the Shapiro-Wilk test also suggests normal distribution of test scores (p-value is .72
and .06, respectively). However, the data obtained from the 32 students who took the
anxiety test after the WISCAT-pabo test did not satisfy the normality test.
The p-values for the Shapiro-Wilk tests are .005, .002 and .019 for the total scoring,
MAS and AMAS, respectively. Since the p-values are all less than alpha=.05, I
decided to exclude the results for these students in the data analysis for the following
reasons: Firstly, their data did not show a normal distribution and secondly, out of the
number of students who took the math anxiety pretest after the WISCAT-pabo test,
only 3 of them also took the post test and only one of them has been identified as
both math anxious and test anxious. Therefore, no harm is done in the data analysis
when I restrict the analysis to the group of students who took the math anxiety test
before the WISCAT-pabo test. To illustrate normality of test scores, I give one
example as supplementary information to the Shapiro-Wilk normality tests: Figure
5.1 shows the 8-bin histogram of MAS scores in the pretest and the normal curve that
approximately describes the distribution of the data.

30
Figure 5.1. A histogram of MAS-measured math anxiety in the pretest.
In the t-test analysis comparing the pre- and posttest scores, I can obviously
only consider the scores of those students who took both tests. Therefore I repeated
the normality testing of the data set. Data for the posttest was also tested for normal-
ity. There were only 26 students in the t-test analysis. The high value in the Shapiro-
Wilk test (W= .96) for normality of the pretest scores indicates that the math anxiety
score was not significantly different from a normal distribution (p-value =.44 >
alpha= .05). The high value in the Shapiro-Wilk test (W= .96) for normality of the
posttest scores indicates that the math anxiety score was not significantly different
from a normal distribution (p-value = .42 > alpha= .05).
Another assumption for applicability of t-test analysis is homogeneity of vari-
ance, that is, almost equality of standard deviations of test scores. The standard
deviations were 12.7 and 16.4 for pre- and posttest, respectively. I used the Levene-
test for this purpose and it supported the hypothesis that the standard deviations are
not significantly different (p-value = .185 > alpha = .05).
5.1.4 t-Test Analysis: Comparing Pre- and Posttest Scores I examined the results of the math anxiety tests in detail. A positive difference indi-
cated increase in math anxiety level while a negative difference indicated a reduction
in math anxiety levels. Comparing the individual scores on the pre- and posttest I
found that in general there was a reduction in the math anxiety level of the partici-
pants. When examined on an individual score level (n = 26), 15 participants' math

31
anxiety scores decreased from pretest to posttest. However, at the same time 9 par-
ticipants’ scores on the math anxiety scale increased and two participants’ scores did
not change. Therefore a more objective method for comparison of test scores was
needed to explore whether there were significant difference in scores. A paired sam-
ples t-test was conducted to evaluate the hypothesis that there is no significant differ-
ence in the math anxiety level of the pre-service teachers in the pre- and posttest. The
results indicated that the mean difference of scores in the pretest (M=53.9, SD=12.7)
was statistically greater than the mean score in the posttest (M=51.5, SD=16.4),
t= 1.082, df= 25, p=.289, p<.05). Therefore, I reject the null hypothesis and conclude
that the mean difference of the scores in the pre- and posttest is not statistically
significantly different from 0.
5.2 Psychometric Analysis of the Math Anxiety Tests
In this section I discuss the psychometric quality of the math anxiety tests. This con-
sists of a reliability analysis and a factor analysis. In addition I compare the MAS and
AMAS components of the mathematics anxiety scale used.
5.2.1. Reliability Internal reliability of the 19-item math anxiety test was assessed for the pre- and
posttest respectively, using the Cronbach α technique. Please note, in the reliability
analysis of the pretest presented in this section I only look at the test administered
before the WISCAT-pabo test with 76 participants (See Section 5.1.3). The 19-item
math anxiety scale produced an alpha of .94 and .96 for the pretest (76 participants)
and the posttest (30 participants), respectively. However, if the first item in the math-
ematics anxiety test is deleted, then the value of α for the pretest increases. Together
with the observation that the inter-item correlation matrix has a first row and column
with small inter-item correlations, this suggests that the first item (i.e. It doesn’t
bother me at all to take more math classes) is a factor on its own unrelated with the
other items. Therefore, in the factor analysis of the MAS component of the math
anxiety tests, the first item will be removed.
The internal reliability of the MAS component and the AMAS component of
the pre- and posttest were also explored and compared to the results obtained in the
literature. Using the split-half method, a reliability coefficient of .81 and .85 for the
10-item MAS component of the pre- and posttest was found, respectively. These

32
values are smaller than the reliability coefficient of .92 reported by Betz (1978) in a
study with 652 College students. However, it still suggests a sufficiently reliable
math anxiety test. Using Cronbach’s α method, a reliability coefficient of .90 was
found for the 10-item MAS component of the pre- and posttest. Using Cronbach’s
α method, a reliability coefficient of .90 and .94 for the 9-item AMAS component of
the pre- and posttest was found, respectively. These values are consistent with the
value of .90 reported by Hopko et al. (2003) in a study with 206 undergraduates.
Thus, it certainly suggests a sufficiently reliable math anxiety test. For the record, for
the Learning Math Anxiety Scale (item 1, 3, 6, 7, 9 of AMAS) I found a reliability
coefficient of .88 and .92 for the pre- and posttest. These values are consistent with
the value .85 reported by Hopko et al. (2003) in a study with 206 undergraduates. For
the record, for the Math Evaluation Anxiety Scale (item 2, 4, 5, 8 of AMAS) I found
a reliability coefficient of .84 and .86 for the pre- and posttest. These values are
consistent with the value .88 reported by Hopko et al. (2003) in a study with 206
undergraduates. Table 5.2 summarizes the Cronbach’s α found for the various math
anxiety tests.
MAS (10 items) AMAS (9 items) Combined (19 items)
Pretest .90 .90 .94
Posttest .90 .94 .96
Table 5.2. Cronbach’s α for math anxiety tests (pre-and posttest scores)
5.2.2 Factor Analysis of the Math Anxiety Test For the pretest, I conducted an exploratory factor analysis on the 10-item MAS com-
ponent and on the 9-item AMAS component of the math anxiety test. In case of the
MAS test, I excluded the first item in the factor analysis (See Section 5.2.1).
The factor analysis of the 9-item remainder of the MAS test resulted in only
one component. This result was as expected from the research literature about the
MAS test that explains that the test was designed as such. The positive and negative
wordings in MAS do not lead to separate principal components: this is the result one
desires because the testing of math anxiety should not depend on the direction in
which the items are phrased (positive or negative).
An exploratory factor analysis was conducted on the 9-item AMAS compo-
nent of the math anxiety test using a principal components extraction and varimax

33
rotation with Kaizer normalization within a two-factor forced solution. The two-
factor exploratory analysis accounted for 69.6% of the variance. This agrees with the
results of Hopko et al. (2003). These authors interpreted the factors using the sub-
scale designations of Learning Math Anxiety (LMA) and Math Evaluation Anxiety
(MEA). I was particularly interested whether I would find the same splitting of items
into the LME and MEA components as the author cited and similar factor loadings.
Table 5.3 illustrates the excellent agreement between my results and those of Hopko
et al. (2003). Only the designation of the component of the first item (i.e. Having to
use the tables in the back of a math book) in my anxiety test is indecisive; probably
because the item may have confused the students because Dutch mathematics
textbooks do not heavily use tables in the back of the book.
Factor loadings in
my research study
Factor loadings in
Hopko et al (2003)
Original AMAS Items LME MEA LMA MEA
1. Having to use the tables in the back of a math book .52 .52 .52 .35
2. Thinking about an upcoming math test 1 day before .30 .84 .27 .86
3. Watching a teacher work an algebraic equation on
the blackboard
.69 .43 .77 .35
4. Taking an examination in a math course. .35 .79 .22 .89
5. Being given a homework assignment of many
difficult problems that is due the next class meeting
.47 .60 .31 .66
6. Listening to a lecture in math class .89 .22 .86 .25
7. Listening to another student explain a math formula. .90 .12 .82 .17
8. Being given a “pop” quiz in math class .06 .84 .29 .84
9. Starting a new chapter in a math book .73 .34 .75 .26
Table 5.3. Factor loadings of AMAS items (designated factors in boldface)
5.2.3 Correlation between MAS and AMAS components I computed the correlation between the student scores on the MAS test (item 1
excluded) and the AMAS test in the pretest. The math anxiety measured via MAS
was positively related to the math anxiety measured via AMAS with a Pearson
correlation coefficient of .71r = and the (one-tailed) significance value is less than
.01, which means that the correlation was significant.

34
Figure 5.2 show the scatterplot of the MAS-measured anxiety level and the AMAS-
measured anxiety level containing a least-squares line fit with the goodness-of-fit
value of 2 .5R = .
Figure 5.2. A scatterplot of MAS and AMAS-measured anxiety level and a line fit.
5.3 Findings for the Test Anxiety Inventory In this section I first report the process of data collection and what data I use in my
data analysis. In the next subsections I present the results of the test.
5.3.1 Data Collection and Data Analysis Procedure Data for the Test Anxiety Inventory (TAI) were collected from those students who
had not passed the first WISCAT-pabo test or wanted to improve their WISCAT-
pabo score. The test was administered during the optional training sessions, three
weeks after the WISCAT-pabo test. Because I wanted to compare the students’ math
anxiety level and test anxiety level, I only analyzed the scores of the students who
had taken the math anxiety test before the WISCAT-pabo test. This means that data
of 42 students were analyzed.
5.3.2 Results of the Test Anxiety Inventory The mean score of the 20-item TAI dataset with a 4-point Likert scale was 41.8 with
a standard deviation of 11.0. Figure 5.3 shows the 12-bin histogram of TAI scores
and the normal curve that approximately describes the distribution of the data.

35
Figure 5.3. A histogram of TAI-measured test anxiety of students.
I also used the Shapiro-Wilk statistic to check normality of the test score. The high
value in the Shapiro-Wilk test (W= .96) indicates that the test anxiety score was not
significantly different from a normal distribution (p-value = .1 > alpha= .05).
In order to find the pre-service teachers who were test anxious, I categorized
them such that the score on the TAI was one standard deviation more than the mean.
6 out of 42 students were found test anxious.
5.4 Psychometric Analysis of the Test Anxiety Inventory
In this section I discuss the psychometric quality of the test anxiety test. This consists
of a reliability analysis and a factor analysis.
5.4.1 Reliability Internal reliability of the 20-item test anxiety inventory (TAI) was assessed via the
Cronbach α technique. The TAI administered for 42 students produced an α of .94.
This is in excellent agreement with the values reported by Spielberger (1980) for un-
dergraduates: α = .94 (males) and α = .95.
Spielberger (1980) divided the TAI into two subscales that assess worry and
emotionality components of test anxiety. The eight items that form the TAI Worry
subscale (TAI-W) are: 3, 4, 5, 6, 7, 8, 14, 17, and 20. The eight items that form the

36
TAI Emotionality subscale (TAI-E) are: 2, 8, 9, 10, 11, 15, 16, and 18. I also assessed
the internal reliability of these 8-item TAI subscales using Cronbach’s α technique
and found the following reliability coefficients: .85 (TAI-W) and .88 (TAI-E).
5.4.2 Factor Analysis of the Test Anxiety Test An exploratory factor analysis was conducted on the 20-item Test Anxiety Inventory
using a principal components extraction and varimax rotation with Kaizer normaliza-
tion. It resulted into 4 components for which the eigenvalue was greater than 1 and
that contributed 23.9%, 18.9%, 14.1%, and 10.1% of the total variance. From the
research literature I had expected three components: (1) the TAI-W items; (2) the
TAI-E items; and (3) the rest category of items 1, 12, 13 and 19. I also tried a factor
analysis using a principal components extraction and varimax rotation with Kaizer
normalization within a three-factor forced solution, but this did not lead to the
literature result: 4 items out 8 TAI-W items were grouped into the ‘worry
component’ and 5 items out 8 TAI-E were grouped into the ‘emotionality
components’. In a third attempt to get good agreement with literature results, I
conducted an exploratory factor analysis on the 16-item TAI-(W+E) (excluding items
1, 12, 13, 19) using a principal components extraction and varimax rotation with
Kaizer normalization within a two-factor forced solution. This also did not reproduce
the categorization of the items into TAI-WS and TAI-E as found in the literature.
Problematic items were in two last factor analyses: 3, 5, 6, 14 (TAI-W), 15, 16, 18
(TAI-E).
5.5 Findings of the WISCAT- pabo Tests
In this section, I report the process of data collection and results of the first and
second WISCAT-pabo test.
5.5.1 Data Collection and Data Analysis Procedure Data of the first WISCAT-pabo were collected for the participants who took the
pretest of the math anxiety test. According to this test, a candidate who scored 103
points or more was considered to have passed the WISCAT-pabo test. Since I was
interested here to find the influence of the math anxiety level on the performance of
the participants in the first WISCAT-pabo test, I analyzed the data for 72 participants
who took both the pretest as well as the first WISCAT-pabo test.

37
For the second WISCAT-pabo test I collected the data for the students who
appeared for the first WISCAT-pabo test and also went to the training sessions of-
fered by the staff of HvA as well as peer tutoring by peers. I wanted to compare here
the results of the first and second WISCAT-pabo and furthermore investigate if there
was an improvement in the performance of the student teachers in the second
WISCAT-pabo after having attended the training sessions and peer tutoring. I ana-
lyzed the data for 46 participants who appeared for the first and the second WISCAT-
pabo test and also attended the training sessions.
5.5.2 Results of the First and Second WISCAT-pabo Test The mean score of first and second WISCAT-pabo test was 99.1 and 90.2 respective-
ly. The standard deviation of the first and second WISCAT-pabo was 30.5 and 25.2,
respectively. I used the Shapiro-Wilk test to check if the data in the first and second
WISCAT-pabo satisfied the test for normality. The high value in the Shapiro-Wilk
test (W= .97) for normality indicated that the scores on the first WISCAT-pabo test
were not significantly different from a normal distribution (p-value =.07 > alpha=
.05). Out of the total participants, 62.5% pre-service teachers failed in the first
WISCAT-pabo test.
However, the Shapiro-Wilk test (W= .91) for normality indicated that the
scores on the second WISCAT-pabo test were significantly different from a normal
distribution (p-value = .002 < α = .05). 57.4% pre-service teachers failed in the
second WISCAT-pabo test.
Because of the problems with normality of the data distribution I applied a
non-parametric test that has fewer assumptions than the parametric counterpart such
as the paired samples t-test: I used the Wilcoxon signed ranks test for comparison of
the means of the WISCAT-pabo tests.
The Wilcoxon signed ranks test showed that WISCAT-pabo test scores for
those students doing the re-test were significantly higher in the second skills test
(median = 96.5) than in the first test (median = 88.0), z = -3.92, p = .000 < α = .05. I
also observed a drop in the attendance of the pre-service teachers in the second
WISCAT-pabo test when compared to the first one.
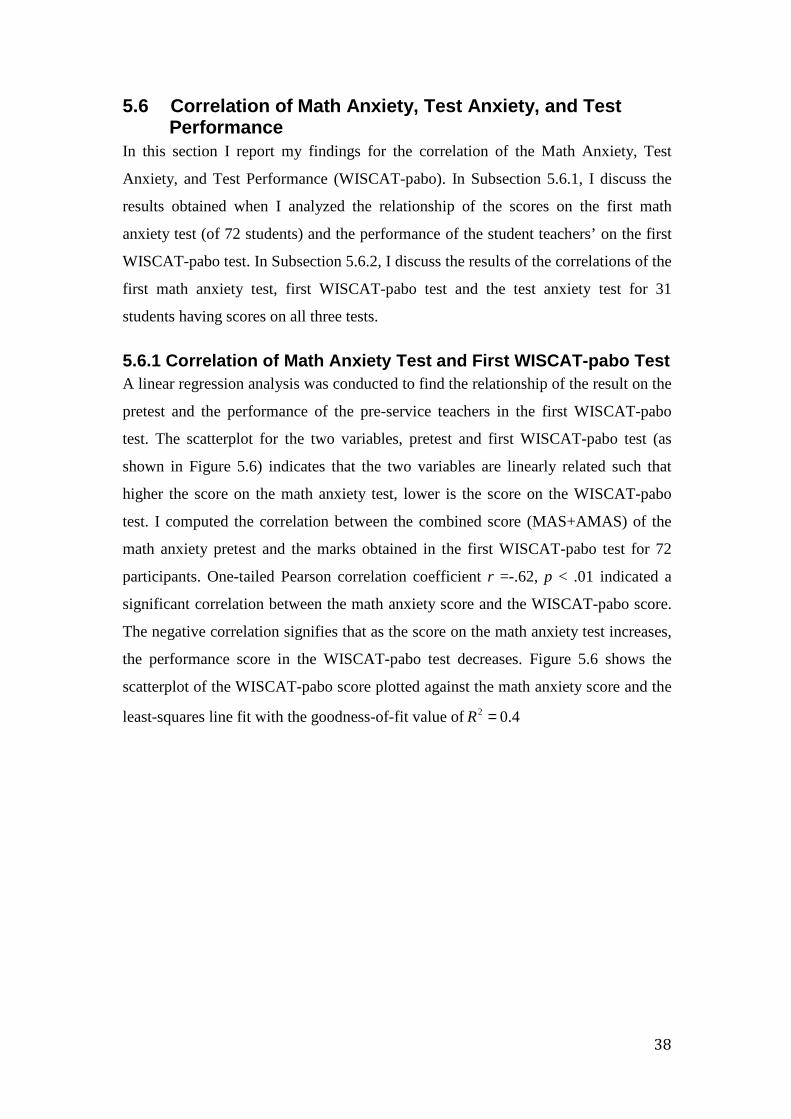
38
5.6 Correlation of Math Anxiety, Test Anxiety, and Test Performance In this section I report my findings for the correlation of the Math Anxiety, Test
Anxiety, and Test Performance (WISCAT-pabo). In Subsection 5.6.1, I discuss the
results obtained when I analyzed the relationship of the scores on the first math
anxiety test (of 72 students) and the performance of the student teachers’ on the first
WISCAT-pabo test. In Subsection 5.6.2, I discuss the results of the correlations of the
first math anxiety test, first WISCAT-pabo test and the test anxiety test for 31
students having scores on all three tests.
5.6.1 Correlation of Math Anxiety Test and First WISCAT-pabo Test A linear regression analysis was conducted to find the relationship of the result on the
pretest and the performance of the pre-service teachers in the first WISCAT-pabo
test. The scatterplot for the two variables, pretest and first WISCAT-pabo test (as
shown in Figure 5.6) indicates that the two variables are linearly related such that
higher the score on the math anxiety test, lower is the score on the WISCAT-pabo
test. I computed the correlation between the combined score (MAS+AMAS) of the
math anxiety pretest and the marks obtained in the first WISCAT-pabo test for 72
participants. One-tailed Pearson correlation coefficient r =-.62, p < .01 indicated a
significant correlation between the math anxiety score and the WISCAT-pabo score.
The negative correlation signifies that as the score on the math anxiety test increases,
the performance score in the WISCAT-pabo test decreases. Figure 5.6 shows the
scatterplot of the WISCAT-pabo score plotted against the math anxiety score and the
least-squares line fit with the goodness-of-fit value of 2 0.4R =
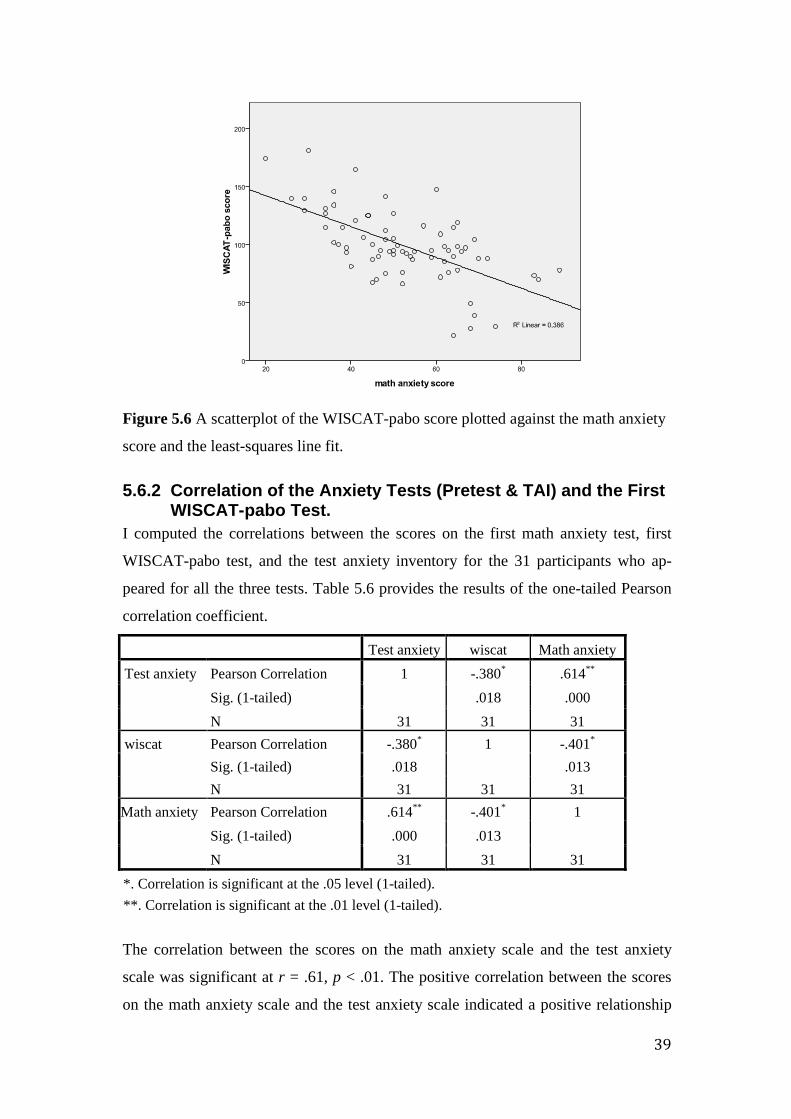
39
Figure 5.6 A scatterplot of the WISCAT-pabo score plotted against the math anxiety
score and the least-squares line fit.
5.6.2 Correlation of the Anxiety Tests (Pretest & TAI) and the First WISCAT-pabo Test. I computed the correlations between the scores on the first math anxiety test, first
WISCAT-pabo test, and the test anxiety inventory for the 31 participants who ap-
peared for all the three tests. Table 5.6 provides the results of the one-tailed Pearson
correlation coefficient.
Test anxiety wiscat Math anxiety
Test anxiety Pearson Correlation 1 -.380* .614**
Sig. (1-tailed) .018 .000
N 31 31 31
wiscat Pearson Correlation -.380* 1 -.401*
Sig. (1-tailed) .018 .013
N 31 31 31
Math anxiety Pearson Correlation .614** -.401* 1
Sig. (1-tailed) .000 .013
N 31 31 31
*. Correlation is significant at the .05 level (1-tailed).
**. Correlation is significant at the .01 level (1-tailed).
The correlation between the scores on the math anxiety scale and the test anxiety
scale was significant at r = .61, p < .01. The positive correlation between the scores
on the math anxiety scale and the test anxiety scale indicated a positive relationship
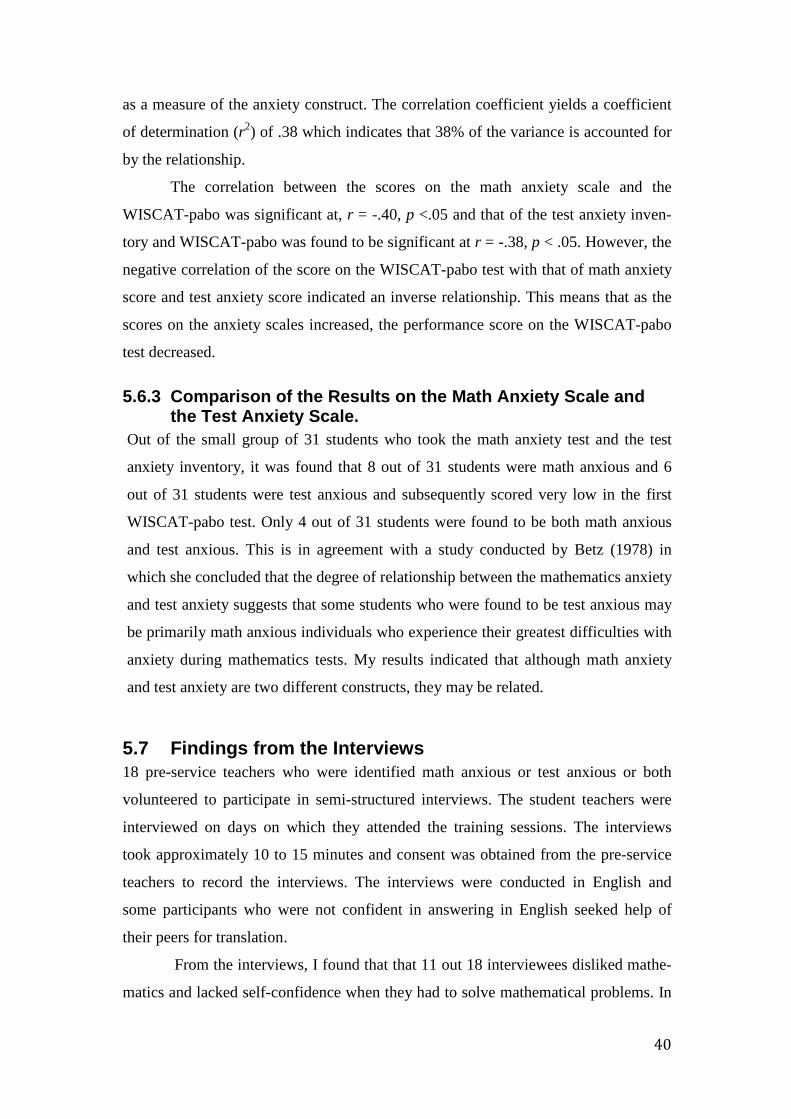
40
as a measure of the anxiety construct. The correlation coefficient yields a coefficient
of determination (r2) of .38 which indicates that 38% of the variance is accounted for
by the relationship.
The correlation between the scores on the math anxiety scale and the
WISCAT-pabo was significant at, r = -.40, p <.05 and that of the test anxiety inven-
tory and WISCAT-pabo was found to be significant at r = -.38, p < .05. However, the
negative correlation of the score on the WISCAT-pabo test with that of math anxiety
score and test anxiety score indicated an inverse relationship. This means that as the
scores on the anxiety scales increased, the performance score on the WISCAT-pabo
test decreased.
5.6.3 Comparison of the Results on the Math Anxiety Scale and the Test Anxiety Scale. Out of the small group of 31 students who took the math anxiety test and the test
anxiety inventory, it was found that 8 out of 31 students were math anxious and 6
out of 31 students were test anxious and subsequently scored very low in the first
WISCAT-pabo test. Only 4 out of 31 students were found to be both math anxious
and test anxious. This is in agreement with a study conducted by Betz (1978) in
which she concluded that the degree of relationship between the mathematics anxiety
and test anxiety suggests that some students who were found to be test anxious may
be primarily math anxious individuals who experience their greatest difficulties with
anxiety during mathematics tests. My results indicated that although math anxiety
and test anxiety are two different constructs, they may be related.
5.7 Findings from the Interviews 18 pre-service teachers who were identified math anxious or test anxious or both
volunteered to participate in semi-structured interviews. The student teachers were
interviewed on days on which they attended the training sessions. The interviews
took approximately 10 to 15 minutes and consent was obtained from the pre-service
teachers to record the interviews. The interviews were conducted in English and
some participants who were not confident in answering in English seeked help of
their peers for translation.
From the interviews, I found that that 11 out 18 interviewees disliked mathe-
matics and lacked self-confidence when they had to solve mathematical problems. In

41
this group of students, one of them was suffering from dyscalculia and said that she
had to work “extra hard” to pass the tests. The pre-service teacher’s mentioned the
following reasons for their dislike towards mathematics: they found mathematics very
hard to do; they could not apply what they had learnt; they had a feeling that they
were never good at mathematics; they had difficulty in understanding what was being
taught in class. The pre-service teachers pointed out that they started to dislike
mathematics during the shift from primary to secondary. The negative attitude of the
teacher and the difficulty to understand mathematics problems were seen as common
causes for their aversion towards mathematics. Some examples of responses from the
students during the interviews are the following:
“ When I was in the primary school and when I had difficulty, the teacher did
not want to help me. The teacher would say- you are dumb.”
“I hate mathematics because I find it difficult to understand. I did not get any help
in the school because teachers did not have time for it and they did not care at all.
A teacher even told me that I will be never good at math and that I will never
learn. That’s when I started to believe that I cannot do mathematics.”
Most of the participants felt as though their negative feelings towards mathematics
could have been prevented in elementary school, if they had received proper instruc-
tion and guidance from their teachers.
Seven students (out of 18) liked mathematics as long as they were able to
understand the problems and solve by themselves. These pre-service teachers were
more worried during test taking situations. One of them said: “I like math but I don’t
like math tests.”
Regarding the possible reasons for not doing well in the first WISCAT-pabo
test, pre-service teachers came up with several answers. The feelings of the partici-
pants during timed mathematics activities, such as testing situations became very
evident. Some of them were very nervous because they were not well prepared for the
test. The majority of them had forgotten what they had learnt at primary school level,
while others did not take up mathematics in their previous education and so had lost
touch with the subject altogether. Not only did they lack practice for the WISCAT-
pabo test, but they had also forgotten the concept of mental calculation owing to the

42
extensive use of calculators in the high school. As a result, it was considered a
difficulty to compute mentally even the simplest of all problems. Few pre-service
teachers had the opinion that they did not learn the concepts very well in their
primary school. One of them remarked: “We do not get all the information we need
to know when we come out of primary level.”
I also asked the pre-service teachers how they thought the optional training
sessions and peer tutoring benefited them. Most of them voiced their opinion for peer
tutoring, as they could assimilate better in comparison to the training sessions. The
identified advantages and disadvantages of peer tutoring and optional training ses-
sions respectively were as follows:
Advantages of Peer Tutoring:
- Peer tutors were of their age and so understanding was better.
- Peer tutoring took place in a small group of 3-4 students and so there was
more scope for individual communication.
- Tutoring happened in a friendly environment.
Disadvantages of Optional Training Sessions:
- Assignments were given on paper in contrast to the WISCAT-pabo test that is
computer based and involves mental arithmetic.
- Took place in the classroom setting.
- Focus was more on practicing the primary level mathematics rather than pre-
paring them to overcome the difficulty of online tests.
- Assignments were given every class that had to be done on their own.
(pre-service teachers expected the teaching faculty of HvA to teach them con-
cepts of primary level mathematics and not just give them assignments to do
on their own).
Last but not the least, the pre-service teachers always felt the pressure to pass
the WISCAT-pabo test in order to continue in the study program. The very fact that
failure in the mathematics skills test would result in their expulsion from the teacher-
training program made them more nervous and this could also be one of the possible
reasons that could have affected their performance in the skills test.

43
5.8 Findings from the Discussions in the Workshop In order to answer the sixth research question concerning the PCK of third-year pre-
service teachers about math anxiety, I conducted workshops in two sessions. In the
first workshop I discussed about the causes, symptoms, origin and measurement of
math anxiety. When I asked the pre-service teachers the question “What do you
know about math anxiety?” Some of the responses were as follows:
Math anxiety is the fear
• of doing mathematics;
• of doing wrong;
• of not understanding mathematics;
• for the teacher who is very strict;
• for asking help;
• to solve mathematical problems even before you see them;
• for being punished;
• for numbers;
• of failing to solve mathematical problem; or
• feeling that you cannot do mathematics.
At the end of the workshop two assignments were given to the pre-service teachers,
which was discussed with them in the second workshop. The second workshop was
conducted 4 weeks later after the pre-service teachers had spent one whole week
teaching in a school. The aim of the second workshop was to find out if the pre-
service teachers had observed any symptoms of math anxiety in their students during
their practice in school and the possible instructional strategies they could think of to
deal with such children. Some excerpts of the discussion of the two assignments are
as follows:
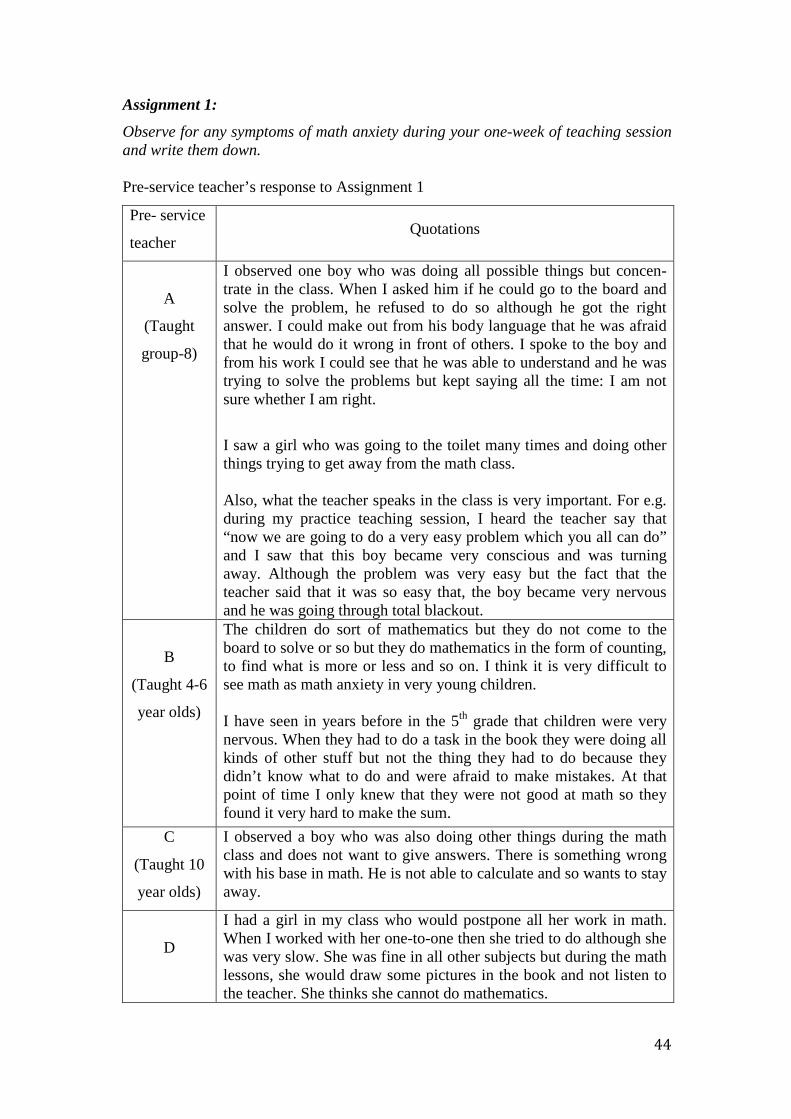
44
Assignment 1:
Observe for any symptoms of math anxiety during your one-week of teaching session and write them down. Pre-service teacher’s response to Assignment 1
Pre- service
teacher Quotations
A
(Taught
group-8)
I observed one boy who was doing all possible things but concen-trate in the class. When I asked him if he could go to the board and solve the problem, he refused to do so although he got the right answer. I could make out from his body language that he was afraid that he would do it wrong in front of others. I spoke to the boy and from his work I could see that he was able to understand and he was trying to solve the problems but kept saying all the time: I am not sure whether I am right.
I saw a girl who was going to the toilet many times and doing other things trying to get away from the math class. Also, what the teacher speaks in the class is very important. For e.g. during my practice teaching session, I heard the teacher say that “now we are going to do a very easy problem which you all can do” and I saw that this boy became very conscious and was turning away. Although the problem was very easy but the fact that the teacher said that it was so easy that, the boy became very nervous and he was going through total blackout.
B
(Taught 4-6
year olds)
The children do sort of mathematics but they do not come to the board to solve or so but they do mathematics in the form of counting, to find what is more or less and so on. I think it is very difficult to see math as math anxiety in very young children. I have seen in years before in the 5th grade that children were very nervous. When they had to do a task in the book they were doing all kinds of other stuff but not the thing they had to do because they didn’t know what to do and were afraid to make mistakes. At that point of time I only knew that they were not good at math so they found it very hard to make the sum.
C
(Taught 10
year olds)
I observed a boy who was also doing other things during the math class and does not want to give answers. There is something wrong with his base in math. He is not able to calculate and so wants to stay away.
D
I had a girl in my class who would postpone all her work in math. When I worked with her one-to-one then she tried to do although she was very slow. She was fine in all other subjects but during the math lessons, she would draw some pictures in the book and not listen to the teacher. She thinks she cannot do mathematics.

45
Assignment 2:
Think of the instructional strategies you may adopt in order to deal with pupils with math anxiety in your classrooms.
Pre-service teacher’s response to Assignment 2
Pre-service Teacher’s
Quotation
A
I would like to give them stuff, which is more visual, and not with too much numbers because then they may not understand and so they might be afraid of it. I would also like to sit together with the child who has some diffi-culties so that he is not afraid of solving problems. When he is in the whole class he is afraid to ask questions but when you are with him he is no more afraid.
B
You have to let them feel safe. I keep telling my students to ask me if they do not understand a problem and keep asking till they under-stand it well. If I already know that a child is math anxious before I give a lesson then first I will teach the whole class and then I will attend to the math anxious children separately and give them the same instruction in a different context and in this way they get the instruction twice.
C
Create a safe and supportive environment. Provide the self-confidence to the children that they can do mathe-matics. Working with manipulatives like blocks.
D Work with the child on one-to-one.
Some of them did not observe any symptoms of math anxiety but had few points to
give when asked about the instruction strategies they would adopt in their future to
deal with math anxious students. For e.g.,
• Give them easy assignments
• Work with the math anxious students at a slower pace
• Make them sit with a child who is good in mathematics
• Work on the self-esteem and motivate them by saying – “ you can do it.”
Ironically, the teachers in the schools where the pre-service teachers went for
their training also did not take any measures towards students who did not perform

46
very well in mathematics. When I asked the pre-service teachers if they discussed
their observation with their mentor teachers in school, the answer was- “yes, but the
teacher said that they do not give turn to children who cannot do it well. She thought
she was doing a good thing but I think that she should have given easy questions to
them and helped them.”
5.9 Comparison of Math Anxiety Test Scores and Self-Ratings It was not really part of my research study, but out of curiosity I also asked students
in the pretest to rate their math anxiety level on a scale from 1 to 10. This allowed me
to compare the math anxiety test scores with the self-ratings. It turned out that these
quantities correlated significantly. Figure 5.9 shows the scatterplot of the score on the
math anxiety scale plotted against the self rating of the participants and the least
square line fit with the goodness-of-fit value of 2 .5R = .
Figure. 5.9 A scatterplot of the score on the math anxiety scale plotted against the self-rating and the least -square line fit

47
6 Discussions and Conclusions
In this chapter, I summarize my findings relative to the quantitative analysis
described in Chapter 5 and organize the conclusions by answering my research
questions.
Research question 1
Does the standardized math anxiety tests indicate the existence of math anxiety
amongst first year elementary pre-service teachers when they enter the teacher-
training program?
The results of this study add to the current literature on the existence of mathematics
anxiety in the pre-service teachers. According to the mathematics anxiety scale used
in my study, which was a combination of two short standardized tests indicated that,
math anxiety existed in the first year elementary pre-service teachers. Results
indicated that 16% and 22% of the population, who administered the math anxiety
test before and after the WISCAT-pabo test respectively, had a high score when they
entered the teacher-training program. The math anxiety test was given to the pre-
service teachers in the form of a questionnaire (see Appendix A) where they also had
to self-analyze their math anxiety level on a scale from 1 to 10. The strong correlation
between the score on the math anxiety test and their self-analysis indicated that the
pre-service teachers were aware of their own anxiety level in mathematics.
The Psychometric tests done on the two standardized tests 10-item MAS and
9-item AMAS used in my study indicated that both these instruments provide a
reliable assessment of mathematics anxiety in elementary pre-service teachers. The
internal reliability Cronbach α=. 94 for the 19-item test indicated that the choice I
made to combine two standardized tests was an appropriate one and gave me
satisfactory results for my target group of pre-service teachers. Since the results
obtained in the two standardized tests to measure math anxiety are similar, I conclude
that MAS and AMAS tests can be used separately or in combination in future studies
to investigate math anxiety in pre-service teachers.
Furthermore, the pre-service teachers who were found to be math anxious
according to the standardized test also expressed their dislike and fear towards

48
mathematics related situations during the semi-structured interviews. The main cause
of their anxiety has been their negative classroom experiences in mathematics in the
primary level. Most of the pre-service teachers interviewed, attributed their major
source of dislike towards mathematics to the teachers and/or teaching methodology
during their course of study in school. Some of them developed an aversion towards
mathematics in the primary level while some others in their high school level. Since
they had minimal family support and outside help during their school years, not much
was done to address their anxiety level in mathematics. However, during the inter-
views the pre-service teachers’ said that they realized the need and importance to
overcome their anxiety level in mathematics before they started their full time
teaching career. Therefore, teacher education program should encourage prospective
teachers to become aware of their level of mathematics anxiety and take serious
measures to help them overcome their anxiety level before they begin their career as
full time teacher at a primary school..
Research question 2
Is there a correlation between students’ results on the first math anxiety test and their
performance in the first WISCAT-pabo test?
In order to check for the correlation between students’ results on the first math
anxiety test and their performance in the first WISCAT-pabo test for my target group
of 72 students, I calculated the Pearson correlation coefficient. The negative correla-
tion between the results of the pretest was significant with that of the result of the
first WISCAT-pabo test. The scatter plot between the two variables (pretest and
WISCAT-pabo test) indicated a linear relationship between them. This means that as
the score on the math anxiety scales increased, participants exhibited poorer
performance in the WISCAT test, irrespective of the instrument (MAS or AMAS)
used. The findings of this study concur with the results of other studies (Betz, 1978;
Hembree, 1990) in which the researchers have found that people with high math
anxiety level exhibit low performance in mathematics achievement test and vice
versa.
During the time of the semi-structured interviews with the first year pre-
service teachers, I asked them for possible reasons that in their opinion explained
their low score in the first WISCAT-pabo test. Some of the pre-service teachers

49
thought that they lacked practice and had also forgotten arithmetic taught at their
primary school level. This made them nervous before the test and they lacked self-
confidence. Some of them thought that they had not learnt the concepts very well
during their primary school time and so did not know how to solve the problems
asked in the WISCAT-pabo test. The majority of them expressed their fear and
dislike towards the subject itself.
The pre-service teachers were of opinion that it would have been beneficial if
they were given practice sessions online. Since the WISCAT test is online and the
first few questions had to be solved mentally, lot of students had difficulty in this
section. This could be attributed to the use of scientific calculators in the high school,
which disables the capability for mental arithmetic. Furthermore, a low score in the
WISCAT-pabo test could also be the result of student teacher’s conceptual weakness
in arithmetic.
Research question 3
For those students who participate in the trainings sessions after the first WISCAT-
pabo test (those who failed and those who wanted to improve their test score) and
take the test anxiety test, what are the students’ results on the math anxiety test and
the test anxiety test? Are there correlations between the three test results?
The findings of my research study were in agreement with studies conducted by
researchers on math anxiety and test anxiety (as discussed in Chapter 2). A number of
researchers have found that there exists a relationship between math anxiety and test
anxiety (Dew, Galassi & Galassi, 1984). In my analysis I found that the test anxiety
scale had a strong correlation with the math anxiety scale, which reflects the relation-
ship between test anxiety and math anxiety. The comparison of the results on the
math anxiety scale and the Test Anxiety Inventory indicated that 13% of the pre-
service teachers who took the two tests were both math anxious and test anxious. The
positive correlation between the scores on the math anxiety scale and test anxiety
scale indicated a positive relationship between the two scales as a measure of the
anxiety construct.
In order to check whether the scores on the math anxiety scale, test anxiety
scale and WISCAT-pabo test were correlated, I did the Pearson correlation coeffi-
cient test. The results indicated a negative correlation between the WISCAT-pabo test

50
with that of the math anxiety test and test anxiety test respectively. This means that as
the scores on the anxiety scales increased, the performance score on the WISCAT-
pabo decreased. One of the possible reasons for this low performance in the
WISCAT-pabo test could also be due to the stress experienced by pre-service
teachers due to computerized adaptive testing. Therefore, the poor performance of the
student teachers in the first WISCAT-pabo test could be attributed to their math
anxiety, test anxiety, or both.
The factor analysis of the Test Anxiety Inventory (TAI) did not lead to results
comparable to those reported in research literature. Based on this literature, I was
looking for the two components- worry and emotionality components in the TAI
scale. According to my results I got 4 components for the TAI scale. Although the
20-item TAI test seemed to be a reliable test to measure test anxiety, the factor analy-
sis did not yield the results reported in the literature. Maybe the rather small number
of participants (42) is an explanation.
Research question 4
How do results on the second WISCAT-pabo test compare with results of the first
WISCAT-pabo test for those students who take the training sessions and the peer
tutoring?
According to the Wilcoxon test, the score on the second WISCAT-pabo test was
significantly higher than the first WISCAT-pabo test. Also, the percentage of pre-
service teachers who failed the second WISCAT-pabo test (57.4%) was lower than
the ones who failed in the first WISCAT-pabo test (62.5%). I also conclude from the
results of the second WISCAT-pabo test that most of the pre-service teachers who
did not perform well in the first WISCAT-pabo test managed to score better marks
and some of them even passed the retest.
During the interview sessions with the pre-service teachers I had asked them
if they found the training sessions and peer tutoring helpful enough to prepare them
for the second WISCAT-pabo test. The pre-service teachers seemed indeed more
confident and thought that they were better prepared for the second WISCAT-pabo
test for the following reasons:
• Pre-service teachers had become familiar with the pattern of the WISCAT
pabo test.
51
• The training sessions and peer tutoring provided them with opportunities for
practice.
• Revision of mathematical topics learnt in the primary level during training
sessions were helpful.
• One-to-one help during peer tutoring
When asked about the usefulness of optional training sessions and peer
tutoring, many of them commented that they understood mathematics much more
when their own peers taught them. Although some of them thought that they benefit-
ted from the training sessions, some others did not find them very useful. They
expected the teaching faculty of HvA to teach them concepts of primary level mathe-
matics and not just give them assignments to do on their own. Moreover, as a prepa-
ration to the online WISCAT-pabo test, the pre-service teachers looked for assign-
ments that were computer-based and involved mental arithmetic and not just on
paper. Nevertheless, the performance in the second WISCAT-pabo was an indication
that pre-service teachers had certainly benefitted in some ways to perform better in
the second WISCAT-pabo test.
Research question 5
How do results on the second math anxiety test compare with the result of the first
math anxiety test for those students who take the training sessions and the peer
tutoring?
I first compared the results of the scores on the pre- and posttest on an individual
score level. In general there was a reduction in the math anxiety level in 15 out of 26
participants. The results of the t-test indicated that the mean difference of scores in
the pretest was statistically greater than the mean score in the posttest. Therefore,
there was a significant reduction in the math anxiety level in the pre-service teachers
in the posttest when compared to the pretest.
When examined on an individual score, 9 out of 26 participants’ scores on
the math anxiety scale increased. During the interview sessions with these student
teachers, they had expressed their fear in terms of passing the WISCAT-pabo test in
order to continue their program in the pabo. These student teachers did not seem very
confident to appear for the retest, because they still felt they could “not do mathemat-
ics”. Having not passed the first WISCAT-pabo test, the pre-service teachers felt

52
pressure to pass the second test in order to continue their study in the teacher-training
program in the PABO. This could be a possible reason for the increase in their
anxiety level. In fact, four of them did not even appear for the second WISCAT-pabo
test.
Research question 6
What Pedagogical Content Knowledge about mathematics anxiety do third year pre-
service teachers have?
a) Did they observe mathematics anxiety amongst their pupils during their teaching
practice sessions?
b) If so, what instructional strategies did they think of and/or have they used in their
lessons in order to deal with their pupils’ anxiety.
Regarding the pedagogical content knowledge of math anxiety, the majority of third-
year pre-service teachers could identify the terminology with “fear” in the general
sense, but they did not have a clear idea that it is the fear or dislike exhibited by their
students towards the subject mathematics. Prior to my workshop, the pre-service
teachers had already many opportunities in the past to meet primary school pupils
during their practice teaching sessions who had shown their discomfort and dislike
towards mathematics. The pre-service teachers considered this behavior as a lack of
confidence to do mathematical problems. Some of them even thought that probably
the child was not good at math and so had difficulty with problem solving. In conclu-
sion, although the pre-service teachers came up with some responses in terms of the
literal meaning of ‘math anxiety’, the answers were not very convincing to conclude
that the third year pre-service teachers had the PCK of math anxiety.
When asked if the student teachers’ observed any symptoms of math anxiety
amongst their pupils during their teaching practice sessions, the student teachers
responded in the affirmative sense; what follows is a list of their observations:
� Lack of concentration in the class.
� Lack of confidence to solve problems.
� Being afraid to solve problems on the board even though h/she has got the
right answer.
� Finding excuses to escape the math class.
� Nervousness while doing tasks from the book.

53
� Postponing work in the math class and instead drawing pictures in the math
book.
� Feeling that one cannot do mathematics.
One of the student teachers, who taught at kindergarten level (4-6 years old), thought
that it was difficult to see symptoms of math anxiety in very young children. Another
student teacher, along with her observation of the pupils in the classroom, also
observed the attitude of the teacher in the class and made a very good point that it is
important that the teacher should be aware of what he/she speaks in class as it may
also cause anxiety in the children.
Thus, the pre-service teachers observations of few students in their class made
clear that they had in practice become aware of the symptoms of math anxiety and
also realized that such pupils need to be given lot of support and attention.
When I asked the student teachers whether they thought of any particular
instructional strategy or if they had used any teaching methodology during their
practice teaching sessions to deal with math anxious students in their classroom, the
responses were as follows:
� I will use visual stuff.
� I sat together with the child and provided support.
� I will try to make the students feel safe and comfortable in math class.
� I shall give individual attention and different kind of instruction.
� I provided self-confidence to the child by saying “you can do mathematics.”
� I will work with manipulatives.
� I will provide with assignments that are easier.
� I made the child sit with a peer who is kind and good at math.
The above strategies cited by the student teachers were a clear indication that
the pre-service teachers had not only become aware of math anxiety but also had
thought about possible instructional strategies they would implement in their class-
rooms to help students with math anxiety. The pre-service teachers had begun to
identify pupils who struggled with mathematics in their classroom and thought that
they must help them out. Ironically, the mentor teachers in the schools where the
student teachers went for their practice sessions seemed to exhibit negligence towards
children who did not perform well in mathematics. One of the student teachers who
observed this attitude of the mentor teacher felt that the teacher’s approach was not
54
the right one. Instead of ignoring the child who is weak in mathematics and not
giving him/her opportunities, the student teacher felt that the teacher should have
given the child easy questions and individual attention.
In conclusion, I considered the workshop that I conducted as a successful one:
the third year student teachers seemed to benefit from it and it increased their
awareness about the symptoms of math anxiety and their knowledge about possible
ways to help children overcome their anxiety. Although some of them did attempt to
try out some of these methods during their one week of practice sessions, some others
only hoped to implement them in their future classrooms in order to deal with math
anxious students.

55
7 Limitations and Recommendations
In this chapter I discuss limitations of my study, based on the constraints of the
research design and the practicalities of the research at the PABO, and implications
and recommendations for future studies.
7.1 Limitations Based on the data collection and findings of this study, the following limitations
should be considered:
- Not all participants took the math anxiety and test anxiety tests at the planned
moments.
- Only few participants were available for all the three tests: pre- and posttest of
math anxiety test and test anxiety test.
- Some of the student teachers who took the pretest were not available for the
posttest of math anxiety. I could only compare the results of pre- and posttest
of math anxiety for a rather small number of participants. Therefore, it is not
possible to generalize the findings of this study to the large student population
with regards to change in the math anxiety levels with respect to the first and
the second WISCAT test.
- The difficulty in using self-report instruments is whether the participant
honestly reports his/her feelings or emotions. It is quite possible that the par-
ticipant’s frame of mind at the time of the test may influence his/her response.
7.2 Implications and Recommendations
The implication of this study for primary teacher training programs was that there is a
need for increased attention on the mathematics anxiety of pre-service teachers and
their negative attitudes about mathematics. I recommend that pre-service teachers be
made aware of their mathematics anxiety level and their attitudes about mathematics.
As seen in many literatures, math anxiety is also transmitted from the math anxious
teachers to their students during their process of teaching. In order to combat this, it
is important to make the teachers themselves aware of their math anxiety levels and
help them to overcome their fear and their negative attitudes about mathematics.

56
Secondly, teacher education programs better acknowledges and addresses the
importance of these affective variables and their role in pedagogy. Therefore, as
educators and teacher training institutes prepare students to pursue a teaching career,
they better examine mathematics anxiety specifically as it relates to pre-service
teachers and its influences on the attitudes of the teacher and their teaching in the
elementary school classroom.
This research study did not find statistically significant results regarding the
factor analysis of the Test anxiety Inventory. With hindsight, the choice of the testing
instrument or the translation of the TAI instrument in order to adapt to the Dutch
educational system may have impacted the results of my study. However, the same
was not true for the choice of Math anxiety instruments. The results were highly
comparable with those found in the literature. The choice of two standardized math
anxiety instruments, as well as the translation of the items in Dutch, seemed to be apt
for my target group of students.
The findings of this study indicated that the pre-service teachers in the first
year teacher-training program had an aversion and negative attitude towards
mathematics. Interestingly, there were eight pre-service teachers who were math
anxious but had passed the WISCAT-pabo test. Although these pre-service teachers
were found math anxious according to the standardized test, no step was taken to help
them reduce or overcome their anxiety. Since these student teachers had passed the
WISCAT-pabo test they did not attend any training sessions and therefore did not
take the test anxiety test. Because there was no opportunity to meet them or interview
them, I could not investigate further regarding their math anxiety. This is something
that the faculty staff of PABO can look into in the future.
As suggested in the literature, the teacher transmits their own negative
feelings and anxiety in mathematics to their students. However, this negative feelings
and even hatred towards mathematics can be attributed to the poor mathematics
instruction the pre-service teachers underwent in their elementary school time and
some of the blame also lies with schools of education at secondary level.
I make the following recommendations:
• All pre-service teachers undergo a mathematics anxiety test at the beginning
of the semester, followed by additional support to be provided for pre-service
teachers who are math anxious. This support to reduce mathematics anxiety
57
can be provided by giving mathematics courses focusing on the content and
methodology.
• Students are provided with mathematics courses before the WISCAT-pabo
test. Since many of the students entering the teacher training program are
from different educational backgrounds with some of them having lost
practice with mathematics in their previous education, it was observed that
many of them lacked the practice and hence the confidence to solve primary
level mathematics problem. One better acts upon this.
• Pre-service teachers should be given mathematics practice sessions where
they have to solve mathematics problem mentally in order to prepare them for
the WISCAT-pabo test.
• The training sessions set up to help pre-service teachers pass the WISCAT-
pabo test should also contain sessions about solving mathematical problems
online, rather than focusing only on paper-and-pencil exercises.
• The pre-service teachers during their program should have a lesson on math
anxiety in order to increase their Pedagogical Content Knowledge (PCK)
about math anxiety and the strategies they could use on their pupils to
overcome the same. All future teachers must be made aware of the causes,
symptoms and remedies to decrease math anxiety and foster the development
of mathematical literacy.
In conclusion, student support strategies may be beneficial in reducing math
anxiety and improve the performance in the online WISCAT test. Last but not the
least, it is my hope that this research study contributes to the larger literature on
mathematics anxiety among pre-service teachers and encourages teacher education
programs to be more responsive to the mathematics anxiety and consider this as a
critical aspect in the progress of prospective teachers.

58

59
References Alexander, L., & Martray, C. (1989). The development of an abbreviated version of the Mathematics Anxiety Rating Scale. Measurement and Evaluation in Counseling and Development, 22(3), 143-159 Arem, C. A. (1993). Conquering Math Anxiety. Pacific Grove, CA: Brooks/Cole. Ashcraft, M. H., & Faust, M. W. (1994). Mathematics anxiety and mental arithmetic performance: An exploratory investigation. Cognition and Emotion, 8(2), 97-125. Ashcraft, M. H., Kirk, E. P. & Hopko, D. (1998). On the cognitive consequences of mathematics anxiety. In C. Donlan (Ed.), The Development of Mathematical Skills, (pp. 175-196). Hove, UK: Psychology Press Ashcraft, M. H., & Kirk, E. P. (2001). The relationships among working memory, math anxiety, and performance. Journal of Experimental Psychology – General, 130(2), 224-237. Ashcraft, M. H., & Ridley, K. S. (2005). Math anxiety and its cognitive consequences: A tutorial review. In J. Campbell (Ed.), Handbook of Mathematical Cognition (pp. 315-327). New York: Psychology Press. Bai, H, Wang, L., Pan, W., & Frey, M (2009). Measuring mathematics anxiety: Psychometric analysis of a bidimensional affective scale. Journal of Instructional Psychology, 36(3), 185-193. Bai, H. (2011) Cross-validating a bidimensional mathematics anxiety scale. Assess-ment, 18(1) 115-122. Ball, S. (1995). Anxiety and test performance. In C. Spielberger, & P. Vagg (Eds.), Test anxiety: Theory, assessment and treatment (pp. 107-116). Washington, DC: Taylor & Francis. Baloğlu, M., & Zelhart, P. F. (2007). Psychometric properties of the Revised Mathe-matics Anxiety Rating Scale. The Psychological Record, 57(4), 593-611. Bessant, K. C. (1995). Factors associated with types of mathematics anxiety in college students. Journal for Research in Mathematics Education, 26(4), 327-345. Betz, N. E. (1978). Prevalence, distribution, and correlates of math anxiety in college students. Journal of Counseling Psychology, 25(5), 441-448. Brady, P., & Bowd, A. (2005). Mathematics anxiety, prior experiences and confidence to teach mathematics among pre-service education student. Teacher and Teaching: Theory and Practice, 11(1), 37-46.

60
Bryant, G. M. M. (2009). A study of pre-service teachers: Is it really mathematics anxiety? PhD Thesis, University of Massachusetts, Amherst. Retrieved, July 23, 2001 from http://scholarworks.umass.edu/open_access_dissertations/43 Bursal, M., & Paznokas, L. (2006). Mathematics anxiety and pre-service elementary teachers’ confidence to teach mathematics and science. School Science and Mathe-matics, 106(4), 173-179. Bush, L. (1981). Some thoughts for teachers on mathematics anxiety. Arithmetic Teacher, 29(4), 37-39. Bush, W. S. (1989). Mathematics anxiety in upper elementary school teachers. School Science and Mathematics, 89(6), 499-509. Çatlioğlu, H., Birgin, O., Coştu, S., & Gürbüz (2009). The level of mathematics anxiety among pre-service elementary school teachers. Procedia Social and Behavio-ral Sciences, 1(1), 1578-1581.
Cemen, P. B. (19871. The nature of mathematics anxiety. (Report No. SE 048 689). Stillwater, OK: Oklahoma State University. (ERIC Document Reproduction Service No. ED 287 729)
Dew, K., Galassi, J. P., & Galassi. M. D. (1983). Mathematics anxiety: Some basic issues. Journal of Counseling Psychology, 30(3), 443-446. Dew, K., Galassi, J. P., & Galassi. M. D. (1984). Math anxiety: Relation with situational test anxiety, performance, physiological arousal, and math avoidance behavior. Journal of Counseling Psychology, 31(4), 580-583.
Dossel, S. (1993). Maths anxiety. Australian Mathematics Teacher, 49(11), 4-8.
Ertekin, E., Dilmac, B., & Yazici, E. (2009). The relationship between mathematics anxiety and learning styles of preserves mathematics teachers. Social Behavior and Personality, 37(9), 1187-1195. Fennema, E., & Sherman, J. (1976). Fennema-Sherman Mathematics Attitude Scales: Instruments designed to measure attitudes toward the learning of mathematics by males and females. Journal for Research in Mathematics Education, 7(5), 324-326. Fernandes, D. (1995). Analyzing four pre-service teachers’ knowledge and thoughts through their biographical histories, Proceedings of the Nineteenth International Conference for the Psychology of Mathematics Education, Vol. II, Universidade Federal de Pernambuco, Recife, Brazil, pp. 162-169. Gresham, G. (2008). Mathematics anxiety and mathematics teacher efficacy in ele-mentary pre-service teachers, Teaching Education, 19(3), 171–184.
Gutbezahl, J. (1995). How negative expectancies and attitudes undermine females' math confidence and performance: A review of the literature. Amherst, MA:

61
University of Massachusetts. (ERIC Document Reproduction Service No. ED 380 279)
Hackworth, R. D. (1985). Math Anxiety Reduction. Clearwater, FL: H&H Publishing. Hadfield, O. D, & McNeil, K. (1994). The relationship between Myers-Briggs personality type and mathematics anxiety among preservice elementary teachers. Journal of Instructional Psychology, 21(4), 375-384. Hembree, R. (1990). The nature, effects, and relief of mathematics anxiety. Journal for research in mathematics education, 21(1), 33-46. Hopko, D. R. (2003). Confirmatory factor analysis of the Math Anxiety Rating scale- Revised. Educational and Psychological Measurement, 63(2), 336-351. Hopko, D. R, Mahadevan, R., Bare, R. L., & Hunt, M. K. (2003). The abbreviated math anxiety scale (AMAS). Assessment, 10(2), 178-182. Jackson, C., & Leffingwell, R. (1999). The role of instructors in creating math anxiety in students from kindergarten through college. The Mathematics Teacher, 92(7), 583-586. Karp, K. (1991). Elementary school teachers’ attitudes towards mathematics: The impact on students’ autonomous learning skills. School Science and Mathematics, 91(6), 265–270. Kelly, W., & Tomhave, W. (1985). A study of math anxiety and math avoidance in pre-service elementary teachers. Arithmetic Teacher, 32, 51–53. Levine, G. (1993). Prior mathematics history, anticipated mathematics teaching style, and anxiety for teaching mathematics among pre-service elementary school teachers. Paper presented at the Annual Meeting of the International Group for Psychology of Mathematics Education, North American Chapter (ERIC Document Reproduction Service No. ED373972).
Levine, G. (1995). Closing the gender gap: Focus on mathematics anxiety. Con-temporary Education, 67(1), 42-45.
Liebert, R., & Morris, L. (1967). Cognitive and emotional components of test anxiety: A distinction and some initial data. Psychological Reports, 20, 975-978. Malinsky, M., Ross, A., Pannells, T., & McJunkin, M. (2006). Math anxiety in pre-service elementary school teachers. Education, 127(2), 274-279 Mandler, G., & Sarason, I. (1952). A study of anxiety and learning. Journal of Abnormal and Social Psychology, 47, 166-173. Martinez, J. G. R. (1987). Preventing math anxiety: A prescription. Academic Therapy, 23, 117–125

62
Mathison, M. A. (1977). Curricular interventions and programming innovations for the reduction of mathematics anxiety. Paper presented at the Annual Convention of American Psychological Association, San Francisco, CA, 26-30 August.
Miller, L. D., & Mitchell, C. E. (1994). Mathematics anxiety and alternative methods of evaluation. Journal of Instructional Psychology, 21(4), 353-358.
Morris, L. W., & Liebert, R. M. Relationship of cognitive and emotional components of test anxiety to physiological arousal and academic performance. Journal of Consulting and Clinical Psychology, 1970, 35, 332-337. Pérez-Tyteca, P., Castro, E., Segovia, I., Castro, E., Fernández, F., & Cano, F. (2009). El papel de la ansiedad matemática en el paso de la educación secundaria a la educación universitaria. PNA, 4(1), 23-35. Plake, B. S., & Parker, C. S. (1982). The development and validation of a revised version of the Mathematics Anxiety Rating Scale. Educational and Psychological Measurement, 42(), 551-557. Preis, C., & Biggs, B. T. (2001). Can Instructors Help Learners Overcome Math Anxiety? ATEA Journal, 28(4), 6-10. Raymond, A. M. (1997). Inconsistency between a beginning elementary school teacher's mathematics beliefs and teaching practice. Journal for Research in Mathematics Education, 28(5), 550-577. Richardson, F. C., & Suinn, R. M. (1972). The mathematics anxiety rating scales: Psychometric data. Journal of Counselling Psychology. 19(6) 551-554. Rossnan, S. (2006). Overcoming math anxiety? Mathitudes, 1(1), 1-4. Sarason, I. G. (1958). Interrelationships among individual difference variables, be-havior in psychotherapy, and verbal conditioning. Journal of Abnormal and Social Psychology, 56(3), 339-344. Sarason, I. G., & Ganzor, V. J. (1962). Anxiety, reinforcement, and experimental instruction in a free verbal situation. Journal of Abnormal and Social Psychology, 65(5), 300-307. Sarason, S. B., & Mandler, G. (1952) Some correlates of test anxiety. Journal of Abnormal and Social Psychology, 47(4), 810-817. Samson, I. G., Pederson, A. M., & Nyman, B. (1968). Test anxiety and the observation of models. Journal of Personality, 36(3), 493-511. Sieber, J. E., O’Neil, H. F., & Tobias, S. (1977). Anxiety, Learning, and Instruction. Hillsdale, NJ: Lawrence Erlbaum Associates Sloan, T. R. (2010). A quantitative and qualitative study of math anxiety among pre-service teachers. The Educational Forum, 74(3), 242–256

63
Smith, J. (1996). Efficacy and teaching mathematics by telling: A challenge for reform. Journal for Research in Mathematics Education, 27(4), 387-402. Spielberger, C. (1980). The Test Anxiety Inventory. Palo Alto, CA: Consulting Psychologists Press. Spielberger, C. D., Gonzalez, H. P., Taylor, C. J., Algaze, B., & Anton, W. D. (1978) Examination stress and test anxiety. In C. D. Spielberger & I. G. Sarason (Eds.), Stress and Anxiety (Vol.5, pp. 167-191). New York, NY: Hemisphere/Wiley Spielberger, C., & Vagg, P. (Eds.). (1995). Test Anxiety: Theory, Assessment and Treatment. Washington, D.C.: Tyalor & Francis. Suinn, R. M, & Edwards, R. W. (1982). The measurement of mathematics anxiety: The mathematics anxiety rating scale for adolescents—MARS-A. Journal of Clinical Psychology, 38(3), 576-577. Suinn, R. M., Taylor, S., & Edwards, R. W. (1988). Suinn mathematics anxiety rating scale for elementary school students (MARS-E): Psychometric and normative data. Educational and Psychological Measurement, 48(4), 979-986. Suinn, R. M., & Winston, E. H. (2003). The mathematics anxiety rating scales, a brief version: Psychometric data. Psychological Reports, 92(1), 167-173. Swars, S. L., Daane, C. J., & Giesen, J. (2006). Mathematics anxiety and mathemat-ics teacher efficacy: What is the relationship in elementary pre-service teachers? School Science and Mathematics, 106(7), 306-315. Swetman, B., Munday, R., & Windham, R. (1993). Math anxious teachers: Breaking the cycle. College Student Journal, 22(4), 421-427.
Tobias, S. (1981). Stress in the math classroom. Learning, 9(6), 34-38.
Tobias, S. (1990). Math anxiety: An update. National Academic Advising Association Journal, 10(1), 47-50.
Trujillo, K. M., & Hadfield, O. D. (1999). Tracing the roots of mathematics anxiety through in-depth interviews with pre-service elementary teachers. College Student Journal, 33(2), 219-232. Uusimaki, L., & Nason, R. (2004). Causes underlying pre-service teachers’ negative beliefs and anxieties about mathematics. Proceedings of the 28th Conference of the International Group for the Psychology of Mathematics Education, Bergen, Norway, vol. 4 (pp. 369-376). Vinson, B. (2001). A comparison of pre-service teachers mathematics anxiety before and after a methods class emphasizing manipulative. Early Childhood Education Journal, 29(2), 89-94.

64
Wigfield, A., & Meece, J. L. (1988). Math anxiety in elementary and secondary school students. Journal of Educational Psychology, 80(2), 210-216. Williams, W. V. (1988, February). Answers to questions about mathematics anxiety. School Science and Mathematics, 88(2), 95-104. Wood, E. (1988). Math anxiety and elementary teachers: What does research tell us? For the Learning of Mathematics, 8(1), 8-13. Zeidner, M. (1998). Test Anxiety: The State of the Art. New York, NY: Plenum Press.

65
Appendix A Questionnaire
for the purpose of research on math anxiety of beginning PABO-students
Math anxiety is a state of a sinking feeling, uncertainty and despair at doing arith-metic and mathematics. I investigate in my research project in the Master of Mathe-matics and Science Education at the UvA to what extent math anxiety is present amongst beginning PABO-students and how it develops further. For the purpose of collecting research data I have created a short questionnaire, in which you may also interpret the term ‘mathematics’ in the more narrow sense of ‘arithmetic’. I will maintain the confidentiality of the provided information and I will use the informa-tion only for research purposes; I will not publicly discuss data of individuals. I hope and have faith in your serious participation. I thank you in advance for filling out the questionnaire. Reshmi Pradeep Student Master of Mathematics and Science Education, UvA Personal data Name: ___________________________________ Student id: __________________ Age: ____ year Gender: male / female Highest prior education:
� HAVO � VWO � MBO � different, namely: _____________________
In case of HAVO/VWO education, the chosen mathematics programme:
� mathematics A � mathematics B � mathematics C � mathematics D � different, namely: _____________________
self-analysis of math anxiety: On a scale from 1 to 10 (1 = no anxiety at all; 10 = extreme anxiety/phobia) I rank my own math anxiety as follows (cicle the mark that is the best indicator your judgment):
1 2 3 4 5 6 7 8 9 10 no anxiety at all extreme anxiety

66

67
Appendix B Original MAS
The following are math anxiety statements, about which your opinion is sought. For
each statement, please circle the response that most closely indicates your extent of
agreement or disagreement with the statement.
1. It doesn’t bother me at all to take more math classes.
Strongly Agree Agree neutral Disagree Strongly Disagree 2. I have usually been at ease during math tests.
Strongly Agree Agree neutral Disagree Strongly Disagree
3. I have usually been at ease during math courses.
Strongly Agree Agree neutral Disagree Strongly Disagree 4. I usually don’t worry about my ability to solve math problems.
Strongly Agree Agree neutral Disagree Strongly Disagree 5. I almost never get uptight during math tests.
Strongly Agree Agree neutral Disagree Strongly Disagree 6. I get really uptight during math tests.
Strongly Agree Agree neutral Disagree Strongly Disagree 7. I get a sinking feeling when I think of trying hard math problems.
Strongly Agree Agree neutral Disagree Strongly Disagree 8. My mind goes blank and I am unable to think clearly when working mathematics.
Strongly Agree Agree neutral Disagree Strongly Disagree 9. Mathematics makes me feel nervous and uncomfortable.
Strongly Agree Agree neutral Disagree Strongly Disagree 10. Mathematics makes me feel uneasy and confused.
Strongly Agree Agree neutral Disagree Strongly Disagree

68

69
Appendix C Original AMAS
The following are math anxiety statements, about which your opinion is sought. For
each statement, please circle the response that most closely indicates your extent of
agreement or disagreement with the statement.
1. Having to use the tables in the back of a math book. Not at all a little bit a bit fairly much very much. 2. Thinking about an upcoming math test 1 day before. Not at all a little bit a bit fairly much very much. 3. Watching a teacher work an algebraic equation on the blackboard. Not at all a little bit a bit fairly much very much. 4. Taking an examination in a math course. Not at all a little bit a bit fairly much very much. 5. Being given a homework assignment of many difficult problems that is due the
next class meeting.
Not at all a little bit a bit fairly much very much. 6. Listening to a lecture in math class. Not at all a little bit a bit fairly much very much. 7. Listening to another student explain a math formula. Not at all a little bit a bit fairly much very much. 8. Being given a “pop” quiz in math class. Not at all a little bit a bit fairly much very much. 9. Starting a new chapter in a math book. Not at all a little bit a bit fairly much very much.

70

71
Appendix D Original Test Anxiety Inventory
The following are test anxiety statements about which your opinion is sought. For
each statement, please circle the response that most closely indicates your extent of
agreement or disagreement with the statement.
1. I feel confident and relaxed while taking tests.
Almost Never Sometimes Often Almost Always 2. While taking final examinations I have an uneasy upset feeling.
Almost Never Sometimes Often Almost Always 3. Thinking about the grade I may get in a course interferes with my work on tests.
Almost Never Sometimes Often Almost Always 4. I freeze up on final exams.
Almost Never Sometimes Often Almost Always 5. During exams I find myself wondering whether I will ever get through school.
Almost Never Sometimes Often Almost Always 6. The harder I work at taking a test, the more confused I get.
Almost Never Sometimes Often Almost Always 7. Thoughts of doing poorly interfere with my concentration on tests.
Almost Never Sometimes Often Almost Always 8. I feel very jittery when taking an important test.
Almost Never Sometimes Often Almost Always 9. Even when I am well prepared for a test, I feel very anxious about it.
Almost Never Sometimes Often Almost Always 10. I start feeling very uneasy just before getting a test paper back.
Almost Never Sometimes Often Almost Always

72
11. During tests I feel very tense.
Almost Never Sometimes Often Almost Always 12. I wish examinations did not bother me so much.
Almost Never Sometimes Often Almost Always 13. During important examines I am so tense that my stomach gets upset.
Almost Never Sometimes Often Almost Always 14. I seem to defeat myself while working on important test.
Almost Never Sometimes Often Almost Always 15. I feel very panicky when I take an important test.
Almost Never Sometimes Often Almost Always 16. If I were to take an important exam, I would worry a great deal about taking it.
Almost Never Sometimes Often Almost Always 17. During tests I find myself thinking about the consequences of failing.
Almost Never Sometimes Often Almost Always 18. I feel my heart beating very fast during important tests.
Almost Never Sometimes Often Almost Always 19. As soon as an exam is over I try to stop worrying about it, but I just cannot.
Almost Never Sometimes Often Almost Always 20. During a course examination I get so nervous that I forget facts I really know.
Almost Never Sometimes Often Almost Always

73
Appendix E Dutch version of the Math anxiety tests
Vragenlijst t.b.v. onderzoek naar wiskundeangst bij beginnende PABO-studenten Wiskundeangst is een gevoelstoestand van beklemming, onzekerheid en vertwijfeling bij rekenen en wiskunde. Ik onderzoek in mijn afstudeerproject binnen de Master of Mathematics and Science Education aan de UvA in hoeverre wiskundeangst bij beginnende PABO-studenten aanwezig is en hoe het zich verder ontwikkelt. Om onderzoeksgegevens te verzamelen heb ik een korte vragenlijst opgesteld, waarin het woord ‘wiskunde’ ook in engere zin als ‘rekenen’ geïnterpreteerd mag worden. Ik zal de verstrekte informatie vertrouwelijk en alleen voor onderzoeksdoeleinden gebruiken; individuele gegevens worden niet publiekelijk besproken. Ik hoop en vertrouw op serieuze medewerking. Bij voorbaat dank voor het invullen van de vragenlijst. Reshmi Pradeep Student Master of Mathematics and Science Education, UvA Persoonlijke gegevens Naam: ___________________________________ Studentnummer: __________________ Leeftijd: ____ jaar Geslacht: man / vrouw Hoogste vooropleiding:
� HAVO � VWO � MBO � anders, namelijk: _____________________
Bij HAVO/VWO vooropleiding, het gekozen wiskundeprogramma:
� wiskunde A � wiskunde B � wiskunde C � wiskunde D � anders, namelijk: _____________________
Zelfoordeel over wiskundeangst: Op een schaal van 1 tot 10 (1 = helemaal geen angst; 10 = extreme angst/fobie) rangschik ik mijn eigen wiskundeangst als volgt (omcirkel het cijfer dat je oordeel het best aangeeft):
1 2 3 4 5 6 7 8 9 10 helemaal geen angst extreme angst

74
Vragenlijst over wiskundeangst Onderstaande vragenlijst bestaat uit 19 vragen, opgedeeld in 2 deellijsten. De vragen zijn zodanig opgesteld dat de beantwoording ervan weinig tijd vergt: je hoeft alleen maar een vakje aan te kruisen dat je mening het best beschrijft. Onderdeel 1: Meningen over wiskundeangst. Hieronder staan 10 uitspraken over wiskundeangst. Plaats voor elke uitspraak een kruisje bij de aanduiding die je mening het best beschrijft (neutraal betekent hierbij dat je het er noch mee eens, noch mee oneens bent of helemaal geen mening hebt). 1. Ik heb er helemaal geen problemen mee als ik meer wiskunde zou krijgen.
_____ _____ _____ _____ _____ zeer mee eens mee eens neutraal mee oneens zeer mee oneens
2. Ik heb me meestal op mijn gemak gevoeld tijdens wiskundeproefwerken.
_____ _____ _____ _____ _____ zeer mee eens mee eens neutraal mee oneens zeer mee oneens
3. Ik heb me meestal op mijn gemak gevoeld tijdens wiskundelessen.
_____ _____ _____ _____ _____ zeer mee eens mee eens neutraal mee oneens zeer mee oneens
4. Ik maak me meestal geen zorgen dat ik wiskundeopgaven kan oplossen.
_____ _____ _____ _____ _____ zeer mee eens mee eens neutraal mee oneens zeer mee oneens
5. Ik geraak bijna nooit in stress tijdens wiskundeproefwerken.
_____ _____ _____ _____ _____ zeer mee eens mee eens neutraal Mee oneens zeer mee oneens
6. Ik kan echt de zenuwen krijgen tijdens wiskundeproefwerken.
_____ _____ _____ _____ _____ zeer mee eens mee eens neutraal mee oneens zeer mee oneens
7. Ik krijg een beklemd gevoel als ik denk aan het maken van moeilijke
wiskundesommen. _____ _____ _____ _____ _____
zeer mee eens mee eens neutraal mee oneens zeer mee oneens 8. Ik heb last van black-outs en kan niet helder denken tijdens wiskunde.
_____ _____ _____ _____ _____ zeer mee eens mee eens neutraal mee oneens zeer mee oneens

75
9. Bij wiskunde voel ik nerveus en ongemakkelijk.
_____ _____ _____ _____ _____ zeer mee eens mee eens neutraal mee oneens zeer mee oneens
10. Wiskunde bezorgt me een onbehagelijk en verward gevoel.
_____ _____ _____ _____ _____ zeer mee eens mee eens neutraal mee oneens zeer mee oneens
Onderdeel 2: Gevoelens van wiskundeangst. Hieronder staan 9 activiteiten voor of tijdens wiskundelessen. Plaats voor elke activiteit een kruisje bij de aanduiding die je mate van angstgevoel het best beschrijft. 11. Gebruik moeten maken van de tabellen achterin een wiskundeboek.
_____ _____ _____ _____ _____ helemaal niet een klein beetje een beetje tamelijk veel heel veel
12. Denken aan een wiskundeproefwerk dat de volgende dag afgenomen wordt.
_____ _____ _____ _____ _____ helemaal niet een klein beetje een beetje tamelijk veel heel veel
13. Kijken naar een leraar die een wiskundige vergelijking uitwerkt op het
schoolbord. _____ _____ _____ _____ _____
helemaal niet een klein beetje een beetje tamelijk veel heel veel 14. Een wiskundeproefwerk maken.
_____ _____ _____ _____ _____ helemaal niet een klein beetje een beetje tamelijk veel heel veel
15. Huiswerk opgedragen krijgen dat uit veel moeilijke opdrachten bestaat en dat af
moet zijn voor de volgende les. _____ _____ _____ _____ _____
helemaal niet een klein beetje een beetje tamelijk veel heel veel 16. Luisteren naar klassikale uitleg/bespreking door de wiskundedocent.
_____ _____ _____ _____ _____ helemaal niet een klein beetje een beetje tamelijk veel heel veel
17. Luisteren naar een medeleerling die een wiskundeformule uitlegt.
_____ _____ _____ _____ _____

76
helemaal niet een klein beetje een beetje tamelijk veel heel veel 18. Een beurt krijgen tijdens de wiskundeles.
_____ _____ _____ _____ _____ helemaal niet een klein beetje een beetje tamelijk veel heel veel
19. Beginnen met een nieuw hoofdstuk in het wiskundeboek.
_____ _____ _____ _____ _____ helemaal niet een klein beetje een beetje tamelijk veel heel veel
Nogmaals bedankt voor het invullen van de vragenlijst. Reshmi Pradeep

77
Appendix F Dutch version of the test anxiety test
Vragenlijst t.b.v. onderzoek naar toetsangst bij beginnende PABO-studenten
We spreken van toetsangst als een toetssituatie (bijvoorbeeld een proefwerk of examen) een spanning teweegbrengt die een negatieve invloed kan hebben op de toetsuitslag. Overmatige nervositeit tijdens de voorbereiding op een toets of tijdens de toets zelf is een sterke indicatie van toetsangst. Ik onderzoek in mijn afstudeerproject binnen de Master of Mathematics and Science Education aan de UvA in hoeverre toetsangst toetsangst bij beginnende PABO-studenten aanwezig is en mogelijk een negatieve invloed heeft op de uitslag van de WISCAT-pabo rekentoets. Om onderzoeksgegevens te verzamelen heb ik een korte vragenlijst opgesteld. Ik zal de verstrekte informatie vertrouwelijk en alleen voor onderzoeksdoeleinden gebruiken; individuele gegevens worden niet publiekelijk besproken. Ik hoop en vertrouw op serieuze medewerking. Bij voorbaat dank voor het invullen van de vragenlijst. Reshmi Pradeep Student Master of Mathematics and Science Education, UvA Persoonlijke gegevens Naam: ___________________________________ Studentnummer: __________________ Leeftijd: ____ jaar Geslacht: man / vrouw Zelfoordeel over toetsangst: Op een schaal van 1 tot 10 (1 = helemaal geen toetsangst; 10 = extreme toetsangst) rangschik ik mijn eigen toetsangst als volgt (omcirkel het cijfer dat je oordeel het best aangeeft):
1 2 3 4 5 6 7 8 9 10 helemaal geen toetsangst extreme toetsangst Vragenlijst over toetsangst Onderstaande vragenlijst bestaat uit 20 vragen. De vragen zijn zodanig opgesteld dat de beantwoording ervan weinig tijd vergt: je hoeft alleen maar een vakje aan te kruisen dat je mening het best beschrijft. 1. Ik ben zelfverzekerd en ontspannen als ik een proefwerk maak.
_____ _____ _____ _____ bijna nooit soms vaak bijna altijd
2. Tijdens een eindtoets voel ik me niet op mijn gemak en ben ik angstig.
_____ _____ _____ _____ bijna nooit soms vaak bijna altijd

78
3. Denken aan het cijfer dat ik kan voor een vak kan halen verstoort mijn prestatie in
toetsen. _____ _____ _____ _____ bijna nooit soms vaak bijna altijd
4. Ik raak verlamd van de zenuwen bij eindtoetsen.
_____ _____ _____ _____ bijna nooit soms vaak bijna altijd
5. Tijdens examens betrap ik mezelf er wel eens op dat ik me afvraag of ik ooit wel
zal slagen. _____ _____ _____ _____ bijna nooit soms vaak bijna altijd
6. Hoe harder ik werk voor een proefwerk, hoe meer ik in de war raak.
_____ _____ _____ _____ bijna nooit soms vaak bijna altijd
7. Gedachten aan een mogelijk slecht resultaat verstoren mijn concentratie tijdens
het maken van preofwerken. _____ _____ _____ _____ bijna nooit soms vaak bijna altijd
8. Ik krijg de kriebels van het deelnemen aan een belangrijk proefwerk.
_____ _____ _____ _____ bijna nooit soms vaak bijna altijd
9. Zelfs als ik goed voorbereid ben voor een toets voel ik me toch angstig.
_____ _____ _____ _____ bijna nooit soms vaak bijna altijd
10. Ik begin me niet op mijn gemak te voelen kort voordat ik een proefwerk terug
krijg. _____ _____ _____ _____ bijna nooit soms vaak bijna altijd
11. Tijdens proefwerken voel ik me heel gespannen.
_____ _____ _____ _____ bijna nooit soms vaak bijna altijd

79
12. Ik zou graag willen dat ik minder problemen zou hebben met het afleggen van examens. _____ _____ _____ _____ bijna nooit soms vaak bijna altijd
13. Tijdens belangrijke examens ben ik zo gespannen dat mijn maag van streek
geraakt. _____ _____ _____ _____ bijna nooit soms vaak bijna altijd
14. Ik lijk mezelf wel in de weg te zitten bij het maken van een belangrijk proefwerk
_____ _____ _____ _____ bijna nooit soms vaak bijna altijd
15. Ik ben paniekerig als ik een belangrijk proefwerk maak.
_____ _____ _____ _____ bijna nooit soms vaak bijna altijd
16. Als ik een belangrijk examen moet afleggen, dan heb ik daar vooraf al veel
zorgen over. _____ _____ _____ _____ bijna nooit soms vaak bijna altijd
17. Tijdens proefwerken betrap ik mezelf er wel eens op dat ik aan de gevolgen van
een slecht resultaat denk. _____ _____ _____ _____ bijna nooit soms vaak bijna altijd
18. Ik voel mijn hart in de keel kloppen tijdens belangrijke proefwerken.
_____ _____ _____ _____ bijna nooit soms vaak bijna altijd
19. Zodra een examen afgelopen is probeer ik er niet meer over te piekeren, maar dat
lukt me niet. _____ _____ _____ _____ bijna nooit soms vaak bijna altijd
20. Tijdens een proefwerk wordt ik zo nerveus dat ik dingen vergeet die ik wel weet.
_____ _____ _____ _____ bijna nooit soms vaak bijna altijd
Nogmaals bedankt voor het invullen van de vragenlijst, Reshmi Pradeep

80

81
Appendix G
Workshop I: PowerPoint Slides and Handout

82

83

84

85

86

87

88

89

90

91

92

93
Handout for the student teachers
1. What is Math Anxiety?
Math anxiety is an irrational fear of mathematics that occurs in response to
situations involving mathematical tasks and can create a negative attitude towards
mathematics. It is described as a feeling of uncertainty of not being able to do well in
mathematics or with numbers.
2. How does Math Anxiety develop?
� Negative experience in classrooms
� Teachers imposing personal views
� Exhibiting gender bias
� Uncaring attitude
� Embarrassing in front of peers
� Teaching methodology
� Different learning styles not considered
� Quality of instruction
� Lack of understanding of the subject
� Memorizing mathematical concepts
� Timed or online tests
� Math anxiety in teachers
3. Teaching techniques that leads to Math Anxiety
� Assigning the same work for all
� Lecturing
� Following the textbook problem by problem
� Assigning written work everyday
� Insisting on only one way to solve a problem
� Assigning mathematics homework as punishment for misbehaving
� Teaching mathematics as only rules and formulas

94
4. What should you look for during your teaching sessions?
Symptoms seen in math anxious students are:
� Afraid to answer questions in class
� Afraid to ask for help
� Avoid math and any math related situations
� Struggle to pay attention in the class
� Extremely uncomfortable in the class.
The symptoms differ from one student to the other and can be seen or found in both
genders. Some students suffering from Math Anxiety are surprisingly hard workers
in the classroom who study regularly and always finish their homework but still lack
the ability to show what they know because of math anxiety. In this same category are
students who are not nervous or anxious but have made themselves incapable of
paying attention because they believe that they will never understand math. These
students then become restless because they have no intention of learning math. As a
teacher, one must understand that these are symptoms when the students are actually
struggling with their confidence in the math classroom.
Assignment for the next workshop
1. Observe for any symptoms of math anxiety during your one-week of teaching
session and write then down (if any) on a paper for a discussion.
2. Think of the instructional strategies you may adopt in order to deal with pupils
with math anxiety in your classrooms.

95
Appendix H
Workshop II: PowerPoint Slides

96
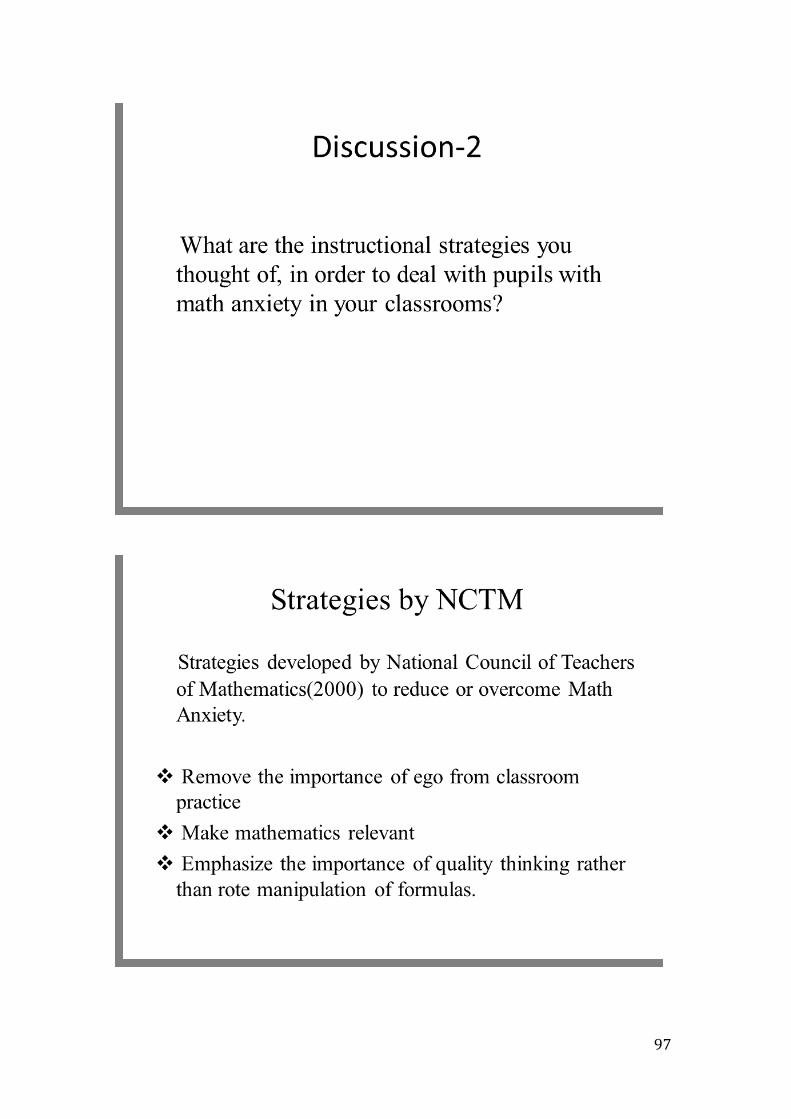
97

98

99

100