a study of loading time effect in oedometer test - iasem · a study of loading time effect in...
TRANSCRIPT

A Study of Loading Time Effect in Oedometer Test
*Sanchari Halder1, Ji-Seung Park2 and Myoung-Soo Won3
1), 2), 3) Department of Civil Engineering, Kunsan National University, Gunsan, South
Korea 1)
[email protected], and 3)
ABSTRACT In this study, the effect of loading time on clayey soil has been investigated through oedometer test considering double and single drainage. The test has been conducted for six times with loading time span of 12, 24 and 72 hours. Application of consolidation loads has been varied from 9.8 kPa to 628 kPa with increment ratio of 1:2. The effect of the loading time for 12, 24 and 72 hours on the e-log p curves was negligible for both single drainage and double drainage. The e-log p behaviours of double drainage and single drainage were similar. However, the void ratio in the case of double drainage was little smaller than single drainage because the instant settlement for double drainage was larger than single drainage. Although, consolidation co-efficient Cv and secondary compression index Cα both exhibited the considerable effect of different loading time span due to clayey soil’s time dependent characteristics. 1. INTRODUCTION Soil structure is made of basic elements called grains. When subjected to mechanical loading, rearrangement of the grain structure occurs which creates irreversible volumetric strain (Hattab and Hicher 1995). Laboratory tests and field observations reported by (Taylor 1942) clearly indicated the effect of time on the compressibility of clays. The oedometer test simulations indicate good agreement with
stress-strain and strain-log time test results during loading (Perrone 1998). Few researchers have addressed the effect of different loading time on clayey soil structure. This paper is an overview of a preliminary attempt to analyse the effect of varying loading time through oedometer tests.
1 Graduate Student
2 Graduate Student
3 Assistant Professor

2.1. TEST EQUIPMENT The tests have been carried out by standard incremental loading type oedometer with computer control and logging facilities, Fig.1 and 2. The 6 cm internal diameter brass oedometer ring used in present study was fitted with loading equipment for measuring the vertical deformation of the soil sample. To avoid side friction, the cell apparatuses has been coated well with grease. The load on the specimen has been applied through a lever arm, and compression has been measured by the data logger. The specimen has been kept submerged in water during the test.
2.2. SOIL SAMPLE The basic properties of the samples used in oedometer tests have been shown in Table 1. The soil has been acquired from Sayemangeum area of South Korea using 100 mm dia tube sampler. The soil has been determined as soft clay with lower sand proportion. The soil samples have been kept under water for 24 hours, before starting the oedometer tests.
Fig.1: Schematic diagram of an oedometer, Das (2009)
Fig. 2: Oedometer cell assembly
Liquid limit, LL (%) 41
Plastic Limit (%) 24
Plasticity index, PI 17
Specific Gravity, Gs 2.67
USCS Class CL, Clay
Table 1: Physical Properties of soil sample.
Magnetic
Sensor
Consolidation
Cell
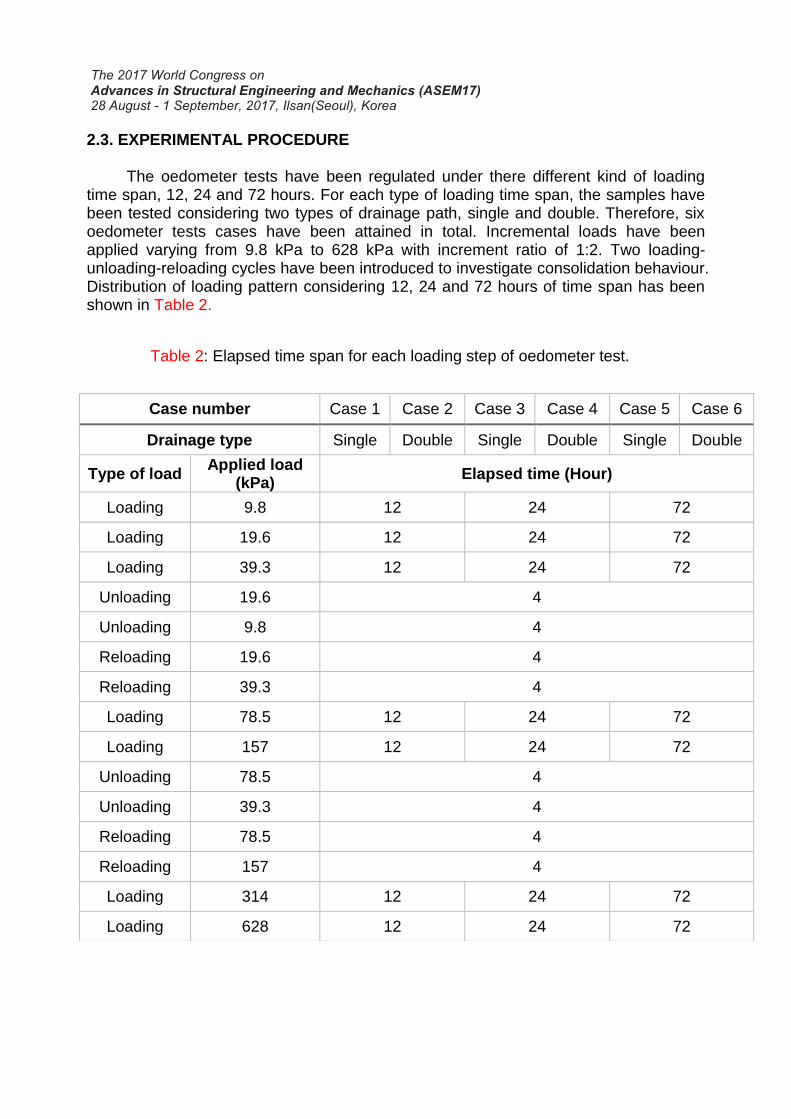
2.3. EXPERIMENTAL PROCEDURE The oedometer tests have been regulated under there different kind of loading time span, 12, 24 and 72 hours. For each type of loading time span, the samples have been tested considering two types of drainage path, single and double. Therefore, six oedometer tests cases have been attained in total. Incremental loads have been applied varying from 9.8 kPa to 628 kPa with increment ratio of 1:2. Two loading-unloading-reloading cycles have been introduced to investigate consolidation behaviour. Distribution of loading pattern considering 12, 24 and 72 hours of time span has been shown in Table 2.
Case number Case 1 Case 2 Case 3 Case 4 Case 5 Case 6
Drainage type Single Double Single Double Single Double
Type of load Applied load
(kPa) Elapsed time (Hour)
Loading 9.8 12 24 72
Loading 19.6 12 24 72
Loading 39.3 12 24 72
Unloading 19.6 4
Unloading 9.8 4
Reloading 19.6 4
Reloading 39.3 4
Loading 78.5 12 24 72
Loading 157 12 24 72
Unloading 78.5 4
Unloading 39.3 4
Reloading 78.5 4
Reloading 157 4
Loading 314 12 24 72
Loading 628 12 24 72
Table 2: Elapsed time span for each loading step of oedometer test.

3.1. EXPERIMENTAL RESULTS (DEFORMATION READINGS BY DATA LOGGER) The test data highlighted slightly additional deformation for samples with 72 hours loading time span while comparing with 12 hours and 24 hours loading time span. Samples with double drainage path exhibited greater instant settlement than single drainage samples, Fig. 4, 5 and 6.
, Fig. 7 and 8 illustrate percent cumulative deformation for increasing load and time in a three-dimensional plot. All of the six oedometer test cases showed about 19% to 20% of instant settlement for first loading step of 9.8 kPa.
Fig. 7: Cumulative deformation (%) for single drainage.
Fig. 8: Cumulative deformation (%) for double drainage.
Analysis of deformation readings demonstrated no significant influence for different loading time span of 12, 24 and 72 hours.
Fig. 4: Deformation for 12 hours time span.
Fig. 5: Deformation for 24 hours time span.
Fig. 6: Deformation for 72 hours time span.

3.2. LOADING TIME EFFECT ON VOID RATIO, e
Samples regulated under 72 hours loading time span exhibited lower void ratio compared to 12 and 24 hours loading time, Fig. 9 and 10.
Fig. 9: Void ratio,e vs load(log) for single drainage.
Fig. 10: Void ratio,e vs load(log) for double drainage.
3.3. LOADING TIME EFFECT ON COEFFICIENT OF CONSOLIDATION, Cv The coefficient of consolidation, Cv values showed reducing the rate to increasing loading time span for each loading step. Samples with 72 hours loading time had the lowest amount of Cv values, Fig. 11 and 12. Single drainage samples appeared to have bigger Cv values than double drainage. Cv curves representing single and double drainage respectively display certain undulation or rise and fall trend following loading-unloading-reloading cycles executed in oedometer test.
Fig. 11: Cv vs load (log) for single drainage.
Fig. 12: Cv vs load (log) for double drainage.

3.4. LOADING TIME EFFECT ON SECONDARY COMPRESSION INDEX, Cα The secondary compression as in long term consolidation index, Cα demonstrated similar behaviour like coefficient of consolidation, Cv. Loading time of 12 and 72 hours showed respectively highest and lowest magnitude of Cα values, Fig.13 and 14.
Fig. 13: Cα vs load (log) for single drainage.
Fig. 14: Cα vs load (log) for double drainage.
4. CONCLUSION This study was an observational attempt to focus on the consolidation behaviour of clayey soil for varying loading time. The evidence from this study point towards the idea that consolidation rates, co-efficient Cv and secondary compression index Cα get affected for increased loading time due to the time-dependent plastic adjustment of soil fabric. Nevertheless, loading time effect on void ratio was visibly insignificant for both single and double drainage. Future improved research on the current topic is required in order to validate this idea. 5. REFERENCE Hattab, M. and Hicher, P.Y. (1995), ‘‘Experimental study of the dilatancy in
overconsolidated clay.’’ Compression and Consolidation of Clayey Soils, Vol. 1,57-62.
Taylor, D.W., (1942), "Research on Consolidation of Clays," Department of Civil and Sanitary Engineering, Massachusetts Institute of Technology, Cambridge, Massachusetts, Serial 82.
Perrone, V.J. (1998), "One-Dimensional Computer Analysis of Simultaneous
Consolidation and Creep of Clay," Department of Civil Engineering, PhD Thesis, Virginia Polytechnic Institute and State University.
Das, B. M. (2009), “Principles of Geotechnical Engineering”, Cengage Learning, Stamford, USA, 7th Edition, pp. 294~364.