a study of dry microburst detection with airport ... study of dry microburst detection with airport...
TRANSCRIPT

DOT/FAA/NR-90/5
Project ReportATC-176
A Study of Dry Microburst Detection with
Airport Surveillance Radars
M. A. Meister
29 November 1990
Lincoln Laboratory MASSACHUSETTS INSTITUTE OF TECHNOLOGY
LEXINGTON, MASSACHUSETTS
Prepared for the Federal Aviation Administration, Washington, D.C. 20591
This document is available to the public through
the National Technical Information Service, Springfield, VA 22161

This document is disseminated under the sponsorship of the Department of Transportation in the interest of information exchange. The United States Government assumes no liability for its contents or use thereof.

TECHNICAL REPORT STANDARD TITLE PAGE
1. Report No. 2. Government Accession No. 3. Recipient's Catalog No.
ATC-176 DOTfFAAlNR-90f5
4. Title and Subtitle 5. Report Date
A Study of Dry Microburst Detection with Airport 29 November 1990
Surveillanee Radars 6. Performing Organization Code
7. Author(s) 8. Performing Organization Report No.
Mark A. Meister ATC-176
9. Performing Organization Name and Address 10 Work Unit No. (TRAIS)
Lincoln Laboratory, MITP.O. Box 73 11. Contract or Grant No.Lexington, MA 02173-9108 DTFA-OI-L-83-4-10579
12. Sponsoring Agency Name and Address 13. Type of Report and Penod CoveredDepartment of Transportation Projeet ReportFederal Aviation AdministrationSystems Research and Development Service 14. Sponsoring Agency CodeWashington, DC 20591
15. Supplementary Notes
This report is based on studies performed at Lincoln Laboratory. a eenter for research 0lwrated byMassachusetts Institute of Technology under Air Foree Contract FI9628-90-C-0002.
16. Abstract
This report evaluates the capability of Airport Surveillanee Radars (ASRs) for the detection of low altitude windshear associated with th{> outflows of dry microhursts. It describes results of simulations of dry microburst observationsby an ASR. These simulations incorporated weather and clutter data collected by the FL-2 pencil-beam Doppler weatherradar at Denver Stapleton Airport in 1988 and 1989 and clutter data collected by the FL-3 ASR-9 emulation radar atHuntsville, Alabama. The impact of signal strength. overhanging precipitation, and grouud e1utter on hoth observahilityand algorithmic performance are assessed.
Principal results of stmly are the following:
I. Overhanging precipitation and weak signal strength do not. by themselves. prohibit detection of dry outflows:however. oecurrence of false alarms and biases in velocity estimates indicate that improvements in the dual heamestimator that was evaluated would II{' required for reliahle detection of these events.
2. Ground cluttel' tends to obsclII'e dry outflows in regions where the differenee llt'tween median effective cluttel'reflectivity and weather rdleetiv'ity exceeds 17-20 dB.
A method for predi{,ting the percentage of missed microburst detections due to ground elutter is used to estimateoverall microburst detection probabilities for a "dry" environment such as Denver. Using measured clutter from an ex-perimental ASR in Huntsville. AL, overall mieroburst deteetion probability is 83 pen'ent. Using simulated Denverclutter, overall detection probability is 91 percent.
17. Key Words 18. Distribution Statement
airport surveillanee radar ground clutterDocument is available to the public through th{·
dry microlmrst detection system sensitivityNational Technical Information Service,
simulationSpringfield. VA 22161.
19. Security Classif. (of this report) 20. Security Classif. (of this page) 21. No. of Pages 22. Price
Unclassified Unclassified 78
FORM DOT F 1700.7 (8-72) Reproduction of completed page authorized

ABSTRACT
This report evaluates the capability of Airport Surveillance Radars (ASRs) for thedetection of low altitude wind shear associated with the outflows of dry microbursts. Itdescribes results of simulations of dry microburst observations by an ASR. Thesesimulations incorporated weather and clutter data collected by the FL-2 pencil-beamDoppler weather radar at Denver Stapleton Airport in 1988 and 1989 and clutter datacollected by the FL-3 ASR-9 emulation radar at Huntsville, Alabama. The impact ofsignal strength, overhanging precipitation, and ground clutter on both observability andalgorithmic performance are assessed.
Principal results of study are the following:
1. Overhanging precipitation and weak signal strength do not, by themselves,prohibit detection of dry outflows; however, occurrence of false alarms andbiases in velocity estimates indicate that improvements in the dual beamestimator that was evaluated would be required for reliable detection of theseevents.
2. Ground clutter tends to obscure dry outflows in regions where the differencebetween median effective clutter reflectivity and weather reflectivity exceeds17-20 dB.
A method for predicting the percentage of missed microburst detections due toground clutter is used to estimate overall microburst detection probabilities for a "dry"environment such as Denver. Using measured clutter from an experimental ASR inHuntsville, AL, overall microburst detection probability is 83 percent. Using simulatedDenver clutter, overall detection probability is 91 percent.
III
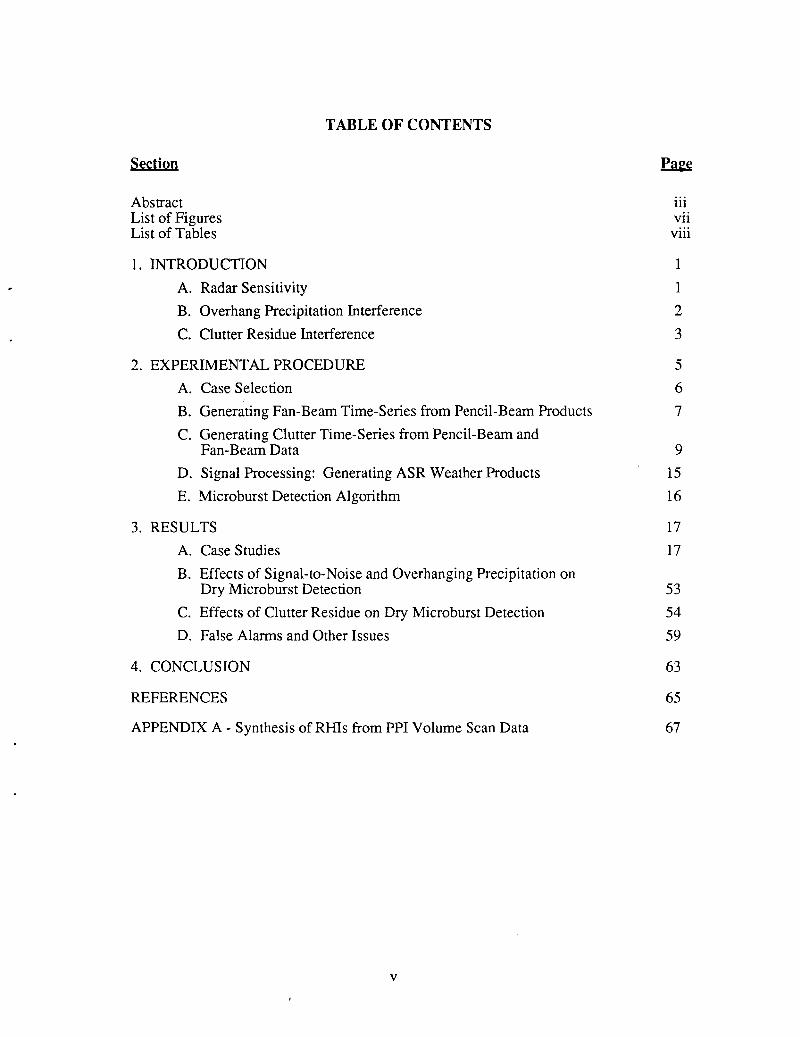
TABLE OF CONTENTS
Section Paee
Abstract 111
List of Figures viiList of Tables viii
1. INTRODUCTION 1
A. Radar Sensitivity 1
B. Overhang Precipitation Interference 2
C. Clutter Residue Interference 3
2. EXPER~ENTALPROCEDURE 5
A. Case Selection 6
B. Generating Fan-Beam Time-Series from Pencil-Beam Products 7
C. Generating Clutter Time-Series from Pencil-Beam andFan-Beam Data 9
D. Signal Processing: Generating ASR Weather Products 15
E. Microburst Detection Algorithm 16
3. RESULTS 17
A. Case Studies 17
B. Effects of Signal-to-Noise and Overhanging Precipitation onDry Microburst Detection 53
C. Effects of Clutter Residue on Dry Microburst Detection 54
D. False Alarms and Other Issues 59
4. CONCLUSION 63
REFERENCES 65
APPENDIX A - Synthesis ofRHIs from PPI Volume Scan Data 67
v

LIST OF FIGURES
Fhmre No.
1. Minimum and maximum detectable reflectivity versus range for anASR~ 2
2. Dry microburst simulation and processing block diagram 6
3. ASR-9 weather and clutter simulation block diagram 8
4. Median ground clutter intensity (ensembled over azimuth) versus range:a) from the ASR-8 at Stapleton Airport (from Weber, 1987)~ b) fromcoordinate-translated FL-2 data 12
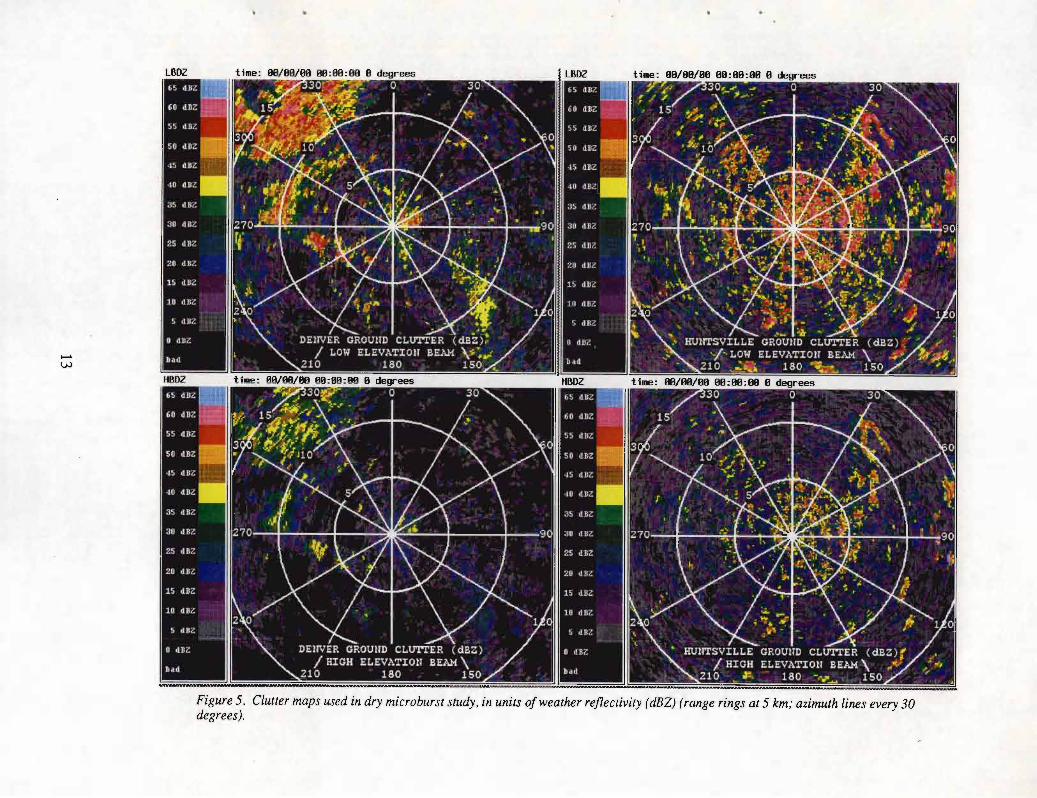
5. Clutter maps used in dry microburst study, in units of weather reflectivity(dBZ) 13
6. FL-2 pencil-beam reflectivity and radial velocity fields during 5 dBZ drymicroburst at 8 km, 316 degrees azimuth, at 20:41 (GMT), August 8, 1988in Denver 19
7. Vertical profile of 20:41 (GMT), August 8, 1988 dry microburst event 21
8. Simulated ASR reflectivity and velocity fields for 20:41 (GMT), August8, 1988 dry microburst event 23
9. Simulated clutter-contaminated ASR velocity fields for 20:41 (GMT),August 8, 1988 dry microburst event 25
10. FL-2 pencil-beam reflectivity and radial velocity fields during 15 dBZ drymicroburst at 6 km, 219 degrees azimuth at 23:07 (GMT), June 12, 1987in Denver 29
11. Vertical profile of 23:07 (GMT), June 12, 1987 dry microburst event 31
12. Simulated ASR velocity fields for June 12, 1987 dry microburst event 33
13. FL-2 pencil-beam reflectivity and radial velocity fields during 10 dBZ drymicroburst at 13 km, 265 degrees azimuth at 22:10 (GMT), June 10, 1988in Denver 35
14. Vertical profile of 22:10 (GMT) June 10, 1988 dry microburst event 37
15. Vertical profile of 22:10 (GMT) June 10, 1988 dry microburst event 41
16. Simulated ASR velocity fields for 22:10 (GMT) June 10, 1988 drymicroburst event 43
VB
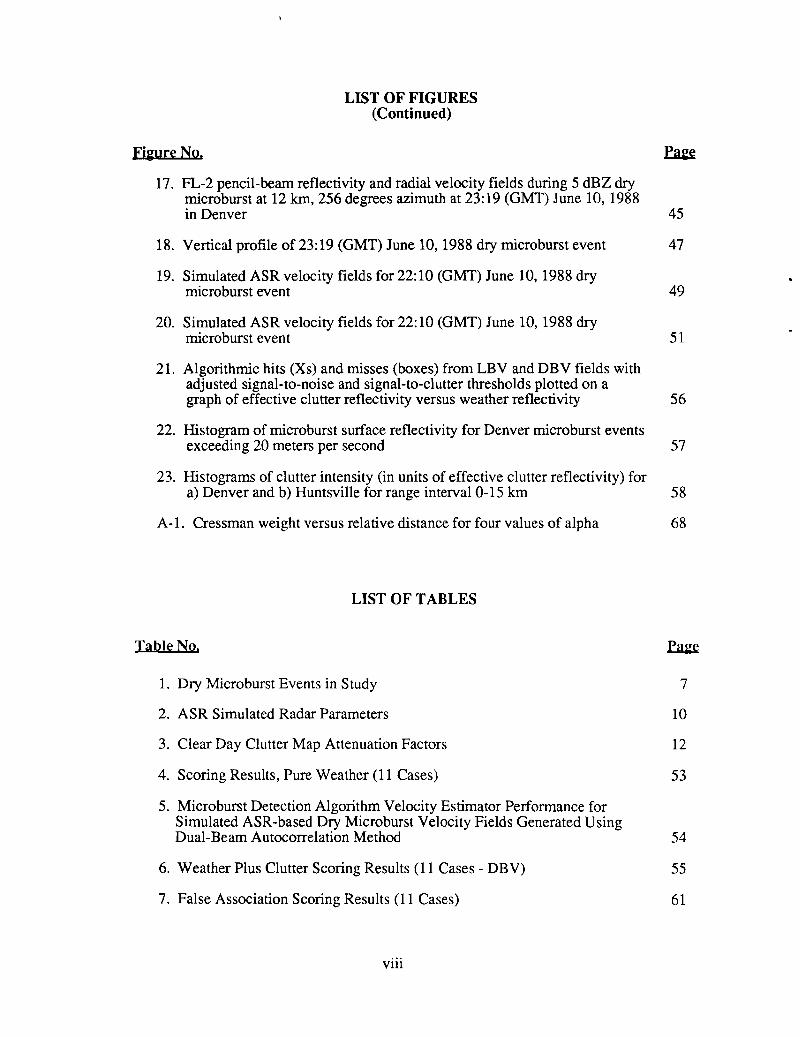
LIST OF FIGURES(Continued)
Fh:ureNo. ~
17. FL-2 pencil-beam reflectivity and radial velocity fields during 5 dBZ drymicroburst at 12 lan, 256 degrees azimuth at 23:19 (GMT) June 10, 1988in Denver 45
18. Vertical profile of 23:19 (GMT) June 10, 1988 dry microburst event 47
19. Simulated ASR velocity fields for 22:10 (GMT) June 10, 1988 drymicroburst event 49
20. Simulated ASR velocity fields for 22: 10 (GMT) June 10, 1988 drymicroburst event 51
21. Algorithmic hits (Xs) and misses (boxes) from LBV and DBV fields withadjusted signal-to-noise and signal-to-clutter thresholds plotted on agraph of effective clutter reflectivity versus weather reflectivity 56
22. Histogram of microburst surface reflectivity for Denver microburst eventsexceeding 20 meters per second 57
23. Histograms of clutter intensity (in units of effective clutter reflectivity) fora) Denver and b) Huntsville forrange interval 0-15 km 58
A-I. Cressman weight versus relative distance for four values of alpha 68
LIST OF TABLES
Table No. ~
1. Dry Microburst Events in Study 7
2. ASR Simulated Radar Parameters 10
3. Clear Day Clutter Map Attenuation Factors 12
4. Scoring Results, Pure Weather (11 Cases) 53
5. Microburst Detection Algorithm Velocity Estimator Performance forSimulated ASR-based Dry Microburst Velocity Fields Generated UsingDual-Beam Autocorrelation Method 54
6. Weather Plus Clutter Scoring Results (11 Cases - DBV) 55
7. False Association Scoring Results (11 Cases) 61
viii

1. INTRODUCTION
This report considers the capability of Airport Surveillance Radars (ASRs) fordetecting the low altitude wind shear associated with the outflows of dry microbursts. Itdescribes results of simulations of dry microburst observations by an ASR. Thesesimulations incorporated weather and clutter data collected by Lincoln Laboratory'sTerminal Doppler Weather Radar testbed (FL-2) at Denver Stapleton Airport in 1988 and1989 and clutter data collected by Lincoln Laboratory's ASR-9 emulation testbed (FL-3)at Huntsville, Alabama. The impact of signal strength, overhanging precipitation, andground clutter on both radar observability and algorithmic performance are assessed.
Field studies in Huntsville have shown that ASRs can adequately detect windshear hazards in "wet" meteorological environments (Weber and Noyes, 1988). This isimportant, since wet microbursts are by far the predominant source of low altitude windshear at most of the potential ASR-9 sites in the United States.
Wet microbursts occur in regions where the low altitude relative humidity is high;as a result, the height of the ambient cloudbase is low (typically one km above groundlevel) and evaporation of precipitation accompanying a convective storm's downdraft isnegligible. Such microbursts, always associated with a moderate to intense rainfall on theground, are designated "wet" microbursts. However, at some potential ASR-9 sites (e.g.,the Great Plains and the deserts east of the Rocky Mountains), dry microbursts,. eventsassociated with much lower reflectivity convective stonns, occur. In these drier regions,the cloud base can often can be as high as 3 km above ground level. Under theseconditions, convective storms still develop, generating strong downdrafts. Much of theprecipitation accompanying these downdrafts evaporates before reaching the ground. Aresultant outflow can therefore be very dry, and the signal returned to a weather radardetection system correspondingly low. In Denver, during the months of high microburstactivity (May to September), a deep boundary layer of dry air exists roughly half thetime. During field experiments conducted at Denver's Stapleton Airport over thesummers of 1987 and 1988,41 percent of the microburst events observed by the FL-2radar were associated with reflectivities of 30 dBZ or less, technically classifying them asdry. Many dry microburst downdrafts are associated with the anvils of larger "wetter"convective storms located tens of kilometers away.
Both the ambient cloud structure and the low surface reflectivity associated withdry microbursts impose technical challenges peculiar to an ASR-based wind sheardetection system. These challenges can be divided into three categories: radarsensitivity, overhang precipitation interference, and ground clutter interference.
A. RADAR SENSITIVITY
Dry microbursts can exhibit surface reflectivities as low as 5 dBZ. While theASR-9 radar is inherently capable of detecting signals below 0 dBZ as far out in range as23 km, operation at maximum sensitivity is impractical on account of receiver clippingcaused by saturation from both high ground clutter and severe weather. The 12-bitanalog-to-digital converters of the ASR-9 receiver impose a 66 dB dynamic range on thesystem. To counter receiver saturation, the sensitivity of the system is currently reducedat close ranges by applying a range-dependent Sensitivity Time Control (STC) function.Figure 1 plots both minimum detectable signal and saturation point versus range in unitsof reflectivity for the ASR-9. The dotted curve shows the receiver with no STC. The
1

158705-'80
70W ....... > •..J .....CD N 60 .... ....<cCD ....-., ........ ~ 50
.,NOSTC
~~,
.... - I R 2STCW> 40 IOJ::....... 0 30 f-Ew::::s..JEu- 20.-w=a:::::Ea: 10 -....... w::::E~ 0 -::J<c ........---;§w ........~ =: -10 ., ....::::E
.,,-20 I
II I I I I I I-30
0 5 10 15 20 25 30 35 40
RANGE (km)
Figure 1. Minimum and maximum detectable reflectivity versus range for an ASR-9. Dashedcurve shows sensitivity and saturation limits with STC switched off. Solid curve shows limits withrange squared STCfunction.
solid curve shows sensitivity after applying an STC function that varies as the square ofthe range. This function was so selected to give a constant sensitivity of 0 dBZ out to 23km. Weber and Moser (1987) have shown that such an STC function should provide theASR-9 with adequate protection from receiver saturation in typical clutter environments.
The use of an IAGC system as an alternative to the STC is currently underinvestigation. This would effectively broaden the dynamic range, affording both highersensitivity and a higher saturation point. Such a system improvement will beimplemented on an ASR-9 transportable testbed in late 1990.
B. OVERHANG PRECIPITATION INTERFERENCE
An ASR fan-beam pattern would not only receive echoes from the low elevationoutflow, but also from the storm above the outflow, biasing Doppler estimates of nearsurface wind velocity. Weber and Noyes (1988) and Weber (1989) have shown this to bea solvable problem in the case of wet microbursts within 20 km of the radar. However,for dry microbursts, this overhanging precipitation interference would be much moreacute, since evaporation causes a decrease in the ratio of echo strength from the lowelevation outflow region to echo strength from aloft.
2

C. CLUTTER RESIDUE INTERFERENCE
Weber (1988) has performed simulations indicating that typical levels of groundclutter for an ASR would not prevent detection of microburst outflows with reflectivity inexcess of 20 dBZ. However, dry microbursts can return echoes as low as 5 dBZ. Typicalsignal-to-clutter ratios in event regions often will be less than -25 dB; clutter residueand/or clutter filtering may seriously distort the weather echo spectrum.
Since 1985, the FAA and Lincoln Laboratory have conducted a multi-year study,FLOWS (FAA/Lincoln Laboratory Operational Wind Shear Studies), to assess the windshear detection capabilities of Doppler weather radars sited at or near airports. Theprimary weather radar used in these studies is an S-band pencil-beam weather radar(FL-2). Data have been collected from four sites thus far: Memphis, TN (1985),Huntsville, AL (1986), Denver, CO (1987-88), and Kansas City, KS (1989). Since notestbed ASR Doppler weather data has been collected in a dry microburst environmentand a large quantity of pencil-beam dry microburst data collected by FL-2 in Denver wasavailable, the FL-2 Denver data set was used in simulations to assess an ASR-9s drymicroburst detection capability.
The breakdown of the report is as follows: Section 2 describes in detail theprocedure followed in the assessment. The criteria used in the selection of 11 drymicroburst cases are discussed. Techniques used in simulating time-series signalscorresponding to an ASR's measurements of dry microbursts and competing groundclutter are described. The section concludes by describing subsequent Doppler signalprocessing and application of the microburst detection algorithm. Section 3 presents theresults of the simulation and the analysis of the eleven microburst cases. Each of thethree above mentioned detection issues, radar sensitivity, overhanging precipitation, andclutter residue is addressed. In section 4, conclusions and recommendations are given.
3

2. EXPERll"ENTALPROCEDURE
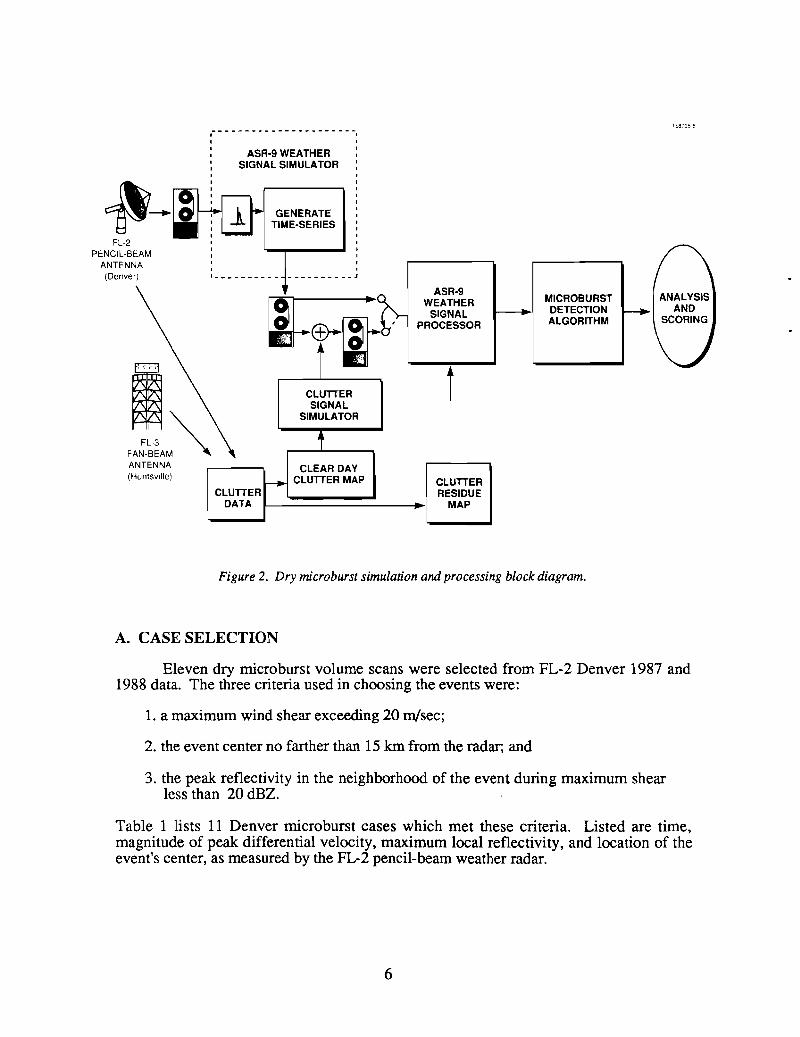
Eleven dry microbursts events were selected from FL-2 data for study. The blockdiagram in Figure 2 depicts the scheme used in processing them. In brief:
1. FL-2 volume scan weather reflectivity, radial velocity, and spectral width datawere used to compute elevation-angle resolved spectra of weather echoes.These were weighted by the beam pattern of the ASR-9, then integrated overbeam elevation.
2. An additional signal component simulating system noise was applied to thecomposite spectra from step 1). The Monte Carlo method described bySirmans and Bumgarner (1975) was then used to simulate Rayleigh amplitudestatistics and a uniform random phase distribution for each spectralcomponent.
3. The resultant "noisy" composite spectral data were inverse Fouriertransformed to time-series.
4. Clutter time-series were generated from clear day clutter data collected fromboth the FL-2 (Denver) and FL-3 (Huntsville) radar systems. These cluttertime-series were added to the weather time-series generated in step 3).
5. Both pure weather time-series from step 3) and clutter-contaminated weathertime-series from step 4) were converted to reflectivity and radial velocityproducts using the ASR signal processing algorithms currently employed bythe FL-3 real-time signal processor.
6. Wind shear segment associations, clusters, were generated from the productdata using a slightly modified version of the divergent outflow detectionalgorithm developed for TDWR.
7. Both product data from step 5 and cluster data from step 6 were analyzed.
This chapter details the case selection and the processing scheme used in the firstfive steps above. Included are:
1. The selection criteria for the 11 dry microburst cases studied;
2. Methods used to simulate ASR fan-beam time-series data from FL-2 pencilbeam volume scan weather data;
3. The conversion of FL-2 and FL-3 clutter data to ASR time-series format;
4. The time-series ASR signal processor used to generate low-altitude radialvelocity estimates, and the application of the microburst detection algorithm.
5
, 58705 B
MICROBURSTDETECTIONALGORITHM
ASR·9WEATHER
SIGNALPROCESSOR
CLUTIERSIGNAL
SIMULATOR
CLEAR DAYCLUTIER MAP
---------_.1
-----_._-------------,,ASR-9 WEATHER :
SIGNAL SIMULATOR :,,,,,GENERATE :
TIME-SERIES :,,II,,
CLUTIER
ClUTIERI-~~~~~=~_...1 RESIDUEDATA MAP
I,,,,,,1 ----
I":~:A>~ANTENNA(Huntsville)
FL-2PENCIL-BEAM
ANTENNA(Denver)
Figure 2. Dry microburst simulation and processing block diagram.
A. CASE SELECTION
Eleven dry microburst volume scans were selected from FL-2 Denver 1987 and1988 data. The three criteria used in choosing the events were:
1. a maximum wind shear exceeding 20 m/sec;
2. the event center no farther than 15 kIn from the radar, and
3. the peak reflectivity in the neighborhood of the event during maximum shearless than 20 dBZ.
Table 1 lists 11 Denver microburst cases which met these criteria. Listed are time,magnitude of peak differential velocity, maximum local reflectivity, and location of theevent's center, as measured by the FL-2 pencil-beam weather radar.
6

Table 1.Dry Microburst Events in Study
Case Time Shear Reflectivity Range AzimuthNumber Date (GMT) (m/s) (dBZ) (km) (degrees)
1 12 June 1987 23:07 24 15 6 219
2 18 June 1987 22:36 21 15 14 255
3 10 July 1987 00:54 30 10 7 311
4 10 July 1987 01:44 28 10 13 198
5 10 July 1987 01:52 27 10 3 193
6 10 June 1988 22:10 27 10 13 265
7 10 June 1988 23:19 24 5 12 256
8 8 August 1988 20:41 22 5 6 316
9 9 August 1988 19:37 22 15 14 330
10 12 August 1988 22:04 22 15 14 289
11 12 August 1988 22:29 24 10 7 307
B. GENERATING FAN-BEAM TIME-SERIES FROM PENCIL-BEAMPRODUCTS
This section describes the method used to simulate fan-beam ASR time-seriesfrom pencil-beam FL-2 volume scan data. The FL-2 volume scan data used for eachevent studied consisted of 7-14 PPI scans of product data. Three products were used:reflectivity (DZ), velocity (V), and spectrum width (SW). The time of the lowest leveltilt, Le., the surface scan, was the time of maximum observed shear. The remaining tiltswere selected such that the surface scan was located at the halfway point of the volumescan.
1. Synthesis: Converting PPIs to RUIs
Since the ASR simulator, described in the next section, integrates product dataover elevation, it was necessary to convert the PPI (azimuthal scan) volume data to anRID (elevation scan) format. Each FL-2 PPI volume scan was thus interpolated andresampled to generate synthesized Rills of DZ, V, and SW. The technique used, a twodimensional skewed Cressman weighting scheme, is described in Appendix A. Theentire azimuthal extent of each volume scan was synthesized; radial range extent wasalways 10 km, centered upon the event location.
7

2. Simulation I: Converting RHI Product Data to ASR Time-Series
The ASR-9 simulation program uses a pencil-beam radar's RHI products (DZ, V,and SW) to simulate the time-series output of an ASR radar system. Figure 3 is a blockdiagram of the data flow through the ASR-9 simulator. Products from each gate are usedto generate power spectra. Each of these spectra are weighted by the two-way beampattern of the ASR radar, then integrated over elevation.
------------------------------------------,
WEATHER +CLUTIER
WEATHER ONLY
WEATHER +CLUTIER
WEATHER ONLY
.I1,0 I
I I HIGHI~ TILTId:;; ~I1,0 .....
Lo~T ~TIL$---.-
ASRWEATHERTIME·SERIESSIMULATOR..
III
INVERSE FOURIER TRANSFORM:
WEATHER GENERATION
~
Iz~~~ ~PENCI:.BE~~INTEGRATEOVER ASR·9RHI WEATHER /L HIGH AND LOW ANTENNARADAR DATA BEAM PATIERNS TO
GENERATE GENERATE A COMPOSITE SPECTRA TO GENERATE ASR IWEATHER SPECTRA SPECTRUM TlME·SERIES I__________________________________________ J
1----------------------------------------1I ,I I: il CLEAR DAY ~ - ~~~nER 1.0:
;.' CLUTTER MAP f2+. ~ ~:~~·C::6~S I-'-I,a-i-: '
t :,~ GENERATE
I,'; ~. CLUTIER SPECTRU~NVERSEFOURIER TRANSFORM i
CLUTTER GENERATION SPECTRA TO GENERATE ASR ITIME·SERIES I
I I________________________________________ J
Figure 3. ASR-9 weather and clutter simulation block diagram.
Three noise and randomization components were applied to the spectra:
1. White noise: a constant computed from the FL-3's nominal noise setting wasadded to the spectra.
2. Statistical variation: The magnitude of each frequency component of thespectra was multiplied by a Rayleigh distributed random variable with a meanof 1.
8
3. Phase randomization: The phase of each frequency component was unifonnly
distributed between -1t and 1t.
The spectra are then inverse Fourier transformed into 26-pulse time-series, the coherentprocessing interval currently used by the ASR-9 real-time processor. Data from bothhigh- and low-elevation tilts are simulated.
For this study, most of the radar parameter settings used in the simulation were setto be the same as those of FL-3. Parameters for an ASR-9 are nearly identical, exceptthat pulse length is 1.0 Jls and transmit and receive losses may differ. The maximumrange of the R-squared STC function was set to 12.36 kIn, equivalent to setting thesystem noise level at 0 dBZ out to 12.36 km. The simulations were run with the nose ofthe beam at both one and two degrees elevation. Two degrees is the normal operationalsetting for an ASR. Placing the nose of the beam at one-degree elevation slightlyincreases an ASR's sensitivity to dry microbursts. However, it also significantlyenhances the impact of ground clutter. Operation at one-degree elevation was simulatedto examine the effects of this weather/clutter tradeoff.
The block staggered pulse repetition frequency (PRF) of the ASR-9 was nottreated in this study due to excessive processing requirements for the simulation. Instead,a constant PRF signal, as used in FL-3 field tests in Huntsville, was simulated. Thischange does not affect main results of this study.
Table 2 lists the simulator's radar parameter settings. (Note: The antennaelevation was switched to 2.0 degrees for the two-degree simulations.)
C. GENERATING CLUTTER TIME-SERIES FROM PENCIL-BEAM ANDFAN-BEAM DATA
This section describes how clutter data collected by FL-2 in Denver and FL-3 inHuntsville were transformed into ASR clutter time-series. This clutter time-series wasadded to the simulated weather time-series, described above, to simulate ground cluttercontamination. The section begins by describing how clear day maps of Denver andHuntsville clutter were generated. Then it describes how these maps were converted totime-series.
1. Clear Day Clutter Map Generation
Both Huntsville and Denver clutter distributions were used. The methods used togenerate both sets of maps differed:
Huntsville: Since actual FL-3 fan-beam clutter data from Huntsville wereavailable, these were used to construct a map. Data were selected from 8 September1988, one of the few days in which clutter data were collected at both one- and twodegree elevations. A single scan (rotation) was used so that the stochastic nature of theclutter echoes was simulated. The all-pass filter "residue" map was then converted to ageneric clear day map format. Since the STC function operating in Huntsville set system
9

Table 2.ASR Simulated Radar Parameters.
Azimuthal Beamwidth 1.45 degrees
Elevation Beamwidth 6.20 degrees
Transmitted Power 58.7 dBm
Pulsewidth 650 nsec
Antenna Gain· Low Beam 33.5 dB
Antenna Gain· High Beam 32.5 dB
Receiver Gain - High Beam 112.75dB
Transmitter Loss -1.5 dB
Receiver Loss - Low Beam -2.8 dB
Receiver Loss - High Beam -26 dB
Noise - Low Beam -105.7 dBm
Noise - High Beam -105.7 dBm
Antenna Elevation [0 dB pt] 1.0 (2.0) degrees
Gate Spacing 0.12 km
Pulse Repetition Frequency 980 Hz
Burst Mode OFF
Total Pulses 26
Frequency 2730 MHz
STC Range 12.36 km
STC Exponent 2.0
noise for FL-3 to a constant 6.1 dBZ, all values in the clear day map below the equivalentof 6.1 dBZ were thresholded to O.
Denver: The Denver clear day map was generated from FL-2 pencil-beam datain a series of steps:
1. An FL-2 horizon scan reflectivity (DZ) field, collected on a clear day
(13:11:5026 Apri11988) was transformed into a clutter cross-section (aD).
10

2. The aO field was then transformed back to a DZ field, assuming propagationfactors corresponding to spherical spreading from the site of the ASR-8 atStapleton airport.
3. The DZ field was attenuated to account for antenna elevation and beam shapedifferences between FL-2 and and an ASR. Four attenuation factors werecomputed (for high and low beams at one- and two-degree nose elevations).The factors were computed as follows:
A base attenuation factor was determined to account for beam shape. Themedian reflectivity observed by the low beam of Stapleton's ASR-8 in1985 was obtained from a graph in Weber and Moser (1987). This graphis reproduced in Figure 4a. A corresponding graph, computed and plottedfrom the coordinate-translated FL-2 clutter data prior to attenuation, isshown in Figure 4b. In the heavy clutter regions from 0 to 20 km, the twographs differed by 14 to 20 dBZ. The base factor was thus set to -17 dB;the two-degree low beam could be reasonably approximated byattenuating the FL-2 Denver clutter data by this base factor.
To approximate clutter for the low beam at one degree and the highbeam at one and two degrees, three additional attenuation factors werecomputed by expressing each beam's clutter illumination power relative tothe two-degree low beam (by clutter illumination power it is meant thatthe amount of power directed at and below the horizon). These relativepower values were computed by integrating the two-way ASR beampattern using measured ASR-9 beam pattern coefficients. All fourattenuation factors computed are summarized in Table 3.
4. The attenuation factors were applied to the coordinate-translated Denverclutter maps produced in step 3, and four attenuated clutter fields weregenerated. These four DZ fields were then transformed into two clear daymaps, one map for each antenna elevation. These maps, in reflectivity units,are shown in Figure 5.
2. Simulation TI: Clear Day Maps to Clutter Time-Series
The clutter reflectivity data from the two sets of clear day maps were transformedto ASR time-series format by:
1. Generating Gaussian clutter power spectra (spectral width 0.72 m/sec)centered at zero velocity with integrated power proportional to the clutterreflectivity level;
2. Applying Rayleigh amplitude variation and uniform phase randomization, aswas done in generating the simulated weather signals. No white noisecomponent was added; and
3. Inverse Fourier transforming the clutter spectra to time-series.
11

158705-660 ...-----r--........--.......-.,....-........--r---r-----,--,--...,
50 ASR-8: DENVER LOW BEAM
(b)
(a)
40353015 20 25
RANGE (km)105
20
40
30
-10 L..- L....-_---'__---L__---l.__.....L__.....L__.....L__....J
o
30
20
o
10
Nm~ 10
~:> 0i=o~ -10 '--_-'-_........__.l...-_-'-_---'-__......................._---'---LI..........I...-_--'LLWa:a:~ 60r------r--..,..-----,----r---r----,.---r----,
~...Jo 50Z~C 40W:E
Figure 4. Median ground clutter intensity (ensembled over azimuth) versus range: a) from theASR-8 at Stapleton Airport (from Weber, 1987); b)from coordinate-translated FL-2 data. Thesetwo measured distributions were used to compute the base beam attenuation factor described inthe text.
Table 3.Clear Day Clutter MapAttenuation Factors
Antenna Elevation
Beam One-Degree Two-Degree
Low -10.83 dB -17 dB
High -24.49 dB -32.31 dB
12
Fig
ure
5.C
lutte
rm
aps
used
indr
ym
icro
burs
tstu
dy,i
nun
itso/
wea
ther
refle
ctiv
ity(d
BZ)
(ran
geri
ngs
at5
km;
azim
uth
lines
ever
y30
degr
ees)
.

As depicted in Figure 3, these clutter time-series were then added to the simulatedweather time-series, thus producing clutter contaminated fan-beam ASR time-seriesweather data from dry microbursts.
D. SIGNAL PROCESSING: GENERATING ASR WEATHER PRODUCTS
All of the simulated time-series were processed using techniques developed forthe real-time wind shear detection processor developed for FL-3. All of the simulatedweather cases without clutter contamination were processed with no clutter filteringapplied. All of the simulated weather with clutter contamination were processed usingthe appropriate clutter residue map. One of four FIR clutter filters are adaptively selectedfor each gate of the low beam; the FIR filter selections for the low beam data are alsoused for high beam data. The generation of the residue maps used is described below.
The ASR signal processor generates several weather products. The two productsof importance in this study were:
Low-Beam Velocity (LBV): This Doppler velocity product is computed fromthe first autocorrelation lag of the low beam data. No high beam information isused.
Dual-Beam Velocity (DBV): This Doppler product is computed using data fromboth high and low receiving beams of the ASR. The algorithm used in computingthis product is described in Weber (1989). In brief, the velocity estimate iscomputed from a weighted difference of the first autocorrelation lags of the twobeams. It has been shown in Weber and Noyes (1988) and in Weber (1989) thatthe dual beam velocity field is more appropriate for the detection of low altitudewind shear than the low beam product.
The ASR signal processor thresholds out all data with a signal-to-noise ratio lessthan 7 dB. Since system noise was set via STC to 0 dBZ in the simulated scans, gooddata with reflectivity below 7 dBZ would be thresholded out. The signal processor alsothresholds all data where the signal-to-clutter ratio is less than 10.4 dB. Since a goal ofthis study was to determine whether the events were detectable at all, regardless of falsealarms, all of the cases were processed both with the default settings and with signal-tonoise thresholding switched off and signal-to-clutter thresholding lowered to 5 dB.
1. Clutter Residue Map Generation
All clutter residue maps, used for adaptive filter selection in the ASR signalprocessor, were generated using the same data and methods described in section C forgenerating the clear day maps. All four filter outputs of the ASR signal processorcontributed to the residue map rather than the all-pass filter output alone. The only otherdifferences in generating them were:
Huntsville: Rather than using a single scan of FL-3 data, three scans wereaveraged after being processed.
Denver: To simulate the effects of scan averaging, the exponential statisticalvariation functions in the program used to generate the simulated Denver cluttertime-series were disabled. To remain consistent with the sensitivity limit of theFL-3 data from Huntsville, the 6.1 dBZ threshold was applied to this map as well.
15
E. MICROBURST DETECTION ALGORITHM
The microburst detection algorithm used, described in Weber and Noyes (1988),is a slightly modified version of the microburst divergent outflow detection algorithm(MDOA) developed for the TDWR. Briefly, the process used to generate microburstalarms is as follows:
1. Shear SeWlents: The algorithm searches for shear segments, runs of velocitiesincreasing with range. Steps are taken to deal with spurious jumps in velocityor small data gaps.
2. Clusters: Range overlapping segments are azimuthally associated into shearsegment clusters, thus defming a shear region.
3. Microburst Alarms: Relying upon the ASR's 4.8 sec update rate, shear regionsare time-associated into microburst alarms on successive scans of the radar.In this way, many spurious shear regions are rejected.
The FL-2 Denver scanning strategy provided surface scan coverage only once aminute. As a result, generation of multiple simulated scans for time-association was notpossible. This study, therefore, uses only shear clusters, the product of step 2, in itsassessment of an ASR's microburst detection capability. This eliminates an importantfalse alarm filter but does not lower detection performance since clusters must fIrst begenerated before producing microburst alarms.
16

3. RESULTS
A. CASE STUDIES
This section discusses the analysis of four of the 11 simulated dry microbursts.The fIrst case described was a very dry event which was detectable in the absence ofclutter, but obscured when clutter was added. The second was a dry event detectableunder virtually all conditions. The third and fourth, which occurred within 70 minutes ofeach other, were marginally detectable events; the meteorological environment in whichthey occurred also was conducive to numerous false alarms.
1. Case 08 - 08 August 1988, 20:41 GMT
On August 8, 1988 a very dry microburst occurred 6 km from the FL-2 radar sitein Denver. A near surface radial shear of 22 m/sec was measured by the FL-2 pencilbeam radar at the time of maximum shear (20:41 GMT). Near surface reflectivity for thisevent was extremely low (5 dBZ). Like many low reflectivity microbursts, this eventdescended from the anvil structure of a higher reflectivity convective storm, locatedapproximately 10 km west of the radar. Figures 6a-d show reflectivity and radial velocityfIelds from two of the 15 PPI scans from which the three-dimensional storm profIle usedin the simulation was constructed. The microburst event is centered at 316 degreesazimuth in the radial velocity fIeld of the 0.3-degree elevation scan, Figure 6b. In the30. I-degree elevation horizontal scan, Figure 6c, the anvil from the storm at 255 degreesclearly extends over the area of the microburst event. Figure 7 shows an interpolatedvertical cross-section of the event, constructed from the 15 PPI scans. The cross-sectionreveals both anvil cloud and the precipitation accompanying the downdraft. Note thedecrease in reflectivity as this precipitation approaches the surface, indicative of theevaporation of the hydrometeors.
As described in Section 2.B, the interpolated three-dimensional data were fed intothe ASR-9 simulator. Figure 8 shows velocity fIelds generated from processing theresultant simulated time-series signal with the Lincoln Laboratory ASR signal processor.Note at this stage that no clutter signals have been added. Low-beam reflectivity(LBDZ), low beam velocity (LBV), and dual beam velocity (DBV) are shown. In theboth the LBV and DBV fIelds, shear segments and associated regions are represented byred lines and red boxes, respectively. The microburst was readily detectable in the DBVfield, Figure 8c. The microburst detection algorithm successfully associated the shearsegments azimuthally, generated shear regions, and estimated a differential velocity of17.8 m/sec. In regions outside of the event, inbound (negative velocity) overhangingprecipitation was mapped into the ASR velocity fIeld, particularly beyond 9 km in rangein regions due west of the radar. This is evident in both LBV and DBV fIelds.
Figure 9 shows the effect of adding Denver and Huntsville clutter time-series tothe simulated weather data time-series and applying appropriate fIltering operations insignal processing. In the neighborhood of the microburst, the effective reflectivity of theground clutter, prior to clutter fIltering, was 7 dBZ for Denver, 33 dBZ for Huntsville.Not surprisingly, the event was completely swamped by ground clutter residue in theHuntsville clutter environment. In the Denver case, where the clutter was of acomparable level to the weather reflectivity, the event was detected in the low beamvelocity field (fIgure 9b) and only marginally missed in the dual beam fIeld (Figure 9d).Note again that the normal signal-to-noise and signal-to-clutter thresholds have beenremoved, resulting in high variance for the velocity estimates in regions of low signalstrength.
17

ozDZ
'U_
:8
8/8
8/8
82
8:4
1:4
23
8.1
deg
rees
•
Fig
ure
6.FL
-2pe
ncil-
beam
refle
ctiv
ityan
dra
dial
velo
city
fiel
dsdu
ring
5dB
Zdr
ym
icro
burs
tat8
Ian.
316
degr
ees
azim
uth.
at20
:41
(GM
T).
Aug
ust8
.198
8in
Den
ver.
Show
nar
eho
rizo
ntal
scan
s/ro
m0.
3an
d30
.0de
gree
sel
evat
ion.
(Ran
geri
ngs
are
at5
and
10km
;az
imut
hlin
esev
ery
30de
gree
s.)

Fig
ure
7.V
erti
cal
prof
ile
0/20
:41
(GM
T).
Aug
ust8
.198
8dr
ym
icro
burs
teve
nt.
Pro
file
was
synt
hesi
zed/
rom
15ho
rizo
ntal
scan
sta
ken
byF
L-2
(ord
inat
ean
dab
scis
sasc
ales
inki
lom
eter
s).

Fig
ure
8.Si
mul
ated
ASR
refl
ecti
vity
and
velo
city
fiel
dsfo
r20
:41
(GM
T),
Aug
ust8
.198
8dr
ym
icro
burs
teve
nt.
No
clut
ter
sign
als
haW
!be
enad
ded.
Shea
rse
gmen
tsan
das
soci
ated
regi
ons
are
repr
esen
ted
byre
dli
nes
and
red
boxe
s.re
spec
tive
ly(r
ange
ring
sat
5km
;az
imut
hli
nes
ever
y30
degr
ees)
.

LB\/
ti.e
:8
8/8
8/8
72
8:3
7:2
71
deg
rees
.~--...~.
LB\/
tim
e:
Fig
ure
9.Si
mul
ated
clut
ter-
cont
amin
ated
ASR
velo
city
field
sfo
r20
:41
(GM
T),
Aug
ust8
.19
88dr
ym
icro
burs
tev
ent.
Shea
rse
gmen
tsan
das
soci
ated
regi
ons
are
repr
esen
ted
byre
dlin
esan
dre
dbo
xes.
resp
ectiv
ely
(ran
geri
ngs
at5
km;
azim
uth
lines
ever
y30
degr
ees)
.
2. Case 01·12 June 1987,23:07 GMT
On June 12, 1987 a very strong, deep, dry microburst occurred 6 km southwest ofthe radar in Denver. A near surface radial velocity differential of 24 rn/sec was measuredby the FL-2 pencil-beam radar at the time of maximum intensity. The FL-2 pencil-beam0.2-degree elevation scan is shown in Figure 10. In addition to the event of interest,another wind shear event is present in the figure, centered at 13 km range and 285degrees azimuth. The peak surface reflectivity of this event was 25 dBZ, disqualifying itfrom this particular study. The high reflectivity returns in regions within 5 km of theradar and in the narrow band centered at 7.5 km west of the radar are ground clutterresidue from the FL-2 radar. While this clutter residue does impinge with the outward(positive) velocity component of the wind shear signature of interest, the clutterinterference begins beyond the peak velocity, so this slight data corruption should notchange the major results of this simulation.
Figure 11 shows the vertical cross-section synthesized from the 14 PPI scansused. The depth of the microburst event is readily apparent from the velocity field(Figure 11b); the outflow region extends almost a half kilometer above the surface.
Figure 12 shows the velocity fields from the processed simulated two-degreeelevation fan-beam data. The depth of the outflow and its 20 dBZ surface reflectivityenabled it to be readily detectable. The DBY product for the pure weather case is shownin Figure 12a. Several associated clusters were found in the microburst region.Presumably, in an operational system, these clusters would themselves be associated togenerate a single microburst alarm for that event. DBY products subsequent to addingthe Denver and Huntsville clutter time-series are shown in Figures 12b and 12c,respectively. The microburst signature was found by the algorithm in the DBY productin both regimes. In the neighborhood of the microburst, the effective reflectivity of theunfiltered ground clutter was 4 dBZ for Denver and 32 dBZ for Huntsville.
3. Case 06·10 June 1988,22:10 GMT
On the afternoon of June 10, 1988, several large storms passed from west to east,just south of the FL-2 radar. Anvils from these storms produced two of the microburstsused in this study. At the time of the first microburst event, 22:10 GMT, a very large,mature, severe thunderstorm was just south of the radar. Figure 13a and b show theO.3-degree FL-2 surface scan. The microburst event was centered 13 km from the radarat 265 degrees azimuth. Peak near surface radial velocity differential, as measured by thepencil-beam radar system, was 27 rn/sec. Peak surface reflectivity in the outflow was10 dBZ. In the 21.8-degree horizontal scan, Figures l3c and d, part of the anvil structurealoft contributing to the microburst is apparent. The anvil is not directly associated withthe higher reflectivity convection at 5 km. Were this the case, then the hydrometeors inthe anvil would exhibit a radial velocity away from the cell. Figure 14, a vertical crosssection synthesized from 14 PPI scans, shows that the radial velocity of the precipitationaloft is clearly moving toward the nearer storm. The reflectivity aloft contributing to themicroburst is from the larger, severe thunderstorm storm 7 km south of the microburst,beyond the FL-2's scan region.
27

02
ti_
:8
7/8
6/1
22
3:8
7:2
7
Fig
ure
10.
FL-
2pe
ncil
-bea
mre
flec
tivi
tyan
dra
dial
velo
city
fiel
dsdu
ring
15dB
Zdr
ym
icro
burs
tat
6km
,21
9de
gree
saz
imut
hat
23:0
7(G
MT)
,Ju
ne12
,198
7in
Den
ver.
Show
nis
hori
zont
alsc
anfr
om0.
2el
evat
ion
(ran
geri
ngs
at5
km;
azim
uth
lines
ever
y30
degr
ees)
.

til
le:
87
/12
/86
23:8
7:27
228
deg
rees
_.-
....
..,
I1
.1
Fig
ure
11.
Ver
tical
prof
ile0/
23:0
7(G
MT)
,Ju
ne12
,198
7dr
ym
icro
burs
teve
nt.
Pro
file
was
synt
hesi
zed/
rom
14ho
rizo
ntal
scan
sta
ken
byF
L-2
(ord
inat
ean
dab
scis
sasc
ales
inki
lom
eter
s).

Fig
ure
12.
Sim
ulat
edA
SRve
loci
tyfie
lds
for
23:0
7(G
MT)
June
12,1
987
dry
mic
robu
rste
vent
.Si
mul
atio
nsw
ithno
clut
ter.
Den
ver
clut
ter.
and
Hun
tsvi
llecl
utte
rar
esh
own.
Shea
rse
gmen
tsan
das
soci
ated
regi
ons
are
repr
esen
ted
byre
dlin
esan
dre
dbo
xes.
resp
ectiv
ely
(ran
geri
ngs
at5
km;
azim
uth
lines
ever
y30
degr
ees)
.

tim
e:
tiB
e:8
8/8
6/1
82
2:1
8:2
72
1.8
deg
rees
I•
DZ yti
.e:
88/8
6/18
22:1
8:18
.3d
egre
es.
II..
.':
r'
".""
''''
'~'i
r'#'
P'''
'
DZ y
Fig
ure
13.
FL-
2pe
ncil
-bea
mre
flec
tivi
tyan
dra
dial
velo
city
fiel
dsdu
ring
10dB
Zdr
ym
icro
burs
tat
13km
,26
5de
gree
saz
imut
hat
22:1
0(G
MT
),Ju
ne10
, 198
8in
Den
ver.
Show
nar
eho
rizo
ntal
scan
s/ro
m0.
3an
d21
.8de
gree
sel
evat
ion
(ran
geri
ngs
at5
km;
azim
uth
line
sev
ery
30
degr
ees)
.

yti
_:
88/1
8/11
62
2:1
8:18
26
5.4
deg
rees
Fig
ure
14.
Ver
tica
lpr
ofil
e0/
22:1
0(G
MT)
June
10.1
988
dry
mic
robu
rst
even
t.P
rofi
lew
assy
nthe
size
d/ro
m14
hori
zont
alsc
ans
take
nby
FL
-2(o
rdin
ate
and
absc
issa
scal
esin
kilo
met
ers)
.

Figure 15 shows the DBV products of the two-degree elevation simulated dataafter signal processing and application of the microburst detection algorithm. In the pureweather case (Figure 15a, the microburst signature was found, along with four falseassociations. In the clutter contamination experiments, the effective reflectivity of theground clutter in the neighborhood of the microburst was 25 dBZ for Denver and 16 dBZfor Huntsville. Figures 15b and c show the resultant ASR products from both cluttercases. In both, a divergent outflow signature is visually apparent and the algorithmcorrectly identified the microbursts in all three cases. However, a single false associationoccurs in each of these two clutter cases as well.
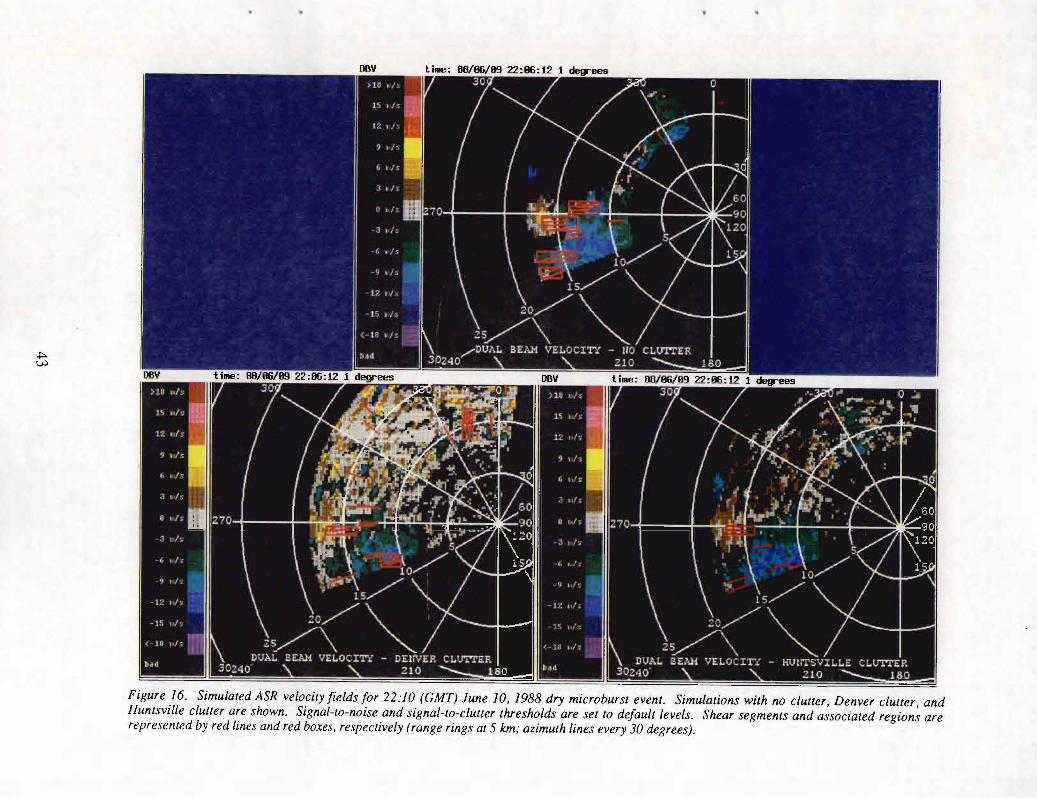
Applying the default thresholds did not eliminate all of the false associations.Figure 16 shows the resultant images when this case was re-processed using defaultsignal-to-noise and signal-to-clutter thresholding. The "no clutter" case (Figure 16a) hadthree false associations, while the Denver case had one. The Huntsville false association,however, was eliminated.
4. Case 07 • 10 June 1988, 23:19 GMT
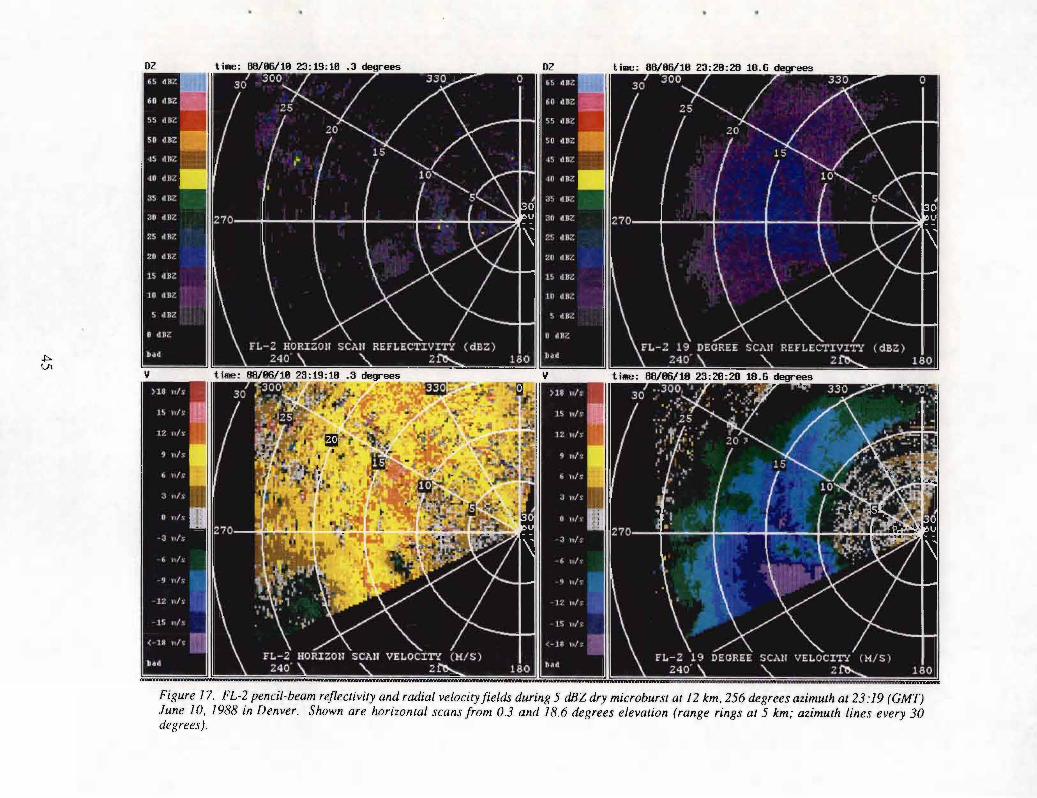
This dry microburst occurred 70 minutes after the event described above, at12 km and 256 degrees azimuth, 2 km northwest of the location of its predecessor. Thevery large storm which had produced the first event had by this time moved 20 kIn to theeast, and a new storm developing to the southwest of the radar produced the anvil fromwhich the dry microburst descended. Figure 17 shows the O.3-degree scan and the18.6-degree scan from the FL-2 pencil beam radar. Figure 18 shows the vertical crosssection of the event constructed from 14 PPI scans from FL-2.
Figure 19 shows the DBV products of the two-degree elevation simulated dataafter signal processing and application of the microburst detection algorithm. In the "noclutter" case (Figure 19a), the microburst signature was found. Note that in this case, themarked increase in reflectivity above 1 km altitude (the level at which the radial windcomponent reversed sign) resulted in widespread mapping of the negative velocities aloftinto the ASR velocity field. "Detection" of the microburst signature must be consideredfortuitous given that tne ASR velocity estimates would not have adequately representedthe overall flow field.
In the clutter contamination experiments, the effective reflectivity of the groundclutter in the neighborhood of the microburst was 18 dBZ for Denver and 27 dBZ forHuntsville. Figures 19b and 19c show the resultant ASR products from both cluttercases. In both, a divergent outflow signature is visually apparent; the algorithm failed inthe Huntsville case, however, because ground clutter residue fragmented too many shearsegments. As in the previous case study, the "no clutter" case had four false associationsoccurring in regions outside the event. No false associations occurred in the Denvercase, but one occurred in the Huntsville case.
Figure 20 shows the same cases after applying the default signal-to-noise andsignal-to-clutter thresholds (7 dB and lOA dB, respectively). In the "no clutter" and theDenver clutter case, the default thresholds eliminated all detections, valid and false. Inthe Huntsville case, the false alarms disappeared. Moreover, the algorithm made a validassociation where it had failed previously. The new detection occurred because the 10.4dB signal-to-clutter thresholding enabled heavier clutter filters to be selected in the regionof the microburst. The larger stopband widths in these filters biased upward the radialvelocity estimates in the event region sufficiently so that the microburst detectionalgorithm's criteria were met.
39

Fig
ure
15.
Sim
ulat
edA
SRve
loci
tyfi
eld
s/o
r22
:10
(GM
T)
June
10.
1988
dry
mic
robu
rste
vent
.Si
mul
atio
nsw
ith
nocl
utte
r.D
enve
rcl
utte
r.an
dH
unts
vill
ecl
utte
rar
esh
own.
Sign
al-t
o-no
ise
thre
shol
dsar
esw
itch
edo
ffan
dsi
gnal
-to-
clut
ter
thre
shol
dslo
wer
ed.
Shea
rse
gmen
tsan
das
soci
ated
regi
ons
are
repr
esen
ted
byre
dlin
esan
dre
dbo
xes.
resp
ecti
vely
(ran
geri
ngs
at5
km;
azim
uth
lines
ever
y3
0de
gree
s).
•
Fig
ure
16.
Sim
ulat
edA
SRve
loci
tyfi
elds
for
22:1
0(G
MT
)Ju
ne10
.19
88dr
ym
icro
burs
tev
ent.
Sim
ulat
ions
wit
hno
clut
ter,
Den
ver
clut
ter,
an
dH
unts
vill
ecl
utte
rar
esh
own.
Sign
al-t
o-no
ise
and
sign
al-t
o-cl
utte
rth
resh
olds
are
set
tode
faul
tle
vels
.Sh
ear
segm
ents
an
das
soci
ated
regi
ons
are
repr
esen
ted
byre
dlin
esan
dre
dbo
xes.
resp
ecti
vely
(ran
geri
ngs
at5
km;
azim
uth
line
sev
ery
30de
gree
s).
DZti
llle
:8
8/8
6/1
82
3:1
9:1
8DZ
•
Fig
ure
17.
FL-
2pe
ncil
-bea
mre
flec
tivi
tyan
dra
dial
velo
city
fiel
dsdu
ring
5dB
Zdr
ym
icro
burs
tat
12km
.25
6de
gree
saz
imut
hat
23:1
9(G
MT
)Ju
ne10
.19
88in
Den
ver.
Show
nar
eho
rizo
ntal
scan
sfr
om0.
3a
nd
18.6
degr
ees
elev
atio
n(r
ange
ring
sat
5km
;az
imut
hli
nes
ever
y3
0de
gree
s).

02
w
till
le:
68
/18
/96
23
:19
:18
25
5.6
de
gre
es
Fig
ure
18.
Ver
tical
prof
ile
0/23
:19
(GM
T)
June
10.1
988
dry
mic
robu
rst
even
t.P
rofi
lew
assy
nthe
size
d/ro
m14
hori
zont
alsc
ans
take
nby
FL
-2(o
rdin
ate
and
absc
issa
scal
esin
kilo
met
ers)
.

Fig
ure
19.
Sim
ulat
edA
SRve
loci
tyfie
lds
for
22:1
0(G
MT)
June
10.1
988
dry
mic
robu
rste
vent
.Si
mul
atio
nsw
ithno
clut
ter,
Den
ver
clut
ter,
and
Hun
tsvi
llecl
utte
rar
esh
own.
Sign
al-t
o-no
ise
thre
shol
dsar
esw
itche
dof
fand
sign
al-t
o-cl
utte
rth
resh
olds
low
ered
.Sh
ear
segm
ents
and
asso
ciat
edre
gion
sar
ere
pres
ente
dby
red
lines
and
red
boxe
s,re
spec
tivel
y(r
ange
ring
sat
5km
;az
imut
hlin
esev
ery
30de
gree
s).

Fig
ure
20.
Sim
ulat
edA
SRve
loci
tyfie
ldsf
or22
:10
(GM
T)Ju
ne10
,198
8dr
ym
icro
burs
teve
nt.
Sim
ulat
ions
with
nocu
tter,
Den
ver
clut
ter,
and
Hun
tsvi
llecl
utte
rar
esh
own.
Sign
al-to
-noi
sean
dsi
gnal
-to-
clut
ter
thre
shol
dsar
ese
tto
defa
ult
leve
ls.
Shea
rse
gmen
tsan
das
soci
ated
regi
ons
are
repr
esen
ted
byre
dlin
esan
dre
dbo
xes.
resp
ectiv
ely
(ran
geri
ngs
at5
Ian;
azim
uth
lines
ever
y30
degr
ees)
.

B. EFFECTS OF SIGNAL-TO-NOISE AND OVERHANGINGPRECIPITATION ON DRY MICROBURST DETECTION
1. Scoring Results
Table 4 shows the results from applying the ASR microburst detection algorithmto the 11 simulated weather cases containing no clutter contamination. A microburst hitwas declared if the algorithm associated shear segments within a kilometer of themicroburst in the DBV field.
Table 4.Scoring Results, Pure Weather (11 Cases)
Hits
One Degree Two Degree
Processor Number Percent Number PercentSettings
NoiseThresholding 10 91 11 100Off (NTO)
Default 8 72 7 64
The table indicates that when signal-to-noise thresholding was switched off, all 11microbursts with the two-degree tilt and 10 of 11 with the one-degree tilt were detected.This indicates that dry microbursts are detectable in the absence of ground clutter.Neither interference from overhanging precipitation nor weak signal strength preventeddetection of these events.
2. Velocity Estimates
Table 5 compares ASR velocity differential estimates to those from the TDWRtestbed on the 11 simulated microburst cases containing no clutter. Both human andalgorithmic truth comparisons are presented. Human truth estimates, produced bymeteorologists estimating the shear from the FL-2 data, tended to be higher thanalgorithmic truth, which was produced by applying the microburst detection algorithmon the surface FL-2 velocity fields.
On average, the ASR differential velocity estimates are 3-4 m/sec (10-15 percent)lower than the corresponding measurements from the TDWR testbed. In most cases, thisis caused by interference from reflectivity aloft. First, since the dual-beam estimator usedhere can be viewed as an extrapolation of surface velocity from high- and low-beamvelocity estimates, enhanced interference from reflectivity aloft in the low beam can stillbias estimates downwards. Second, in the simulated dry microbursts, while descending
53

Table 5.Microburst Detection Algorithm Velocity Estimator
Performance for Simulated ASR-based Dry MicroburstVelocity Fields Generated Using Dual-Beam
Autocorrelation Method
Beam Elevation Two-Degree One-Degree
Truth Type Human Algorithmic Human Algorithmic
AVRBias (mls) -3.98 -2.88 -3.56 -2.46
Relative A VR Bias -0.15 -0.11 -0.14 -0.10
RMS L\ VR Discrepancy (mls) 5.61 3.98 5.94 4.22
RMS Relative L\ VR Discrepancy 0.22 0.16 0.23 0.17
precipitation was adequate to resolve the centers of regions of shear, much lowerreflectivities were associated with the outer fringes of the outflow region. Interferencefrom reflectivity aloft biased or overwhelmed surface velocities in these fringes. Shearsegments were shortened, driving the resultant velocity estimates downward.
Nevertheless, the velocity estimator's performance statistics in Table 5 arecomparable to results of field measurements of wet microbursts made in Huntsville, ALand Kansas City by FL-3. Thus, regardless of the cause of the biases, these velocitystatistics should be viewed as a positive result.
C. EFFECTS OF CLUTTER RESIDUE ON DRY MICROBURST DETECTION
This section describes the results when simulated ground clutter time-series wasadded to the simulated dry microburst time-series
1. Scoring Results
Table 6 shows microburst detection results when the Denver and Huntsvilleground clutter were added to the scans analyzed. Ground clutter filtering, as described inWeber (1987), was performed before estimating velocities. As in Table 4, the resultsshown are from scoring from the dual-beam velocity (DBV) field.
If scoring is expanded so that a detection in either the LBV or DBV fieldsconstitutes a hit, one additional hit is obtained for the Denver two-degree data. Since thedual beam product is still under development, it is hoped that an improved dual-beamvelocity estimator will enable the LBV hits to be detectable from the DBV field also.
54
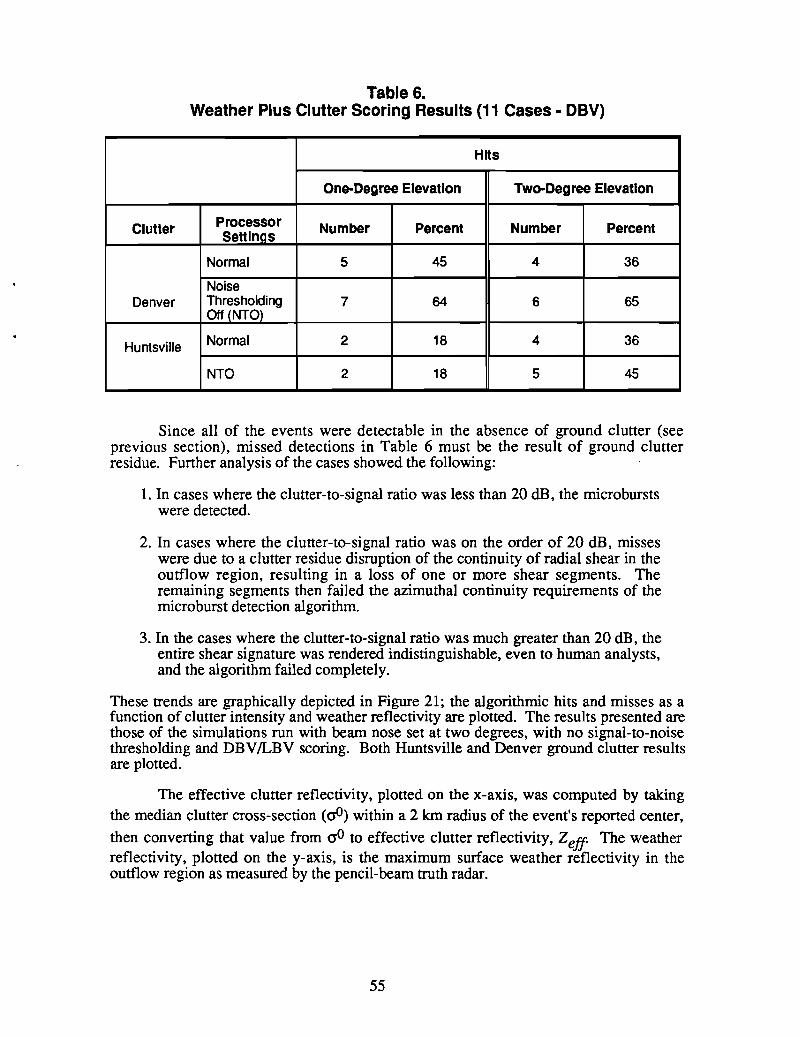
Table 6.Weather Plus Clutter Scoring Results (11 Cases - DeV)
Hhs
One-Degree Elevation Two-Degree Elevation
Clutter Processor Number Percent Number PercentSettlnas
Normal 5 45 4 36
NoiseDenver Thresholding 7 64 6 65
Off CNTO)
Huntsville Normal 2 18 4 36
NTO 2 18 5 45
Since all of the events were detectable in the absence of ground clutter (seeprevious section), missed detections in Table 6 must be the result of ground clutterresidue. Further analysis of the cases showed the following:
1. In cases where the clutter-to-signal ratio was less than 20 dB, the microburstswere detected.
2. In cases where the clutter-to-signal ratio was on the order of 20 dB, misseswere due to a clutter residue disruption of the continuity of radial shear in theoutflow region, resulting in a loss of one or more shear segments. Theremaining segments then failed the azimuthal continuity requirements of themicroburst detection algorithm.
3. In the cases where the clutter-to-signal ratio was much greater than 20 dB, theentire shear signature was rendered indistinguishable, even to human analysts,and the algorithm failed completely.
These trends are graphically depicted in Figure 21; the algorithmic hits and misses as afunction of clutter intensity and weather reflectivity are plotted. The results presented arethose of the simulations run with beam nose set at two degrees, with no signal-to-noisethresholding and DBV/LBV scoring. Both Huntsville and Denver ground clutter resultsare plotted.
The effective clutter reflectivity, plotted on the x-axis, was computed by takingthe median clutter cross-section (00) within a 2 km radius of the event's reported center,
then converting that value from crO to effective clutter reflectivity, Zelf The weatherreflectivity, plotted on the y-axis, is the maximum surface weather reflectivity in theoutflow region as measured by the pencil-beam truth radar.
55

It is clear from Figure 21 that the hits and misses can be separated into distinct hitand miss regions. In regions of high signal-to-noise (Le., reflectivity exceeding 0 dBZ inthe simulations), it is reasonable to assume that the boundary delimiting the two regionsis a straight line of slope one. An appropriate placement of this line is shown in Figure21.
A conclusion drawn from the figure is as follows: using the current signalprocessing strategies and microburst detection algorithms, events which occur in regionswhere the effective clutter exceeds weather reflectivity by 17-20 dB are missed by thecurrent algorithms. Conversely, events which occur in clutter regions where thedifference between clutter and weather reflectivities is less than 17 dB are detectable.
5
10 -
w 200.-..c:( NLLcntt~::J >- 15C/) ....
l;;~ttl::J 0cn W0....1ttltOtt:i
Ie HITSD MISSES
Ie • Ie Ie •
Ie Ie
Ie
D
OL....-....l..-......L.-.L---I.~...l.---L_.L.....-...l-......L.---l
o 10 20 30 40 50
EFFECTIVE CLUTIER REFLECTIVITY (dBz)
Figure 21. Algorithmic hits (Xs) and misses (boxes) from LBV and DBV fields with adjustedsignal-to-noise and signal-to-clutter thresholds plotted on a graph of effective clutter reflectivityversus weather reflectivity.
2. Statistical Analysis
From the results described in the preceding section, an estimate of an ASR'soverall probability of detection for microbursts at a particular site can be developed.Specifically, given both weather reflectivity distribution statistics for microburst eventsoccurring in the radar site's environment and the distribution of the site's effective groundclutter reflectivity, the percentage of microburst events missed on account of groundclutter can be predicted.
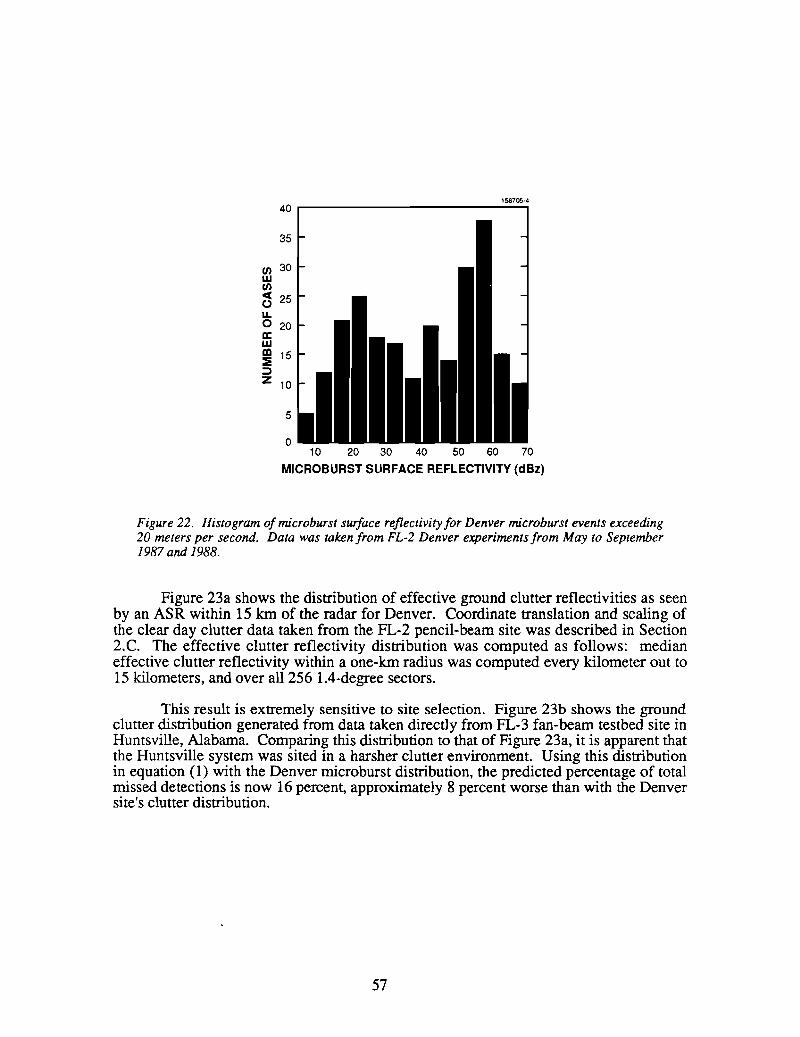
Figure 22 shows the distribution of reflectivities for microburst events at Denver,measured by the FL-2 radar in 1987 and 1988 between the months of May andSeptember. Note that this histogram includes wet as well as dry microbursts. Forty-onepercent of these Denver events were associated with reflectivities of 30 dBZ or less,classifying them as dry.
56
158705·440 ,---------------,
35
(/) 30w(/)
~ 25L&.o 20a:wIn 15::::iE::JZ 10
5
o10 20 30 40 50 60 70
MICROBURST SURFACE REFLECTIVITY (dBz)
Figure 22. Histogram of microburst surface reflectivity for Denver microburst events exceeding20 meters per second. Data was taken from FL-2 Denver experiments from May to September1987 and 1988.
Figure 23a shows the distribution of effective ground clutter reflectivities as seenby an ASR within 15 km of the radar for Denver. Coordinate translation and scaling ofthe clear day clutter data taken from the FL-2 pencil-beam site was described in Section2.C. The effective clutter reflectivity distribution was computed as follows: medianeffective clutter reflectivity within a one-km radius was computed every kilometer out to15 kilometers, and over all 256 lA-degree sectors.
This result is extremely sensitive to site selection. Figure 23b shows the groundclutter distribution generated from data taken directly from FL-3 fan-beam testbed site inHuntsville, Alabama. Comparing this distribution to that of Figure 23a, it is apparent thatthe Huntsville system was sited in a harsher clutter environment. Using this distributionin equation (1) with the Denver microburst distribution, the predicted percentage of totalmissed detections is now 16 percent, approximately 8 percent worse than with the Denversite's clutter distribution.
57

158705-3150 r---r---r---r---r---r-----,
o
100
(a)
50
enW~.~
C) 0LL0a:w 150m:E;:)Z
100
(b)
50
10 20 30 40 50 60
EFFECTIVE CLUTIER REFLECTIVITY (dBz)
Figure 23. Histograms of clutter intensity (in units of effective clutter reflectivity) for: a) Denverand b) Huntsville for range interval 0-15 km. Both distributions were computedjrom the clearday clutter maps used in the simulations and described in the text.
PercHits =
Using the two distributions above, the following equation can be evaluated:
JJf (dBZw,dBZc) PwfdBZw) PcfdBZc) MEZc MEZw] ) PwfdBZw) PcfdBZc) MBZc MEZw
(1)
where
PercHits Percentage ofdetectable microburst events
Weather reflectivity
Effective clutter reflectivity
58

PddBZc)
Probability that a microburst will have reflectivity ininterval (dBZw,dBXw + MBZw)
Probability that the clutter environment will have effectivereflectivity in interval (dBZc,dBZc + ~dBZc)
f(dB7 ,dBZc) = { 1 ifdBZw and dBZc map into the hit region (see Figure 21)
"'W 0 otherwise
Using the microburst weather reflectivity distribution of Figure 22 to approximatePw, and the Denver clutter distribution of Figure 23a to approximate Pc, equation (1) wasevaluated. The hit-miss function, f(dBZ sub W, dBZ sub C), was modelled as
where
dBZc - dBZw < Totherwise (2)
T clutter signal threshold
If T is between 18 and 20 dB as is suggested by Figure 21, then by equation (1), thepercentage of Denver microbursts missed due to ground clutter interference should be8 percent.
It must be stressed that this method does not predict a total detection probability, only thepercentage of detections eliminated through ground clutter interference. Other factors,such as microburst asymmetry, are not included in the computation. However, based onthe analysis in this report, ground clutter interference should be the dominant cause ofmissed microburst detections, so this prediction is significant.
D. FALSE ALARMS AND OTHER ISSUES
1. Scoring
While the simulation procedure was not specifically designed to assess false alarmrates, analysis of the false associations occurring in the simulated cases provides someuseful observations, applicable not only to dry events but also to ASR detection ofmicrobursts in general.
Specifically, the processed data contained numerous false associations. Table 7shows false association statistics from the simulated dry microburst cases. Anyassociation of shear segments -- clusters -- not associated with a shear region in theoriginal FL-2 horizon scan used in the simulation were counted as false. Multiple falseclusters occurring in a single scan were counted as a single false association in thisscoring. In all cases except the two-degree tilt with Huntsville clutter and defaultthresholding, false associations occurred between 18 and 45 percent of the time.Although, the tw.o-degree Huntsville cases with default thresholding produced no false
59

associations, this result should not be viewed optimistically, as Table 6 shows thedetection rate in that regime was less than 20 percent.
2. Overhanging Precipitation and the Dual-Beam Product
Overhanging precipitation was the dominant source of false associations in fourof the 11 cases. The two June 10, 1988 cases, discussed in sections A.3-4 of this chapter,are typical examples. Markedly different wind direction for near-surface winds versuswinds in the higher reflectivity anvil resulted in velocity estimates that approached thevelocity of the winds aloft. This study has shown that the subsequent false velocityestimates do not appear to be present in the region of the microburst center, where enoughprecipitation exists to counteract the vertical shear. However, the false estimates led tomany false associations outside the shear region. This effect is not isolated to drymicrobursts and has been observed in wet microburst conditions by the FL-3 system inKansas City in 1989, as well. Efforts are underway to evaluate alternate velocityestimators that may reduce the frequency of false-alarm occurrence.
The June 10, 1988 case studies discussed earlier demonstrated that the defaultsignal-to-noise and signal-to-clutter thresholds do not suffice to eliminate the observedfalse associations caused by overhanging precipitation. Recall, in the first case, that thethresholds failed to have an appreciable effect on the false associations. In the secondcase, the thresholds succeeded in filtering out the false associations but eliminated thevalid detections as well. So while a few false associations were eliminated through thisthresholding, not all were, and valid detections were lost through the same mechanismsthat eliminated the false associations. For two reasons, these results were not entirelyunexpected. First, the default thresholds were designed to eliminate false alarms due tonoise and ground clutter interference, not false alarms resulting from overhangingprecipitation. Second, the default thresholds were not optimized for dry microburstdetection.
60

Table 7.False Association Scoring Results (11 Cases)
False Associations
One-Degree Two-Degree
Clutter Processor Number Percent Number PercentSettings
None Default 3 27 0 0
NoiseThresholding 5 45 4 36
Off (NTO)
Denver Default 2 18 2 18
NTO 2 18 2 18
Huntsville Default 3 27 0 0
NTO 2 18 4 36
A number of other methods may be applied to rid the signal of false alarms. Timeassociation, which is used in the current detection algorithms, may filter many falseassociations, and nothing indicates that the technique would inhibit dry microburstdetection. However, another false alarm rejection technique, reflectivity thresholding,will most likely reject more than false alarms. Reflectivity thresholding eliminatesalarms not associated with higher reflectivity convective storm cells. Dry microburstsfrequently fallout of the anvil structure (instead of the parent cells) of convective storms.As a result, a dry microburst's reflectivity structure is often fragmented; its radarsignature does not often resemble a wet convective storm core, and thus is difficult todistinguish from other low-reflectivity precipitation. While reflectivity thresholding is animportant technique being considered for eliminating false alarms in general, its use isexpected to be incompatible with dry microburst detection.
61

4. CONCLUSION
Results from the simulation of 11 dry microbursts, with and without groundclutter contamination were presented. It was shown that neither radar sensitivity norinterference from overhanging precipitation prohibited detections of dry microbursts withshear strengths in excess of 20 m/sec. Ground clutter tended to cause missed detectionsonly when median ground clutter reflectivity in the microburst event region exceeds themicroburst's surface outflow reflectivity by greater than 17-20 dB.
These observations were used to develop a predictor of ASR microburst detectionperformance at a particular site for events lost on account of interference by groundclutter residue. In the simulations, this was the predominant cause of missed detections.When computed for Denver's Stapleton ASR, a missed detection rate of slightly less than10 percent was predicted. If all non-clutter-related causes of missed detections arenegligible, this prediction puts a Denver ASR within the TDWR specification. Thisresult is highly dependent on the ambient clutter environment of the radar's site. When aclutter distribution collected from another radar site was applied, failed detections forDenver microbursts rose to almost 20 percent, worse than allowed by the TDWRspecification. Although these results warn that inappropriate siting could be detrimentalto adequate dry microburst detection by an ASR, they are promising insofar as they donot preclude it.
The study also pointed out areas where the current microburst detection algorithmmay be improved. For example, one event occurring close to the radar was missedbecause of inadequacies in the microburst detection algorithm's capability for detectingevents at very short ranges. This problem is currently being addressed.
Also, the simulation results indicated a number of false alarms caused byinterference from overhanging precipitation in regions outside of the main stormdowndraft. These are not phenomena associated only with dry microbursts, and thusshould be a cause of concern for microburst detection in general. Improvements in thedual beam velocity product should help eliminate many false alarms. Reflectivitythresholding, while it would improve false-alarm rates, would almost certainly degradethe detection of dry microburst events.
63

REFERENCES
M. Weber and W. Moser, "A preliminary assessment of thunderstorm outflow windmeasurement with airport surveillance radars," MIT Lincoln Laboratory, Lexington, MA,Project Report ATC-140 (May, 1987).
M. Weber, "Ground clutter processing for wind measurements with airport surveillanceradars," MIT-Lincoln Laboratory, Lexington, MA, Project Report ATC-143 (November,1987). .
D. Sirmans, and W. Bumgarner, "Numerical comparison of five mean frequencyestimators," J. ofApp/. Meteoro/., vol. 14, pp. 991-1003 (September, 1975).
M. Weber, and T. Noyes, "Low-altitude wind shear detection with airport surveillanceradars: evaluation of 1987 field measurements," MIT Lincoln Laboratory, Lexington,MA, Project Report ATC-159, (August, 1988).
M. Weber, "Dual-beam autocorrelation based wind estimates from airport surveillanceradars," MIT Lincoln Laboratory, Lexington, MA, Project Report ATC-167, (June,1989).
65

APPENDIX ASYNTHESIS OF RHIs FROM PPI VOLUME SCAN DATA
This appendix describes the procedure used in generating interpolated Rills fromPPI data. At each range gate, a two-dimensional grid is set up in 8-f/J (azimuth-elevation)space. The PPI product data is laid onto the appropriate elevations. The weather product
"value for each unfilled grid point A is estimated from all N filled neighboring product
values by computing the weighted average
NIWnAn
" n=OA = -N=-=---
IWnn=O
Wn is a Cressman weighting; it is a function of sn, the distance from the unfilled gridpoint to the filled neighboring grid point, where the product value is An.
Wn =
o
2 2So +s n
a
where
So =Cressman distance parameter (degrees)
a =Cressman exponent parameter
67

The angular distance Sn is computed
where
~n == elevation separation (degrees)
en == azimuthal separation (degrees)
Figure A-I plots the Cressman weight W versus relative distance..£ for four values of a.SoAs illustrated in the graph, a higher alpha increases the relative weighting of nearby gridpoints. The Cressman distance parameter So defines the maximum range for the
interpolation. For the synthesis of RIlls from PPIs, settings of a = 4 and So = 100 werefound to provide realistic interpolated storm profiles where elevation separation betweenPPls was a few degrees or less.
1.0 ~t=:::"'"-'---"""'--"""T""-----r-"";;;;;';";';';'
0.8
0.6
0.4
02
0.2 0.4 0.6 0.8 1.0
RELATIVE DISTANCE (Sn/So)
Figure A-I. Cressman weight versus relative distance for four values of a.
68
•

However, this weighting scheme produced unrealistic estimates for values at gridpoints where the gap between PPls exceeded five degrees. It was desired that less weightbe placed on grid points azimuthally separated from the unknown value. This correctionwas implemented by applying a skewing factor k. A skewed distance sin was calculatedand used in place of sn in Equation A-I. sin was computed as follows
where
k == PPI-to-RHI skewed weighting factor
In a normal Cressman weighting, the value of k is one. A high value for k weightselevation proximity much higher than azimuthal proximity. Setting k = 10 wasempirically found to produce satisfactory interpolated RIll fields from PPls.
69