a study of current market strategies and position and an
TRANSCRIPT

A Study of Current Market Strategies and Position and an Analysis of the Market Prospects for the Export of
Australian Dairy Products to Malaysia
Submitted by
Sukumaran Bhaskaran
for
Masters of Business
Department of Hospitality and Tourism Management Faculty of Business
Victoria University of Technology
1994

FTS THESIS 582.4170994 BHA 30001004591147 Bhaskaran, Sukumaran A study of current strategies and position and c^ analysis of the market

ABSTRACT
This study analyses trends in demand for dairy products in Malaysia,
characteristics of the Australian dairy industry, the marketing strategies of
Australian dairy companies, the marketing strategies of major competitors, public
policy influencing dairy industry development in Malaysia and concludes with a
SWOT analysis of the market for dairy products in Malaysia from an Australian
perspective.
The study is based on secondary research of the dairy industry in Malaysia and
that of neighbouring countries such as Thailand and Indonesia, secondary
research on trends in food consumption in Asia, market audit of 20 food service
outlets and 20 resellers in Kuala Lumpur, primary research of 21 Australian
companies who, in aggregate, account for 90 per cent of Australia's dairy exports
to Malaysia and a case study of the 'Butter Producers Co-operative Federation', a
successful Australian exporter of branded value-added dairy products to Malaysia.
This study suggests that consumption of dairy products in Malaysia is high and
would increase. Consumption is forecast to reach 330,000 tonnes by the year
2020. As Malaysia does not have a competitive nor comparative advantage in
dairy production, ceteris paribus, increase in consumption would have to be met
through imports. It is estimated that 95 per cent of demand would be imported.
Therefore, imports are forecast to reach 315,000 tonnes in 2020.
The growth in demand for dairy products in Malaysia should provide Australian
exporters substantial opportunities. Australian dairy exports to Malaysia
averaged 30,000 tonnes annually. If Australian exports do not increase
substantially, market share in Malaysia is forecast to fall from current levels of
approximately 20 per cent to less than 10 per cent by 2020.
This study suggests that the Australian dairy industry is not appropriately
stiuctured or focussed nor has in place effective marketing strategies to maximise
opportunities in this rapidly expanding market.

TABLE OF CONTENTS
Page
SCHEDULE OF TABLES ix
SCHEDULE OF DIAGRAMS xi
1 INTRODUCTION 1
1.1 Research Interest 1
1.2 Research Background 1
1.3 Research Objectives & Benefits 6
1.3.1 Overview of Research Objectives 6 1.3.2 Specific Research Objectives 7 1.3.3 Overview of Research Benefits 9 1.3.4 Specific Research Benefits 10
1.4 Research Hypothesis 14
1.5 Research Methodology 16 1.5.1 Research Approach 16 1.5.2 Research Framework 17 1.5.3 Primary Research Methodology 18 1.5.4 Questionnaire Construction 23 1.5.5 Data Analysis Methodology 25
1.6 Limitations, Delimitations and Definitions 28 1.6.1 Limitations 28 1.6.2 Delimitations 28 1.6.3 Definitions 29
1.7 Chapter Summary 33
1.8 Overview of Thesis 34
2 LITERATURE REVIEW 36
2.1 Introduction 36 2.1.1 Chapter Objectives 36 2.1.2 Rationale 36
2.2 Chapter Outline 36
I V

Page
2.3 The food industry in Malaysia wi th particular reference to the dairy industry 37
2.4 Information on the Australian dairy industry 40
2.5 The food industry in South and South-East Asia wi th particular reference to the dairy industry 47
2.6 International marketing theory and concepts 77
2.7 Competitor's strategy and activities 85
3 THE AUSTRALIAN DAIRY INDUSTRY 86
3.1 Chapter Objectives 86
3.2 information on the Australian Dairy industry 86 3.2.1 Current Position 86
3.2.2 Threats 91
3.3 An analysis of Australian dairy industry strategies . . . . 95
3.4 Weakness of the Australian dairy industry 102
3.5 Opportunities for the Australian dairy Industry 104
3.6 Major Australian dairy product manufacturers and processors 107
4 AN OVERVIEW OF THE MARKET 109
4.1 Chapter Objective 109
4 .2 Rationale 109
4.3 Historical and Policy Background 110
4.3.1 Administrative Structure 110 4.3.2 Historical Background I l l 4.3.3 Economic and Public Policy Background 113
4 .4 The Contemporary Economic and Policy Issues 114 4.4.1 Gross National Product 114

PAGE
4.4.2 Private Consumption Expenditure 119 4.4.3 Economic Structure 121 4.4 .4 Direct Foreign Investment (DFI) 122 4.4.5 Trade Policies 123
4.5 Demography 126 4.5.1 Population 126 4.5.2 Rural-Urban Divisions 126 4.5.3 Gender Mix 129 4 .5 .4 Age Classification 129 4.5.5 Ethnic Mix 131 4.5.6 Social Indicators 131
4.6 The New Economic Policy 133 4.6.1 Policy Background 133 4.6.2 Policy Objectives 133 4.6.3 Policy Implementation 133 4.6.4 Results 134
4.7 The Distributive Trades 135
4.8 Conclusion 143
5 THE DAIRY INDUSTRY IN MALAYSIA 144
5.1 Chapter Objective 144
5.2 Domestic Cattie & Buffalo Milk Production 144
5.3 Public Policy 147
5.4 Dairy Product Consumption Trends 150
5.4.1 Milk Powder 152 5.4.2 Concentrated Milk 157 5.4.3 Liquid Milk 161 5.4.4 Yellow Fats 163 5.4.5 Cheese 167 5.4.6 Yoghurt 170 5.4.7 Ice Cream 172
5.5 Projection of Demand for Dairy Products in Malaysia . 172
5.6 Chapter Summary 182
V I
Page
CASE STUDY - NICHE MARKETING IN MALAYSIA: Butter Producers Co-Operative Federation 184
6 AUSTRALIAN EXPORT PERFORMANCE 190
6.1 Chapter Objective 190
6.2 Analysis of Export Performance 194
6.3 Analysis of Reasons for Poor Performance of Australian Exporters 194 6.3.1 Overdependence on Indirect Reseller Channels 194 6.3.2 Non Intensive Marketing 197 6.3.3 Non Focused Marketing 198 6.3.4 Overdependence on Traditional Reseller
Intermediaries 199 6.3.5 Poor Quality Market Intelligence 200 6.3.6 Lack of marketing emphasis on the Impact of
Income growth & changes In dietary habits . . 204 6.3.7 Not tailoring marketing mix to Malaysia's
unique ethnic population variables 207 6.3.8 Over emphasis on the Importance of
supermarkets as retail reseller channels . . . . 209 6.3.9 Perception of being Non Price Competitive . . 210 6.3.10 Fear of the competitive strength
of NZDB/NESTLES 215 6.3.11 Organisation Structure 215 6.3.12 Lack of Export Market Planning 216 6.3.13 No sales development plans 217
6.4 Australian Product Market Performance 218
6.5 Chapter Summary 223
7 CONCLUSION 224
7.1 Chapter objective 224
7.2 Introduction 224
7.3 Strengths 225 7.3.1 Competitive Advantage 225
V l l

PAGE
7.3.2 Comparative Advantage 226 7.3.3 Generic Differentiation 226 7.3.4 Human Resources 228 7.3.5 Market Experience 228 7.3.6 Public Sector Export Facilitation Schemes . . . 228 7.3.7 Product and Process Research
and Development Strengths 229
7.4 Weakness 230 7.4.1 Limited Product Sales Mix 230 7.4.2 Channel Intermediaries 230 7.4.3 Lack of Brand Offering 231 7.4.4 Poor Marketing Strategies 231 7.4.5 Ineffective Market Entry Strategies 232 7.4.6 Market Intelligence 233 7.4.7 Market Research 234 7.4.8 Corporate Structure & Organisation 235 7.4.9 Difficulty of Promoting Product Benefits . . . . 235
7.5 Opportunities 237 7.5.1 Competition 237 7.5.2 Customers 237 7.5.3 Substitutes 238 7.5.4 Suppliers 239 7.5.5 Positive Public Policy 239 7.5.6 Brand Elastic Demand 239 7.5.7 Social Stability 240 7.5.8 High Economic Growth Rates 240 7.5.9 Favourable Political Environment 240 7.5.10 Favourable Legal Environment 241
7.6 Threats 241 7.6.1 Subsidised Products 241 7.6.2 Economic Grouping 241 7.6.3 Dairy Substitutes 242
7.7 Chapter Summary 242
8 BIBLIOGRAPHY 243
V l l l

9 APPENDICES
PAGE
Appendix I Schedule of Companies Surveyed 260 Appendix II Questionnaire 261 Appendix III GDP per capita in Pacific Basin - selected countries
271 Appendix IV Annual World Indicator Prices for Major Dairy
Products 272 Appendix V Incidence of Poverty in West Malaysia . . . . 273 Appendix VI Retail Establishments in Malaysia 274
I X
SCHEDULE OF TABLES
Page TABLE 1: PER CAPITA CONSUMPTION OF MEAT
& DAIRY PRODUCTS IN SELECTED EAST ASIAN ECONOMIES 60
TABLE 2: FEATURES OF KEY OVERSEAS CHINESE MARKETS . . 62
TABLE 3: TRENDS IN THE AUSTRALIAN DOMESTIC
DAIRY INDUSTRY 99
TABLE 4 : MEAN HOUSEHOLD INCOMES IN WEST MALAYSIA . 117
TABLE 5: WORLD BANK SURVEY ON THE INCIDENCE OF POVERTY 118
TABLE 6: PRIVATE CONSUMPTION EXPENDITURE IN MALAYSIA 1980-1989 (MYR million) 120
TABLE 7: CONSUMER PRICE INDEX OF WEST
MALAYSIA 1986-89(%) 120
TABLE 8: MALAYSIA'S INTRA ASEAN TRADE 126
TABLE 9: OBSERVED AND PROJECTED POPULATION DATA OF MALAYSIA {'000) 128
TABLE 10: URBAN RESIDENCE BY ETHNIC GROUPS 1970 (WEST MALAYSIA) 129
TABLE 1 1 : CHANGES IN MEAN & MEDIAN AGES IN MALAYSIA 131
TABLE 12: APPARENT ANNUAL CONSUMPTION OF DAIRY PRODUCTS IN MALAYSIA 1970-89 ( '000 tonnes) . . 152
TABLE 13: REPACKED POWDERED MILK - PRODUCT MARKET SEGMENTS & MARKET SHARE (%) 155
TABLE 14: ESTIMATED ANNUAL WMP CONSUMPTION BY MARKET SEGMENTS 155
TABLE 15: TRENDS IN THE CONSUMPTION OF WMP (TONNES) 156

Page
TABLE 16: ESTIMATED ANNUAL CONSUMPTION OF CONCENTRATED MILK PRODUCT LINES 157
TABLE 17: PRODUCT LINE MARKET SHARE - CONCENTRATED MILK (% VOLUME) 161
TABLE 18: ESTIMATED MARKET SHARE OF LIQUID MILK (% VOLUME) 163
TABLE 19: CHEESE - MARKET SEGMENTS & COMPANY MARKET SHARE 170
TABLE 20: PROJECTION OF CONSUMPTION & IMPORTS OF DAIRY PRODUCTS TO MALAYSIA (tonnes) 177
TABLE 2 1 : PROJECTION OF CONSUMPTION & IMPORTS OF DAIRY PRODUCTS TO MALAYSIA (tonnes) 179
TABLE 22: AUSTRALIAN DAIRY EXPORTS TO MALAYSIA -PRODUCT MIX & MARKET SHARE (tonnes) 191
TABLE 23 : AUSTRALIAN DAIRY PRODUCT EXPORTS TO MALAYSIA - TYPES OF RESELLER CHANNELS 195
TABLE 24: AUSTRALIAN DAIRY PRODUCT EXPORTS TO MALAYSIA - INTENSITY OF MARKET COVERAGE . . 198
TABLE 25: AUSTRALIAN DAIRY PRODUCT EXPORTS TO MALAYSIA - HISTORY OF RELATIONSHIP WITH RESELLERS 200
TABLE 26: MEAN SCORES OF THE IMPORTANCE OF RESELLERS AS A SOURCE OF MARKET INFORMATION 202
TABLE 27: MEASURE OF THE IMPORTANCE IN INCOME & DIETARY CHANGES BY EXPORTERS USING DIFFERENT CHANNEL INTERMEDIARIES 204
TABLE 28: MEAN DIFFERENCES OF VARIABLE BY INTERMEDIARY 210
TABLE 29: AUSTRALIAN DAIRY PRODUCT EXPORTS TO MALAYSIA 212
TABLE 30: RANKING OF MARKET POTENTIAL & FORECAST OF EXPORT GROWTH 213
x i

DIAGRAM 1:
DIAGRAM 2:
DIAGRAM 3:
DIAGRAM 4:
DIAGRAM 5:
DIAGRAM 6:
DIAGRAM 7:
DIAGRAM 8:
DIAGRAM 9:
DIAGRAM 10:
SCHEDULE OF DIAGRAMS
Page
AUSTRALIAN DAIRY EXPORTS TO MALAYSIA . . 5
SCHEMATIC ILLUSTRATION OF RESEARCH AREA 7
VENN DIAGRAM ILLUSTRATING THE INTERACTION OF VARIABLES 27
PER CAPITA CONSUMPTION OF MEAT AND DAIRY PRODUCTS IN SELECTED EAST ASIAN COUNTRIES 64
POPULATION GROWTH TRENDS IN MALAYSIA 127
AGE CLASS OF MALAYSIAN POPULATION IN 1991 130
DAIRY PRODUCT CONSUMPTION TRENDS . . . 153
IMPORTANCE OF INCOME AND DIETARY CHANGES ON DAIRY PRODUCTS DEMAND . . 205
INTERMEDIARY USED AND FORECASTS OF MARKET POTENTIAL & EXPORT GROWTH . . . 214
DAIRY PRODUCT POSITIONING IN MALAYSIA MODELLED ON THE BCG GROWTH-SHARE MATRIX 222
XII

CHAPTER ONE
1 INTRODUCTION
1.1 Research Interest
The researcher's interest in this subject is a result of his background and
experience in the marketing of branded food products in the wholesale,
retail and food service market segments in Malaysia.
1.2 Research Background
This research commenced with an extensive literature survey. This
provided limited information on the research topic. Isolated empirical
studies on the marketing of Australian dairy products to Malaysia were
available, but generally there is a lack of signiticant empirical research in
this area\
There are, however, many reports on the need for and the potential in
developing exports of food products to South-East Asia. The
geographical proximity, rapid economic growth in these countries,
excellent networks in South East Asia developed through Australia being
the premier choice for tertiary education and migration for South-East
Asians, and the Westernisation of dietary habits have been explained as
Refer Chapter 2 for further discussion on this.

2
contributing to the impressive growth in Australian exports to South East
Asia^.
Member of the Association of South East Asian Nations (ASEAN),
particularly Thailand, Malaysia, Singapore, Brunei and Indonesia are
mentioned as important export destinations for Australian goods and
services. For example, the Department of Foreign Affairs and Trade and
Austrade report:
Our exports to ASEAN now exceed those to the USA and also Europe. Exports to South-East Asia are rising more quickly than to any other part of the world^.
However, in at least some of these countries such as Malaysia,
Australia's market share of merchandise exports has declined steadily.
Concurrent with the rapid economic growth in Malaysia, imports
increased by an average of 30.4 per cent per annum in the period 1987-
91* . However, Australian exports to Malaysia in 1987-91 increased
only by an average of 22.2 per cent per annum resulting in the market
share of Australian merchandise exports to Malaysia declining by 0.9 per
East Asia Analytical Unit 1992a, Australia's Business Challenge: South-East Asia in the 1990's. Department of Foreign Affairs and Trade and Austrade, Australian Government Publishing Service, Canberra 1992 p. xix.
Idem.
Ibid., p. 109.

3
cent per annum. In 1992 Australia's share of merchandise imports by
Malaysia was only 3.2 per cent^.
Australia has been an important source of food imports into Malaysia. In
1991, Australia was the source of 22 per cent of food imports by
Malaysia. However, Australia's market share in food imports by
Malaysia has declined steadily through having lost market share in
exports of beef to Argentina and India and in the exports of horticultural
products to United States, New Zealand and Pakistan. As such, even
non traditional trading partners, less developed economies, countries
without close geographical proximity, and countries without significant
migrant and education links to Malaysia are displacing Australia's market
position in Malaysia®.
Dairy products continue to be an important Australian export to
Malaysia. However, even in dairy products Australia's market share in
total imports into Malaysia has declined. The major dairy product
imported by Malaysia is milk powder. In 1986, Malaysia imported
Ibid., pp. 107, 109.
United Nations Industrial Development Organisation, Malavsia. sustaining the industrial investment momentum. Austria 1991, p. 39 citing Bank Negara Malaysia Quarterly Bulletin (various issues).
Note: Imports from Australia as a percentage of total imports by Malaysia has progressively declined from 4.2 % in 1983 to 3.8% in 1989. Imports from other sources increased from 20.8% in 1983 to 21.4% in 1989.
Economic Research Department (United Malayan Banking Corporation), Kuala Lumpur 1991, p. 16 citing Department of Statistics, External Trade Statistics (various issues).

4
73,500 tonnes of milk powder. Of this 28,900 tonnes or 34.5 per cent
came from Australia. By 1991 Malaysia's import of milk powder was
estimated to have increased to 98,000 tonnes, imports from Australia
declined to 24,400 tonnes i.e. Australia's market share declined to 24.9
per cent'. The trend in Australia's dairy product export to Malaysia is
illustrated in Diagram 1.
The dairy industry in Australia has argued that subsidised exports from
the European Community (EC) and the United States of America (US)
has displaced Australian dairy exports in the international market. For
example, in a recent presentation a senior spokesperson from the
Australian Dairy Corporation analysed the international dairy market
conditions as follows:
The international dairy market is dominated by the production and trade policies of major OECD countries. The majority of these countries provide considerable protection and support to their indigenous dairy industries ... Of the major suppliers to the market, only Australia and New Zealand operate dairy policies whereby farm gate prices are linked to international market prices ...^
Australian Dairy Corporation 1992 (a). Dairy Compendium 1992. pp. 58, 59 & 70.
Lacey, Rick; 'International Dairy Market Outlook', Shepparton Regional Outlook Conference, 3 October 1990 p. 1.

5
s
- J
i
0) c c o
o o o o
o o o o CO
o o o o CNJ
o o o o
<D
a)
O
_ j
< 1-o h-
II • D ^ O Q. ^
^ 0) o §
•
1 _
0 • D ^ O
CL J!^
S E
. ^ CO
"(5 LL ^
^ (0 13
o • D > .
•C
c <
#
L_
3 CD
ffl:i:

6
However, this argument does not explain the poor performance of
Australian dairy exports to Malaysia. The most apparent loss in the
market share of Australian dairy exports to Malaysia was to imports
from New Zealand, which according to the commentator did not distort
markets through subsidised exports.
This research is a result of the researcher's experience in Malaysia and
preliminary secondary research which contradicted observations and
reports by Australian industry commentators regarding opportunities and
threats in the international market place. The researcher concluded that
detailed research was needed to increase awareness of market
conditions and to develop greater understanding of the export market
prospects for dairy products to Malaysia.
1.3 Research Objectives & Benefits
1.3.1 Overview of Research Objectives
The broad objectives of this research are to evaluate the market
potential for the export of value-added dairy products to the consumer
and food service market segments in Malaysia, compare the market
entry and operations strategies of successful dairy companies operating
in Malaysia and analyse the strengths, weakness, opportunities and
threats that characterise Malaysia as a market for the Australian dairy
industry. The research area is illustrated in Diagram 2.

DIAGRAM 2: SCHEMA TIC ILLUSTRA TION OF RESEARCH AREA
Industrial
Consumer Food Service Exports Public Policy
K!j.^P»^^^SpP^^»^i-'^ " ' * : ^ " - : * " ' » ^ y * ^ ^ ^ • ^ ^ • » ' ^
;;Prtrtr? con>•/<•(» :?;•
lifimestic iiWiP
Legend:
Areas covered by research
1.3.2 Specific Research Objectives
The specific research objectives are to:
a) outiine economic characteristics and trends in Malaysia that are
perceived to influence market entry and operations in Malaysia.
These will include data on gross domestic product (current and
growth trends), per capita gross domestic product, inflation,
employment levels, investment levels, pace of industrialisation,
income distribution, stability of currency and foreign reserves^
Cooke, Ian M; Overseas Marke.tinp from Australia. Queensland Business Magazines C.Ltd.,
Australia 1991, pp. 45-46.

8
b) examine the public policy and legal environment regulating market
entry and operations of the dairy industry in Malaysia and evaluate
the impact that these policies can have on the export of Australian
dairy products^". This will include researching the legislation and
rules regulating packaging, promotion and sales, foreign
ownership of corporat ions, . laws regulating contractual
agreements, patents and the employment of expatriates.
c) compare the market entry and operations strategy of Australian
dairy exporters with that of major competitors. This will involve a
comparative study of the marketing mix (product, pricing,
promotion and distribution) strategies used by Australian dairy
exporters wi th that of major competitors and analysing the priority
of major Australian dairy companies in promoting exports to
Malaysia.
d) analyse current consumer market features, characteristics and the
consumption trends of dairy and dairy substitute products in
Malaysia in different sub markets such as age groups, ethnic
groups, rural/urban sectors and income groups and analyse the
impact that the changes in these sub markets can have on the
export potential of Australian dairy products to Malaysia. This will
include determining the attitude to the consumption of dairy
10 Ibid., pp. 46-47.

9
products, cultural taboos such as product/packaging colour,
aesthetic design, packaging format, linguistic problems and the
cultural influence on business etiquette and social custom in the
different sub markets^\
e) forecast the growth in demand for dairy products in Malaysia up
to the year 2020.
1.3.3 Overview of Research Benefits
Not withstanding limitations because of funding constraints which
restricted the survey of consumers and manufacturers in Malaysia, this
is a comprehensive research document that is expected to be of value to
Australian food marketeers particularly dairy exporters to Malaysia.
This research will provide general insight on food production and
consumption in South and South East Asia. This will be beneticial in
public sector decision making on the use of scarce export promotion and
industry assistance funding. There is a proliferation of industry training
and assistance packages such as the Food Industries Networking for
Asia Exports Program funded by the Department of Industry, Technology
and Regional Development, Australian Awards for Research in Asia
funded by the Department of Employment, Education and Training,
" Ibid., p. 45.

10
Private Sector Linkages Program tinanced by Australian International
Development Aid Bureau and programs such as the Innovative
Agricultural Marketing Grant financed by the Department of Foreign
Trade and Austrade.
1.3.4 Specific Research Benefits
The specific benefits of this research can be summarised as the:
a) provision of detailed market information to Australian exporters of
dairy products to Malaysia i.e. information on product and brand
market share, competitors activities and the extent and nature of
threats from dairy substitute products. This research provides a
framework to Australian food product exporters on the type of
market information that should be collated for developing effective
market entry and operations strategy. This research expects to
set a benchmark in Australia for research on export marketing of
food products.
b) provision of information on socio-cultural factors that influence
consumption of dairy products in Malaysia. The research will
identify traditional markets where sales may not have been
maximised, identify niche markets, identify new growth markets
and recommend appropriate channel and marketing mix

11
strategies'^. The researcher perceives that Australian dairy
companies are over-dependent on importers, AUSTRADE and
perceptions of the market formed through the media for
information used in shaping market strategies. It seems that
comprehensive market research has not been carried out.
c) provision of data that is objective. The impact of culture in both
the corporate environment and in everyday purchase decisions in
Malaysia is not well understood. To use an analogy by Harris and
Moran in their book Managing Cultural Differences, "culture is an
iceberg -only part of it is seen, but most of it is not'^^.
Traditional information sources are perceived to have limitations
because of a lack of in-depth understanding of the market and in
some instances because of vested interest that may have
influenced feedback of information'*.
d) identitication of tariff and non-tariff barriers that may restrict the
export of Australian dairy products to Malaysia. This will be
valuable information to the public sector, dairy industry
12
13
14
Refer Section 4.5-4.13 and Case Study.
Harris, Philip R, and Moran, Robert T; Managing Cultural Differences (3 Edition), Gulf Publishing Company, USA 1991.
These are discussed in section 6.3. In particular sections 6.3.1, 6.3.5 and 6.3.9 highlight the weakness in the collation of market intelligence by Australian dairy product exporters.

15
16
17
12
associations and public corporations whose role is to advise and
negotiate fairer trade conditions and fund export market
development of Australian food products. There are signiticant
differences in the customs, culture and values between the three
dominant ethnic communities (Malays, Chinese and Indians) who
live in Malaysia. These differences have been known to intiuence
public sector import regulations'^. The Malaysian Government,
for example, does not permit the transhipment of meat such as
beef and lamb through Singapore on the argument that it may
have been stored with meat such as pork which cannot be
consumed by Muslims'^. This can be interpreted as
cultural/religious concerns regarding the handling of food products
in largely non-Muslim Singapore or it can also be interpreted as an
extension of Malaysian policies aimed at developing direct trade
relations with countries and/or other national socio-economic
policies. Detailed understanding of the market is needed to
identify barriers such as these which may restrict the marketing of
dairy products in Malaysia'^.
Refer section 4.4.5 for discussions on some of these issues.
Based on market knowledge of the researcher.
The interventionist role of the Malaysian Government in the food industry are discussed in detail in sections 4.4, 4.5 and 4.6, while the case study in Chapter 5 will highlight the significance of religious and ethnic differences in marketing food products in Malaysia.

13
e) provision of information that can be used by Australian exporters
of dairy products to develop and improve marketing strategies and
tactics in Malaysia. Some of the industry initiated market
research in Australia seems to be intiuenced by interest groups
seeking a protected market or export subsidies, or they rely too
heavily on information from reseller channels in Malaysia who
have their own interests to protect when providing information to
their suppliers in Australia. Market information in such instances
are observed as being biased and self-serving'^.
f) provision of information to the Victorian Government which is
keen on developing the food manufacturing sector in the State'^.
Victoria produces approximately 90 per cent of all manufactured
dairy products in Australia^". Collating market intelligence on the
export potential and strategies for manufactured dairy products
will be of particular benefit to State Government Departments
such as the Office of Trade and Investment.
18
19
20
Refer Section 2.4 and 6.3.
Office of the Premier of Victoria, 'Food Victoria to drive export growth', July 29 1993, Melbourne pp. 1-2.
Australian Dairy Corporation 1992 (a), op. cit.. p. 8.

14
1.4 Research Hypothesis
a) Australian dairy companies are dependent on indirect reseller
marketing channels such as export agents and merchants in
Malaysia, and channel intermediaries in Singapore for export
marketing to Malaysia.
b) Australian dairy exporters who have resellers (importers,
distributors, agents) representing them in Malaysia and Singapore,
have less than two resellers representing them for the whole
market. This inhibits intensive market coverage.
c) Australian dairy exporters do not have specific sale territories
designated for resellers and this inhibits the development of
intensive market coverage of different geographical markets in
Malaysia.
d) Australian dairy exporters do not have specitic end user segments
such as retail, wholesale or food service segments designated for
their resellers and this inhibits specialist coverage of end user
market segments.
e) Australian dairy exporters appointed their present resellers in
Malaysia more than 15 years ago and have not reviewed their
15
distribution strategies to meet the changes in the socio-economic
and political environment in Malaysia.
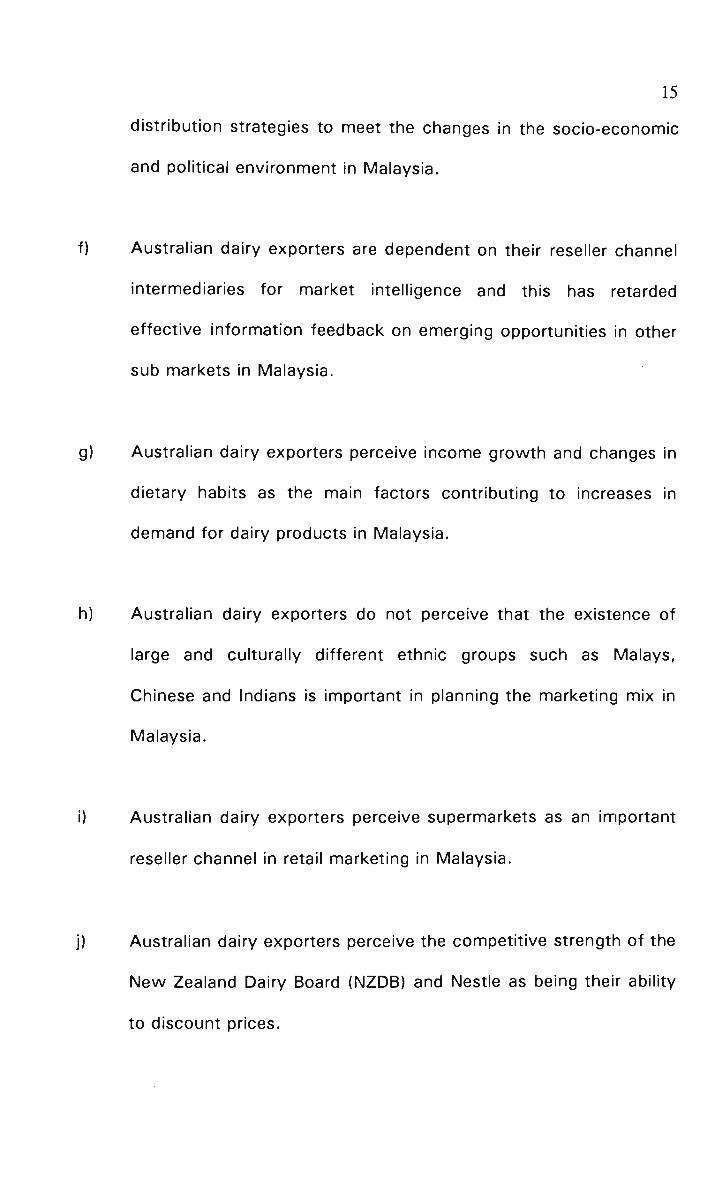
f) Australian dairy exporters are dependent on their reseller channel
intermediaries for market intelligence and this has retarded
effective information feedback on emerging opportunities in other
sub markets in Malaysia.
g) Australian dairy exporters perceive income growth and changes in
dietary habits as the main factors contributing to increases in
demand for dairy products in Malaysia.
h) Australian dairy exporters do not perceive that the existence of
large and culturally different ethnic groups such as Malays,
Chinese and Indians is important in planning the marketing mix in
Malaysia.
i) Australian dairy exporters perceive supermarkets as an important
reseller channel in retail marketing in Malaysia.
j) Australian dairy exporters perceive the competitive strength of the
New Zealand Dairy Board (NZDB) and Nestle as being their ability
to discount prices.

16
k) Australian dairy exporters perceive limitations in the Malaysian
market because of the competitive strength of Nestles and NZDB.
I) Australian dairy companies do not have an International Marketing
Department to collate market information and develop strategic
export market plans.
m) Australian dairy companies do not have separate market specific
managers to specialise and develop export markets in specitic
geographical markets such as Malaysia.
n) Australian dairy companies do not have annual and long term
plans for export market development.
o) Australian dairy companies do not have plans to aggressively
develop sales in Malaysia.
1.5 Research Methodology
The research methodology used is based on the information needs that
have been identitied in the research objectives.
1.5.1 Research Approach
This research commenced as an exploratory study. An exploratory
study is 'undertaken when we do not know much about the situation at

17
hand, or we have no information on how similar problems or research
issues have been solved in the past'^\
1.5.2 Research Frame work
The overall structure of this research is as follows:
a) Preliminary information gathering by way of desk research.
b) Postulating research hypothesis based on secondary data and
background information on market experience.
c) Secondary research through literature search and review.
d) Primary research through administering questionnaires to collate
information on Australian exporters and dairy product
manufacturers.
e) Field audit in Malaysia of reseller channels and food service
outlets.
f) Case study of a successful Australian exporter as evidenced from
preliminary research. The case study was based on secondary
data, field interviews and close collaborative work with the
company to understand its market entry and marketing mix
strategies.
g) Testing primary research data through quantitative data analysis,
h) Evaluating and summarising research findings.
21 Sekaran, Uma; Research Methods for Business (Second Edition), John Wiley, USA 1992, p. 95.

18
1.5.3 Primary Research Methodolog y
The survey of Australian industry was conducted through purposive
samples, that is the survey was contined to the most important
exporters^^. The respondents in the survey account for more than 90
per cent of the total value of Australian dairy exports to Malaysia. The
companies surveyed are shown in Appendix 1. These companies were
selected based on information in Section 3.6 i.e. information from
Australia's major dairy processing companies^^. Some of the dairy
processors and manufacturers did not export their products directly. As
such, the survey questionnaires were also administered on major dairy
trading companies in Australia who handled export sales for dairy
processors and manufacturers.
The research questionnaire was modelled on the questionnaire developed
by Hooley and Lynch^'* and the adaptations of this by Lai W.B. et al^^.
The questionnaire includes questions on channel market strategies used
22
23
24
25
Weisberg, F. Herbert, Krosnick, A. Jon, and Bowen D. Bruce; An Introduction to Survey Research and Data Analysis (Second Edition), Scott, Foresman and Company, USA 1989, pp. 32-33.
Twenty one exporters were surveyed. Some manufacturers do not export directly but handle exports through agents. The companies surveyed include the principal agents of the top twenty Australian dairy processors identified in the last page of this Chapter.
Hooley, G.J. and Lynch,J.E., 'Marketing Lessons from the UK's High-flying Companies', Journal of Marketing Management. Vol.1 No.l, 1985.
Lai, W.B., Huang, J.Y., Hooley, Graham., Lynch, Jim., Yau, Oliver; 'Effective Marketing in Taiwan: Profiles of the Top Performers', European Journal of Marketing. Vol. 26, No. 3, 1992, pp. 7-17.

19
by the industry. For this purpose, the study by Chan T.S. ® was used
as a model. A sample questionnaire is contained in Appendix 2. The
questionnaire was designed to collate information on:
a) Marketing attitudes (Questions 3, 5, 17, 18, 19, 20 & 21).
b) Corporate strategy (Questions 22, 23, 24, 25 & 26).
c) Marketing strategies (Questions 4, 6, 7, 8, 9, 10, 11, 12, 13, 14,
15 & 16).
d) Performance measurement (Question 1 & 2).
The purpose of the survey on channel strategies was to examine the
relationship between organisational attitudes in relation to the
organisation for and the execution of marketing effort. Variables such as
the directness and intensity of export channels and export performance
were examined. Channel directness represents a measure of the
utilisation of direct versus indirect channel intermediaries, and export
performance indicates the manufacturer's export sales volume^^ or the
share of exports to the total production of the tirm. At one extreme,
direct exporting results when the manufacturer performs the bulk of the
export channel functions itself through an export department in Australia
or sales subsidiaries in Malaysia. At the other extreme, indirect
^ Chan T.S., 'Emerging Trends in Export Channel Strategy: An Investigation of Hong Kong
and Singaporean Firms', European Journal of Marketing. Vol. 26, No. 3., 1992.
'^ Idem.

20
exporting occurs when the manufacturer's products are sold in Malaysia
but no special activity for exporting is carried out within the tirm. The
key issues investigated were:
a) Direct Exporting/Indirect Exporting (Number of companies, export
performance).
b) Channel intermediaries used (Australian based agents, tirms own
export department, Malaysian based agents, Malaysian based merchants
and Malaysian based sales oftices/subsidiaries).
The inter relationships between the directness and intensity of export
channel structure and export performance were tested using the
Spearman's Correlation Analysis. The Spearman's Correlation Analysis
shows how two variables that are rank-ordered are associated.
Responses to interviews in the primary research were rank ordered using
a Likert type scale i.e. the responses were ranked on a scale ranging
from ' 0 ' to '5 ' . The Spearman's Correlation shows the direction,
strength and significance of the relationship among the variables
tested^°.
The categorisation of channel directness was based on weights (with a
range of 1 to 6) assigned to the six types of channel structures identitied
28 Sekaran, op. cit.. pp. 264-266.
Weisberg, op. cit.. pp. 229-230.

21
in this study. The use of Australian based buyers/buying agents was the
most indirect type carrying the weight of 1, tirm's own export
department, foreign based agents, foreign based merchants, with tirms's
foreign sales offices/subsidiaries rounding up the list with a weight of 6.
Channel intensity refers to the total number of export channel
intermediaries used.
Export performance was measured by the annual export sales volume^^
for Australian based companies to Malaysia. Where this was not
available, the company's export as a percentage of its total production
was used to measure export performance.
Primary research was completed through face to face or telephone
interviews with dairy industry and trade executives in Australia. The
questionnaires were posted to the Chief Executive or the executive
responsible for exports. Subsequently appointments were made for
interviews with executives as directed in the course of follow up phone
calls. The response to the survey was excellent in that all twenty one
companies returned completed questionnaires. However, many
companies omitted some sections of the questionnaire either on grounds
of contidentiality or on grounds that they did not have sufficient
information to complete these sections. The survey is an important part
29 Chan, OP. cit.. pp. 20-21.

22
of this research because of the limitations and quality of secondary data.
Market audit of twenty reseller channels and twenty food service outlets
in the Kelang Valley of Kuala Lumpur (Malaysia) was carried out by a
Research Assistant to collate information in Malaysia. The market audits
were unstructured and involved checking on product and brand ranging
and tinding explanations for using or selling certain brands or products.
The market audits involved tinding information on the following:
a) Brands of full cream concentrated milk stocked in retail outlets
and the principal brands as evidenced by shelf space allocated for
the brands.
b) Brands of liquid milk stocked and the shelf space allocated for
liquid milk.
c) Brands of butter stocked and the shelf space allocated for butter.
d) Brands of margarine and the shelf space allocated for margarine.
e) Brands of tilled concentrated milk used in coffee stalls and coffee
shops.
The sample size for the market audit was small relative to the large
numbers of resellers and food-service outlets in the Kelang valley. The
main purpose of the audit was to check information from secondary
sources. As such, the tindings of the market audit are used selectively
and with qualitications.
23
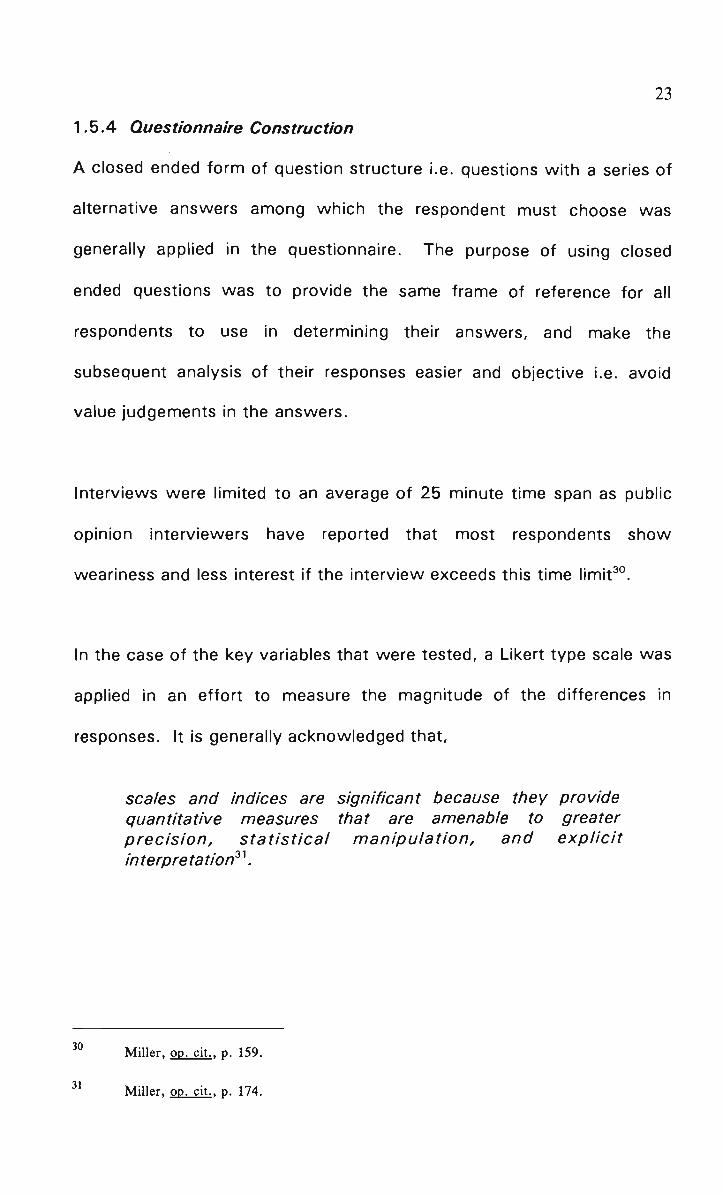
1,5.4 Questionnaire Construction
A closed ended form of question structure i.e. questions with a series of
alternative answers among which the respondent must choose was
generally applied in the questionnaire. The purpose of using closed
ended questions was to provide the same frame of reference for all
respondents to use in determining their answers, and make the
subsequent analysis of their responses easier and objective i.e. avoid
value judgements in the answers.
Interviews were limited to an average of 25 minute time span as public
opinion interviewers have reported that most respondents show
weariness and less interest if the interview exceeds this time limit^°.
In the case of the key variables that were tested, a Likert type scale was
applied in an effort to measure the magnitude of the differences in
responses. It is generally acknowledged that.
scales and indices are significant because they provide quantitative measures that are amenable to greater precision, statistical manipulation, and explicit interpretation^^.
30
31
Miller, op. cit.. p. 159.
Miller, op. cit.. p. 174.

24
The primary consideration was to see that the scale had the qualities of
validity, reliability, and utility in that order of priority^^.
Rating scales seek to obtain an evaluation or a quantitative judgement of
personality, group or institutional characteristics based upon personal
judgements. It can be used to evaluate attitudes, values, norms, social
activities and social structural features". The basis of constructing the
scales is logical inference, and the use of the numerical scale is based on
the assumption of a psychological continuity that the respondents can
realistically act upon in rating their choices^*. Respondents were asked
to rank in order their preferred choice among a list of alternative choices.
In ranking, no more than six choices were provided since there is
evidence from various psychological research that respondents have
difticulty in reliably making more than seven distinctions^^.
In constructing a rating scale, the following recommended guidelines
have been strictly adhered to' '^
a) The continuum to be measured is divided into an optimal number, in this case six (6), of scale divisions.
^^ Idem.
" Ib i i , p. 179.
^ Ibid., p. 175.
35 Weisberg, op. cit.. p. 65.
^ Miller, op. cit.. pp. 179-180.

25
b) There should be no breaks or divisions in the continuum. c) The positive and negative poles should be alternated. d) Each trait is Introduced with a question to which the rater can
give an answer. e) Descriptive adjectives or phrases are used to define different
points on the continuum. f) The probable extremes of the traits to be found In the group in
which the scales are to be used are investigated in advance. g) Only universally understood descriptive terms should be used. h) The end phrases should not be so extreme in meaning as to be
avoided by the raters. I) Descriptive phrases need not be evenly spaced, j) During pretesting, the investigator asks respondents to raise any
questions they have about the ratings and the different points on the continuum if they are unclear,
k) To score, assigned numerical values are used.
A common problem with questionnaire construction is the wording of
questions. Considerable effort was made to ensure that standard
terminology was used when it could be ascertained and the
questionnaires were pre-tested on students at Victoria University of
Technology for interpretation before they were used in the survey.
1.5.5 Data Analysis Methodology
The analysis of the survey data is both descriptive and explanatory. The
descriptive analysis is by way of univariate and bivariate descriptions^^.
Univariate descriptions employ frequency distributions, central tendency
such as median and mode, variability, percentages and cumulative
percentages. To explain the findings more clearly various graphical tools
including bar charts, pie charts and graphs are used.
" Ibidi, p- 296.

26
The bivariate description use statistical methods such as contingency
table analysis, correlation and regression analysis.
The survey results were also used to test whether there are causal
explanations between variables. Casual explanations (one thing is the
cause of another) may be said to exist if " a change in the first produces
a change in the second'^^. "Causal hypotheses usually posit
relationship between variables'^^. For example, the hypotheses
regarding success in the market place is the dependent variable. The
analysis involved establishing a relationship of this to a number of
independent variables and moderating variables such as the ownership of
the company (Australian/muiti national company), pro active/reactive
marketing and directness of channel strategy).
A number of independent variables were explored as it is likely that a
number of causes will work simultaneously to cause a particular result in
the dependent variable. The inter relationship of dependent, independent
and moderating variables are illustrated in Diagram 3. In research
methods it is common to analyse casual processes rather than single
causes. In testing causal processes the variables must pass four
tests*°. These are.
38 Weisberg, op. cit.. p. 139.
Idem.
''° Ibid^, pp. 142-144.
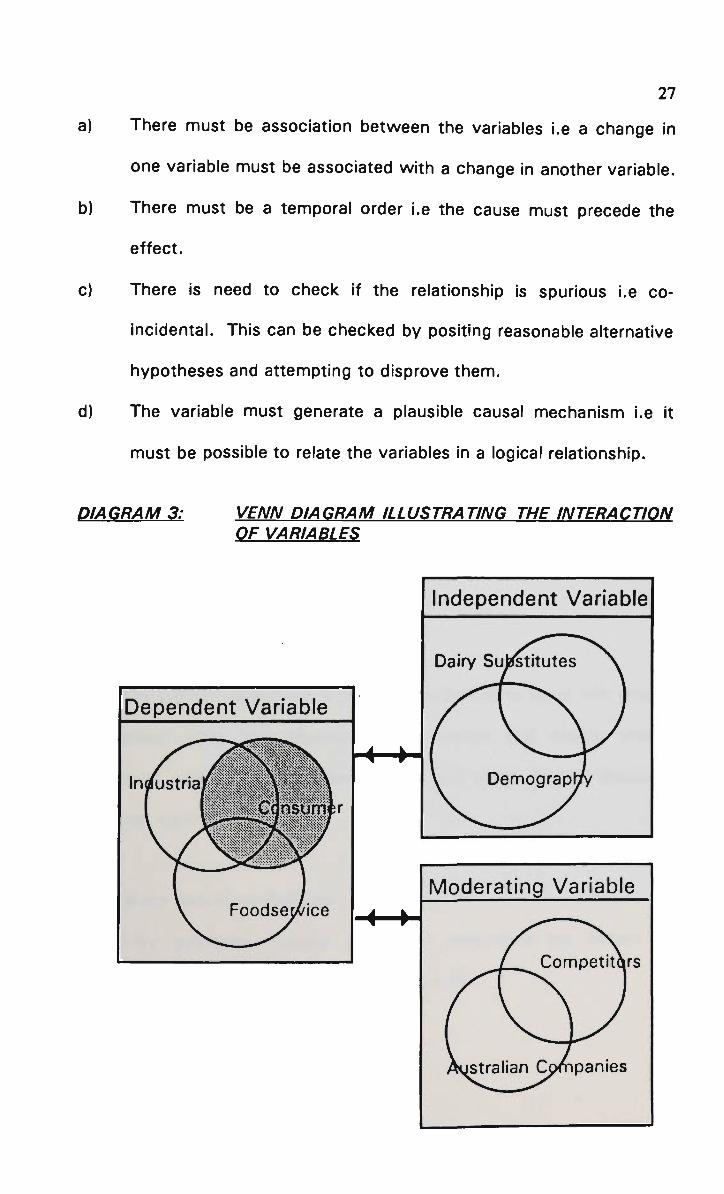
27
a) There must be association between the variables i.e a change in
one variable must be associated with a change in another variable.
b) There must be a temporal order i.e the cause must precede the
effect.
c) There is need to check if the relationship is spurious i.e co
incidental. This can be checked by positing reasonable alternative
hypotheses and attempting to disprove them,
d) The variable must generate a plausible causal mechanism i.e it
must be possible to relate the variables In a logical relationship.
DIAGRAM 3: VENN DIAGRAM ILLUSTRATING THE INTERACTION OF VARIABLES
Dependent Variable
Indfustria
nstim#r
• 4 — • •
- 4 — • •
Independent Variable
Dairy SujKtitutes
Moderating Variable
panies

28
1.6 Limitations, Delimitations and Definitions
1.6.1 Limitations
A consumer survey measuring the prevalence of attitudes, beliefs and
behaviours and changes in these over time and characteristics in
different market segments'*' would have contributed substantially to
the information base. Unfortunately, funding limitations prevented the
researcher from completing a comprehensive consumer market research.
A rough audit of reseller channels and food service outlets was done to
verify secondary data where this seemed contradictory to the market
experience of the researcher.
1.6.2 Delimitations
a) Dairy Products
The dairy product categories researched are limited to liquid milk (fresh,
pasteurised, ultra heat treated), milk powders (full cream, skim),
condensed milk (full cream, filled) butter and butter blends, cheeses,
yoghurts, ice cream and ghee.
b) Dairy Substitute Products
The dairy substitute product categories researched are limited to
margarine, vanaspathi, soya milk, and soya curd.
"' IbidL, p. 136.

29
1.6.3 Definitions
a) Market Size
Market size is detined as the total sales either in nominal (dollar) values,
weight or units that constitute the present or potential sales volume of a
product or group of products.
b) Market Share
The share of products from a source, say Australia or a defined company
to the total sales volume or value of a group of products or a product
category.
c) Marketing Strategies
Marketing strategies are detined as the market entry and marketing mix
strategies and tactics.
d) Market Entry
The market entry strategies will include an evaluation of how the
industry goes about exporting. Both direct exporting and indirect
exporting will be investigated.

30
e) Direct Exporting
Direct exporting includes such entry strategies as appointing a Malaysian
distributor, an agent or the company undertaking its own marketing in
Malaysia through a marketing subsidiary*^.
f) Indirect Exporting
Indirect exporting is a market entry mechanism where the company's
products are sold in the overseas markets but no special activity is
carried on within the company to facilitate this*^. In indirect exporting,
the sale mechanism is similar to a domestic sale. Foreign market access
is through an Australian based trading company, an export management
company or an export trading company or piggy backing.
g) Direct Foreign Investment
Direct foreign investment (DFI) constitute activities such as contract
manufacturing, licensing, joint venture and establishing wholly owned
manufacturing units in Malaysia.
42
43
Cooke, op. cit.. p. 16.
Terpstra, Vern and Sarathy, Ravi; International Marketing (Fifth Edition), The Dryden Press, USA 1991, p. 367.
Cook, op. cit.. p. 15.

31
h) Overseas Marketing
This is detined as the business activities performed to direct the
movement of goods and services from producer to consumer or user in
the overseas market**.
i) Marketing Mix
The marketing mix strategies will consist of product, price, place and
promotional plan and program mixes employed to achieve product
market objectives.
j) Industry
An industry is defined as a group of companies offering products or
services that are close substitutes of each other*^. In this research the
dairy products industry will include all manufacturers of products using
dairy raw materials.
k) Successful Market Entry
A successful market entry and operations strategy is assumed to retiect
one or more of the following characteristics:
Cook, op. cit.. p. 6.
* Hill, Charles W.L. and Jones, Gareth R; Strategic Management. An Integrated Approach (Second Edition), Houghton Mifflin Company, Boston, USA 1992.

32
i) Increasing sales volume of the proprietary brands of
Australian dairy product companies,
ii) Increasing sales volume of non traditional products such as
cheese and yoghurt,
iii) Dominant market share in some product categories,
iv) Increasing total export volumes of Australian dairy
products.
I) Industrial Market Segment
The industrial market segment constitute markets such as ice cream
factories, milk powder repacking and re-constituting plants, bakeries,
confectionaries and biscuit factories who purchase dairy products for
use as raw materials for purposes of producing a different end product.
The industrial market is largely a purchaser of bulk commodities like
butter oil, whey powder, full cream milk powder and skim milk powder.
m) Food Service Market Segment
The food service segment is made up of catering establishments such as
food stalls, hotels, fast food chains, restaurants and airlines. This
segment will purchase both bulk products for use as ingredients for the
preparation of meals, and portion packs of product lines for the table.
Examples of dairy products used by the food service segment include
the purchase of bulk Cheddar cheese by fast food chains, and yellow
fats by restaurants for cooking. Many food service outlets such as
33
hotels and airlines also purchase portion packs of dairy products such as
cheese and butter.
n) Consumer Market Segment
The consumer market segment is made up of retail outlets such as
supermarkets and grocery stores. Consumer products may be exported
in their original form from Australia or may be contract packed in
overseas factories but branded as proprietary brands belonging to
Australian companies. The consumer market is the end user market and
the purchase decisions of this segment is influenced by a range of socio
economic and cultural factors such as the demographic and income
protile of the sub markets.
o) Currency
For the purpose of comparative analysis, currency values have been
converted to Australian denominations. The exchange rates used are:
United States Dollar (US $) 1 = Australian Dollar (A$) 0.69
Malaysian Ringgit (MR $) 1 = Australian Dollar (A$) 1.79
1.7 Chapter Summary
Chapter one traced,
a) The rationale for this research and the export market performance
of Australian food products generally.

34
b) Highlighted market failures in key dairy product line export
performance and anomalies in the observed conditions in the
market place and the explanations offered by the Australian dairy
product industry.
c) Developed hypotheses and explained research and data analysis
methodology.
1.8 Overview of Thesis
CHAPTER 2 reviews texts, industry reports, journals and periodicals that
were used in the secondary research. Critical analysis is made on the
comments and tindings of these secondary sources.
Chapter 3 discusses the existing conditions in the Australian dairy
products industry. The objective of this chapter is to develop a broad
picture of the organisation of the dairy industry and the major dairy
product companies in Australia.
CHAPTER 4 discusses the Malaysian economy, public policy as it relates
to the export marketing of dairy products and the socio cultural
characteristics in Malaysia that are perceived to intiuence the demand
for dairy products.
CHAPTER 5 develops a detailed analysis of the dairy industry in Malaysia
and forecasts demand for dairy products.

35
CHAPTER 6 analyses Australian dairy product export performance to
Malaysia, and evaluates the reasons for the current market position.
CHAPTER 7 develops a Strength, Weakness, Opportunity and Threat
(SWOT) Analysis as a basis of evaluating the Australian dairy products
industry in the context of export sales development to Malaysia.

36
CHAPTER TWO
2 LITERATURE REVIEW
2.1 Introduction
2.1.1 Chapter Objectives
The objectives of this chapter are to,
a) Outline and review the secondary data used in this research.
b) Analyse and define the basis for the selective use of secondary
data in subsequent chapters.
c) Discuss the information gaps in the secondary data.
d) Discuss the perceived errors in the secondary data and the
methodology used in the secondary sources.
2.1.2 Rationale
This chapter attempts to explain the selective use of information and
data from secondary sources and highlight the benefits and limitations of
the secondary data used in this research.
2.2 Chapter Outiine
The literature review in this chapter is categorised into different topics
on the basis of which the literature search was done. The comments,
opinions and information where referenced from the same source for
different topics are cited again subsequently.

37
2.3 The food industry in Malaysia with particular reference to the dairy industry
Literature on the dairy products industry in Malaysia is limited. Data on
imports and exports of dairy products, and domestic production data
based on product category are available from Jabatan Perangkaan
Malaysia (Department of Statistics Malaysia) publications41*° and the
Australian Dairy Corporation publications*^. However, only one journal
article*^, one industry report*^one article in a magazine^°, and one
newspaper article^' were cited specitic to the dairy industry in
Malaysia.
Mahendranathan's article has data only up to 1977. It is, therefore, out
dated and of limited use in this research. Historical trends in the dairy
industry in Malaysia can be analysed through using this article and
46
47
48
49
50
51
Jabatan Perangkaan Malaysia, Perangkaan PerdaQanoan Luar Neoeri (External Trade Statistics), Malaysia 1990.
Jabatan Perangkaan Malaysia, Bulcu Tahunan Perangkaan (Yearbook Of Statistics),
Malaysia 1991.
Australian Dairy Corporation, Dairy Comoendiunn 1989, 1991 and 1992.
Mahendranathan, T; 'The present status of the dairy industry in the ASEAN countries'. The Malaysian Veterinary Journal. Vol.7, No.3 , 1982, pp. 174-179.
International Marketing and Econonnic Services Report (IMES), Volume 1: Malaysia. England, June 1991.
Phoon, Zoe; 'Thriving on Connpetition', Malaysian Business, July 16-31 1992, p. 2 1 .
Australian Financial Review; 'NZ Dairy Expands', Tuesday 19 May 1992.

38
comparing it with other publications". As Mahendranathan's
publication is a well researched article it was used in comparing data in
the IMES report cited above.
The IMES^^ report provides data on sales estimates for different dairy
products for the period 1985 to 1990. It analyses these data and
forecasts demand for different products up to 1995. These suggest that
the IMES report will be a useful source of reference.
However, the quality of the IMES research is questionable. Comparison
of the information in Mahendranathan's article on head of cattle, milk
yields and import tigures from the late 1970s and the statistics from
Jabatan Perangkaan Malaysia shows a logical fit. However, the data in
the IMES report contiicts with these two publications. The research
methodology used in the IMES report is not explained and therefore it
was difticult to evaluate the accuracy of data contained in this report.
The IMES report is referenced very selectively and critically in this
dissertation.
52
53
IMES, loo, cit.
Perangkaan Perdagangan Luar Negeri, loc. cit.
Buku Tahunan Perangkaan, loc. cit.
Sorensen, Anders; 'Progress and Problems of Dairy Development in the Asian and Pacific Region', Asia and Pacific Extension Bulletin. Vol 237 (7) 1986, Food and Fertiliser Technology Centre, Taiwan 1986, pp. 1-12.
IMES, loc. cit.

39
The article from 'Malaysian Business' provided information on the market
share of Nestles in different product categories. Nestles is a major dairy
manufacturing company in Malaysia. This article served as an important
starting point of the primary research. Information on brand market
share, and the width and depth in the range of product categories and
lines from Nestles were available in this report.
The article in the Australian Financial Review (AFR) was very useful in
that it reported, albeit very brietiy, on the market entry strategy of the
New Zealand Dairy Board (NZDB). NZDB, as reported in Business
Malaysia, is an important manufacturer of branded value added dairy
products in Malaysia. Business Malaysia and the AFR provided brief but
important information on the two major dairy manufacturing companies
in Malaysia. There was limited information on the food industry in
Malaysia.
Data on imports and domestic production was available from several
sources including Jabatan Perangkaan Malaysia and Malaysian
commercial bank reports^*.
These limitations made the general survey of the food industry in South
and South East Asia necessary. The literature used for this review is
Economic Research Department (United Malayan Banking Corporation); Business Conditions in Malaysia. Malaysia, December 1992.
Economic Research Department (United Malayan Banking Corporation); Business Conditions in Malaysia. Malaysia, October 1991.

40
covered in section 2.5.
2.4 Information on the Australian dairy industry
There were many industry reports^^, publications from the Australian
55 Industry Assistance Commission; Background Paper to the Industries Assistance Commission's Inouiry on the Dairy Industry. 10 February 1983, pp 1-24.
Industry Commission; 'Review of Overseas Export Enhancement Measures Volume 1: Report', Report No. 22, Australia, 3 April 1992.
Beytagh, G.A.; 'What does the Future Hold for Dairy Products in the Local and Export Market', The Australian Journal of Dairy Technology. Vol. 29 No. 2, June 1974, Australian Society of Dairy Technology, pp. 3-7.
Strange, L.L.; 'Packaging and Presentation - Its Influence on Impulse Buying', The Australian Journal of Dairy Technology. Vol. 29 No. 2, June 1974, Australian Society of Dairy Technology, pp. 5-8.
Corden, M.W.; 'The Nutritional Value of Dairy Products in Present Day Health Concepts', The Australian Journal of Dairy Technology. Vol. 29 No. 2, Australian Society of Dairy Technology, June 1974, pp. 9-13.
Hyde, K.A.; 'The Need for Research, Production and Marketing to Work Closely Together in the Development of New Products: I', The Australian Journal of Dairy Technology. Vol. 29 No. 2, Australian Society of Dairy Technology, June 1974, pp. 14-18.
Chant, N.A.; 'The Need for Research, Production and Marketing to Work Closely Together in the Development of New Products: M', The Australian Journal of Dairy Technology. Vol. 29 No. 2, Australian Society of Dairy Technology June 1974, pp. 19-20.
Kinnersley, D ; 'The Need for Research, Production and Marketing to Work Closely Together in the Development of New Products: III', The Australian Journal of Dairy Technology. Vol. 29 No. 2, Australian Society of Dairy Technology, June 1974, pp. 21-28.
Shew, D.I.;'The Manufacturer is the Key Link in Any Programme to Improve the Image of Dairy Products - Quality, Consistency, Availability', The Australian Journal of Dairy Technology. Vol. 29 No. 2, Australian Society of Dairy Technology, June 1974, pp. 28-30.
Industry Assistance Commission, 'Background Paper to the Industries Assistance Commission's Inquiry on the Dairy Industry', 10 February 1983, pp. 1-24.
N.S.W. Dairy Farmers Association, 'Discussion Paper on Quota System Review', Sydney 29 August 1988, pp. 1-9.
Bray, R.H.; 'Self Regulation of the Dairy Industry', D.I.A.A Conference, Tuesday 29 and Wednesday 30 March 1988, pp. 1-3

41
Dairy Corporation^®, annual reports of companies" and several
56
57
Baxter, Ken; 'Managing Change in the Dairy Industry', UDV Annual Conference, June 1989.
O'Callaghan, T.W.; 'Self Regulation in the Dairy Industry', Dairy Industry Association of Victoria, 1989.
Australian Dairy Corporation, 'Update Information on the Australian Dairy Industry', August 1991 , pp. 1-8.
Taylor, Michael; 'The Australian Dairy Industry : An Overview', Agricultural Science. May 1991 , pp. 18-21.
Gibson, John; 'The Role of the Australian Dairy Corporation', Agricultural Science. May 1991 , pp. 23-27.
Donnelly, Paul and Gray, Stuart; 'What is the Role of The Dairy Research and Development Corporation in the Dairy Industry', Agricultural Science. May 1991, pp. 39-41 .
Australian Dairy Industry Council; 'Dairy Australia: Strategy for the Future', Victoria, December 4 1991.
Office of Trade and Investment (Victoria); 'The Dairy Industry Sector Study', Australia, October 1992.
Pappas Carter Evans & Koop/Telesis; The Global Challenge: Australian Manufacturing in the 1990's. Australian Manufacturing Council, Australia 1990.
Australian Dairy Corporation 1992 (a), loc. cit.
Australian Dairy Corporation 1992 (b), loc. cit.
Bonlac Foods Limited, Annual Report 1992.
Australian Dairy Corporation, Annual Report 1991/92, 1992(b).
National Foods Limited, Annual Report 1991.
Australian Dairy Products Federation, Annual Report 1992.
Murray Goulburn Co-operative Co. Limited, 42nd Annual Report 1992.
Victorian Dairy Industry Authority, Annual Report 1992.
Kraft Foods Limited, The Kraft Story in Australia. 1992.
Tatura Milk Industries Limited, Annual Report 1992.
Australian Dairy Products Federation Inc., Annual Report 1991 .
Australian Dairy Industry Council, Annual Report 1992.
Queensco-Unity Dairy Food Co-operative Association Limited, Annual Report 1992.

42
conference papers^^ that provided information on the Australian dairy
industry.
The general vein of these reports was that the Australian dairy industry
is a very important industry to the national economy^^, highly price
competitive in the international market®° and is increasingly displaced in
the international market because of subsidised products from the
European Community and the United States®', protected international
markets®^, new dairy product exporters®^, and difticult international
58
59
60
61
62
63
Lembit, Murray; 'Market prospects for dairy', Shepparton Regional Outlook Conference, 3 October 1990, pp. 1-7.
Sullivan, Joe; 'Outlook for Victorian dairying in a changing policy environment', Shepparton Regional Outlook Conference, 3 October 1990, pp. 1-6.
Australian Dairy Corporation 1992 (a), op. cit.. p. 5.
Office of Trade and Investment, OP. cit.. pp. 31-34.
Australian Dairy Industry Council, op. cit.. p. 7.
Australian Dairy Corporation 1992 (a), op. cit., p. 7.
Lembit, op. cit.. p. 2.
Sullivan, op. cit. pp. 4-7.
Lacey, loc. cit.
'A Dairy Boom for Four to Five Years', Australian Dairy Foods. November 1988, p. 4.
Ryan-Clark, Fiona; 'What the Future Holds for the Dairy Industry', Australian Rural Times. North Richmond, NSW, Vol. 40, pp. 18-19.
Lembit, op. cit., p. 2.
Clark, loc. cit.

43
market conditions that are forecast well into the 1990s®*.
Although these reports provided useful information on the structure and
the problems that the Australian dairy industry faced, most of these
reports appear to have a strong industry bias and to be intiuenced by
industry interest groups®^.
The strength, the importance and the problems of the industry seem real
enough®®. However the literature review suggested that the industry
generally does not have a focused and pro-active marketing program in
comparison to its major competitors®^. A highly regulated domestic
64
65
66
67
Lembit, op. cit. p. 7.
Sullivan, lop, cit.
Australian Dairy Corporation 1992 (a & b), oo. cit.. p. 8.
'Give Us a Go', Dairy Industry asks Government', Australian Dairy Foods. May 1991, Vol. 12, No. 4, pp. 14-15.
Barrett, David; 'international policy developments and the world dairy product market'. Quarterly Review of the Rural Economy, 8(2), May 1986, pp. 172-180.
'CER: the shape of the final Agreement', pp. 10-14.
Frew, Wendy and Others; 'Closer Economic Relations: AFR Survey', Australian Financial Review. 20 June 1990, pp. 39-44.
Taylor, loc. cit.
Templeton, H.C.; 'Why CER ? : a look at Australia's concerns'. New Zealand Foreign Affairs Review, V. 32, January/March 1982, pp. 7-11.
Barry, G. and Lembit, M.; 'Dairy products: commodity outlook'. Agriculture and Resources Quarterly, Vol. 1, No. 4, December 1989, pp. 404-406.
Spring, Dryden; 'An International Marketer's View of Porter's New Zealand Study'.Business Quarterly. Winter 1992, pp. 65-69.
Dobson, William D; 'The Competitive Strategy of the New Zealand Dairy Board',

44
market®^, various public sector marketing agencies and associations
and regulatory mechanisms®^ seem to have encouraged a generally
68
69
Agribusiness. Vol.6 No. 6 1990, pp. 541-558.
Rosenbaum, Andrew; 'BSN challenging Nestle, Unilever', Advertising Age. June 25 1990, p. 37.
Beltoft, Anders; 'European dairy structure year 2000' , Scandinavian Dairy Information. 3/92, Vol. 6, No. 3, 1992, pp. 46-49.
Hall, Terry; "Commodities and agriculture: NZ dairy industry 'in good heart'- gloom is lifting after worst season in decades", The London Financial Times. 28 November 1991, Great Britain, p. 36.
Hayward, Dai; 'Commodities and agriculture: NZ trades dairy products for coal'. The London Financial Times. 19 June 1991(a), Great Britain, p. 34.
Hayward, Dai; ' Survey of New Zealand(7): Farmers look to GATT for world trade boost- Agriculture, belt-tightening amid bleak short-term prospects, but could better times lie ahead?', The London Financial Times. 9 July 1991(b), Great Britain, p. 30.
Barnes, Hilary; 'Survey of Denmark (10): cheesey smile - Profile of Christian Hansen', The London Financial Times. 19 November 1991, Great Britain, p. 4.
'Asia to be a major dairy market, says study'. Food Industry. November 1991.
Nestles moves south'. South, September/October 1991, No. 125 p. 6.
Australian Financial Review, loc. cit.
'Pacific Dunlop seeks slice of Asian food market'. Food Industry, November 1992.
Sullivan, loc. cit.
Lembit, Murray J . , Topp, Vernon., Beare, Steve C , and Sheales, Terry; 'Dairy Industry Policy and Free Trade with New Zealand', Discussion paper 91.8, Australian Bureau of Agricultural and Resource Economics, Australia, August 1991, pp. 24-45.
Australian Dairy Industry Council, 'Dairy Australia: Strategy for the Future',
December 4 1991.
'Dairy Industry Organizations', Resource Material (RAB:RB:79/50), Gilbert Chandler Institute of Dairy Technology, Australia 1979, pp. 1-13.
Donnelly, Paul and Gray, Stuart; 'What is the Role of the Dairy Research and Development Corporation in the Dairy Industry?', Agricultural Science, May 1991, pp. 39 -41 .
Gibson, John; 'The Role of the Australian Dairy Corporation', Agricultural Science,
May 1991, pp. 23-38.

45
lethargic industry content to export bulk commodities to selected
markets where the general level of competition was perceived to be
low^°.
In contradiction to the ADC and other reports that the demand for
Australian dairy products are under threat internationally^', there were
some isolated reports^^ that forecast demand.
. . . for Australian processed dairy products is likely to be high well into 1991 and in part reflects world interest in the Australian product because of the absence of environmental and nuclear pollution risks^^.
70
71
72
73
Committee for Review of Exports, 'Australian Exports, Performance Obstacles and Issues of Assistance'.
Market Development Assistance. Australian Government Publishing Services, Australia, July 1989.
Callaghan, Bede; 'Australia's Survival- Australian's Awake', Development of Our Export Potential. Institute of Industrial Economics, University of New Castle, Australia, August 1987, pp. 1-10.
Suchard, Hazel; 'Some Aspects of International Marketing', Development of Our Export Potential. Institute of Industrial Economics, University of New Castle, Australia, August 1987, pp. 29-38.
'In Need of Weaning', Far Eastern Economic Review. 6 February 1992, p. 38.
'International Focus Vital says ADC Chairman', Dairy Moves, Issue No. 20, January 1991.
Keniry, John; 'Food Giant's Recipe for Success', The Australian. Wednesday 24 June 1992, p. 7.
Lembit, Murray and Barry, Glen; 'Dairy Products', Agriculture and Resources Quarterly 1(4). December 1989, pp. 404-406.
'NSW Processed Food Development Strategy', NSW Processed Food Task Force, October 1991.
Syvert, Paul; 'Quality food exports from the clean country'. The Australian Financial Review. Wednesday 12 May 1993, p. 14.
NSW Processed Food Task Force, op. cit.. p. 1 1 .

46
This seemed an unresearched generalisation but provided a catalyst for
research into the Australian Government's 'Clean Food Export Strategy',
the national marketing strategy to promote Australian agri-foods as clean
and produced in a relatively unpolluted environment^*. Research on
whether this concept provides Australia with any competitive advantage
in dairy product exports to Malaysia could not be cited. Research in this
area is still in its infancy^^.
The Australian dairy industry appeared to be focussing on improving its
competitive position domestically through acquisitions and
amalgamations''® and a very active thrust into market milk
production^^.
74
75
76
77
East Asia Analytical Unit, op. cit.. p. 179.
Cook, John; 'Adding value for overseas markets'. The Australian. Monday 15 February 1993.
Syvert, Paul, op. cit.. p. 14.
Missen, Geoff; 'Australia's Clean Environment as Comparative Advantage in Food Exports to Asia: Myth or Reality?' (unpublished- research proposal).
Australian Dairy Industrial Council, loc. cit.
Riddell Information Services Pty Ltd, 'Australia's Top 500 Companies 1991-92', The Business Who's Who of Australia. Australia 1991.
Riddell Information Services Pty Ltd, Jobson's Year Book of Australian Companies 1992/93. Australia 1992.
Australian Marketing Publications & Services, The Queensland Business Register (5th Edition), Australia 1991, pp. 418- 487.
Ryan-Clark, op. cit.. p. 18.
Lembit, op. cit.. p. 3.

47
2.5 The food industry in South and South-East Asia with particular reference to the dairy industry
This exploratory study aimed to provide an overview of the market
characteristics and public policy in South and South-East Asia with a
view to gaining a general understanding of the market.
Many of these countries are characterised by high economic growths,
greater urbanisation, higher standards of living as evidenced by
increasingly high per capita ownership of cars, refrigerators and other
consumer durables^® and the greater trade liberalisation regimes. There
are also ethnic and cultural similarities between some of these countries
such as Indonesia, China, India, and Malaysia^^.
Malaysia has population made up of Malays, Chinese and Indians. There
is, therefore, cultural aftinity with communities in Indonesia, China and
the Indian sub continent®".
This review of the markets in South and South-East Asia provided
information on food consumption and dietary choices because of factors
such as culture, public policy and higher disposable income.
78
79
80
Port Jackson Partners Limited, 'Australian business in Asia: Climbing the
mountains'. Business Council of Australia 1992, pp. 30-33.
Port Jackson Partners Limited, op. cit.. p. 23.
Sections 4.4 and 4.5 discuss these in detail.

48
The public policy in many of these countries show evidence of being
borrowed from one another because of common bi-lateral extension
service activities by organisations such as Food and Agricultural
Organisation (FAO). There are also similarities in the educational and
institutional framework in some of these countries because of their
common colonial past®'.
Singapore, Malaysia and countries in the Indian sub continent generally
follow a British intiuenced legal system. The legal systems in these
countries are therefore similar.
The dairy industry in South-East Asia is regulated and intiuenced by
public policy. The dairy industry program in many of these countries are
designed to improve rural farm incomes®^. Some countries have
publicity campaigns in schools and the mass media, special courses for
teachers and school milk programs to encourage milk consumption
among school children. Milk prices are statutorally controlled or
subsidised in some of these countries®^.
81
82
83
Ibid., p. 23.
lya, K.K.,'Dairy Development in South East Asia-Problems and Challenges',Indiarv Dairyman. Vol.30(5), 1978, pp. 345-352.
International Marketing & Economic Services (UK) Limited, Volume 2 (Thailand).
IMES (Volume 1), loc. cit.
Goldstein, Carl; 'Milking a Better Living', Far Eastern Frnnomic Review. 12 January 1989, p. 52.

49
Limited information was found on statutory controls, incentives, non
tariff barriers to imports such as licensing, quarantine regulations, 'halal'
certitication, quotas and total ban on the import of some products, and
export subsidies in the region. Commentators report that there are a
wide range of invisible non tariff barriers in many of these countries®*.
The Pappas Carter®® report for example in a schedule of non tariff
barriers which includes import bans, quotas, import licences,
government procurement and export subsidies reports Malaysia as
having only import licensing.
Malaysia has several non tariff barriers including total ban on imports as
in the case of liquid milk, government procurement as in the case of the
school milk program and quarantine laws that restrict free imports
particularly of food products. The average tariff rate in Malaysia is
reported to be 40 per cent in the Pappas Carter report. Other, more
authoritative reports compute the Effective Rate of Tax in Malaysia to be
substantially higher than this®®. However, there are no signiticant tariff
84
85
86
Chong, Florence; 'Why Australia Must Change', The Australian. Tuesday June 15 1993, p. 2 1 .
Pappas Carter Evans & Koop/Telesis, op. cit.. p. 53.
Noland, Marcus; Pacific Basin Developing Countries. Prospects for the Future. Institute of International Economics, Washington DC, USA 1990, p. 6 1 .
Kamal, Salih, Mohamed Haflah Piei, and M. Sahathavan; Trade Policy options for Malaysia', in Mohamed Ariff and Tan Loong-Hoe, eds.. The Uruguay Round: ASEAN Trade Policy Options. Institute of South East Asian Studies, Singapore 1988 as cited in Marcus p. 6 1 .
50
and non tariff barriers on the imports of dairy products (other than liquid
milk) into Malaysia.
There appears to be widespread recognition in a number of South-East
Asian countries that it is not to their competitive and comparative
advantage to provide extensive support to the domestic dairy industry
either as an import substituting measure or export development
measure. This policy interpretation seems particularly strong in the
ASEAN countries®^
The lack of forage for feed, competition for arable land from the
cultivation of cash crops, low productivity of cattle due to the tropical
climate, and more recently the thrust in economic development through
the encouragement of manufacturing and service industries, seem to
suggest that the dairy industry has not been a priority industry from the
public policy view point®®.
To a limited extent, dairy industry development programs are
incorporated in the overall socio-economic policy in many of these
countries. It is one of the mechanisms to improve the generally more
depressed rural subsistence farm sector where there is considerable
® Sorensen, Anders; 'Progress and Problems of Dairy Development in the Asian and
Pacific Region', Asia and Pacific Extension Bulletin. Vol. 237 (7) 1986, pp. 1-12.
88 Goldstein, op. cit.. pp. 52-53.

51
disguised unemployment/underemployment®^. However, the emphasis
in economic development is to encourage manufacturing industries.
There are strong tiscal policies to encourage domestic manufacturing,
downstream processing and packaging of imported dairy products. This
policy to a great extent limits the viability of domestic fresh milk
production.
However, policy changes in some countries such as Thailand and
Indonesia appear to be developing a viable, and in some instances an
export market focussed dairy industry using domestic milk^°.
lya K.K.®' discusses the development of the dairy industry in the
South, and South-East Asian region in great detail. The article was
published in 1978.
This information, although not recent, provides valuable background on
the active beginnings of the dairy industry in the region. Even at this
89
90
91
Idem.
lya, OP. cit.. pp. 345-352.
Young, Kenneth B; Amir, Pervaiz; and Cramer, Gail L; 'Implications of Dairy Development in Indonesia', Agribusiness. Vol.6, No.6, 1990, pp. 559-574.
IMES (Volume 2), loc. cit.
Goldstein, op. cit.. pp. 52-53.
lya, OP. cit.. pp. 345-352.

52
early phase. State intervention in encouraging the development of the
industry in some countries such as Thailand is already evident.
The developments in the dairy industry in Thailand discussed by lya K.K.
can be related to the more recent articles cited^^.
From these early beginnings in the 1970s, through Government
intervention, Thailand's domestic milk production is projected by IMES to
have increased from 27,240 tonnes in 1982 to 134,000 tonnes in
1989, an average annual growth in production of 49 per cent.
However, Goldstein estimates domestic milk production in Thailand in
1989 at 87,000 tonnes®^. There is, therefore, signiticant difference in
the estimates in these two sources.
There is further discrepancy between the IMES report and that of
Goldstein's analysis of the market in Thailand. Goldstein forecasts
continued increase in milk imports into Thailand as a result of increasing
per capita consumption, and the high cost of domestic production
because of comparative cost disadvantages. Goldstein reports that in
1986 Thailand imported US$ 83 million (A$ 120m) of dairy products
49 IMES, loc. cit.
Goldstein, loc. cit.
Mahendranathan, I; op. cit.. pp. 174-179.
93 Goldstein, loc. cit.
53
from Australia, New Zealand, Netherlands, Denmark and other major
dairy producing countries. Imports increased to US$ 96 million (A$
140m) in 1987, an increase of approximately 17 per cent. On the basis
of this tinding, it appears that in at least the ASEAN countries the
demand for dairy products will continue to outstrip supply even in those
countries such as Thailand which have a very active public policy
encouraging the development of a domestic dairy industry.
The IMES report also suggests that Thailand has embarked on what
appears to be a major export focused dairy products industry. The joint
venture operation by the large Japanese company Meiji, for instance,
appears to have an export market focus®*. On the basis of this it may
appear that imports in Thailand are for value adding purposes for re
export to North East Asia.
Burns®® in his article 'The South East Asian Food Market' provides
important information on the pattern of Australian food exports to the
region in the period 1948-1970. Although this is also not a recent
article, it provides valuable insight into the development of the agri-foods
industry in the region, public policy directions that influenced these
®* IMES, loc. cit.
Goldstein, loc. cit.
^^ Burns, W.G., 'The South East Asian Food Market', Food Technology in Australia,
February 1972.

54
developments, and the changing patterns of Australia's export trade.
Burns notes that the share of Australia's food exports to South East Asia
as a proportion of total food exports had remained at about 20 per cent.
The signiticant change had been the shift in the geographical markets
and the product categories.
Up to the 1950s, India was the dominant export market for Australia,
and grains were the principal food exports. By the 1960s Japan had
become the dominant market and the export of meat had become
important.
Burns attributes this change to India becoming self sufticient in food
products. However, active Indian government barriers to food imports
appears to have intiuenced the decline of exports to India. The recent
trade liberalisation, and the entry of large American food companies such
as Kelloggs, Coca-Cola and Pepsi Cola indicates the signiticance of
public policy in developing trade and investment in this region®®.
Garnaut in his assessment of the market for food products in the
People's Republic of China (PRO highlights the significance that public
'Bringing in the World', Asiaweek. 8 November 1991, pp. 64-65.
'Business: Frantic Wooing', India Today. 15 November 1991, pp. 86-87.
Chidambaran, P.; 'India's Economic Development', A.sian Business Review. November 1991, pp. 11-13.

55
regulatory policies have on food imports and consumption. In his
research Garnaut shows evidence that the increases in food
consumption in the PRC following the economic reforms exceeded
proportionate increases in income or decreases in prices resulting from
these reforms®^.
The NSW Task Force Report makes a number of positive export market
forecasts including that.
Good opportunities exist, especially in the Asian markets [East Asia] for the supply of manufactured dairy products such as processed cheese, soft cheeses, ice cream, yoghurt, frozen yoghurt and powdered products^^.
This seems to be the vein of other reports®®, in many instances
claiming to be the authority of industry and public sector experts.
However, there does not seem to be any detailed market research, or
hard data, to support claims of market opportunities other than the
simple, unanalysed data on economic growth in these markets. As such
the observations of the commentators appear to be based on perception
of changes in dietary habits rather than being based on any hard
quantitiable data. Importantly data that is available does not seem to
support any substantial increase in total per capita consumption of dairy
® Garnaut, Ross and Ma, Guonan; Grain in China. East Asia Analytical Unit, Department of Foreign Affairs and Trade, Australia 1992.
98 NSW Processed Food Task Force, op. cit.. p. 12.
99 Port Jackson Partners Limited, loc. cit.

56
products or increases in the consumption of 'new' product lines by the
indigenous populations in several of these countries'"". In Indonesia,
for instance, sweetened condensed milk and whole milk powder
accounted for approximately 80 per cent of total retail sales of dairy
products in 1986'° ' . Quantifying milk consumption in these countries
is difticult especially since not all liquid milk production is channelled
through the market'"^.
Increases in consumption, particularly of 'new' product lines seem to be
generated through the hospitality industry catering for the Western
tourist and business visitors to these countries'"^ and through re
exports to third countries'"*. In view of this, the dramatic increase in
imports and hence the apparent high per capita consumption of dairy
products in some countries, such as Singapore with its large Southern
Chinese population has to be examined critically. Many of the reports
on Australian export development initiatives relate economic growth
rates in some of these markets as the sole indicator of the export market
100
101
102
103
104
Gresswell, Ian; 'How the Dairy Industry is Changing', Business Review Weekly. 6 November 1992, pp. 50-54.
Lembit, Murray and Barry, Glen; 'Dairy Products', Agriculture and Resources Quarterly 1 (4), December 1989, pp. 404-406.
Sorensen, loc. cit.
Smith, D.B.; 'Food Technology in the Philippines', Food Technnloov in Australia, Council of Australian Food Technology Associations, November 1975.
IMES (Volumes 1 & 2), loc. cit.
Davidson, R., 'Dairy Joint Ventures Flourish in Singapore', Australian Dairy Foods,
February 1992, pp. 26-28.

57
105 potential
This paper contends that it is an over generalisation to say that with
improvements in incomes the per capita consumption of dairy products
will increase. This trend seems limited to South Asia where increases in
income has had significant impact on consumption of dairy products.
This demonstrates the importance traditional food consumption habits
has on the demand for dairy products. The over emphasis on changes in
dietary habits as a result of increases in economic wealth appear to
detract from realising the real opportunities in the market place. In his
study of dairy industry in the Asia Pacitic region, Sorensen points out
the importance of dairy products in the nutrition of South Asian
communities and the relative less importance of dairy products in the
diet of East Asian communities. Sorensen presents an interesting study
through segmenting the region into three broad groups as follows:
Group 1: (Indian sub continent) Milk is important in nutrition.
Group 2:(ASEAN, Korea, Burma) Milk is of limited importance. These
countries are categorised as important importers of dairy products.
Group 3: (Japan, Hong Kong, Singapore) Price sensitive market.
105 East Asia Analytical Unit, loc. cit.
McLean, R.J; 'Exploiting Opportunities in the Pacific Basin', CEDA Study Committee for Economic Development of Australia, Strategic Issues Forum Monograph, June 1986.
Noland, loc. cit.

58
This analysis has some limitations because of the dramatic changes in
some of these market places in the last five years, but the analysis
provides valuable insights of the sub markets within the region.
India for example produced 58 million tonnes of milk in 1992'°®.
China, an economy that can be compared to India in terms of population
size and per capita income levels, produced only approximately 5 million
tonnes of milk in 1992'"''. Despite production levels of India being
approximately 12 times that of China's, India still has an acute shortage
of dairy products necessitating controls on the consumption. In East
Asian communities consumer preference for other foods particularly tish
and meat is evident. These communities have traditionally consumed
milk substitutes such as soy milk instead of cattle milk. These comments
are a result of examining data in demand growth and per capita
consumption levels in a number of East Asian communities'"®.
106
107
108
Australian Dairy Corporation 1992(a), op. cit., p. 3 1 .
Idem.
East Asia Analytical Unit, Australia and North East Asia in the 1990s: Accelerating Change, Department of Foreign Affairs and Trade, Australia 1992.
Booth, Anne., David, Cristina., (et al); Food Trade & Food Security in ASEAN and Australia. ASEAN-Australia Joint Research Project, The Australian National University, Australia 1986.
Garnaut, Ross; Australia and the Northeast Asian Ascendancy. Australian Government Publishing Service, Australia 1989.
Garnaut, Ross and Ma, Guonan; loc. cit.

59
Garnaut and Ma'°® observe that the historical experience of Chinese
communities in different South East Asian geographical markets provides
insights into the relationship between incomes and demand. Referring to
Singapore, Hong Kong and Taiwan, the authors observe that,
China's food consumption in the process of economic growth seems to have been following closely the patterns of other East Asian communities during their periods of high growth. The similarity with Chinese communities in Taiwan, Hong Kong and Singapore is particularly close^^°.
... the dietary preference of these ... communities, resemble each other more closely than ... other major regions of the world economy, facilitating the identification of the influence of economic factors (prices and incomes) on levels of consumption^ ^\
The presence of approximately 5.2 million ethnic Chinese from
Guangdong and other southern coastal Chinese provinces in Malaysia
who have generally not integrated into the main stream indigenous
community"^ suggests that the underlying consumer preferences are
broadly similar to the overseas Chinese communities in Hong Kong,
Taiwan and Singapore. In most Chinese societies, other than in the case
of Singapore which has 75 per cent Chinese population, the per capita
consumption of meat is substantially higher and has shown greater per
capita increases in comparison to dairy products. As shown in Table 1,
the consumption of dairy products in countries such as China, Taiwan
109 Garnaut and Ma, op. cit., p. 23.
110 , . . . p Ibid., p. 5.
^^^ Ibid., p. 23.
112 'The Overseas Chinese', The Economist. July 18 1992, pp. 21-24.

60
and Hong Kong had grown very substantially from very low per capita
consumption levels but has stabilised at still relatively low levels. The
exception to this is Singapore which has a sizeable (25 per cent) Malay
and Indian population, and large intiows of Western tourists and
expatriates.
TABLE 1: PER CAPITA CONSUMPTION OF MEAT & DAIRY PRODUCTS IN SELECTED EAST ASIAN ECONOMIES^^^
PERIOD/COUNTRY
SINGAPORE
CHINA
TAIWAN
HONG KONG
DAIRY PRODUCTS
1975-79
55
3
28
30
1980-84
61
4
27
33
1985-86
66
5
28
40
MEAT
1975-79
73
10
42
75
1980-84
79
15
53
86
1985-86
79
19
60
91
As shown in Table 1 and illustrated in Diagram 4, the per capita
consumption of dairy products in China increased 5.6 per cent per
annum in the period 1975-1986. However, the per capita consumption
of dairy products is still only 5 kg - a level lower than in many other
countries at the same stage of economic development. The
consumption of meat increased 7.5 per cent in the same period, but at
19 kg per capita the per capita consumption of meat in China is far
113 Garnaut (1989), loc. cit.
Note Although Garnaut has not stated it in the text, the dairy consumption levels are assumed (based on data from other sources such as the IMES and the Australian Dairy Corporation) to be in Liquid Milk Equivalent (LME) terms.

61
higher than many other developing countries. The per capita
consumption of dairy products in Taiwan has remained unchanged in the
ten year period 1975 - 1986 and remains at the relatively low level of
28 kg per capita for a middle income country. On the other hand, the
consumption of meat has increased by approximately 4 per cent from a
relatively high base of 42 kg in 1975 to 60 kg in 1986. Similarly in
Hong Kong the per capita consumption of dairy products increased by
approximately 3 per cent in the period 1975 - 1986 and remains at the
relatively low level of 40 kg per capita for a middle income country that
has sizeable non Chinese and Western expatriate and tourist populations.
However, the consumption of meat has increased by more than 2 per
cent per annum from an already high base level of 75 kg per capita in
1975 to a 91 kg per capita in 1986.
Greater consumer awareness particularly regarding the benefits of breast
milk as opposed to infant formula, and the increasing availability of
cheaper and what are perceived to be better dairy substitute products
particularly vegetable fats and margarine are likely to result in a fall in
the consumption of dairy products particularly in the yellow fats
category and full cream milk category in markets such as Singapore that
already does not have a tradition in the consumption of dairy products.
After having made adjustments for above average consumption in the
hospitality and food service market segments servicing a largely Western

62
tourist and expatriate population, the characteristics of the markets in
Taiwan, Singapore and Hong Kong can be used as a model to analyse
the Chinese segment of the Malaysian market. The per capita
consumption trends in these largely ethnic Chinese markets provides
valuable insight into the consumer preferences and market
characteristics in correlation to variables such as income, price, and level
of urbanisation. Key data on these markets are illustrated in Table 2.
TABLE 2: FEATURES OF KEY OVERSEAS CHINESE MARKETS
COUNTRY
Singapore
Hong Kong
Taiwan
TOTAL POPULATION"*'
2.7
6.0
21.0
CHINESE (%)
75
99
99
DAIRY PRODUCT CONSUMPTION
(Kg/capita)"*
66
40
28
Million
It is highly probable that the consumption levels in Taiwan will most
closely represent the consumption levels in the Chinese segment of the
Malaysian market. Singapore has a significant South Asian and Malay
population, and Hong Kong has significant Western tourist arrivals. Both
Singapore and Hong Kong are also almost wholly urban communities.
The Chinese population in Malaysia will most closely resemble the
114
115
The Economist, loc. cit.
Garnaut, loc. cit.
Note Although Garnaut has not stated it in the text, these consumption levels are assumed (based on data from other sources such as the IMES and the Australian Dairy Corporation) to be in Liquid Milk Equivalent (LME) terms.

63
Taiwanese population in homogeneity and level of urbanisation. Based
on this analysis, it is assumed that the per capita consumption of dairy
products in the Chinese segment of the population in Malaysia will be
approximately 28 kg/capita - Taiwan's consumption levels. The per
capita income of the Chinese segment of the market in Malaysia
compares with that of the per capita income of Taiwan.
The IMES report is the only publication which suggest that market
surveys had been commissioned and that primary research was an
important element in shaping the research tindings. The IMES report
makes some signiticant observations on consumer product preferences.
However, in the absence of information on research methodology the
quality of these tindings cannot be determined. The report, for example,
observes that milk is not a favoured drink in Thailand and that 80 per
cent of the consumption of dairy products in Thailand is around Greater
Bangkok. This contradicts the dramatic increases in dairy production
and import levels forecast in this report.

64
DIAGRAM 4: PER CAPITA CONSUMPTION OF MEAT A DAIRY PRODUCTS IN SELECTED EAST ASIAN COUNTRIES (ks/percapita)
Dairy Products
Singapore China Taiwan Hong Kong
1975-79 1980-84 1985-86
Meat
Singapore China _| IHI h -
Taiwan Hong Kong
1975-79 ^1980-84 1985-86
Source: Garnaut. R.: Australia and the North East Asia as Ascendency, Australian Government Publishing Service, Canberra 1989.
65
Booth"® provides important information on food consumption trends
in ASEAN. The chapter on Malaysia in this book, makes references and
provides data on the per capita food consumption among different ethnic
groups"^ There is very clear observation of substantial differences in
the dietary habits particularly in the consumption of dairy products
among the three main ethnic communities in Malaysia. The Australian
Dairy Corporation, in contradiction to this, postulates that there is no
difference in the household expenditure on dairy products among the
Malays, Chinese and Indians in Malaysia. The report says that dairy
products account for approximately seven to eight percent of household
food expenditure for all three communities"®.
lya makes similar references to the prevalence of tradition based
differences to dairy product consumption. He cites the usage of a local
variety of cheese in traditional Filipino diet"®. Generally, there is
insufticient information on attitudes to and trends in the consumption of
dairy products in different sub markets in ASEAN. There is suggestion
that the indigenous communities in ASEAN countries have a tradition in
the consumption of dairy products, at least more so than in North East
Asian communities.
1 1 A
Booth, loc. cit.
" ^ ibid^, pp. 56-58.
118
Australian Dairy Corporation, 'Dairy Market Briefings', p. 4.
lya, loc. cit.

66
In what appears to be a recognition of this and a strategy to promote
dairy products to the dominant Chinese population in Singapore, NZDB
has recently been promoting milk powder through Chinese medical halls
in Singapore as a health product. It has been marketing milk as a dietary
need for controlling osteoporosis'^".
It appears that the dietary benetits of dairy products is well
recognised'^'. However, what is less certain is the competitive and
comparative advantage dairy products have over substitute products
such as margarine and soy milk. The raw materials of both these
products are particularly abundant in ASEAN and there is a tradition in
the consumption of soy bean bi-products particularly among the ethnic
Chinese segment of the population.
Davidson's article suggests that Singapore is an important value adding
centre for re-exports to many countries in the Middle East, and South
Asia'". Unilac Dairy Products which commenced production in
Singapore in 1984 as a joint venture operation between Bonlac Foods of
Australia and Fraser and Neave of Singapore has a very strong export
focus. Nearly 95 per cent of the total A$ 60 million turnover of Unilac
Dairies comes from exports to countries such as Bangladesh, Malaysia
120
121
'Neighbours Come Knocking', Asiaweek. 28 February 1992, pp. 66-67.
Australian Dairy Corporation 1992 (b), OP. cit.. pp. 17.
122 Davidson, oo. cit.. pp. 26.

67
and countries in the Middle East '". Bonlac Foods is now reviewing its
investment in Singapore and has established a Joint Venture company in
Bangladesh'^*.
The public policies in some of these markets, particularly in communities
in which dairy products are important dietary components, does not
appear to be given sufficient importance by some major Australian
companies. In contrast to this, the NZDB appear to be divesting from
Singapore and increasing investments in countries that have a larger
population base, and exemplify greater demand characteristics for dairy
products. NZDB had established a dairy plant in Singapore with major
share holding as a joint venture with Cold Storage Holdings (CSH), an
associate company of Goodman Fielder (GF). On GF divesting from
CSH, a new company Asia Dairies Pte. Ltd. (Asia Dairies) was formed in
1990. In the new company, Fraser and Neave, the same investor as in
Unilac, holds a 51 per cent equity, while NZDB holds the remaining 49
per cent equity. Asia Dairies exports 25 per cent of its production'^®.
In addition to dairy products such as fresh milk, milk powders,
condensed milk, ice cream, butter, dairy spreads and yoghurt, Asia
Dairies produces a range of fruit juices and Asian drinks including soy
^ " Ibid^, pp. 26-27.
124 Bonlac Foods Limited; Annual Report 1992.
^® ibid^, pp. 27-28.

68
drink'^®. The product mix, the target export markets and the equity
holders in these joint ventures exemplify the differences in market
strategies between NZDB and its Australian competitors.
Fraser and Neave is the local partner in both joint ventures. The
strength of Fraser and Neave is that, it is already a major dairy products
company in the region through a 50 per cent share holding in Premier
Milk Industries, a concentrated milk production facility that commenced
operation in Malaysia in 1962'^^. Fraser and Neave appear to be
using the strategic alliances with companies in Australia and New
Zealand to develop export market expertise and linkages. NZDB's
strategies suggest that the company recognises the limitations in using
Singapore as a base for re-export. NZDB's investment in Asia Dairies
pre dates Fraser and Neave's acquisitions in the company. NZDB had
joint ventured with CSH in establishing Asia Dairies. CSH was a major
food products wholesale and retail operator in Singapore and Malaysia.
Fraser and Neave acquired CSH's share in Asia Dairies. NZDB has
recently diversified its activities in Asia Dairies. It concentrates on
research and development support such as the development of new
tiavours and food products to Asia Dairies'^®. NZDB has directly
^ ® Ibid^, p. 27.
^^^ Schenk, D.G.; 'Importance of the Recombined and Filled Milk Industry in South East Asia', Orgaan-Koninklijke Nederlandse-Zuivelbond'. Vol. 65, 0-45 18 1973, pp. 444-446.
128 Davidson, op. cit.. p. 28

69
entered some of the export markets of Asia Dairies. In Malaysia for
instance, in 1992 it established a large manufacturing, packaging and
warehouse complex together with a Malay businessman'^®. NZDB
forecasts that its current turnover of NZ$ 56 million will increase by
more than 30 per cent to NZ$ 75 million by the end of 1993'^°.
Similarly, Nestles has announced a major direct investment program
involving US$ 100 million in Malaysia, Thailand, Singapore, Philippines
and Indonesia in both dairy and non dairy operations. The non dairy
operations will include the manufacture of stock cubes, chocolate bars,
soy based drinks and meat substitutes'®'. Nestles has offered 40 per
cent ownership of the new companies to local investors'®^.
The strategies of NZDB and Nestles retiect emphasis on direct market
entry, strategic alliance with local companies and product line extensions
incorporating dairy substitute products. These companies show
evidence of recognising the limitations of the domestic market in
Singapore both because of its small population size and the preference
for non dairy sources of protein among the Chinese majority population.
These companies also recognise that using Singapore as a centre for
129
130
131
132
Australian Financial Review, loc. cit
Idem.
South. 00. cit., p. 6.
idem.

70
processing and manufacturing operations for re-export to other countries
in the region may not be a successful long term strategy as countries in
the region are attracting investments in the dairy sector from
competitors. This is evident in strategies applied by NZDB with respect
to its interests in Asia Dairies. The strategies of these companies retiect
the need to evaluate the market regionally in planning strategies in
specitic countries.
The studies by Burns'®^ and lya'®* are particularly useful in this
context as they have analysed the market characteristics in a number of
countries in the region. Both these authors have covered an extensive
geographic market that encompasses the Indian sub continent, ASEAN,
Korea and Japan. Differences in the food consumption habits of
communities in this region has signiticant intiuence on demand for food
products and public policy formulation relating to the food sector.
This review exposed a signiticant gap in the literature on consumer
product preferences. Although there are models on consumer behaviour
relating to the overseas Southern Chinese population, which can be
applied to study the Chinese segment of the population in Malaysia, no
similar studies were available with regard to the overseas Indian and the
Muslim-Malay populations. These two ethnic groups comprise more
133 Burns, loc. cit.
lya, loc. cit.

71
than 60 per cent of the Malaysian population. The literature surveyed,
suggests that the per capita consumption of dairy products in these
ethnic segments are signiticantly higher than among the Chinese
segment of the population.
The companies such as Nestles and NZDB that have been active in the
region have probably built up a data base in the course of their presence
in the market place.
It appears that the main source of market intelligence of Australian dairy
companies have been through their resellers. These resellers are
generally Chinese wholesalers whose strength is only in their cultural
sections of the market.
Improvements in rural (largely indigenous) incomes, the increasing
involvement in business by indigenous populations and the tacit or subtle
government aftirmative programs particularly in some countries such as
Malaysia, do not appear to be well understood nor the extent of the
commercial success of some of these programs fully realised.
There is detailed discussion of some of these issues by Noland, and
Balassa'®®. The role of the public sector in development, and the
Noland, loc. cit.
Balassa, Bela and John, Williamson;'Adjusting to Success: Balance of Payments

72
redistribution of wealth in Malaysia can be gathered from a number of
the texts'®®. Although these texts give important information on
policy issues that impact upon the redistribution of incomes, there are
noticeable errors and serious tiaws in data in some of them.
Short comings in research methodology have influenced these errors in
analysis. Noland for example, analyses that:
136
Policy in the East Asian NICs', Policy Analyses in International Economics. Institute for International Economics, USA 1990.
Port Jackson Partners Limited, loc. cit.
Booth, loc. cit.
Esman, Milton J ; Administration and Development in Malaysia. Cornell University Press, Great Britain 1972.
Findlay, C. and Garnaut, R; The Political Economy of Manufacturing Protection: Experience of ASEAN and Australia, Allen and Unwin, Australia 1986.
lya, loc. cit.
Macpherson, Neill T; The South East Asian Investment Guide. Longman Group (Far East) Ltd., Hong Kong 1992.
Milne, G; 'Region's Tigers Beat us on Taxes', Weekend Australian. June 18-19 1992.
Smith, D.B; 'Food Technology in the Philippines', Food Technology in Australia. November 1975.
Sheridan, G; 'The Coming of Age of Asia's Trading Bloc', Business Review Weekly. March 29 1991 pp. 42-46.
Trends in Developing Economies 1991. International Bank for Reconstruction and Development/World Bank, September 1991.
Dixon, Chris; South East Asia in the World-Economy, Cambridge University Press, Cambridge 1991.
East Asia Analytical Unit, Australia's Business Challenge: South-East Asia in the 1990s. Department of Foreign Affairs and Trade and Austrade, Australia 1992.

73
Malaysia has the most unequal income distribution of the Pacific Basin developing countries, and as a consequence, distributional issues are central to Malaysian economic policy'''.
Noland bases his assessment of the comparative income distribution
position of Malaysia to that of other countries in the Pacitic area on the
basis of the Atkinson inequality index.
However, an examination of the data reveals that Noland had used 1973
data for Malaysia while using for example, the 1985 data for the
Philippines (Appendix 3). Noland's assessments also contradict the
tindings of a number of other researchers'®®.
Thus, the impact of economic policies and the effect that these policies
have had on the redistribution of wealth and economic power in
Malaysia cannot be determined from a reading of any one text.
Comparative study of a number of texts and detailed analysis of the data
and comments in these texts has been pursued in developing statements
on the Malaysian economy that is covered in Chapter 4 of this thesis.
137
138
Noland, op. cit., p. 56.
Dixon, OP. cit.. pp. 149-226.
Crouch, Harold; 'Malaysia: Neither authoritarian nor democratic', in Southeast Asia in the 1990s, Authoritarianism. Democracy & Capitalism, by Hewison, Kevin et_al (Eds), Allen & Unwin, Australia 1993, pp. 135-157.
Sieh Lee Mei Ling; 'The transformation of Malaysian business groups', in South East Asian Capitalists by Ruth McVey (Ed), Cornell University, USA 1992, pp. 103-126.

74
The New Economic Policy (NEP) initiatives were accelerated after the
mid 1970s. The income distribution position in Malaysia by the mid
1980s should be substantially different to the position in the early
1970s because of the impact of the NEP'®®.
The text Australia's Business Challenge'*" appears to have fallen into
the common error of generalising the socio-economic conditions in the
region. The text repeatedly discusses privatisation (Privatisation Master
Plan)'*', and the influence that large Chinese businesses
conglomerates have on national economic policy'*^ in the region as if
it is a standard feature in all of ASEAN that the ethnic Chinese have a
virtual monopoly of economic activities and continue to intiuence and
shape economic policies including through intiuencing corrupt politicians
and bureaucrats.
The intiuence of Chinese businesses in Malaysia is very restricted
because of the NEP'*®, and the fact that privatisation in itself is often
used as a mechanism to increase Malay ownership and operation of
139
140
141
142
143
Idem.
East Asia Analytical Unit, loc. cit.
Ibid., p. 22.
ibid., pp. xxx-xxxi.
Crouch, loc. cit.
Sieh, loc. cit.

75
businesses in Malaysia. The comments by Jomo probably best describes
Malaysia's economic strategy in the 1980s and 1990s:
...on the whole, it can be said that economic policies from the early 1980s seek to transform Malays/a into a newly industrialised country (NIC) like South Korea, less dependent on the developed industrial nations, and under genuine Bumiputera capitalist entrepreneurial leadership. Most of Mahathir's economic policies seem to aim to achieve this end''*^.
This difference in the perception of the political and economic policies in
Malaysia is a result of the differences in the sources of market
intelligence. The East Asia Analytical Unit's probable source of market
intelligence are the ethnic Chinese students from Malaysia or non Malay
academics from Malaysia. This 'misreading' of events in the market
place appears to extend to the collation of business information as well
because of this over-dependence on sections of the population or other
inherent pre-conceived notions of the market place. This preconception
appears to be neither new nor peculiar to Australians. British
administrators appear to have worked on and perpetuated similar notions
on the particular strengths of ethnic Chinese communities in trade and
commerce in comparison to indigenous Malays. Dixon summarises this
attitude of colonial Britain as follows:
^** Jomo Kwame Sundaram (Ed); Mahathir's Economic Policies (2nd Edition), insan,
Kuala Lumpur 1989, p. 2.

76
The indigenous population had little control over trade and production; enclaves of Chinese, Indian and Arab traders and entrepreneurs controlled the trade and much of the production. Influential colonial administrators, especially the British in the Straits Settlements, held favourable views of the Chinese as workers and entrepreneurs^""^.
This thesis postulates that these notions and perceptions have continued
to cloud a factual and realistic assessment of the market place. Thus,
Australian failings in marketing in Malaysia stem from this inability to
assess the realities in the market place and hence develop meaningful
and successful strategies. A number of writings by a range of
commentators supports the view that the NEP initiatives have increased
the position of Malay businesses in Malaysia. In some industries, Malay
and government corporations virtually control business activities'*®.
Sieh for instance says:
... the NEP booked considerable success in its first decade. Poverty eradication efforts such as new land schemes, education and training institutions, and loan facilities for housing and small businesses benefited the Bumiputera population to such an extent that non-Malays felt hard done by ... data by sectors from the Fifth Malaysia Plan (1986-1990) indicate that already by mid-1985 Bumiputera owned 69 percent of domestic banking and financial institutions and at least 32 percent of the plantations. '''^
145
146
147
Dixon, OP. cit.. p. 109.
Sieh, OP. cit.. pp. 103-126.
Heng Pek Koon; 'The Chinese business elite of Malaysia',in Ruth McVey (Editor) Southeast Asian Capitalists. Cornell University, USA 1992, pp. 128-144.
Ibid., p. 104.

77
2.6 International marketing theory and concepts
Many texts and marketing journals were researched to develop a clear
understanding of marketing theory and concepts that can be applied in
analysing the research tindings in this dissertation.
A number of product-market theories and concepts such as Product Life
Cycle Theory; market segmentation including cross-classitication matrix,
benefit segmentation, and multiple market segmentation; brand
strategies including brand extension, brand image, brand mark, and
brand name; customers choice criteria; theory of comparative advantage
and competitive advantage; competitive parity; concentrated marketing
and differentiated marketing; product positioning strategies; elasticity of
demand, and cross elasticity of demand; depth and width of product
lines; marketing mix strategies, physical distribution; market entry
strategies; direct foreign investment; and tariff and non-tariff barriers
were reviewed.
All these concepts and theories as relevant to the marketing of dairy
product lines in Malaysia will be discussed in this dissertation. Current
texts on these subjects are readily available as they are standard texts
for most undergraduate marketing courses'*®.
148 Assael, Henry; Marketing Principles & Strategy (First Edition), The Dryden Press, USA 1990.
Aaker, David A and Day, George S; Marketing Research. (Fourth Edition), John
Wiley & Sons, Singapore 1990.

78
These texts are very recent and therefore incorporate current thinking in
this area of study. There are also many journal articles'*®, reports in
business magazines'®", and reports and commentaries in
149
150
Brown, Linden; Competitive Marketing Strategy. Thomas Nelson, Melbourne 1991.
Collins, Brett A; Getting a Marketing Orientation. The Graduate School of Management, The University of Melbourne, Working Paper No. 6, March 1990.
Cravens, David W., and Woodruff, Robert B; Marketing. Addison-Wesley Publishing Company, United States 1986.
Cravens, David W; Strategic Marketing (Third Edition), Irwin, USA 1991.
Daniels, John D., and Radebaugh, Lee H; International Business Environments and Operations (5th Edition), Addison Wesley Publishing Company, USA 1989.
Hague, Paul and Jackson, Peter; Marketing Research in Practice. Kogan Page, England 1992.
Kotler, Philip et al: Marketing in Australia (Second Edition), Prentice Hall, Australia 1989.
Onkvisit, Sak and Shaw, John J ; International Marketing: Analysis and Strategy (Second Edition), Macmillan Publishing Company, USA 1993.
Jain, Subhash C ; International Marketing Management (Fourth Edition), Wadsworth Inc., USA 1990.
Terpstra, Vern and Sarathy, Ravi; International Marketing, (5th Edition), The Dryden Press, USA 1991.
Zikmund, William and D'Amico, Michael; Marketing (Second Edition), John Wiley & Sons, USA 1986.
/White, David; Capturing Opportunities in Asian Food Markets, McKinsey Global Institute, Sydney 1992.
Weidenbaum, Murray; 'The Business Response to the Global Marketplace', The Washington Quarterly. Winter 1992, pp. 173-185.
Dillon, Patricia M; 'Say Hello to the Global Marketplace', Fnnd Engineering, January 1991, pp. 81-86.
Shoebridge, Neil; 'Goodman Gets Its Act Together', Business Review Weekly 17 July 1992, pp. 19-21.
Jarrett, Ian; 'Asia's New Snack Basket', Asian Business. January 1992, pp. 44-45.
'Plan to Double Food Export Earnings', Over.seas Trading, May 1990, pp. 30-32.
Wilson, Marshall; 'Seize the Chance, Australia!', Overseas Trading, December
1992, p. 2.
79
newspapers'®'on marketing and market entry strategies that provided
valuable background material to this research.
The majority of this literature, especially the text books, are generally set
151 Fosler, Gail; 'Going Global Aids Survival', The Australian. Wednesday 24 June 1992, p. 6.
Keniry, John; 'Food Giant's Recipe for Success', The Australian Wednesday 24 June 1992, p. 7.
Anderson, Paul; 'How We Can Cater to the Asian Palate', Australia Business Monthly. September 1992, pp. 133 - 134.
Baker, Russell; 'Goodman Fielder's Recipe for Asian success', '^•ustralian Financial Review. 30 Ap r i r i 993 .
Hanes, Kathryn; 'Biscuits Player Takes on Japanese', The Australian. Tuesday 1 June 1993 p. 42.
Nugent, Michael; 'Listening to the Customer Will Help Us Change Attitude', The Australian. Wednesday 10 March 1993.
Best, Paul; 'Bid to Treble Processed Food Exports to $7 bn'. The Weekend Australian. 8-9 May 1993 p. 9.
Rennie, Michael; 'Persistence Pays off for Successful Exporters', The Australian. Friday 12 March 1992 p. 10.
Roberts, Peter; 'An Innovative, Courageous Politician Bows Out', Australian Financial Review, Thursday 1 April 1992.
Dodd, Tim; 'Button Fires off Parting Shots at Big Business', Australian Financial Review. Thursday 1 April 1993.
McKanna, Guy and Burrell, Steve; 'Aust Must Lift Game or be Left Behind, says Garnaut', Australian Financial Review. Tuesday 30 March 1993 p. 5.
Doman, Matthew; 'New Ears Hear Old call on Asia', Australian Financial Review. 23 April 1992 p. 2.
Evans, Ralph; 'Austrade Plans Network of Insiders to Global Markets', I h e Australian. Friday 26 June 1992 p. 6.
Gill, Peter; ' Wran and the Asia-Pacific Trade Plan', Australian Financial Review, 30 April 1993 p. 16.
James, Graeme; 'Breaking Out of Commodity Trap Gives Food for Thought', The Australian. Friday 21 August 1992 p. 33.
Barratt, Paul; 'In The Real World, Bilateral Effort Will Bring Results', The Australian, Friday 12 March 1993 p. 1 1 .

80
in an economically advanced and demographically Western socio-cultural
environment. Adaptations to the Malaysian market environment is
needed. Even here, there are a number of texts that discuss the socio-
cultural aspects in marketing including covering these with particular
reference to Malaysia satisfactorily'®^.
The thrust by food manufacturers to value add and its benefits is
discussed in detail with very informative case studies by Daniel
Best'®®. Best suggests that increasing disposable incomes, changing
consumer lifestyles, increasing emphasis on health and nutrition, and
greater exposure to foods of different cultures have all contributed to
significant changes in consumer attitudes to food consumption. He
notes that consumers "were willing to pay more for added-value
attributes in their food products"^^"^.
Information on food distribution channel intermediaries in Malaysia is
152
153
154
Harris, Philip R and Moran, Robert T; Managing Cultural Differences (Third Edition), Gulf Publishing Company, Houston, USA 1991.
Moran, Robert T and Stripp, William G; Dynamics of Successful International Business Negotiations, Gulf Publishing Company, Houston, USA 1991.
Business Asia. October 23 1989, p. 352.
Cooke, Ian M; Overseas Marketing from Australia, The Australian Institute of Export, Queensland 1991 .
Best, Daniel; 'Designing New Products from a Market Perspective,' in Food Product Development - from Concept to the Marketplace by Ernst Graf and Isreal Sam Saguy, Van nostrand Reinhold, USA 1991.
Ibid., p. 4.

81
also very limited. The critical pattern and structure of retail/wholesale
food distribution in Malaysia is discussed only in three sources'®®.
These include Allen'®®, in which there appears to be signiticant errors
in data and information. The analysis of trade conditions and
characteristics in this book are based on unexplained and unreliable
market research methodology. For example, the book provides some
information on the structure of food distribution outlets and trends in the
retail and wholesale grocery reseller channels in Malaysia. However, the
book makes statements, often inaccurate, without supporting data. For
instance, the book claims that the Jaya Supermarket and the Kimisawa
Group "virtually monopolise the retail trade'^^^.
As is evident from other sources, nothing could be further from the
truth. The supermarkets, as a whole, do not have more than 5 per cent
market share by value in the total retail grocery sales'®®. The market
155
156
157
158
Allen, Tim et al; Sales and Distribution Guide to Malaysia. European School of Management Studies, Great Britain 1988.
Euromonitor, Retail Trade International Volume 3. Great Britain 1992, pp. 1216-1219.
Zain, Osman Md., and Rejab, Ismail; 'The Choice of Retail Outlets Among Urban Malaysian Shoppers', International Journal of Retailing, Vol. 4, No. 2 1989, pp. 35-45.
Allen, loc. cit.
Allen, OP. cit.. p. 111 .
Ngam, S.M. and Lee, E; 'Supermarkets: Battle of the Stores', Maiay.;ifln Business,
Vol.16, January 1986, pp. 5-16.

82
is still dominated by conventional stores'®®. In fact, Kimisawa was a
highnote in the failure of supermarket operations in Malaysia.
Similarly, information on the number of wholesale outlets, number of
retailers serviced and the number of retail franchisees of the government
owned corporation Pernas Edar seems to be inaccurate. This company
was among the resellers that were the subject of the tield audit in this
research. The information from the tield audit suggested that this
company serviced approximately 3000 retailers, had about 30
franchisees and about 20 wholesale depots. Allen reported that this
company serviced 500 retailers, had 200 franchisees and had 34
wholesale depots. Data such as this can vary over time. However, the
differences in the data are substantial and, therefore, raises doubts on
the accuracy and sources of information contained in this book.
Trends in the development of retail outlets and exhaustive data are
available in the Euromonitor report. This proves an useful source in
which there was an aggregation of data from a number of sources
including the Statistics Department of Malaysia.
Osman and Ismail's'®" article is another well researched source which
provides useful data on the development and characteristics of the retail
159
Euromonitor, op. cit.. pp. 1216-1219.
Osman, loc. cit.

83
grocery business in Malaysia. The article also provides very detailed
analysis of consumer choice of retail grocery outlets on the basis of
ethnic, income and education variables. This analysis provides an useful
conceptual framework to develop this research to test differences in the
consumer preferences for different dairy product lines based on ethnic,
income and age group variables. Findings by Osman also contiicts with
the information in Allen. Allen claims that as much as 60-90 per cent of
supermarket shoppers in Malaysia are Chinese'®'. Research tindings
by Osman suggests that the majority of shoppers in supermarkets are
Malays.
There are suggestions in a number of studies in different market places
that there is a direct and positive correlation between a tirm's export
channel structure and its export performance'®^.
There is no secondary data on the channel intermediaries used by
Australian dairy product export companies. However, experience in the
market place suggests that Australian exporters almost wholly rely on
importers and regional wholesalers without an extensive network of
distribution channel throughout the country.
161 A„ , _ ^ Allen, op. cit.. p. 106.
162 Chan T.S; 'Emerging Trends in Export Channel Strategy: An Investigation of Hong Kong and Singaporean Firms', European Journal of Marketing. Vol. 26, No. 3 1992, pp. 18-26.

84
Direct Foreign Investment (DFI) is increasingly becoming an important
mode of market entry. It is estimated that half of all imports and
exports (foreign trade) is transacted between domestic companies and
their foreign aftiliates or parent companies abroad'®®. There is no
literature on the volume and/or value of dairy product imports by
companies in Malaysia from their parent or associate companies abroad.
However, a number of reports including reported comments by the
Australian Trade Commissioner in Malaysia emphasise that DFI is a
crucial market entry strategy for Australian exporters wanting to develop
business in Malaysia'®*.
The secondary data, especially the article by Davidson suggests that
Australian companies prioritise DFI into Singapore or other East Asian
destinations in preference to Malaysia. Australian investments,
particularly into Singapore show a strong re-export market focus. The
prospects for the Australian dairy product investments into Singapore
have to be evaluated in the context of investments in the dairy products
industry into these target markets. A number of sources identify
Malaysia as an important destination for DFI funds in ASEAN
163
164
Weidenbaum, Murray; 'The Business Response to the Global Marketplace', Jhe
Washington Quarterly. Winter 1992, pp. 173-185.
Parkes, Joe; 'Malaysia: Moving into Overdrive', Overseas Trading, June 1990, pp. 22-24.
Beringer, Graham; ' i t 's no Holiday in Malaysia', Business Review Weekly. March 19 1993, pp. 60-63.

countries
85
165
There is no data on the expansion of the dairy industry either through
DFI or upgrading of existing plant sizes. However, there is data to
suggest extensive European DFI into dairy industry development in the
Middle East - a target re-export market for Australian dairy companies
based in Singapore.
2.7 Competitor's strategy and activities
There are a select number of product market research reports particularly
by the United States Government and European Community members.
The article by Olscheske'®® is an useful model of these. There are
many general reports on United States and European Community and
New Zealand dairy industry activities in the market place. The London
Financial Times is an useful source of information regarding this'®''.
165
166
167
East Asia Analytical Unit, op. cit.. pp. 43-50.
Olscheske, J.H.; 1990 Asian Cheese Market Research in Japan. Taiwan. Hong Kong, Project of Mid America International Agri-Trade Council, USA, August 1990.
Blackweli, David; 'Commodities and Agriculture: Decision Expected on Future of Milk Board', The London Financial Times, 5 March 1991, Great Britain, p. 32.
Dickson, Tim; 'Churning the Cream of Cartels: Mounting Pressure to Reform the UK's Monopolistic Milk Marketing Boards', The London Financial Times, 16 August 1991, Great Britain, p. 1 1 .
Hall, Terry; ' Commodities and Agriculture: NZ Dairy Industry 'in Good Heart' -Gloom is Lifting after the Worst Season in Decades', The London Financial Times, 28 November 1991, Great Britain, p. 36.
Jackson, Tony; 'Lotta Bottle, Little Rivalry: The Lessons of a Proposed UK Milk Market Deal', The London Financial Times, 20th November 1991, Great Britain, p. 22.

86
CHAPTER THREE
3 THE AUSTRALIAN DAIRY INDUSTRY
3.1 Chapter Objectives
The objectives of this chapter are to outline the importance and the
strategies of the Australian dairy manufacturing industry. The strategies
of individual tirms will no doubt be different from that of the industry. In
this chapter the general industry strategy particularly as it applies to
export marketing is analysed.
3.2 Information on the Australian Dairy Industry
3.2.1 Current Position
The major features of the Australian dairy manufacturing industry can be
summarised as follows:
a) Important value adding industry
Measured on wholesale turnover values, the dairy industry is
Australia's third largest agricultural industry. Annual gross
revenue in 1992 exceeding A$ 4.5 billion,'®® approximately two
168 Australian Dairy Industry Council, op. cit.. p. 7.

169
170
171
172
87
and a half times the farmgate value of A$ 1.7 billion'®®. This
makes the dairy industry an important value-adding rural industry.
The dairy industry is the largest value adding industry among
Australia's major agricultural industries'^". This position
provides the industry considerable strength in negotiating with the
Government for subsidies and other regulatory support. It is
reported that " . . . the dairy industry remains one of the most
heavily assisted agricultural Industries in Australia^^^". The
Industry Commission estimated that in 1988-89 the effective rate
of assistance accorded to the dairy industry was 55 per cent in
comparison with 9 per cent for the beef industry, 20 per cent for
the sugar industry and 1 per cent for the wheat industry. The
average effective rate of assistance accorded to the agricultural
industry in general was only 9 per cent'^^, substantially lower
than the effective rate of assistance accorded to the dairy
industry.
Ibid., p. 5.
Taylor, op. cit., p. 18.
Office of Trade & Investment, op. cit.. p. 3 1 .
Idem.
Australian Bureau of Agricultural and Resource Economics; 'Submission 91.3 to the Industry Commission: Future dairy marketing arrangements', Canberra, April 1991.
Ibid., p. 6.

88
b) High productivity
Australia produced 6,661,000 tonnes of cows milk in 1991' ®
from a heard size of approximately 1.6 million head of cows'^*.
Australia accounts for approximately 1.6 per cent of the world's
dairy product output'^®. The average annual milk production
per cow in Australia exceeds 4,000 kgs/head'^®. The milk
yields of cows in Australia has continued to improve, increasing
from an average of 3,476 kgs/head in 1986 to 4,027 kgs/head in
1991'^^. In the same period the milk yield of cows in New
Zealand, Australia's major competitor in Malaysia, decreased from
3,478 kgs/head to 3,276 kgs/head'^®. The improving milk
yields in Australian farms makes the industry in Australia very
efticient in comparison to major competitors.
d) Important export industry
The Australian dairy industry is a major export industry. The dairy
industry contributes between A$ 600-700 million in exports sales
annually. Australia has 7 per cent share in world trade in dairy
173
174
175
176
177
178
Australian Dairy Corporation 1992 (a), op. cit., p. 4 1 .
Ibid..p. 38.
Australian Dairy industry Council, OP. cit.. p. 19.
Australian Dairy Corporation 1992 (a), op. cit., p. 39.
Idem.
idem.

89
products'^®. This provides the Australian dairy industry large
export volumes and therefore economies of scale in production.
e) Important rural industry
The Australian dairy industry includes 15,000 dairy farms. This
accounts for 12 per cent of all farms in Australia'®®. As such, it
is an important rural industry with strong lobby groups that can
intiuence Government policy.
f) Low cost producer
Compared wi th costs in other major dairy producing countries,
Australia has among the lowest cost of production at the farm
gate'®'. This is because dairy farming in Australia is based on
year round grazing of cows. This results in cost savings on feed
and capital investments such as for buildings to enable indoor
feeding in winter. In addition, the high cost of labour and the
lower productivity of labour in major producing countries provides
Australia comparative cost advantage in the production of
milk'®^
179
180
181
182
Taylor, op. cit.. p. 20.
Ibid., p. 18.
Ibid., p. 21.
Idem.
Australian Dairy Corporation 1992 (a), OP.cit., p. 5.

90
g) Major employer
The Australian dairy industry employs more than 50,000 people in
farms and factories. An additional 50,000 people are estimated
to be employed in various supporting roles'®®. As a major
employer, this gives the dairy industry a strong voice in
Government policy making.
h) Important manufacturing industry
The dairy manufacturing industry is Victoria's largest
manufacturing sector. Victoria produces 50 per cent of market
(liquid) milk, 86 per cent of butter and 50 per cent of cheese in
Australia. This too strengthens the industry's negotiating position
with the State Government in policy matters affecting the
industry.
i) Major exporter to Asia
The Australian dairy industry has traditionally been a major
exporter to Asia. More than 80 per cent of Australian exports of
dairy products are to Asia'®*.
183 Australian Dairy Industry Council, op. cit.. p. 7.
184 _ , Taylor, op. cit.. p. 20.
Australian Dairy Corporation 1992 (a), op. cit.. p. 56.

9 1
j) Strengths in key product categories
Nearly 80 per cent of Australian dairy export volumes are
generated from three products. The major export product
categories and their share of export volume are'®®:
Butter/butter oil 16.87%
Cheese 16.17%
Milk Powders 46.66%
3.2.2 Threats
a) Subsidised Products
The Australian dairy industry faces the threat of trade restrictions
in some markets and competition from subsidised EC and US
products elsewhere.
b) Overproduction In major countries
Subsidies to dairy farmers and resulting over production in major
dairy producing countries have depressed world prices for dairy
products. The 1970s and early 1980s were particularly difficult
years as the industry felt the effects of the downturn in prices
caused by substantial increase in production in EC and USA'®®.
185
186
Taylor, op. cit.. p. 2 1 .
Lembit, op. cit... pp. 1-2.

92
In the mid 1980s quotas on milk production and subsidies to
reduce dairy product stockpiles in EC resulted in reduction in milk
production and improvement in world prices for dairy
products'®^. However, prices fell in late 1980s. The depressed
conditions due to increase in dairy product stocks in EC and other
major dairy producing countries and therefore expanded export
subsidies are forecast to continue into 'the early 1990's
(Appendix 4)'®®. As such, no significant improvement in dairy
product prices is forecast in the short term'®®. It is reported
that the world market prices for dairy products react to a supply
response and not to demand responses. This is illustrated by the
example of how a 1 per cent increase in production in 1988-89 in
EC contributed to a fall in world prices for dairy products by 25
per cent'®°.
c) Competition from new entrants
The emergence of new exporters particularly Eastern European
countries such as Poland and the Czech and Slovak republics are
expected to depress world dairy product prices. Dairy products
from Eastern European countries have started to enter the world
187
188
189
190
Idem.
Lembit, op. cit.. 1-2, & 7.
Clark, OP. cit.. p. 18.
Ibid., p. 18.

93
market at very low prices'®'. Poland, for instance has moved
from being a net importer of butter to becoming a net exporter of
butter and milk powder. Poland sells butter in the international
market at approximately US $ 900 a tonne, compared to the
general average world price of US$ 1,600 a tonne'®^.
The reunitication of Germany is expected to result in East German
farmers being allocated quotas in EC leading to increase of EC
milk stocks'®®.
d) Competition in domestic market
Imports from New Zealand, particularly now with the full
implementation of the Closer Economic Relations (CER)
Agreement is another threat to the Australian dairy industry. In
1988, the Commonwealth Government announced accelerated
changes to the CER Trade Agreement with New Zealand. This
created further apprehension in the industry about its capacity to
withstand competition from New Zealand. A Victorian
Government Strategy Group for instance, recommended the
continuation of dorriestic price support for manufactured milk.
Lembit, op. cit.. p. 2.
Clark, OP. cit.. p. 18.
192 Lembit, op. cit.. p. 18.
193 Lembit, op. cit.. p. 2.

94
The rationale for this recommendation was that the lack of any
export capacity in the Australian industry will give New Zealand a
far wider scope for its pricing strategies in the Australian
market'®*. Imports from New Zealand particularly cheese and
wholemilk powder has been steadily increasing. By 1991/92 New
Zealand's volume market share in cheese increased to 8 per cent.
Australia also imported 4,200 tonnes of wholemilk powder from
New Zealand in 1991/92'®®.
e) Dairy substitute products
Competition from dairy substitutes such as margarine, soy based
alternatives to milk, imitation cheese and artiticial butter
tiavourings are also threatening the viability of the Australian dairy
industry. For example, in 1991/92 sale of margarine increased 1
per cent whereas sale of butter and butter blends decreased 3 per
cent'®®.
Sullivan, op. cit.. p. 2.
195
Australian Dairy Corporation 1992 (b), OP. cit., p. 14.
^ ® Ibid., p. 14.
95
f) Diminution in consumer perception
It appears that there is growing diminution in perception among
Australian consumers of dairy foods as important and valid
components of a balanced diet'®^.
g) Threat from private labels
Concurrent with worsening economic conditions in Australia
during the period 1988-1993, the sale of private labels of dairy
products increased'®®. Private labels are marketed on price
competitiveness. It, therefore, becomes difticult to develop a
brand market protile for Australian dairy products.
3.3 An analysis of Australian dairy industry strategies
The dairy industry has lobbied the Government for regulating trade in
dairy products and for the provision of incentives for exports. The
industry claims that these concessions are necessary to counteract the
pressures of over production and the trade practices of competing dairy
producing countries. The Government has responded through several
industry studies and plans. The major recent Government initiative in
this direction was the Dairy Produce Act 1986, commonly referred to as
the Kerin Plan'®®.
197 Australian Dairy Corporation 1992 (a), OP. cit.. p. 16.
198 Bonlac Foods 1992, op. cit., p. 9.
199 Australian Bureau of Agricultural and Resource Economics, op. cit., p. 21 ,

96
The industry adopted the Kerin Plan. The Kerin Plan is based on
domestic manufacturing milk price support and market support payment
system on exports. The support level was set at the New Zealand
import parity price^°°. The Kerin Plan ended in June 1992. An
industry commission inquiry into the Australian dairy industry that
recommended the removal of industry support schemes when the Kerin
Plan ceased was not accepted by dairy industry associations such as the
Australian Dairy Products Federation^°'. As a result of strong lobbying
by the Australian Dairy Products Federation, the Commonwealth
Government was persuaded to temporarily retain industry support
schemes^"^. However, the new marketing arrangement reduces
market support from 30 percent under the Kerin Plan to 22 per cent
initially. This is gradually phased down to 10 percent by the end of the
new arrangement in the year 2000^°®.
The industry's main focus appears to be the Australian domestic market
where the strategy is to have competitive edge against imports from
New Zealand and maximise returns from the sale of market (liquid) milk.
Sale of market milk is developed through promotion, advertising and
product line extension such as the introduction of speciality milk
Australian Dairy Products Federation, op. cit.. pp. 1-2.
201 l u j Ibid., p. 7.
202 Australian Dairy industry Federation, op. cit., p. 7.
203 Australian Dairy Industry Council, op. cit.. p. 9.

97
(example: calcium enriched milk). The sale of market milk in Australia
has increased rapidly^"*.
Dairy farmers seem to support the removal of price controls in the
industry. For example in 1985, following non approval by the
Government of price increase for domestic market milk for eighteen
months, dairy farmers blockaded milk deliveries to processors. The
Government commissioned an arbitration by Mr Justice Robinson. The
Robinson Report recommended a phased but wide ranging deregulation
of the dairy industry including pricing and zoning regulations at the retail
and wholesale levels^"®. However, price controls at the wholesale and
retail levels and restrictions on the free movement of milk between
states continue to be enforced by the Government.
States have generally reacted strongly to cheaper milk coming from inter
State for processing. This was evident in the 'Midland Milk Crisis' in the
period 1986-1987. Contiict developed between Victoria and New South
Wales when Midland Milk Company threatened to trade milk into Sydney
using raw milk purchased at lower than the statutory price^"®.
Victorian Dairy Industry Authority, OP. cit. , p. 6.
205 c. ... . _ Sullivan, op. cit.. p. 2.
206 ,. . . -Ibid., p. 2.

98
Australia's milk production increased in 1991 because of improved yields
and the over capacity generated through larger dairy herds because of
the trend towards higher world prices in the mid 1980s^°^. These
trends in the dairy industry are highlighted in Table 3. However, there
were shortages of manufacturing milk in some states such as New
South Wales and Western Australia. In 1991/92 milk prices again
increased because of production shortfalls in other countries (EC,
Eastern Europe) and the fall in the value of the Australian dollar that
contributed to increased exports^"®.
The Australian^dairy manufacturing industry is rationalising its operations
through mergers, alliances and joint ventures between inter-state
companies as a strategy to improve its competitive position^"®. The
industry is dominated by some major producers such as National Foods
Limited, Bonlac Foods, Murray Goulburn, Nestles and Kraft Foods. Other
than Nestles and Kraft Foods, major dairy companies in Australia are
Australian owned. Nestles and Kraft are Australia's major exporter of
dairy products. This may be because these multi-national companies
207 Lembit, op. cit., p. 3.
Bonlac Foods, op. cit.. pp. 6-7.
Murray Goulburn Cooperative Limited, oo. cit.. p. 2.
209 Bonlac Foods, op. cit., p. 4.
Australian Dairy Industry Council 1992, op. cit., p. 5.

99
have developed a brand position in export markets and are represented
there through subsidiary and associate companies.
TABLE 3: TRENDS IN THE AUSTRALIAN DOMESTIC DAIRY I N D U S T R Y 2 1 0
TOTAL MILK
•market
-manufacturing
Dairy Cows(numbers)
Milk yields
MANUFACTURED PRODUCTS
-Butter
-Cheese
-Wholemilk powder
-Skim milk powder
RETURNS TO FARMERS
-Manufacturing Milk
-Market milk
Unit
ML*
ML*
ML*
'000
L/cow"
kt'
kt*
kt"
kt*
c/L"
c/L"
1987-
88
6,127
1,668
4,459
1,697
3,610
94
176
64
120
19.3
36.2
1988-
89
6,291
1,695
4,596
1,683
3,736
96
191
68
119
23.2
37.9
1989-90
6,262
1,695
4,566
1,637
3,825
106
175
56
113
24.4
39.7
1990-
91
6,310
1,700
4,610
1,604
3,934
100
185
55
120
21.9
40.5
• ' LITRES COOO)
• ' LITRES/COW
• " KILO TONNES
• ' CENTS/LITRE
The major Australian dairy companies are often the result of the
amalgamation of smaller co-operatives^". The rationale of most of
210
211
Lembit, op. cit.. p. 3.
Riddell Information Services 1992, oo. cit.. pp. 87, 88, 303, 471 , 503 519.
Riddell Information services 1991, op. cit.. pp. 75, 84, 112, 318, & 426.
Australian Marketing Publications & Services, OP. cit.. pp. 90, 149 & 220.

100
these amalgamations was that the formation of larger companies will
result in economies of scale and will improve the competitive position of
the companies both domestically and internationally. Sometimes, the
shortage of market milk hastened rationalisation of operations and
amalgamations^'^.
The Australian dairy industry depends on several dairy industry
organisations to regulate and co-ordinate the operations of the industry
in Australia. These include the Australian Dairy Corporation, Australian
Dairy Farmers Federation, Australian Dairy Products Federation, the
Australian Dairy Traders Federation and the Market Milk Federation of
Australia. Several other Government departments such as the
Department of Agriculture and the Department of Primary Industry also
co-ordinate and control dairy industry operations^'®.
Even among these dairy industry organisations, rationalisation of
operations is occurring. During 1992 for example, the Australian Dairy
Traders Federation and the Australian Speciality Cheese Producers
Committee merged with the Australian Dairy Products Federation.
212
213
Lembit, op. cit., p. 3.
Australian Dairy industry Council; 'Dairy Australia: Strategy for the Future', December 4 1991.
'Dairy Industry Organisations', Resource Material (RAB:RB:79/50), Gilbert Chandler institute of Dairy Technology, Australia 1979, pp. 1-13.
Donnelly, op. cit.. pp. 39-41 .
Gibson, op. cit.. pp. 23-38.
1 0 1
Discussions between the Australian Dairy Products Federation and the
Market Milk Federation are underway to merge the operations of these
two organisations^'*.
Statutory organisations such as the Australian Dairy Corporation and the
Victorian Dairy Industry Authority through their marketing and
promotional programs have played an important strategic role in meeting
threats facing the industry. Review of their Annual Reports and other
literature suggest a pre-eminent focus on promotional activities in the
domestic market where dairy substitute products are popular because of
diminution in the perception of dairy products as an essential component
of Australian diet^'®.
The Australian dairy manufacturing industry appears divided on whether
it should concentrate in the domestic market, increase exports of bulk
commodities or seek niche markets for value-added and branded
manufactured dairy products. The prevailing view is that exports,
particularly to Asia, should be the strategy^'®. The Australian Dairy
Corporation is preparing a protile of the various Asian market
opportunities to detine target markets for more detailed research^'^.
214 Australian Dairy Products Federation Inc., oo. cit.. pp. 2-3.
215 Victorian Dairy industry Authority, oo. cit.. pp. 6-9.
21fi
Bonlac Foods, op. cit.. pp. 3-4 and p. 6.
Australian Dairy Products Federation, OP. cit., p. 9.

102
3.4 Weakness of the Australian dairy industry
The Australian dairy industry is highly regulated, protected, not
diversitied internationally nor segmentally within markets and is not
diversitied on product category basis. The weaknesses of the industry
include:
a) Lack of geographical market diversification
As explained in 3.2.1 (i) more than 80 per cent of Australian dairy
exports are to Asia. This is concentrated in some major
destinations such as Japan, Philippines, Singapore, Thailand and
Malaysia^'®. This contrasts with the dairy industry in New
Zealand. The New Zealand dairy industry has the following
geographical market spread:^'®
218
219
North America, Korea
Latin America,
Asia (excluding
Russia
TOTAL
REGION
Europe, Japan, Australia
Africa
Japan
and Middle East
and S. Korea)
SALES (%)
and South 47
26
22
5
100
Australian Dairy Corporation 1992 (a), op. cit.. p. 56.
Dobson, William D; 'The Competitive Strategy of the New Zealand Dairy Board,
Agribusiness. Vol. 6 No. 6 , p. 548.
103
b) Overdependence on a limited product sales mix
Australia has dominant market share for a few products in Asia.
It has 80 per cent market share of Skim Milk Powder (SMP), 75
per cent market share of Butter/Anhydrous Milk Fat (AMF), 42 per
cent market share of Whole Milk Powder (WMP), 73 per cent
market share of Cheese"". Most of these exports, other than
cheese of which nearly 75 per cent was exported to Japan"',
are bulk WMP, SMP and butter oil for supply to the industrial
market segment"^.
Australia is, therefore, nearly not represented in the branded
consumer pack and the food service product lines. In contrast,
approximately 35 per cent of NZDB's exports are branded
consumer and specialised (non bulk) products"®. This
concentration on the exports of bulk commodities has exposed the
industry to the threat of subsidised exports from EC and USA.
c) Market Entry Strategies
Australian dairy product companies, except for the investments by
Bonlac Foods in a manufacturing plant in Singapore and
220 Australian Dairy Corporation 1992 (a), OP. cit., pp. 53-63.
221 Australian Dairy Corporation 1992 (a), op. cit.. pp. 56-57.
222 Australian Dairy Corporation 1992 (a), oo. cit.. pp. 58-61.
223 Dobson, OP. cit., p. 544.
224
225
104
Bangladesh^^*, Ausdairy's investments in a plant in
Thailand"® and the recent investment of Associated Dairies in a
plant in China"® have no investment in processing and/or
packaging facilities overseas. In contrast, NZDB has 11
companies in Asia alone. NZDB has processing and/or packaging
operations in Singapore, Malaysia, Indonesia, Philippines,
Thailand, Taiwan, Hong Kong and Sri Lanka"^
3.5 Opportunities for the Australian dairy industry
a) Strong base to develop sales
The Australian dairy industry has considerable experience in Asia
because of the long historical presence in the market. Although
the industry has not succeeded in developing the sale of branded
value added dairy products, the lack of success in this area and
the falling market share in some markets should alert the industry
to the need for change in its strategies. This places the Australian
industry at an advantage in comparison to new entrants to the
market.
Bonlac Foods, op. cit.. pp. 8-9.
Australian Dairy Corporation 1991, loc. cit.
"® Webb, Richard; 'Associated Dairies raises $3.45m', Australian Financial Review,
24 April 1993, p. 29.
227 Dobson, OP. cit.. p. 545.

105
b) High growth markets
The high economic growth in Asia and the concurrent demand for
more varied food products, and the Commonwealth and State
Government food export initiatives should assist the Australian
dairy industry. The Australian Government provides incentives
and support the export development of value added food
products. The Agri-Foods strategy statement announced by
Senator Button and Simon Crean included several measures to
facilitate export of food products"®. This strategy is being
carried out by the Agri-Food Council. The A$ 5 million 'Clean and
Green' campaign announced by the Agri-Foods Council, for
example, should enhance Australia's image as a supplier of clean
and high quality food products"®.
The ADC's 'Australian Dairy Mark Program' is a strategy at
generic promotion directed at informing customers of the health
and nutritional benefits of dairy products in comparison with dairy
substitutes"". It is also a strategy at promoting a quality image
of Australian dairy products. Reports by the ADC suggest that
228
229
230
Departments of industry. Technology & Regional Development and Primary Industries and Energy, 'Briefing Note on the Agri-Food Industries Strategy and the work of the Agri-Food Council', Agri-Food Council Secretariat, Canberra, June 1993.
Fabian, Garry and McGregor, Ken; 'Canberra in - At Last', Fnnd Manufacturing
News. September/October 1992, p. 13.
Australian Dairy Corporation 1992 (b), oo. cit.. p. 12.

106
the recall rate of the mark/brand image in Australia is h igh" ' .
The extent to which the Dairy Mark is used as a promotional
strategy in Malaysia cannot be discerned from available secondary
sources. However, it is a promotional strategy that can be useful
in Malaysia where dairy substitutes such as margarine and soy
milk are popular in some segments of the market.
c) Negative perception of products from competitors
Australia is generally perceived in Asia as a developed economy
with very high and rigorous standards in food production and
processing. Anecdotal evidence suggest that Australia is
perceived as having an educated and discerning domestic market
with strong consumer groups who monitor the nutritional quality
and hygiene in food production.
The Chernobyl nuclear disaster in Russia and reported
contamination of agricultural and dairy products in Europe also
meant that food products, particularly dairy products from the
United States, New Zealand and Australia were preferred to
imports from Europe. The report 'NSW Processed Food
Development Strategy' for instance forecasts that the perception
of Australia as a fresh and clean environment provides an
231 Australian Dairy Corporation 1992 (b), op. cit., p. 19.

107
advantages in the export market"^ Although this may not
provide the Australian industry with any particular competitive
advantage over New Zealand, it is still a competitive edge over
other major producers in Europe.
3.6 Major Australian dairy product manufacturers and processors
Total milk production in Australia has stabilised at approximately
6,300,000 litres"®. The undermentioned 20 companies process 90
per cent of the total milk output in Australia"* making them the most
important dairy manufacturing companies in Australia.
232
233
NSW Processed Food Task Force, op. cit., p. 3.
Australian Bureau of Agricultural and Resource Economics, op. cit., p. 11.
" * Dairy Research and Development Corporation, Portfolio Balance Workshop #1 ,
Travelodge Hotel, Melbourne 1992.
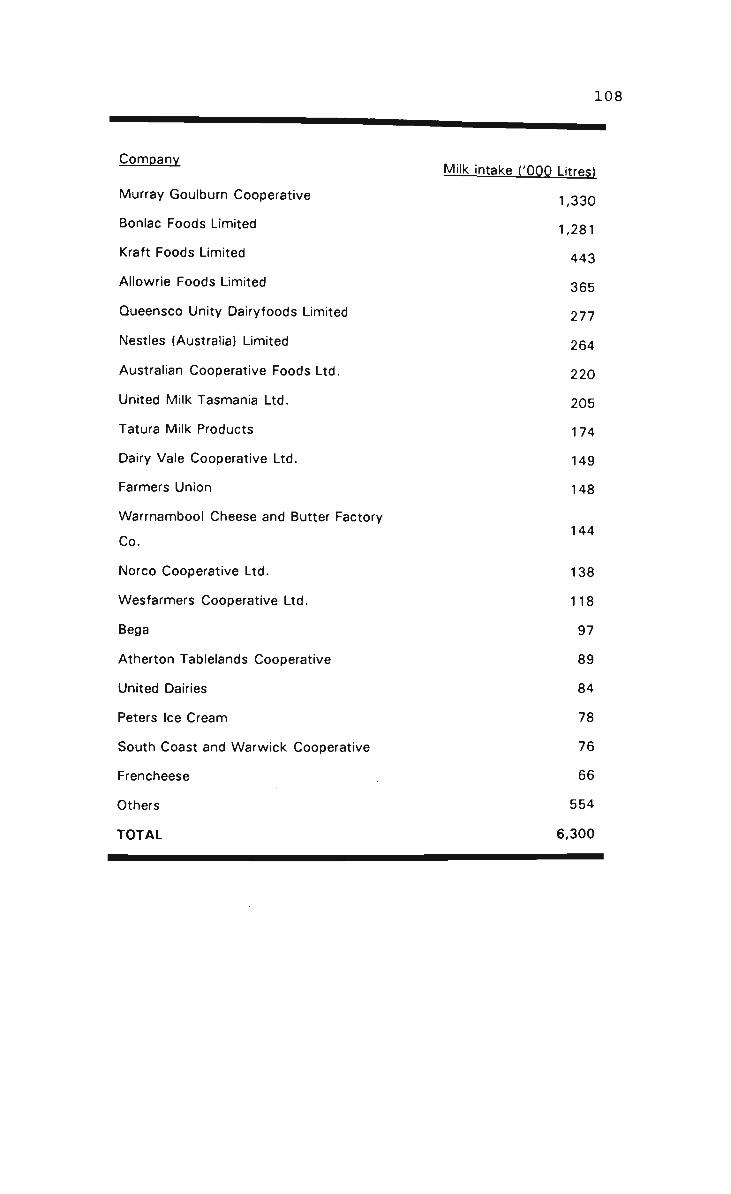
1 0 8
Company ,. .„ . Milk intake COOO Litres!
Murray Goulburn Cooperative .j 33Q
Bonlac Foods Limited -^ 201
Kraft Foods Limited 443
Allowrie Foods Limited 365
Queensco Unity Dairyfoods Limited 277
Nestles (Australia) Limited 264
Australian Cooperative Foods Ltd. 220
United Milk Tasmania Ltd. 205
Tatura Milk Products 174
Dairy Vale Cooperative Ltd. 149
Farmers Union 148
Warrnambool Cheese and Butter Factory 144
Co.
Norco Cooperative Ltd. 138
Wesfarmers Cooperative Ltd. 118
Bega 97
Atherton Tablelands Cooperative 89
United Dairies 84
Peters Ice Cream 78
South Coast and Warwick Cooperative 76
Frencheese 66
Others 554
TOTAL 6.300

109
CHAPTER FOUR
4 AN OVERVIEW OF THE MARKET
4.1 Chapter Objective
The objectives of this chapter are to,
4.1.1 Briefly trace the historical and economic policy background in Malaysia.
4.1.2 Outline and discuss contemporary economic data and issues on Malaysia.
4.1.3 Describe the current and projected demographic and socio-economic profile of Malaysia.
4.1.4 Describe and analyse the features, characteristics and trends in the retail, wholesale and food distribution channels.
4.2 Rationale
The objective of identifying the above characteristics are to understand
the factors that intiuence demand for dairy products in Malaysia.
Research in other markets suggest that socio-demographic, economic
and cultural factors influence the consumption of food products"®.
The international market for food products is characterised as having
undergone several phases of demand. For example, the 'Youth
Revolution', a phase of signiticant purchasing power among children and
young adults was the feature in several Western countries in 1960s and
235 Best, OP. cit.. pp. 16-26.

110
1970s. In the 1980s the purchasing power of young, single
professionals ('Yuppies') and families with two income adults grew
rapidly. In the 1990s the trend in most Western countries have been the
aging population and consequently the growing importance of niche
markets in this segment. It is important to recognise these changes as
factors such as tiavour, texture, preparation attributes, packaging
graphics and distribution channels will all have to match the
demographic protiles of the market"®.
4.3 Historical and Policy Background
4.3.1 Administrative Structure
Malaysia is a federation of thirteen (13) states, of which eleven are in
the Malay Peninsula (West Malaysia) and the other two states
collectively called East Malaysia are in the northern part of Borneo.
West Malaysia is often discussed as two distinct regions, namely the
East Coast and the West Coast. The two regions are separated by the
Main Range that runs through the centre of the peninsula.
East and West Malaysia are separated by 400 miles of the South China
Sea.
"® Ibid^ pp. 16-26.

I l l
The states that make up the Federation are:
West Malavsia
a) The west coast is made up of the following eight (8) states:
Perils, Kedah, Province Wellesley, Perak, Selangor, Negeri
Sembilan, Melaka, and Johor.
b) The east coast is made up the following three (3) states:
Kelentan, Trengganu, and Pahang.
East Malavsia
c) East Malaysia is made up of the two states Sarawak and Sabah in
Borneo.
4.3.2 Historical Background
Historically the Malay peninsula was a transit zone for maritime
commerce between China and India"^. From as early as 600 BC
traders and explorers from South India were in contact with the Malay
peninsula"®. 'Indianized' states with concepts of monarchy, social
order, urban planning, religion and literature were widespread in the
Malay peninsula until one thousand AD"®. Hindu intiuence remains
signiticant in Malay customs and language.
237
Marcus, op. cit.. p. 55.
"® Dixon, OP. cit.. p. 42 citing Wheatley in South East Asia in the Wnrlri Economy.
"® Ib id^ p. 43.

112
The next intiuence Islam, was introduced into the peninsula by Indian
traders from Gujerat and Bengal in the seventh century AD^*°.
Subsequent Islamic intiuences from the Middle East and Southern India
also had signiticant impact on the culture of the Malays. Islam spread
rapidly in the Malay peninsula in the fourteenth and tifteenth century
AD^*'.
From the 1830s British influence began to expand in the Malay
peninsula^*^. By 1914 the British had established a 'varied and
complex pattern of control over the entire present day Malaysia'^*^.
Economic activity was concentrated in present day West Malaysia^**.
Chinese mining activity and migration to work in the tin mines started in
the mid 1840s in areas such as Larut that had been acquired by the
British *®. From the 1890s there was a gradual expansion of British
plantation interests^*®. With the development of plantations there was
large migration from Southern India to work in the plantations.
240
241
242
243
244
245
Ibid., p. 45.
Idem.
Ibid., pp. 69-71.
Ibid., p. 75.
idem.
ibid., pp. 74-75.
^^^ Ibid., p. 103.

113
British colonialism resulted in the introduction of Western education, the
British model of law and administration and the introduction of the
Westminster model of multi-party parliamentary system of government
at independence.
4.3.3 Economic and Public Policy Background
From the colonial period up to the mid 1980s, the Malaysian economy
was largely dependent on primary products. The only signiticant change
was the widening category of primary commodities produced. The main
primary product commodities produced by Malaysia are tin, rubber,
cocoa, palm oil, tropical woods, petroleum and natural gas.
Malaysia has traditionally being a relatively wealthy country because of
good natural resource endowments. However, studies by Kravis et al
using the Atkinson inequality index have concluded that Malaysia has
the most significant inequality in income distribution among the Pacitic
Basin developing countries^*^.
247 Kravis, Irving, Robert, Summers, and Heston, Alan; 'international comparisons of real product and its composition'. Review of Income and Wealth. No.l (March) 1988.

114
Income distributional issues especially as it pertains to the wealth and
incomes of the three major ethnic groups (Malay, Chinese and Indian)
are central to Malaysian economic and social policy^*®.
There have been substantial economic policy changes since 1969.
Many of these changes are a result of earlier policy initiatives at macro
economic reforms. These changes influence trade opportunities and
business and investment decisions into Malaysia. These are discussed in
a later section of this chapter.
4.4 The Contemporary Economic and Policy Issues
4.4.1 Gross National Product
Malaysia has been characterised by high economic growth rates^*®.
Real Gross Domestic Product (at constant 1978 prices) grew at an
average of 9 per cent for the period 1988 to 1991^®". This is among
the highest growth rates in the world for the last four successive years.
248
249
250
Marcus, op. cit.. p. 56.
Crouch, Harold; 'Malaysia Neither authoritarian nor democratic', in Southeast Asia in the 1990s: Authoritarianism. Democracy & Capitalism, Hewison, Kevin at_ai (Editors), Allen & Unwin Pty. Ltd, Australia 1993.
Economic Research Department, op. cit.. p. 16.
East Asia Analytical Unit, op. cit.. p. 16.
115
The Gross National Product (GNP) in 1991 at constant 1978 prices grew
by 8.2 per cent to MR$ 82.2 billion (A$ 48 billion)^^!. j he GNP is
forecast to grow to MR$ 97.2 billion (A$ 57 billion) by 1993. The per
capita GNP at current prices is forecast to increase from the 1991 level
of MR$ 6,796 (A$ 4, 000) to MR$ 8,318 (A$ 4,900) by 1993.
With a GDP of A$ 67 billion (at constant 1978 prices) in 1991, Malaysia
has the third highest GDP in the ASEAN region. Only Indonesia (GDP
A$ 166 billion) and Thailand (A$ 131 billion) which have much larger
populations are larger economies in ASEAN^® .
Some studies claim that the rapid economic growth in ASEAN countries
is spawning a burgeoning middle class with growing disposable
incomes"®. This aftiuence is more obvious in Malaysia than in other
countries in ASEAN. It is forecast that by the year 2020 Malaysia will
reach OECD levels of affluence^®*. There is less evidence of income
disparity in Malaysia than in countries such as Indonesia or Thailand.
^®' ibid.. 0. 16.
® jbid^, p. 12.
253 , . Idem.
Prime Minister's Science and Engineering Council; Food into Asia: The Next Steps, Office of the Chief Scientist (Department of Prime Minister and Cabinet), Australian Government Publishing Service, Canberra 1994, pp. 3-6.
" * Ib id^ p. Xli

116
Even a casual visitor to ASEAN can observe the generally higher
standards of living in Malaysia compared with Indonesia or Thailand.
This observation contradicts the Atkinson study"®. However, the
Atkinson study used 1973 data for Malaysia whereas data for other
countries were from much later periods. For example, 1976 data were
used for Indonesia and 1975/76 data were used for Thailand.
Improvements in income and living standards in Malaysia is most
signiticant among the indigenous Malays who, because of their
disproportionate concentration in subsistence farming, had lower per
capita incomes than the Chinese and Indians^®®.
The ethnic and rural-urban income disparities in Malaysia are summarised
in Table 4.
255
Kravis, op. cit.. p. 34
Marcus, op. cit., p. 56

117
TABLE 4: MEAN HOUSEHOLD INCOMES IN WEST MALAYRIA257
GROUP
Malay
Chinese
Indian
Others
Rural Average
Urban Average
All Households
MEAN HOUSEHOLD INCOME
(MR$ per month)
172
394
304
813
200
428
264
POOR HOUSEHOLDS (%)
74
17
8
1
86
14
Improvement in Malay incomes was most obvious with the introduction
of the aftirmative 'New Economic Policy' (NEP) in 1969. Among other
initiatives, the NEP emphasised rural development. This is partly the
result of 'political representation of rural Malay interests institutionalised
in the NEP after 1969^^^'
The NEP resulted in substantial improvement in Malay and consequently
rural poverty in Malaysia. By 1985 for example, a World Bank survey
estimated that incidence of poverty in Malaysia had declined 9 per cent
within 8 years. The report claimed that Malaysia had the lowest ratio of
population below the poverty line in ASEAN. The summary of the
results of the World Bank survey are reproduced in Table 5.
257
258
Dixon, OP. cit.. p. 182.
Ibid., p. 185.

118
TABLE 5: WORLD BANK SURVEY ON THE INCIDENCE OF POVERTY^^^
Country
Indonesia
Malaysia
Philippines
Thailand
SURVEY (Year)
1976-79
1974-78
1974-78
1975-76
RURAL*
51
46
44
34
URBAN'
28
16
39
15
TOTAL*
47
37
42
31
WORLD BANK SURVEY*
39
28
52
31
* % of population below poverty line
The most signiticant result of the NEP was the substantial improvement
in the economic well being of the Malays. In 1957 Malays made up 22
per cent of the four middle class occupational categories. However, by
1990 Malay participation in these occupations had reached 48.1 per
cent"". In 1990 about 35 per cent of the Malaysian population were
classed as being engaged in middle class occupations"'.
The rural development policies of the Malaysian Government under NEP
are reported to have reduced the incidence of rural poverty in West
Malaysia from 58.7 per cent in 1970 to 19.3 per cent in 1980"^
Reduced incidence of poverty is most signiticant in States with large
Malay populations such as Kedah, Kelentan and Trengganu (Appendix
259
260
261
262
Ibid., p. 210 citing World Bank reports.
Crouch, OP. cit.. pp. 142-143.
Ibid., p. 143.
Ibid., p. 149.

119
5). In 1976, 60-70 per cent of households in these states were classed
as poor. By 1984 poor households in these States declined to 30-40
per cent"®. The incidence of poverty among Malays is reported to
have declined from 65.0 per cent in 1970 to 20.8 per cent in 1980" * .
The conditions in Thailand and Indonesia are very different. In these
countries, Chinese minorities and some privileged elite with political
power control the economic wealth"®.
4.4.2 Private Consumption Expenditure
Private consumption expenditure in Malaysia has progressively
increased. Private consumption expenditure at constant prices increased
from MR$ 24,445 (A$ 13,600) in 1980 to MR$ 44,281 (A$ 25,000) in
1991266 j|-,g trend in private consumption expenditure are shown in
Table 6.
263
264
265
266
ibid., p. 214.
Crouch, OP. cit.. p. 149 quoting Government of Malaysia, The Second Perspective Plan 1991-2000. Kuala Lumpur, Malaysia 1991.
'Indonesia: The Long March', The Economist, April 17th 1993 pp. 3-18.
Economic Research Department, loc. cit.

120
TABLE 6: PRIVATE CONSUMPTION EXPENDITURE |N MAI AYSIA 1980-19fiQ (MYR mi l l ion)"^
YEAR
1980
1986
1987
1988
1989
CURRENT PRICES
26,946
36,574
37,764
44,801
53,505
CONSTANT PRICES
24,445
26,369
26,913
31,149
36,100
Consumer prices, particularly for food products, have been relatively
stable in Malaysia. The Consumer Price Index for food increased from
100 in the base year 1980 to only 131.1 in 1989, an average annual
increase of only 3.1 per cent"®. The trends in the consumer price
index are shown in Table 7.
TABLE 7: CONSUMER PRICE INDEX OF WEST MALAYSIA 1986-89(%) 2S9
1980 = 100
FOOD
BEVERAGE & TOBACCO
CLOTHING & FOOTWEAR
RENT, FUEL & POWER
HOUSEHOLD EQUIPMENT
MEDICAL CARE & HEALTH
TRANSPORT & COMMUNICATION
EDUCATION GOODS & SERVICES
1985
122.1
152.5
120.6
138.7
113.3
133.2
123.1
103.8
1986
122.4
155.0
121.2
140.0
114.0
135.1
123.3
104.2
1987
121.8
165.9
121.7
139.0
115.4
136.3
126.9
106.6
1988
126.4
168.4
124.3
136.2
118.7
138.3
135.4
108.3
1989
131.3
170.7
126.4
135.1
122.0
140.6
144.7
108.9
267
268
269
Jabatan Perangkaan Malaysia, loc. cit.
Euromonitor, op. cit., p. 1217.
Jabatan Perangkaan Malaysia 1991 . loc. cit.

1 2 1
Analysis of the data in Table 7 show that concurrent with increased
economic wealth in Malaysia, real private consumption expenditure
particularly for food products has increased signiticantly.
4.4.3 Economic Structure
The manufacturing, mining and quarrying, and the services sectors are in
that order the three fastest growing sectors of the Malaysian economy.
In 1991 (at constant 1978 prices), the manufacturing sector grew by
13.9 per cent to MR$ 24.3 billion (A$ 14.29 billion), the construction
sector grew by 14.6 per cent to MR$ 3.2 billion (A$ 1.88 billion), and
the services sector grew by 10.4 per cent to MR$ 37.3 billion (A$
21.94 billion)^^". By 1991 these three sectors accounted for more
than 80 per cent of Malaysia's Gross Domestic Product^^'. The
structural changes in the Malaysian economy are signiticant. From a
largely primary producing economy based on tropical plantation
agnculture and mining, Malaysia has transformed into a rapidly
industrialising economy. Agriculture, livestock, forestry and fishing
recorded a low growth rate of 0.04 per cent in 1991"^ .
Economic Research Department, op. cit.. p. 16.
271 , . Idem.
Idem.
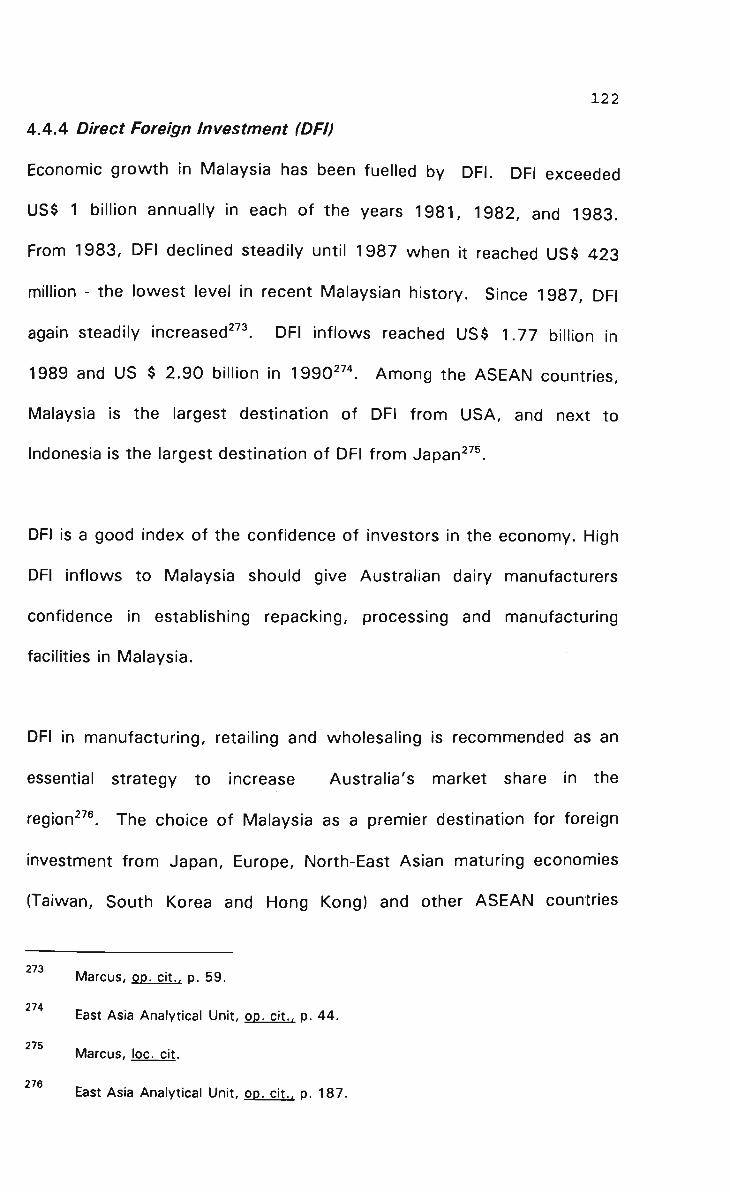
122
4.4.4 Direct Foreign Investment (DFI)
Economic growth in Malaysia has been fuelled by DFI. DFI exceeded
US$ 1 billion annually in each of the years 1981, 1982, and 1983.
From 1983, DFI declined steadily until 1987 when it reached US$ 423
million - the lowest level in recent Malaysian history. Since 1987, DFI
again steadily increased^". DFI intiows reached US$ 1.77 billion in
1989 and US $ 2.90 billion in 1990"*. Among the ASEAN countries,
Malaysia is the largest destination of DFI from USA, and next to
Indonesia is the largest destination of DFI from Japan"®.
DFI is a good index of the confidence of investors in the economy. High
DFI intiows to Malaysia should give Australian dairy manufacturers
confidence in establishing repacking, processing and manufacturing
facilities in Malaysia.
DFI in manufacturing, retailing and wholesaling is recommended as an
essential strategy to increase Australia's market share in the
region"®. The choice of Malaysia as a premier destination for foreign
investment from Japan, Europe, North-East Asian maturing economies
(Taiwan, South Korea and Hong Kong) and other ASEAN countries
273 Marcus, op. cit.. p. 59.
274
East Asia Analytical Unit, op. cit.. p. 44.
Marcus, loc. cit. 276 _
East Asia Analytical Unit, op. cit.. p. 187.

123
particularly Singapore"^ the synergy of Malaysia's market size to that
of Australia, similarities in the legal systems of the two countries,
political stability and the widespread use of English in business and
commerce should make Malaysia an attractive investment proposition to
Australian investors in comparison with other countries in Asia.
4.4.5 Trade Policies
Malaysia offers signiticant'investment incentives aimed at developing a
mixture of export promotion and import substituting regimes"®. Not
withstanding the limitations of soil and climatic conditions, Malaysia is
actively encouraging the setting up of large scale integrated food
processing companies. In a recent interview"®, Dato Sadasivam the
Director General of the Malaysian Industrial Development Authority
(MIDA) highlighted opportunities for new product development through
combining imported and local raw materials in food production which
will result in cheaper alternative products. Interestingly, he illustrated
the opportunities for this through two examples in the dairy industry.
Filled milk is being manufactured using palm oil fat to take advantage of
the lower cost Malaysian palm oil replacing expensive imported butter
277
278
279
East Asia Analytical Unit, op. cit.. pp. 46-47.
Dixon, OP. cit.. pp. 16-17.
Marcus, op. cit.. p. 6 1 .
'Unveiling a grab bag of incentives - Malaysia's new gamepian for its food industry', Asia Pacific Food industry. Vol. 3 No 7 July 1991, AP Trade Publications Pty Ltd., Singapore pp. 27-30.

124
fat. Dato Sadasivam also suggested the possibility of producing cheaper
milk substitute through combining dairy milk wi th soy mi lk"" , a
product category that Nestles has since introduced into Malaysia.
There is signiticant tariff protection for industries. The average effective
rate of protection (ERP) increased sharply from minus five (-5) percent in
1965 to 173 percent in 1 9 7 8 " ' . Estimates of ERP after 1978 are not
available. However, researchers contend that the policies pursued in the
1980s have raised ERP's further"^.
Even in international trade policies, the peculiar ethnic balance and the
income distributional issues based on ethnicity have substantial
intiuences on policy making. There is for instance, opposition to greater
tariff protection on the argument that this wil l only be of benefit to the
non indigenous ethnic groups"®.
Despite the publicity regarding intra ASEAN trade, the growth in trade
between Malaysia and its ASEAN partners has not been significant. The
" ° ibid^ p. 29.
281 Marcus, op. cit.. p. 61 ,
282
283
Marcus, op. cit.. p. 61 citing Kamal, Salih, Mohamed Haflah Piei, and M. Sahathavan; 'Trade Policy options for Malaysia, in Mohamed Ariff and Tan Loong-Hoe, eds.. The Uruguay Round: ASEAN Trade PoNcv Options. Institute of South East Asian Studies, Singapore, 1988.
Ariff, Mohamed and Hal Hill; 'Industrial policies and performance in ASEAN's "Other Four", Paper presented at the Fifteenth Pa'^ific Trade and Development Conference. Japan 26-29 August 1985.

125
share in the total imports and exports between Malaysia and its ASEAN
partners is shown in Table 8"* . The low growth in intra ASEAN trade
is probably because the economies of these countries are similar and
therefore competing rather than complementary in character. Based on
this analysis, the researcher suggests that countries within ASEAN will
not be good production bases for re-export to other countries as there is
no integration in the manufacturing policies among the ASEAN countries.
As such, the relaxation of tariffs under the ASEAN Free Trade
Agreement (AFTA) is not expected to increase intra ASEAN trade.
The Malaysian currency (Ringgit) was tioated in 1973. Malaysia allows
the free repatriation of profits. These monetary and tiscal policies are
attractions for the establishment of repacking, processing and
manufacturing operations in Malaysia.
284 Marcus, op. cit., p. 65.

TABLE 8: MALAYSIA'S INTRA ASEAN TRADE
126
COUNTRY
THAILAND
PHILIPPINES
INDONESIA
SINGAPORE
IMPORTS (%)
1966
1.0
1.2
n.a
n.a
1988
2.0
1.5
2.0
19.3
EXPORTS (%)
1966
7.6
0.7
7.6
n.a
1988
3.0
0.8
3.0
13.2
4.5 Demography
4.5.1 Population
The population of Malaysia in 1990 was 17.3 million - almost
equivalent to that of Australia"®. By 2020 the population is forecast
to increase to 26.6 million"®. Thus, Malaysia is forecast to have an
additional 9.3 million people in the next thirty years.
4.5.2 Rural-Urban Divisions
Concurrent with the structural changes in the economy, the level of
urbanisation in Malaysia increased (Diagram 5).
285
286
Keyfitz, op. cit., p. 230.
Idem.

127
DIAGRAM 5: POPULATION GROWTH TRENDS IN MALAYSIA
30 f
25
20
15
10
5
0 ^
- H ^ ^ ^ ^
1 9 8 0 ^
L ^
h"— ~ 8BHi^^w^^^B|'^yB
I ^ W H S 8 ^ 9
i^^M^M^M
9 9 0 ~ " ^ ? r i ^ 2000
^ ^ ^ ^ - ^
^^^ta^-d^SSiimf^^'^^^'^^'f^^SP^^^^^^^uU "~
l-^^^H^^B^H^n8^Bl!w^EHK^H
«MB^^^^^^^^^Bffi^^^^^9B^^^^^^g^^H~ "
20IC
^HB^SI^^^^K^S^^^I ' ~
>02C
^ ^ T o t a l Population • ^U rban Populat ion
Source: Keyfitz, N. andflieger, W.; World Population Growth andAeim: Demoeraphic Trends in the Late Twentieth Century. The University of Chicago Press, Chicago 1990, pp 230.

128
The pace of urbanisation in Malaysia is shown in Table 9. It is forecast
that by the year 2020 Malaysia will have more than 64 per cent of its
population classed as urban i.e. Malaysia will change from being a
largely rural community to a largely urban community. With a projected
population of 26.6 million in the year 2020, the urban population in
Malaysia will be nearly 17 million.
TABLE 9: OBSERVED AND PROJECTED POPULATION DATA OF MALAYSIA COOO)"^
YEAR
1980
1985
1990
1995
2000
2005
2010
2015
2020
POPULATION
13,763
15,448
17,339
19,186
20,870
22,320
23,692
25,131
26,556
BIRTHS
406
442
441
419
384
381
406
422
422
DEATHS
83
86
90
96
103
115
127
144
163
URBAN POPULATION
4,713
5,905
7,336
8,901
10,509
12,072
13,658
15,332
17,038
34.2
38.2
42.3
46.4
50.4
54.1
57.6
61.0
64.2
POPULATION 1985
30
35
40
45
50
55
60
65
70 +
1,099
897
682
628
469
400
298
237
348
The urban population of Malaysia is largely Chinese, but even this is
changing rapidly as the pace of urbanisation accelerates and the NEP
287 Idem.

129
polices begin to have their impact. The urban residence by ethnic
groups is shown in Table 10. As is evident, already by 1970 the Malays
made up nearly 30 per cent of the urban population of Malaysia.
TABLE 10: URBAN RESIDENCE BY ETHNIC GROUPS 1970 (WEST MALAYSIA)288
GROUP
Malay
Chinese
Indian
Others
(%)
27.6
58.5
12.8
1.1
4.5.3 Gender Mix
The ratio of males to females is almost equal.
4.5.4 Age Classification
The age group classification of the population in 1991 is shown in
Diagram 6"®. The mean and median ages of the Malaysian population
is forecast to increase substantially by 2020. The trends and the
forecast of the mean and median ages of the Malaysian population are
shown in Table 1 1 " " . It appears that the average Malaysian by the
year 2020 will be a young person with a family as opposed to the single
new entrant to the work force that typified the Malaysian in the 1980s.
288 Dixon, 00. cit.. p. 182.
289 Keyfitz, oo. cit., p. 230.
290 , . Idem.

130
Twenty six per cent of the population will be in the age group of 25-44
years. The school going population (in the age category 5-19 years) will
be about 35 per cent of the population.
DIAGRAM 6: AGE CLASS OF MALA YSIAN POPULA TION IN 1991
*"® 1009 :;r:nr'~--~---^^ —'--i—J 20-29 30.3^ - - - — _ _ ^ ^
Age Classification (Years)
S«re»; Dfrtmtnt tH Stttislia Mtmyti*. V»»1>oo* rf SteWsttet t»Bt

131
TABLE 1 1 : CHANGES IN MEAN & MEDIAN AGES IN MALAYSIA
YEAR
1950
1960
1970
1980
1990
2000
2010
2020
POPULATION
MEAN AGE
24.70
22.82
22.81
24.08
25.27
27.54
30.72
33.38
MEDIAN AGE
19.80
17.65
17.50
19.67
21.73
24.46
28.11
31.85
4.5.5 Ethnic Mix
The Malaysian population is made up of 60 percent Malay and other
indigenous groups, 30 percent Chinese and 10 percent South Asian
(Indians, Pakistanis and Sri Lankans)"'. This high proportion on non
indigenous ethnic groups in the population is unique to Malaysia. Other
countries in the region have a more homogenous population. Malaysia
has among the highest overseas Chinese (5.2 million) and overseas
Indian (1.7 million) populations in the world.
4.5.6 Social Indicators
Other indices of economic development too position Malaysia well above
other countries in the region.
^^^ 'Malaysia turns dreams and visions into reality', Tradescope. Japan External Trade
Organisation, Volume 12, No. 10 October 1992.

132
There has been substantial improvement in the number of households
with electricity in West Malaysia (Appendix 5). More than ninety tive
per cent of households in Kuala Lumpur have electricity. Even in the
largely rural States such as Kedah, Kelentan and Trengganu, 60-70 per
cent of households had electricity supply in 1985 in comparison with
30-50 per cent of households with electricity supply tive years
earlier"^
The proportion of rural households with piped or potable water rose from
39 per cent in 1970 to 73 per cent in 1990"®.
There have been substantial improvements in school enrolments.
Enrolment in primary school has become virtually universal"*. The
adult literacy rate in Malaysia in 1990 was 76 per cent"®.
The infant mortality rate fell from 3.9 per cent in 1970 to 2.3 per cent in
1990"®. This is a retiection of the improved health care facilities.
Indices such as persons per hospital bed (1989 - 400:1) and persons per
physician (1989 - 1,935:1) show the relatively high standard of health
care facilities in Malaysia"^. Life expectancy in Malaysia has
continued to increase. Life expectancy reached 70 years in 1989"®.
292
293
294
295
296
297
298
Dixon, OP. cit.. p. 214 citing the Fifth Malaysia Plan 1986-1990.
Crouch, OP. cit.. pp. 134 & 149 citing Government of Malaysia, Fourth Malavsia Plan 1981-1985. Kuala Lumpur, Malaysia 1981.
Ibid., p. 149 citing Government of Malaysia, The Second Outline Perspective Plan 1991-2000. Kuala Lumpur, Malaysia 1991.
ibid., p. 134.
ibid., p. 149.
Ibid., p. 134.
Idem.

133
4.6 The New Economic Policy
4.6.1 Policy Background
Following the race riots of 1969, the Malaysian government launched a
social engineering program called the 'Twenty-year Overall Perspective
Plan'. More commonly called the New Economic Policy (NEP). The NEP
was embodied in the Second Malaysia Plan of 1971"®,
4.6.2 Policy Objectives
The objective of this plan was to correct the imbalance in economic
wealth among the different races in Malaysia. The NEP set a target of
30 per cent indigenous Malay (Bumiputera) ownership of all commercial
enterprises by 1991.
4.6.3 Policy Implementation
The plan was implemented through an affirmative action program that
encompassed subsidies, quotas, scholarships, investment licensing and
rural development.
The Malaysian Federal Government and the various State Governments
also incorporated non financial public enterprises (NFPE's), 'which were
intended to "hold in trust" newly acquired economic wealth on behalf of
the Bumiputra until such time as they were in a position to control it
themselves'^°°. This program reached its second phase in the 1980s
with privatisation of NFPE's. A Malaysian political scientist summarises
the economic policies from 1980 as follows:
299
Japan External Trade Organisation, loc. cit..
Marcus, op. cit.. p. 57.

134
. . . on the whole, it can be said that economic policies from the early 1980s seek to transform Malaysia into a newly Industrialised country (NIC) . . . under genuine Bumiputra capitalist entrepreneurial leadership. Most of Mahathir's economic policies seem to aim to achieve this end.^""'
4.6.4 Results
The implementation of the NEP resulted in substantial increase in the
participation rate of the Malays and other indigenous communities
(Bumiputeras) in commerce and the professions. It was for example,
estimated that only 2.4 per cent of the share capital in limited
companies in West Malaysia was owned by Bumiputeras (1.6 per cent
by individual Bumiputeras and 0.8 per cent by Bumiputera corporate
entities) in 1970. By 1990 the share capital of Bumiputeras in limited
companies increased to 20.3 per cent (8.2 per cent by Bumiputera
individuals and 12.1 per cent by Bumiputera corporate entities)®"^.
The signiticance of this is that in addition to substantial overall economic
growth, the per capita wealth of the Bumiputeras has grown
substantially faster than the national average. This is another distinct
difference between Malaysia and the other ASEAN countries such as
Indonesia, Thailand and the Philippines where business is still largely
dominated by the Chinese minority, and there have not been any
^°^ Jump (Editor); Mahathir's Economic Pniinie.s (2nd Edition), insan, Kuala Lumpur 1989.
302 ^ Crouch, op. cit.. pp. 144-147.

135
declared and strongly promoted policy to uplift the economic and
educational status of the indigenous communities.
There is signiticant participation in business by Bumiputera owned
companies, government-sponsored agencies (NFPE), Permodalan
Nasional Berhad (National Equity Corporation), business interests of the
Malay political party United Malay Nationalist Organisation (UMNO) and
vanous unit trust schemes. Thus, both the market segment based on
ethnic divisions and the corporate culture in Malaysia is quite different
from other countries in the region where the indigenous population is still
not actively involved in business.
The NEP expired in 1990. This was replaced by the 'New Development
Policy'. Even under the new policy the general thrust of the NEP has
been retained®"®. There is, however, a stronger thrust on the growth
of the private sector. This will inevitably mean greater privatization of
NFPE's and encouragement of private Malay businesses.
4.7 The Distributive Trades
Malaysia is serviced by a large number of very small retail outlets,
'generally comprising one or more shopholders with their relatives
working as employees'.^°^
^ " \m., p. 145.
304 Euromonitor, op. cit.. pp. 1217-1218.

136
Dairy products are generally sold through what are classed as 'Provision
Shops'. There were 43,433 provision shops in Malaysia in 1980. With
annual turnover of MR$ 12.1 billion (A$ 7.12 billion) provision shops
had more than 26 per cent market share in grocery retail sales in
Malaysia. In 1980, grocery retail sales in Malaysia was approximately
MR$ 3.15 billion (A$ 1.85 billion)®"®. Euromonitor forecasts that this
trend is unlikely to change. It comments.
There is no likelihood . . . that rural populations [in Malaysia] will readily abandon the small village shops and private traders with whom they have done business for years, and who [rural traders] still account for more than two thirds of all turnover away from the larger cities'°^.
Small grocery stores in rural Malaysia are dependent on sales to rural
farmers on credit particularly during the pre harvest period. With rapid
urbanisation and wage earning as opposed to subsistence farming
members in the family, this dependence on credit from the small
neighbourhood shops is forecast to decline. This is not to imply that
larger supermarkets will become the dominant grocery retail outlets in
rural Malaysia. The researcher forecasts that the 'minimarket' type
grocery retail operations in neighbouring towns will become important to
shoppers in rural Malaysia.
^°^ ibid,, p. 1217-1218.
^°° Ibid,, p. 1211.

137
The major form of food retail outlets in Malaysia are conventional
counter service stores that sell an assortment of canned and packaged
foods. With the development of planned housing estates in suburban
Malaysia, 'minimarkets' are becoming an important grocery retail outlet.
Mini markets generally occupy an average tioor area of 1,800 sq.feet
and are operated on a self serve basis. As with conventional stores,
these 'mini markets' remain family operated or sole proprietor
businesses®" .
Supermarkets are relatively new in Malaysia. It was estimated that in
1987 there approximately twelve supermarkets in sizes varying between
3,000-15,000 sq. feet in Malaysia®"®.
Annual turnover of these supermarkets in 1984 was estimated to be
MR$ 186 million (A$ 103 million)®"®. The market share of
supermarkets in retail sales value to total retail grocery sales is less than
5 per cent®'".
307
308
309
310
Md. Zain, Osman and Rejab, Ismail; op. cit.. p. 38.
idem.
Md. Zain, Osman and Rejab, Ismail; OP. cit..citing Ngam, S.M. and Lee, E in 'Supermarkets: Battle of the stores' in Malaysian Business. Vol. 16, January, pp. 5-16.
Refer earlier estimate based on Euromonitor report. Grocery turnover in Malaysia estimated at MR$ 3.15 billion in 1980. Based on 10% annual growth rate, 1984 turnover is estimated at MR$ 4.61 billion. This estimate is substantially different from that in Allen, Tim OP. cit.. p. 93. Allen says that 'according to manufacturers

138
It is obvious that the conventional stores and mini markets will continue
to be the dominant retail channel intermediaries for grocery products in
Malaysia®". No significant change to the structure of the retail grocery
distribution trade is forecast in the medium term.
A number of factors inhibit the development of grocery supermarket
operations in Malaysia®'^. These include:
a) A complex system of wholesaling with a multitude of wholesalers
and manufacturers agents represented in every town.
b) Wages in Malaysia are generally paid monthly. As such credit
sales are important. The conventional grocery stores and
'minimarkets' sell on credit.
c) As almost all conventional grocery stores are either family owned
businesses or sole proprietorship businesses with the trading
premises owned by the proprietors, the operating costs of the
conventional grocery stores is very small.
311
10-15 per cent of agrofood products are sold through 160 supermarkets dominated by three chains'.
Tradescope, op. cit.. p. 11. Akihito Tanaka, the Managing Director of Jaya Jusco (Malaysia's largest supermarket group) says that only 30 per cent of his company's sales in Malaysia is in food products.
^ ^ Bhaskaran, Sukumaran; 'The Food Distributive Trade in a Developing Economy-The Malaysian Example', Kuala Lumpur 1984.
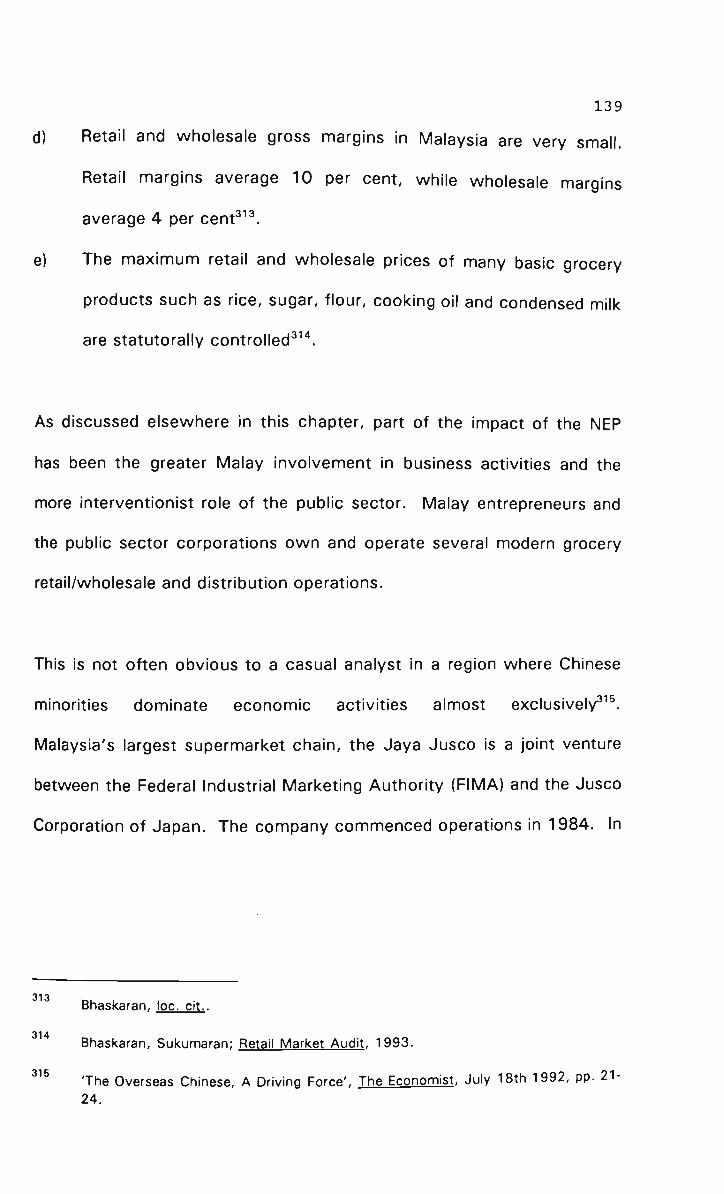
139
d) Retail and wholesale gross margins in Malaysia are very small.
Retail margins average 10 per cent, while wholesale margins
average 4 per cent®'®.
e) The maximum retail and wholesale prices of many basic grocery
products such as rice, sugar, tiour, cooking oil and condensed milk
are statutorally controlled®'*.
As discussed elsewhere in this chapter, part of the impact of the NEP
has been the greater Malay involvement in business activities and the
more interventionist role of the public sector. Malay entrepreneurs and
the public sector corporations own and operate several modern grocery
retail/wholesale and distribution operations.
This is not often obvious to a casual analyst in a region where Chinese
minorities dominate economic activities almost exclusively®'®.
Malaysia's largest supermarket chain, the Jaya Jusco is a joint venture
between the Federal Industrial Marketing Authority (FIMA) and the Jusco
Corporation of Japan. The company commenced operations in 1984. In
313 Bhaskaran, loc. cit.
Q 1 ^
Bhaskaran, Sukumaran; Retail Market Audit. 1993.
^^^ 'The Overseas Chinese, A Driving Force', The Economist. July 18th 1992, pp. 21-24.

140
1992 it operated four supermarkets, three in Kuala Lumpur and one in
Melaka®'®.
The Seven Eleven stores in Malaysia is operated by Convenience Stores,
a joint venture between Antah Holdings, Innovest and Jardine Matheson.
In 1974, the large Malaysian Government owned conglomerate
Perbadanan Nasional Berhad (Pernas) established a wholly owned
subsidiary to wholesale grocery products. This company made
signiticant inroads into the grocery wholesale trade very quickly®". It
opened Malaysia's first 'Cash and Carry' grocery wholesale operation.
Pernas rapidly set up a national network of wholesale depots and was
reputed to have about 12 percent of the grocery products wholesale
trade by 1980. It is estimated by the researcher that by late 1980s,
Pernas had about 20 per cent market share (by wholesale value) for
some products such as milk powder, rice and sugar®'®.
Privately owned supermarkets in Malaysia have generally failed. Many
supermarkets such as Yuyi Supermarkets, Emporium Holdings, Irma
Food Fair and Kimisawa opened by ethnic Chinese or Chinese owned
4 4 A
Japan External Trade Organisation, op. cit., p. 11 .
Allen, OP. cit.. p. 109.
^^^ Ibid., p. 110. 318
Bhaskaran, loc. cit.

141
corporations in the late 1970s failed®'®. The major equity in Kimisawa
and Emporium Holdings was by Multi Purpose Holdings, the investment
arm of the Malaysian Chinese Association. Irma Food Fair was 90 per
cent owned by the Montezuma Group, a family business of the Chinese
businessman Datuk Mohammed Tan®".
Most large retail operations were also incorporated as companies in
comparison with conventional retail/wholesale business in Malaysia
which were generally family owned.
In the 1970s several Government and Malay owned food retail and
wholesale companies commenced operations. This may have been a
tacit program by the Malaysian Government because of the boycott of
grocery sales to Malays by Chinese owned businesses following the race
riots in 1969.
The development of large (as defined by capitalisation, number of
employees, number of branches and turnover) wholesalers and retailers
in Malaysia was already evident by the mid 1980s. The structure of
grocery distribution business in Malaysia also showed signs of change
from small family owned businesses to larger corporate chain store
model by early 1980s. This was mostly spearheaded by Government
319 Allen, OP. cit.. p. 109.
3 on ib jd^ pp. 108-109.

142
corporations or joint ventures between Government corporations and
large multinationals. However, the grocery wholesale and retail trade in
Malaysia continues to be dominated by a large number of small
operators and the share of the large wholesale and retail businesses to
total trade volume is still small.
The consumer choice of retail outlets in Malaysia show strong
correlation to the ethnicity of the shopper. A survey by Md. Zain and
Rejab found that 56 per cent of Chinese shopped in conventional retail
shops and only 38 percent shopped in supermarkets. The survey found
that 46 per cent of Malays shopped in supermarkets and only 36 percent
shopped in conventional retail outlets. Indians showed similar
preferences in choice of retail outlet as the Chinese. This study
suggests a clear preference among Malay shoppers to purchase at
supermarkets®^'. Surveys such as this may have intiuenced the
decision by the Malaysian Government to play an interventionist role in
grocery retail and wholesale operations.
The survey by Md. Zain and Rejab also suggested that there was no
signiticant correlation in the choice of retail outlets among Malaysian
shoppers based on either income or education. The report, however.
321 Md. Zain, Osman and Rejab, Ismail; OP. cit.. p. 4 1 . Md. Zain's findings are substantially different to statements in Allen, op. cit.., p. 106. Alien claims that 60-90 per cent of shoppers at the large supermarkets are Chinese.

143
adds that higher income shoppers (annual incomes exceeding MR$
60,000) were more visible in the supermarkets®".
4.8 Conclusion
Malaysia is a rapidly growing and modernising economy. There is strong
state intervention including direct participation in business by
government. However, private enterprises are actively promoted.
Government programs are generally directed at promoting activities in
which Malaysia has a competitive advantage. The manufacturing and
service industries are Malaysia's priority sectors.
Malaysia has a liberal economic policy which provides incentives to
develop processing and manufacturing operations. The country has
succeeded in attracting large foreign investments.
The Government has successfully introduced an aftirmative program
favouring the Malays which has created a more affluent and business
oriented Malay community.
322 Ibid., p. 42.

144
CHAPTER FIVE
5 THE DAIRY INDUSTRY IN MALAYSIA
5.1 Chapter Objective
5.1.1 Discuss the size and features of the dairy industry (fresh milk and manufactured milk products) in Malaysia.
5.1.2 Highlight public policy in Malaysia which are of particular relevance to the dairy industry.
5.1.3 Discuss trends in the consumption of dairy products and the performance of dairy companies in Malaysia.
5.1.4 Quantify the growth in demand for dairy products in Malaysia.
5.2 Domestic Cattie & Buffalo Milk Production
Several factors were observed to inhibit the development of a
sustainable domestic milk production industry in Malaysia. These
included,
a) The shortage of pastoral land. Malaysia's total land area is only
329,749 square kilometres. Flat pastoral land is scarce
particularly in West Malaysia where 90 per cent of the population
live. The emphasis in plantation agriculture limits pastoral land for
cattle grazing®^®.
323 Mahendranathan, op, cit., p. 178,

145
b) Extensive plantation agriculture (rubber, palm oil, cocoa) and
cereal crop (rice) cultivation restrict cattle and buffalo
keeping®^*. Plantation managers generally discourage or ban
the keeping of cattle as they damage plantation crops®^®.
c) The small dairy cattle population in Malaysia. The ADC estimated
the cattle population in Malaysia in 1991 at 30,000 head® ®.
This suggested that the total cattle population in Malaysia had not
increased for nearly two decades. The total milk cattle population
was estimated in 1977 by the Food and Agricultural Organisation
(FAO) at 30,000 head®". The FAO also estimated that there
were 16,000 head of milk yielding buffaloes®^®. Data on head
of milk yielding buffaloes for the post 1977 period was not
available. However, data on total domestic fresh milk availability
which was estimated by the ADC in 1991 as being 25,000
tonnes, suggested that heard size had not increased
signiticantly®^®.
324
325
326
327
328
329
Ibid.. p. 178.
Bhaskaran, Sukumaran; Field Audit.
ADC Dairy Market Briefings, loc. cit.
Mahendranathan, op. cit., p. 176.
Ibid., pp. 177-178. Estimated on the basis that buffalo tnilk production was 11,000 tonnes, and that the average milk yield per animal was 671 kg.
Australian Dairy Corporation Trade and Product Balances, loc^ cit.

146
d) Small size dairy farm operations. The majority of dairy farms in
Malaysia are based on small holder basis with 3-4 head of cattle
or buffalo per farmer®®°. The dairy farming activity is generally
to supplement the income of the farmer from other rural activities
such as inland tishing, fruit cultivation and shopkeeping.
e) The tropical climatic and environmental conditions in Malaysia are
not ideal for the development of large scale dairy industry.
Studies have shown that in humid tropical climates, milk yields of
even imported exotic breeds of cattle drop significantly. In 1990
the milk yield in Malaysia was estimated at 1,000 litres/cow per
annum®®' compared with 3,895 litres/cow per annum in
Australia®® . As such, the average milk yield in Malaysia was
only 25 per cent that in Australia.
Given these limitations, there is no comparative advantage in developing
a dairy industry in Malaysia. Cheaper milk and milk products can be
imported from more efticient producers such as Australia and New
Zealand.
330
331
332
I b i d . . p . 178.
ADC Dairy Market Briefings, loc. cit.
Dairy Compendium 1992, op. cit., p. 39'

147
5.3 Public Policy
The policy of the Malaysian government on dairy industry development
was not clear. The ADC's 'Dairy Market Brietings' commented that the
Malaysian government had strongly supported the development of
domestic milk production under the New Economic Policy (NEP)
initiatives®®®. Review of economic policies discussed in earlier
sections in this thesis suggested that public policy initiatives in
developing the dairy industry was of low priority®®'*.
Programs for the dairy industry have been part of the rural development
program aimed at improving the economic position of the predominantly
Malay rural population®®®. The government policy was not as
interventionist as in other sectors such as manufacturing, plantation
agriculture, insurance, banking, rice production and food distribution. In
these sectors the government had actively intervened through legislative
controls, tariff incentives and operation of public sectors
enterprises®®®. In the dairy industry, government intervention was
observed to be limited to the operations of a few large farms, provision
333
Dairy Market B r i e f i n g s , op. c i t . , p . 2, 334
Sections 4.4.3, 4.4.4, 4.4.5, 4.6 and 4.7 show the emphasis that the Malaysian government has shown in its econornic development strategies. Manufacturing and service industries have are the priority sectors. It appears that there is greater Government intervention even in the retailing and wholesaling sectors in comparison to the dairy industry. The tax regime on the imports of dairy raw materials in Malaysia are also lower than in many other countries in ASEAN.
55 „. Dixon, OP. cit.. p. 185.
Noland, op. cit.. p. 57.

148
of extension service to small scale dairy farmers through programs such
as herd improvement and the establishment of centralised milk collection
centres®®^
As Malaysia did not have a comparative advantage in dairy production,
this was a pragmatic policy. Unlike other sectors of the Malaysian
economy, milk production had been a low growth sector. Milk
production in 1977 was estimated at 31,000 tonnes®®®. In 1990 milk
production was estimated at 29,000 tonnes®®®. Production of fresh
milk was difticult to estimate as dairy farmers also sold milk directly to
consumers and food service outlets. As such not all milk was sold
through the milk collection centres. This resulted in production statistics
of fresh milk being understated. However, it seems obvious that fresh
milk production in Malaysia had not increased substantially since 1977.
The initiatives of the Malaysian government in developing dairy
manufacturing operations have been more vigorous. In addition to
general taxation incentives that were available to most manufacturing
industries, there were several specific policies to support the dairy
manufacturing industry. These included:
337 ADC Dairy Market Briefings, loc. cit.
338 Mahendranathan, op. cit.. p. 178.
339 ADC Dairy Market Briefings, loc. cit.
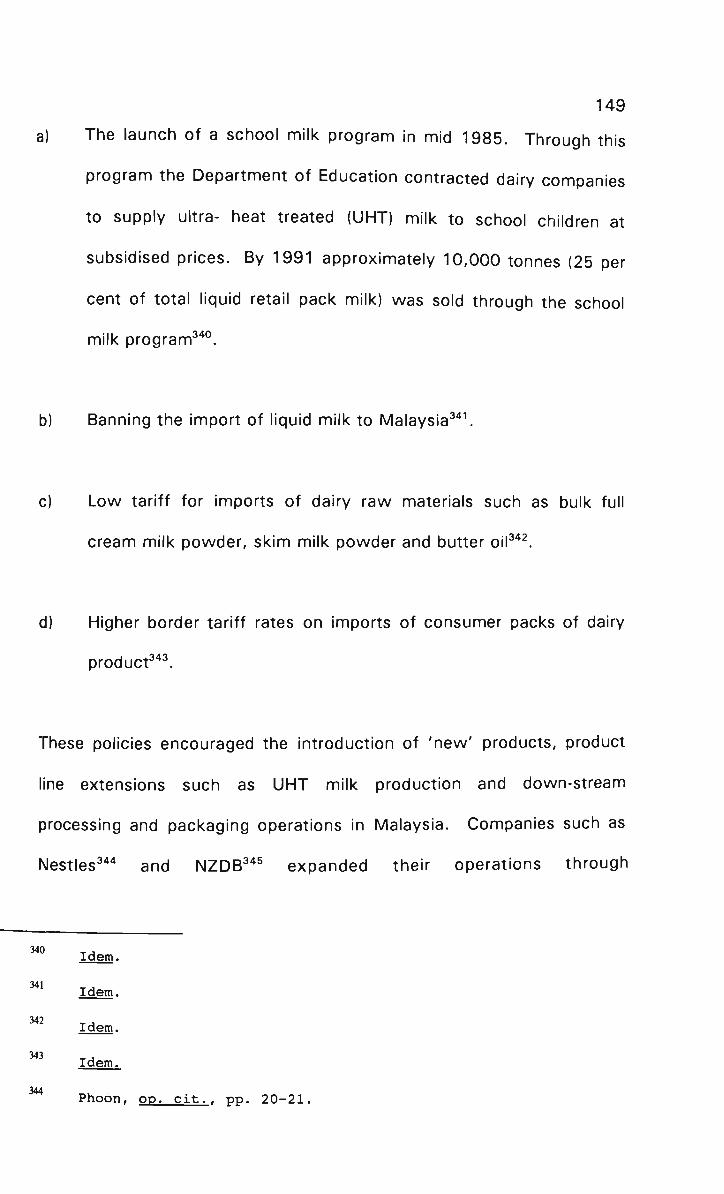
149
a) The launch of a school milk program in mid 1985. Through this
program the Department of Education contracted dairy companies
to supply ultra- heat treated (UHT) milk to school children at
subsidised prices. By 1991 approximately 10,000 tonnes (25 per
cent of total liquid retail pack milk) was sold through the school
milk program®'* .
b) Banning the import of liquid milk to Malaysia®*'.
c) Low tariff for imports of dairy raw materials such as bulk full
cream milk powder, skim milk powder and butter oil®'* .
d) Higher border tariff rates on imports of consumer packs of dairy
product®*®.
These policies encouraged the introduction of 'new' products, product
line extensions such as UHT milk production and down-stream
processing and packaging operations in Malaysia. Companies such as
Nestles®** and NZDB®*® expanded their operations through
340
341
342
343
Idem.
Idem.
Idem.
Idem.
344
Phoon, op. c i t . . pp. 20-21.

150
developing processing, packaging and distribution operations. It seemed
that the Malaysian government encouraged investment in dairy
processing and packaging operations more actively than in fresh milk
production.
5.4 Dairy Product Consumption Trends
Even though data for exports of dairy products from Australia to
Malaysia were available up to 1992, data on exports from Malaysia and
imports from other countries to Malaysia were available only up to 1990.
As such the analysis of consumption trends were based on data for the
period 1970-89. For purposes of other analysis such as product and
company market share, more recent secondary data and primary
research findings have been used. This analysis will retiect features of
the Malaysian market as at 1993.
The consumption of dairy products in Malaysia increased substantially in
the period 1970-89. Comprehensive data analysis was done in an effort
to reconcile often contiicting information. As discussed in the literature
review, the estimates by IMES were unsubstantiated and contradicted
information from other sources. The principal source of data used in this
analysis is from the Food and Agricultural Organisation (FAO). As
discussed in the previous section, fresh milk production in Malaysia had
stabilised at around 30,000 tonnes per annum. This seemed largely due
345
Australian Financial Review, loc. cit.

151
to limitations in the physical environment and the encouragement by the
Malaysian government of other sector's of the economy in which the
country had greater competitive and comparative advantages.
The apparent consumption of dairy products in Malaysia were computed
by deducting exports of different product categories from their
respective import data. These data were computed on the basis of five
year time series to smooth any changes in demand due to temporary
shocks such as periodical shortages in world supply or cyclical shortfalls
in demand. The results showed significant and continued increase in the
consumption of dairy products in Malaysia. Total consumption increased
by an average of 23 per cent per annum in the tive year period following
1970-74, it increased by an average of 31 per cent per annum in the
next tive years 1980-84 and again increased by an average of 11 per
cent per annum in the next tive years 1985-89. These were very
signiticant growth rates in the consumption of dairy products. These
trends in the consumption of dairy products are shown in Table 12. As
is evident in Diagram 7, there was substantial tiuctuations in the
consumption of different products.

152
TABLE 12: APPARENT ANNUAL CONSUMPTION OF DAIRY PRODUCTS IN MALAYSIA 1970-89 COOO tonnes)^*^
PRODUCT
WMP
SMP
SUB TOTAL
BUTTER
GHEE
CHEESE
TOTAL
1970-74
13,722
24,925
38,647
7,892
1,161
361
48,061
1975-79
33,370
17,017
50,387
7,762
735
403
59,287
1980-84
59,374
11,424
70,798
5,443
962
633
77,832
1985-89
39,962
38,663
78,625
5,653
1,492
881
86,651
5.4.1 Milk Powder
As shown in Table 12 the consumption of milk powders (SMP and
WMP) in Malaysia had increased. Consumption increased by an average
of more than 30 per cent per annum in the period 1975-79, by an
average of more than 40 per cent per annum in the period 1980-84, and
by an average of 12 per cent per annum in the period 1985-89.
Consumption of milk powders, had therefore, exceeded the average rate
of growth in the consumption of dairy products.
346 Australian Dairy Corporation Dairy Market Briefings, Malaysia Trade & Product Balances.

DIAGRAM 7: DAIRY PRODUCT CONSUMPTION TRENDS
1970-1974
153
1975-1979
1980-1984
1985-1989
CHEESE (1.0%) GHEE (5
BUTTER (34.7%) WMP (21.1%)
SMP (38.1%)
CHEESE (0.8%) GHEE p
BUTTER (29.5%)
SMP (22.4%)
WMP (44.1%)
CHEESE (1.1%) GHEE (3.5%)
BUTTER (17.3%)
SMP (12.6%) WMP (65.6%)
CHEESE (14%) GHEE (4 8%)
BUTTER (16.1%)
SMP (38.2%)
WMP (39.6%)

154
However, consumption of WMP declined whereas consumption of SMP
increased. This seemed to be because the demand for WMP and SMP
were derived demand in that these products were imported for
reprocessing and/or repacking prior to domestic marketing®*^. The
shift in the consumption from WMP to SMP seemed to retiect changes
in demand for their derived products in Malaysia. These changes in
demand for different dairy products are discussed below. Ninety-five per
cent of SMP imported into Malaysia was used for recombining into liquid
and concentrated milk®*®. Ninety five per cent of WMP imported was
repacked as powdered milk and infant formula®*®. The apparent
market share of key product lines and the product market share of
different companies are shown in Table 13. WMP was imported for
repacking into retail packs, for the production of infant formula and for
sale to food service outlets in bulk 25 kg bags®®®. The market
segments for WMP are shown in Table 14.
347
348
349
350
Dairy Market Briefings,
Ibid. p. 6.
Idem.
Market Audit, loc. cit.
op. cit
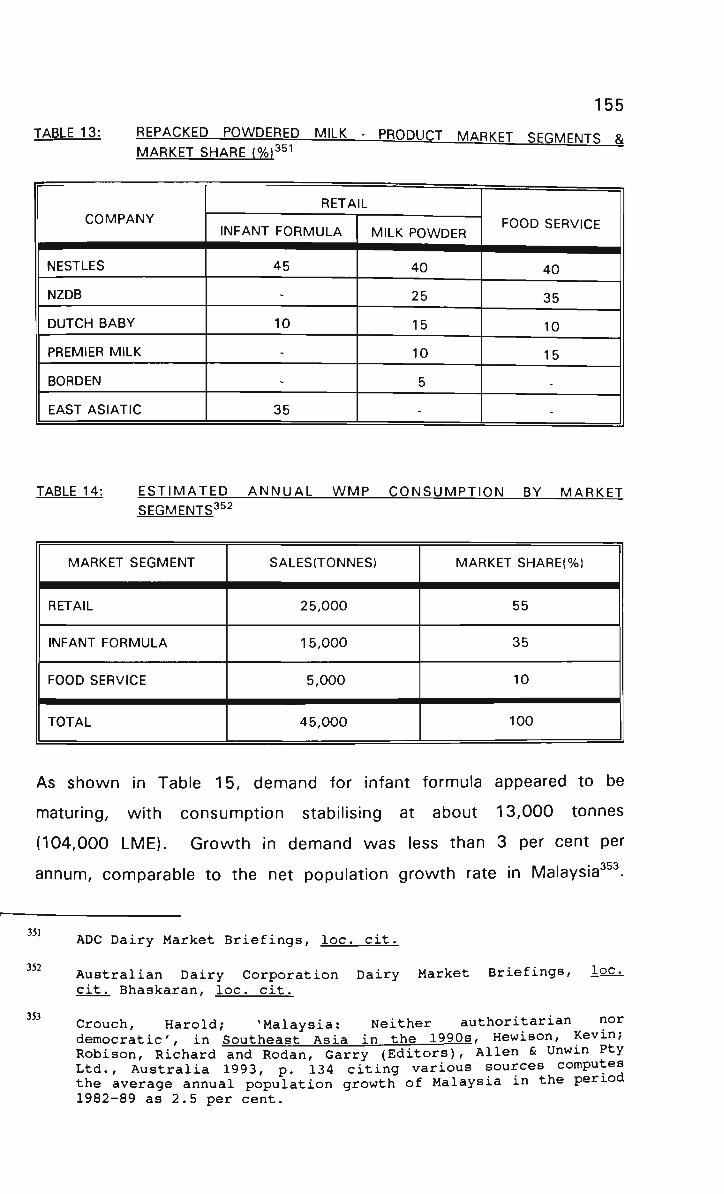
155
TABLE 13: REPACKED POWDERED MILK - PRODUCT MARKPT SEGMENTS R. MARKET SHARE (%l ®^
COMPANY
NESTLES
NZDB
DUTCH BABY
PREMIER MILK
BORDEN
EAST ASIATIC
RETAIL
INFANT FORMULA
45
-
10
-
-
35
MILK POWDER
40
25
15
10
5
-
FOOD SERVICE
40
35
10
15
-
-
TABLE 14: ESTIMATED ANNUAL WMP CONSUMPTION BY MARKET SEGMENTS®®^
MARKET SEGMENT
RETAIL
INFANT FORMULA
FOOD SERVICE
TOTAL
SALES(TONNES)
25,000
15,000
5,000
45,000
MARKET SHARE(%)
55
35
10
100
As shown in Table 15, demand for infant formula appeared to be
maturing, with consumption stabilising at about 13,000 tonnes
(104,000 LME). Growth in demand was less than 3 per cent per
annum, comparable to the net population growth rate in Malaysia®®®.
351
352
353
ADC Dairy Market Briefings, loc. cit.
Australian Dairy Corporation Dairy Market Briefings, loc^ cit. Bhaskaran, loc. cit.
Crouch, Harold; 'Malaysia: Neither authoritarian nor democratic, in Southeast Asia in the 1990s, Hewison, Kevin; Robison, Richard and Rodan, Garry (Editors), Allen & Unwin Pty Ltd., Australia 1993, p. 134 citing various sources computes the average annual population growth of Malaysia in the period 1982-89 as 2.5 per cent.

156
The consumption of milk powder had steadily increased. Annual
average consumption of milk powder was 25,000 tonnes (200,000
LME).
TABLE 15: TRENDS IN THE CONSUMPTION OF WMP (TONNES)^^^
YEAR
1989
1990
1991
INFANT FORMULA
13,727
11,589
14,260
MILK POWDER
23,558
24,230
27,451
The reasons for this were not clear. Market audit suggested that
aggressive promotion and the real or perceived better keeping qualities
of powdered milk in comparison with liquid milk had contributed to this.
Powdered milk keeps better in humid tropical climates especially when
transporting from wholesale distributors to retailers and from retailers to
consumers. This gives powdered milk some advantages over new
products such as UHT milk®®®. This may also explain why large dairy
product manufacturers such as Nestles and NZDB continued to
aggressively market powdered milk®®®. The market share of the major
manufacturers of powdered milk in Malaysia are summarised in Table
13. Nesties and NZDB are the market leaders. The domination by
Nestles and NZDB seemed to result from their excellent distribution
network, continued product innovation and the successful marketing mix
strategies®® . Both these companies used product line extension and
354
355
356
357
Idem.
Market Audit, loc. cit.
Dairy Market Briefings, loc. cit.
Idem.

157
differentiation strategies to maximise market penetration®®®. Nestles,
for example, introduced a milk powder which is a mix of dairy and soy
milk under the brand name 'Twin'. NZDB was promoting its milk
products through Chinese medical halls as a health food that prevented
osteoporosis. Both NZDB and Nestles were well represented in the food
service segments. In Western type food outlets in Malaysia milk powder
is used for making ice cream and other diary desserts. In Asian,
particularly Indian, restaurants milk powder is used for making Indian
style yogurts, butter milk and dairy desserts®®®.
5.4.2 Concentrated Milk
Based on annual consumption volumes, concentrated milk was the most
important dairy product in Malaysia. Concentrated milk comprised four
product lines. The 1991 consumption volumes of these four product
lines are summarised in Table 16.
TABLE 16: ESTIMATED ANNUAL CONSUMPTION OF CONCENTRATED MILK PRODUCT LINES^^Q
PRODUCT LINES
FILLED CONDENSED MILK
FULL CREAM CONDENSED MILK
FILLED EVAPORATED MILK
FULL CREAM EVAPORATED MILK
TOTAL
QUANTITY (T)
90,000
40,000
6,500
3,500
140,000
MARKET SHARE(%)
64
29
5
2
100
358
359
360
Bhaskaran, l o c . c i t .
Market Audit, loc. cit,
Idem.
Market Audit, loc. cit.
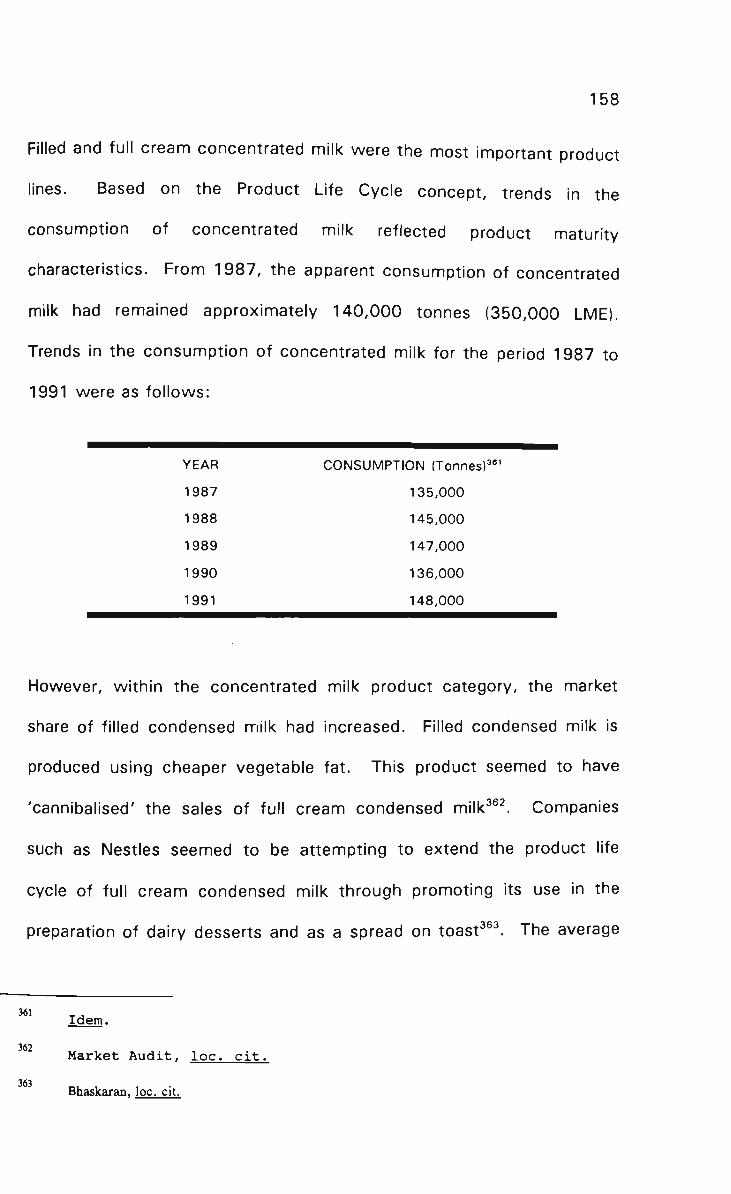
158
Filled and full cream concentrated milk were the most important product
lines. Based on the Product Life Cycle concept, trends in the
consumption of concentrated milk reflected product maturity
characteristics. From 1987, the apparent consumption of concentrated
milk had remained approximately 140,000 tonnes (350,000 LME).
Trends in the consumption of concentrated milk for the period 1987 to
1991 were as follows:
YEAR
1987
1988
1989
1990
1991
CONSUMPTION (Tonnes)^"'
135,000
145,000
147,000
136,000
148,000
However, within the concentrated milk product category, the market
share of tilled condensed milk had increased. Filled condensed milk is
produced using cheaper vegetable fat. This product seemed to have
'cannibalised' the sales of full cream condensed milk®® . Companies
such as Nestles seemed to be attempting to extend the product life
cycle of full cream condensed milk through promoting its use in the
preparation of dairy desserts and as a spread on toast®®®. The average
Idem.
362
Market Audit, loc. cit. 363 _ , , , .
Bhaskaran, loc. cit.

159
annual consumption of full cream condensed milk was 42,000 tonnes
(105,000 LME)®®*. The average annual consumption of tilled
condensed milk was 98,000 tonnes (245,000 LME)®®®.
The market share of major companies in concentrated milk product lines
are summarised in the Table 17. Nestles was the market leader with an
estimated market share of 50 per cent®®®. The dominant position of
Nestles in the full cream condensed milk product line seemed to result
from the excellent distribution network and good brand image of the
company®® . Premier Milk seemed to be well represented in tilled
condensed milk because of its excellent distribution network into the
coffee shop and coffee stall segments of the market®®®. The good
keeping qualities of condensed milk in the humid tropical climate of
Malaysia seemed to be an important contributory reason for the
extensive use of condensed milk in coffee shops and coffee stalls where
refrigeration was not widespread and the standards of food handling I
seemed poor®®®. Demand in the coffee stall/coffee shop segment
seemed to be highly price elastic because these outlets appeared to
364
365
366
367
368
369
Dairy Market Briefings, op. cit., p. 5.
Computed based on data in Dairy Market Briefings, p. 5.
Ibid.. Major dairy suppliers by product category.
Market Audit, loc. cit.
Idem.
Idem.

160
target the lower income segment of the population. It seemed that
brand loyalty was not a signiticant intiuencer in purchasing decisions of
tilled condensed milk in the food service segment. Marked tiuctuations in
the market share of different companies in this segment seemed to
result from competitive price discounting and promotional activities by
different companies®^". Premier milk, the market leader in this
segment is a subsidiary of Fraser and Neave (F & N) which is the largest
Malaysian bottler and distributor of soft drinks such as Coca Cola, Sprite
and the F & N range of mixers in Malaysia. F & N seemed to have
excellent distribution network into the coffee shop and coffee stall
segment®^\ The market for concentrated milk seemed to be shared
by two major producers specialising in different market niches because
of the strength of their distribution network in the different segments.
There were no Australian companies in the concentrated milk category.
This may be because of the high tariffs for the import of concentrated
milk. Tariffs on concentrated milk was MR$ 41.89 per 100 Kg. In
addition there was a 5 per cent sales tax on imported concentrated milk.
This increased the wholesale price of imported concentrated milk by
approximately 15 per cent®^ .
370 , ,
Idem.
Idem.
372
Dairy Market Briefings, op. cit., p. 3,

161
TABLE 17: PRODUCT LINE MARKET SHARE - CONCENTRATED Mil K (% VOLUME)®^®
COMPANY
NESTLES
DUTCH BABY
PREMIER MILK . ^ . . ^
FULL CREAM
60
20
-
FILLED
45
10
35
TOTAL
50
15
30
5.4.3 Liquid Milk
The consumption of liquid milk in Malaysia was observed to be small.
Approximately 50,000 tonnes®''*(50,000 LME) of liquid milk was
consumed annually. Of this, approximately 10,000 (20 per cent) tonnes
was consumed through the school milk program. UHT milk was used as
a substitute for condensed milk®'®. Increased ownership of
refrigerators because of greater electritication, higher incomes and
greater urbanisation seemed to intiuence changes in food consumption
habits in Malaysia. Condensed milk was the common form of tea and
coffee whitener and sweetener used in Malaysia®'®. In more aftiuent
households the use of liquid milk and other 'whiteners', particularly the
low fat varieties, seemed to have increased. Nestles for instance, had
introduced a low fat variety of liquid milk under the brand name 'Nesties
373
374
375
376
I b i d . , p . 5.
Idem.
Idem.
Market Audit , l o c . c i t .

162
Slender'®''. Consumption of liquid milk had consistently increased.
Consumption in the period 1988-90 were as follows:
YEAR
1988
1989
1990
QUANTITY (Tonnes) ^
45,200
47,100
49,200
UHT milk represented 90 per cent of total manufactured liquid milk
consumed in Malaysia®'®. Dutch Baby and Nestles were the major
producers of liquid milk in Malaysia. Both these companies were major
producers of UHT milk which was the largest product line in this
category. The consumption of pasteurised and sterilised milk was
observed to be small®®°. In addition to supplying milk for the school
milk program, substantial sales of UHT milk seemed to be made to 'up
market' catering and food service outlets®®\ The major liquid milk
producers and their market share in different product lines are illustrated
in the Table 18. There were no Australian companies in the liquid milk
377
378
379
380
381
Idem.
IMES, OP. c i t . . p . 7 .
Market Audit, loc. cit.
Dairy Market Briefings, OP. cit., p. 5.
Dairy Market Briefings, Major supplier by product category.
Ibid, p. 4.
Market Audit, loc. cit.

163
category as the import of liquid milk into Malaysia was banned®®^
Consumption of manufactured liquid milk particularly in the retail
consumer segment seemed unlikely to grow very rapidly in the medium
term. This was because of the popularity of instantised wholemilk
powder and the marketing strength of NZDB and Nestles in the WMP
category®®®. NZDB was not represented in the liquid milk segment.
Nestles main marketing effort in the manufactured liquid milk category
seemed to be directed at the food service segment and a small niche
market for low fat milk in the retail consumer segment®®*.
TABLE 18: ESTIMATED MARKET SHARE OF LIQUID MILK (% VOLUME)^^^
COMPANY
DUTCH BABY
COLD STORAGE
NESTLES
MALAYSIA MILK
PASTEURISED
60
20
-
-
STERILISED
80
10
30
-
UHT
50
-
35
10
TOTAL
55
5
30
5
5.4.4 Yellow Fats
The average annual consumption of yellow fats in Malaysia was 10,000
tonnes®®®. This product category was made up of the following three
382
383
384
385
386
Idem.
Idem.
Idem.
Idem.
I b i d . . P- 7 .

product lines
164 387.
Butter
AnInydrous Milk Fat
Ghee
45%
45%
15%
The average annual consumption of butter was 3,500 tonnes®®®
(80,000 LME). The consumption of butter was observed to have
declined. This was probably because of competition from
margarine®®®. Malaysia is one of the world's largest producers of palm
oil and the Malaysian government encouraged the downstream
processing of value-added palm oil based products. The cheaper cost of
production and better storing qualities of margarine in unrefrigerated
conditions were positive product attributes for sale in Malaysia.
Refrigeration space particularly in retail outlets seemed to be
limited®®". Gross retail margins in Malaysia was only about 12 per
cent®®\ As a result of these constraints butter was not sold
387
388
389
390
391
Idem.
Idem.
Market Audit, loc. cit.
ADC Dairy Market Briefings, OP. cit., p. 7,
Market Audit, loc. cit.
Idem.

165
extensively in Malaysian retail outlets®®^ Consumers seemed to
generally perceive margarine and butter as substitutes. The demand for
yellow fats (margarine and butter) seemed to be highly price elastic®®®.
As a result of obvious cost advantages in the production of margarine
and hence the competitive strength of local margarine producers, the
consumption of butter in Malaysia had progressively declined' J 3 9 4
The average annual consumption of anhydrous milk fat (AMF) was about
5,000 tonnes®®®( 125,000 LME ). AMF was largely used by the
industrial segment for processing recombined milk products®®®. AMF
consumption data had been aggregated with data on butter consumption
thus making it difticult to analyse consumption trends of the two
products.
'Ghee (claritied butter) seemed to be an example of the successful
marketing of dairy products in Malaysia by an Australian company.
Annual consumption of ghee was estimated at 2,000 tonnes®®'
392
393
394
395
396
397
Idem.
ADC Dairy Market B r i e f i n g s , l o c . c i t .
Idem.
Idem.
Dairy Market Briefings, op. cit., p. 7.
Idem.
Market Audit, loc. cit.
Dairy Market Briefings, op. cit., p. 7.

166
(52,000 LME). The Butter Producers Cooperative Federation of
Queensland (BPCF) had approximately 70 per cent market share in this
product line. QBB can be classed as a 'star' in a Growth Share Matrix
model based on the Boston Consulting Group (BCG) Growth Share
Matrix. It seemed to be the only example of the proprietary brand of an
Australian company that had a large market share in a high growth
market®®®. As incomes in the Indian and Malay segment of the
population (the principal consumers of ghee) increased and as the
Chinese segment of the population increasingly consumed Malay and
Indian type foods such as 'thosai', 'murthapa', 'roti cani' and 'nasi
beryani' (meals for which ghee is used), the consumption of ghee was
forecast to increase and continue to have a long product life span®®®.
Health attributes of the product such as the anti-cancer properties of
conjugated linoleic acid (CLA) from butter fat*°° were seen to impact
positively on the consumption of ghee in Malaysia.
Religion and the mythology of food are important forces that drive
demand for food*°\ As illustrated in Table 11, the Malaysian
population is ageing. It is estimated that by the year 2020, the mean
398
Refer Case Study.
399
Market Audit, loc. cit.
400
Daniel, op. cit.. p. 15.
Ibid.. p. 16.
401

167
age of the Malaysian population will be more than 33 years*® .
Anecdotal evidence suggested that there is religious revival among the
Hindus in Malaysia and because of this vegetarian dietary habits were
becoming popular. Milk fat, especially that derived from ghee was the
principal source of protein in these ancient vegetarian societies. Ghee
seemed to be used extensively in Hindu and Sikh temples for preparing
meals*®®. Hindu and Sikh temples provided meals to the
congregation*"*. The Hindu and Sikh temples were observed to be an
important market for ghee in Malaysia*®®. The product market
performance of BPCF is covered in detail in the case study (see page
184).
5.4.5 Cheese
The consumption of cheese in Malaysia was observed to be low*®®.
However, with an annual increase in consumption of about 12 per cent,
this seemed to be a rapidly growing product categor/®'. The main
varieties of cheese imported into Malaysia were processed cheese,
cream cheese, fresh cheese and grated/powdered cheese*"®. There
402
403
401
405
406
407
408
Refer Section 4.9.4 on Demography.
Market Audit, loc. cit.
Idem.
Idem.
Dairy Market Briefings, op. cit., p. B.
Ibid.. p. 9.
Idem.

168
was no domestic production of cheese. The expansion of Western style
fast food outlets such as McDonalds, Pizza Hut and Shakeys Pizza
seemed to be the principal contributory reasons for the growth in sales
of cheese*®®. The demand for processed cheese slices was observed
to be greater than the demand for shredded cheese*^®. This was
because of the popularity of burgers*^\ In addition to Western fast
food chains, there appeared to be a proliferation of Malay operated
burger stalls. Malay burger manufacturers such as Ramli Burger seemed
to show the growing Malay participation in the burger type fast food
operations*^^. The consumption of beef burgers and, therefore,
processed cheese which is used as a complementary product in burgers,
was substantially higher among the Muslim Malays than among the
predominantly Hindu Indians or Buddhist Chinese who do not consume
beef. Demand for processed cheese in Malaysia was estimated to be
growing at approximately 20 per cent per annum. The growth in
consumption of cream cheese and fresh cheese was estimated to be
lower,*^® at approximately 8 per cent per annum*^*. Fresh cheese
was observed to be mainly used in 'upmarket' food service outlets such
409
410
411
412
413
414
Dairy Market Briefings, op. cit., p. 9.
Market Audit, loc. cit.
Idem.
Idem.
Idem.
Dairy Market Briefings, op. cit., pp. 8-9.
Retail Audit, loc. cit.

169
as hotels. The main end users continue to be Western expatriates and
tourists*^®.
High economic growth and development in tourism*^® suggested that
the consumption of cheese would increase further.
Consumption of powdered cheese had also increased substantially.
Powdered cheese was used extensively in food processing particularly in
the manufacture of snack foods*^'.
The market share of major companies for different categories of cheese
are shown in Table 19. NZDB had the largest market share. NZDB
displaced Kraft as the market leader in 1991*^®. NZDB appeared to
have strengthened its position through concentrating in the rapidly
growing food service segment.
415
416
417
Idem.
418
Refer to section on Malaysian economy (Chapter 4).
'Moving in on the growing snack food market,' Asia Pacific Food Industry. AP Food Industry Publications Pte Ltd, Singapore, January/February 1991 Volume 3 No 1/2 pp 46-52.
'Snacks in Southeast Asia', Asia Pacific Food Industry. AP Food Industry Publications Pte Ltd Singapore, April 1992 pp 28-32.
Dairy Market Briefings, op. cit., p. 9.

170
TABLE 19: CHEESE-MARKET SEGMENTS & COMPANY MARKET SHARE'^^^
COMPANY
NZDB
KRAFT
EC BRANDS
MARKET SEGMENT(%)
RETAIL
60
35
5
FOOD SERVICE
70
20
10
TOTAL! %)
50
30
10
5.4.6 Yoghurt
Yoghurt was principally domestically manufactured in Malaysia from
imported milk powder*^®. The product can be categorised into cup
yoghurt, drinking yoghurt and plain yoghurt*^^ Set cup yoghurt was
the principal category of yoghurt consumed in Malaysia. However,
dnnking yoghurt had become popular, and by 1991 accounted for more
than 90 per cent of all retail sale of yoghurt*". Consumption of retail
packs of yoghurt was estimated to have increased from a few hundred
tons in 1985 to 4,000 tonnes (4,000 LME) by 1990*". The
estimated market share of different product lines are as follows*^*:
419
420
421
422
423
424
Idem.
Market Audit, loc. cit.
Dairy Market Briefings, OP. cit., p. 9.
Market Audit, loc. cit.
Dairy Market Briefings, op. cit.. p. 9.
Idem.
Idem.

171
Cup Yogiiurt 400 tonnes
Drinking Yoghurt 3,600 tonnes
Plain Yoghurt 10,000 tonnes
Three companies (Nestles, Dutch Baby and Malaysia Milk) had 85 per
cent of the market for cup yoghurt*^®. The major producers of
drinking yoghurt were Vitagen, Nestles and Malaysia Milk*^®.
Consumption of manufactured yoghurt, especially drinking yoghurt was
forecast to increase rapidly. The increasing consumption of drinking
yoghurt seemed to be because of its sweet taste and its promotion as a
health drink*^'.
Plain yoghurt ('Thairu'/'Dahi') was observed to be sold extensively in
Indian food service outlets*". Consumption of plain yoghurt was
estimated to be at least twice as large as manufactured yoghurt.
Consumption of plain yoghurt was estimated at 10,000 tonnes (10,000
LME)*". WMP was observed to be reconstituted in the food service
outlets using bulk 25 kg. packs of full cream milk powder*®®. The
425
426
427
428
429
430
Idem.
Idem.
Market Audit ,
Idem.
Idem.
Idem.
l o c . c i t .

172
food service segment thus seemed an important market for WMP in
Malaysia.
5.4.7 Ice Cream
Ice cream sales in Malaysia was estimated at 15,000 tonnes (15,000
LME)*®\ The major product segment was the stick and cup lines that
accounted for 60 per cent of sales*®^ Walls, Cold Storage and
Premier Milk Industries were the major local manufacturers of ice
cream*®®.
5.5 Projection of Demand for Dairy Products in Malaysia
Consumption trends for dairy products in Malaysia were forecast by the
researcher using a model developed in an earlier study*®*. This model
considered variables such as current consumption, forecast of growth in
income, income elasticity of demand and the forecast of growth in
population to project consumption trends*®®. Consumption of dairy
431
432
433
434
435
Dairy Market Briefings, op. cit., p. 9.
Ibid.. pp. 9-10.
Idem.
Meyanathan S and Sivalingam G, 'Malaysia' in Anne Booth, Christina C. David, et al pp. 76-77.
Young et al.. 'Implications of dairy development in Indonesia', Agribusiness. Vol. 6, No. 6. p. 566.
NOTE; In this study, the demand for dairy products in Java (Indonesia) was computed using the following model:
Qi+i = Qi (1 + e * g) P'+'
where C'"' = Consumption in time t C = Consumption in base year e = Income elasticity g = Annual growth rate of income P'"' = Annual population growth rate

173
products in Malaysia up to the year 2020 was forecast using the
following formula:
C. = PJKJ1 + ge)^] where,
C, = Total consumption in year ' g = Annual rate of growth in per capita income e = Income elasticity of demand T = Number of years from base year (1990) K. = Per capita consumption in base year (1990) Pf = Population in year *
a) The annual growth in per capita income was pegged at 4 per cent.
There was no reason to assume that Malaysia's economic growth
and real per capita income growth will decline below an average
of 4 per cent per annum in the period 1990-2020. Recent
economic growth had been very high. From 1957-70, the
average increase in GDP was 6 per cent. This increased to 7.8
per cent in the 1970s but declined to 6 per cent in the 1980s
when the impact of world recession caused economic stagnation
in 1985 and 1986*®®. The GDP growth in the 1990s had been
even more impressive with growth of 9.8 per cent in 1990, 8.8
per cent in 1991 and 8.0 per cent in 1992*®'.
For purposes of providing an alternative forecast of trends in
consumption, per capita income growth was pegged at 2 per cent
436
437
Crouch, op. c i t . . p . 140,
Department of Foreign Affairs and Trade; Quarterly Economic and Trade Review. Commonwealth of Australia, November 1993 p. 34 citing Bank Negara Quarterly Reports 1990-1993.

438
439
440
441
174
per annum in computing the 'Worst Case Scenario'.
b) The income elasticity of demand for milk was pegged at 1.179
based on the study by Cheam in 1979*®®. it was assumed by
the researcher that this coefticient will continue for the period
1990-2020. Consumption of dairy products in Malaysia had
shown signiticant correlation to economic growth. For instance,
absolute consumption fell dramatically in 1985 and 1986*®®
following the low economic growth in 1985 and 1986**° and
increased substantially from 1988 when the economic growth in
Malaysia improved**\ The high economic growth, increasing
per capita incomes, substantially improved income distribution
that has been achieved through the NEP initiatives and the
forecast that these trends will continue at least up to the year
2020 influenced the researcher to assume that the income
elasticity coefficient for dairy products will continue to be 1.179
for the period 1990-2020.
An alternative income elasticity coefticient of 0.8 is used for the
Cheam Soon Tee; 'Household Food Consumption Analysis in Peninsular Malaysia', as cited in Anne Booth, Christina C. David et al p. 77.
Dairy Market Briefings, op. cit.. Trade & Product Balances.
Fifth Malavsia Plan 1986-1990, Economic Planning Unit; Government Printer, Malaysia 1991.
Dairy Market Briefings, op. cit.. Trade & Product Balances.

175
'Worst Case Scenario'. Young et_ai in a study of the dairy
industry in Indonesia, had pegged the income elasticity coefficient
for dairy products in Java at 0.8**^. The researchers explained
that this coefticient was based on the estimates of income
elasticity coefficients for dairy products in other Asian countries at
similar stages of development. Per capita income in Indonesia
was observed to be less than 25 per cent of that in Malaysia**®.
As such, this estimate for Malaysia was considered extremely
conservative.
c) Total consumption in 1990 was estimated at 91,000 tonnes.
This was based on the average annual consumption of 87,000
tonnes in the period 1985-89 as shown in Table 12*** plus
consumption of domestically produced fresh milk. Fresh milk
production in Malaysia was estimated at 30,000 tonnes**®. As
milk powder accounted for more than 80 per cent of dairy
products imported by Malaysia, domestic fresh milk production
was estimated to be equivalent to the import replacement of
442
443
444
445
Young e t a l . . op. c i t . . p . 568.
Robison, Richard; 'Indonesia: Tensions in state and regime', in Southeast Asia in the 1990s; Authoritarianism. Democracy & Capitalism. Hewison, Kevin et al. (Eds), Allen & Unwin, Australia 1993, p. 40.
Crouch, OP. cit.. p. 134.
Dairy Market Briefings, loc. cit.
Mahendranathan, op. cit.. pp. 175-176.
Dairy Market Briefings, op. cit., p. 2.

176
about 4 ,000 tonnes of dairy products in liquid milk equivalent
(LME) terms**®.
d) The population of Malaysia in 1990 was estimated at 17.3
mill ion**' as per Table 9.
e) The population of Malaysia was forecast at 19.19 million in 1995,
20.87 million in 2000, 22.32 million in 2005, 23.69 million in
2010, 25.13 million in 2015, and 26.56 in 2020**® as per
Table 9.
Through applying these variables, the growth in consumption and the
import requirements of dairy products in Malaysia were forecast to
change as shown in Tables 20 and 21 through applying different rates of
increase in income and income elasticity coefticients.
446
447
448
Dairy Compendium 1991, OP. cit.. p. 78. The liquid milk equivalent(LME)/Kg. for the production of different dairy products are as follows:
Butter 19.88 Skim Milk Powder 11.61 Buttermilk Powder 19.88 Casein 34.33 Cheddar Cheese 9.99 Wholemilk Powder 8.14
Nathan, Keyfitz and Flieger, Wilhelm, OP. cit., p. 230.
Idem.
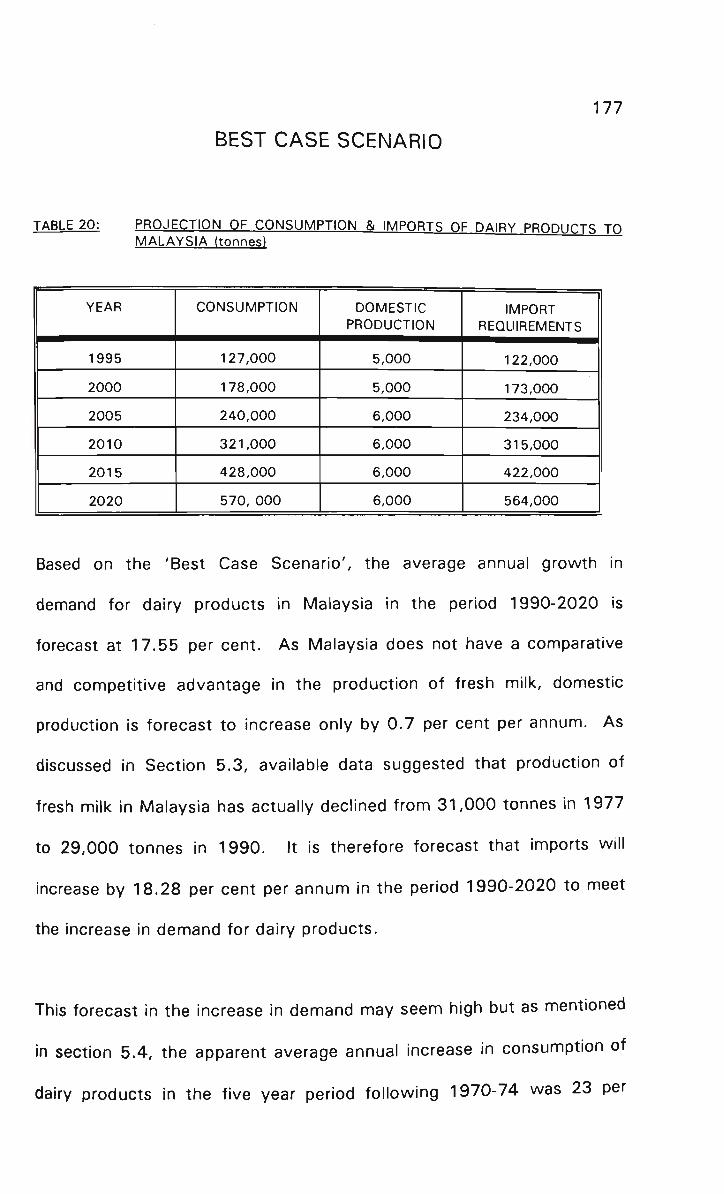
177
BEST CASE SCENARIO
TABLE 20: PROJECTION OF CONSUMPTION & IMPORTS OF DAIRY PRODUCTS TO MALAYSIA (tonnes)
YEAR
1995
2000
2005
2010
2015
2020
CONSUMPTION
127,000
178,000
240,000
321,000
428,000
570, 000
DOMESTIC PRODUCTION
5,000
5,000
6,000
6,000
6,000
6,000
IMPORT REQUIREMENTS
122,000
173,000
234,000
315,000
422,000
564,000
Based on the 'Best Case Scenario', the average annual growth in
demand for dairy products in Malaysia in the period 1990-2020 is
forecast at 17.55 per cent. As Malaysia does not have a comparative
and competitive advantage in the production of fresh milk, domestic
production is forecast to increase only by 0.7 per cent per annum. As
discussed in Section 5.3, available data suggested that production of
fresh milk in Malaysia has actually declined from 31,000 tonnes in 1977
to 29,000 tonnes in 1990. It is therefore forecast that imports will
increase by 18.28 per cent per annum in the period 1990-2020 to meet
the increase in demand for dairy products.
This forecast in the increase in demand may seem high but as mentioned
in section 5.4, the apparent average annual increase in consumption of
dairy products in the five year period following 1970-74 was 23 per

178
cent, it increased by an average of 31 per cent per annum in the next
five year period 1980 to 1984, and increased again by an average of 11
per cent per annum for the next five year period 1985-1989. The period
1985-1989 contained two years (1985 and 1986) when Malaysia was
affected by recession.
As such, trends in consumption of dairy products in Malaysia suggested
that the forecast of growth in consumption of approximately 18 per cent
per annum for the period 1991-2020 was realistic.
The 'Worst Case Scenario' was based on the assumption that Malaysia's
per capita income growth would average only 2 per cent per annum i.e
less than 25 per cent of the annual growth rate in the period 1990-
1992. In the 'Worst Case Scenario' the income elasticity coefticient is
pegged at 0.8 i.e. comparable to Indonesia whose per capita income is
less than 25 per cent that of Malaysia.
Trends in the consumption of dairy products under the 'Worst Case
Scenario' are shown in Table 21 .

179
WORST CASE SCENARIO
TABLE 2 1 : PROJECTION OF CONSUMPTION & IMPORTS OF DAIRY PRODUCTS TO MALAYSIA (tonnes)
YEAR
1995
2000
2005
2010
2015
2020
CONSUMPTION
101,700
111,400
120,300
128,600
137,500
146,600
DOMESTIC PRODUCTION
5,000
5,000
6,000
6,000
6 000
6 000
IMPORT REQUIREMENTS
96,700
106,400
114,300
122,600
131,500
140,600
The 'Worst Case Scenario' would result in consumption of dairy
products in Malaysia increasing by an average of 2.04 per cent per
annum in the period 1990-2020. Even on the basis of this computation,
absolute consumption will increase by 54.5 per cent by the year 2020
i.e. annual consumption will increase by 49,600 tonnes by 2020.
To further analyse the absolute increases in demand using the above
models, trends in the per capita consumption of dairy products in
Malaysia were reviewed. These are summarised below.
YEAR
1980
1985
1990
POPULATION (' 000)
13,763
15,448
17,339
AVERAGE CONSUMPTION/
ANNUM (T)
59,289
77,832
86,651
PER CAPITA CONSUMPTION
(KG)
4.31
5.04
5.00

180
Per capita consumption of dairy products in Malaysia in 1990 is
estimated at 5 Kg. per annum i.e. approximately 50 litres in LME terms.
Per capita consumption increased by 0.69 Kg. i.e about 7 litres in LME
terms in the period 1980-1990. The data above suggests that per
capita consumption declined slightly in 1990. However, this is not
wholly accurate as the average consumption volumes are based on data
for the tive preceding years. As was discussed earlier, the consumption
of dairy products in Malaysia declined substantially in the years 1985-
1986 when economic conditions were adverse. The annual
consumption of dairy products for these years were 82,505 tonnes in
1985 and 82,963 tonnes in 1986**®. Consumption increased
substantially from 1988 onwards when economic conditions improved.
The annual consumption peaked in 1988 to 109,500 tonnes and has
since then stabilised at about 95,000 tonnes*®®. The signiticant
feature is that per capita consumption increased by about 1.6 per cent
per annum in the period 1980-1990 and that it is also closely correlated
to growth in the economy (improvement in income).
The per capita consumption of dairy products in Malaysia is still
signiticantly lower than in many Western countries. The per capita
annual dairy product consumption in Australia, for example, is
449 Dairy Market Briefings, op. cit.. Trade and Product Balances,
450 Ibid.. Trade & Product Balances.

181
approximately 350 litres (LME)*®\ As such, the per capita annual
consumption of dairy products in Malaysia is only about 15 per cent of
that in Australia. The per capita consumption of dairy products in
Singapore is estimated at 70 litres (LME)*®^ The consumption in
these countries suggest that there is potential for substantial growth in
consumption of dairy products in Malaysia.
The computation below shows absolute consumption at different per
capita consumption volumes for the period 1995-2020.
YEAR Pop.« PER CAPrrA CONSUMPTION (KG)'
4 6 8 10 14 18 22
1995 19,186 76,444 115,116 153,448 191,860 268,604 345,348 422,092
2000 20,870 83,480 125,220 166,960 208,700 292,180 375,660 459,140
2005 22,320 89,280 133,920 178,560 223,200 312,480 401,760 491,040
2010 23,692 94,768 142,152 189,536 236,920 331,688 426,456 521,224
2020 26,856 107 424 161 136 214,848 268,560 375,984 483,408 590,832
* Population _Kilograms
In the event that per capita consumption declines by 20 per cent to 4 Kg. per
annum, absolute consumption will increase to 107,424 tonnes in 2020 i.e. an
increase of 16,000 tonnes. If per capita consumption remains unchanged at 5 Kg.
per annum, absolute consumption will increase to 134,280 i.e. absolute
451 Calculated using data on per capita consumption of key product lines as cited in Dairy Compendium 1992 pp. 48-49.
452 IMES Volume 2, op. cit., p. 10.

182
consumption will increase by 43,000 tonnes.
If absolute consumption in 2020 increases to 576,000 tonnes in 2020 as per the
•Best Case Scenario' in this study, per capita consumption will increase to
approximately 21 Kg. per annum (210 LME). This will still only be 60 per cent
of the 1990 per capita annual consumption of dairy products in Austi-alia.
If absolute consumption only increased to 152,600 tonnes in 2020 per the 'Worst
Case Scenario', the per capita consumption will be 5.75 Kg. (57.5 LME) per
annum i.e. it will be less than the current per capita consumption levels in
Singapore. Given the findings in the research that large sections of Malaysians
reflect positive cultural attitude to the consumption of dairy products and that
incomes in Malaysia will continue to increase, it seems highly improbable that
per capita consumption will be less than 6 Kg. per annum by 2020.
Even by conservative estimates, the per capita consumption of dairy products
should at least be mid-way between these two scenarios i.e approximately 12.5
kg. per annum. On the basis of this analysis, absolute consumption is forecast at
330,000 tonnes by 2020.
5.6 Chapter Summary
Demand for all dairy products except concentrated milk and butter have shown
substantial growth in Malaysia. Butter consumption has declined due to
competition from margarine, in the production of which Malaysia has a

183
competitive advantage. Sales of concentrated milk have not improved due to the
increase in consumption of other dairy substitutes such as powdered milk and
liquid milk.
Despite substitution of vegetable fat in the production of filled concentrated milk
which is the major dairy product sold in Malaysia, the consumption of milk fats
and the imports of dairy products have grown substantially.
Consumption of dairy products in Malaysia is forecast to reach at least
330,000 tonnes by 2020. Almost all of this increase in consumption has to be
met through imports as the domestic production of milk is not forecast to grow
rapidly.
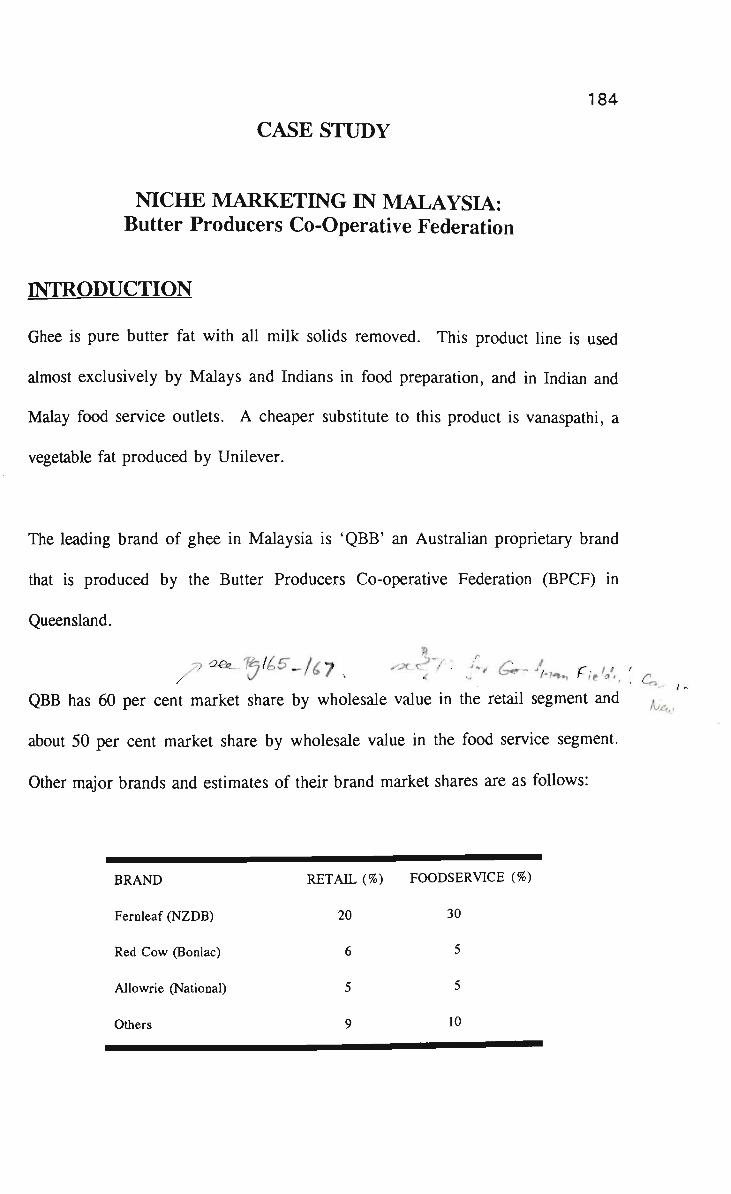
184
CASE STUDY
NICHE MARKETING IN MALAYSIA: Butter Producers Co-Operative Federation
INTRODUCTION
Ghee is pure butter fat with all milk solids removed. This product line is used
almost exclusively by Malays and Indians in food preparation, and in Indian and
Malay food service outlets. A cheaper substitute to this product is vanaspathi, a
vegetable fat produced by Unilever.
The leading brand of ghee in Malaysia is 'QBB' an Australian proprietary brand
that is produced by the Butter Producers Co-operative Federation (BPCF) in
Queensland.
^ -^I^l^s^/Cy , ^ ^ 7 : f. C^. 4.,^ . ^ . ^ ^
QBB has 60 per cent market share by wholesale value in the retail segment and ^^
about 50 per cent market share by wholesale value in the food service segment.
Other major brands and estimates of their brand market shares are as follows:
BRAND RETAIL (%) FOODSERVICE (%)
Fernleaf (NZDB) 20 30
Red Cow (Bonlac) 6 5
Allowrie (National) 5 5
Others 9 10

' ' 185
What are the key differences in the marketing mix strategies adopted by BPCF
that contrasts it with the larger, yet noticeably less successful Austialian
competitors such as Bonlac Foods and National Dairies?
1. Product
BPCF is a single product line company. It has a strong product - market focus.
The product texture, colour and flavour is tailored to its market niche. 'QBB' is
perceived to be coarser in texture and not to liquefy easily in comparison with
competing brands. The coarse texture is preferred by consumers because of the
variety of uses for ghee.
Ghee is extensively used in Hindu temples and Sikh gurudwaras. In fact, ghee is
considered the favourite food of the Hindu mythical deity Krishna. It has been
acknowledged by food marketeers that "the religion and mythology of food are
among the many forces that drive food consumption in the marketplace"*^^.
BPCF markets ghee that is perceived as clean and wholesome - as being 'Halal'
to the Muslims and as not containing any meat bi-products to the Hindus.
2. Price
'QBB' is generally sold as a premium product. Its retail pricing structure is
higher than competing brands. This pricing stioicture is a good strategy as ghee
is a more expensive product than vanaspathi, the main product substitute.
4S3 ^ . ,
Danie l , op. c i t . . p . 16.

186
Vanaspathi is made from palm oil fat, a cheap vegetable oil of which Malaysia is
among the world's largest producer.
Bulk ghee is also imported by a number of small wholesale outiets and repacked
in Malaysia for resale to retail and food service outiets. The low cost of
production in these outiets would make it difficult for 'QBB' to compete with
these producers such as Bagawan Singh Melasingh on price.
As such, the strategy of BPCF to position 'QBB' as a premium brand appears to
be a good brand positioning strategy. The product image is that of a good quality
premium product. As ghee is a 'premium' product for the preparation of more
expensive meals such as 'biryani' and 'korma ayam', there is little price elasticity
of demand for this product. As such price discounting may be an inappropriate
strategy for this product.
3. Promotion
'QBB' is advertised in Malay and Tamil newspapers and magazines. BPCF also
sponsors Tamil and Malay movies. Free offers are given with 'QBB' especially
during peak sales period in the month of Ramadan (the Muslim fasting month)
and Diwali (the Hindu festival). This promotional scheme gives maximum brand
exposure within the consumer market segment that 'QBB' is targeted at. The
promotional policy of giving free offers as opposed to price discounting also
helps maintain 'QBB's brand positioning as a premium product.

187
4. Place
In Malaysia, BPCF uses FIMA Cold Storage to contract pack the small 150 gram
and 250 gram pack which is marketed only in Malaysia and Singapore. Fima
Cold Storage is also among Malaysia's largest food distributor and supermarket
operator. Originally an Australian company owned by Goodman Fielder, the
company was acquired by the Malaysian government owned corporation FIMA.
Less than a year ago the company was acquired by Malay business interests.
BPCF has thus formed a strategic alliance with a large Malaysian, particularly a
Malay (Bumiputera) company that gives it synergy with its largest ethnic market
in Malaysia.
The company has also appointed Barkath Stores and Naina Mohammed, two large
and established Muslim wholesalers, as sub agents. These companies have
excellent distribution network in West Malaysia especially into Indian and Malay
owned provision shops and food service outiets. This sub agency arrangement
has introduced barriers to entry for new entrants targeting the Malay and Indian
segment of the market as Barkath Stores and Naina Mohammed probably have
the best distribution network into the Malay and Indian owned retail and food
service outiets in Malaysia. In contrast, Bonlac Foods and National Dairies have
appointed Chinese merchants as their resellers in Malaysia. As evidenced by the
substantially smaller market share, these agents do not have the marketing and
distribution strength into the Malay and Indian owned retail and food service
outiets. NZDB too, despite its impressive performance in some other dairy
product categories such as milk powder has not been able to compete with BPCF.

188
However, as the market share data illustrates, NZDB has been more successful
than Bonlac Foods or National Dairies through direct distribution of their brand,
'Fernleaf.
5. Packaging
'QBB' is packed in dark green tins with brand names and product descriptions in
English, Jawi and Tamil. Green is a colour that appeals to Muslims. Fernleaf is
also packed in green tin. Bonlac packs its brand 'Red Cow' in yellow and red
coloured tins, while National Dairies packs its brand 'Allowrie' in yellow and
blue tins - colour that appeal to the Chinese segment of the population who rarely
if at all use this product.
'QBB' is packed in a number of pack sizes such as 150 grams, 250 grams, 500
grams, 1 kilogram, 2 kilograms, 5 kilograms, and 19.25 kilograms. The smaller
pack sizes are particularly popular in rural Malaysia as consumers are able to use
a premium product at a low unit cost because of it being available in small pack
sizes. The larger pack sizes are economical and are used in food service outiets
and institutional outiets such as temples.
CONCLUSION
The successful marketing of 'QBB' as a brand signifies the importance of
developing a brand image, brand positioning, pricing strategies, product
packaging, aesthetics relating to brand name/packaging and the choice of channel
intermediaries in marketing dairy products in Malaysia. BPCF has applied all

189
these factors effectively to develop and maintain a dominant position in tiie
marketing of a branded value added dairy product in Malaysia. The effectiveness
of the marketing strategy of BPCF is a result of good quality market intelligence
and strategic application of this market intelligence. The success of BPCF reflects
how effective export marketing management can result in export market success
in spite of competition from larger companies.

190
CHAPTER SIX
6 AUSTRALIAN EXPORT PERFORMANCE
6.1 Chapter Objective
The objectives of this chapter are to,
6.1.1 Analyse the export performance of Australian dairy companies in Malaysia.
6.1.2 Critically evaluate the reasons for the positive and/or negative market performance of Australian dairy exporters in Malaysia.
6.2 Analysis of Export Performance
The export volumes of Australian dairy products to Malaysia and
Australia's share in total dairy imports by Malaysia are summarised in
Table 22*'*.
As illustrated in Diagram 1 (page 4), Australia's total dairy exports and
the sale of specitic dairy products to Malaysia had tiuctuated
signiticantly from one year to another. Exports in the period 1985-92
had tiuctuated from as low as 15,490 tonnes in 1990 to a maximum of
38,202 tonnes in 1992. The difference in export volumes between some
years as for example between 1992 (38,202 tonnes) and in 1990
(15,490 tonnes) which was 22,700 tonnes exceeded total exports in
several other years.
*^ Australian Dairy Corporation 1992a, OP- cit.. pp. 57-61.
Australian Dairy Corporation 1991, op. cit., pp. 57-70.
Dairy Market Briefings, loc. cit.

1 9 1
v> t c c
{M o> O)
" O)
o O)
1
OQ <
(/> O »-
o> 00
00 00 O)
r 00 O)
<o 00 O)
tn 00 05 T "
u u
Pro
d
r CO ^ es
U) 00 in O)
m 00 i »
10,
o in r>« ^
o <M CM CO T—
(O <o ^ 1^ *"
in CO r 00 *"
00 00 O) CN r—
CN ^ <o . ^
Q.
W
CN (O O
o CO 00 ^'
00
8 CN
O in 00
"
CN 00 * CO
r» o> <o ^
a> in r-
in
in CM 00 Tf
o> 00
q <D
WM
P
o> O) * CN CN
in ^ * CM
CO a> ^— CN
8 <o «n
CM O r«« (O ^
CO (O 00
^ CM
Tf O) 00 CO CN
CO
00
r-" ^
CO r^ r»' «"
ub-
To
ta
w
m 00
O) r
^ 00
O) r*
r-
00
r». 00
CN 00
CO r
^
are!
.c
rod
uct
S
0.
CO m (O
r* 00 ^
00 c CO
o> 00 ««t
in
o CO
o r in
00 CO rt
m 00 CO
Oi O Tj-
hees
e
O
CN CO
in CO ^
CO
o t
m CO m
a> «• t
•— ^ in
O ^ in
r r ^
o o r«.
utter
03
CO CO 00 * " •
Tt-in ^ CO
CO CO CN eg'
CO CO CO
CO
CN * CO CO
00 CO Oi
CO
o Tf m CM
_ CO O) CN
»" r 00 CO
u.
<
CN
o CN 00 CO
CN OQ
28,1
o c» ^ in
«" CO Oi
CO CN
oo CO
q *— CN
. in O) CO PsI
CN ^ ^ h""" CN
«* CO CO w.-C\l
,_ «— r«>^ c' Csl
OT
AL
1-
40
c
•5 c
_ ?S J5
83,(
^ CM «— W 00
Q Q Q
»— 00
Q rS Q 00 o>
0 0 r*. CO 00
8 in CO f
00 r-
^^ «* 00
rts
0
ota
l Im
p
1-
(0 <; c
CO "c
O)
CO CM
CO CM
00 CM
CO CO
O) CM
r CM
5 0)
(0 r-
Mark
et
SI
o en
c ^ CT<
CM c ^ < ^
g 3
T3 C
E 0 O
> u « a
c 0 .P Id u
a 0 u > 1 u -H Id a c Id
Id
n 3

192
Marked tiuctuations in Australia's market share in total dairy imports by
Malaysia were also observed. Australia's market share of dairy imports
by Malaysia had continued to decline progressively from a peak of 33
per cent in 1987 to 19 per cent in 1990, the most recent year for which
Malaysia's import data was available.
SMP and WMP represented approximately 80 per cent of Australian
exports to Malaysia, thus demonstrating an unbalanced product sales
mix. The demand for SMP and WMP were observed to be derived
demand in that these products were used by the dairy manufacturing
industry in Malaysia to manufacture other dairy products or for repacking
into consumer packs. As WMP and SMP were almost wholly exported
in bulk undifferentiated form, demand was observed to be highly price
elastic. Australian exports of WMP and SMP were affected when
cheaper products from EC, USA or other countries became available. As
such, the exports of SMP and WMP showed even greater tiuctuations in
exports than total dairy exports. In 1990 for example, exports of
Australian SMP and WMP to Malaysia was 15,490 tonnes. In 1991
exports more than doubled. However, this did not suggest that
Australian exports of SMP and WMP to Malaysia had increased. High
exports of SMP and WMP (comparable to exports in 1991) had been
recorded in the past, as for instance in 1987, only to decline again in
later years.

193
Even within this product category (SMP and WMP), the primary research
tindings suggested that export performance was largely dependent on
the sales by Nestles to its associate company in Malaysia. It was
estimated by the researcher that the exports from Nestles Australia to
Nestles Malaysia would alone account for more than 50 per cent of total
WMP exports from Australia to Malaysia' ,456
The contribution to export sales resulting from trade between
subsidiaries and associate companies of multi-nationals are hard to
evaluate as they are dependent on non tangible factors such as transfer
pricing. Transfer pricing decisions are affected by several factors
including differences in corporate tax regimes between countries, tariffs
and/or trade regulations, credit status of the companies and joint venture
constraints in the host country*^^. As such, on the basis of available
information it was not possible to determine the reasons for Nestles
Malaysia procuring large volumes of their WMP requirements from
Nestles Australia.
In the export of other dairy products too, performance seemed
dependent on the competitiveness of a few companies such as Kraft and
BPCF. Kraft was observed to have signiticant market share in cheese
products in Malaysia and BPCF was the market leader for ghee in
Market Survey, loc. cit.
"" Jain, Subhash C; International Marketing Management (4th edition), Wadsworth Publishing Company, USA 1993 pp. 551-556.

194
Malaysia*^^ As illustrated in the case study, the performance of
companies such as BPCF show the company's export market focus,
good quality market intelligence and effective application of marketing
mix strategies. Trading companies such as Ballantyne Export Company,
Ausfine and Lavery International were observed to be major exporters of
SMP, butter oil and cheese powder to Malaysia*^^. These trading
companies through effective networking and market research seem to
have performed better in dairy exports to Malaysia than had the larger
dairy companies*®^. The export performance of the major Australian
dairy companies to Malaysia was observed to be generally poor.
6.3 Analysis of Reasons for Poor Performance of Australian exporters
The weaknesses and hence the poor performance of the larger
Australian dairy companies in Malaysia were perceived by the researcher
to be attributed to the following reasons:
6.3.1 Overdependence on Indirect Reseller Channels
The companies surveyed were observed to be dependent on indirect
export marketing channels such as export agents and merchants in
Malaysia and channel intermediaries in Singapore and Australia for
export marketing to Malaysia*^^ Table 23 summarises the tindings of
''" Marketing mix strategies of BPCF are discussed in Case Study (Chapter 5).
Idem.
460 .. ,
Idem.
Idem.

195
the primary research done by the researcher. More than ninety per cent
(i.e. 19 companies) of the respondents were observed to be indirect
exporters to Malaysia. Of these, twelve companies exported to Malaysia
through resellers/resale operations from countries outside Malaysia.
Seven companies had resellers who were based in Singapore and tive
had resale operations that were managed from Australia. In contrast to
this, companies who dominated sales in Malaysia such as NZDB, Nestles
and Dutch Baby were observed to use direct channel marketing
strategies with logistics such as warehouses, distribution and other
infrastructure to develop both extensive sale of their core products such
as milk powder and intensive sale of specialised products such as low
fat milk to niche markets.
TABLE 23: AUSTRALIAN DAIRY EXPORTS TO MALAYSIA - TYPES OF RESELLER CHANNELS
RESELLER CHANNELS
MALAYSIAN SALES OFFICE
MALAYSIAN AGENT
MALAYSIAN MERCHANT
AUSTRALIAN RESELLER
MALAYSIAN SUBSIDIARY
SINGAPORE RESELLER
TOTAL
NUMBER
1
5
2
7
1
5
21
PERCENT
4.8
23.8
9.55
33.3
4.8
23.8
100
CUM PERCENT
4.8
28.6
38.1
71.4
76.2
100.0
100
The export performance (share of exports to total production) of the
companies surveyed were analysed using a one way Analysis of
Variance (ANOVA) based on the type of channel intermediaries used by
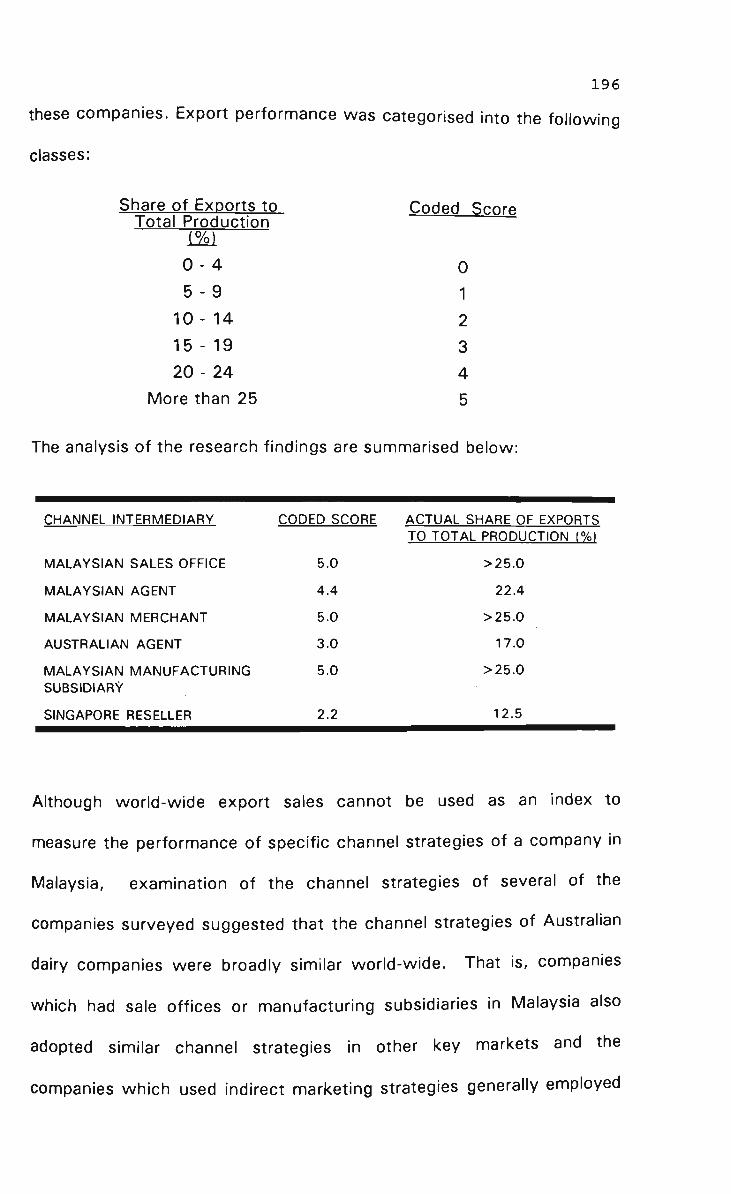
196
these companies. Export performance was categorised into the following
classes:
Share of Exports to Coded Scorn Total Production
0 - 4 0
5 - 9 1
1 0 - 1 4 2
1 5 - 1 9 3
2 0 - 2 4 4
More than 25 5
The analysis of the research tindings are summarised below:
CHANNEL INTERMEDIARY
MALAYSIAN SALES OFFICE
MALAYSIAN AGENT
MALAYSIAN MERCHANT
AUSTRALIAN AGENT
MALAYSIAN MANUFACTURING SUBSIDIARY
SINGAPORE RESELLER
CODED SCORE
5.0
4.4
5.0
3.0
5.0
2.2
ACTUAL SHARE OF EXPORTS TO TOTAL PRODUCTION (%)
>25.0
22.4
>25.0
17.0
>25.0
12.5
Although world-wide export sales cannot be used as an index to
measure the performance of specitic channel strategies of a company in
Malaysia, examination of the channel strategies of several of the
companies surveyed suggested that the channel strategies of Australian
dairy companies were broadly similar world-wide. That is, companies
which had sale oftices or manufacturing subsidiaries in Malaysia also
adopted similar channel strategies in other key markets and the
companies which used indirect marketing strategies generally employed

197
similar strategies in other key markets. Not withstanding this
generalisation, it was observed that companies which used their own
manufacturing or sale subsidiaries in Malaysia exported a higher share of
their production than companies which used indirect channel
intermediaries such as Singaporean or Australian resellers to export to
Malaysia. This suggested that companies which adopted direct export
marketing strategies were more export market focussed compared with
companies that used indirect channel intermediaries to export^^^.
These findings supported hypothesis 1.4 (a) of this research.
6.3.2 Non Intensive Marketing
As mentioned in Section 6 . 3 . 1 , more than 52 percent of the
respondents (11 companies) had no channel intermediaries representing
them in Malaysia. Of the nine companies with reseller operations in
Malaysia, it was observed that eight companies had appointed only one
agent/distributor to cover the whole of Malaysia. The primary research
tindings are summarised in the Table 2 4 * " . As such, Australian
companies were viewed by the researcher as not engaged in intensive
marketing. In comparison companies such as Nestles, NZDB and Dutch
Baby had at least one agent/distributor in each major town. Nestles, in
462
463
Shoebridge, Neil; 'Food for Asia: A market on the boil', Business Review Weekly, October 23, 1992. NOTE; A number of commentators including Kenichi Ohmae (McKinsey & Company), and Owen Price (Dairy J^^^ International) have been quoted in this article as emphasising that indirect export marketing strategies are constraining export market opportunities for Australian food products to Asia.
Market survey, loc. cit.

198
particular, had developed an extensive network of agency representation
in all major towns with elaborate training and sales support from the
central office in Kuala Lumpur and regional oftices in major towns such
as Pulau Pinang, Ipoh, Melaka, Johor Baru, Kuantan and Kota Baru*^*.
This tinding supported hypothesis 1.4 (b).
6.3.3 Non Focused Marketing
It was observed that the companies surveyed generally operated with
one channel intermediary (reseller) in Malaysia (Table 24). These
resellers handled sale of all products to ail market segments (industrial,
food service and consumer). This suggested that the companies
surveyed were neither specialised on the basis of sale territories within
Malaysia nor by user segments. This supports hypothesis 1.4 (c) and (d)
of this research which postulated that Australian exporters did not
practice intensive marketing either through specialising in sale territories
or product user segments.
TABLE 24: AUSTRALIAN DAIRY PRODUCT EXPORTS TO MALAYSIA - INTENSITY OF MARKET COVERAGE*^^
NUMBER OF INTERMEDIARIES IN MALAYSIA
0
1
2-3
NUMBER
12
8
1
PERCENT
57.1
38.1
4.8
CUMULATIVE PERCENT
57.1
95.2
100.0
464
465
Idem.
Idem.

199
6.3.4 Overdependence on Traditional Reseller Intermediaries
More than seventy five (75) per cent of resellers who represented the
companies surveyed had managed their export operations in Malaysia for
more than 15 years (Table 25). This tinding supported research
hypothesis 1.4 (e). The dramatic economic growth, structural changes
in the economy, perceived growth in demand for dairy products, socio
economic changes resulting from greater urbanisation, improved socio
economic position of the Malays, improved wealth of the rural farmers
would all have necessitated reassessment of reseller channel strategies.
However, Australian companies did not seem to have reviewed their
reseller channel strategies in Malaysia in the last 15 years. There were
comments by key executives of three companies that review of channel
strategies was probably necessary but that this was difticult because of
the extreme personal and friendly relations that had been developed with
managers of existing intermediaries over several years. It was implied
by the respondents that they were 'comfortable' with the present
arrangement and that they did not want to risk introducing changes. In
contrast, companies such as Nestles, NZDB and Dutch Baby had entered
into strategic alliances in production and/or repacking with Malay
businesses and had been selecting Malays as their channel
intermediaries. These actions may have been to comply with NEP
guidelines but they were also observed to be a recognition of the need
to maximise distribution to all ethnic groups in what seemed an
ethnically polarised market.

200
TABLE 25: AUSTRALIAN DAIRY PRODUCT EXPORTS TO MALAYSIA-HISTORY OF ' RELATIONSHIP WITH RESELLERS
YEARS
> 25
2 0 - 2 4
1 5 - 19
1 0 - 14
5 - 9
< 5
NUMBERS
5
2
5
-
-
4
PERCENT
31.3
12.5
31.3
-
-
25.0
CUMULATIVE PERCENT
31.3
43.8
75.1
75.1
75.1
100.0
6.3.5 Poor Quality Market Intelligence
The companies surveyed were observed to depend upon their indirect
channel intermediaries for market intelligence and seemed to consider
their reseller channels as the most important source of market
information. This was illustrated in the analysis of survey results
through an analysis of variance (ANOVA) of Australian companies that
used different channel intermediaries and the importance that these
companies attributed to different sources of market information (Table
26). The companies surveyed were asked to select their major sources
of market information on Malaysia and rank using a scale of '0 ' (Not
Important) to '5 ' (Important), the degree of importance that they
attributed to each of their choices. The respondents gave a mean score
of 4.81 for resellers as an information source. The results are not
statistically signiticant because all respondents ranked their resellers as
an important source of market information. However, the analysis
revealed some interesting results. For example, companies which used
Malaysian agents or merchants scored a mean value of 5 for resellers as

2 0 1
an information source. As it was explained in an earlier section of this
study, more than tifty seven per cent of the companies surveyed used
channel intermediaries in countries outside Malaysia. Those using
channel intermediaries in Malaysia used Chinese merchants. Ordinarily,
reseller channels would constitute an important source of market
information. However, Malaysia's special demographic, socio-economic
characteristics and public policies suggested that the information from
resellers needed to be used more selectively. Malaysia's 17 million
population consisted of three major ethnic groups. Malays and other
indigenous groups made up approximately 60 per cent of the population,
Chinese made up approximately 30 per cent of the population and
Indians made up approximately 10 per cent of the population (Dixon,
1991). Following the race riots of 1969, the Malaysian government had
implemented an affirmative program called the New Economic Policy
(NEP) that favoured Malays in business activities. This program had
substantially increased the participation rate of Malays and other
indigenous communities in commerce. It was for example, estimated
that in 1970 only 2.4 per cent of the share capital of limited companies
in West Malaysia was owned by Malays. By 1990, the share capital of
Malays in limited companies was estimated to have increased to 20.3
percent (Crouch, 1993).

2 0 2
TABLE 26: MEAN SCORES OF THE IMPORTANCE OF RESFLLERS AS A SOURCE OF MARKET INFORMATION
TYPE OF RESELLERS USED
MALAYSIAN SUBSIDIARY
MALAYSIAN AGENT
MALAYSIAN MERCHANT
AUSTRALIAN AGENT
MALAYSIAN MANUFACTURING
SINGAPORE RESELLER
TOTAL
NUMBERS
1
5
2
2
1
5
16
MEAN SCORE
5.0
4.8
5.0
5.0
5.0
4.6
4.8
F Ratio: . 4375 F Probability: . 8129
Using traditional resellers in a fast evolving and dynamic market place
seemed to have limited the quality of market information particularly on
new business power groups with whom Australian companies could
have formed strategic alliances. The majority of the companies surveyed
appeared to have little understanding of various government programs
that affected business operations in Malaysia or the size and features of
the Malay segment of the market. The success of affirmative actions
under the NEP and the increasing importance of the Malay segment of
the population both as consumers and for strategic business alliance did
not appear to be well understood by the companies surveyed. It is
suggested in this research that the traditional Chinese merchants do not
understand the characteristics of the Malay segment of the market and
as such may not be the appropriate channel intermediary to maximise
business opportunities in this large and rapidly growing segment.
Malays accounted for 60 per cent of Malaysia's population. This,

203
together with the increasing affluence of Malays suggested that this was
probably the most important ethnic segment for dairy products in
Malaysia.
Findings in the primary research also suggested that the role of the
Malaysian reseller was generally limited to public relations with the
'Buyers' in the Malaysian food processing companies and the provision
of services such as credit to the customer. Sales from the Australian
principal to the Malaysian reseller was almost always observed to be
completed through confirmed irrevocable letters of credit at sight i.e. on
cash terms*^^. Marketing executives from the principal in Australia
periodically called on the Agent and jointly made market visits to the
industrial outlets. These brief visits (averaging two days in Malaysia, as
part of a market visit to ASEAN countries),*^^ and the collation of
market information from the reseller in Malaysia were viewed by the
researcher to be not directed at developing a brand market profile nor
export sales to the consumer and food service market segments. These
tindings supported research hypothesis 1.4 (f).
466 _ , Idem.
Idem.

204
6.3.6 Lack of marketing emphasis on the Impact of income growth & changes in dietary habits
The mean scores using a one way ANOVA on the perception of the
importance of changes in income and dietary habits as factors
intiuencing demand for dairy products are summarised in Table 27.
TABLE 27: MEASURES OF THE IMPORTANCE IN INCOME & DIETARY CHANGES BY EXPORTERS USING DIFFERENT CHANNEL INTERMEDIARIES
RESELLER CHANNEL
MALAYSIAN SUBSIDIARY
MALAYSIAN AGENT
MALAYSIAN MERCHANT
AUSTRALIAN AGENT
MALAYSIAN MANUFACTURING
SINGAPORE RESELLER
TOTAL
F Ratio
F Probability
MEAN SCORE
INCOME CHANGES
5.0
4.6
4.5
5.0
4.0
3.7
4.4
.8689
.5458
DIETARY CHANGES
5.0
3.5
3.5
4.5
4.0
4.0
3.9
.8800
.5314
As shown in Table 27, the companies surveyed ranked income changes
and changes in dietary habits as the principal factors that influenced
demand for dairy products in Malaysia. To this extent, the research
hypothesis 1.4 (g) was supported. However, analysis of the data
suggested that exporters who used resellers in Malaysia (Malaysian
agent/merchant) perceived dietary change as less important (mean score
3.5) than changes in income (mean score 4.5) as factors that intiuenced
demand for dairy products. Australian dairy exporters who had

205
Malaysian subsidiaries or Malaysian manufacturing operations, i.e.
companies with the most direct channel strategies ranked dietary
changes and income changes as being equally important determinants in
the demand for dairy products in Malaysia. These tindings are illustrated
in Diagram 8. There is need to research whether the ethnic Chinese
background of the resellers representing Australian exporters in Malaysia
may be limiting market information on the importance of the differences
and changes in the dietary habits of other ethnic communities such as
the Malays. Studies such as that by Zain and Meyanathan suggested
that there were substantial differences and changes in the dietary and
shopping habits of the Malays.
DIAGRAM 8: IMPORTANCE OF INCOME AND DIETARY CHANGES ON DAIRY PRODUCTS DEMAND
Mean Score
M*l<Vti*n Sub«idiiry M*l*yti*n Merchant Mdty t i tn ManufKtinne M*l*Y(i*n Aoent Auitrdian Aowit Singapore R«Mll«r
Reseller Channel
Income Change^ Dietary Change

206
Several studies suggested that moderate income customers from rural
Malaysia were the main customers in modern supermarkets in urban
Malaysia'*^®. Large supermarkets in urban Malaysia reported that they
were dependent upon rural shoppers in the weekends for their
trade*'^
This contrasted sharply with the popular perception that demand for
Western type food products was essentially confined to the urban
middle class in Malaysia'*^".
This perception may have resulted from these companies not testing
new products in the market and/or as discussed earlier, the focus of
these companies being limited to the Chinese segment of the market.
Companies such as Nestles and Australian export agents such as
Ballantyne who had successfully introduced new products were
observed to perceive income changes and dietary changes as being
equally important factors that influenced growth in consumption of dairy
products in Malaysia. Ballantyne had successfully introduced cheese
*^^ 'Diet revolution in Pacific Rim creates new customers for U.S. foods', AqExporter. Volume 5, Issue 6, June 1993 p. 4.
469 .... ibid.. p.4.
Section 4.7 of this thesis contains research findings by Osman that there is strong correlation between ethnicity and the choice of retail outlets in Malaysia, with the Malays preferring to shop in supermarkets.
*'° Refers to discussions in Chapter 2 on the almost exclusive relationship of income to dietary changes that is espoused by a number of writers.

207
powder to the snack foods industry in Malaysia*^\ Nestles had an
extensive product range and had continually introduced new products
into Malaysia, the most recent being low fat liquid milk. In contrast,
companies who exported bulk products and/or who depended upon
traditional reseller intermediaries for market intelligence seemed to
perceive that there were no substantial changes in dietary habits. As
the majority of the companies surveyed used traditional reseller
intermediaries and/or concentrated on the export of bulk commodities, it
had to be concluded that the research hypothesis was not supported i.e.
the alternate hypothesis that there was insufticient marketing emphasis
on the importance of growth in income and changes in dietary habits
seemed more probable. This finding suggested that the Australian
exporters did not recognise that signiticant changes in income and
dietary habits particularly among the Malays, was intiuencing demand
characteristics in Malaysia.
6.3.7 Not tailoring marketing mix to Malaysia's unique ethnic population variables
Response to this investigation was more revealing. All exporters other
than Nesties, Bonlac Foods and BPCF did not consider the ethnic mix of
Malaysia's population as being important in formulating export market
strategies. The most successful Australian exporters such as Nesties
and BPCF gave a mean score of '5 ' (Important) to ethnic differences as a
factor in developing export market strategies for Malaysia. Eighty (80)
471
Market Survey, l o c . c i t .

208
per cent of Australian exporters gave this factor a mean ranking of less
than 3. In fact, 50 per cent of the respondents gave this factor a
ranking of ' 0 ' i.e. they considered ethnic mix of the population in
Malaysia as totally unimportant in developing their marketing strategies
in Malaysia. The correlation of export market success (share of exports
to total production) to the emphasis given by the companies to ethnic
differences in the market-place ranked on a scale of '0 ' (Not Important)
to '5 ' (Important) was tested using the Spearman Correlation
Coefticients. It was found that the companies surveyed did not consider
this as an important factor in export marketing to Malaysia (signiticant at
0.01). A Spearman's Test was also completed correlating responses on
forecast of market potential which was ranked on a scale of '0 ' (Poor) to
'5' (Good) to the emphasis given by the respondents to ethnic
differences in the market ranked on a scale of '0 ' (Not Important) to '5 '
(Important). Again, it was found that companies which forecast high
growth in the market did not give much importance to the ethnic
differences in the market (signiticant at 0.10). This tinding was further
supported by comments from CEO's of some of the companies
surveyed. The CEO of one company for example, in a separate
interview with the researcher, acknowledged that he did not know of
substantial differences in consumer attitudes and food consumption
habits between the Malays and the Chinese in Malaysia as described by
the researcher. The findings by the ADC seemed somewhat similar. The
ADC's analysis of the market in Malaysia suggested that the expenditure
on dairy products among the three major ethnic groups (Malays, Chinese
209
and Indians) was the same*^^ Well researched reports such as 'Food
Trade and Food Security in ASEAN and Australia' have highlighted the
distinct differences in the food consumption expenditure of different
ethnic groups in Malaysia"^^^. Each of the ethnic groups in Malaysia
represented sizeable market segments. As is evident from the case
study, BPCF's success in Malaysia was largely a result of the company
recognising the unique characteristics of the market and developing
appropriate marketing mixes strategies. These tindings strongly support
research hypothesis 1.4 (h).
6.3.8 Over emphasis on the Importance of supermarkets as retail reseller channels
The perception of the companies surveyed regarding the importance of
supermarkets as intermediaries for the sale of dairy products was tested
using a one way ANOVA with a scale of '0 ' (Not Important) to '5 '
(Important). The mean reading of 3.31 suggested that the research
hypothesis 1.4 (i) was supported. In fact, respondents who used
merchants and reseller channel intermediaries in Malaysia and Singapore
gave very low ratings of 2.0 and 2.8 respectively to the prospects of
changes in the retail grocery trade in Malaysia from small shops to
supermarkets. The researcher was unable to explain this finding except
to speculate that the feed-back from these intermediaries was intiuenced
by their desire to concentrate in markets where they perceived they had
Dairy Market Briefings, op. cit., p. 4.
' Booth, OP. cit., pp. 56-58.

210
the strength. The merchants were probably better positioned to service
these traditional outiets rather than the supermarkets.
6.3.9 Perception of being Non Price Competitive
With the exception of companies such as Nestles and BPCF, the majority
of the companies surveyed viewed competitors such as NZDB as
actively discounting prices and therefore making market entry into the
food service and consumer segments in Malaysia difticult. This finding
supported research hypothesis 1.4 (j). The responses on the reasons for
the success of NZDB in Malaysia were tested using one way ANOVA.
The results showed significant mean scores in some variables. This is
illustrated in the Table 28.
TABLE 28: MEAN DIFFERENCES OF VARIABLE BY INTERMEDIARY
REASONS
CHANNEL MARKETING
PROMOTIONS
PRICE DISCOUNTING
MALAYSIAN
AGENTS
2.2
3.0
4.0
MERCHANTS
2.5
3.0
4.0
M'FACr
4.0
-
-
SINGAPORE AGENT
2.0
4.0
5.0
MEAN SCORE
2.4
3.2
4.3
Manufacturer
Price support both by heavy promotional spending (mean score 3.2) and
price discounting (mean score 4.3) were generally viewed by the
respondents as the cause for the strength of NZDB in Malaysia. NZDB,

2 1 1
as had been discussed earlier in this thesis, had only entered the market
in 1985 and by 1992 was holding either the premier or second position
in a number of product categories. As had been explained, NZDB was
observed to be particularly strong in high growth 'up market' products
such as cheese i.e. products whose demand would have been driven
more by the quality image rather than price. NZDB had built a brand
protile in the consumer and food service market segments. The
perception of the majority of the companies surveyed was observed to
be shaped through information from channel intermediaries as this was
the principal source of market intelligence for them'*^'*. It is signiticant
that only Nestles Australia and BPCF attributed NZDB's success in
Malaysia to effective channel marketing (mean score 4). Nestles
Australia had cited its associate company Nestles Malaysia as its
principal source of market intelligence. Nestles Malaysia was well
represented in Malaysia through an elaborate marketing and sales
department and similar to NZDB had either the premier or second
position in almost all dairy product categories in Malaysia. The market
intelligence of Nesties Australia was from a direct source and was
perceived by the researcher to be more reliable. The researcher perceived
that the indirect channel intermediaries were probably using price non-
competitiveness as method of negotiation to obtain discounts from their
Australian suppliers.
474
Refer s e c t i o n 6 . 3 . 1 .
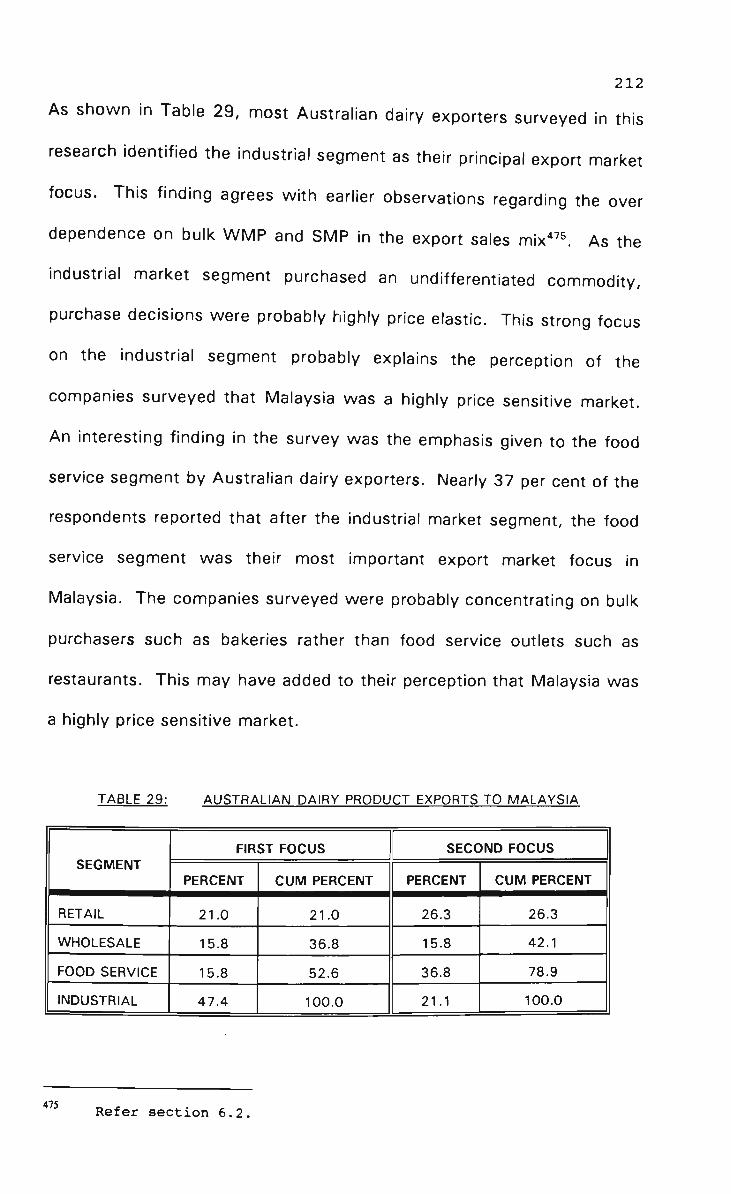
212
As Shown in Table 29, most Australian dairy exporters surveyed in this
research identitied the industrial segment as their principal export market
focus. This tinding agrees with earlier observations regarding the over
dependence on bulk WMP and SMP in the export sales mix*^^ As the
industrial market segment purchased an undifferentiated commodity,
purchase decisions were probably highly price elastic. This strong focus
on the industrial segment probably explains the perception of the
companies surveyed that Malaysia was a highly price sensitive market.
An interesting tinding in the survey was the emphasis given to the food
service segment by Australian dairy exporters. Nearly 37 per cent of the
respondents reported that after the industrial market segment, the food
service segment was their most important export market focus in
Malaysia. The companies surveyed were probably concentrating on bulk
purchasers such as bakeries rather than food service outlets such as
restaurants. This may have added to their perception that Malaysia was
a highly price sensitive market.
TABLE 29: AUSTRALIAN DAIRY PRODUCT EXPORTS TO MALAYSIA
SEGMENT
RETAIL
WHOLESALE
FOOD SERVICE
INDUSTRIAL
FIRST FOCUS
PERCENT
21.0
15.8
15.8
47.4
CUM PERCENT
21.0
36.8
52.6
100.0
SECOND FOCUS
PERCENT
26.3
15.8
36.8
21.1
CUM PERCENT
26.3
42.1
78.9
100.0
475 Refer s e c t i o n 6.2,

213
A further significant tinding in this research were the differences in
growth forecasts of the market by the respondents. Forecast of
estimates in market growth based on type of reseller intermediary used
by the exporter were analysed using a one way ANOVA. Growth
forecasts were ranked on a scale ranging from '0 ' (No Growth) to '5 '
(more than 25 per cent growth). The mean scores are shown in Table
30.
TABLE 30: RANKING OF MARKET POTENTIAL & FORECAST OF EXPORT GROWTH
RESELLER CHANNEL
MALAYSIAN SUBSIDIARY
MALAYSIAN AGENT
MALAYSIAN MERCHANT
AUSTRALIAN AGENT
MALAYSIAN MANUFACTURE
SINGAPORE RESELLER
TOTAL
MARKET POTENTIAL
3.0
3.8
3.5
2.5
5.0
4.0
3.7
EXPORT GROWTH
5.0
3.2
3.0
2.0
5.0
2.4
3.0
It was observed that companies such as Nestles who had adopted direct
export marketing strategies in Malaysia forecast high growth in sales
over the next two years whereas exporters who used indirect channel
intermediaries forecast relatively lower growth in sales. As illustrated in
Diagram 9, the position of the two variables 'Market Potential' and
'Export Growth' for companies using indirect reseller channels and those
exporting directly were opposite to one another. These differences in
perception of the market suggested that the quality of market

214
Information from indirect channel intermediaries needed to be examined
carefully as they were very different from that of companies that
exported directiy and therefore probably had better information on the
market.
DIAGRAM 9: INTERMEDIARY USED AND FORECASTS OF MARKET POTENTIAL & EXPORT GROWTH
Mean Score
5.3
4.8
4.3
3.8
3.3 f
2.8
2.3 1.8
m
Mdayeian Subeldlary Matayeian Mareham Mafayaian Manufaetuf<i>g Malayalan Aoant AuatnAan Agant Wnaapwa RaaaMai
Reseller Channel
11 Market Potential M Export Growth

215
6.3.10 Fear of the competitive strength of NZDB/NESTLES
Forty two (42) per cent of respondents gave a mean score of 4 and
above to this question, indicating that they perceived the competitive
strength of NZDB and Nestles as detracting them from more aggressive
market entry into Malaysia. Fifty eight (58) per cent of respondents
gave a rating of 3 and less to this investigation suggesting that the
majority of respondents were not affected by the competitive strength of
NZDB and/or Nestles in their market entry decisions into Malaysia. As
such, research hypothesis 1.4 (k) was not fully supported but it seemed
evident that several companies considered the competitive strength of
Nestles and NZDB as a deterrent to direct market entry into Malaysia.
6.3.11 Organisation Structure
Only 40 per cent of the companies surveyed reported that they had an
International Marketing Department. In addition, only 25 per cent of the
companies surveyed reported that they had separate market managers
i.e. managers specialising in export marketing to specitic regions or
countries. This research tinding was further confirmed through
examining the organisation structure of companies in annual reports
wherever this information had been included. Export marketing
management in 75 per cent of the companies surveyed was handled by
a generalist who managed export marketing efforts of all products to all
export destinations of the company. This organisation structure
suggested that the companies surveyed were not export market
focussed and did not recognise the distinctiveness of their export market

216
destinations. The organisation structure of the majority of the
companies surveyed was perceived by the researcher as a barrier to
maximising exports to Malaysia. These tindings supported hypothesis
1.4 (I) and (m).
6.3.12 Lack of Export Market Planning
Eighty tive (85) per cent of companies surveyed showed a high level of
formal market planning. Twenty five (25) per cent of respondents said
that they had separate annual marketing plans. Sixty (60) per cent of
respondents reported having both annual and long term plans. As the
question did not clearly specify that the intention of the researcher was
to evaluate the extent of formal export market planning, this had to be
asked separately. The general response was that export market plans
were prepared as an integral part of the company's total marketing plan.
However, response to the next question regarding specific market
objectives suggested that the extent of formal export market planning,
at least in reference to Malaysia, was not very high. Twenty (20) per
cent of respondents said that they did not have any specific marketing
objectives in Malaysia. Twenty (20) per cent reported that their
objective was to maintain their current position. Fifty (50) per cent said
that their objective was to have steady sales growth. Almost all
respondents explained steady sales growth as maintaining their existing
client base and expanding sales through increases in sales of their
existing clients. Only 10 per cent of respondents said that their
objective was aggressive sales growth through new product

217
introductions, entering new market segments and even winning market
share from competition. On the basis of these tindings, the researcher
perceived that the extent of strategic market planning to improve export
performance in Malaysia was a low priority among Australian exporters.
This supported research hypothesis 1.4 (n).
6.3.13 No sales de velopment plans
The tindings on market objectives discussed above already suggested
that the companies surveyed did not have sales development plans for
Malaysia. However, to test this tinding more clearly, the researcher
collated information on the company's operational strategies. Twenty
(20) per cent of the respondents contirmed that they did not have
specific operational strategies in Malaysia. Thirty tive (35) per cent of
the respondents reported that they aimed to achieve their marketing
objectives through expansion in demand in the market. Thirty tive (35)
per cent of the respondents said that they will enter new emerging
segments, in most instances this referred to the fresh milk segment.
The general expectation appeared to be that when the Malaysian
government lifted the ban on the import of fresh milk there will be
opportunities in this product category. Therefore, it appeared that 90
per cent of the companies surveyed depended on macro environmental
factors to achieve their market objectives in Malaysia. Only 10 per cent
of the companies surveyed had operational strategies to develop sales in
Malaysia. The researcher also observed that some companies perceived
that their export performance in Malaysia was good. A senior executive

218
of a major dairy processor told the researcher in an interview that the
company's performance in Malaysia was very good and therefore its
export market focus was on new destinations such as Taiwan. It
became apparent in this research, that this company had no signiticant
market share in any of the major product lines in Malaysia. This
appeared to be an example of a company that was concentrating on the
highly regulated and more profitable domestic market milk sector and
limiting export activities to bulk commodities when there was an over
supply in Australia. These tindings supported research hypothesis 1.4
(0).
6.4 Australian Product Market Performance
The product market position of Australian dairy exports was summarised
using the Boston Consulting Group (BCG) Growth Share Matrix
Model*'^ The researcher's analysis is illustrated in Diagram 10. The
vertical axis shows the annual market growth rate. This provides a
measure of the attractiveness of the market. Market growth rate is
indexed from 0 per cent to 30 per cent. The axis is arbitrarily divided
into 'High' and 'Low' growth at the mid point by a 15 per cent growth
line. The horizontal axis shows the relative market share. This
illustrates the Australian dairy industry's relative market share in
comparison with Nestles and NZDB. It serves as a measure of the
competitive strength of Australian exporters in the market. A relative
^ « Kotler, Philip e^_al; MnrVoting in Australia, Prentice Hall,
Australia 1989, pp. 68-70.

219
market share of 0.1 for instance means that the Australian dairy
industry's market share is 10 per cent of that of the combined market
share of these two companies. The relative market share is drawn in
logarithmic scale and is divided into 'High' and 'Low' using 1.0 as the
dividing line.
This model enables identitication of four types of product
categories/lines. The four types of products are:
a) Stars which are products with a high market share in a high
growth market"^". As such they are perceived to be products
that need extensive promotional and other marketing support to
maintain their competitive position in the market place. Cheese
(c) and ghee (G) are two Australian products that fits this
classification. Cheese powder (CP) is also shown as a 'Star'.
However CP is largely sold as a commodity to the snack food
industry. The positioning of CP as a 'Star' is to illustrate the
dominant market share of a 'new' Australian export product line
to Malaysia.
b) Cash Cows are products that have a high market share in a low
growth market i.e. the market has matured. Returns on these
products are high as there is not much expense in marketing
477 Assael, Henry; Marketing Principles and Strategy, The Dryden Press, USA 1990.
Kotler, op. cit.. p. 68.

220
effort. Competitors marketing activity is also not very high and as
such there is not much pressure to increase the aggressiveness in
the marketing ef for t* '^ Skim milk powder (SMP) and whole
milk powder (WMP) are shown as Australian exports that can be
classed as 'cash cows ' . However, this is not a wholly accurate
positioning. This positioning only shows the dominant Australian
market share in these two low growth product categories.
However, there is intense competitive pressure especially through
penetration pricing policies by suppliers from EC and USA who
subsidise export prices. Margin on sales and therefore profits are
not very high for these products.
c) Question Marks are products that have a low market share in a
high growth market. These products require extensive marketing
effort to maintain or improve market position. Promotional
activities by competitors in these products tend to be very
intense*^®. Australian exports that can be classed as 'Ouestion
Marks' include ice cream, yoghurt, dairy desserts, retail milk
powder and liquid milk. The description will be fairly accurate
except for liquid milk which is not exported to Malaysia because
imports of liquid milk into Malaysia is banned. Imports of milk to
478
479
Assael, op. cit., p. 627.
Kotler, op. cit., p. 68.
Assael, OP. cit.. p. 627. Assael uses the term 'Problem Children'.
Kotler, op. cit.. p. 68.

2 2 1
Malaysia may be liberalised under the recently launched 'National
Agricultural Policy of Malaysia 1992-2010'. This may lead to
Australian companies exporting liquid milk to Malaysia. However,
it is probable that Australian exporters will face intense pressure
from major players in the market such as Nestles and Dutch Baby
who dominate the manufactured liquid milk segment.
d) Doas are product that have a low market share in a low growth
market'*^". The product is mature and there is minimal
marketing effort. Butter can be classed as a 'Dog'. Sales of butter
in Malaysia has progressively declined through diminution of
product perception and intense pressure from substitute products
such as margarine. Australian butter has a smaller market share in
Malaysia in comparison with butter from New Zealand.
480 Assael, op. cit.. p. 628.
Kotler, op. cit.. p. 69.

DIAGRAM 10:
222
DAIRY PRODUCT POSITIONING IN MALAYSIA MODELLED ON THE BCG GROWTH-SHARE MATRIX
30%
HIGH
MARKET GROWTH 15%
RATE
LOW
lOx HIGH lOx LOW
COMPARATIVE MARKET SHARE
O.lx
LEGEND:
B = C = CM = CP = IC = IF = LM = RMP = SMP = Y =
BUTTER CHEESE CONCENTRATCD MILK CHEESE POWDER ICE CREAM INFANT FORMULA LIQUID MILK RETAIL MILK POWDER SKIM MILK POWDER YOGHURT

223
6.5 Chapter Summary
The demand for dairy products in Malaysia was growing rapidly.
However, Australian export efforts were concentrated in the export of
bulk WMP and SMP to the industrial market segment. This market
segment was observed to be highly price elastic in demand due to
competitive pressure from low cost and subsidised suppliers from other
countries. This concentration on the export of highly price sensitive bulk
commodities was observed to explain the marked tiuctuations in
Australian exports to Malaysia. The Australian dairy industry was
observed not to be export market focussed. Generally, the Australian
exporters marketing efforts in Malaysia were not geared to maximise
sales to the rapidly growing consumer and food service market
segments. Aggressive marketing effort was observed as being needed
to expand sales and market share of products that were classed as
'Question Mark' (yoghurt, liquid milk, retail milk powder and ice cream)
and 'Stars' (cheese, ghee, cheese powder) in this study.
224
CHAPTER SEVEN
7 CONCLUSIONS
7.1 Chapter objective
The objective of this chapter is to summarise the prospects and potential
for the profitable sales of Australian dairy products to Malaysia.
7.2 Introduction
This analysis is based on a Strength, Weakness, Opportunity and
Threats (SWOT) model by Charles W.L.Hill and Gareth R. Jones'*^^
Opportunities and threats are an analysis of the industry's external
operating environment'*^^. Strength and Weakness are an internal
analysis of the industry and will incorporate the quantity and quality of
resources available to the industry*®"*. Opportunities are said to arise
when environmental trends create the potential for a company to
increase protits. By the same corollary, threats are said to arise when
environmental trends endanger the profitability and integrity of the
industry. The opportunities and threats that the industry faces in its
external environment can be broken down in terms of the industry
environment in which the company competes and the macro
* °^ Hill, Charles W.L. and Jones, Gareth R; Strategic Management, An Integrated Approach (Second Edition), Houghton Mifflin Company, USA 1992.
Hill, op. cit.. p. 13.
Idem.
225
environment. The industry environment are those factors such as
competitors, suppliers, customers and substitute products that directly
affect the industry*®^ in Malaysia. The macro environment consists of
broader social, demographic, economic, political and legal setting*®^ in
which the industry operates. A summary of the strengths, weaknesses,
opportunities and threats facing the Australian dairy industry in Malaysia
are summarised as follows:
7.3 Strengths
7.3.1 Competitive Advantage
Malaysia is geographically close to Australia. Freight costs for the
export of products from Australia to Malaysia are minimal in comparison
with freight costs from competiting countries. The average cost of sea
freight from Australia to a West Malaysian port such as Pelabuhan
Kelang is approximately US$ 1500 per 20 foot container. There is
regular sea freight from Australian ports to Malaysia. The duration of
sea freight is less than three weeks.
There is also regular and economical air service both for cargo and
passenger traftic from Australia to Malaysia. The cost of air freighting
short shelf life products and the expenses for market visits to Malaysia
* 8 5 L,i i •... - i «
Hill, op. cit., p. 70.
486 , . Idem.

226
by Australian executives is considerably reduced because of high service
standards and competitive air fares between Australia and Malaysia.
Geographical proximity is envisaged to offer cost benefits to Australian
exporters in comparison with major competitors from EC, USA and New
Zealand.
7.3.2 Comparative Advantage
The Australian dairy industry has among the lowest production cost in
the world at the farm gate"*® . This is because dairy farming in
Australia is based on year round grazing of cows. There are, therefore,
cost savings on feed and capital investment for buildings to enable
indoor feeding in winter. Added to this, the high cost of labour and the
lower productivity of labour in other major producing countries gives
Australia substantial cost advantages in the production of milk*®®.
7.3.3 Generic Differentiation
Australia is perceived in Malaysia as a developed economy that has high
and rigorous standards in food production, closely monitored by
educated and discerning consumers who demand high quality food
products.
Taylor, op. cit., p. 2 1 .
*®® Idem.
Australian Dairy Corporation 1992a, OP. cit., p. 5.

227
The Chernobyl nuclear disaster in Russia with ensuing reports of
contamination of agricultural and dairy products in Europe meant that
food products from USA, New Zealand and Australia are preferred to
imports from Europe.
The AUD$ 5 million 'Clean Food' campaign announced by the Agri-
Foods Council is expected to further enhance Australia's image as a
supplier of clean and high quality food products*®^.
The Australian Dairy Corporation's (ADC) programs such as 'The
Essentiality of Dairy Foods' and the 'Australian Dairy Mark' are
strategies at generic promotion of dairy products targeted at increasing
consumer awareness of the health and nutritional advantages of dairy
products in comparison to substitutes*^". The Dairy Mark helps
promote a quality image of Australian dairy products in the export
market. Reports by the ADC suggest that the recall rate of the
mark/brand in Australia is high*^\ The dairy mark is not used
extensively as a promotional strategy in Malaysia. However, it remains a
valuable method of differentiating and promoting Australian dairy
products in Malaysia.
*®^ Fabian, Garry and McGregor, Ken; 'Canberra in - At Last', Food Manufacturing
News. September/October 1992, p. 13.
*^° Australian Dairy Corporation 1992b, op. cit., pp. 6, 17 & 19.
*^^ Ibid., p. 19.
228
7.3.4 Human Resources
Educational links resulting from the large number of Malaysian students
coming to Australia for their tertiary education and the business
migration program through which many Malaysian businessmen became
permanent residents in Australia will increase market intelligence and
awareness of the corporate culture in Malaysia.
7.3.5 Market Experience
The Australian dairy industry has extensive experience in Malaysia as a
result of long trading links as an exporter of bulk commodities. Although
the industry has not succeeded in exporting branded value added
products, the lack of success in this and decreasing market share in
Malaysia will awaken the industry to weaknesses in its current
strategies. This places the Australian industry at an advantage in
comparison with new entrants to the market.
7.3.6 Public Sector Export Facilitation Schemes
The Commonwealth and State Governments provide incentives and
support the export of value added food products. The Agri-Foods
strategies statement announced by Senator Button and Simon
Crean*^^ include many measures to facilitate export of food products.
* ' ' Crean, Simon; 'Food Strategy to benefit farmers', Australian Financial Review, Thursday June 3 1993.

229
This strategy is being spearheaded through the Agri-Food Council. The
policy statement of the Agri-Foods Council best describes its mission,
The council is actively developing a comprehensive programme, in which the government and industry are working together to improve the international competitiveness of Australia's agri-food industries*^^.
Food companies such as Goodman Fielder Limited (GF) and Kelloggs
have already taken advantage of these initiatives through participating in
these government programs. There is opportunity for the dairy industry
to emulate the example of companies such as GF.
7.3.7 Product and Process Research and Development Strengths
The Australian dairy industry, especially with support from CSIRO has a
very strong research base*^*. It was Australian that tirst introduced
and provided technical expertise in milk reconstituting processes in Asia.
Today, milk reconstituting is the most important dairy manufacturing
industry in countries such as Malaysia. However, the industry developed
forging linkages with manufacturing companies in Europe and New
Zealand. This has gradually eroded the position of Australian suppliers.
493
494
Australian Financial Review, June 3 1993.
Collins, S. M.; 'Dairy Research in CSIRO 1986-87', Food Technology in Australia,
Volume 40 (5) May 1988, pp. 176-177.
'CSIRO Dairy Research Laboratory - in Brief; CSIRO Dairy Research Laboratory, 1992.
'Whey - Too Valuable to Dump!'; CSIRO Dairy Research Laboratory, 1992.
'More Cheese from Less Milk!'; CSIRO Dairy Re-search Laboratory, 1992.

230
Australian dairy industry has excellent research and development
resources in various institutions such as the CSIRO which it can use to
develop business linkages.
7.4 Weakness
7.4.1 Limited Product Sales Mix
Australian dairy companies concentrate on exports of bulk commodities
such as SMP, WMP and butter oil to food processing companies. As
such, except for companies such as BPCF and Kraft, there is no depth
nor width in Australian dairy product exports to Malaysia. Malaysian
consumers have a limited offering of Australian dairy products by way of
variety and pack sizes. Companies such as NZDB have successfully and
profitably developed a varied product sales mix especially in value added
products*®^.
7.4.2 Channel Intermediaries
Australian exporters use indirect channel intermediaries and have
marketing strategies that does not maximise opportunities in the rapidly
evolving socio-economic environment in Malaysia. In comparison,
Australia's major competitors in Malaysia, NZDB has strengthened its
position through direct channel marketing*^^.
495 Spring, op. cit., p. 65.
496 , . Idem.

231
7.4.3 Lack of Brand Offering
Several recent studies suggest that successful exporters invest in
developing proprietary brands in the market*^^ NZDB, for example,
actively promoted its two major brands 'Fernleaf and 'Anchor' in
Malaysia.
7.4.4 Poor Marketing Strategies
The Australian dairy industry, unlike NZDB, has not developed a positive
and aggressive marketing strategy for its world wide operations. New
Zealand produces only 1.5 per cent of the world's milk but has 25 per
cent of the world's trade in dairy products*^®. The development of a
positive and aggressive marketing strategy was the turning point in the
success of NZDB in the international market. In 1979, NZDB exported
nearly half of its total production of about 550,000 tonnes to the United
Kingdom (UK). Exports were made up almost exclusively of standard
butter and cheese. This position is not very different compared with the
Australian dairy industry today. Eighty per cent of Australia's exports
are bulk commodities to a few countries in Asia.
UK's admission to the EC enabled it to import subsidised products from
continental Europe. UK also became an exporter of dairy products.
NZDB had to develop and carry through new marketing strategies.
Idem.
498 , . Idem.

232
NZDB recognised the need to differentiate and add value to its exports in
several ways including through strong brand offering backed by
effective distribution and delivery systems*^^ In many countries,
particularly in South-East Asia, NZDB brands hold either number one or
number two market positions. NZDB has established an international
marketing network of more than 50 companies throughout the
world^°°. In 1 9 9 1 , NZDB's exports increased to over 800,000 tonnes
per annum. Even more importantly, since 1981 the value of products
sold in added value form by NZDB has increased by 250,000 tonnes
annually^°\
7.4.5 Ineffective Market Entry Strategies
The Australian dairy industry's market entry strategies are weak in
comparison to major competitors such as NZDB. NZDB has followed a
strategy of vertical integration to overcome physical limitations of some
product lines such as short shelf life products and to counteract market
barriers. A classic case of this strategy is the NZDB owned Asia Dairies
in Singapore which imports New Zealand milk powders and milk fat and
manufactures fresh milk, ice cream and yoghurt from those raw
499 , . Idem.
^°° Ibid., pp. 65-69.
^'' Idem.

233
materials wi th which it then dominates the fresh market in
Singapore^°^.
John Keniry of Goodman Fielder Limited (GF) a successful Australian
food exporter, in a recent article^°^ outlines three key elements in
export market success. These include becoming a global company,
good quality market research and appropriate market entry strategies -
points that resemble NZDB's strategy. Keniry explains that global
strategy is more than exporting or engaging in joint venture production
overseas,
. . . it describes an organisational commitment to a borderless strategy to produce local products in local markets.^^""
7.4.6 Market Intelligence
The researcher suggests that the weakness of the Australian dairy
industry's export marketing strategies in comparison with NZDB and GF
results from poor market intelligence. Several Australian dairy industry
executives interviewed did not show understanding of the intricacies and
the vast opportunities in Malaysian. This may be the result of poor
quality market intelligence because of depending upon indirect channel
Idem.
^°^ Keniry, John; 'Food Giant's Recipe for Success', The Australian, Wednesday 24 June 1992, p. 7.
^ ° * Fosler, Gail; 'Going Global Aids Survival', The Australian, Wednesday 24 June 1992, p. 6.

234
intermediaries for information. The limited in-house export marketing
skills in the industry seem to be concentrated in maximising sales to
existing customers. A casual observation of the 'local' personnel used
both by the Australian dairy industry and organisations such as
AUSTRADE suggest that the focus is still on the traditional Chinese
segment of the market. There has been no focus on the Malay segment
which make up 60 per cent of the population.
7.4.7 Market Research
The operations of Australian dairy companies suggest that market
research and planning to establish where and how the company wants
to enter the export market does not appear a priority. Market research
goes beyond raw data on economic growth and levels of income in a
country. Company's should concentrate their effort in markets where
potential growth is greatest for its products. Keniry for instance notes
that "it is significantly easier to build sales in high growth markets'^^^.
However, each market should be researched thoroughly, various
opportunities should be examined, assessed, prioritised, and investment
decisions made accordingly. Keniry goes on to say that creating an
international future for the business is developing export consciousness
and integrating this into all sections of corporate behaviour. The
company should aim to become an 'insider' in each market through
understanding the culture and adapting exports to each nations unique
505 ^ . ., -, Keniry, op. cit., p. 7.

235
requirements. This strategy should incorporate adaptations to product,
packaging, marketing and locating new plants in these markets^°®.
7.4.8 Corporate Structure & Organisation
For success in the export market, the company has to incorporate export
growth in its primary corporate objective and this needs commitment
within the mission statement, structure and core business strategy^°^.
GF for example, in implementing its export strategy changed from
regional organisational structures into six core food business groups,
each responsible for worldwide business development in specialised
product areas^°®. GF has also set an objective to have 50 per cent of
its sales from outside Australasia by 1997^°®. The majority of
Australian dairy companies do not have comparable programs and
therefore cannot compete successfully in the international market.
7.4.9 Difficulty of Promoting Product Benefits
It is acknowledged by many food product marketeers that the marketing
of food is difficult as there are,
506 , . Idem.
507 , . Idem.
°® Idem.
Shoebridge, Neil; 'Goodman Gets its Act Together',Rii';inRss Review Weekly, July
17 1992, p. 19.
609 L, • •... - I
Keniry, op. cit.. p. 7.

236
. . . constant stream of claims and counter-claims about the benefits and dangers of a variety of food products. Myths, misconceptions and fears dog the marketing of many foodstuffs. Correcting misconceptions about food is not
K1 rt e a s / ' °
Jens Karnoe of the Australian Dairy Corporation attributes the non
growth in the domestic demand for dairy products to,
, . . the dichotomy in the consumer's mind between the goodness of dairy products on the one hand and concerns about the fat and cholesterol level of dairy products on the othef^^\
These perceptions caused continued decline in per capita consumption
of some dairy products such as butter, milk and cheese in Australia.
Australian per capita consumption of butter has declined whereas
consumption of margarine, a key substitute product, has increased.
Perceptions such as this will compound the problem in countries such as
Malaysia where sections of the population traditionally consume dairy
substitute products and consider these to have superior dietary qualities.
510
511
Shoebridge, Neil 'Dairy Marketeers Reap the Benefits of a New Image',Business
Review Weekly, July 24 1992, p. 82.
Shoebridge, OP. cit., p. 84.

237
7.5 Opportunities
7.5.1 Competition
The main competit ion for Australian dairy companies in Malaysia is from
NZDB, who are also not an exporter of subsidised products. With
improved marketing strategies the Australian dairy industry will be able
to compete wi th NZDB on a more 'level playing tield' in Malaysia. The
strength of the competition in Malaysia is difficult to measure but the
researcher suggests that rapid growth in the market and success of
NZDB shows that there are substantial opportunities.
7.5.2 Customers
Malaysia is a wealthy country with increasing domestic demand for dairy
products. There is opportunity to increase sales of a wider range of
product categories as Malaysians generally have a positive perception to
the consumption of dairy products. Dairy products are important in the
diet of the Indian and Malay segments of the population. The per capita
consumption of dairy products in Malaysia in 1990 was estimated at 50
litres. This is higher than in East Asian economies at the same level of
development. More importantly, consumption of dairy products in
Malaysia has progressively increased whereas in countries such as
Taiwan consumption has remained unchanged at 28 kg/capita for the
decade 1975-1985^*^
^^^ Refer Tablet,

238
Dairy product consumption in Malaysia remains substantially lower than
Western European or Australian consumption of 350-400 litres per
capita^^^ This suggests that market potential in Malaysia remains
large. Both domestic production of dairy products and imports of dairy
products (probably correlated) have shown signiticant growth. Since
1986, production in Malaysian dairy manufacturing industries increased
by more than 13 per cent per annum (5.4). 'New' products such as milk
drinks have shown high growth (5.4.3). There is demand for a wider
range of dairy products. Traditional product lines such as sweetened
and filled condensed milk show market maturity characteristics. The
market is capable of accepting a wider range of fresh products such as
market milk, yogurt and custard because of increased ownership of
refrigerators in households.
7.5.3 Substitutes
Malaysia is a major producer of vegetable fats. Competition may be
intense in yellow fats, spreads and baking products. However, yellow
fats such as ghee are used as a 'up market' products in the cuisine of
Malays and Indians. This product commands a premium price and there
is opportunity for substantial growth as incomes increase. The
researcher observed that soy milk consumption is widespread only
among the Chinese segment of the market. The increasingly aftiuent
^^^ IMES (Volume 1), op. cit., p. 10.

239
Malay population offers opportunity for the growth in sales of dairy
products.
7.5.4 Suppliers
Malaysia has a liberal and open economy. Market entry is generally not
restricted. As such, the market is very competitive. The intiow of DFI is
a retiection of the quality of service facilities such as banking, transport,
packaging and power that are available in Malaysia. Australian dairy
companies will be purchasing dairy raw material supplies from parent
and/or associate companies in Australia. The industry is expected to
have favourable supply position.
7.5.5 Positive Public Policy
There is no threat from a domestic dairy industry in Malaysia as the
factor endowments are not conducive to the development of a
sustainable dairy industry. Economic policy has been directed at
concentrating on those sectors in which Malaysia has comparative and
competitive advantage.
7.5.6 Brand Elastic Demand
Companies such as Nestles, Premier Milk and Pacitic Milk started
operations in Malaysia in the 1960s. Even then, NZDB which entered
Malaysia only in 1985 has notched up major market share in several

240
products. This shows that there are no barriers to market entry by new
manufacturers.
7.5.7 Social Stability
Except for the race riots in 1969, Malaysia has experienced social and
political stability. The Government has legislated affirmative action
strategies to improve income distribution among ethnic groups and
sectors of the country. Malaysia has a burgeoning middle income
segment particularly among ethnic Malays. Malaysia has a low intiation
and high private consumption expenditure.
7.5.8 High Economic Growth Rates
Malaysia is a wealthy country with excellent natural resource
endowments. The economic structure of the country is rapidly changing
from that of a primary producer to a country with a signiticant
manufacturing base. Malaysia attracts high direct foreign investment.
Between 1988 and 1991 Malaysia recorded real GDP growth of 9 per
cent. This is among the highest growth rates in the world.
7.5.9 Favourable Political Environment
Malaysia is a multi party parliamentary system modelled along the
Westminster system. The country has a stable political environment.

241
7.5.10 Favourable Legal Environment
Malaysia's legal system is derived from the British model. Laws
governing trade and commerce are broadly similar to that of Australia.
7.6 Threats
7.6.1 Subsidised Products
One of the obvious and often mentioned causes for the non
competitiveness of Australian dairy products in the international market
place is competition from subsidised products from members of the
European Community (EC). This continues to be a threat to Australian
dairy exporters concentrating on selling bulk commodities.
7.6.2 Economic Grouping
The Asean Free Trade Association (AFTA), the economic grouping of
members of ASEAN, is becoming a reality. Various co-operative
arrangements within ASEAN such as the ASEAN joint venture
preferential scheme are being introduced. Under the ASEAN joint
venture preferential scheme a manufacturer who sets up in any ASEAN
country can export to a member country at 90 per cent tariff
discount^^*.
^^* Chong, Florence; 'Why Australia must change'. The Australian, Tuesday June 15 1993, p. 21.

242
7.6.3 Dairy Substitutes
Malaysia is a major producer of margarine and vanaspathi. Soya bean is
imported from China at very competitive prices. Large local companies
and multi nationals produce margarine, soya milk and vanaspathi for the
local and export market. Government support for these export
promoting and/or import substituting industries are substantial.
7.7 Chapter Summary
The SWOT Analysis suggests that there are substantial and growing
demand for dairy products in Malaysia. The macro environment is
conducive for Australian exporters. Australian dairy industry needs to
improve and follow the example of NZDB, BPCF, Kraft and GF in
developing market focussed strategies to maximise opportunities in
Malaysia.
243
8 BIBLIOGRAPHY
/Aaker, D. and Day, G.S.; Marketing Re.seamh (Fourth Edition), John Wiley & Sons, Singapore 1990.
'A dairy boom for four to five years', Australian Dairv Fonri.s. Melbourne, November 1988, p. 4 .
Albaum, G., Strandskov, J . Duerr, E. and Dowd, L.; International Marketino and Export Manaoement Addison-Wesley Publishing Company, Great Britain 1989.
lien, T., Lucas, L., Marthet, P., Rocke, C. et al: Sales and Distribution Guide to Malavsia. European School of Management Studies, Great Britain 1988.
Anderson, J . , Durston, B.J. and Poole, M.; Thesis and Assignment Writ ing. John Wiley & Sons, Australia 1970.
Anderson, P.; 'How we can cater to the Asian palate', Australian Business Monthlv, September 1992 pp 133-134.
Argenti, J . ; Practical Corporate Planning, George Allen & Unwin, London 1980.
Argenti, J . ; The Argenti Svstem Team Manual
Ariff, M. and Hal, H.; 'Industrial policies and performance in ASEAN's "Other Four", Paper presented at the Fifteenth Pacific Trade and Development Conference. Japan, August 1985 pp 26-29.
'Asia to be a major dairy market, says study'. Food Industrv. November 1991 .
Assael, H.; Marketing Principles & Strategy (First Edition), The Dryden Press, USA 1990.
Australia Industry Commission; 'Review of overseas export enhancement measures volume 1: Report,' Industrv Commission Report Number 22, 3 April 1992.
Australia. Market Development Assistance; Australian Government Publishing Service, Canberra, July 1989.
Australian Bureau of Agricultural and Resource Economics, 'Future dairy marketing arrangements', Submission 91.3 to the—Industry Commission. Australia, April 1991 .

244
Australian Dairy Corporation, Annual Rennrt 1991/Q9 1992b Australia.
Australian Dairy Corporation, Annual Report iQQn/Qi 1991 Australia.
Australian Dairy Corporation; Dairv Compendium 199? 1992a Australia.
Australian Dairy Corporation; Dairv Compendium 1991, 1991 Australia.
Australian Dairy Corporation; Dairv Compendium 19«q 1989 Australia.
Australian Dairy Corporation, 'ADC Dairy Market Brietings,' unpublished report, 1993.
Australian Dairy Corporation, 'International focus vital says ADC Chairman,' Dairv Moves. Issue No. 20, January 1991.
Australian Dairy Corporation, 'Trade and Product Balances,' unpublished report, 1993.
Australian Dairy Corporation, 'Update Information on the Australian Dairy Industry', August 1991.
Australian Dairy Industry Council, 'Dairy Australia: Strategy for the Future'; December 4 1991.
Australian Dairy Industry Council, Annual Report 1992.
Australian Dairy Products Federation Inc; Annual Report 1991.
'Australian Exports, Performance obstacles and issues of assistance'; Report of the Committee for Review of Export. Australia 1990.
'Australia's share of imports by developing Asian countries 1965 to 1985', Australian Government Publishing Service, Information Bulletin 1. Canberra 1979.
Australian Trade Commission; Austrade's Directorv of Australian Exporters (First Edition), AUSTRADE Commonwealth of Australia 199t^
Australian Trade Commission, AUSTRADE's Directorv of Australian Exporters (First Edition), Australia 1990.
Baker, R.; 'Goodman Fielder's recipe for Asian success', Australian Financial Review. 30 April 1993.

245
Balassa, B. and Williamson, J.; 'Adjusting to success: balance of payments policy in the East Asian NICs', Policv Analvses in International Economics. Institute for International Economics, USA 1990.
Barnes, H.; 'Survey of Denmark (10): Cheesy smiles - Protile of Christian Hansen', Financial Times. 19 November 1991, London.
Barret, D.; 'International policy developments and the world dairy product market', Quarterlv Review of the Rural Economv. Volume 8 (2), May 1986, pp 172-180.
Barret, P.; 'In the real world, bilateral effort will bring results', The Australian. Friday 21 March 1993 pp 11.
Barry, G. and Lembit, M.; 'Dairy products: commodity outlook'.Agriculture and Resources Quarterlv. Volume 1, Number 4, December 1989, pp 404-406.
Baxter, K.; 'Managing change in the dairy industry', UDV Annual Conference, June 1989.
Beltoft, A.; 'European dairy structure, year 2000', Scandinavian Dairv - Information. 3/92 Volume 6, Number 3, 1992.
Beringer, G.; 'It's no holiday in Malaysia', Business Review Weeklv. March 19 1993, pp 60-63.
Best, D.; 'Designing new products from a market perspective', in GraL E. and Saouv- I.S. (Ed.) 1991. pp.1-27.
Best, P.; 'Bid to treble processed food exports to $7 bn', The Weekend Australian. 8-9 May 1993, pp 9.
Beytagh, G.A.; 'What does the future hold for dairy products in the local and export market,' The Australian Journal of Dairy Technology, Volume 29, Number 2, Australian Society of Dairy Technology, June 1974..
Blackweli, D.; 'Commodities and Agriculture: Decision expected on future of Milk Board', The Financial Times, 5 March 1991, London, pp 32.
Bonlac Foods Limited, Annual Report 1992.
Booth, A., David. C. e i ^ ; Pnnri Trade & Food Security in ASEAN and Australia. ASEAN-Australia Joint Research Project, The Australian National University, Australia 1986.
246
Bray, R.H.; 'Self regulation of the dairy industry', D.I.A.A. Conference, Tuesday 29 and Wednesday 30 March 1988 pp 1-3.
Briant, C ; 'Milk: a magic mix of market opportunities', Australian Dairy Foods,February 1991,Volume 12, No.3 pp.1-10.
'Bringing in the world', Asiaweek. 08/11/91, pp 64-65.
Britain, J. ; 'How to beat the trade barriers'.Australian Business Monthly. April 1992, pp 70-72.
Brown, L.; Competitive Marketing Strateov. Thomas Nelson, Melbourne 1991.
Burns, W.G.; 'The South East Asian Food Market', Food Technoloov in Australia. February 1972.
Business Council of Australia, Australian Business in Asia : Climbing the Mountain. Melbourne, Australia 1992,
'Business: Frantic Wooing': India Todav. 15/11/91, pp 86-87.
Callaghan, B.; Australia's Survival - Australians Awake. Development of our Export Potential. Institute of Industrial Economics, University of New Castle, New South Wales, August 1987.
Chan, T.S.; 'Emerging trends in export channel strategy: An investigation of Hong Kong and Singaporean tirms', European Journal of Marketing. Volume 26, No. 3, MCB University Press, London, England 1992, pp 18-26.
Chant, N.A.; 'The need for research, production and marketing to work closely together in the development of new products: M', The Australian Journal of Dairv Technoloov. Volume 29, Number 2, Australian Society of Dairy Technology, June 1994.
Chidambaran, P.; 'India's Economic Development', Asian Business Review. November 1991 pp 11-13.
Ch'ng, D.; Mosaic mac-b: A Comprehensive Framework for Marketing Planning. Faculty of Business Staff Papers, Serial No.67, Swinburne Institute of Technology, Victoria 1990.
Chong, F.; 'Why Australia must change', The Australian. Tuesday June 15 1993, pp 21 .
Coleman, M.; 'Stop, look and listen, is councils message. Food Manufacturing News. V. 13, No. 4, July/August 1987.

247
Collins, S.M.; 'Dairy Research in CSIRO', Food Technoloov in Au.stralia. Vol.40(5), May 1988, pp 176-177.
Collins, B.A.; Getting a Marketing Orientation. The Graduate School of Management, The University of Melbourne, Working Paper No. 6, March 1990.
Commonwealth Scientific and Industrial Research Organisation - CSIRO; 'CSIRO Dairy Research Laboratory - in br ief ; CSIRO Dairv Research Laboratory. 1992.
Commonwealth Scientific and Industrial Research Organisation - CSIRO; 'More cheese from less milk!, CSIRO Dairv Research Laboratory. 1992.
Commonwealth Scientitic and Industrial Research Organisation 'Whey -too valuable to dump' , CSIRO Dairv Research laboratorv, 1992.
Cooke, I.M.; Overseas Marketing from Australia. The Australian Institute of Export, Australia 1991 .
Corden, M.W.; 'The nutritional value of dairy products in present day health concepts' , The Australian Journal of Dairv Technoloov. Volume 29, Number 2, Australian Society of Dairy Technology, June 1994.
Cravens, D.W.; and Woodruff, Robert B., Marketino. Addison-Wesley Publishing Company, United States 1986.
Cravens, D.W.; Strategic Marketing (Third Edition), Irwin, Boston 1991.
Crean, S.; 'Food Strategy to benefit farmers', Financial Review, Thursday June 3 1993.
Crouch, H.; 'Malaysia: Neither authoritarian nor democratic', in Hewison, K.. Robison. R. and Rodan. G. 1993. pp. 133-158.
'Dairy Co-ops target Asia'; Foodweek. December 17 1991 , pp 2.
Dairy Industry Association of Australia; 'A dairy boom for four to five years', Australian Dairv Foods. November 1988 pp 4 .
Dairy Industry Association of Australia, "'Give us a go ' dairy industry asks government", Au.<;tralian Dairv Foods. May 1991 Volume 12, No. 4. pp 14-15.
Dairy Research and Development Corporation, Portfolio Balance Workshop # 1. Travelodge Hotel, Melbourne 1992.
248
Daniels, J .D. and Radebaugh, L.H.; International Business Environments and Operations. (5th Edition), Addison Wesley Publishing Company, Reading, Massachusetts 1989.
Davidson, K.; 'Growth Economies are those nurturing growth industries,' The Age. Saturday 15 February 1992 pp 2 1 .
Davidson, R.; 'Dairy joint ventures tiourish in Singapore', Australian Dairv Foods. February 1992 pp 26-28.
Department of Foreign Affairs and Trade; Ouarterlv Economic & Trade Review. Commonwealth of Australia, Australia, November 1993.
Departments of Industry, Technology & Regional Development and Primary Industries and Energy; 'Briefing Note on the Agri-Food Industries Strategy and the work of the Agri-Food Council', Agri-Food Council Secretariat, Canberra, June 1993.
Dickson, T.; 'Churning the cream of cartels: Mounting pressure to reform the UK's monopolistic Milk Marketing Boards', The Financial Times. 16 August 1991 , London pp 1 1 .
'Diet revolution in Pacitic Rim creates new customers for U.S. foods', AoExDorter. Volume 5, Issue 6, June 1993 p. 4 .
Dillon, P.M.; 'Say Hello to the global marketplace', Food Engineering. January 1991 pp 81-86.
Dixon, C ; South East Asia in the World Economv. Cambridge University Press, Great Britain 1991 .
Dobson, W.D. ; 'The Competitive Strategy of the New Zealand Dairy Board', Agribusiness. Volume 6, Number 6, 1990 pp 541-548.
Dodd, T.; 'Button tires off parting shots at big business', Australian Financial Review. Thursday 1 April 1993.
Doman, M.; 'New ears hear old call on Asia', Australian Financial
Review. 23 April 1992, pp 2.
Donnelly, P. and Gray, S.; 'What is the role of the Dairy Research and Development Corporation in the dairy industry?', Agricultural Science. May 1 9 9 1 , pp 39- 4 1 .
Dow Jones & Co., 'Making a better l iving', Far Eastern Economic
Review. 12th. June 1989.

249
East Asia Analytical Unit, Department of Foreign Affairs and Trade and Austrade; Australia's Business Challenge: South East Asia in the 1 9 9 0 ^ , Australian Government Publishing Service, Australia 1992a.
East Asia Analytical Unit, Department of Foreign Affairs and Trade; Australia and North-East Asia in the 1990s: Accelerating Change. Australian Government Publishing Service, Australia 1992b.
Economic Planning Unit, Government of Malaysia; Fifth Malavsia Plan 1986-1990. Government Printer, Kuala Lumpur, Malaysia, 1991.
Economic Research Department, United Malayan Banking Corporation Berhad, Business Conditions in Malavsia, Malaysia 1991.
Economic Research Department, United Malayan Banking Corporation Berhad, Business Conditions in Malavsia. Malaysia 1992.
Esman, M.J.; Administration and Development in Malavsia, Cornell University Press, London, 1972.
Evans, R.; 'Austrade plans network of insiders to global markets', The Australian. Friday 26 June 1992, pp 6.
Fabian, G. and McGregor, K.; 'Canberra in - at last'. Food Manufacturing News, September/October 1992, pp 13.
Findlay, C. and Garnaut, R.; The Political Economv of Manufacturing Protection: Experiences of Asean and Australia. Allen and Unwin, Sydney, 1986.
Fosler, G.; 'Going global aids survival', The Australian, Wednesday 24/06/92, p. 6.
Frew, W., et al.: 'Closer Economic Relations: AFR survey', Australian Financial Review. 20 June 1990, pp 39-44.
Garnaut, R.; Australia and the Northeast Asian Ascendancv. Australian Government Publishing Service, Canberra, 1989.
Garnaut, R. and Ma, G.; Grain in China. East Asia Analytical Unit, Department of Foreign Affairs and Trade, Canberra 1992.
Gibson, J.; 'The Role of the Australian Dairy Corporation', Agricultural Science. May 1991, pp 23-38.

250
Gilbert Chandler Institute of Dairy Technology, 'Dairy Industry Organizations'; Resource Material (RAB:RB: 79/50 ), Werribee 1979, pp 1-13.
Gill. P.; 'Wran and the Asia-Pacitic trade plan'. The Australian Financial Review. 30 April 1993, pp 16.
'"Give us a go", dairy industry asks government', Australian Dairv Foods, V. 12, No. 4, May 1991, pp 14-15.
Goldstein, C ; 'Milking a better living'. Far Eastern Economic Review. 12 January 1989 pp 5
0raf, E. and Saguy, I.S. (Ed.) Food Product Development. From Concept to the Marketplace. Van Nostrand Reinhold, USA 1991.
Gregory, J.R. and Wiechman. J.G., Marketing Corporate Image. NTC Publishing. 1991,
Gresswell. I.; 'How the dairy industry is changing', Business Review Weeklv. 6 November 1992 pp 50-54.
Hague, P. and Jackson, P.; Marketing Research in Practice. Kogan Page, England 1992.
Hall, T.; 'Commodities and Agriculture: NZ dairy industry 'in good heart'-Gloom is lifting after the worst season in decades', Financial Times. 28 November 1991, London pp 36.
Hanes, K.; 'Biscuits player takes on Japanese', The Australian, Tuesday 1 June 1993, pp 42.
Harris, P.R., and Moran. R.T.; Managing Cultural Differences (3 Edition). Gulf Publishing Company. USA 1991.
Hayward. D.; 'Survey of New Zealand (7): Farmers look to Gatt for world trade boost-Agriculture, belt-tightening amid bleak short-term prospects, but could better times lie ahead?' The Financial Times. 9 July 1991, London, pp 30.
Hayward, D.; 'Commodities and Agriculture: NZ trades dairy products for coal', ThP Financial Times. 19 June 1991, London, pp 34.
Heng Pek Koon, 'The Chinese business elite of Malaysia', in McVey (Ed.) 1992. pp. 127-144,

251
^ ^ ^ ^ ' T Q O I ^ " ^ ° ^ ' ^ ° " ' R- and Rodan. G. (Ed.); Southeast A. IP. in thP 1990s, Authoritarianism, Demncrar^y ^ Canit;^lif.m Allen & Unwin. Australia 1993.
Hornig, E., Boisvert, R.N. and Blandford, D.; 'Explaining the distribution of quota rents from US cheese imports,' Australian Jntirnal r f Agricultural Economics. V.34, n o . l , April 1990 pp 1-2.
Hill, C.W.L. and Jones, G.R.; Strategic Management. An Integrated Approach, (Second Edition), Houghton Miftiin Company Boston USA 1992.
Hooley, G.J. and Lynch, J.E.; 'Marketing lessons from the UK's high tiying companies'. Journal of Marketing Manaoemftnt. V . I , n o . l , London, England 1985.
Hutchinson, J . ; 'Asia trade up but market share slips, The Age. Saturday 15 February 1992.
Hyde, K.A.; 'The need for research, production, and marketing to work closely together in the development of new products: I', The Australian Journal of Dairv Technology. Volume 29, Number 2, Australian Society of Dairy Technology, June 1994.
'In need of weaning' . Far Eastern Economic Review. 6 February 1992, p 38.
'Indonesia: The Long March' , The Economist, April 17th 1993 pp 3-18.
Industry Assistance Commission, Background Paper to the Industries Assistance Commission's Inouirv on the Dairv Industrv. 10 February 1983. pp 1-24.
International Bank for Reconstruction and Development/World Bank, Trends in Developing Economies 1991. September 1991.
'International focus vital says ADC Chairman', Dairv Moves. Issue No. 20, January 1991 .
International Marketing & Economic Services (IMES). Dairv Products Malavsia. Thailand and Taiwan. Volume 1: Malavsia. IMES. Surrey, England June 1991 .
International Marketing & Economic Services (IMES), Dairv Products Malavsia, Thailand and Taiwan, Volume 2: Thailand. IMES, Surrey, England June 1991 .

252
lya, K.K.; 'Dairy development in South East Asia-Problems and Challenges', Indian - Dairvman. Vol. 30 (5). 1978. pp 345-352.
Jabatan Perangkaan Malaysia (Department of Statistics Malaysia), Buku Tahunan Perangkaan (Yearbook of Statistics): Malaysia 1991.
Jabatan Perangkaan Malaysia (Department of Statistics Malaysia. Perangkaan Perdagangan Luar Negeri (External Trade Statistics). Malaysia 1990.
Jackson. J .H. ; World Trade and The Law of Gatt. Law Publishers. Charlottesville, USA, 1969.
Jackson, T.; 'Lotta bottle, littie rivalry: The lessons of a proposed UK milk market deal', The Financial Times. 20 November 1991, London pp 22.
Jain, S .C ; International Marketing Management. (4th Edition), Wadsworth Publishing Company, USA 1990.
James. G.; 'Breaking out of commodity trap gives food for thought'. I h e Australian. Friday 21 March 1992. pp 33.
Jarrett, I.; 'Asia's new snack basket', Asian Business. January 1992, pp 42-45.
Jewson, D.; 'Consumer Research', in Graf, E. and Saguy, I.S. (Ed.)
1 9 9 1 . pp. 29-48.
Keniry, J . ; 'Food giant's recipe for success'. The Australian, Wednesday
24/06/92, p 7.
Keyfitz N. and Flieger. W.; Wnrld Population Growth and Aqing: npmonranhic Trpnri?. in the la te Twentieth Century, The University of Chicago Press. Chicago, USA 1990.
Kinnersley, D.; 'The need for research, production and marketing to work closely together in the development of new products: III . ThP AiKstralian \nnrn^\ of Dairy TP.chnologv. Volume 29, Number 2. Australian Society of Dairy Technology. June 1974.
Kohls, R.L. and Uhl, J .N. ; M^r^Ptinn of Aoriciilti iral Products (Seventh Edition), Macmillan publishing Company, USA 1990.
Kotler, P., Chandler. P. eL_aL; Marketing in Australia (2nd Edition).
Prentice Hall, Australia 1989.

253
Kraft Foods Limited; The Kraft Storv in Au.straii^ 1992.
Kravis, I., Robert, S. and Heston, A.; 'International comparisons of real product and its composition'. Review of Income and Wpalth No 1 (March) 1988. '
Lacey, R.; 'International Dairy Market Outlook', Shepparton Regional Outlook Conference. 3 October 1990.
Lai. W.B.. Huang, J.Y., Hooley, G., Lynch, J. and Yao, 0.; 'Effective Marketing in Taiwan: Protiles of the Top Performers'. European Journal of Marketing. Vol. 26, No. 3, MCB University Press, London, England 1992 pp 7-17.
Lane. B.; 'Dairy corp told to get tinancial affairs straight.' Western Farmer & Grazier. 24 September 1981.
Lembit, M.; 'Market prospects for dairy', Shepparton Regional Outlook Conference, 3 October 1990.
Lembit, M. and Barry, G.; 'Dairy products', Agriculture and Resources Quarterlv. 1 (4). December 1989, pp 404-406.
Lembit. M.J., Topp. V., Beare, S.C. and Sheales, T.; 'Dairy Industry Policy and Free Trade with New Zealand', Discussion Paper 91.8. Australian Bureau of Agricultural and Resource Economics, Canberra, August 1991 pp 24-45.
Lim, D. (Ed.); ASEAN - Australian Trade in Manufacturers. Longman Cheshire Pty. Ltd., Australia 1985.
Macpherson, N.T.; The South East Asian Investment Guide. Longman Group (Far East) Ltd., Hong Kong, 1992.
Mahendranathan. I., 'The present status of the dairy industry in the ASEAN countries.' Malavsian Veterinarv Journal. 1982, 7 (3) pp 174-179.
'Malaysia turns dreams and visions into reality', Tradescope. Japan External Trade Organisation. October Vol. 12 No. 10. Tokyo, Japan 1992.
McKanna, G. and Burrell. S.; 'Aust must lift game or be left behind, says Garnaut'. Australian Financial Review. Tuesday 30 March 1993 PP 5.
MvColl, G.D. and Mozina. T.A.; International Trade in the Pacific Basin. The University of New South Wales. Australia, 1984.
254
McLean, R.J.,'Exploiting opportunities in the Pacific Basin', CEDA Study Committee for economic development of Australia, Strategic Issues Forum Monograph. June 1986.McVey, R. (Ed.); Southeast Asian Capitalists,Cornell University, USA 1992.
Meissner, H.G.; Strategic International Marketing, Springer-Verlag, Germany 1990.
Meyanathan, S. and Sivalingam, G.; 'Malaysia' in Booth. A., David, C et al (Ed.) 1986. pp. 37-116.Miller, D.C.; Handbook of Research Design and Social Measurement (Fifth Edition). Sage Publications. Newbury Park 1991
Milne, G., 'Region's tigers beat us on taxes,' Weekend Australian. June 18-19. 1992.
Missen, G.; 'Australia's clean environment as comparative advantage in food exports to Asia: myth or reality?' (unpublished research proposal). University of Melbourne, 1992.
Mohamed. A. and Tan, L., eds.. The Uruouav Round: ASEAN Trade Policv Options. Institute of South East Asian Studies, Singapore 1988.
Moran, R.T. and Stripp, W.G.; Dvnamics of Succe.s.sful International Business Negotiations. Gulf Publishing Company, Houston, USA 1991.
'Moving in on the growing snack food market', Asia Pacitic Food Industrv. AP Food Industry Publications Pte Ltd., January/February Vol. 3 No. 1/2 pp 46-52, Singapore 1991.
Muller. L.L., 'Food Odyssey - 2001. Dairy Products', Food Technology in Australia. Vol.33 (6), June 1981, pp 278-279.
Murray Goulburn Co-operative Company Limited, Annual report 1992.
National Foods Limited, Annual Report 1991.
'Neighbours come knocking', Asiaweek, February 28 1992, pp 66-67.
'Nestles' moves South,' South, September/October 1991, No. 125 p 6.
N.S.W. Dairy Farmers Association, 'Discussion Paper on Quota System Review', Sydney 29 August 1988 pp 1-24.
Ngam, S.M. and Lee, E.; 'Supermarkets: Battle of the Stores', Malaysian Business. Vol.16, January 1986, pp 5-16.
255
Noland, M.; Pacitic Basin Developing CountriP.*;: Prospects for thP Euture/ Institute of International Economics, Washington DC USA 1990.
'NSW processed food development strategy', NSW Processed Food Task Force, October 1991.
Nugent, M.; 'Listening to the customer will help us change attitude'. The Australian. Wednesday 10 March 1993.
'NZ dairy expands', Australian Financial Revipw. Tuesday 19 May 1992.
O'Callaghan, T.W.; 'Self regulation in the dairy industry'. Dairy Industry Association of Victoria, 1989.
Office of the Premier of Victoria, 'Food Victoria to drive export growth', July 29, Melbourne, Australia 1993.
Oftice of Trade and Investment, 'The dairy products industry in Victoria: A sector study', Melbourne, Australia, February 1991.
Olah. A., 'The role of Austrade, its products, services and initiative'. Development of our Export Potential. Institute of Industrial Economics, University of New Castle, New South Wales. August 1987. pp:29-38.
Olscheske, J.H., '1990 Asian cheese market research in Japan Taiwan, Hong Kong', Project of Mid America International Agri-Trade Council, August 1990.
Onkvisit, S. and Shaw, J.J.; International Marketing: Analvsis and Strategv (Second Edition). Macmillan Publishing Company. USA 1993.
Oxiey, A.. 'Effects of EC (European Community) agricultural policies on Australian and other countries exports', [speech by the Australian Ambassador and Permanent Resident to GATT to the Council of GATT (General Agreement on Tariffs and Trade) in Geneva, 10 October 1985].
'Pacitic Dunlop seeks slice of Asian food market,' Food Industrv. November 1992.
Pappas Carter Evans & Koop/Telesis; The Global Challenge: Australian Manufacturing in the 1990's. Australian Manufacturing Council. Sydney 1990.

256
Parkes, J . ; 'Malaysia: Moving into overdrive'. Overseas Trading. June 1990, pp 22-24.
Phoon, Z.; 'Thriving on competit ion', Malavsian Business. July 16 1992.
'Plan to double food export earnings', Overseas Trading. May 1990, pp 30-32.
Port Jackson Partners Limited, Australian Business in Asia: Climbing the Mountains. Business Council of Australia, 1992.
Porter, M.E.; 'Industry scenarios and competitive strategy under uncertainty', in Competitive Advantage Creating and Sustaining Superior Performance'. The Free Press, New York 1985.
Processed Food Industry Council; Packaging and the international competitiveness of the Australian food processing industrv. Australia, September 1990.
Queensco-Unity Dairy Food Co-operative Association Limited, Annual Report 1992.
Rennie, M.; 'Persistence pays off for successful exporters'. The Australian. Friday 12 March 1992, pp 10.
Retail Trade International. Volume 3, Euromonitor, London 1992.
Riddell Information Services Pty. Ltd., Jobson's Year Book of Australian Companies 1992/93: Sydney 1992.
Riddell Information Services Pty. Ltd.; Australia's Too 500 Companies 1991-92. The Business Who's Who of Australia. Crows Nest (New South Wales) 1991 .
Roberts, P.; 'An innovative, courageous politician bows out ' , Australian Financial Review. Thursday 1 April 1992.
Robison, R.; 'Indonesia: Tension in state and regime', in Southeast Asia in the 1990s: Authoritarianism. Democracv & Capitalism in Hewison, Kevin et al. (Ed.) 1993.
Rose, W., 'Increasing Australia's exports, development of our export potential ' . Institute of Industrial Economics, University of New Castie, New South Wales, August 1987. pp 11.-28.
Rosenbaum, A.; 'BSN challenging Nestle, Unilever', Advertising Aqe,
June 25 1990.

257
Rossiter, J.R., 'Consumer research and marketing science'. Faculty of Business Working Paper Series, University of Technology, Sydney, April 1988.
Ryan-Clark, F.; 'What the future holds for the dairy industry', Australian Rural Times. Volume 40 August 1990, pp 18-19.
Sandilands, B., 'The Un-packaged tourists,' Australian Business Monthlv. April 1992.
Schenk, D.G.; 'Importance of the recombined and tilled milk industry in South East Asia', Orgaan-Koninklijke Nederlandse-Zuivelbond. Volume 65, 0-45 18 1973, pp 444-446.
Sekaran, U., Research Methods for Business (Second Edition), John Wiley & Sons, USA 1992.
Sheridan, G., 'The coming of age of Asia's trading bloc,' Weekend Australian. January 18-19, 1992.
Shew, D.I.; 'The manufacturer is the key link in any program to improve the image of dairy products - quality, consistency, availability'. The Australian Journal of Dairv Technoloov. Volume 29, Number 2, Australian Society of Dairy Technology, June 1974.
Shoebridge, N.; 'Dairy marketeers reap the benefits of a new image'. Business Review Weeklv. Julv 24 1992, pp 82.
Shoebridge. N.; 'Goodman gets its act together', Business Review Weekly. 17 July 1992 pp 19-21.
Shoebridge. N.; 'Food for Asia: A market on the boil ' . Business Review Weeklv. October 23. 1992.
Sieh Lee Mei Ling, 'The transformation of Malaysian business groups', in McVev (Ed.) 1992. pp. 103-126.
'Silicon Valley. South India'. Asiaweek, 06/03/92. pp 44-46.
Smith. D.B., 'Food Technology in the Philippines'. Food Technology in Australia. November 1975.
Smith. D.B.; 'Food Technology in the Philippines', Food Technology in Australia. Council of Australian Food Technology Associations, November 1975.
'Snacks in Southeast Asia', ACJ . P.r^ifir Food Industrv. AP Food Industry Publications Pte Ltd.. April pp 28-32. Singapore 1992.

258
Sorensen, A.; 'Progress and problems of dairy development in the Asian and Pacific region', Asia and Pacific Extension Bulletin. Volume 237 (7) 1986, Food and Fertiliser Technology Centre, Taiwan.
Spring, D.; 'An international marketer's view of Porter's New Zealand study' . Business Quarterlv. Winter 1992.
Sundram, J . (Ed); Mahathir's Economic Policies (2nd Edition), Insan, Kuala Lumpur. Malaysia 1989.
Stevens. M., 'How the dairy industry is changing'. Business Review Weekly, November 6. 1992.
Stewart, A.; 'Why we import so much food' . Business Review Weeklv. March 2 9 , 1 9 9 1 . pp:42-46.
Strange. L.L.; 'Packaging and presentation - its intiuence on impulse buying' . The Australian Journal of Dairy Technology. Volume 29, Number 2. Australian Society of Dairy Technology, June 1974.
Suchard. H.; 'Some aspects of international marketing'. Development of our Export Potential. Institute of Industrial Economics. University of New Castle, New South Wales, August 1987 pp 29-38.
Sullivan. J . ; 'Outlook for Victorian dairying in a changing policy environment', Shepparton Regional Outlook Conference, 30 October 1990.
Syvert. P., 'Quality food exports from the clean country'. The Australian Financial Review. Wednesday 12 May 1993. p. 14.
Tatura Milk Industries Limited, Annual Report 1992.
Taylor, M.; 'The Australian dairy industry: an overview'. Agricultural Science. May 1991 .
Terpstra, V. and Sarathy. R.; International Marketing (Fifth Edition). The Dryden Press. Orlando, USA 1992.
Templeton, H.C.; 'Why CER ?: a look at Australia's concerns. [Address to the National Rural Press Club, Canberra, 10 March 19821, New Zealand Forpinn Affairs Review. V.32, January/March 1982 pp 7-1 1 .
'The dairy industry sector study' . Office of Trade and Investment. Victoria. October 1992.

259
'The Lex Column: Dairy industry'. The Financial Times, 16 March 1991. London pp 24.
'The overseas Chinese'. The Economist, July 18 1992, pp 21-24.
The Queensland Business Register (5th Edition), Australian Marketing Publication & Services Pty. Ltd., Bowen Hills. Queensland, pp 418-487.
Tsuruoka, D., 'In need of weaning'. Far Eastern Economic Review. 6th February 1992.
United Nations Industrial Development Organisation, Malaysia, sustaining the industrial investment momentum. Austria 1991.
'Unveiling a grab bag of incentives - Malaysia's new gamepian for its food industry, ' Asia Pacific Food Industrv. Vol. 3, No. 7. AP Trade Publications Pty Ltd.. Singapore. July 1991 pp 27-30.
Victorian Dairy Industry Authority. Annual Report 1992.
Webb, R.; 'Associated Dairies raises $3.45m', Australian Financial Review. 24 April 1993. p 29.
Weidenbaum, M.; 'The business response to the global marketplace'. The Washington Quarterlv. Winter 1992 pp 173-175.
Weisberg, H.F., Krosnick, J.A. and Bowen, B.D. ; An Introduction to Survev Research and Data Analvsis (Second Edition). Scott, Foresman and Company, USA 1989.
White, D.; Caoturino Opportunities in Asian Food Markets, McKinsey Global Institute, Australia 1992.
Wilson, M.; 'Seize the chance, Australia', Overseas Trading, December
1992, pp 2.
Young, K.B., Amir, P., and Cramer, G.L.; 'Implications of dairy development in Indonesia', Agribusiness, Volume 6, Number 6, 1990 pp 559-574.
Zain, 0 . , and Rejab, I.; 'The choice of retail outiets among urban Malaysian shoppers'. intPmational Journal of Retailing. Volume 4. Number 2 1989 pp 34-35.
Zikmund. W. and Di 'Amico, M.; Marketing (2nd Edition). John Wiley &
Sons, New York 1986.

260
Appendix I
SCHEDULE OF COMPANIES SURVEYED
Butter Producers Cooperative Federation
Associated Dairies Ltd
Lactos Pty Ltd
Dairy Vale Cooperative Ltd
Ausdairy Ltd
Ausfine Trading company
International Food Processing
Ballantyne Export Company Pty Ltd
Lavery International
Atherton Tablelands Cooperative
Norco Cooperative Ltd
Queensco Unity Dairyfoods Ltd
National Dairies Ltd
Kraft Foods Ltd
Bonlac Foods Ltd
Nestles (Australia) Ltd
Australian Cooperative Foods Ltd
Warrnambool Cheese and Butter Factory Co
Tatura Milk Products
United Milk Tasmania Ltd
Murray Goulburn Cooperative Ltd

261
Appendix II
QUESTIONNAIRE
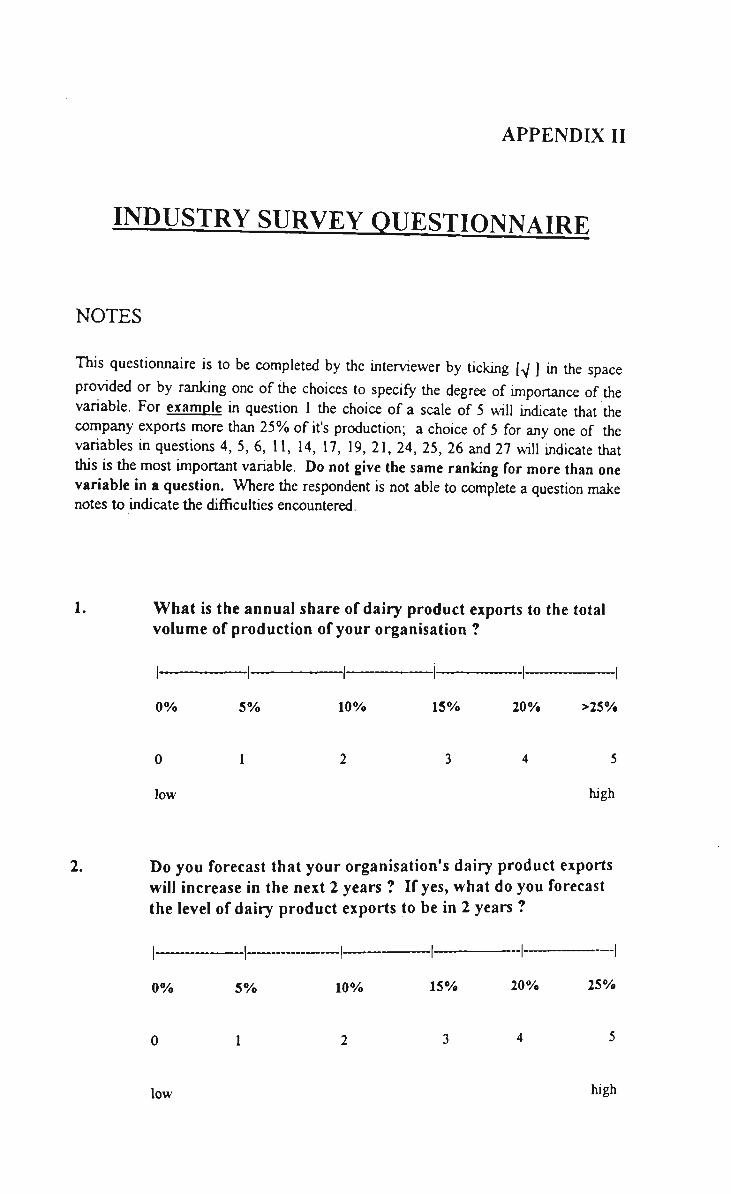
APPENDIX II
INDUSTRY SURVEY OIIESTIONNATRF
NOTES
This questiormaire is to be completed by the interviewer by ticking [. ] in the space provided or by ranking one of the choices to specify the degree of importance of the variable. For example in question 1 the choice of a scale of 5 will indicate that the company exports more than 25% of it's production; a choice of 5 for any one of the variables in questions 4, 5, 6, 11, 14, 17, 19, 21, 24, 25, 26 and 27 will indicate that this is the most important variable. Do not give the same ranking for more than one variable in a question. Where the respondent is not able to complete a question make notes to indicate the difficulties encountered.
1. What is the annual share of dairy product exports to the total volume of production of your organisation ?
0% 5% 10% 15% 20% >25%
0 1 2 3 4 5
low high
2. Do you forecast that your organisation's dairy product exports will increase in the next 2 years ? If yes, what do you forecast the level of dairy product exports to be in 2 years ?
0% 5% 10% 15% 20% 25%
low *»»gh

SUKU: 02/1993
3. Based on your market experiences and/or market intelligence how will you rank the export market potential for dairy product lines of your organisation to Malaysia in the next 2 years ?
POOR SATISFACTORY GOOD
Indicate your organisation's principal sources of market intelligence on Malaysia. Rank key sources of market intelligence in order of importance.
a)
b)
c)
d)
e)
f)
Malaysian Resellers
Austrade
AFR/Business Magazines
Market Surveys (consultants)
Industry Reports
Others, speciiy
Important
5
5
5
5
5
5
4
4
4
4
4
4
3
3
3
3
3
3
Not Important
2 ]
2 ]
2 ]
2 ]
2 1
2
0
0
0
1 0
I 0
1 0
5. Do you perceive that the demand for dairy products in Malaysia will grow ? If yes, what do you perceive to be the positive factors for the growth in demand for dairy products in Malaysia in the next 2 years ?
a)
b)
c)
d)
e)
f)
Income Growth
Changing dietary habits
Positive production perception
Positive perception of Australian products
Negative perception of dairy substitutes
Others, specify
Important
5
5
5
5
5
5
4
4
4
4
4
4
3
3
3
3
3
3
Not Important
2
2
2
2
2
2
I 0
I 0
I 0
I 0
1 0
1 0

SUKU; 02/1993
6. In export marketing to Malaysia, what reseller channel intermediaries do you use ? Rank in order of importance.
a) Malaysian based sales office/subsidiary
b) Malaysian based Agents
c) Malaysian based Merchants
d) Australian based Agents
e) Malaysian wholly owned manufacturing subsidiary
f) Malaysian manufactxuing joint venture
g) Others, speciiy
Important
4
4
4
4
3 2
3 2
3 2
3 2
Not Important
0
0
0
0
5 4 3 2
5 4 3 2
0
0
7. If using resellers in Malaysia ('a' and/or 'b'), indicate the number of resellers representing you in Malaysia.
<9 8-7 6-5 4-3 2-1 none
8. For how many years have these resellers represented you in Malaysia?
<5
5
5-9
4
10-14
3
15-19
2
20-24
1
>25
0
Are there specified sales territories for your resellers in Malaysia or do they represent you for the whole country ?
a) YES • b) NO n

SUKU; 02/1993
10. Does the existence of large and diverse ethnic and religious groups such as Chinese, Malays and Indians in Malaysia, make product market planning more difficult than in other more homogenous markets in the region ?
J) YES • b) NO •
Difficult Not Difficult
11. What segments of the market as defined below do your resellers focus on ?
Important Not Important
a) Retail
b) . Wholesale
c) Food service
d) Industrial
e) Mass market
f) Others speciiy.
5
5
5
5
5
5
4
4
4
4
4
4
3
3
3
3
3
3
2 ]
2 ]
2 1
2 1
2
2
0
0
0
I 0
I 0
I 0
12. Is your strategy in Malaysia to sell bulk products such as SMP, WMP, whey powder and butter oil or do you actively promote value added, packaged proprietary brands to the retail and food service segments ?
NICHE MARKET (value added)
MASS MARKET (bulk commodities)

SUKU; 02/1993
13. What are your major exports to Malaysia based on sales value ?
PRODUCT VALUE
a)
b)
c)
14. In product market segmentation, what important sub markets do you see in Malaysia ? Rank the importance of these sub markets.
a)
b)
c)
d)
Income based
Ethnic based
Tourism based
Others, speciiy
Important
5
5
5
5
4
4
4
4
3
3
3
3
Not
2
2
2
2
Important
1 0
1 0
1 0
1 0
15. Do you perceive modern supermarkets (as in Australia) becoming an important retail channel in Malaysia in the next 5 years ?
a) YES D b) NO D
5 4 3 2 1 0
16. If yes, do you think that your present resellers are geared to selling into these more sophisticated outiets (ability to negotiate mstore promotions, merchandising etc) ?
a) YES D > ^® ^
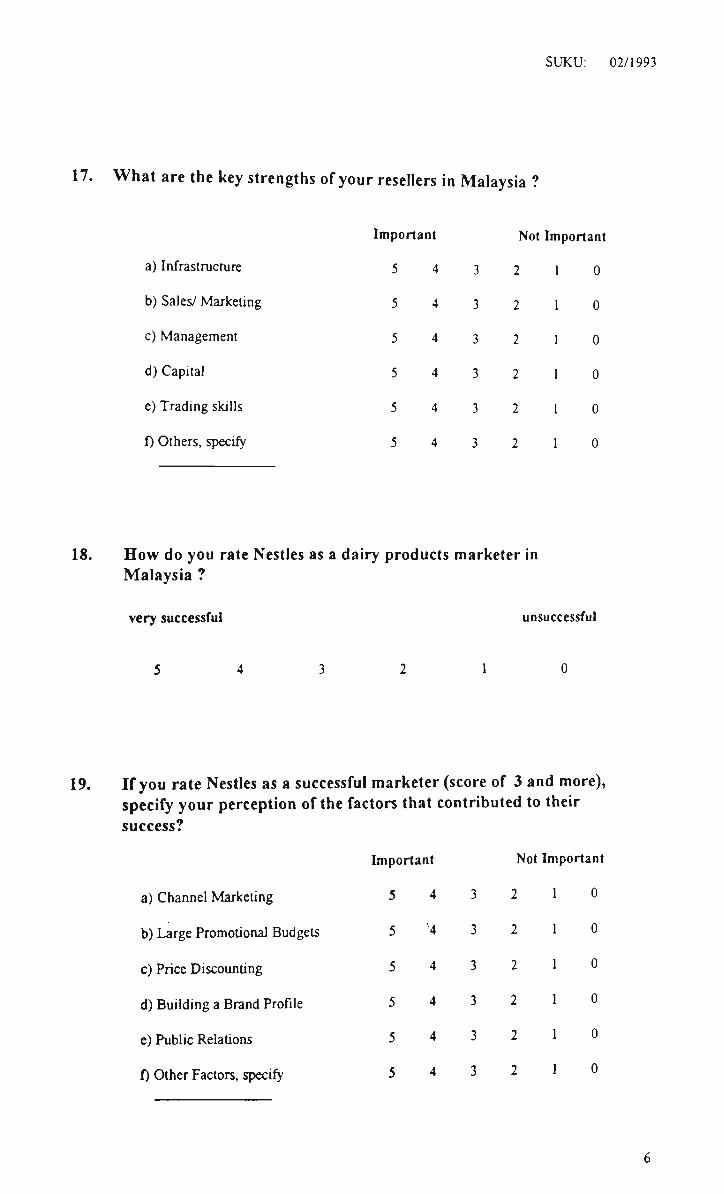
SUKU; 02/1993
17. What are the key strengths of your resellers in Malaysia ?
a) Infrastructure
b) Sales/ Marketing
c) Management
d) Capital
e) Trading skills
i) Others, specify
Important
5
5
5
5
5
5
4
4
4
4
4
4
3
3
3
3
3
3
Not
2
2
2
2
2
2
Important
1 0
1 0
1 0
1 0
1 0
1 0
18. How do you rate Nestles as a dairy products marketer in Malaysia ?
very successful unsuccessful
19. If you rate Nestles as a successful marketer (score of 3 and more), specify your perception of the factors that contributed to their success?
a) Channel Marketing
b) Large Promotional Budgets
c) Price Discounting
d) Building a Brand Profile
e) Public Relations
f) Other Factors, specify
Important
5
5
5
5
5
5
4
'4
4
4
4
4
3
3
3
3
3
3
Not Important
2 ]
2 ]
2
2 ]
2
2
I 0
I 0
I 0
1 0
I 0
I 0

SUKU; 02/1993
20. How do you rate NZDB as a dairy products marketer in Malaysia ?
Very successful Unsuccessful
21. If you rate NZDB as a successful marketer (score of 3 and more), specify your perception of the factors that contributed to their success?
a) Chaimei Marketing
b) Large Promotional Budgets
c) Price Discounting
d) Building a Brand Profile
e) Public Relations
f) Other Factors, specify
Important
5
5
5
5
5
5
4
4
4
4
4
4
3
3
3
3
3
3
Not Important
2 1
2 1
2 1
2 1
2
2
0
0
0
0
I 0
I 0
22. Do you think that the dominance of Nesties and NZDB will make business development more difficult for your organisation in Malaysia ?
Difficult
5
No effect
0
23. Is there a separate International Marketing Department in your organisation ?
a) YES • b) NO n

SUKU; 02/1993
24. If yes, which of the following will closely resemble the organisation of your International Marketing Department ?
a) All products under one manager L J
b) Separate product managers Q
c) Separate market managers L J
d) A combination of the above LJ
25. What is the extent of formal marketing planning in your organisation ?
a) There is little or none Lj
b) Limited to aiuiual budgeting L J
c) A separate annual marketing plan L J
d) Annual and long -term plans LJ
26. Which of the following best describes your organisation's current marketing objectives in Malaysia
a) Don't have specific objectives
b) Maintain current position
c) Steady sales growth
d) Aggressive sales growth
e) Market domination
f) Others, specify
• a 9
D
D
D
D
D
D
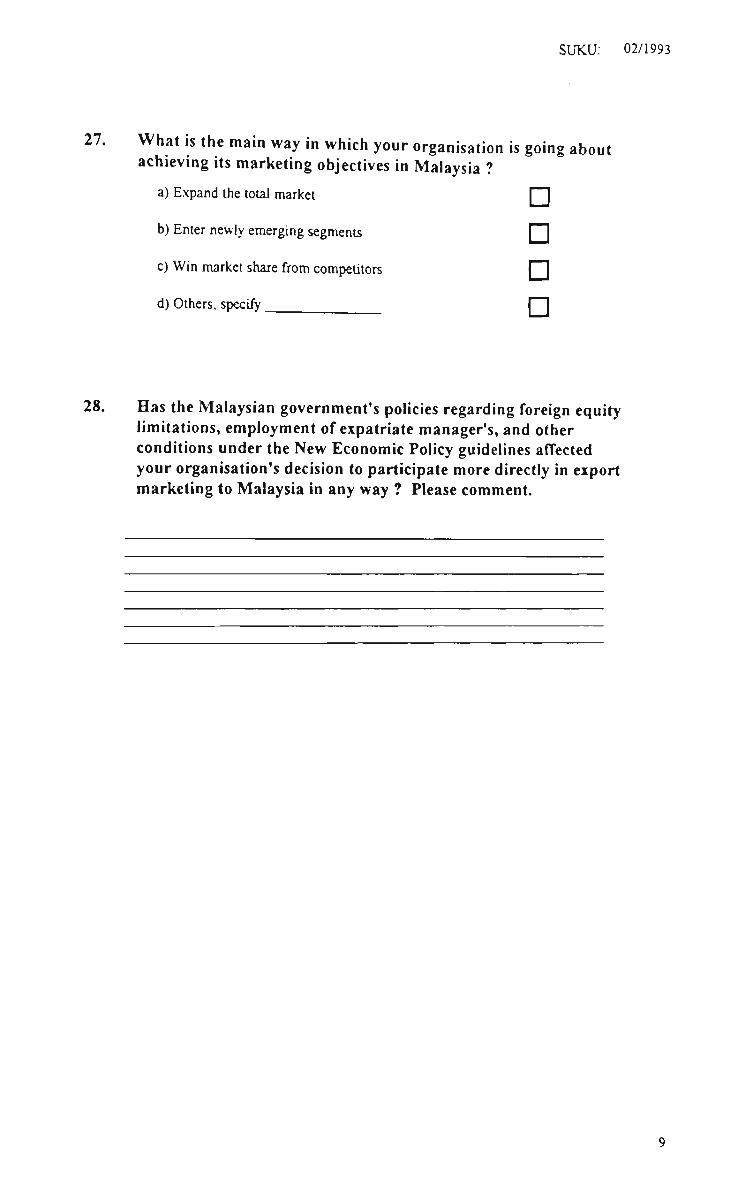
SUKU: 02/1993
27. What is the main way in which your organisation is going about achieving its marketing objectives in Malaysia ?
a) E.\pand the total market F l
b) Enter newly emerging segments Fl
c) Win market share from competitors n
d) Others, specify PH
28. Has the Malaysian government's policies regarding foreign equity limitations, employment of expatriate manager's, and other conditions under the New Economic Policy guidelines afTected your organisation's decision to participate more directly in export marketing to Malaysia in any way ? Please comment.

271
APPENDIX
GDP PER CAPITA IN THE PACIFIC BASIN - SELECTED COUNTRIES (US Dollars excepted where noted)
Country
Singapore
Malaysia
Thailand
Philippines
Indonesia
At purchasing power parities prices
1963
1,777
1,233
537
965
463
1988
11,693
3,643
1,627
1,460
1,348
Average growth
rate (%)
7.8
4.4
4.5
1.7
4.4
n 1980
Atkinson
inequalit V
index"
n.a.
0.556
0.408
0.442
0.407
At 1988 Market
exchange rates
7,623
1,886
887
603
409
The Atkinson inequality index is defines as 1-[Ii(yi"Vn)]Vy, where yj = inconne of group i and n is the number of income groups. The index varies from 0 to 1, with higher values indicating greater income inequality.

272
APPENDIX IV
ANNUAL WORLD INDICATOR PRICES FOR MAJOR DAIRY PRODUCTS
1985-86 1986-87 1987-88 1988-89 1989-90 1990-91
Ref: Lembit M.; 'Market prospects for dairy', Shepparton Regional Outlook Conference, 3 October 1990, pp 1.
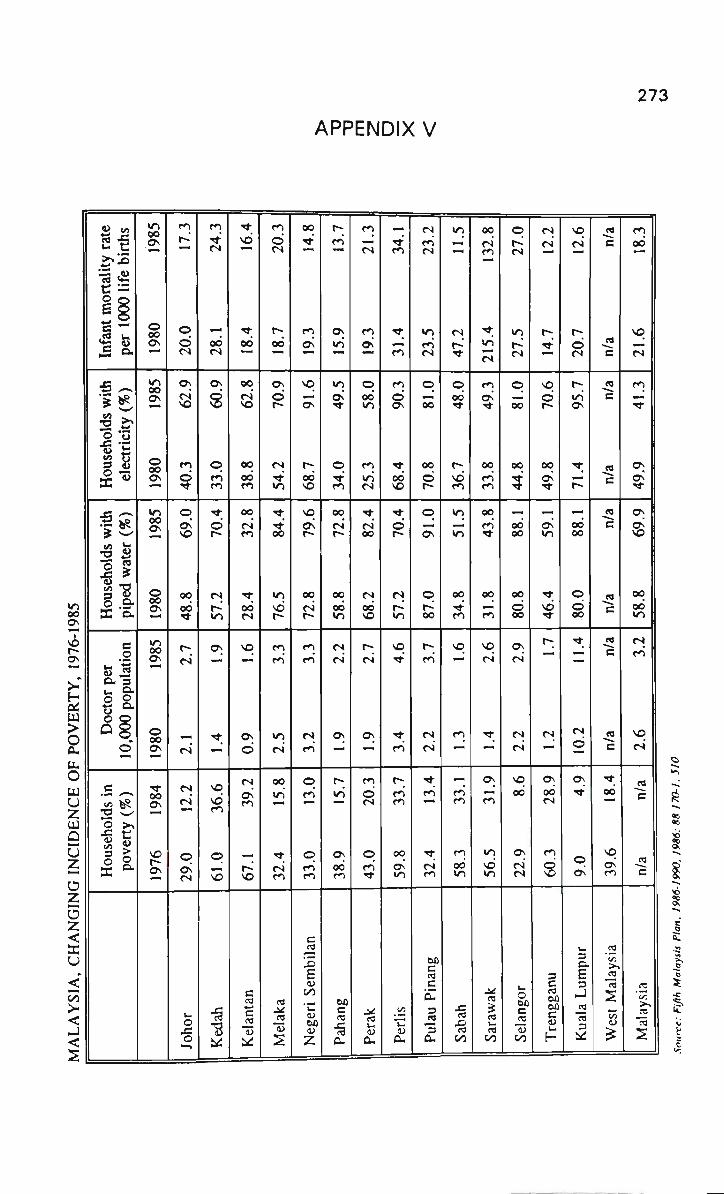
273
APPENDIX V
V) 0 0 OS
76-1
OS
^^
C< tu >
o u. O
u u z u Q
NG
INC
^ M
O z < E U
<
MA
LA
YS
I
2J 52 2 ^ >«S ••i«£ t: = 2 o S§
Infa
nt
per
11
S^
2 ^ •© "o
Hou
seh
elec
tri
1 «S ^ ^ •Ss 1 0
Hou
si
pipe
d
a o
S 1 ex 3 o o
o 2 o 8
© •
. £ ^-v
'.5 "o >»
li
Hou
: po
v
»n oo OS
980
I T l OO Ov
o 00 OS * - M
«n oo OS
o oo 0 \
oo 0 \
'^
o 00 0 \
0 0 OS
1976
r»%
r*-*
0.0
rsi
Os
f S
^
m
? p OS VO
8.8
T f
r-<s
. M
rs
CN
cs
29.0
Jo
hor
rn
CN
8.1
CN
Os
s
p ro r^
T f
d r-
7.2
*r\
OS ^ M «
"«t ^
v£>
61.0
K
edah
"* VO
8.4
0 0
r j so
OO
0 0 m
0 0
CN m
8.4
CN
VO ^m
Os
d
CN Os' rr\
67.1
K
elan
tan
m d
8.7
^
Os
d r~
CN
• * *
*n
•^ •^ oo
6.5
t~
rn en*
in CN
QO
vn
32.4
M
elak
a
0 0
•*'
9.3
*"
so
^ Os
1—
00*
so
VO
Ov' t^
2.8
r*
fn
<*i
« N
cn
p c* '
33.0
c n
mbi
a>
Neg
eri
S
I - ;
rn
5.9
9 ^
«r> Os' •<t
o T f m
0 0
CN
r*
8.8
Vi
CN
CN
Os ^
r-uS
38.9
Pa
hang
C*J
r5
9.3
^
p 00* »n
rn •o CN
•*_ CN 0 0
8.2
VO
r-CN
Os — < '
en d CN
43.0
Pe
rak
,^
1.4
m
m
d c>
xf
od VO
•* d r
7.2
l O
VO
• « * • '
•«t rn
f -rn m
59.8
P
eril
s
CN
cn CN
3.5
CN
P ^ 0 0
0 0
d r»
p ^ o\
7.0
0 0
r-m'
CN
CN
"t rn
'^
32.4
an
g
c
Pula
u Pi
irj ^
7.2
• *
p 0 0 • ' f
t--_
vd en
wn ^ •n
4.8
m
vq ^
m —
^ . M
PO m
58.3
Sa
bah
0 0
32.
—
5.4
c^
<n OS •<t
0 0
en en
0 0
r^ •*
1.8
m
VO
CN
• *
—
OS
^ cn
56.5
Sa
raw
ak
o
CN
7.5
CN
P ^ M
OO
0 0
5 » oo' 0 0
0.8
0 0
Os
CN
CN
CN
VO
od
22.9
Se
lang
oi
CN
CN
4.7
w^t
vq d r
oq OS •<*•
» OS »n
46.4
1.
7
CN
—
OS
0 0 CN
60.3
3 C
Tre
ngga
vq CN
0.7
CN
r> vi OS
• * .
^ r* » oo' oo
0.0
oo
1.4
^
10.2
Os rt
9.0
Uri
mpu
3
Kua
la L
CO
"c
CQ
"c
CO
"c
CQ
c
n/a
-5 c
n/a
eq
"c
T f
0 0
39.6
e«
lays
CO
Wes
t M
f n od
1.6
c^
m « M
•*
OS
5 • *
•1 «Ri vO n
8.8
—. _
vq CN
CQ
c
n/a
(C
Mal
aysi
;
i a.
1
I

APPENDIX VI
RETAIL ESTABLISHMENTS IN MALAYSIA
274
BUSINESS Employees
Meat/Poultry
Roasted Meat
Fish
Fruits and Vegetables
Confectionery
Biscuits, cakes, bread etc
Provisions (including rice)
Bean curd
Mee and kueh teow
Tobacco, cigarettes
Beer, wine, spirits
Domestic hardware
Establishments
(number)
2,977
181
4,074
7,998
1,564
781
43,433
204
148
310
487
1,615
Electrical goods, appliances etc 3,184
Furniture, furnishings
Clothing and textiles
General merchandise
Footwear
Chemists' goods, cosmetics
Books, stationery etc
Jewellery, watches etc
Bicycles and parts
1,975
5,538
946
711
2,426
2,232
2,319
1,316
Other household, personal goods 2,426
Turnover
{MR$ mill ion)
306.3
14.0
173.0
216.0
28.8
18.0
3,214.0
4.5
4.6
8.3
53.7
134.2
1,019.8
283.7
782.3
533.1
103.6
308.6
200.6
482.2
53.2
189.5
(number)
5,914
375
6,171
11,165
2,600
1,103
100,654
274
224
497
1,051
3,392
11,058
5,884
17,484
10,241
2,222
6,541
5,778
6,976
2,663
5,736
Source: Retail Census of Peninsular Malaysia, 1980, Chapter H.
