a study of audit committees of listed companies in … · a study of audit committees of listed...
TRANSCRIPT

© 2015 ISCA
A Study of Audit Committees of
Listed Companies in Singapore
Thursday, 2 June 2016

Slide 2 of 50
A Study Commissioned by the Institute of Singapore Chartered Accountants (ISCA) and Conducted by the Department of Accounting, NUS Business School
Principal Investigators :
Professor Ho Yew Kee (Chair)
Associate Professor Vincent Chen
Dr Tan Boon Seng
A Study of Audit Committees of
Listed Companies in Singapore

Slide 3 of 50
“There are at least three major
failures in the context of the
role of accountants:”
• In-house accountants
• External auditors
• Audit Committees
Slide 4 of 50
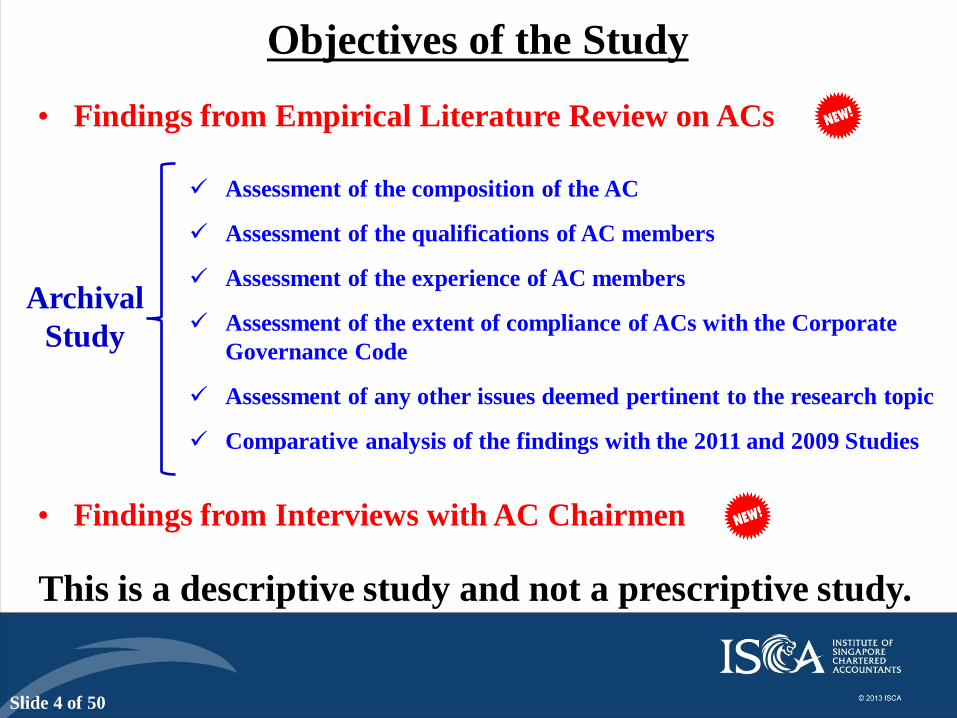
This is a descriptive study and not a prescriptive study.
• Findings from Empirical Literature Review on ACs
Assessment of the composition of the AC
Assessment of the qualifications of AC members
Assessment of the experience of AC members
Assessment of the extent of compliance of ACs with the Corporate
Governance Code
Assessment of any other issues deemed pertinent to the research topic
Comparative analysis of the findings with the 2011 and 2009 Studies
• Findings from Interviews with AC Chairmen
Objectives of the Study
Archival
Study

Slide 5 of 50
Introduction
*****
• Third Study of ACs in Singapore (2011 and 2009 Studies)
• Regulations and Guidelines Governing ACs in Singapore
The Companies Act
CG Code 2012
GCG-Banks 2013
SGX LR
GAC 2014.
• Annual Report for Year Ended 31 Dec 2014 (717 Companies)
• Empirical Literature Review on ACs
• Study of ACs of 717 Companies
• Interviews with Selected AC Chairmen
Slide 6 of 50
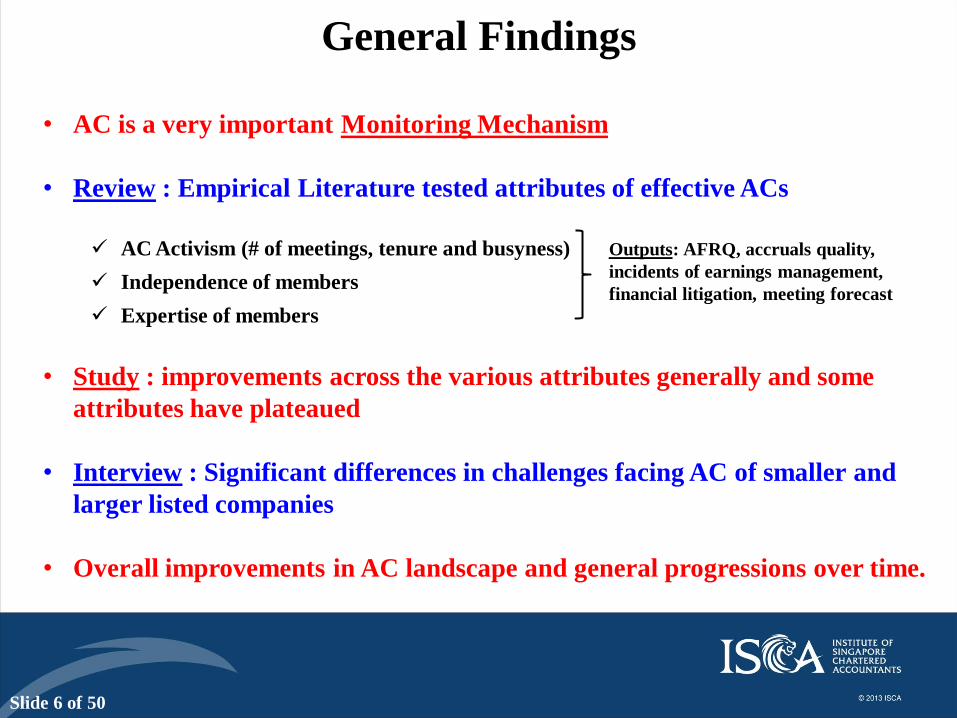
General Findings
• AC is a very important Monitoring Mechanism
• Review : Empirical Literature tested attributes of effective ACs
AC Activism (# of meetings, tenure and busyness)
Independence of members
Expertise of members
• Study : improvements across the various attributes generally and some
attributes have plateaued
• Interview : Significant differences in challenges facing AC of smaller and
larger listed companies
• Overall improvements in AC landscape and general progressions over time.
Outputs: AFRQ, accruals quality,
incidents of earnings management,
financial litigation, meeting forecast
Slide 7 of 50
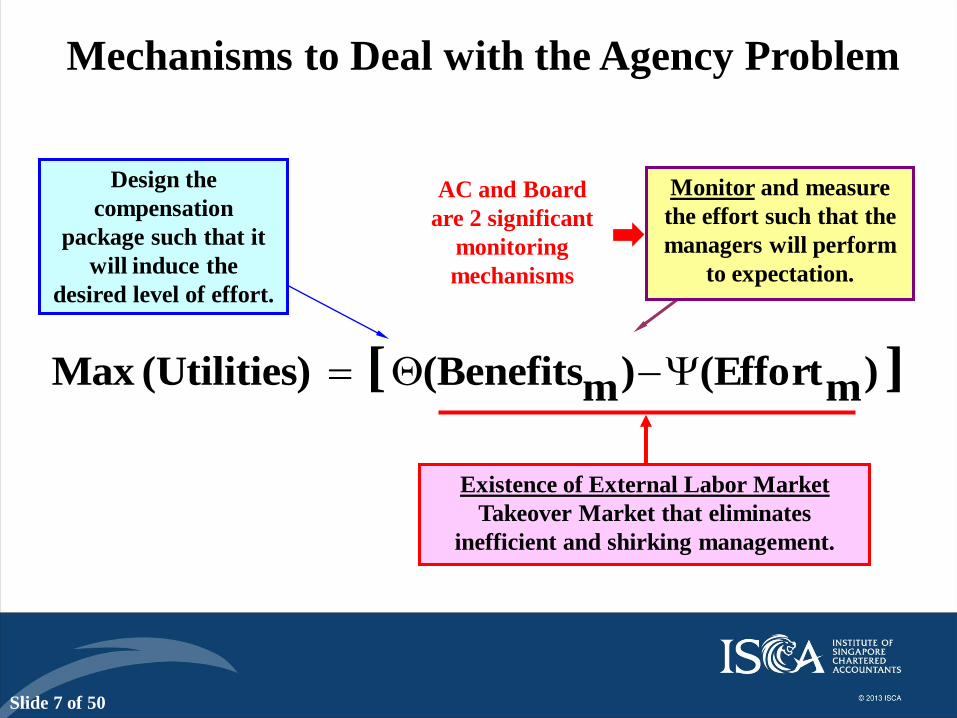
][ )m(Effort)m(Benefits )(UtilitiesMax
Existence of External Labor Market
Takeover Market that eliminates
inefficient and shirking management.
Design the
compensation
package such that it
will induce the
desired level of effort.
Monitor and measure
the effort such that the
managers will perform
to expectation.
Mechanisms to Deal with the Agency Problem
AC and Board
are 2 significant
monitoring
mechanisms

Slide 8 of 50
• AC is a very important monitoring mechanism
• The AC landscape in Singapore has all the right expectations
and requirements
• Significant progresses had been made since 2009 on almost all
fronts but signs of plateauing.
• High degree of compliance and the regulations and guidelines
have positive effects on companies’ practices
• Companies making full use of new appointments to further
calibrate the manpower needs of ACs
• Lukewarm about some of the audit innovations
Conclusion

Slide 9 of 50
Empirical Literature on ACs
Outputs: AFRQ, accruals quality, incidents of earnings management, financial litigation,
meeting forecast
• AC is a very important Monitoring Mechanism
• Only 2 Studies involving Singapore Data
“Board Characteristics, Audit Committee Characteristics and Abnormal Accruals”, Bradbury, Mak
and Tan (2006),
“Audit Committees and Financial Reporting Quality in Singapore”, Kusnadi, Leong, Suwardy and
Wang (2015)
Attributes Inputs
AC Activism
No. of meetings (poor proxy for activism)
Tenure (mixed results)
Busyness (mixed results)
Independence of
members Very important for effective board
Expertise of members Accounting and Finance skill sets are important but at a mixed
basis.
Slide 10 of 50
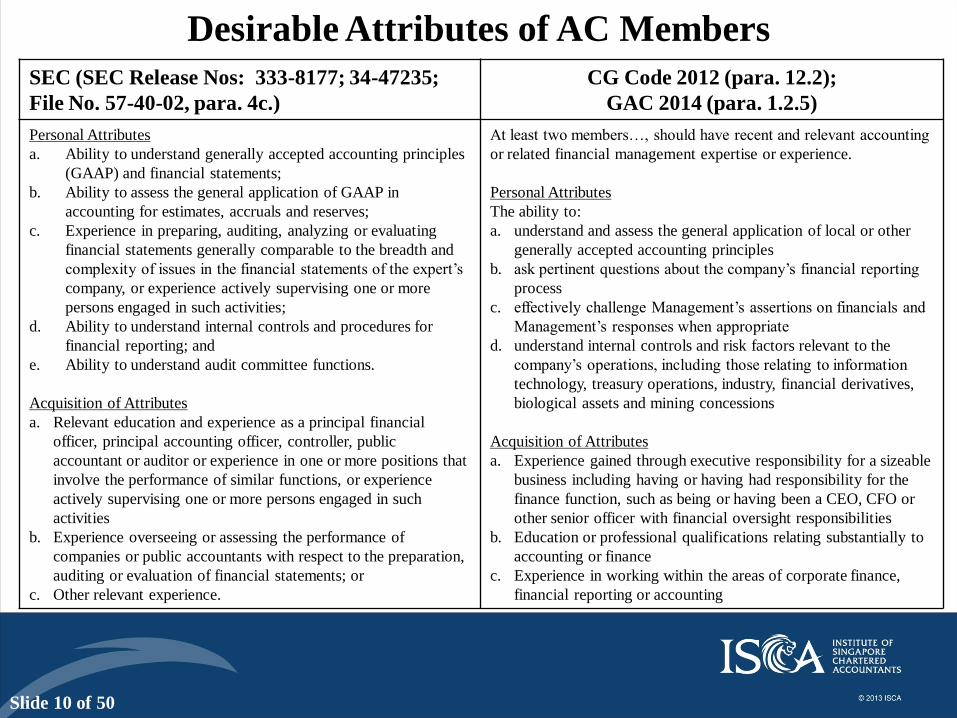
Desirable Attributes of AC Members SEC (SEC Release Nos: 333-8177; 34-47235;
File No. 57-40-02, para. 4c.)
CG Code 2012 (para. 12.2);
GAC 2014 (para. 1.2.5)
Personal Attributes
a. Ability to understand generally accepted accounting principles
(GAAP) and financial statements;
b. Ability to assess the general application of GAAP in
accounting for estimates, accruals and reserves;
c. Experience in preparing, auditing, analyzing or evaluating
financial statements generally comparable to the breadth and
complexity of issues in the financial statements of the expert’s
company, or experience actively supervising one or more
persons engaged in such activities;
d. Ability to understand internal controls and procedures for
financial reporting; and
e. Ability to understand audit committee functions.
Acquisition of Attributes
a. Relevant education and experience as a principal financial
officer, principal accounting officer, controller, public
accountant or auditor or experience in one or more positions that
involve the performance of similar functions, or experience
actively supervising one or more persons engaged in such
activities
b. Experience overseeing or assessing the performance of
companies or public accountants with respect to the preparation,
auditing or evaluation of financial statements; or
c. Other relevant experience.
At least two members…, should have recent and relevant accounting
or related financial management expertise or experience.
Personal Attributes
The ability to:
a. understand and assess the general application of local or other
generally accepted accounting principles
b. ask pertinent questions about the company’s financial reporting
process
c. effectively challenge Management’s assertions on financials and
Management’s responses when appropriate
d. understand internal controls and risk factors relevant to the
company’s operations, including those relating to information
technology, treasury operations, industry, financial derivatives,
biological assets and mining concessions
Acquisition of Attributes
a. Experience gained through executive responsibility for a sizeable
business including having or having had responsibility for the
finance function, such as being or having been a CEO, CFO or
other senior officer with financial oversight responsibilities
b. Education or professional qualifications relating substantially to
accounting or finance
c. Experience in working within the areas of corporate finance,
financial reporting or accounting
Slide 11 of 50
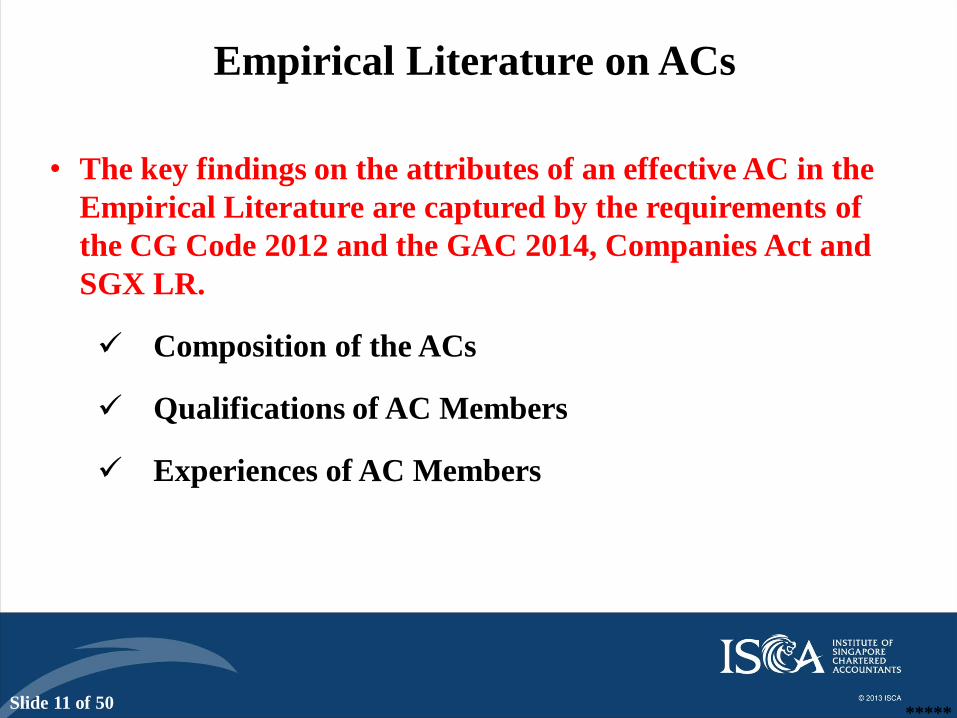
Empirical Literature on ACs
*****
• The key findings on the attributes of an effective AC in the
Empirical Literature are captured by the requirements of
the CG Code 2012 and the GAC 2014, Companies Act and
SGX LR.
Composition of the ACs
Qualifications of AC Members
Experiences of AC Members
Slide 12 of 50
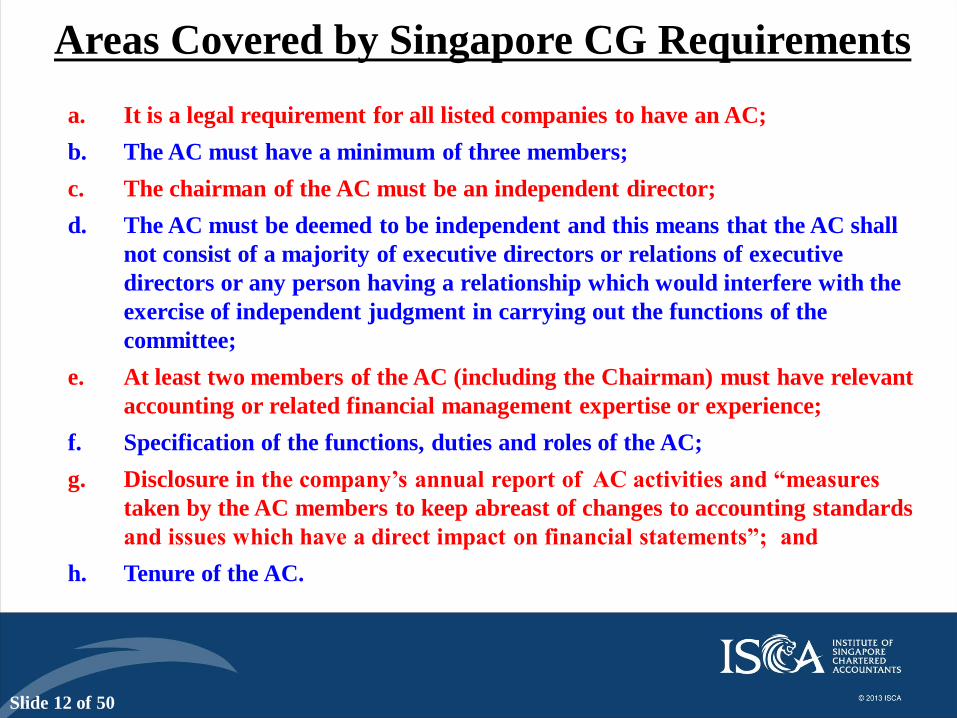
Areas Covered by Singapore CG Requirements
a. It is a legal requirement for all listed companies to have an AC;
b. The AC must have a minimum of three members;
c. The chairman of the AC must be an independent director;
d. The AC must be deemed to be independent and this means that the AC shall
not consist of a majority of executive directors or relations of executive
directors or any person having a relationship which would interfere with the
exercise of independent judgment in carrying out the functions of the
committee;
e. At least two members of the AC (including the Chairman) must have relevant
accounting or related financial management expertise or experience;
f. Specification of the functions, duties and roles of the AC;
g. Disclosure in the company’s annual report of AC activities and “measures
taken by the AC members to keep abreast of changes to accounting standards
and issues which have a direct impact on financial statements”; and
h. Tenure of the AC.

Slide 13 of 50
• Positive trajectory in the development of the AC
landscape in Singapore
• High degree of compliance
• Very significant changes made through new appointees to
AC.
• Some signs of plateauing
• Female AC membership is still very low.
Study – Main Findings
Slide 14 of 50
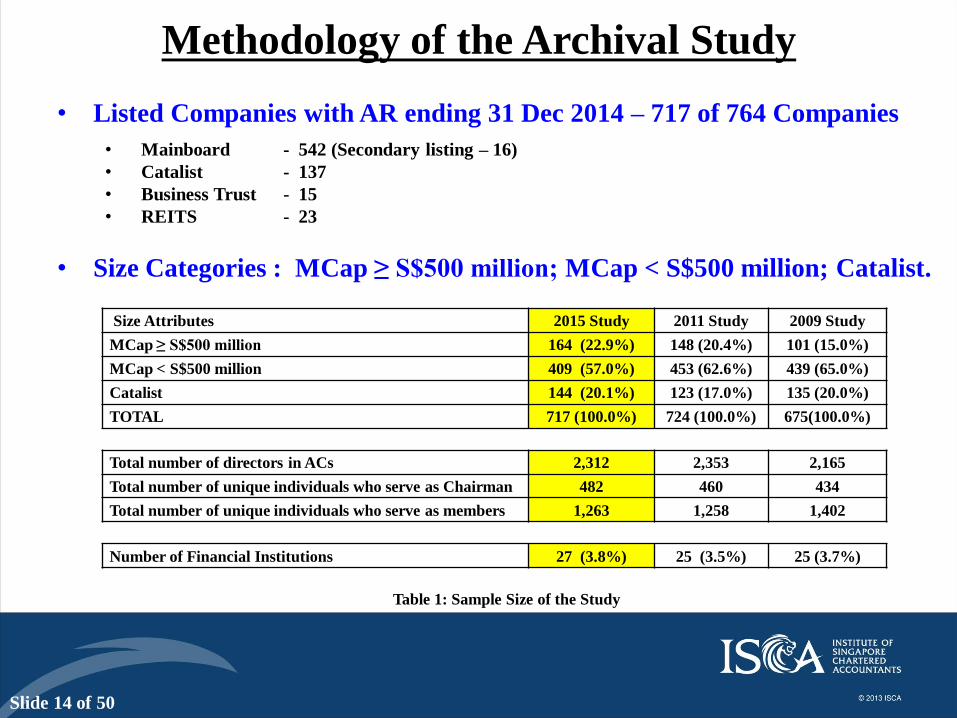
• Listed Companies with AR ending 31 Dec 2014 – 717 of 764 Companies
• Mainboard - 542 (Secondary listing – 16)
• Catalist - 137
• Business Trust - 15
• REITS - 23
• Size Categories : MCap ≥ S$500 million; MCap < S$500 million; Catalist.
Methodology of the Archival Study
Size Attributes 2015 Study 2011 Study 2009 Study
MCap ≥ S$500 million 164 (22.9%) 148 (20.4%) 101 (15.0%)
MCap < S$500 million 409 (57.0%) 453 (62.6%) 439 (65.0%)
Catalist 144 (20.1%) 123 (17.0%) 135 (20.0%)
TOTAL 717 (100.0%) 724 (100.0%) 675(100.0%)
Total number of directors in ACs 2,312 2,353 2,165
Total number of unique individuals who serve as Chairman 482 460 434
Total number of unique individuals who serve as members 1,263 1,258 1,402
Number of Financial Institutions 27 (3.8%) 25 (3.5%) 25 (3.7%)
Table 1: Sample Size of the Study

Slide 15 of 50
Table 2 : Distribution of the Frequency of AC Meetings
Number of AC Meetings
2015
Study
2011
Study
2009
Study
0 1 (0.1%) 3 (0.4%) 3 (0.4%)
1 7 (1.0%) 15 (2.1%) 20 (3.0%)
2 112 (15.6%) 123 (17.0%) 168 (24.9%)
3 33 (4.6%) 59 (8.1%) 104 (15.4%)
4 431 (60.1%) 385 (53.2%) 263 (39.0%)
5 80 (11.2%) 90 (12.4%) 57 (8.4%)
6 34 (4.7%) 27 (3.7%) 29 (4.3%)
7 to 14 18 (2.5%) 18 (2.5%) 19 (2.8%)
No Disclosure 1 (0.1%) 4 (0.6%) 12 (1.8%)
TOTAL 717 (100.0%) 724 (100.0%) 675 (100.0%)

Slide 16 of 50
Table 3 : Distribution of the Frequency of AC Meetings by Size
No of Meetings
2015 Study 2011 Study
≥S$500m <S$500m Catalist ≥S$500m <S$500m Catalist
No (%) No (%) No (%) No (%) No (%) No (%)
0 0 (0.0%) 0 (0.0%) 1 (0.7%) 1 (0.7%) 1 (0.2%) 1 (0.8%)
1 0 (0.0%) 1 (0.2%) 6 (4.2%) 3 (2.0%) 9 (2.0%) 3 (2.4%)
2 8 (4.9%) 43 (10.5%) 61 (42.4%) 9 (6.1%) 67 (14.8%) 47 (38.2%)
3 4 (2.4%) 14 (3.4%) 15 (10.4%) 1 (0.7%) 34 (7.5%) 24 (19.5%)
4 & above 151 (92.1%) 351 (85.8%) 61 (42.4%) 134 (90.5%) 339 (74.8%) 47 (38.2%)
No disclosure/
Not available 1 (0.8%) 0 (0.0%) 0 (0.0%) 0 (0.0%) 3 (0.7%) 1 (0.8%)
TOTAL 164
(100.0%)
409
(100.0%)
144
(100.0%)
148
(100.0%)
453
(100.0%)
123
(100.0%)
Slide 17 of 50
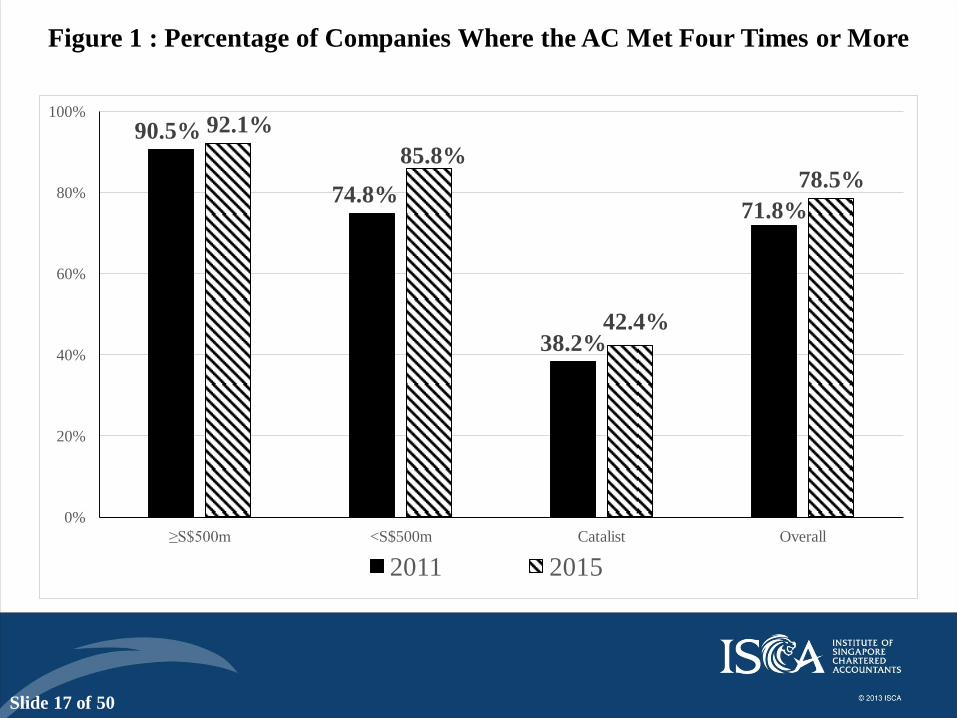
Figure 1 : Percentage of Companies Where the AC Met Four Times or More
90.5%
74.8%
38.2%
71.8%
92.1%
85.8%
42.4%
78.5%
0%
20%
40%
60%
80%
100%
≥S$500m <S$500m Catalist Overall
2011 2015

Slide 18 of 50
Statistics
Non-Financial Companies Financial Companies Total
2015
Study
2011
Study
2009
Study
2015
Study
2011
Study
2009
Study
2015
Study
2011
Study
2009
Study
Average 3.9 3.8 3.0 4.6 4.3 4.2 3.9 3.8 3.6
Median 4.0 4.0 3.0 4.0 4.0 4.0 4.0 4.0 4.0
Minimum 0.0 0.0 0.0 2.0 2.0 2.0 2.0 0.0 0.0
Maximum 14.0 8.0 7.0 11.0 6.0 10.0 14.0 8.0 12.0
Statistics
≥S$500m <S$500m Catalist Total
2015
Study
2011
Study
2009
Study
2015
Study
2011
Study
2009
Study
2015
Study
2011
Study
2009
Study
2015
Study
2011
Study
2009
Study
Average 4.6 4.2 4.6 4.0 3.8 3.5 3.0 3.0 3.0 3.9 3.8 3.6
Median 4.0 4.0 4.0 4.0 4.0 4.0 3.0 3.0 3.0 4.0 4.0 4.0
Minimum 2.0 0.0 0.0 1.0 0.0 0.0 0.0 0.0 0.0 2.0 0.0 0.0
Maximum 14.0 8.0 12.0 12.0 7.0 12.0 7.0 7.0 8.0 14.0 8.0 12.0
Table 4 : Statistics on the Frequency of AC Meetings

Slide 19 of 50
Table 5 : Distribution of the Number of Chairmanship and Membership of ACs Held by Individuals
Chairmanship
of AC
2015
Study
2011
Study
2009
Study
Members of
AC
2015
Study
2011
Study
2009
Study
1 345
(71.6%)
323
(70.2%)
313
(72.1%) 1
1047
(82.9%)
1,026
(81.6%)
1,063
(75.8%)
2 74
(15.4%)
72
(15.7%)
63
(14.5%) 2
140
(11.1%)
153
(12.2%)
166
(11.8%)
3 40
(8.3%)
27
(5.9%)
28
(6.5%) 3
48
(3.8%)
43
(3.4%)
69
(4.9%)
4 17
(3.5%)
22
(4.8%)
13
(3.0%) 4
18
(1.4%)
22
(1.7%)
49
(3.5%)
5 5
(1.0%)
12
(2.6%)
8
(1.8%) 5
5
(0.4%)
6
(0.5%)
17
(1.2%)
6 1
(0.2%)
2
(0.4%)
5
(1.2%) 6
3
(0.2%)
5
(0.4%)
17
(1.2%)
7 1
(0.2%)
3
(0.7%) 7
2
(0.2%)
3
(0.2%)
8
(0.6%)
8 1
(0.2%) 8
4
(0.3%)
9 1
(0.2%) 9
7
(0.5%)
10 10 2
(0.1%)
TOTAL 482
(100%)
460
(100%)
434
(100%) TOTAL
1263
(100%)
1258
(100%)
1402
(100%)

Slide 20 of 50
Figure 2 : Number of Multiple Chairmanship and Membership
0.0%
1.0%
2.0%
3.0%
4.0%
5.0%
6.0%
4 5 6 7 8 9 10
2009 2011 2015
0.0%
1.0%
2.0%
3.0%
4.0%
5.0%
6.0%
4 5 6 7 8 9 10
2009 2011 2015
Panel A : Percentage of
Multiple Chairmanship
Panel B : Percentage of
Multiple Membership

Slide 21 of 50
Chairmen Members Total
2015
Study
2011
Study
2009
Study
2015
Study
2011
Study
2009
Study
2015
Study
2011
Study
2009
Study
Male 679
(95.4%)
701
(97.0%)
659
(97.8%)
1457
(91.1%)
1,519
(93.2%)
1,393
(94.0%)
2,136
(92.4%)
2,220
(94.3%)
2,052
(95.2%)
Female 33
(4.6%)
22
(3.0%)
15
(2.2%)
143
(8.9%)
111
(6.8%)
89
(6.0%)
176
(7.6%)
133
(5.6%)
104
(4.8%)
TOTAL 712a
100%
723b
(100%)
674
(100%)
1600
(100%)
1,630
(100%)
1,482
(100%)
2,312
(100%)
2,353
(100%)
2,156
(100%)
Table 6 : Distribution of AC Memberships According to Gender
aFive companies did not have a chairman for their ACs as the previous chairman had resigned or not mentioned in the annual report.
Therefore, there were 712 chairman (717 – 5 = 712) for the sample. bOne company did not have a chairman for their ACs as the previous chairman had resigned. Therefore, there were 723 chairman (724 – 1
= 723) for 724 companies in the sample.
Since the first Study in 2009, the percentage of total female AC members had increased by 2.8% in
6 years. At this rate of increase, it will take another 5 years to reach 10%.
Slide 22 of 50
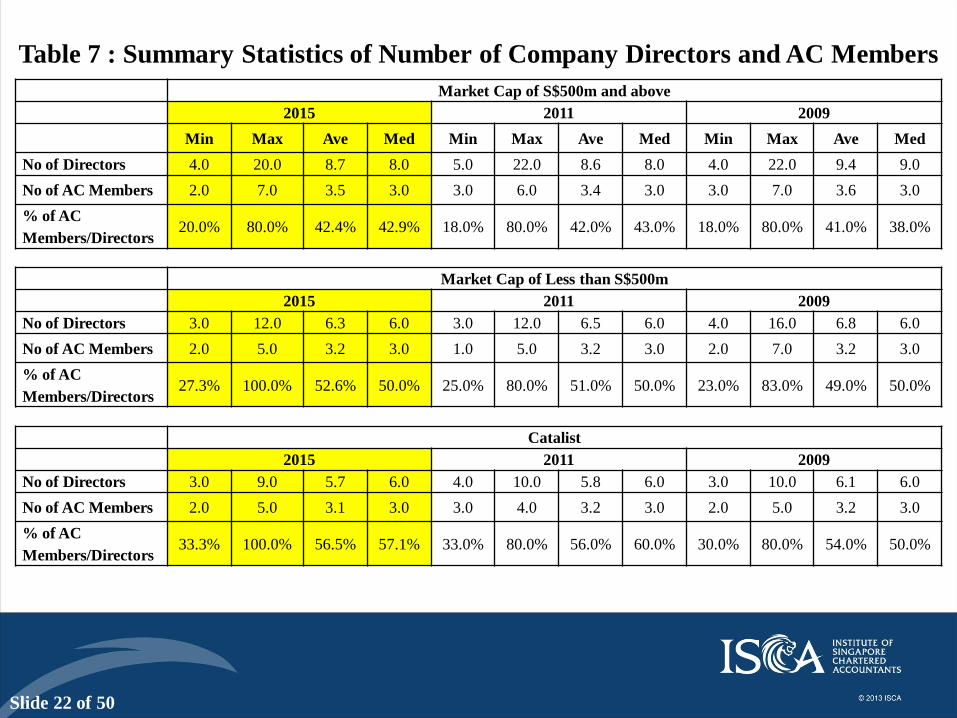
Table 7 : Summary Statistics of Number of Company Directors and AC Members
Market Cap of S$500m and above
2015 2011 2009
Min Max Ave Med Min Max Ave Med Min Max Ave Med
No of Directors 4.0 20.0 8.7 8.0 5.0 22.0 8.6 8.0 4.0 22.0 9.4 9.0
No of AC Members 2.0 7.0 3.5 3.0 3.0 6.0 3.4 3.0 3.0 7.0 3.6 3.0
% of AC
Members/Directors 20.0% 80.0% 42.4% 42.9% 18.0% 80.0% 42.0% 43.0% 18.0% 80.0% 41.0% 38.0%
Market Cap of Less than S$500m
2015 2011 2009
No of Directors 3.0 12.0 6.3 6.0 3.0 12.0 6.5 6.0 4.0 16.0 6.8 6.0
No of AC Members 2.0 5.0 3.2 3.0 1.0 5.0 3.2 3.0 2.0 7.0 3.2 3.0
% of AC
Members/Directors 27.3% 100.0% 52.6% 50.0% 25.0% 80.0% 51.0% 50.0% 23.0% 83.0% 49.0% 50.0%
Catalist
2015 2011 2009
No of Directors 3.0 9.0 5.7 6.0 4.0 10.0 5.8 6.0 3.0 10.0 6.1 6.0
No of AC Members 2.0 5.0 3.1 3.0 3.0 4.0 3.2 3.0 2.0 5.0 3.2 3.0
% of AC
Members/Directors 33.3% 100.0% 56.5% 57.1% 33.0% 80.0% 56.0% 60.0% 30.0% 80.0% 54.0% 50.0%
Slide 23 of 50
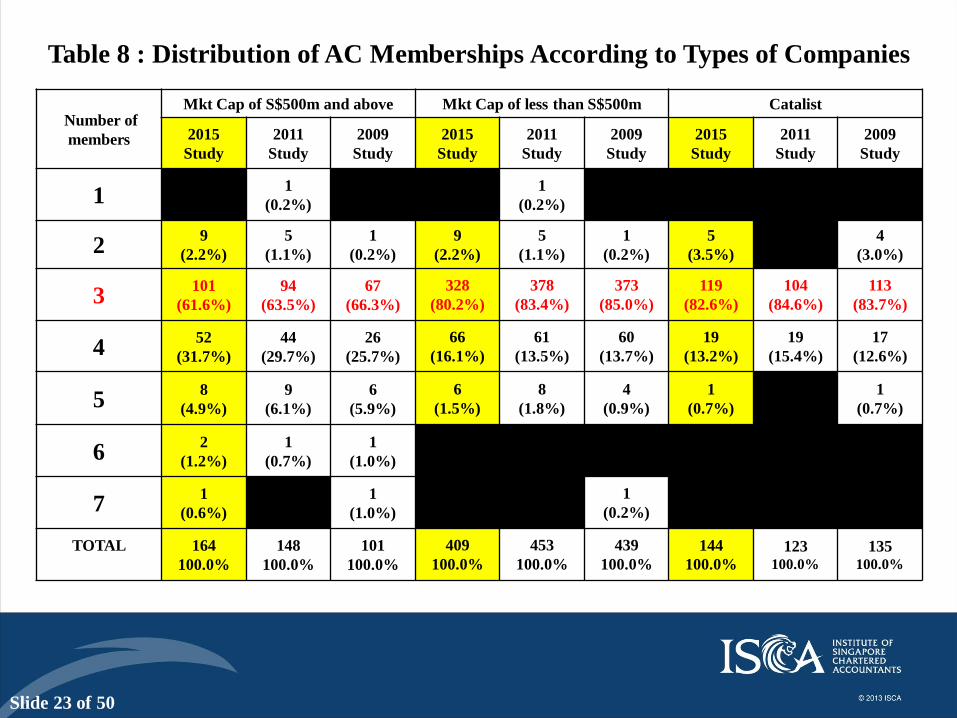
Table 8 : Distribution of AC Memberships According to Types of Companies
Number of
members
Mkt Cap of S$500m and above Mkt Cap of less than S$500m Catalist
2015
Study
2011
Study
2009
Study
2015
Study
2011
Study
2009
Study
2015
Study
2011
Study
2009
Study
1 0
(0.0%) 1
(0.2%) 0
(0.0%) 0
(0.0%) 1
(0.2%) 0
(0.0%) 0
(0.0%) 0
(0.0%) 0
(0.0%)
2 9
(2.2%) 5
(1.1%) 1
(0.2%) 9
(2.2%) 5
(1.1%) 1
(0.2%) 5
(3.5%) 0
(0.0%) 4
(3.0%)
3 101
(61.6%)
94
(63.5%)
67
(66.3%)
328 (80.2%)
378 (83.4%)
373 (85.0%)
119 (82.6%)
104 (84.6%)
113 (83.7%)
4 52
(31.7%)
44
(29.7%)
26
(25.7%)
66 (16.1%)
61 (13.5%)
60 (13.7%)
19 (13.2%)
19 (15.4%)
17 (12.6%)
5 8
(4.9%)
9
(6.1%)
6
(5.9%)
6 (1.5%)
8 (1.8%)
4 (0.9%)
1 (0.7%)
0 (0.0%)
1 (0.7%)
6 2
(1.2%)
1
(0.7%)
1
(1.0%)
0 (0.0%)
0 (0.0%)
0 (0.0%)
0 (0.0%)
0 (0.0%)
0 (0.0%)
7 1
(0.6%)
0
(0.0%)
1
(1.0%)
0 (0.0%)
0 (0.0%)
1 (0.2%)
0 (0.0%)
0 (0.0%)
0 (0.0%)
TOTAL
164
100.0%
148
100.0%
101
100.0%
409 100.0%
453 100.0%
439 100.0%
144
100.0% 123
100.0% 135
100.0%

Slide 24 of 50
Table 8 : Distribution of AC Memberships According to Types of Companies
(Overall)
Number of members Total
2015 Study 2011 Study 2009 Study
1 0
(0.0%)
1
(0.1%)
0
(0.0%)
2 14
(2.0%)
5
(0.7%)
5
(0.7%)
3 548
(76.4%)
576
(79.6%)
553
(81.9%)
4 137
(19.1%)
124
(17.1%)
103
(15.3%)
5 15
(2.1%)
17
(2.3%)
11
(1.6%)
6 2
(0.3%)
1
(0.1%)
1
(0.1%)
7 1
(0.1%)
0
(0.0%)
2
(0.3%)
TOTAL 717
100.0%
724
100.0%
675
100.0%

Slide 25 of 50
Figure 3 : Percentage of AC having Four or More Members
33.7%
14.8% 13.3%
17.3%
36.5%
15.2% 15.4%
19.6%
38.4%
17.6%
13.9%
21.6%
0%
5%
10%
15%
20%
25%
30%
35%
40%
45%
S$500m and above Less than S$500m Catalist Total
2009 Survey 2011 Survey 2015 Survey

Slide 26 of 50
Table 9 : Types of Directors in the ACs
Directors
Type
Chairmen of All
Companies
Members for All
Companies
Total for
All Companies
2015
Study
2011
Study
2009
Study
2015
Study
2011
Study
2009
Study
2015
Study
2011
Study
2009
Study
ID 706
(99.2%)
718
(99.3%)
673
(99.9%)
1302 (81.4%)
1281 (78.6%)
1186 (80.0%)
2008 (86.9%)
1999 (85.0%)
1859 (86.2%)
NED 6
(0.8%)
1
(0.1%)
1
(0.1%)
259 (16.2%)
285 (17.5%)
253 (17.1%)
265 (11.5%)
286 (12.2%)
254 (11.8%)
ED 0
(0.0%)
3
(0.4%)
0
(0.0%)
38 (2.4%)
41 (2.5%)
42 (2.8%)
38 (1.6%)
44 (1.9%)
42 (1.9%)
AD 0
(0.0%)
1
(0.1%)
0
(0.0%)
1 (0.1%)
19 (1.2%)
1 (0.1%)
1 (0.0%)
20 (0.8%)
1 (0.0%)
Others 0
(0.0%)
0
(0.0%)
0
(0.0%)
0 (0.0%)
4 (0.2%)
0 (0.0%)
0 (0.0%)
4 (0.2%)
0 (0.0%)
TOTAL 712
(100.0%)
723
(100.0%)
674
(100.0%)
1,600 (100.0%)
1,630 (100.0%)
1,482 (100.0%)
2,312 (100.0%)
2,353 (100.0%)
2,156 (100.0%)
ID – Independent Director NED – Non-Executive Director
ED – Executive Director AD – Alternate Director
Slide 27 of 50
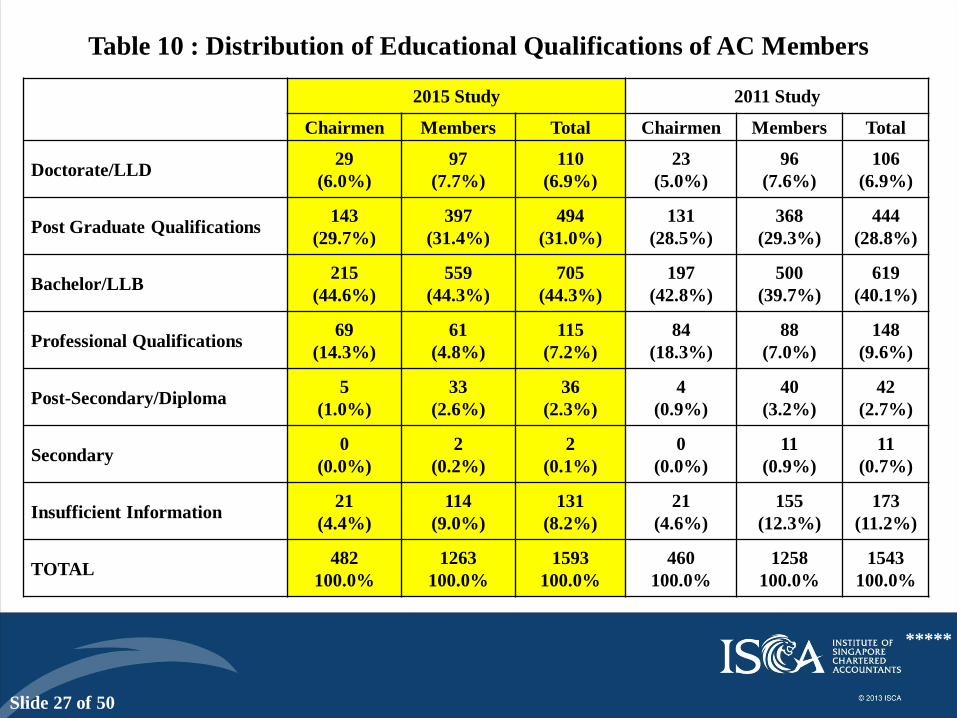
Table 10 : Distribution of Educational Qualifications of AC Members
*****
2015 Study 2011 Study
Chairmen Members Total Chairmen Members Total
Doctorate/LLD 29
(6.0%)
97
(7.7%)
110
(6.9%)
23
(5.0%)
96
(7.6%)
106
(6.9%)
Post Graduate Qualifications 143
(29.7%)
397
(31.4%)
494
(31.0%)
131
(28.5%)
368
(29.3%)
444
(28.8%)
Bachelor/LLB 215
(44.6%)
559
(44.3%)
705
(44.3%)
197
(42.8%)
500
(39.7%)
619
(40.1%)
Professional Qualifications 69
(14.3%)
61
(4.8%)
115
(7.2%)
84
(18.3%)
88
(7.0%)
148
(9.6%)
Post-Secondary/Diploma 5
(1.0%)
33
(2.6%)
36
(2.3%)
4
(0.9%)
40
(3.2%)
42
(2.7%)
Secondary 0
(0.0%)
2
(0.2%)
2
(0.1%)
0
(0.0%)
11
(0.9%)
11
(0.7%)
Insufficient Information 21
(4.4%)
114
(9.0%)
131
(8.2%)
21
(4.6%)
155
(12.3%)
173
(11.2%)
TOTAL 482
100.0%
1263
100.0%
1593
100.0%
460
100.0%
1258
100.0%
1543
100.0%

Slide 28 of 50
Table 11 : Distribution of Major Areas of Education of AC Members
*****
Educational
Discipline
2015 Study 2011 Study
Chairmen Members Total Chairmen Members Total
Accountancy 180
(37.3%)
178
(14.1%)
302
(19.0%)
171
(37.2%)
167
(13.3%)
286
(18.5%)
Finance 22
(4.6%)
67
(5.3%)
80
(5.0%)
21
(4.6%)
48
(3.8%)
62
(4.0%)
Economics 25
(5.2%)
88
(7.0%)
102
(6.4%)
29
(6.3%)
78
(6.2%)
92
(6.0%)
Management 120
(24.9%)
302
(23.9%)
388
(24.4%)
113
(24.6%)
301
(23.9%)
366
(23.7%)
Law 32
(6.6%)
199
(15.8%)
216
(13.6%)
35
(7.6%)
218
(17.3%)
235
(15.2%)
Engineering 27
(5.6%)
147
(11.6%)
165
(10.4%)
27
(5.9%)
124
(9.9%)
140
(9.1%)
Arts 13
(2.7%)
42
(3.3%)
48
(3.0%)
18
(3.9%)
57
(4.5%)
65
(4.2%)
Science 22
(4.6%)
61
(4.8%)
75
(4.7%)
19
(4.1%)
82
(6.5%)
89
(5.8%)
Others 9
(1.9%)
61
(4.8%)
70
(4.4%)
9
(2.0%)
50
(4.0%)
58
(3.8%)
Insufficient
information
32
(6.6%)
118
(9.3%)
147
(9.2%)
18
(3.9%)
133
(10.6%)
150
(9.7%)
TOTAL 482
100.0%
1,263
100.0%
1,593
100.0%
460
100.0%
1,258
100.0%
1,543
100.0%
47.1% 48.1%

Slide 29 of 50
Table 12 : Distribution of Major Full-Time Experiences of AC Members
Full-Time Experiences 2015 Study 2011 Study
Chairmen Members Total Chairmen Members Total
Accountancy/Auditing 133
(31.7%)
83
(8.2%)
187
(14.4%)
122
(26.5%)
103
(8.2%)
188
(12.2%)
Banking/Finance/Investment 138
(32.9%)
225
(22.1%)
310
(23.8%)
153
(33.3%)
265
(21.1%)
358
(23.2%)
Senior Management 98
(23.3%)
373
(36.6%)
436
(33.5%)
113
(24.6%)
507
(40.3%)
575
(37.3%)
Academia 6
(1.4%)
29
(2.8%)
32
(2.5%)
9
(2.0%)
50
(4.0%)
53
(3.4%)
Civil Service 9
(2.1%)
29
(2.8%)
33
(2.5%)
13
(2.8%)
42
(3.3%)
49
(3.2%)
Legal Practices 21
(5.0%)
174
(17.1%)
183
(14.1%)
31
(6.7%)
204
(16.2%)
217
(14.1%)
Others 8
(1.9%)
72
(7.1%)
79
(6.1%)
10
(2.2%)
56
(4.5%)
64
(4.1%)
Insufficient Information 7
(1.7%)
33
(3.2%)
40
(3.1%)
9
(2.0%)
31
(2.5%)
39
(2.5%)
TOTAL 420
(100.0%)
1,018
(100.0%)
1,300
(100.0%)
460
(100.0%)
1,258
(100.0%)
1,543
(100.0%)
64.6% 59.8%

Slide 30 of 50
Table 13 : Number of Years AC Members have been with the Companies
2015 Study 2011 Study
Chairmen Members Total Chairmen Members Total
Less than or equal
to One year
132
(18.5%)
358
(22.4%)
490
(21.2%)
86
(11.9%)
316
(19.4%)
402
(17.1%)
More than One Year
to Five Years
207
(29.1%)
519
(32.4%)
726
(31.4%)
250
(34.5%)
563
(34.5%)
813
(34.5%)
More than Five
Years to Ten Years
213
(29.9%)
409
(25.6%)
622
(26.9%)
211
(29.1%)
374
(22.9%)
585
(24.9%)
Greater than Ten
Years
150
(21.1%)
281
(17.6%)
431
(18.6%)
118
(16.3%)
220
(13.5%)
338
(14.4%)
Insufficient
Information
10
(1.4%)
33
(2.1%)
43
(1.9%)
59
(8.1%)
157
(9.6%)
216
(9.2%)
TOTAL 712
(100.0%)
1,600
(100.0%)
2,312
(100.0%)
724
(100.0%)
1,630
(100.0%)
2,354
(100.0%)

Slide 31 of 50
Table 14 : Companies which have Executive Directors in their ACs
No of
Members
in the AC
2015 Study 2011 Study
No of
Compa
nies
Proportion of
Executive Directors in
the AC Members
No of
Comp
anies
Proportion of
Executive Directors in
the AC Members
20% 25% 33% 50% 67% 20% 25% 33% 50%
1 0 0 0 0 0 0 1 0 0 0 0
2 14 0 0 0 0 0 4 0 0 0 0
3 548 0 0 18 0 0 576 0 0 28 0
4 137 0 15 0 1 0 125 0 11 0 2
5 15 3 0 0 0 0 17 1 0 0 0
6 2 0 0 0 0 0 1 0 0 0 0
7 1 0 0 0 0 0 0 0 0 0 0
TOTAL 717 3 15 18 1 0 724 1 11 28 2
Slide 32 of 50
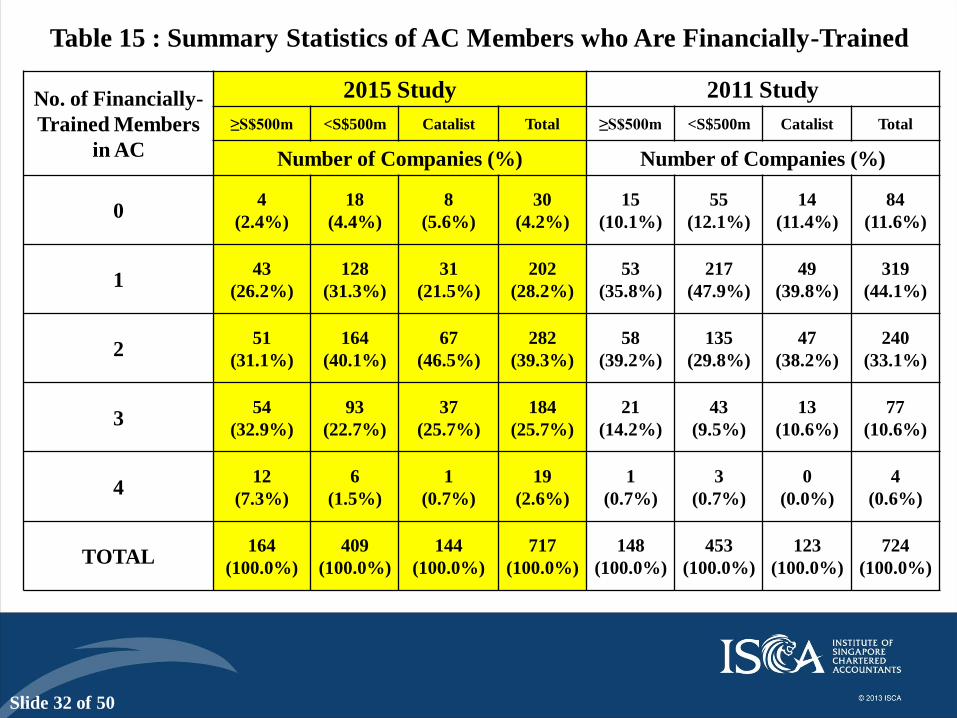
Table 15 : Summary Statistics of AC Members who Are Financially-Trained
No. of Financially-
Trained Members
in AC
2015 Study 2011 Study
≥S$500m <S$500m Catalist Total ≥S$500m <S$500m Catalist Total
Number of Companies (%) Number of Companies (%)
0 4
(2.4%)
18
(4.4%)
8
(5.6%)
30
(4.2%)
15
(10.1%)
55
(12.1%)
14
(11.4%)
84
(11.6%)
1 43
(26.2%)
128
(31.3%)
31
(21.5%)
202
(28.2%)
53
(35.8%)
217
(47.9%)
49
(39.8%)
319
(44.1%)
2 51
(31.1%)
164
(40.1%)
67
(46.5%)
282
(39.3%)
58
(39.2%)
135
(29.8%)
47
(38.2%)
240
(33.1%)
3 54
(32.9%)
93
(22.7%)
37
(25.7%)
184
(25.7%)
21
(14.2%)
43
(9.5%)
13
(10.6%)
77
(10.6%)
4 12
(7.3%)
6
(1.5%)
1
(0.7%)
19
(2.6%)
1
(0.7%)
3
(0.7%)
0
(0.0%)
4
(0.6%)
TOTAL 164
(100.0%)
409
(100.0%)
144
(100.0%)
717
(100.0%)
148
(100.0%)
453
(100.0%)
123
(100.0%)
724
(100.0%)

Slide 33 of 50
Figure 4 : Percentage of ACs with Two or More Financially-Trained Members
44.6% 43.3%
54.8% 54.1%
40.0%
48.8%
71.3%
64.3%
72.9%
0%
20%
40%
60%
80%
>= S$500m <S$500m Catalist
2009 2011 2015

Slide 34 of 50
Table 16 : Disclosure of the Terms of Reference for ACs
Section of Disclosure Frequency %
Corporate Governance Section of the Annual
Report 707 98.6%
Director Report Section of the Annual Report 7 1.0%
No Disclosure 3 0.4%
Total 717 100.0%

Slide 35 of 50
Table 17 : Description of the Roles of the ACs in the Terms of Reference
*****
Roles of AC in the Terms of Reference CG Code 2012
Guidelines
GAC 2014
Guidelines Frequency Percent
Recommend the re-appointment and
compensation of the external auditor to
the board
12.4(e) Section 6 673 93.9%
Review financial statements and
financial reporting 12.4(a) Section 4 663 92.5%
Reviewing the level of non-audit services 12.6 Section 6 673 93.9%
Review issues related to conflicts of
interest (interested persons transactions) 7.1
Section 2 :
2.2.32 – 2.2.50 643 89.7%
Review adequacy, scope, and results of
external audit 12.4(d) Section 6 638 89.0%
Review risk management controls 11.1 Section 3 627 87.4%
Review internal controls 11.3 Section 3 611 85.2%
Review adequacy, scope, and results of
internal audit 12.4(c) Section 4 555 77.4%
Slide 36 of 50
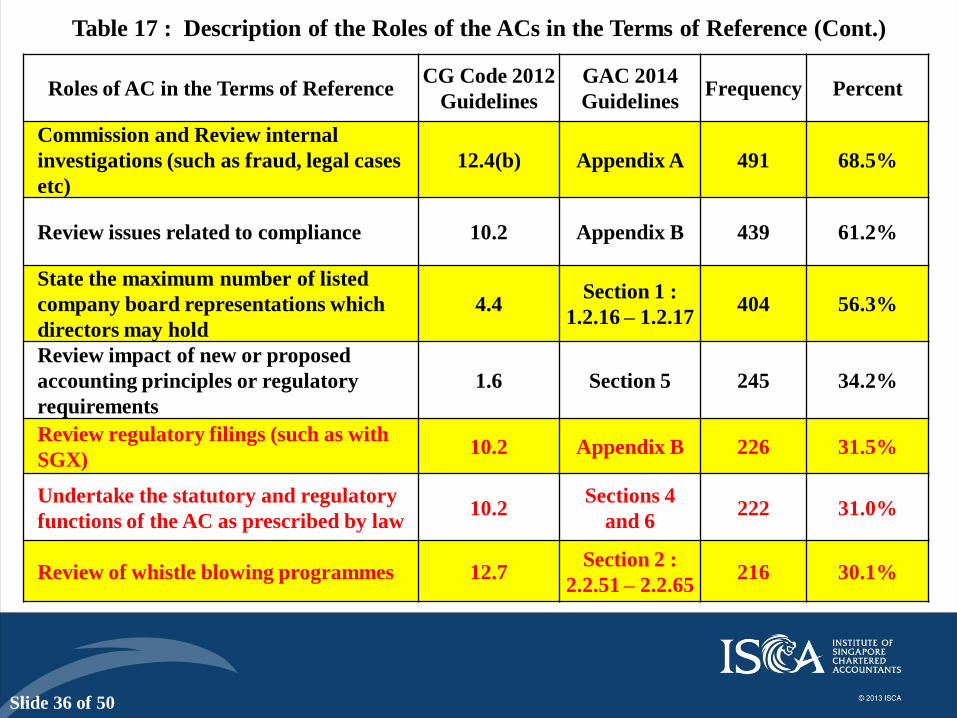
Table 17 : Description of the Roles of the ACs in the Terms of Reference (Cont.)
Roles of AC in the Terms of Reference CG Code 2012
Guidelines
GAC 2014
Guidelines Frequency Percent
Commission and Review internal
investigations (such as fraud, legal cases
etc)
12.4(b) Appendix A 491 68.5%
Review issues related to compliance 10.2 Appendix B 439 61.2%
State the maximum number of listed
company board representations which
directors may hold
4.4 Section 1 :
1.2.16 – 1.2.17 404 56.3%
Review impact of new or proposed
accounting principles or regulatory
requirements
1.6 Section 5 245 34.2%
Review regulatory filings (such as with
SGX) 10.2 Appendix B 226 31.5%
Undertake the statutory and regulatory
functions of the AC as prescribed by law 10.2
Sections 4
and 6 222 31.0%
Review of whistle blowing programmes 12.7 Section 2 :
2.2.51 – 2.2.65 216 30.1%

Slide 37 of 50
Table 18 : Distribution of the Disclosure of Auditors Fees
Auditors' Fees Percentage
Disclosure of the aggregate amount of fees paid to external
auditors 97.5%
Disclosure of the breakdown of the fees paid to the external
auditor for audit and non-audit services 95.3%
Table 19 : Disclosure of Whistle Blowing Policy
Whistle Blowing Policy Percentage
Disclosure of the existence of a whistle blowing policy 93.9%
Disclosure of the procedure to raise the concerns 37.9%

Slide 38 of 50
Table 20 : Channels for Reporting Concerns Under Whistle Blowing Policy
Channels of Reporting Percentage
AC 50.2%
Management 2.5%
Internal auditor 1.4%
Designated external party 2.9%
AC/Management 5.2%
AC / Management / Internal auditor 1.5%
AC / Internal auditor 2.0%
AC / Internal auditor / designated external party 0.1%
AC / Designated external party 0.1%
Management / Internal auditor 0.1%
No Disclosure 33.9%
Total 100.0%
Slide 39 of 50
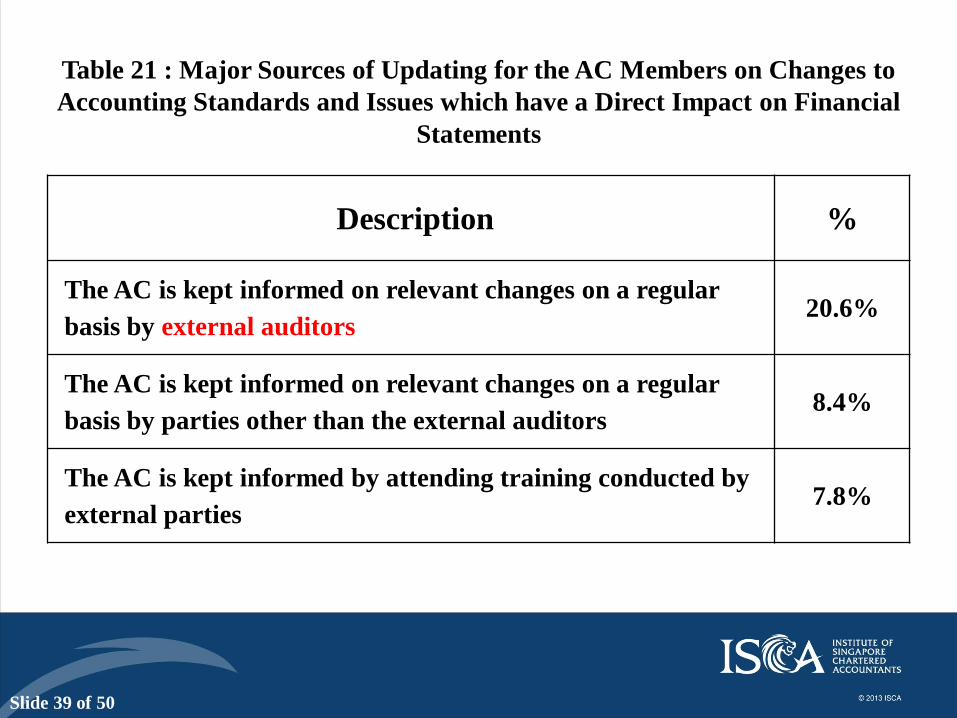
Table 21 : Major Sources of Updating for the AC Members on Changes to
Accounting Standards and Issues which have a Direct Impact on Financial
Statements
Description %
The AC is kept informed on relevant changes on a regular
basis by external auditors 20.6%
The AC is kept informed on relevant changes on a regular
basis by parties other than the external auditors 8.4%
The AC is kept informed by attending training conducted by
external parties 7.8%
Slide 40 of 50
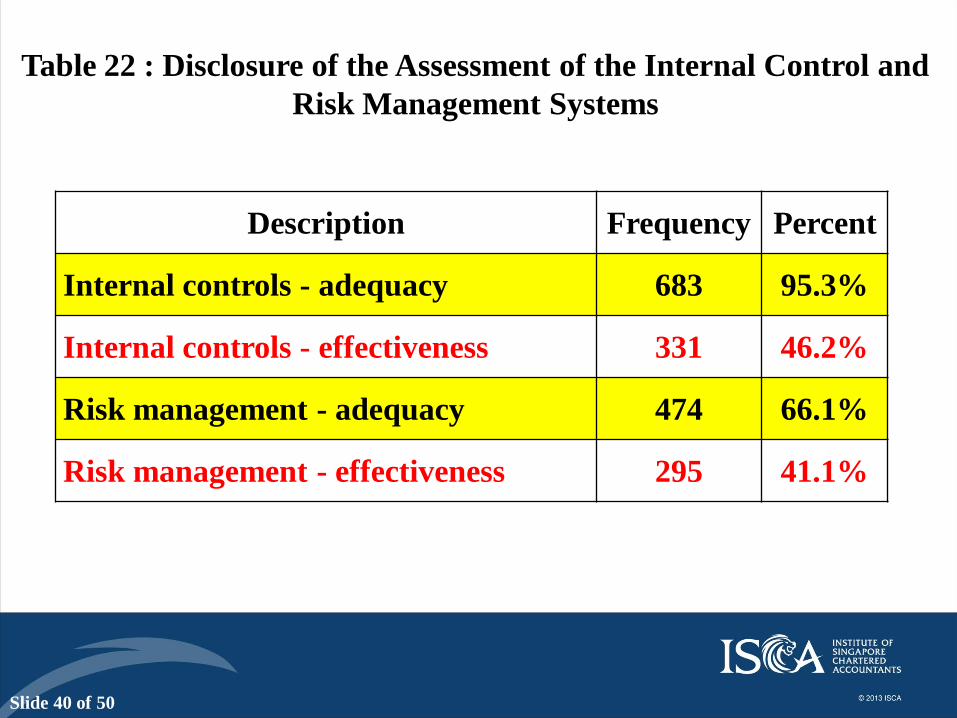
Table 22 : Disclosure of the Assessment of the Internal Control and
Risk Management Systems
Description Frequency Percent
Internal controls - adequacy 683 95.3%
Internal controls - effectiveness 331 46.2%
Risk management - adequacy 474 66.1%
Risk management - effectiveness 295 41.1%
Slide 41 of 50
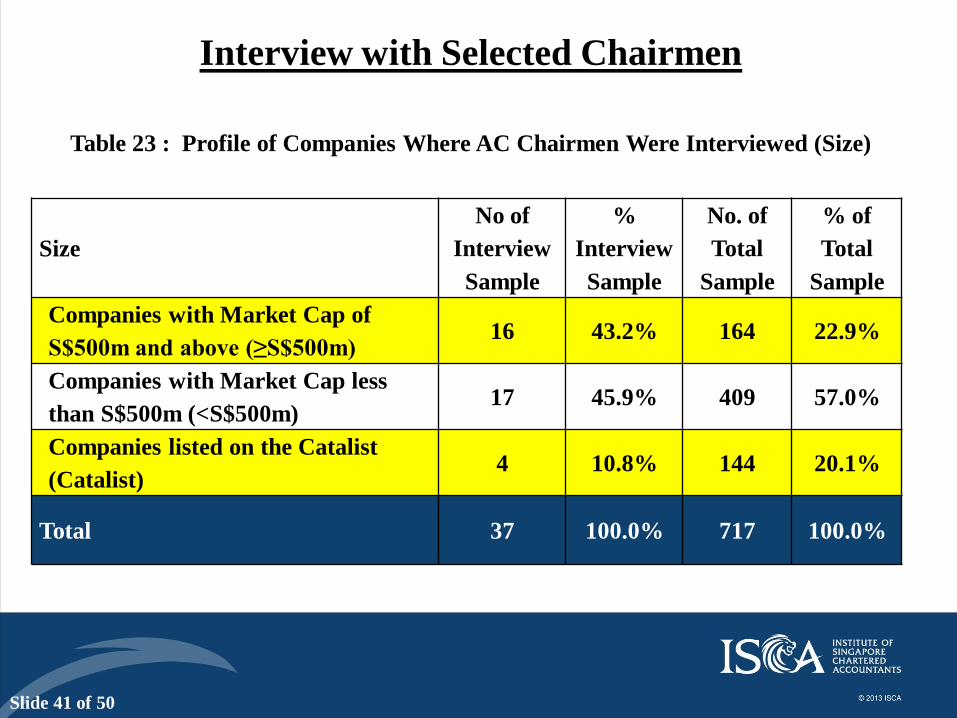
Interview with Selected Chairmen
Size
No of
Interview
Sample
%
Interview
Sample
No. of
Total
Sample
% of
Total
Sample
Companies with Market Cap of
S$500m and above (≥S$500m) 16 43.2% 164 22.9%
Companies with Market Cap less
than S$500m (<S$500m) 17 45.9% 409 57.0%
Companies listed on the Catalist
(Catalist) 4 10.8% 144 20.1%
Total 37 100.0% 717 100.0%
Table 23 : Profile of Companies Where AC Chairmen Were Interviewed (Size)

Slide 42 of 50
Interview with Selected Chairmen
Size
No of
Interview
Sample
%
Interview
Sample
No. of
Total
Sample
% of
Total
Sample
Financial Institution 6 16.2% 27 3.8%
Non-Financial 31 83.8% 690 96.2%
Total 37 100.0% 717 100.0%
Table 23 : Profile of Companies Where AC Chairmen Were Interviewed (Size)

Slide 43 of 50
Coverage of Interview with Selected Chairmen
1. Composition of the AC
2. Appointment of external auditors and audit
quality
3. Emerging scope of Audit Committee
4. Coping with changing requirements and
market innovations

Slide 44 of 50
• AC is the heavy duty (work horse) committee
• Small and large listed Companies ACs have very different
challenges (resource constraints, risk, manpower etc)
• Tone at the top and a strategic partner rather than just a
watch dog.
• Difficulties of ever increasing demands of regulations
• Directors’ fees for risk bearing is too low.
General Comments and Opinions

Slide 45 of 50
• Desirable characteristics:
able to articulate their views, technical knowledge, financial literacy, industry experiences, team players, different
viewpoints, independent, willing to speak out, holistic understanding of the business, dedication, ability to question
judgement, having moral courage or boldness
• Ability to speak independently
• Trust, independence, conducive environment, communication
• Diversity in the experiences, views and expertise
• Industry relevant knowledge and experiences
• One knowledgeable in financial reporting / professional accountant
• Current and relevant financial knowledge
• 9-year independent rule is arbitrary
• 9-year rule : Good reminder for succession planning and deliberate
reminder to review the independence of members
• 9-year rule : Go against the need for corporate memories and
experiences not going through one business cycle
Composition of Audit Committee

Slide 46 of 50
• Not necessary to publish selection and re-appointment criteria
• Criteria for selection :
technical competency of the auditing partner, timely completion of the audit engagement, quality
of feedback on the audit, ability of the auditors to work with the management, thoroughness and
quality of the audit, relevant industry experiences, ability to communicate with the AC,
management and Board
• Reputation and prior experiences and the audit partner
• Quality then fees (2-envelops approach) but for small companies fees is
very important.
• AC to be more involved in selection of auditors
• Luke warm : audit partners and firm rotation, limitation of non-audit
services, mandatory re-tendering and enhanced audit report (more
acceptable for NAS)
• Re-tendering can be a race to the bottom for fees.
Appointment of External Auditors and Audit Quality

Slide 47 of 50
• Enhanced Audit Report – Key Audit Matters
Concern about the fallout – change in relationship
Misunderstanding by shareholders
More fees and management, AC and Board’s time
• NAS can be problematic as the current audit fees is low.
Appointment of External Auditors and Audit Quality
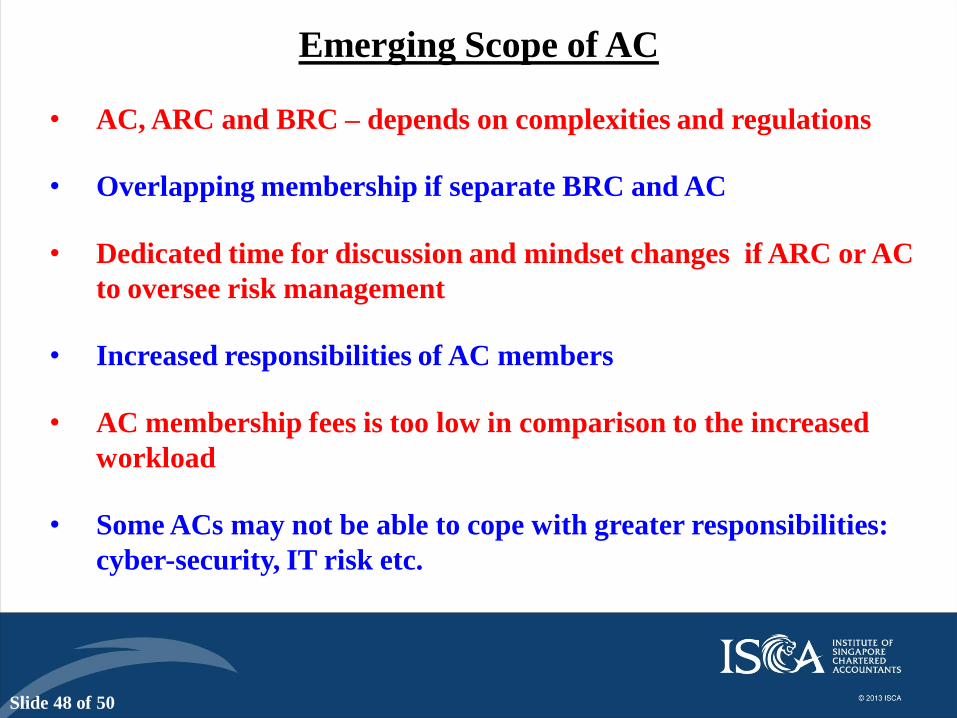
Slide 48 of 50
• AC, ARC and BRC – depends on complexities and regulations
• Overlapping membership if separate BRC and AC
• Dedicated time for discussion and mindset changes if ARC or AC
to oversee risk management
• Increased responsibilities of AC members
• AC membership fees is too low in comparison to the increased
workload
• Some ACs may not be able to cope with greater responsibilities:
cyber-security, IT risk etc.
Emerging Scope of AC

Slide 49 of 50
• Importance of Internal Audit
• Outsource IA for smaller companies
• Need to “protect” IA – reporting line, performance
evaluation, proper governance
• Greater professionalisation of IA
• Risk-based IA rather than the traditional compliance or
box-ticking IA
• IA as strategic partner rather than a mere policeman
Emerging Scope of AC

Slide 50 of 50
• Keeping current is a personal responsibility
• Degrees of preparation and plans to cope with changing
landscape is very much dependent upon the “size” of the
companies.
• Too many changes can distract management and AC from
their real responsibilities and work.
Coping with Changing Requirements and Market Innovations

Slide 51 of 50
• AC is a very important monitoring mechanism
• The AC landscape in Singapore has all the right expectations
and requirements
• Significant progresses had been made since 2009 on almost all
fronts but signs of plateauing.
• High degree of compliance and the regulations and guidelines
have positive effects on companies’ practices
• Companies making full use of new appointments to further
calibrate the manpower needs of ACs
• Lukewarm about some of the audit innovations
Conclusion
fb.com/ISCA.Official
http://www.linkedin.com/company/institute-of-singapore-chartered-accountants-isca-
@ISCA_Official

This Presentation (the Presentation) has been prepared by ISCA for the exclusive use
of the recipients to whom it is addressed.
Each recipient agrees that it will not permit any third party to, copy, reproduce or
distribute to others this Presentation, in whole or in part, at any time without the prior
written consent of ISCA, and that it will keep confidential all information contained
herein not already in the public domain.
The Preparers expressly disclaim any and all liability for representations or warranties,
expressed or implied, contained in, or for omissions from, this Presentation or any other
written or oral communication transmitted to any interested party in connection with this
Presentation so far as is permitted by law. In particular, but without limitation, no
representation or warranty is given as to the achievement or reasonableness of, and no
reliance should be placed on, any projections, estimates, forecasts, analyses or forward
looking statements contained in this Presentation which involve by their nature a
number of risks, uncertainties or assumptions that could cause actual results or events
to differ materially from those expressed or implied in this Presentation.
In furnishing this Presentation, the Preparers reserve the right to amend or replace this
Presentation at any time and undertake no obligation to update any of the information
contained in the Presentation or to correct any inaccuracies that may become apparent.
This Presentation shall remain the property of ISCA.
Important disclaimer