a study of academic entrepreneurs using venture capital data · a study of academic entrepreneurs...
TRANSCRIPT

IZA DP No. 2992
A Study of Academic EntrepreneursUsing Venture Capital Data
Junfu Zhang
DI
SC
US
SI
ON
PA
PE
R S
ER
IE
S
Forschungsinstitutzur Zukunft der ArbeitInstitute for the Studyof Labor
August 2007

A Study of Academic Entrepreneurs
Using Venture Capital Data
Junfu Zhang Clark University
and IZA
Discussion Paper No. 2992 August 2007
IZA
P.O. Box 7240 53072 Bonn
Germany
Phone: +49-228-3894-0 Fax: +49-228-3894-180
E-mail: [email protected]
Any opinions expressed here are those of the author(s) and not those of the institute. Research disseminated by IZA may include views on policy, but the institute itself takes no institutional policy positions. The Institute for the Study of Labor (IZA) in Bonn is a local and virtual international research center and a place of communication between science, politics and business. IZA is an independent nonprofit company supported by Deutsche Post World Net. The center is associated with the University of Bonn and offers a stimulating research environment through its research networks, research support, and visitors and doctoral programs. IZA engages in (i) original and internationally competitive research in all fields of labor economics, (ii) development of policy concepts, and (iii) dissemination of research results and concepts to the interested public. IZA Discussion Papers often represent preliminary work and are circulated to encourage discussion. Citation of such a paper should account for its provisional character. A revised version may be available directly from the author.

IZA Discussion Paper No. 2992 August 2007
ABSTRACT
A Study of Academic Entrepreneurs Using Venture Capital Data*
Academic entrepreneurship has become an increasingly important channel through which universities contribute to economic development. This paper studies academic entrepreneurs using a comprehensive venture capital database. I find that about two-thirds of the academic entrepreneurs locate their businesses in the same state as their universities. National academy membership and number of faculty awards, measures of a university’s research quality, are the most significant variables in explaining the number of academic entrepreneurs from a university. In contrast, the abundance of venture capital near the university has no significant effect on academic entrepreneurship. JEL Classification: M13 Keywords: academic entrepreneur, university spin-off, venture capital Corresponding author: Junfu Zhang Department of Economics Clark University 950 Main Street Worcester, MA 01610 USA E-mail: [email protected]
* I would like to thank Nikesh Patel, whose careful and patient work on data coding has been tremendously helpful. This paper has benefited from the comments by Jon Haveman, Martin Kenney, Young-Choon Kim, Josh Lerner, Ting Lu, David Neumark, Xue Song, Michael Teitz, Rob Valletta, Brandon Wall, Peyton Young, and seminar participants at the Public Policy Institute of California, the Center for Globalization and Information Technology at the University of California at Berkeley, the Technology Transfer Society 26th Annual Conference in Albany, New York, the 26th Annual Research Conference of the Association for Public Policy Analysis and Management (APPAM) in Atlanta, Georgia, and the Department of Economics at California State University, Hayward.

1. Introduction
This paper studies business founders who have worked at universities. I call these
founders academic entrepreneurs, and their firms university spin-offs (USO). I seek to
answer the following questions: What is the academic background of these
entrepreneurs? What industries do they enter? Do they locate their businesses close to
their universities? And most importantly, which types of universities tend to generate
academic entrepreneurs?
Entrepreneurship among academics is by no means a new phenomenon.
Professorial entrepreneurs played an important role in creating the U.S. biotechnology
industry (Kenney, 1986a, 1986b). Today’s biotech industry leaders such as Genentech,
Amgen, Biogen Idec, and Chiron were all founded or co-founded by university
professors.1 The information technology industries, though more famous for college-
dropout entrepreneurs such as Bill Gates, Steve Jobs, and Michael Dell, also provide
many examples of academic entrepreneurs: The legendary personal computer software
pioneer Gary Kildall, whose CP/M operating system dominated the personal computer
industry in the early years, was once an instructor at the Naval Postgraduate School in
Monterey, California. Silicon Valley’s most famous serial entrepreneur Jim Clark, the
founder of Silicon Graphics, Netscape, Healtheon, myCFO, and Shutterfly.com, started
his career as a professor at UC Santa Cruz and later Stanford University. Michael
Mauldin, a computer scientist at Carnegie Mellon University, founded Lycos, one of the
leading Internet search engines.2
Academic entrepreneurs caught scholarly attention primarily in two closely
related contexts. First, academic entrepreneurs are viewed as important players in the
process of technology transfer from university to industry. A great deal of knowledge
created at universities is tacit and uncodifiable, and the dissemination of such knowledge
requires direct interpersonal contact. For this reason, moving people is believed to be the
most effective way to move knowledge (Allen, 1984). Thus the movement of university
1 Biogen Idec was formed by a merger between Biogen and IDEC Pharmaceuticals, both originally founded by academic entrepreneurs. Two of Biogen’s founders, Walter Gilbert and Phillip Sharp, later won the Nobel Prize. 2 It is well known that popular Internet search engines Yahoo! and Google both grew out of Stanford. But they were founded by students instead of university employees and thus not considered as university spin-offs by the definition used here.
1

employees to industry creates an important channel for technology transfer (Samson and
Gurdon, 1993; Zucker et al., 2002).3 Understanding academic entrepreneurship and
university spin-offs is therefore an important part of the research agenda on technology
transfer.
Second, studying academic entrepreneurs helps us understand the role of research
universities in regional economic development. It is well recognized that universities
such as Stanford and MIT played a crucial role in the development of regional high-tech
economies, partly through spinning off technology companies (Saxenian, 1994; Zhang,
2003). A growing literature has studied the link between academic entrepreneurship and
regional development. Audretsch and Stephan (1996) find that when biotech companies
are founded by university-based scientists, their founders tend to be local. Recent
research by Zucker and Darby and coauthors (e.g., Zucker, Darby, Armstrong, 1998;
Zucker, Darby, Brewer, 1998) show that “star scientists” have a significant impact on the
timing and location of the formation of biotechnology companies. Shane (2004) is a
comprehensive study of academic entrepreneurship primarily based on data from MIT,
often considered one of the most successful research institutions in spawning technology
companies. Feldman (1994), on the other hand, studies why a top research university
such as Johns Hopkins contributes little to the local economy through academic
entrepreneurship and knowledge spillovers.
Given the value of studying academic entrepreneurs, scholars resort to various
sources of data to conduct research in this area. Depending on the data at hand,
researchers often invoke very different definitions of academic entrepreneurship and
university spin-offs. (See Pirnay et al., 2003 for a typology of university spin-offs.)
Klofsten and Jones-Evans (2000) use a very broad definition of academic
entrepreneurship that covers not only new firm formation but also consulting and patent-
seeking activities of academics. In Stuart and Ding (2004), an academic entrepreneur may
only serve on the scientific advisory board of a startup.4 In several studies, Scott Shane
and co-authors investigate “university spin-offs” as start-ups exploiting university
3 As quoted by Zucker et al. (2002), former Stanford president Donald Kennedy once observed that “technology transfer is the movement of ideas in people.” 4 In an early study of life scientists, Louis et al. (1989) even considered engaging in externally funded research and earning supplemental income as academic entrepreneurship.
2

inventions but not necessarily founded by university employees (e.g., Shane and Stuart,
2002; Di Gregorio and Shane, 2003; and Nerkar and Shane, 2003).5 These studies,
though related to this work, do not address exactly the same questions.6
When defining university spin-offs as firms founded by academic entrepreneurs
affiliated with a university, researchers apparently face a data constraint. As a result, they
often focus on a small number of universities and rely on case studies or small-scale
survey data. McQueen and Wallmark (1982) study spin-off companies from the Chalmers
University of Technology in Sweden. Smilor et al. (1990) examine technology start-ups
from the University of Texas at Austin. Using personal interviews, Steffensen et al.
(2000) analyze six spin-off companies from the University of New Mexico. Kenney and
Goe (2004) use survey and Internet data to compare “professorial entrepreneurship” at
UC Berkeley and Stanford.
Lowe and Gonzalez-Brambila (2005) and Toole and Czarnitzki (2005) are
perhaps the only studies that use a definition of academic entrepreneurs similar to mine
and rely on systematic analysis of relatively large databases. Lowe and Gonzalez-
Brambila identify 150 “faculty entrepreneurs” in 15 academic institutions and investigate
whether entrepreneurial activities affect their research productivity. Toole and Czarnitzki
identify 337 academic entrepreneurs by matching the National Institute of Health (NIH)
researcher database with data from the U.S. Small Business Innovation Research (SBIR)
program. They find that firms linked to academic scientists show a better performance in
terms of receiving follow-on venture capital investment, completing SBIR program, and
filing patent applications.
In this paper, I employ a comprehensive venture capital database to study
academic entrepreneurs. This database tracks all venture-backed start-ups in the United
States and has detailed firm-level information. In addition, it contains biographical
information about a large number of start-up founders, which makes it possible to
identify whether a founder has ever worked for a university. By focusing on venture-
backed firms, I am excluding a large proportion of new businesses founded by academic 5 Data on companies founded to exploit MIT intellectual property during 1980-1996 shows that about one third of them have the university inventor as the lead entrepreneurs (Shane, 2004, pp. 6-7). 6 There is also literature that studies spin-offs from existing companies that pays more attention to the process of business creation rather than technology transfer. See, for example, Klepper (2001) and Gompers et al. (2005).
3

scientists.7 However, venture-backed start-ups often possess the greatest growth potential
and may have a much greater effect on the economy than their share implies. In addition,
the richness of the data, enhanced by information from various other sources, allows one
to study academic entrepreneurs across industries and universities, which previous
studies were unable to do.
I find that entrepreneurial activities among university employees concentrate in
biotechnology and information technology industries. About two-thirds of the venture-
backed university spin-offs are located in the same state as the universities. National
academy membership and total faculty awards, measures of a university’s research
quality, are the most significant variables in explaining the number of spin-offs at the
university level. Although I focus on venture-backed start-ups, the abundance of local
venture capital has no significant effect on the number of spin-offs from the university,
which is rather surprising.
The rest of the paper is organized as follows: Section 2 describes the venture
capital data used in this study. Section 3 presents some descriptive statistics, including
the specialty, industry, business location, and academic affiliation of venture-backed
academic entrepreneurs. Section 4 analyzes why some universities generate more
venture-backed entrepreneurs than others. And finally, section 5 offers some concluding
remarks.
2. Data
VentureOne, a leading venture capital research company based in San Francisco,
provided the data used in this study. Founded in 1987, VentureOne has been continuously
tracking equity investment in the United States and abroad. It collects data by regularly
surveying venture capital firms for recent funding activities and portfolio updates,
gathering information through direct contacts at venture-backed companies, and scouring
various secondary sources such as company press releases and IPO prospectuses
7 According to the survey conducted by Association of University Technology Managers (2005, pp. 28), 85 (18.6%) of 458 start-ups licensing technology from U.S. research institutions (including research hospitals and research institutes) received venture capital financing. Data on companies founded to exploit MIT intellectual property during 1980-1996 indicates that venture capitalists and angel investor groups helped finance 30% of these companies (Shane, 2004, pp. 236).
4
(VentureOne, 2001). VentureOne intends to capture all the venture-backed companies in
the United States and their early-stage financing events.8
For each deal, VentureOne keeps a record of its size, stage of financing, closing
date, the venture capital firms involved, and detailed information about the firm that
receives the money, including its address, founding year, industry, and so on. In addition,
VentureOne tracks the venture-backed company and updates the information about its
employment, business status, ownership status, etc. VentureOne claims that they have
“the most comprehensive database on venture backed companies.”9 While VentureOne’s
database is maintained for commercial purposes, its rich information has attracted many
academic researchers. Some recent empirical work, such as Gompers and Lerner (2000),
Cochrane (2005), Gompers et al. (2005), and Zhang (2003, 2007), has used VentureOne
data.
The version of the data used in this study covers venture capital deals completed
in the United States from the first quarter of 1992 through the fourth quarter of 2001. It
includes 22,479 rounds of financing, which involved 11,029 firms. Among these firms,
83.5% were founded in or after 1990. VentureOne categorizes venture-backed firms into
16 “industry segments.” Table 1 presents venture capital investment in each industry
during 1992-2001. On the top of the list are all Internet-related industries, including
communication, software, consumer/business services, and information services.
Together, these four industries account for 71.3% of the total venture capital investment
over the decade. Venture capital investment also tends to concentrate geographically. As
shown in Table 2, California alone received 44.1% of the U.S. total; Massachusetts, a
distant second, received about 10% of the U.S. total. The top ten states together absorbed
82.5% of the U.S. venture capital investment.10
8 VentureOne defines a venture capital firm as “a professional, institutional venture capital limited partnership that generally manages over $20 million in assets and invests in privately held companies” (VentureOne, 2000). Once a company receives some investment from venture capital firms, it becomes a “venture-backed company” and enters the VentureOne database. Once in the database, VentureOne tracks the company’s financing from all sources, including bank loans and IPO. While I do not count bank loans or money raised through an IPO as venture capital, I do include equity investment made by non-VC corporations or “angel investors” as venture capital in my calculations. 9 See http://www.ventureone.com/products/venturesource.html (accessed on January 18, 2007). 10 To put this into perspective, in 2004, 55.5% of the U.S. GDP came from the top ten states.
5

VentureOne also provided a separate data set containing information about
venture-backed firm founders. However, the founder data are incomplete: Founder
information is available for 5,972 of the 11,029 venture-backed firms.11 Because many
firms are co-founded by more than one individual, I end up with a total of 10,530
individual founders.
The availability of founder information is not entirely random, which stems from
VentureOne’s database management practice. A firm enters VentureOne’s database once
it receives equity investment from a venture capital firm. VentureOne regularly updates
the information about the venture-backed firm until it ceases operation, is acquired, or
goes public.12 Therefore, VentureOne will follow some firms longer than others.
VentureOne is more likely to obtain a firm’s founder information if the firm has been
followed longer. VentureOne also appears to be more likely to capture founder
information for firms founded in the late 1990s, possibly because these firms tend to
reveal a lot of company and founder information at their websites. For example, among
firms with founder information available, 20.5% were founded before 1995; for the rest,
62.4% were founded before 1995. Indeed, firms with founder information tend to be
privately held, and are less likely to be out of business, to be acquired, or to complete an
initial public offering (IPO), which is consistent with the fact that they are younger. In
subsequent work, I will focus on firms with founder information. As long as this sample
selection is independent of whether or not a founder is an academic entrepreneur, my
results will not be biased.
For each founder, there is a data field containing brief biographical information of
the person. It describes the founder’s working experiences, which, in most cases, not only
specifies the companies or institutions a founder worked for but also includes the position
held. Because VentureOne did not code founders’ biographical information, I started by
carefully reading this field. In particular, I constructed a variable to indicate whether an
individual previously worked for a university or college.13 If so, values are assigned to a
11 For an additional 387 firms, some non-biographical information about the founder is available, but these data are not useful to identify academic entrepreneurs. 12 For VentureOne’s research methodology, see http://www.ventureone.com/ii/research.html (accessed on January 18, 2007). 13 Some founders’ bio indicated a working experience at some research lab or research center that may or may not belong to a university. I search the Internet to investigate whether the lab or research center is
6

set of variables including the name of the institution, the job position (if indicated), the
person’s specialty (if identifiable), and the state where the institution is located. For a
small group of people who had worked at more than one academic institution, only the
latest academic position is counted.
An academic entrepreneur’s specialty is not always identifiable in the data. For
example, an entrepreneur’s biographical sketch could read like this: “professor, Johns
Hopkins University.” In this case, the “specialty” field is left blank. Most cases provide
more information, for example: “professor, Department of Computer Science, Carnegie
Mellon University,” or simply “professor of chemistry, Stanford University,” which
clearly indicates this person’s specialty.
The firm data and the founder data share a common variable, “EntityID,” by
which I can match a firm with its founder when founder information is available. Using
this rich data set, I can characterize academic entrepreneurs along many dimensions with
simple descriptive statistics.
3. Descriptive Statistics on Academic Entrepreneurs
This section describes the specialties and academic affiliations of academic
entrepreneurs and summarizes the industry and business locations of the university spin-
offs they founded.
Among the 10,530 venture-backed firm founders in the VentureOne data, 903 had
worked for academic institutions, which account for 8.6% of the total.14 These 903
individuals founded or co-founded 704 venture-backed firms, and 35 of them founded
more than one firm.
3.1 Positions in academic institutions
associated with some university. If it is (e.g., Lincoln Laboratory of MIT), the founder is counted as an academic entrepreneurs. Otherwise (e.g., Lawrence Livermore National Laboratory), the founder is not considered an academic entrepreneur. 14 There are 23 entrepreneurs whose biographical information contains university names, but they were “research assistants,” “Ph.D. students,” or “post-doc fellows” and did not hold formal job positions at universities. I excluded these founders from the group of academic entrepreneurs. One might argue that post-doc founders should be counted as academic entrepreneurs. However, because VentureOne often collects founders’ biographical information from secondary sources such as company websites where a post-doc experience may not be significant enough to be mentioned, it is possible that the database fails to identify many post-doc founders. In that case, it makes more sense to exclude them all. Given that the number of post-doc founders is so small, it does not matter how I treat them.
7

Table 3 summarizes the positions these academic entrepreneurs held at
universities. Note that these could reflect either current or former posts. The VentureOne
data do not indicate whether a firm founder has or has not given up his or her position in
a university. Ample anecdotal evidence suggests that professors usually retain their
academic positions when they start firms; yet non-tenure track employees may have to
quit if they choose to be entrepreneurs.
As Table 3 shows, nearly two thirds of the entrepreneurs from universities are
professors. Most people in this group are self-identified as professors. A few of them are
“dean” or “chairman” of some academic departments, which are undoubtedly also
professors. So these entrepreneurs are categorized into the professor group instead of the
executive group.
The second largest group (close to 16% of the total) is research scientists at
universities. These individuals usually identified themselves as researchers at university
laboratories. It is likely that they did not hold tenure track positions and it is impossible to
tell from the data whether they also do some teaching.
The third group identify themselves as “directors.” This group overlaps with some
of the other groups. For example, the director of a research lab is likely to be a professor
or a research scientist; on the other hand, the director of the department of continuing
education in a university could be an executive. Instead of using subjective judgment to
assign these people to other groups, they are analyzed as a separate group.
The professor and research scientist groups constitute 78.2% of all entrepreneurs
with a prior university affiliation. The proportion rises to 86.1% when directors are
included. This implies that around 80% of these entrepreneurs held research positions at
academic institutions. Most likely, they started new businesses in order to commercialize
their own research findings.
The executive and the lecturer/instructor positions are also self-identified, with
the latter likely to be non-tenure track temporary teaching jobs. Finally, all other
positions are combined into the “other” group, which includes technicians, programmers,
and other staff members in various academic or administrative departments at
universities.
8

Among the 903 academic entrepreneurs, 669 have identifiable specialties. Table 4
describes the distribution of these individuals by specialty. As Table 1 shows, venture
capital investment is overwhelmingly concentrated in high-tech industries. So it is not
surprising that most of the academic entrepreneurs have an engineering or science
background. More than 45% (304) specialize in engineering, among which 186 could be
identified as experts in computer science or electrical engineering. Another 44% of
academic entrepreneurs specialize in medical sciences, biological sciences, or chemistry.
Obviously, computer industries and medical/biological industries attracted most of the
academics.
While anecdotal evidence suggests that in the 1990s many business students
considered entrepreneurship a desirable career track, the data show that business
professors also followed the trend. In fact, they form the largest non-scientist/engineer
group among academic entrepreneurs. The “other” group represents a wide range of
specialties, including for example architecture, economics, physics, psychology, and
statistics. Social sciences and humanities are under-represented, with fewer than ten of
the academic entrepreneurs from such disciplines. Of course, academics in social
sciences and humanities may not be so much less entrepreneurial as this difference
implies. It is quite possible that many of them also start businesses, but they are not
backed by venture capital and thus not captured in the VentureOne data.
3.2 Distribution across industries
Table 5 presents the distribution of all entrepreneurs and academic entrepreneurs
across industries. Overall there are 10,530 entrepreneurs in this version of the
VentureOne data. More than three-fourths of these entrepreneurs (8,033 or 76.3% of the
total) are in the software, consumer/business services, communication, and information
services industries. In contrast, Table 1 indicates that only 64.2% of venture-backed
companies belong to these four industries. This discrepancy stems from two facts: First,
founder information is available for a higher proportion of companies in these industries;
and, second, an average company in these industries has more co-founders.
The 903 academic entrepreneurs constitute 8.6% of the total number of
entrepreneurs. The percentage of academic entrepreneurs varies substantially across
industries. While more than 40% of the entrepreneurs in the biopharmaceutical industry
9
have worked for universities, only 3.1% of the firm founders in the consumer/business
services industry are academic entrepreneurs. Each of the four largest industries has a
below-average proportion of academic entrepreneurs.
The biopharmaceutical industry has the largest number of academic
entrepreneurs. The second largest group of academic entrepreneurs is in the software
industry. Together, these two industries account for more than half of the 903 academic
entrepreneurs. In terms of the total number of entrepreneurs, the software industry is
almost five times as large as the biopharmaceutical industry (2,963 vs. 618). However,
the biopharmaceutical industry attracted more academic entrepreneurs than the software
industry (252 vs. 226). In fact, the proportion of academic entrepreneurs in the software
industry is below average.
The biopharmaceutical industry truly stands out in that 40.8% of the venture-
backed entrepreneurs in this industry are from universities. If we look at companies
founded by academic entrepreneurs, the proportion is even more striking: 51.3% (182 out
of 355) of the venture-backed biopharmaceutical companies are university spin-offs.
Other major industries (with more than 100 entrepreneurs in the sample) over-represented
by academic entrepreneurs include the medical information service (17.9%) and medical
device (14.7%) industries.
Academic entrepreneurs have such a high tendency to start businesses in the
biopharmaceutical industry that it calls for some explanation. A few possible reasons may
account for this phenomenon.
1) Marketability of technology. In general, whether an inventor benefits from
his/her invention depends on whether it is easily marketable. If there is ready market
demand for the technology, such as in the case of Nobel’s dynamite, the inventor will see
the economic value right away and try to capture it. On the other hand, if there is no
immediate market value, such as in the cases of the personal computer and Internet, the
inventor often misses the chance to reap the economic benefit. In these situations, it
usually takes one or several entrepreneurs rather than the inventor to bring the technology
to the market, and it is the entrepreneurs who are financially rewarded. For example,
personal computers hardly found any buyers when the technology first became available.
IBM, Hewlett-Packard, and DEC all missed the chance to first mass-market personal
10

computers, although they were in a better position than anybody else. It took Steve Jobs,
not the inventor, to found the Apple Computer to establish the enormous PC market.
In the case of biotech and medical research, applications in the healthcare industry
have long become well known. Biotechnology did not create its own demand; it helps
serve the multi-billion-dollar market that already exists for medicinal drugs.15 Since the
market awaits technological breakthroughs, it is very likely that the inventors themselves
(professors) will see the economic value of biotechnology and seek to realize it. While
existing market demand for more effective drugs is salient, biotechnology may have
some other not-so-obvious applications. If some of those applications are carried out in
the future, it is likely that non-academic entrepreneurs, rather than university professors,
will make it happen.
2) Diffusion of technology. Biotechnology is sophisticated, not easily codifiable,
and well protected by patent law. All these features determine that the diffusion of
biotechnology is relatively slow. And therefore, for a long time, only the inventor of a
new technology (very likely a university researcher) and others involved in making the
technological breakthrough are in a position to commercialize it. This is in sharp contrast
to the situation in other technology industries. For example, during the Internet boom, the
core technology of many dot-coms, such as Amazon.com and eBay, was no more than an
innovation in usability. Such ideas can be understood and imitated by many people
outside the academic world, which is not the case with complex biotech products.
3) Asymmetric information and signaling. Most startups in biotech will remain
unprofitable over a long horizon.16 It first takes years to develop a viable biotech product;
and then many of these products are subject to a lengthy approval process by the Food
and Drug Administration (FDA).17 Therefore, investment in biotech is highly risky.
Related to this risk is an asymmetric information problem between entrepreneurs and
investors: Entrepreneurs know more than investors about just how risky a proposed
15 In 2005, the U.S. spent approximately $2 trillion ― 16.0% of its GDP ― on health care, of which $200.7 billion goes to purchase prescription drugs. See http://www.cms.hhs.gov/NationalHealthExpendData/downloads/tables.pdf (accessed on January 18, 2007). 16 For example, I examined the 72 biotech firms that were included in the NASDAQ Biotech Index as of December 2002. Their median founding year was 1990, and by 2002, their average age was 12.6 years. Yet, even among these most successful biotech firms, only 12 were making a profit in 2002. Only 25 had enough total revenue to cover R&D expenditure and 31 spent more than 200% of total revenue on R&D. 17 The median duration of successful clinical trials is six years (Zhang and Patel, 2005, p. 13).
11
project might be and it is extremely difficult for investors to acquire the knowledge to
fully evaluate the blueprint of a biotech start-up.18 In this situation of asymmetric
information, venture capitalists must base their investment decisions partly on their faith
in the entrepreneurs. On the other side, entrepreneurs want to send signals to investors
revealing the long-term value of their ideas. Naturally, a record of outstanding work in
hard science will be the most convincing evidence that the entrepreneur knows the true
value of the proposed idea and has the ability to implement it. At the same time, venture
capitalists know they will earn their money back by selling a start-up to the public
through an IPO even before the firm becomes profitable. But how do they convince the
public that a currently unprofitable start-up is valuable? Again, an established scientist
will be a very important selling point. If this is how venture capitalists evaluate proposals
of biotech start-ups, prominent scientists (mostly university professors) have a much
better chance than others to pass the screening process.
3.3 Academic location vs. business location
An important question regarding academic entrepreneurs is whether they locate
their businesses close to their academic institutions. In other words, to what extent is
knowledge transfer through entrepreneurship a local phenomenon? This question
concerns not only researchers, but also state and local policymakers.
By merging the entrepreneur data with the firm data, I can describe the
distribution of academic entrepreneurs by their academic and business locations (Table
6). Among the 903 academic entrepreneurs, 60 were previously employed at foreign
institutions, including universities in Britain, Canada, Germany, Israel, and other
countries. VentureOne data only include foreign researchers who founded firms in the
United States; it is not designed to capture U.S. researchers if they started businesses
overseas. Thus it is impossible to measure the net flow of academic entrepreneurs
between the United States and the rest of the world.
Among the 843 academic entrepreneurs from U.S. institutions, 571 (just over two-
thirds) located their businesses in the same state as their academic affiliations. That is,
18 See, for example, Leland and Pyle (1977) for a formal discussion of the informational asymmetries between entrepreneurs and investors.
12

less than one third of academic entrepreneurs moved to other states. Thus technology
transfer through academic entrepreneurs is, largely, a local phenomenon.19
Table 6 captures the net flow of academic entrepreneurs at the state level.
California is clearly the “winner.” In my sample, 244 California university employees
founded venture-backed firms; yet 364 academic entrepreneurs had businesses in
California. Whereas 27 academic entrepreneurs left California, 147 moved into
California, resulting in a net gain of 120 academic entrepreneurs (and a net gain of 95
university spin-offs, not shown in Table 6). This is not surprising because the dataset
covers the period between 1992 and 2001, during which time the Internet revolution was
the primary driver of the venture capital investment, and California was the main
destination of this “digital rush.” Besides California, other significant winners include
Washington (+8), Virginia (+8), Arizona (+5), Texas (+4), Minnesota (+4), and Oregon
(+4). Obviously, all these “winning” states are nowhere near comparable to California.
Since my data only include venture-backed firms, one might think that
entrepreneurs must be chasing money and that being rich in venture capital guarantees a
net gain of academic entrepreneurs. This is hardly true. For example, Massachusetts is
number two in terms of total venture capital investment and its academic institutions
produce 168 venture-backed entrepreneurs. However, compared with California,
Massachusetts has a fairly low retention rate. Forty-nine, or 29.2% of the 168
entrepreneurs chose to leave Massachusetts. At the same time, 45 academic entrepreneurs
moved to Massachusetts from other states, resulting in a net loss of four academic
entrepreneurs. New York, the number three state in total venture capital investment, did
even worse with a net loss of 21 academic entrepreneurs. Other states that experienced a
major loss include Illinois (-10), Arkansas (-9), Pennsylvania (-9), Missouri (-8) and
Indiana (-7).
Arizona and Arkansas are two extreme cases. Arizona produced no academic
entrepreneurs but ended up with five, all of whom came from other states. On the
contrary, universities in Arkansas generated nine academic entrepreneurs, but none of
19 The annual survey by the Association of University Technology Managers (2005, p. 28) shows that 74.5% of 462 start-up companies that formed in 2004 through licensing technology from U.S. research institutions were located in the same state as the institution.
13

them chose to stay in Arkansas and no one came from other states, leaving Arkansas with
no venture-backed university spin-offs.
3.4 Academic affiliations
Table 7 lists top academic institutions by the number of academic entrepreneurs
and the number of venture-backed firms they founded. The number of entrepreneurs and
the number of spin-offs do not agree because an entrepreneur may found more than one
firm and a firm may (usually) have more than one founder.
It is not surprising that Stanford and MIT overwhelmingly outperform other
universities. The important role of these two academic institutions in the development of
Silicon Valley and the Boston region is well documented in the literature (see, for
example, Etzkowitz, 2002; Gibbons, 2000; Saxenian, 1994). While Harvard and UC
Berkeley are often considered different from their respective neighbors in terms of their
relationship with industry (Etzkowitz, 2002; Kenney and Goe, 2004), they have also
generated many academic entrepreneurs. In fact, they spun off more venture-backed
firms than any other institutions except Stanford and MIT.
One common feature of the institutions listed in Table 7 is that they are all top
research universities. No liberal arts college or teaching university makes the list. Even in
the whole sample, no more than five entrepreneurs are from institutions that specialize in
teaching. This suggests that it is the research at these institutions that spurred
entrepreneurial activity and attracted venture capital investment.
4. Why Do Some Universities Generate More Entrepreneurs than Others?
Why do some universities have more academic entrepreneurs and spin off more
firms than others? While this is recognized as an important question, not much work has
been done on the subject due to the limitation of data. Di Gregorio and Shane (2003) try
to explain why some universities attract more start-ups to exploit their intellectual
property than others. In their study, start-ups are not necessarily founded by university
employees. Kenney and Goes (2004) use survey and Internet data to explore why the
departments of electrical engineering and computer science at Stanford produce more
professor entrepreneurs than their counterparts at UC Berkeley. Focus on two universities
prevents them from conducting a multivariate analysis. This nationwide VentureOne
14

database allows me to perform a statistical study of academic entrepreneurs and
investigate the factors that determine inter-university differences.
4.1 Multivariate analysis
I used the VentureOne data to construct the dependent variable: the number of
academic entrepreneurs (or spin-offs) from a university. Table 8 is a list of all the
explanatory variables used in the analysis. Many of the variables were constructed using
data from The Center for Studies in the Humanities and Social Sciences at the University
of Florida.20 The Center conducts an annual ranking of top research universities in the
United States starting from 2000. For this purpose, they collect and maintain data on
universities from various sources. Using these data, I constructed several university-level
variables that are postulated to be related to academic entrepreneurship. These include
measures of faculty quality (national academy membership, total faculty awards),
research budget (total expenditure on research, research expenditure on science and
engineering), advanced training (doctorial degrees awarded, number of post-docs), and
whether the school is private.21
The Center at the University of Florida has data for 616 universities. However,
many variables are missing, especially for minor universities. There are a total of 150
universities for which every variable is available. I used this subset of universities to
match the VentureOne data. In particular, the number of academic entrepreneurs and the
number of university spin-offs are generated from the VentureOne data for each of the
150 universities. These numbers are greater than zero for 98 universities. I assign zeros to
the rest of them.
I also used VentureOne data to construct variables that measure the availability of
venture capital. Since I focused on venture-backed firms only, it is natural to hypothesize
that local abundance of venture capital is a significant determinant of academic
entrepreneurs. Thus I calculated total local venture capital investment during 1992-2001.
For each venture capital deal, VentureOne gives the zip code of the venture-backed firm.
The zip codes of universities were gathered by Internet search. These data were merged
20 Data downloaded from http://thecenter.ufl.edu/, on October 22, 2003. 21 The Center also has data on undergraduate quality (median SAT scores, number of merit/achievement scholars), total enrollment, size of endowment, annual giving by alumni and others, etc. But such information is not particularly relevant for the purpose here.
15

with the U.S. Census Bureau’s ZIP Code Tabulation Area (ZCTA) files22 to assign
latitude-longitude coordinates to the zip codes, which were then used to calculate the
distance between any two zip code areas.23 For each academic institution, I computed the
total venture capital investment within 50 miles during 1992-2001 (Local-VC 50). Since
it is unclear a priori what degree of proximity to venture capital investment will have an
effect, I also computed total investment within 25 miles, 75 miles, and 100 miles for
robustness check. Another venture capital variable is the number of venture capital firms
located in the university’s state (State-VC-Firms). This was constructed based on the
directory of venture capital firms published by VentureOne (VentureOne Corporation,
2000).
In addition, university policy could also be a relevant factor in explaining the
number of academic entrepreneurs. Universities with policies supporting entrepreneurial
activities will likely generate more spin-off companies. For example, Di Gregorio and
Shane (2003) included a set of policy variables to explain why some universities have
attracted more start-ups to license their technologies than others. They found that some of
the policies, such as inventor’s share of royalties and whether the university can make
equity investment, do have significant effects. I constructed two variables to control for
the policy effect: the age of the university’s Office of Technology Transfer (OTT) and the
total number of patents granted to the university during 1969-2000.24 The former is
acquired through the Association of University Technology Managers (AUTM) and,
when not available from AUTM, directly from OTT offices through e-mail or phone call;
the later is downloaded from the U.S. Patent and Trademark Office.25 All major research
universities today have an OTT office to help their faculty with patent application and
other commercialization activities. Yet the opening dates of these OTT offices vary a lot.
While MIT had such an office in 1940, Princeton did not establish one until 1987. One
suspects that those universities with a long tradition of facilitating entrepreneurial
activities among faculty members should generate more academic entrepreneurs. The 22 Data downloaded from http://www.census.gov/geo/www/gazetteer/places2k.html on January 20, 2004. 23 The distance (D) between two points (longitude1, latitutde1) and (longitude2, latitutde2) on the earth is calculated using the formula D = R*arccos [cos(longitude1-longitude2)*cos(latitude1)*cos(latitude2) + sin(latitude1)*sin(latitude2)], where R is the radius of the earth (3961 miles). See the derivation of this formula at http://www.cs.cmu.edu/~mws/lld.html (accessed on March 12, 2004). 24 Young-Choon Kim has helped with obtaining the data to construct these two variables. 25 Data downloaded from ftp://ftp.uspto.gov/pub/taf/ on November 9, 2005.
16
number of patents is an indicator of both how applied a university’s research is and
whether its faculty actively seek to commercialize their inventions. Thus universities with
a large number of patents are expected to have more academic entrepreneurs.
The variables measuring university quality are highly correlated with each other:
A university with a distinguished faculty is very likely to spend a lot on research and train
a large number of doctoral students and post-docs. Likewise, the measures of venture
capital abundance are also correlated with each other. Table 9 presents the pair-wise
correlation between all the dependent and independent variables. Notice that all the
correlation coefficients are positive. The number of academic entrepreneurs and the
number of university spin-offs have a correlation coefficient of 0.997. Thus there should
not be a big difference using either one as the dependent variable. The national academy
membership and the number of faculty awards have a correlation coefficient of 0.818; the
correlation between total research expenditure and research spending on science and
engineering is 0.983. All these suggest that there is a potential multi-collinearity problem
if all the explanatory variables are included in a single regression.
Therefore, as a preliminary test, I start by running simple OLS to regress a
university’s number of academic entrepreneurs on each of the explanatory variable listed
in Table 8, to examine which variable has the highest explanatory power (results in Table
10). Not surprisingly, in separate regressions, all university characteristics are significant
and positively correlated with the number of entrepreneurs from a university. That is, no
matter which measure is used, a university of higher quality, closer to VC investment, or
highly active in commercializing inventions tends to generate more venture-backed
academic entrepreneurs. This is true even if I exclude the four outliers (Stanford, MIT,
Harvard, and UC Berkeley) from the single-variable regressions.
However, the goodness of fit (measured by R2) varies a lot among these
regressions. The two university characteristics that are most closely related with the
number of academic entrepreneurs are national academy membership and total faculty
awards. This suggests that the number of a university’s academic entrepreneurs has more
to do with its faculty quality than its research budget or advanced training. The regression
on national academy membership (using the full sample) has an R2 higher than 0.8. That
is, this variable alone explains more than 80% of the variation in the number of academic
17
entrepreneurs across universities. Besides these two faculty quality measures, the number
of post-doc appointees explains more of the variation in the dependent variable than other
university characteristics. This also is a good indicator of quality of research. In the
regression using the full sample, total number of patents also has a high R2. Yet its R2
becomes substantially smaller once the four outliers are excluded.
Single-variable OLS regressions also show that total venture capital investment
within 50 miles is significantly and positively correlated with a university’s number of
academic entrepreneurs. That is, a university in an area with a higher total venture capital
investment does generate more venture-backed entrepreneurs, although as Table 6 shows,
not all the spin-offs are located in the same state as the university. I also tried alternative
measures of local VC investment and find that the smaller the geographic region is
defined, the higher degree of correlation is observed between a university’s number of
entrepreneurs and local venture capital investment. While total venture capital investment
within a 100-mile circle explains only 17% of the variations in academic entrepreneurs,
the total within a 25-mile circle explains 48%. The number of venture capital firms at the
state level ─ an even bigger geographic region ─ shows a much weaker correlation with
the number of academic entrepreneurs. All these results seem to confirm the well-known
notion that venture capital investment is a local phenomenon (see, for example, Gompers
and Lerner, 1999; Sorenson and Stuart, 2001).
As one uses smaller and smaller geographic definitions, one needs to be more and
more cautious about how to interpret the coefficient of the venture capital variable.
Apparently, if many academic entrepreneurs stay close to the university,26 more venture-
backed academic entrepreneurs necessarily result in more venture capital investment
locally. But in that case, a positive coefficient does not represent a positive effect of
venture capital on academic entrepreneurship. From this point on, the analysis will use
VC investment within 50 miles and total number of VC firms at the state level to measure
the availability of VC locally, and use other VC measures only for sensitivity analysis.
Table 11 presents the results from multivariate regression analysis. Again,
because the independent variables are highly correlated, I tried various specifications. I
first used the venture capital measures as independent variables, then added different
26 This is likely the case especially when professorial entrepreneurs want to retain their academic positions.
18

university characteristics one by one, and finally pooled all the explanatory variables in a
single regression (Models 1-9). Whether a university is private or not is included in all
the specifications as a control variable. Because there are many zeros in the dependent
variable, I have run both OLS and Tobit regressions.27 These two specifications give
qualitatively similar results. Table 11 presents only the results from Tobit regressions.
In each of the nine regressions in Table 11, total venture capital investment within
50 miles has a positive and statistically significant coefficient. The number of VC firms
at the state level, when included in the regression together with local VC investment, is
never statistically significant. When the national academy membership is added to the
regression in Model (2), it has a positive and statistically significant coefficient, and it
raises the R2 of the regression substantially. As university characteristics are added to the
regression one by one, the coefficient of the national academy membership hardly
changes and remains statistically significant. A comparison between models (3)-(9) and
model (2) reveals that adding a group of university characteristics hardly adds any
explanatory power to the simpler specification of model (2), which includes only one
university characteristic⎯the national academy membership. Moreover, adding other
university characteristics causes very little change to the magnitude of the significant
coefficients in model 2. In other words, the national academy membership variable alone
essentially captures all the explanatory power of the university characteristics in these
regressions. In all these specifications, only one other university characteristic, number of
patents, has a positive coefficient that is statistically significant (at the 10% level).
The coefficient of post-docs is statistically significant in some specifications but
has the wrong sign. Sensitivity analysis showed that the significance of the post-doc
variable derived from a single outlier, Harvard. This is because Harvard, with an
extremely large medical school, consistently appoints many more post-docs than its
27 Since the dependent variables are nonnegative integers, I also tried negative binomial regressions as a robustness check. Given the large number of zeros in the dependent variable, the zero-inflated negative binomial model seems appropriate. However, this model requires the specification of an extra equation determining whether the count is zero. If I want to add variables to the main equation one by one, how to re-specify the ancillary equation becomes a rather arbitrary decision. Thus I simply run the ordinary negative binomial regression on the full sample and on a truncated sample dropping all the zeros. These negative binomial regressions yield results qualitatively similar to those from the Tobit regressions, although dropping all the zeros generally gives more precise estimates (with smaller standard errors) than running the negative binomial regressions on the full sample.
19
peers.28 For example, in 1998, the combined number of post-docs at Stanford and MIT
was less than half of the number at Harvard, but each of them has many more academic
entrepreneurs than Harvard.
Further sensitivity analysis evaluated the robustness of the results. As shown in
Table 7, Stanford, MIT, Harvard, and UC Berkeley greatly outperformed all other
schools. This raises the question of whether or not these four outliers alone drive some of
the regression results. Table 12 presents the regression results based on a restricted
sample that excludes these four observations.
When I exclude the four outliers, local venture capital investment is no longer
statistically significant. In fact, neither of the two measures of venture capital availability
is statistically significant in any of the regressions with other university characteristics
included as independent variables (models (2)-(9) in Table 12). This suggests that the
significance of the venture capital variables is derived from the four outliers, all of which
have access to a rich supply of capital locally. National academy membership and total
faculty awards, both measuring the quality of the faculty, are the only two variables that
consistently have statistically significant coefficients. None of the other university
characteristics, including the number of patents, is statistically significant. These results
in Table 12 clearly suggest that venture-backed academic entrepreneurs tend to come
from universities with a first-class faculty doing high-quality research. More importantly,
these results show that their entrepreneurial activities are not significantly influenced by
venture capital investment near the universities, which is surprising given that I am
focusing exclusively on venture-backed academic entrepreneurs.
Table 13 presents more results from sensitivity analysis. Since national academy
membership and total faculty awards both measure the quality of faculty and are highly
correlated, only one is included in the regression. As Models (1) and (2) show, each of
the two variables, when included in the regression separately, is statistically significant.
Moreover, their coefficients and standard errors are almost identical, further proving the
high level of collinearity between these two variables. For the same reason, one may
doubt that the two measures of research expenditure, total research expenditure and
28 As Harvard’s website shows, it has 10,647 medical school faculty, compared to only 2,497 non-medical faculty (http://www.news.harvard.edu/glance/, accessed on January 18, 2007).
20

research spending on science and engineering, are highly collinear and that neither one is
statistically significant only because both are included in a single regression. The same
logic applies to the two measures of advanced training (number of doctoral degrees
awarded, total number of post-docs) and the two measures of commercialization (age of
OTT office and number of patents). Thus one variable in each pair is dropped from the
regression to see whether the other becomes statistically significant. As the rest of Table
13 shows, dropping these variables hardly affects the coefficient of national academy
membership or the coefficient of total faculty awards. They are still statistically
significant when included in the regression separately. In fact, when national academy
membership is excluded, total faculty awards is always the only university characteristic
that has a statistically significant coefficient. When total faculty awards is excluded,
national academy membership and total number of doctoral degree awarded are always
statistically significant. Overall, the results in Table 13 again show that the quality of
research at a university affects the number of venture-backed entrepreneurs from the
university and that the availability of venture capital in the local area is not an important
factor.
Alternative measures of local venture capital investment yielded similar results.
Even total investment within 25 miles, the measure most likely to be endogenously
related to the number of venture-backed entrepreneurs, does not have a statistically
significant coefficient when the four outliers are excluded. I repeated the same set of
regression analysis using the number of university spin-offs as the dependent variable.
The results are qualitatively similar and not reported here.
4.2 Further discussion
The regression analysis shows that entrepreneurial activities among academics are
closely related to the most distinguished faculty members in universities. So why do
universities with outstanding scientists tend to generate more venture-backed
entrepreneurs? One possible explanation could be that a strong reputation in scientific
research is a selling point that venture capitalists need, as mentioned earlier. Thus venture
capitalists are more willing to invest in start-ups founded by scientists from top research
universities. And national academy membership and total faculty awards are simply two
important indicators of a school’s quality of research.
21

Another possible reason is that outstanding scientists or their associates
themselves are engaged in entrepreneurial activities once they see the commercial value
of their research findings. It is important to understand that nowadays universities in the
United States are anything but “ivory towers” in which scholars hide away to solve
problems that are irrelevant to the real world. Thanks to pioneering figures such as MIT’s
Vannevar Bush and Stanford’s Frederick Terman, today’s university-industry
relationship is extensive, productive, and mutually beneficial. Industrial consulting has
become a part of life for many university professors, and collaboration between
university research labs and industry is common. Even today’s most prestigious academic
scholars would not consider entrepreneurial activities in the business world
unacceptable.29 In fact, many universities even encourage such activities. For example,
the University of Georgia, Georgia Tech, and other universities in the state formed a
partnership with the local government and industry, called the Georgia Research
Alliance. The partnership helps these universities recruit “eminent scholars” to Georgia.
These scientists are expected to work as professors and entrepreneurs. They are even
offered incubator space (Herper, 2002).
A casual search of the Internet reveals that even among today’s most
distinguished scientists, starting a firm is not uncommon. Table 14 presents a partial list
of Nobel Prize winners who were also entrepreneurs. Among the 36 U.S. Nobel
Laureates who won the prize in chemistry or medicine between 1993 and 2005, 13 had
founded at least 14 firms.30
One may suspect that these Nobel Laureates’ entrepreneurial activities came after
their prizes. It is reasonable to believe that these scientists’ research productivity had
peaked long before they won the prize. Thus it must be attractive for them to move into
29 Indeed, Lowe and Gonzalez-Brambila (2005) show that faculty entrepreneurs tend to be more productive in terms of publication than their peers who have never started businesses. That is, successful scientists are more likely to start businesses than less successful ones. 30 One of the Nobel Laureates, Robert Grubbs, apparently founded more than one firm although I was unable to name all of them. The entrepreneurial activities are by no means limited to the Nobel Laureates from the U.S. For example, I found at least three Laureates from other countries also started businesses: Arvid Carlsson from Sweden (Nobel Prize in Medicine in 2000, founded Carlsson Research in 1998); Christiane Nüsslein-Volhard from Germany (Nobel Prize in Medicine in 1995, founded ARTEMIS Pharmaceuticals GmbHn (later acquired by Exelixis) in 1997); and Michael Smith from Canada (Nobel Prize in Chemistry in 1993, founded Zymos (now ZymoGenetics) in 1981). Although Michael Smith was associated with University of British Columbia in Canada when he won the Nobel Prize, the company he co-founded was actually located in the United States (Seattle, WA).
22

industry after the prize so that they could capitalize on their Nobel Prize fame. However,
I found that most of these Nobel Laureates (10 out of 13) founded their firms before their
prizes. At least for those people, their entrepreneurial activity was not triggered by the
Nobel Prize.
Furthermore, I found that several of these Nobel Laureates even mentioned their
entrepreneurial activities in their speeches/autobiographies submitted to the Nobel Prize
archive, suggesting that they take their entrepreneurial achievement seriously. Thus, it is
unlikely that these great scientists merely lent their names to, but spent little time on,
their businesses. Given the list in Table 14, it is not surprising that the number of a
university’s academic entrepreneurs is most closely related to its number of distinguished
scientists.
It is unexpected that the statistical significance of local venture capital variables is
not robust. However, this is not puzzling. As Table 6 shows, not all of the academic
entrepreneurs stayed close to their academic institutions. In fact, about one third of them
ended up in different states, suggesting that the availability of venture capital locally is
not a decisive factor that lures academics to industry. Moreover, consider an area like
Boston, which houses several universities in my sample, including Brandeis, Boston
College, Boston University, Harvard, MIT, Northeastern, Tufts, and others. The number
of spin-offs varies a great deal among these universities, although they have access to
roughly the same local venture capital resources. The San Francisco Bay area is another
example. Stanford, UC Berkeley, UC Davis, and UC Santa Cruz all enjoy the proximity
to the abundance of local venture capital, but show very different performance in terms of
generating entrepreneurs. All these examples provide the intuition as to why very little
variation of academic entrepreneurs is attributable to local venture capital.
It is worth noting that the results of this study are consistent with the findings in
previous work, such as Zucker, Darby, and Armstrong, (1998), Zucker, Darby, and
Brewer (1998), and Di Gregorio and Shane (2003). Zucker, Darby, and co-authors
showed that “star scientists,” as defined by a distinguished publication record, play a
significant role in determining the location and timing of biotech firm formation.
Similarly, Di Gregorio and Shane (2003) found that the number of new firms licensing a
23

university’s inventions is correlated with the intellectual eminence of the university,
measured by its academic rating score in the Gourman Reports.
Both Zucker, Darby, and Brewer (1998) and Di Gregorio and Shane (2003)
included venture capital variables in their empirical studies. Zucker, Darby, and Brewer
found that local venture capital has no significant effects (or has significantly negative
effects in some regressions) on the number of biotech firms in a region. Di Gregorio and
Shane showed that the number of start-ups using university technology is not
significantly correlated with the availability of venture capital locally. My result is in line
with these findings. One may argue that this paper’s conclusion about the role of venture
capital is even stronger, because neither of the previous studies is limited to venture-
backed firms. What is shown here is that even venture-backed academic entrepreneurs
are not attracted to industry by venture capital. It seems that some schools generated
more venture-backed spin-offs only because they have done high quality research
suitable for commercialization.
Some other relevant factors at the university level, such as salient entrepreneurial
successes and particular university culture, are hard to measure, but their importance is
evident. For example, the data show that Carnegie Mellon University did particularly
well in generating start-ups. The impressive performance of Carnegie Mellon is most
likely inspired by the early financial success of Lycos. Lycos is an Internet search engine
developed by Michael Mauldin, a research scientist at Carnegie Mellon’s School of
Computer Science. The company was incorporated in June 1995. On April 2, 1996, even
before the public offerings of Yahoo! and Excite, Lycos was launched on the NASDAQ.
It ended the day with a market value of nearly $300 million (Lewis, 1996). That instant
wealth creation must have inspired many other researchers at Carnegie Mellon to follow
suit. From the VentureOne data, I could identify at least 15 of the 24 entrepreneurs from
Carnegie Mellon as computer scientists. Also, I found that 18 out of the 19 Carnegie
Mellon spin-offs were founded after May 1996. That is, almost all these founders had
witnessed Lycos and Michael Mauldin’s miraculous wealth creation before they started
their own ventures.
Culture also matters. Two of the outliers, Stanford and MIT, have a long tradition
of supporting academic entrepreneurship. This is an important reason why they greatly
24

outperformed other universities. At MIT, the tradition traces back to Vannevar Bush, a
professor in the 1920s who co-founded Raytheon, a major U.S. defense contractor. Bush
was primarily responsible for creating a business friendly culture at MIT. His student,
Frederick Terman, later transmitted the culture to Stanford (Etzkowitz, 2002). In his
various capacities (professor, dean of engineering, provost, and vice-president), Terman
always encouraged entrepreneurial activities among faculty members and students at
Stanford. The entrepreneurial culture has now been so deep-rooted at Stanford that the
university even offers entrepreneurship seminars to faculty.
On the other hand, a culture that expects academic scientists to keep an arm’s
length from the business world may have discouraged entrepreneurial activities on some
campuses. An obvious under-performer among the top research universities (in Table 7)
is the Johns Hopkins University. Johns Hopkins has one of the world’s best medical
schools and its annual research budget is often greater than Stanford and MIT’s combined
budget, but it has only 6 spin-offs in the data. As Feldman (1994) and Feldman and
Desrochers (2003) documented, Johns Hopkins lags similar institutions along a variety of
measures of technology transfer, including patents granted and patent licensing royalties
in addition to firm formation. They relate this outcome to the emphasis on basic scientific
research in Johns Hopkins’ founding mission, the long-lasting culture of seeking “truth
for its own sake,” and the lack of successful commercialization attempts in the early
years that further enhanced this culture.
5. Conclusions
The university, as the producer and distributor of knowledge, is a major force of
technological innovation and thus an important driver of economic growth (Rosenberg
and Nelson, 1994). University technology becomes incorporated into industrial practices
through various channels. Entrepreneurial activities by academics constitute one
particular form of technology transfer, which have not been thoroughly studied due to the
limited availability of data. This paper examines venture-backed academic entrepreneurs
using a large venture capital data set. I used the biographical information about start-up
founders to identify whether an entrepreneur has had a university affiliation. Combining
this rich venture capital data set with ancillary data sources, I was able to do a
25
comprehensive study of academic entrepreneurs. My major findings include the
following:
First, academic entrepreneurs are common. Close to 9% of venture-backed
entrepreneurs have worked at academic institutions. A majority of these people specialize
in engineering, and most of them start businesses in life science industries or information
technology industries.
Second, to a great extent, technology transfer through academic entrepreneurs is a
local phenomenon. About two-thirds of the venture-backed academic entrepreneurs
locate their businesses in the same states as the academic institutions they served. Many
conceivable factors could explain why entrepreneurs stay where they are when they
found firms, including the value of local networks and the feasibility of an informal start
on a part-time basis (Cooper and Folta, 2000). It is unclear what motivates academic
entrepreneurs to move to other states. Anecdotal evidence suggests that venture capital
firms could lure entrepreneurs away. Yet the data suggest that venture capital is not a
sufficient determinant, because states rich in venture capital, such as Massachusetts and
New York, have both experienced net losses of academic entrepreneurs.
Third, the number of venture-backed academic entrepreneurs from a university is
primarily explained by the number of distinguished scientists at the university. An
overwhelming majority of the venture-backed academic entrepreneurs are from the top-
tier research universities, and very few are from teaching universities or colleges, which
suggests that it is high-quality research that drives academic entrepreneurship. A
multivariate regression analysis further confirms that better research universities tend to
generate more spin-offs. Moreover, a university’s national academy membership and
total faculty awards are the two most significant variables in explaining its number of
academic entrepreneurs. Other university characteristics, such as total research
expenditure, research expenditure on science and engineering, doctoral degrees
appointed, and post-doc appointees, have no significant effects on the number of spin-
offs once the regression includes the national academy membership and/or total faculty
awards.
Fourth, local abundance of venture capital does not play a significant role in
explaining venture-backed academic entrepreneurs once I drop the four outliers from the
26
regressions. Although previous research has shown similar findings, I still find this result
striking because this analysis focuses exclusively on venture-backed entrepreneurs.
The significance of the national academy membership and total faculty awards
suggests that quality research is the decisive factor in explaining venture-backed
academic entrepreneurs. However, this finding is open to alternative interpretations. For
example, it might be the reputation of these distinguished scientists instead of the true
quality of their research that has attracted venture capital to universities. Further
investigation along this line seems warranted.
Although it is uncertain what the national academy membership and total faculty
awards exactly measure, I find it surprising that these variables show more explanatory
power than the venture capital variables. My analysis shows that even if the study covers
venture-backed firms only, the availability of venture capital plays a minor role in
explaining the number of academic entrepreneurs from a university. I consider this
finding the most important one in this paper.
A limitation of this paper is its focus on venture-backed academic entrepreneurs,
which only represent a subset of all academic entrepreneurs. However, it is likely that
these entrepreneurs are the most prominent and that their ventures tend to have a larger
effect on economic growth. The rich information in the data set permits a comprehensive
study of academic entrepreneurs across disciplines and across universities, which
previous studies have not been able to do. I believe this is a fruitful starting point that
invites further investigation.
27
References
Allen, Thomas J., 1984, Managing the Flow of Technology: Technology Transfer and the Dissemination of Technological Information within the R&D Organization, MIT Press, Cambridge, MA.
Association of University Technology Managers, 2005, “AUTM U.S. Licensing Survey: FY 2004,” available at http://www.autm.net/events/File/FY04%20Licensing%20Survey/04AUTM-USLicSrvy-public.pdf (accessed on December 28, 2005). Audretsch, David B., and Paula E. Stephan, 1996, “Company Science Locational Links: The Case of Biotechnology,” American Economic Review 86, 641–652. Cochrane, John H., 2005, “The Risk and Return of Venture Capital,” Journal of Financial Economics, 75, 3-52.
Cooper, Arnold and Timothy Folta, 2000, “Entrepreneurship and High-technology Clusters,” in Donald L. Sexton and Hans Landstrom (eds.), The Blackwell Handbook of Entrepreneurship, Blackwell Business, Malden, MA.
Di Gregorio, Dante and Scott Shane, 2003, “Why Do Some Universities Generate More Start-Ups Than Others?” Research Policy 32, 209-227.
Etzkowitz, Henry, 2002, MIT and the Rise of Entrepreneurial Science, Routledge, London.
Feldman, Maryann, 1994, “The University and Economic Development: The case of Johns Hopkins University and Baltimore,” Economic Development Quarterly 8, 67-76.
Feldman, Maryann and Pierre Desrochers, 2003, “Research Universities and Local Economic Development: Lessons from the History of the Johns Hopkins University,” Industry and Innovation 10, 5-24.
Gibbons, James F., 2000, “The Role of Stanford University: A Dean's View,” in Lee, Chong-Moon, William F. Miller, Marguerite Gong Hancock, and Henry S. Rowen (eds.), The Silicon Valley Edge, Stanford University Press, Stanford, pp. 200-217.
Gompers, Paul and Josh Lerner, 1999, The Venture Capital Cycle, Cambridge, MA: MIT Press.
Gompers, Paul and Josh Lerner, 2000, “Money Chasing Deals? The Impact of Fund Inflows on Private Equity Valuations,” Journal of Financial Economics 55, 281-325.
Gompers, Paul, Josh Lerner, and David Scharfstein, 2005, “Entrepreneurial Spawning: Public Corporations and the Genesis of New Ventures, 1986-1999,” Journal of Finance 60, 577-614.
Herper, Matthew, “Biotech Topples the Ivory Tower,” Forbes, May 13, 2002.
Kenny, Martin, 1986a, “Schumpeterian Innovation and Entrepreneurs in Capitalism: A Case Study of the U.S. Biotechnology Industry,” Research Policy 15, 21-31.
Kenny, Martin, 1986b, Biotechnology: The University-Industrial Complex, New Haven, CT: Yale University Press.
28

Kenney, Martin and W. Richard Goe, 2004, “The Role of Social Embeddedness in Professorial Entrepreneurship: A Comparison of Electrical Engineering and Computer Science at UC Berkeley and Stanford,” Research Policy 33, 691-707.
Klepper, Steven, 2001, “Employee Start-ups in High- Tech Industries,” Industrial and Corporate Change 10, 639-674.
Klofsten, Magnus and Dylan Jones-Evans, 2000, “Comparing Academic Entrepreneurship in Europe — The Case of Sweden and Ireland,” Small Business Economics 14, 299-309.
Leland, Hayne E. and David H. Pyle, 1977, “Informational Asymmetries, Financial Structure, and Financial Intermediation,” Journal of Finance 32, 371-387.
Lewis, Peter H., “Yet Again, Wall Street Is Charmed by the Internet,” New York Times, April 3, 1996.
Louis, Karen Seashore, David Blumenthal, Michael E. Gluck, and Michael A. Soto, 1989, “Entrepreneurs in Academe: An Exploration of Behaviors among Life Scientists," Administrative Science Quarterly 34, 110-131.
Lowe, Robert and Claudia Gonzalez-Brambila, 2005, “Faculty Entrepreneurs and Research Productivity,” mimeo, Carnegie Mellon University.
McQueen, Douglas H., and J. Torkel Wallmark, 1982, “Spin-off Companies from Chalmers University of Technology,” Technovation 1, 305-315.
Nerkar, Atul and Scott Shane, 2003, “When Do Start-ups That Exploit Patented Academic Knowledge Survive?” International Journal of Industrial Organization 21, 1391-1410.
Pirnay, Fabrice, Bernard Surlemont, and Frederic Nlemvo, 2003, “Toward a Typology of University Spin-offs,” Small Business Economics 21, 355-369.
Roberts, Edward B., 1991, Entrepreneurs in High Technology: Lessons from MIT and Beyond, Oxford University Press, Oxford.
Rogers, Everett M., 1986, “The Role of the Research University in the Spin-off of High Technology Companies,” Technovation 4, 169-181.
Rosenberg, Nathan and Richard R. Nelson, 1994, “American Research Universities and Technical Advance in Industry,” Research Policy 23, 323-348.
Samson, Karel J. and Michael A. Gurdon, 1993, “University Scientists as Entrepreneurs: A Special Case of Technology Transfer and High-Tech Venturing,” Technovation 13, 63-71.
Saxenian, AnnaLee, 1994, Regional Advantage: Culture and Competition in Silicon Valley and Route 128, Harvard University Press, Cambridge.
Shane, Scott, 2004, Academic Entrepreneurship: University Spinoffs and Wealth Creation, Edward Elgar, Northampton, MA.
Shane, Scott and Toby Stuart, 2002, “Organizational Endowments and the Performance of University Start-ups,” Management Science 48, 154-170.
29
Smilor, Raymond W., David V. Gibson, and Glenn B. Dietrich, 1990, “University Spin-out Companies: Technology Start-ups from UT-Austin,” Journal of Business Venturing 5, 63-76.
Sorenson, Olav and Toby Stuart, 2001, “Syndication Networks and the Spatial Distribution of Venture Capital,” American Journal of Sociology 106, 1546-1590.
Stuart, Toby and Waverly Ding, 2004, “When Do Scientists Become Entrepreneurs? The Social Structural Antecedents of Commercial Activity in the Academic Life Sciences,” mimeo, Columbia Business School, Columbia University.
Steffensen, Morten, Everett M. Rogers, and Kristen Speakman, 2000, “Spin-offs from Research Centers at a Research University,” Journal of Business Venturing 15, 93-111.
Toole, Andrew A. and Dirk Czarnitzki, 2005, “Biomedical Academic Entrepreneurship Through the SBIR Program,” NBER Working Paper 11450.
VentureOne Corporation, 2000, The VentureOne Venture Capital Sourcebook, San Francisco, California.
VentureOne Corporation, 2001, Venture Capital Industry Report, San Francisco, California.
Zucker, Lynne G., Michael R. Darby, and Jeff S. Armstrong, J., 1998, “Geographically Localized Knowledge: Spillovers or Markets?” Economic Inquiry 36, 65-86.
Zucker, Lynne G., Michael R. Darby, and Marilynn B. Brewer, 1998, “Intellectual Human Capital and the Birth of U.S. Biotechnology Enterprises,” American Economic Review 88, 290-306.
Zucker, Lynne G., Michael R. Darby, and Maximo Torero, 2002, “Labor Mobility from Academe to Commerce,” Journal of Labor Economics 20, 629-660.
Zhang, Junfu, 2003, High-Tech Start-Ups and Industry Dynamics in Silicon Valley, Public Policy Institute of California, San Francisco, California.
Zhang, Junfu, 2007, “Access to Venture Capital and the Performance of High-Tech Start-Ups in Silicon Valley,” Economic Development Quarterly, forthcoming.
Zhang, Junfu and Nikesh Patel, 2005, The Dynamics of California’s Biotechnology Industry, Public Policy Institute of California, San Francisco, California.
30

Table 1: Venture Capital Investment by Industry, 1992-2001
Industry Number of VC-Backed
Companies
Number of VC Deals
VC Raised, ($ million)*
Percentage of U.S.
Total, %
Communication 1,381 2,984 49,502.21 23.31
Consumer/Business Services
2,060 4,051 41,240.49 19.42
Software 2,672 5,542 40,917.12 19.27
Information Services 972 1,958 19,687.36 9.27
Biopharmaceutical 689 1,664 13,606.89 6.41
Retailing 390 784 9,242.43 4.35
Medical Devices 626 1,470 8,903.98 4.19
Semiconductor 431 913 8,330.73 3.92
Electronics 619 988 6,608.62 3.11
Medical Information Services
336 723 5,669.59 2.67
Healthcare 341 643 4,607.45 2.17
Consumer/Business Products
251 399 2,111.29 0.99
Advance/Special Material and Chemical
76 142 641.64 0.30
Energy 34 58 580.15 0.27
Agriculture 34 45 209.05 0.10
Other 117 115 463.30 0.22
Total 11,029 22,479 212,322.30 100
* In 1996 dollars (converted using GDP deflator).
31

Table 2: Top Ten States by Venture Capital Investment, 1992-2001
State Number of VC-Backed
Companies
Number of VC Deals
VC Raised ($m)*
Percentage of U.S. Total, %
California 4,302 9,856 93,655.50 44.11
Massachusetts 1,170 2,612 22,196.60 10.45
New York 610 1,179 11,129.79 5.24
Texas 598 1,145 12,008.25 5.66
Washington 347 787 6,881.90 3.24
Colorado 316 703 8,468.45 3.99
Virginia 323 673 5,632.51 2.65
Pennsylvania 359 657 5,466.01 2.57
Georgia 304 602 4,563.52 2.15
New Jersey 263 501 5,197.80 2.45 * In 1996 dollars (converted using GDP deflator).
32

Table 3: Positions That Entrepreneurs Ever Held in Academic Institutions
Position Number of Individuals Percentage of Total, %
Professor 563 62.35
Research Scientist 143 15.84
Director 71 7.86
Executive 69 7.64
Lecturer / Instructor 17 1.88
Other 40 4.43
Total 839* 100
* Position is unidentifiable for some of the 903 academic entrepreneurs.
Table 4: Distribution of Entrepreneurs by Specialty
Academic Discipline Number of Entrepreneurs Percentage of Total, %
Engineering 304 45.44
Medical sciences 175 26.16
Bioscience 96 14.35
Business 29 4.33
Chemistry 23 3.44
Other 42 6.28
Total 669* 100
* Specialty is unidentifiable for some of the 903 academic entrepreneurs.
33
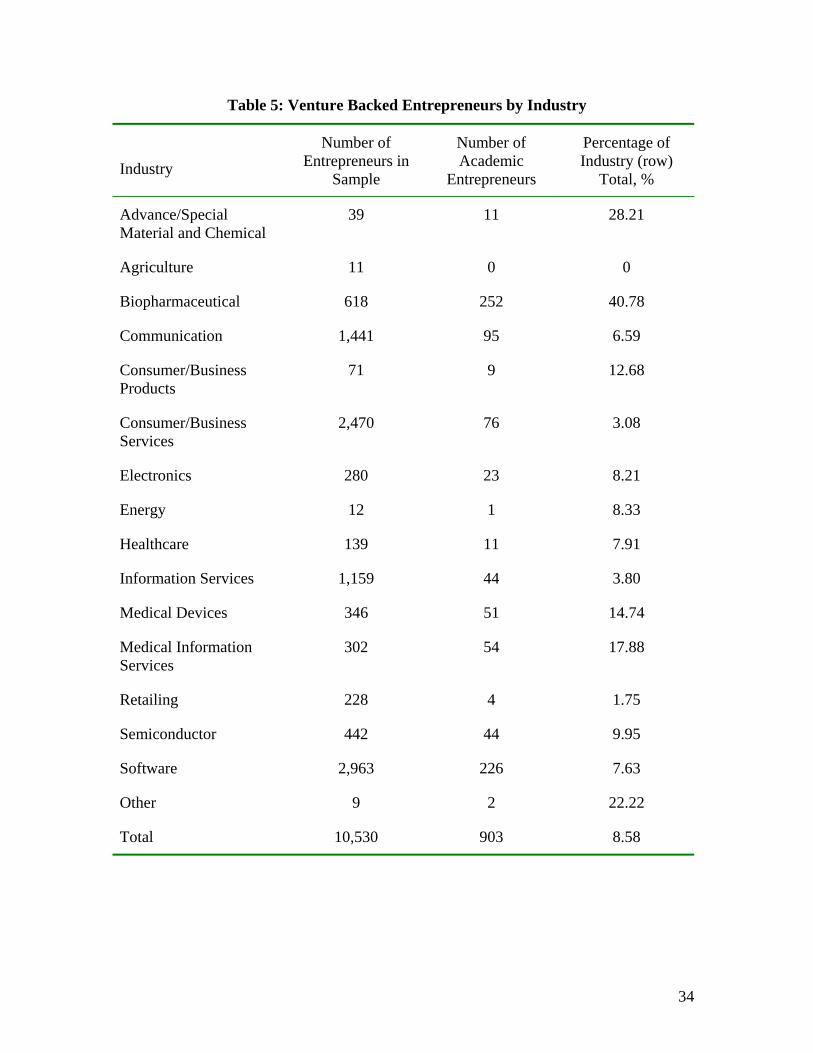
Table 5: Venture Backed Entrepreneurs by Industry
Industry
Number of Entrepreneurs in
Sample
Number of Academic
Entrepreneurs
Percentage of Industry (row)
Total, %
Advance/Special Material and Chemical
39 11 28.21
Agriculture 11 0 0
Biopharmaceutical 618 252 40.78
Communication 1,441 95 6.59
Consumer/Business Products
71 9 12.68
Consumer/Business Services
2,470 76 3.08
Electronics 280 23 8.21
Energy 12 1 8.33
Healthcare 139 11 7.91
Information Services 1,159 44 3.80
Medical Devices 346 51 14.74
Medical Information Services
302 54 17.88
Retailing 228 4 1.75
Semiconductor 442 44 9.95
Software 2,963 226 7.63
Other 9 2 22.22
Total 10,530 903 8.58
34

Table 6: Distribution of Academic Entrepreneurs by Academic/Business Location
By Academic Location By Business Location State Entrepreneurs
Moved out Entrepreneurs
Stayed Total
(a) Net Gain (b) – (a)
Total (b)
Entrepreneurs Stayed
Entrepreneurs Moved in
California 27 217 244 120 364 217 147 Massachusetts 49 119 168 -4 164 119 45 New York 32 24 56 -21 35 24 11 Pennsylvania 17 24 41 -9 32 24 8 North Carolina 10 30 40 -1 39 30 9 Illinois 14 20 34 -10 24 20 4 Texas 12 19 31 4 35 19 16 Georgia 6 15 21 2 23 15 8 Washington 2 16 18 8 26 16 10 Colorado 4 11 15 2 17 11 6 Connecticut 6 8 14 1 15 8 7 Maryland 9 4 13 -2 11 4 7 Michigan 4 9 13 -2 11 9 2 Missouri 8 3 11 -8 3 3 0 Wisconsin 4 7 11 -4 7 7 0 Arkansas 9 0 9 -9 0 0 0 Indiana 7 2 9 -7 2 2 0 Minnesota 1 8 9 4 13 8 5 Ohio 5 4 9 -3 6 4 2 Rode Island 4 5 9 -3 6 5 1 New Jersey 4 4 8 3 11 4 7 Utah 4 4 8 -4 4 4 0 Virginia 4 4 8 8 16 4 12 New Mexico 2 4 6 0 6 4 2 Tennessee 4 2 6 -3 3 2 1 Florida 4 1 5 0 5 1 4 Alabama 2 1 3 1 4 1 3 Washington, DC 3 0 3 -3 0 0 0 Kentucky 2 1 3 -2 1 1 0 Louisiana 3 0 3 -3 0 0 0 West Virginia 3 0 3 -3 0 0 0 Iowa 2 0 2 0 2 0 2 Oklahoma 1 1 2 -1 1 1 0 Oregon 1 1 2 4 6 1 5 Delaware 0 1 1 0 1 1 0 Hawaii 1 0 1 -1 0 0 0 Kansas 1 0 1 -1 0 0 0 Nebraska 0 1 1 0 1 1 0 New Hampshire 0 1 1 2 3 1 2 Vermont 1 0 1 -1 0 0 0 Arizona 0 0 0 5 5 0 5 Nevada 0 0 0 1 1 0 1 Total 272 571 843 60* 903 571 332
* Net gains do not add up to zero because 60 entrepreneurs are associated with foreign institutions.
35

36
Table 7: Top Universities by Number of VC-Backed Entrepreneurs and Spin-offs
Institution Entrepreneurs Spin-offs Institution Entrepreneurs Spin-offs
Stanford 96 91 U Colorado 10 7
MIT 85 76 UIUC 10 6
Harvard 58 53 Brown 9 6
UC Berkeley 38 37 UW-Madison 9 6
CMU 24 19 U Minnesota 8 8
UCSF 20 17 Washington U 8 5
UC San Diego 17 17 Cornell 7 8
Duke 17 14 Northwestern 7 8
U Washington 16 13 Johns Hopkins 7 6
CalTech 15 15 U Arizona 7 6
Columbia 14 12 UCSB 7 6
Michigan 13 13 Princeton 6 5
Yale 13 12 UPenn 6 5
Chicago 13 10 U Pittsburgh 6 4
UT-Austin 12 14 UC Davis 5 6
Boston U 12 10 Purdue 5 5
NYU 12 10 Maryland 5 5
Georgia Tech 11 9 Wake Forest 5 5
USC 11 8 U New Mexico 5 4
UCLA 10 11 Emory 5 3
NC State 10 10

Table 8: University Characteristic Variables a
Variable Name Description Mean Standard Dev. No. of Obs. NAM99 National academy membership in 1999 b 19.8 40.1 150 Awards99_01 Total faculty awards during 1999-2001 c 37.5 37.3 150 Total-Exp91_00 Total research expenditure during 1991-2000 $1.33 billion 1.24 150 SciEng-Exp00 Research expenditure on science and engineering in 2000 $0.13 billion 0.12 150 Doctors98_01 Total doctoral degrees awarded in 1998 and 2000-01 0.68 thousand 0.53 150 Post-Doc98 Number of post-doc appointees in 1998 0.22 thousand 0.35 150 Private = 1 if private and = 0 otherwise 0.35 0.48 150 Local-VC 50 Total venture capital investment within 50 miles during
1992-2001 $2.27 billion 10.7 150
State-VC-Firms Number of venture capital firms located in the state 49.0 82.2 150 OTT-Age The age of the Office of Technology Transfer 19.2 12.3 136 Patents 69_00 Total number of patents assigned to the university during
1969-2000 d 1.69 hundred 2.7 128
a Since most of the firms in the VentureOne data were founded in the 1990s, it is desirable to use the explanatory variables in the same period or earlier. However, not all the variables are available in early years. Some of the variables, such as the national academy membership, are available for several years but not addable over time. So I chose the one in the earliest year. This hardly affects the results because university characteristics are fairly stable over time. For example, I run regressions using national academy membership in 1999, 2000, and 2001, and the differences are negligible. b This includes membership in the National Academy of Sciences (NAS), the National Academy of Engineering (NAE), or the Institute of Medicine (IOM). All three academies are private, nonprofit organizations and serve as advisors to the federal government on science, technology, and medicine. Their members are nominated and elected by active members and all get life terms. National academy membership is one of the highest honors that academic faculty can receive. c This refers to awards from 24 prominent grant and fellowship programs in the arts, humanities, science, engineering, and health fields, including Fulbright American Scholars, Guggenheim Fellows, MacArthur Foundation Fellows, NIH MERIT and Outstanding Investigators, National Medal of Science, National Medal of Technology, NSF CAREER awards, etc. d For some multi-campus universities such as the University of California, the University of Texas, and the State University of New York, the patent data are aggregated and not available at the campus level, which creates some missing data at the campus level.
37

Table 9: Pair-wise Correlation of Dependent and Independent Variables
(1) (2) (3) (4) (5) (6) (7) (8) (9) (10) (11) (12) (13) (1) No. of Entrepreneurs 1 (2) No. of Spinoffs 0.9971 1 (3) NAM99 0.9042 0.9069 1 (4) Awards99_01 0.6835 0.6811 0.8182 1 (5) Total-Exp91_00 0.5602 0.5551 0.6372 0.8502 1 (6) SciEng_Exp00 0.5492 0.5441 0.6209 0.8613 0.9832 1 (7) Doctors98_01 0.5197 0.519 0.6123 0.8009 0.7714 0.7958 1 (8) Post-Doc_98 0.6482 0.6467 0.7767 0.7914 0.7093 0.7022 0.5893 1 (9) Private 0.0863 0.0809 0.1795 0.0564 -0.0614 -0.0465 -0.0706 0.0821 1 (10) Local_VC 50 0.5926 0.606 0.5699 0.3887 0.1689 0.1693 0.2209 0.3366 0.2622 1 (11) State-VC-Firms 0.1772 0.1847 0.3274 0.1776 0.0927 0.111 0.1213 0.2179 0.1167 0.5166 1 (12) OTT_Age 0.3551 0.3481 0.3862 0.3669 0.4524 0.4515 0.3993 0.2788 -0.0407 0.1223 0.1765 1 (13) Patents 69_00 0.7313 0.7275 0.747 0.6123 0.6584 0.6583 0.5881 0.4117 0.1336 0.3462 0.2742 0.6198 1
38

Table 10: Single-Variable OLS Regressions [Dependent variable: number of academic entrepreneurs from a university]
Independent Variables
NAM99 Awards 99_01
Total-Exp91_00
SciEng-Exp00
Doctors 98_01
Post-Doc98
Private Local-VC 50
State-VC-Firms
OTT-Age Patents 69_00
Full Sample OLS coefficient 0.27*** 0.21*** 4.77*** 46.9*** 11.2*** 21.4*** 5.93*** 0.67*** 0.05*** 0.37*** 3.43*** (0.01) (0.02) (0.70) (7.17) (1.66) (2.27) (2.02) (0.07) (0.01) (0.08) (0.29)
R2 0.813 0.435 0.239 0.224 0.236 0.374 0.055 0.351 0.108 0.126 0.535 No. of Obs. 150 150 150 150 150 150 150 150 150 136 128
Excluding Stanford, MIT, Harvard, and UC Berkeley OLS coefficient 0.16*** 0.10*** 2.21*** 22.7*** 4.89*** 13.4*** 2.05*** 0.09* 0.01*** 0.09*** 1.34*** (0.01) (0.01) (0.25) (2.55) (0.65) (1.43) (0.77) (0.05) (0.004) (0.03) (0.19)
R2 0.566 0.498 0.345 0.355 0.284 0.380 0.047 0.022 0.051 0.048 0.288 No. of Obs. 146 146 146 146 146 146 146 146 146 132 125
Every OLS regression included a constant term, although not reported here in the table.
Standard errors are in parentheses. *** Significant at the 1% level; ** significant at the 5% level; * significant at the 10% level.
39

Table 11: Tobit Regressions Using the Full Sample [Dependent variable: number of academic entrepreneurs from a university]
(1) (2) (3) (4) (5) (6) (7) (8) (9) Constant -3.34** -2.79*** -2.21** -2.60** -2.63 -3.44*** -3.12** -3.65** -2.96* (1.50) (0.76) (1.03) (1.08) (1.11) (1.27) (1.24) (1.51) (1.50) Local-VC 50 0.69*** 0.16** 0.015** 0.17*** 0.17** 0.17*** 0.15** 0.17** 0.45*** (0.12) (0.06) (0.06) (0.007) (0.07) (0.07) (0.07) (0.07) (0.09) State-VC-Firms 0.009 -0.009 -0.009 -0.009 -0.009 -0.01 -0.009 -0.008 -0.01 (0.02) (0.008) (0.008) (0.008) (0.008) (0.008) (0.008) (0.008) (0.013) NAM99 0.28*** 0.29*** 0.29*** 0.29*** 0.29*** 0.31*** 0.31*** 0.25*** (0.02) (0.03) (0.03) (0.03) (0.03) (0.03) (0.03) (0.05) Awards99_01 -0.02 -0.05 -0.04 -0.07* -0.05 -0.05 -0.04 (0.03) (0.03) (0.04) (0.04) (0.04) (0.05) (0.05) Total-Exp91_00 0.89 1.16 0.22 0.56 0.061 -0.37 (0.73) (2.08) (2.18) (2.14) (2.18) (2.20) SciEng-Exp00 -3.07 3.92 1.02 -2.02 1.08 (22.8) (23.3) (22.9) (23.8) (25.6) Doctors98_01 2.84 2.11 1.90 2.56 (2.03) (2.01) (2.08) (2.38) Post-Doc98 -5.08** -4.76* -2.55 (2.49) (2.53) (2.96) OTT-Age 0.06 -0.03 (0.05) (0.06) Patents 69_00 0.008* (0.005) Private 2.97 0.46 0.37 0.59 0.60 1.29 1.12 1.68 -0.39 (2.29) (1.17) (1.16) (1.17) (1.18) (1.27) (1.25) (1.34) (1.47)
Pseudo R2 0.057 0.222 0.223 0.224 0.225 0.227 0.231 0.234 0.259 No. of Obs. 150 150 150 150 150 150 150 136 115
Note: Standard errors are in parentheses. *** Significant at the 1% level; ** significant at the 5% level; * significant at the 10% level.
40

Table 12: Tobit Regressions Using the Limited Sample [Dependent variable: number of academic entrepreneurs from a university]
(1) (2) (3) (4) (5) (6) (7) (8) (9) Constant 0.44 -0.064 -2.08*** -2.29*** -2.40*** -2.92*** -2.93*** -2.78*** -2.86*** (0.70) (0.50) (0.66) (0.69) (0.70) (0.80) (0.80) (0.95) (1.08) Local-VC 50 0.03 0.04 0.04 0.04 0.03 0.04 0.04 0.04 0.08 (0.08) (0.05) (0.05) (0.05) (0.05) (0.05) (0.05) (0.05) (0.08) State-VC-Firms 0.014** -0.001 0.002 0.002 0.003 0.003 0.003 0.004 0.008 (0.007) (0.005) (0.005) (0.005) (0.005) (0.005) (0.005) (0.005) (0.009) NAM99 0.18*** 0.09*** 0.08*** 0.08*** 0.08*** 0.08*** 0.08** 0.04 (0.02) (0.03) (0.03) (0.03) (0.03) (0.03) (0.03) (0.04) Awards99_01 0.07*** 0.06** 0.07*** 0.05* 0.05 0.05 0.07* (0.02) (0.02) (0.03) (0.03) (0.03) (0.03) (0.04) Total-Exp91_00 0.46 1.62 0.96 0.97 1.04 0.78 (0.47) (1.29) (1.36) (1.36) (1.39) (1.58) SciEng-Exp00 -13.8 -8.75 -9.82 -10.6 -9.08 (14.3) (14.7) (15.3) (15.9) (19.3) Doctors98_01 1.88 1.97 1.83 1.16 (1.24) (1.29) (1.34) (1.72) Post-Doc98 0.91 0.28 -0.31 (3.65) (3.70) (4.34) OTT-Age 0.007 0.002 (0.03) (0.04) Patents 69_00 0.002 (0.004) Private 2.08 0.52 1.05 1.19 1.27* 1.67** 1.67** 2.03** 1.65 (1.11) (0.76) (0.75) (0.76) (0.76) (0.81) (0.81) (0.87) (1.07)
Pseudo R2 0.015 0.143 0.161 0.162 0.163 0.167 0.167 0.162 0.147 No. of Obs. 146 146 146 146 146 146 146 132 112
Four outliers, Stanford, MIT, Harvard, and UC Berkeley, are excluded from the regressions.
Note: Standard errors are in parentheses. *** Significant at the 1% level; ** significant at the 5% level; * significant at the 10% level.
41
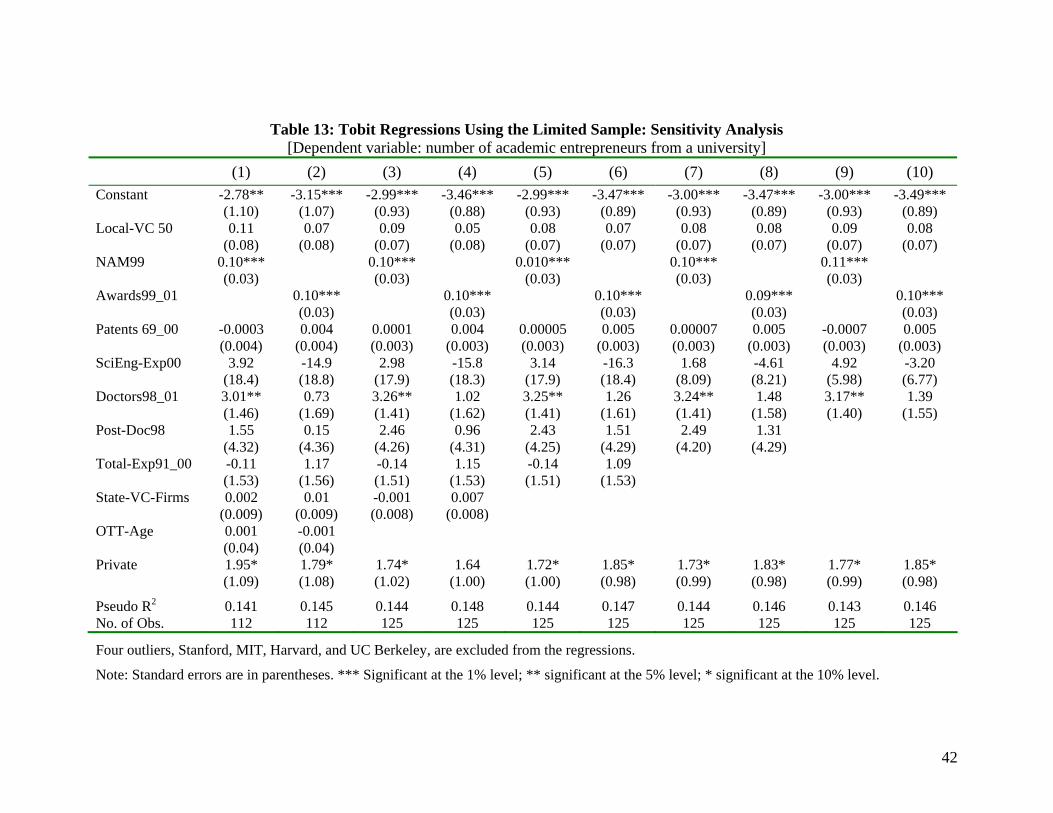
Table 13: Tobit Regressions Using the Limited Sample: Sensitivity Analysis [Dependent variable: number of academic entrepreneurs from a university]
(1) (2) (3) (4) (5) (6) (7) (8) (9) (10) Constant -2.78** -3.15*** -2.99*** -3.46*** -2.99*** -3.47*** -3.00*** -3.47*** -3.00*** -3.49*** (1.10) (1.07) (0.93) (0.88) (0.93) (0.89) (0.93) (0.89) (0.93) (0.89) Local-VC 50 0.11 0.07 0.09 0.05 0.08 0.07 0.08 0.08 0.09 0.08 (0.08) (0.08) (0.07) (0.08) (0.07) (0.07) (0.07) (0.07) (0.07) (0.07) NAM99 0.10*** 0.10*** 0.010*** 0.10*** 0.11*** (0.03) (0.03) (0.03) (0.03) (0.03) Awards99_01 0.10*** 0.10*** 0.10*** 0.09*** 0.10*** (0.03) (0.03) (0.03) (0.03) (0.03) Patents 69_00 -0.0003 0.004 0.0001 0.004 0.00005 0.005 0.00007 0.005 -0.0007 0.005 (0.004) (0.004) (0.003) (0.003) (0.003) (0.003) (0.003) (0.003) (0.003) (0.003) SciEng-Exp00 3.92 -14.9 2.98 -15.8 3.14 -16.3 1.68 -4.61 4.92 -3.20 (18.4) (18.8) (17.9) (18.3) (17.9) (18.4) (8.09) (8.21) (5.98) (6.77) Doctors98_01 3.01** 0.73 3.26** 1.02 3.25** 1.26 3.24** 1.48 3.17** 1.39 (1.46) (1.69) (1.41) (1.62) (1.41) (1.61) (1.41) (1.58) (1.40) (1.55) Post-Doc98 1.55 0.15 2.46 0.96 2.43 1.51 2.49 1.31 (4.32) (4.36) (4.26) (4.31) (4.25) (4.29) (4.20) (4.29) Total-Exp91_00 -0.11 1.17 -0.14 1.15 -0.14 1.09 (1.53) (1.56) (1.51) (1.53) (1.51) (1.53) State-VC-Firms 0.002 0.01 -0.001 0.007 (0.009) (0.009) (0.008) (0.008) OTT-Age 0.001 -0.001 ( 0.04) 0.04)( Private 1.95* 1.79* 1.74* 1.64 1.72* 1.85* 1.73* 1.83* 1.77* 1.85* (1.09) (1.08) (1.02) (1.00) (1.00) (0.98) (0.99) (0.98) (0.99) (0.98)
Pseudo R2 0.141 0.145 0.144 0.148 0.144 0.147 0.144 0.146 0.143 0.146 No. of Obs. 112 112 125 125 125 125 125 125 125 125
Four outliers, Stanford, MIT, Harvard, and UC Berkeley, are excluded from the regressions.
Note: Standard errors are in parentheses. *** Significant at the 1% level; ** significant at the 5% level; * significant at the 10% level.
42

43
Table 14: A Partial List of Nobel Laureates as Entrepreneurs, 1993-2005
Name Affiliation Nobel Prize Firm Founded Founding Year
H. Robert Horvitz MIT Medicine, 2002 NemaPharm (acquired by Sequana Therapeutics) and Idun Pharmaceuticals (merged with Apoptech)
1990, 1993
Leland Hartwell Fred Hutchison Medicine, 2001 Rosetta Inpharmatics (bought by Merck) 1996
K. Barry Sharpless Scripps Chemistry, 2001 Coelecanth (bought by Lexicon Genetics) 1996
Alan Heeger UCSB Chemistry, 2000 Uniax Corporation (acquried by DuPont) 1990
Paul Greengard Rockefeller U Medicine, 2000 Intra-Cellular Therapies 2002
Eric Kandel Columbia Medicine, 2000 Memory Pharmaceuticals 1998
John Pople Northwestern Chemistry, 1998 Gaussian 1987
Ferid Murad UT-Houston Medicine, 1998 Molecular Geriatrics Corporation (Acquired by Hemoxymed)
1992
Stanley B. Prusiner UCSF Medicine, 1997 InPro Biotechnology 2001
Richard E. Smalley Rice Chemistry, 1996 Carbon Nanotechnologies 2000
Alfred G. Gilman UT-Dallas Medicine, 1994 Regeneron Pharmaceuticals 1988
Phillip Sharp MIT Medicine, 1993 Biogen 1978
Robert H. Grubbs * CalTech Chemistry, 2005 Materia 1997
Source: Author’s search on the Internet.
* It is claimed that Robert Grubbs has founded four companies although I was unable to identify all of them. See, for example, http://www.neurionpharma.com/news0702grubbs.htm (accessed on January 18, 2007).