a study into the validation of atp testing devices for
TRANSCRIPT

A study into the validation of
ATP testing devices
for integrated cleanliness monitoring
within healthcare settings
Gregory Stuart Whiteley
School of Science and Health
Western Sydney University
AUSTRALIA
A thesis submitted in fulfilment
of the requirements for the degree of
Doctor of Philosophy (PhD)
1st August 2016


II
Acknowledgements
First is my thank you to Michelle, my best friend and wife.
And that thanks extends onto the others in my family including Jemima, Mitchell and Holly, the late
Rusty and also to Mimi. And to both my Mum and Dad, who have always believed in me. A belated
thanks also to the Late Dr Margaret Sheldon OAM, whom I know would be so proud and pleased for
me and the entire family group at finishing this PhD.
The list of work colleagues to thank includes especially my friends Darran Leyden and Phil Clulow for
their encouragement and support. Dr Trevor Glasbey is in a league of his own, but I will come back
to his contributions in comments below. Many other of the Whiteley Corporation company staff
have offered encouragement at critical stages including Darran Leyden, Phil Clulow, Skye Mentjox,
Gaye Lawrence, Greg Pobjoy and many others. And to my fellow Directors on the Whiteley
Corporation board, particularly my Chairman, Mr Bruce Robertson, but also to John Stewart and Phil
Morgan, a big thank you for your patience and support during the long period of the project.
The list of friends and peers who have offered friendship and support is also extensive across the
past eight years. People to mention include; Dr John Fahey, Paul Brennan AM, Professor Maree
Gleeson AM, Dr Kip Kippenhan, Roy Malkin, Professor Steven Spivak, Mattie Chinks, Jim Harris, Dr
Richard Shaughnessy and his wife Dr Ulla Haverinen-Shaughnessy, Professor Eugene Cole, Bob
Robinson and John Richter, Mark Tur, and Professor Laurie Walsh.
A special mention of thanks also to Mr Charles M Diker, who also encouraged my continuance and
had the patience to take some time with me in the midst of the commercial issues that could have
so easily diverted me onto a different pathway.
The list of academic colleagues for specific thanks for their contributions is also extensive and has
been so gratefully received. Thanks to Associate Professor Karen Vickery, Associate Professor
Cathryn Murphy, Associate Professor Brett Mitchell, Professor Phillip Carling, Professor Stephanie
Dancer, Professor Mary-Lou McLaws, UWS Professors, Dr John Bartlett and Professor Alison Jones.
And the assistance of my WSU co-authors was so graciously provided with real contributions from
Jessica Knight, Paul Fahey, Associate Professor Slade Jensen and Professor Iain Gosbell.
And thanks also to my other UWS/WSU colleagues. Specific thanks to my academic panel and in
particular to Dr Micheal Phillips, but also to Associate Professor Slade Jensen. Also thanks to the lab
staff in K2, and in particular to Carol Adkins. And also to my academic and work colleague Dr Trevor
Glasbey. Trevor has been a willing friend, colleague, co-author, editor and encourager. I could not
have achieved the full array of outcomes without the input and support of Trevor.
And finally to my principle supervisor, Dr Chris Derry. Chris has been my supervisor, educator,
colleague and collaborator. We have often worked remotely in a physical sense, but his oversight,
engagement and practical supervision of the project, papers and thesis has been closely felt. The
dynamic tension of the supervisor-candidate relationship has built and strengthened the project,
extended my learning and development, and achieved the final outcome of a PhD. Chris, Thank you.
The alpha and omega are to Michelle, whose encouragement and engagement in every aspect of the
work has been so deeply appreciated. Your faith in me and in God has spurred me on even when the
load and effort seemed so very overwhelming. Thank you, I love you.
AMDG
Greg S Whiteley

III
Preface
This completed document is submitted to Western Sydney University (WSU) in fulfilment of the
requirements of the Doctor of Philosophy (PhD) degree as a series of publications and overarching
statement. My initial enrolment in the higher degree program was in the first semester of 2008. The
project consisted in an initial literature review followed by a Confirmation of Candidature in 2010.
Shortly after the confirmation of the project, the research phase commenced and included
laboratory studies, a risk assessment study, five poster presentations, five publications arising from
the research including a field based pilot study which was described in the fifth publication, several
letters to the editor canvassing aspects of the research, and finally the compilation and presentation
of this thesis.
The requirements for awarding of a PhD by publication must include at a minimum four, full length,
scholarly and peer reviewed publications and an overarching statement as a thesis. This PhD thesis
includes five scholarly and peer reviewed publications as the second publication was published as a
‘research brief’, albeit with full peer review and within a special edition on environmental hygiene
through the journal Infection Control & Hospital Epidemiology.
The format of this thesis generally follows the WSU guidelines found in the Higher Degree Research
Examination Handbook (http://www.uws.edu.au/__data/assets/pdf_file/0019/
70822/ORS3474_HDR_Handbook_Exams_booklet_A5_LR3.pdf:doi 21st January 2016).
There are a number of minor exceptions from the guidelines within this thesis. Firstly the order of
inclusions is slightly varied to take account of the content, which is for a PhD thesis as a series of
publications. Secondly, the references appear at the end of each discreet chapter, both in the
compilation and each of the published references, published letters, and posters. At the start of each
of the first four chapters is a short precis which takes the place of an abstract for each chapter. This
precis outlines in a simple form the content to be appreciated through the following material.
The page numbering has been applied as per the WSU guidelines, excepting that the five
publications have retained their pagination as published. The page numbers applied to the section
headings have been kept in the proper sequence throughout the thesis.
I hope that you enjoy reading this account of the study and the published outputs arising from this
body of original work.
Greg S Whiteley
1st August 2016

IV
List of Abbreviations
Abbreviation Full form or title
ABHR Alcohol based hand rub
AJIC American Journal of Infection Control (Journal of)
ASID Australian Society of Infectious Diseases
ATCC American type culture collection
ATP Adenosine triphosphate
Cv Coefficient of variance
E coli Escherichia coli
FM Fluorescent marker
FMEA Failure mode effects analysis
HAI Healthcare associated infections
HCW Health care workers
HI Healthcare Infection (Journal of)
HIS Hospital Infection Society
HTO High touch object (or surface)
HPLC High Power Liquid Chromatography device
ICHE Infection Control and Hospital Epidemiology (Journal of)
ICU Intensive care unit
IFIC International Federation of Infection Control
LCMS Liquid Chromatography Mass Spectrophotometry
MRO Multi drug resistant organisms
MRSA Methicillin resistant Staphylococcus aureus
NHMRC National Health and Medical Research Council
NSW New South Wales
P aeruginosa Pseudomonas aeruginosa
RLU Relative light units
ROC Receiver operating curve
SHEA Society for Healthcare Epidemiology of America
S. epidermidis Staphylococcus epidermidis
TGA Therapeutic Goods Administration
The 5 moments The 5 Moments of Hand Hygiene campaign
TSB Triptone soy broth
VRE Vancomycin resistant Enterococcus (faecium or faecalis)

V
Glossary of Terms
Term used Definition for this thesis
Biofilm A group of bacteria which are joined together in a material that has been produced
by bacteria, and which provides a sustainable framework for bacterial survival,
growth and dissemination
Cleaning The process of removal of soils including unwanted microorganisms from a surface
Colonisation The presence of a microorganism on the skin or other body cavity of a patient or
health care worker
Disinfectant A product which kills a defined number of microorganisms and which is registered in
Australia as either: i. Disinfectant – Hospital Grade; ii. Disinfectant – Instrument
Grade or iii. Sterilant; under the Therapeutic Goods Order 54, 1996 (as amended)
which provides the Australian regulatory framework for Disinfectants and Sterilants
Hazard Anything which has the potential to cause or result in harm to an individual or
environment
Health Care Worker A doctor, nurse or other person employed and working within a health care
setting and who is performing duties pertaining to patient health or maintenance of
the hospital or health care environment.
Hygienic A state of cleanliness of a surface which has no hazards present
Infection A patient status where a microorganism has begun to grow inside a normally sterile
area of a person, and which growth has triggered an immunological response within
that person
Risk The probability of a change in status, either adverse or positive in nature
Risk Assessment The detailed analysis of the risk of different outcomes arising from a process
or of processes (such as cleaning or cleaning monitoring)
Sanitising The process of removing microorganisms sufficiently well to be considered hygienic
Soil Foreign matter on a surface which may or may not include microorganisms
Surface The outside of an object, implement, wall, desk or other piece of furniture, or any
other item used within a healthcare setting

VI
List of Tables Page
Table 1 The methods used in the Five Whiteley papers 26
List of Figures Page
Figure 1 Cleaning Process Risk Overview: taken from Whiteley Poster 10
Figure 2 Coefficient of Variance for three portable ATP bioluminometers 13
Figure 3 An integrated model for cleaning monitoring 15

VII
Table of Contents Page Number
Section One: The overarching statement
Abstract The Abstract for this PhD thesis 2
Introduction An outline of the entire research project 3
Chapter 1 The evolution of the research project 8
Chapter 2 Methods used within the study 32
Chapter 3 A thematic & critical review of each of the papers included for PhD 43
1st Paper Reviewed 45
2nd Paper Reviewed 49
3rd Paper Reviewed 51
4th Paper Reviewed 55
5th Paper Reviewed 58
Chapter 4 Conclusions and Recommendations 66
Section Two: The five publications 78
Chapter 5 The comparative performance of three brands of portable ATP-bioluminometer intended for use in hospital infection control 79
Chapter 6 Reliability Testing for Portable Adenosine Triphosphate Bioluminometers 87
Chapter 7 Failure analysis in the identification of synergies between cleaning monitoring methods 91
Chapter 8 The Perennial Problem of Variability In Adenosine Triphosphate (ATP) Tests for Hygiene Monitoring Within Healthcare Settings 99
Chapter 9 A pilot study into locating the bad bugs in a busy intensive care unit 106
Section Three: Appendixes 113
Appendix A Other papers published as part of the PhD study 114
A.1 Letter to the editor: The importance of stakeholder consultation for infection control guidelines: Healthcare Infection: 2009:14:9 115

VIII
A.2 Letter to the editor: Flawed recommendations on
surface hygiene within the existing Interim Influenza Pandemic National Infection Control Guidelines: Healthcare Infection: 2009:14:177-179 117
A.3 Letter to the editor: Sampling plans for the use of rapid adenosine triphosphate (ATP) monitoring must overcome variability or suffer statistical invalidity: Infect Control Hosp Epidemiol: 2015:36:236-237 121
A.4 Letter to the editor and reply: 125 A.4.1 Roady L: The role of ATP luminometers in infection control: Infect Control Hosp Epidemiol: 2015:36:1367 126
A.4.2 Reply to Roady: Infect Control Hosp Epidemiol: 2015:36:1368 127
Appendix B Posters presented as part of the PhD study 128
B.1 The Importance of Practical Zero in cleaning 129 performance indicators: IFIC 2011
B.2 Validation of cleaning indicators for healthcare surfaces: IFIC 2011 130
B.3 The problem of rapid ATP systems many be scaling using Relative Light Units (RLU): HIS 2014 131
B.4 Evidence based cleaning and cleaning validation using FM and ATP systems: HIS 2014 132
B.5 A new method for practical quality control in monitoring the cleaning of healthcare surfaces: ASID 2015 133
End page 134
1
A study into the validation of
ATP testing devices
for integrated cleanliness monitoring
within healthcare settings
Gregory Stuart Whiteley
School of Science and Health
Western Sydney University
AUSTRALIA
1st August 2016

2
Abstract There is a problem in hospital cleaning. There is currently no scientific monitoring method that
provides timely and reliable assurance that harmful bacteria have been removed by the cleaning
processes.
This PhD investigates the validation of commercially available testing devices intended for the rapid
detection of adenosine triphosphate (ATP), which may provide a quantitative surrogate estimate of
surface cleanliness based on ATP measurements. The findings indicate that ATP testing devices,
despite problems with scaling and imprecision, provide immediacy in readings which enables the
incorporation of ATP testing into an improved and integrated cleanliness monitoring process for
applications within healthcare settings.

3
Introduction There is a problem in hospital cleaning. The problem is that there is no accepted and credible
scientific measurement of the outcome resulting from the cleaning process. A monitoring approach
is required that can reliably assess both the efficacy and efficiency of hospital cleaning and the
standard of cleanliness of healthcare surfaces.
There are two existing methods which are used to verify the cleaning and both are inadequate. The
most common method of cleaning monitoring is visual inspection, which whilst it is quick and easy, is
not overly scientific. Visual inspection in isolation cannot assess if the cleaning process has occurred,
nor the time since the cleaning process on a particular surface was completed and the visual
appearance does not correlate with actual surface cleanliness using microbiological methods.1
The other existing method of cleaning monitoring is environmental or surface microbiology which
takes too long between sampling and obtaining results, is expensive, and has sampling difficulties.2
There are two new methods proposed to measure and monitor cleanliness.
The first new monitoring method utilises hand held devices that rapidly measure the presence of
adenosine triphosphate (ATP). ATP is present in all living cells and the presence of ATP is proposed as
a proxy indicator of surface soiling with biological based materials.1
The second new cleaning monitoring method uses a fluorescent mark (FM) to assess the efficiency of
a cleaning process an environmental surface (FM spot removal).3
Both of the new methods provide timely information for monitoring purposes and both may be
integrated into cleanliness monitoring processes for hospital applications.4
This PhD study investigates the validation of several commercially available, rapid ATP testing
devices, which can be used to provide a quantitative estimate of surface cleanliness based on their
ATP measurements. Rapid ATP testing devices make use of the ‘firefly reaction’ to generate and
measure a luminescent reaction which is loosely proportionate to the level of cellular soiling present
on a surface (ATP + Luciferase = Light). This light response is expressed in a scale known as Relative
Light Units (RLU).
The results from the studies in this PhD are published in the five included published papers. These
findings indicate that rapid ATP testing, despite imprecision and scaling difficulties, can be included
in an integrated monitoring processes, albeit with careful consideration over sampling methodology
and the interpretation of the data/readings arising from the use of rapid ATP devices.

4
The four chapters which follow this introduction are the overarching statement that explains the
examinable work. The first chapter outlines the evolution of the project; the second chapter reviews
the methods used in the five papers; the third chapter provides a detailed discussion over the
context and implications arising from each of the papers, and finally a fourth and concluding chapter
summarises the key findings.
The five published papers each examines a different aspect of the overall validation and integration
of rapid ATP testing into a cleanliness monitoring process. The five papers are included after the first
four chapters, and are described briefly as follows.
The first paper outlines the findings of a series of studies of three commercially available ATP testing
devices, to describe and document the dynamic range, upper and lower limits of detection, linearity
of response and the precision of response of each ATP device. The accuracy of response which
would normally be included in validation studies could not be conducted due entirely to the relative
and idiosyncratic scaling used by each branded ATP device. A novel method of direct application of
pure ATP was developed to establish device validation without interfering with the individual dose
responses of each commercial device. The findings of this paper indicate the key features of each
ATP device against the core validation criteria.
The second paper (which is a short ‘Research Brief’), applied the findings from the first laboratory
study and, using the statistical measure of Coefficient of variance (Cv), presented graphical
information on the uncontrolled variability of the ATP devices. The measurement of Cv is obtained
by dividing the mean into the standard deviation for each data set and allows dis-contiguous data
sets to be normalised for comparative purposes. The results demonstrated that when challenged
using pure ATP, all of the ATP testing devices displayed a Cv above 0.4. This was surprisingly high
when compared to the calibrated High Performance Liquid Chromatography (HPLC) results.
The third paper in chronological sequence considered the findings arising from the laboratory
studies to consider the risks arising from integrating ATP testing into a cleanliness monitoring
program. The paper used a risk assessment tool known as Failure Mode Effects Analysis (FMEA) to
assess each of the cleaning monitoring methods (visual inspection, surface microbiology, ATP testing
and FM). The findings indicated that by combining the four cleanliness monitoring methods into a
single integrated monitoring process, the strengths of each method could be used to mitigate the
weaknesses from each of the other monitoring methods. This finding is presented as a novel and
new approach for integrating the cleanliness monitoring for use in healthcare settings.

5
The fourth paper (in the chronological sequence of publication) applies the results from the first and
second studies and extends this analysis to include the use of bacterial species in addition to pure
ATP. This provided a more comprehensive measure of the precision of the dose-response for each of
the ATP testing devices. The variability of the dose-response was again examined using Cv, which is
fully described in the paper. The experiments included a fourth ATP device and results demonstrated
that the Cv (variability) for each of the tested ATP devices was in excess of Cv > 0.4. The high
variability suggests that any reading taken on any of the four ATP devices has a 20% chance of being
wrong by a factor of 2. This finding has important sampling and interpretative implications for those
using rapid ATP testing devices in cleanliness monitoring.
The fifth and final paper applied knowledge obtained during the earlier published studies and
applied this learning into a field based pilot study investigating an integrated cleanliness monitoring
approach. This paper was selected as the lead article in the December 2015 issue of the American
Journal of Infection Control. There were a number of key findings, and importantly the use of rapid
ATP testing applied within an integrated cleanliness monitoring process was shown to be
significantly better than using a traditional, one dimensional, list based sampling approach.
This PhD is the accumulation of a single and contiguous group of studies which examines the
validation and performance of ATP testing devices. This PhD further investigates the incorporation of
rapid ATP testing devices within an integrated cleanliness monitoring process for healthcare settings.
The results demonstrated in this PhD underpin an enhanced scientific platform for on-going research
to further improve the reliability of cleanliness measurements within healthcare settings. This thesis
is submitted for the satisfaction of requirements for the awarding of a Doctor of Philosophy Degree.
Goals for the study
In the Confirmation of Candidature (March 2010), the overarching aim of the research was to:
“…investigate an integrated approach to cleanliness monitoring, relying on modern scientific
methods… that reflects a truly validated standard of cleanliness at a sub-visual level. An accurate
appreciation of actual surface hygiene and cleanliness can then more accurately inform infection
control practice. By demonstrating that interpretation and validation of cleaning in health care be
improved this will remove a critical current confounding factor (validity of cleaning processes) that
contributes to the difficulty in preventing the spread of HAI within the health care setting.”

6
The initial research goals of the project were to:
1. Conduct a series of validation studies of the new cleanliness monitoring methods of ATP
testing and FM spots to confirm their scientific validity for field use; and
2. Compare the ATP and FM methods with visual inspection and microbial recovery so as to
develop an integrated approach to cleanliness monitoring which is scientifically valid; and
3. Complete a field based cleanliness monitoring study using an integrated model within a
healthcare setting to demonstrate the value of improved scientific measures of cleanliness
monitoring for use in practical infection control.
Following the initial laboratory studies it became clear that the FM approach measured cleaning
efficiency (i.e. the physical effort of wiping a surface – a qualitative factor) and did so with
robustness. Validation studies published by Carling and others established FM as a reliable measure
of cleaning effort and efficiency.
However, ATP testing systems measure the output of cleaning effort through assessment of the
quantitative cleanliness level achieved through the cleaning process (a quantitative factor).
Unfortunately, it became quickly apparent that ATP testing systems required substantially greater
laboratory experimentation in an effort to achieve a validated status upon which ATP testing could
be used reliably for cleanliness monitoring within healthcare settings.
The confirmed goals for the research project were to:
1. Investigate the validation of ATP testing systems for reliable cleanliness monitoring; and,
2. Investigate the four major cleanliness monitoring methods (ATP, FM, visual inspection and
microbial recovery) to provide a reliable and integrated method of cleanliness monitoring
within healthcare settings: and,
3. Investigate the application of an integrated cleanliness monitoring process for practical
infection prevention within a healthcare setting.
The hypothesis being tested is:
“ATP testing is a valid and reliable method of cleanliness monitoring which can be incorporated into
an integrated cleanliness monitoring methodology for use within healthcare settings to improve
practical infection control”.

7
References
1. Griffith CJ, Cooper RA, Gilmore J, Davies C & Lewis M. An evaluation of hospital cleaning regimes and standards. J Hosp Infect:2000:45:19-28
2. Griffith CJ. Surface sampling and detection of contamination. In Handbook of Hygiene Control in the Food Industry. 1st Edition, Woodhead Publishing Ltd, Cambridge UK
3. Carling PC, Briggs J, Highlander D, Perkins J. An evaluation of patient area cleaning in 3 hospitals using a novel targeting methodology. Clinical Infect Dis:2006:34:513-519
4. Boyce JM, Havill NL, Havill HL, Mangione E, Dumigan DG, Moore BA. Comparison of fluorescent marker systems with 2 quantitative methods of assessing terminal cleaning practices. Infection Control Hospital Epidemiology: 2011:32:1187-1193

8
Chapter 1
The evolution of the research project
Précis
This PhD project was commenced in 2008 on a part time basis through the school of Science and
Health at Hawkesbury Campus at Western Sydney University. The overall aim of the research
program was to examine cleanliness monitoring within healthcare settings, with a particular focus
on the validation of rapid ATP testing. The experimental goal was to validate ATP testing as a reliable
and quantitative mechanism for the assessment of surface cleanliness prior to any practical
verification of the use of ATP testing within a healthcare setting.
This chapter sets out the background for the project, the development of the literature over the
period of the project and the chronological development of the project. The stages of the project
outlined include the validation of the rapid ATP testing systems, the development of an integrated
framework for cleanliness monitoring arising from a risk assessment, and a final field based study
within a healthcare setting which applied the teaching from the earlier project results.
Chapter 1 outlines the single and focused theme of the project across each of the five research
publications to create a single body of novel work for this PhD project.
The Background to the project
At the time of commencement of the project in 2008, the problems of multi drug resistant
organisms (MRO), and particularly methicillin resistant Staphylococcus aureus (MRSA) were
recognised as a significant cause of morbidity and mortality through healthcare associated infections
(HAI) in Australian hospitals.1 There had been a dramatic increase in hospital cross-infections in
many western countries over the past decade. In the United States, nosocomial infections of HAI
were ranked among the top ten causes of death.2 In Australia, it is estimated that 50% of all multiple
resistant Staphylococcus aureus (MRSA) infections are HAI, with an 11% case fatality rate.3 There is
also extensive evidence of transmission of other bacterial pathogens such as Enterococcus species,
including Multi Resistant Organisms (MRO) via healthcare settings, and particularly involving
contaminated surfaces.4,5

9
Apart from morbidity and mortality, the economic impact is considerable. The annual number HAI
cases in Australia is thought to be approximately 200,000.6 A recent study estimated that a 1%
reduction in HAI’s should be attainable through a modest improvement in infection control and
would free up 38,500 hospital beds annually.7 The cost associated with HAI is a significant drain on
the health care system and is estimated in terms of billions of dollars in the USA alone.8 Equivalent
cost data for Australia is not available, but the Australian Commission on Safety and Quality in
Healthcare (ACSQH) acknowledges broadly that around half of all HAI are preventable through
better infection prevention practices.9
The first tier response to the growing burden of HAI from the global clinical community, including
Australia, was to focus on hand hygiene as a principle infection prevention intervention, and so the
‘5 moments of hand hygiene’ campaign (‘the 5 moments’) was developed and accepted
internationally.10-12 ‘The 5 moments’ campaign recognised that bacteria can move via unwashed
hands from surface to surface.13 Studies had shown that where hand hygiene compliance was
reduced the risk of nosocomial transmission of MRO increased.14 The goal of ‘the 5 moments’
campaign was to increase the frequency of hand hygiene compliance amongst all health care
workers (HCW) and particularly attending clinicians.
In Australia, hand hygiene products with bactericidal claims which are intended for hospital or
healthcare usage, are controlled as medicines by the Australian Government regulator, the
Therapeutic Goods Administration (TGA). The ‘5 moments’ shifted the focus of hand hygiene onto
the effective use of alcohol based hand rub (ABHR) products to speed up the efficiency around hand
hygiene compliance and to allow bedside application of ABHR without need of a sink and running
water.12 The effective use of ABHR, with proven bactericidal properties, increased the likelihood that
MRO that had been picked up on HCW hands via unhygienic surfaces, would be killed on the hands
by the ABHR prior to transmission to another surface or object.
Whilst hand hygiene was the significant focus, no studies in Australia had considered the corollary
issue of surface hygiene, and the effectiveness of cleaning and disinfecting of the patients’ surrounds
and the hygienic standards of cleanliness for general hospital surfaces. Whilst visual inspection was
the primary cleaning and cleanliness monitoring method, it was suggested to define cleanliness
standards in terms of bacterial contaminants present on healthcare surfaces.15 Authors such as
Dancer and Carling have noted that the microbes that are most frequently responsible for HAI are all
recognised as organisms that can survive for long periods of time on environmental surfaces and
that these surface are also the surfaces most frequently touched by healthcare workers.16,17 More

10
recent work has demonstrated that these organisms can survive within dry surface biofilms on
common hospital surfaces and can remain viable for many years.18
The former President of the Society of Healthcare Epidemiologist of America, Professor Robert
Weinstein has commented that whilst a large amount is known about the genetics of organisms
responsible for HAI, the precise mechanisms of development of antibiotic resistance and the
interaction of these bacteria in the hospital environment continues to be poorly understood from a
preventative perspective.2 Environmental surfaces are recognised as an important reservoir for
infectious agents of such nosocomial infections.19
One key study indicated that prior occupancy of the same bed or hospital room was a key indicator
for the likelihood of a subsequent patient acquiring the same organism thus suggesting poor
cleaning as a small but important causal link to HAI.20 The issue of prior patient infection
transmission risk was also more recently confirmed in a meta-analysis.21 MRSA was identified as
strongly associated with hospital surface contamination and nosocomial transmission when
comparing environmental and patient isolates.22 Gram negative bacteria are also responsible for HAI
and are similarly associated with environmental contamination that could be controlled by improved
cleaning processes.5
Some lamented modern hospital hygiene practices including disinfectant usage and harked back to
the days of Florence Nightingale.23 The need to reconsider hygiene standards and methods for the
monitoring of cleanliness of healthcare surfaces required urgent attention.16
The TGA had instituted rigorous and mandated, pre-market, in-vitro testing requirements for
hospital grade surface disinfectants since 1996.24 Despite the regulatory controls, there was a view
that disinfectants were both undesirable and unreliable, and additionally that cleaning was the key
issue for effective hospital hygiene and cleanliness.6
The issue of disinfectant expertise within policy setting documents of the same period was a major
concern. One authoritative Australian Government policy document contained poorly considered
information on cleaning and disinfecting of instruments possibly exposed to prion contamination
and this was criticised via a letter to the editor from this author (see Appendix A1).25 A second
document, published shortly thereafter by another Australian Government body, made
recommendations on surface decontamination in regards to influenza virus which ignored the
Australian Commonwealth legislation on disinfectants (see Appendix A2).26
Whilst disinfectants and their use were being ill-considered, it seemed that the important corollary
issues around the hygienic status and the cleaning of surfaces (what gets touched and how to clean

11
them) were being uniformly overlooked and particularly so in Australia. The risk arising from this
omission in approach was that disinfectant failure may have been solely as a result of the first
chronological task of cleaning. No risk assessment was apparently conducted to identify this issue
and even in relevant healthcare cleaning standards – such as the NSW Infection Control Policy of
2007 – the process of cleaning prior to disinfectant usage was not defined.27
In the 2010 Australian Infection Prevention Guidelines the cleaning process always precedes the
disinfecting, and so to ensure that the disinfectants work correctly, it is important to understand the
initial cleaning step as a quality assurance opportunity and eliminate cleaning as a variable for
disinfectant performance.6 To add to the confounders, whilst the disinfectant products are regulated
by the TGA, the cleaning products are unregulated. The process of surface disinfection is therefore a
two-step process involving an unregulated product use (for the cleaning process) followed by the
use of a regulated disinfectant for the disinfecting process.
Cleaning of the environment has long been regarded as the essential first step in the major
guidelines for Infection Control within health care settings and yet not one of these major
documents defines the term “clean” in any quantitative manner.6,28,29 The closest to a definition of
“clean” is with the process of “cleaning” which is defined as “the removal of soil and a reduction in
the number of micro-organisms from a surface”.29 The primary shortfall with cleaning in hospitals in
Australia and elsewhere is in the measurement of the efficiency and effectiveness of the cleaning
processes due to the reliance on visual assessment alone for performance monitoring.
The primary mechanism for monitoring both what is ‘clean’ and also the process of cleaning is visual
inspection. No other routine monitoring has been recommended in any of the major reference
standards. Routine microbiological examination is not recommended in Australia or the USA.6,28 If a
surface therefore appears to be acceptably visually clean, and the audit tool developed in Victoria
scores the surfaces as clean, then it is deemed to be clean.27,30 There is no recognised or accepted,
quantitative standard for what constitutes a clean surface, nor how it could be measured.31
The benefits of improved cleanliness or cleaning have been demonstrated. A study at Rush Medical
Center in the USA with Vancomycin Resistant Enterococci (VRE) positive patients, demonstrated that
with every 10% improvement in cleaning, there was a 6% reduction in the recovery of VRE within a
contaminated ICU.5 In a Scottish hospital with active MRSA patients and HAI – MRSA transmissions,
the rate of transmission dropped significantly with the addition of just a single extra cleaning staff
member.32 Work with additional cleaning during an outbreak with a multi drug resistant
Acinetobacter baumannii (MRAB) showed similar reductions in cross infections with cleaning
enhancements.33 The question is how to measure the cleaning and ensure that the standard of

12
cleaning processes regularly meets the standard of quantitative cleanliness that is desirable to
reduce the risk of cross infections or HAI. The literature provided no clear answers on how to make
cleaning improvements and permanently implement and provide a measure of quality assurance for
these cleaning outcomes.
This gap in the literature around cleaning within healthcare focused the project onto the definition
of healthcare surface cleanliness, and immediately two separate process issues became apparent.
The first was the cleaning process itself, and the second was the outcome from the cleaning
processes. Visual inspection and surface microbiology were insufficient to meet the requirements of
a modern hospital. At that time, the literature suggested two new methods of cleaning validation for
investigation. The two new methods proposed for applications within healthcare settings were the
use of rapid ATP testing (ATP), and fluorescent marker technologies (FM), which is where the
following description of the laboratory phase of the project commences.
Some Background on ATP testing
Adenosine Triphosphate (ATP) is present in all living cells and testing using ATP portable devices was
first developed for the food industry.34 The first published study using ATP testing to measure
cleanliness within healthcare settings came later.35 ATP is detected using the “firefly reaction” and
the amount of light liberated in this reaction is roughly proportional to the amount of ATP present in
a sample.36
The handheld and portable ATP testing devices measure all available ATP in a swab sample by firstly
lysing any cells to liberate the ATP present, and then measure the light output from the luciferase
reaction using a Photo Diode Array or a Photo Multiplier.37 However, these devices do not
distinguish between the sources of ATP and so any cells present (human, plant or bacterial cells) will
yield a volume of ATP against which the light reaction will occur. Consequently, the use of ATP
testing cannot be directly correlated with bacterial contamination, but only cellular contamination
(all sources).
So, ATP testing is proposed a surrogate of cellular soiling in general, and not specifically bacterial
soiling. To add to complications in use, ATP testing cannot distinguish on the basis of resistance or
susceptibility to antibiotics (MRO). Review articles on the use and abuse of ATP testing have noted
these shortcomings, which is discussed later and within the presented papers of this thesis.38 The
use of modern selective growth techniques and the application of modern genetics in microbiology
(such as whole genome sequencing) are both essential for the detection and specific identification of

13
MRO as indicated later in the thesis. These improvements to specificity in microbial identification
with MRO dramatically improve our understanding of the movement of MRO within and without the
healthcare setting in both spatial and temporal aspects.39
The Initial Laboratory Phase
The use of rapid ATP testing had become available to the food microbiology sector in late 1998 with
the innovation of hand held (portable) ATP testing devices and accompanying consumables. The use
of rapid ATP testing was suggested in 2000 as a superior method to both visual inspection and
microbial recovery methods for cleaning validation within healthcare settings.35 This application of
rapid ATP testing was being explored with field studies on the practical implementation of rapid ATP
testing as a surrogate method for cleaning validation within hospital settings.40-44
The other new method of cleaning validation used a fluorescent marker (FM) and had been
developed by Dr Philip Carling, an Infectious Diseases clinician who was concerned that critical
cleaning required practical verification.17 This new FM technology allowed tracking of cleaning
action, and whilst being a qualitative measurement, the FM appeared to work well as a quality
improvement technique.45 The use of an FM was shown to aid in the reduction of Staphylococcus
aureus nosocomial infection rates when included as part of a cleaning intervention during an
outbreak of disease.46
The starting point for this PhD project at the Confirmation of Candidature (COC) was a research
proposal which included the validation of cleanliness monitoring methods by comparing the new
methods (ATP and FM) with the two existing methods (visual inspection and microbial recovery). The
project would move from a laboratory based validation process (focused on rapid ATP testing and
FM usage) and then move into a risk assessment that subsequently applied the findings of validation
studies and risk assessment and tested these findings within a healthcare setting.
The initial studies arising from the COC project proposal quickly identified that the validation of the
ATP testing systems required more laboratory based research than was initially anticipated. The first
laboratory study subjected samples of the Fluorescent Marker (FM) to a range of drying studies to
qualify the characteristics as described in the literature. A key observation was that the ATP devices
were measurement tools (quantitative), whereas the FM was an observational (qualitative) tool.
The initial experimental results were expressed through two Poster Presentations in 2011 at the
International Federation of Infection Control meeting in Venice (Appendix B1 and B2). A result of the

14
early findings included a risk-based approach to cleaning monitoring which is shown on the poster
titled “The importance of practical zero in cleaning performance indicators” (Appendix B1). The flow
chart presented on the poster is shown as Figure 1.
The goal of a cleaning process is soil reduction or microbial removal and there are four possible
outcomes from any monitoring process. The four possible outcomes are also individual risk elements
of a cleaning process being true negative, false negative, true positive and false positive. Each of
these risk elements has implications for cleaning management and infection prevention. The
cleaning process involves a cleaning activity that should be measurable (efficiency monitoring) and
the cleaning outcome that should also be measurable (efficacy monitoring). Whilst ATP testing
measures the efficacy of the process, it is the role FM to measure cleaning efficiency.
The experimental results for FM were described on the second poster (“Validation of cleaning
indicators for healthcare surfaces”) at the same IFIC 2011 Conference (Appendix B2).
Figure 1: Cleaning Process Risk Overview (source: Whiteley Poster: Appendix B1)
Cleaning Process Conducted
Cleanliness Assessed
Negative for soil present
TRUE
1. Reuse without
risk
FALSE
2. Heightened Risk with
Reuse
Positive for soil present
TRUE
3. Mitigation has reduced
risk
FALSE
4. Mitigation has imposed unnecessary additional
costs

15
The Validation experiments with ATP testing devices and consumables
The laboratory work examining the validation of the ATP devices used a known source of
standardised ATP in controlled dilution series. This experimental work used a new method to
conduct the validation by applying the diluent directly onto the swabs using a micro-pipette. The
study was based on standard validation methods as outlined in the International Conference on
Harmonisation (ICH) Guidelines on validation for the pharmaceutical industry which calls for
separate validation for each of the known variables.47
In using an ATP testing device, a pre-prepared swab (consumable) is used to wipe across the surface
to be tested, which is then recapped, and the reagent (which is contained in the proximal end of the
swab) is released onto the swab which allows the ATP-Luciferase reaction to initiate. There is a short
activation time of around 15 – 30 seconds during which time the swab is inserted into the ATP
measurement device for detection of the light arising from the reaction. The light is measured by the
ATP testing device and the measurement is expressed as relative light units (RLU).
The first and primary consideration in the validation process for the rapid ATP testing devices and
their consumables is the reliability of the core chemical reaction between the Luciferase and the ATP
and the quantification of RLU expressed as a result of the reaction. The initial validation started with
testing the dose-response of the devices using this core chemical reaction process before any other
variables were introduced to the validation experiments.
The additional variables present when using a rapid ATP device and consumables as intended,
include the swab ‘material’, which was identified as an independent variable in its own right (the
first independent variable in addition to the core biochemical reaction). The swabbing process is a
separate, second independent variable. The reagent containing the luciferase must also contain a
separate chemical reagent which will induce cellular lysis to liberate the intercellular ATP, and this
lysis process is yet another and third independent variable. So, before the essential reaction can
occur, there are at least three separate variables which could each independently effect the results
of the validation.
In order to avoid confronting these variables, the decision was taken to use a calibrated micro-
pipette which would apply the ATP in quantitative volumes directly onto the swabs, thus focusing
the testing purely on the performance of the devices/consumables against pure ATP solution in a
quantitated dilution series. This was a previously unpublished method for this type of validation
study and has subsequently had citations in peer reviewed publications looking into ATP studies.

16
The results of the study were therefore a more accurate indication of validation of ATP devices than
any prior studies, all of which were either field based or subject to the combination of all four
variables (dose response; swab material; swab technique; and lysis chemistry). The other key issue
arising from the research was that a sufficient number of replicates at each dilution point were
required to establish precision at each sample point which was also a previously unreported finding.
This was an important observation due to the variability observed in the first experimental phase.
The results from the first validation study of the three ATP bioluminometers were analysed and
submitted for publication. The first full paper arising from the laboratory studies on the three ATP
devices was submitted to the journal, Healthcare Infection (CSIRO publications), was accepted into
peer review in June 2012 and was accepted for publication in July 2012.48
The key findings of the first paper were threefold. Firstly, the scale used to express the measurement
of ATP uses Relative Light Units. Whilst all of the commercial ATP devices make use of the same
equation (one ATP unit plus one Luciferase Unit gives one light unit), each of the devices applies a
different algorithm to express the measurement of light units and even the method of light
detection varies between different branded ATP devices.37 So, whilst the same equation is used as
the underlying technology, the expression of RLU is relative in every sense. There is no standardised
scale and so each ATP device will express a quite different number when measuring a standardised
ATP quantity. The lack of a standardised scale means that different brands currently have no
interoperability. The lack of a standardised scale also means that any calibration tool is relative to
that device only and has no universal applicability. Without a standardised measurement scale,
accuracy of measurements cannot be assessed.
Secondly, the ATP devices were reasonably reliable when testing against a ten-fold dilution series
(and taking the median reading as indicative). An important contribution of the findings arising from
the log scale dilutions was that all three ATP devices tested did demonstrate a uniform linearity of
response over the core part of the dynamic range. However, all of the ATP devices tested were
highly unreliable at testing a 20% dilution series. The uncontrolled variability revealed through a
standardised laboratory validation process was both surprising and unexpected. Interestingly the use
of medians to express a group of readings was more reliable than averages due to the frequency of
outliers (which was also part of the novel result).
Thirdly, there was no way for a normal user to detect the level of variability when using an ATP
device. Therefore, the applicability of ATP devices to perform a role in validation of cleaning was
undermined by the limitations of the devices.

17
Lord Kelvin once wrote:
“I often say that when you can measure what you are speaking about, and express it in numbers, you
know something about it; but when you cannot measure it, when you cannot express it in numbers,
your knowledge is of a meagre and unsatisfactory kind; it may be the beginning of knowledge, but
you have scarcely in your thoughts advanced to the state of Science, whatever the matter may be." 49
The basis of measurement sciences is that the numbers produced can be relied upon to accurately
express the underlying measurement. The first paper arising from this study demonstrated that this
fundamental principle of reliability of measurement was seriously compromised when using rapid
ATP devices. Further work was required to understand and quantify the level of variability.
The work on reliability was extended in the second paper by using a simple but elegant statistical
tool known as the Coefficient of Variance (CoV or Cv).50 Cv divides the standard deviation into the
mean and gives a number that should be always between zero and one. The lower the number, the
lower the variance. The Cv is the inverse of the engineering equation most frequently known as the
signal to noise ratio (mean divided into standard deviation).
Fortunately, the first experimental series used a large number of replicate readings at each
concentration point, for each of the ATP devices. From this data set, the mean and standard
deviation were calculated for each discreet concentration point with that associated sample group
(same ATP device, same concentration and multiple readings at that concentration) and from there
the Cv was calculated for each ATP device at each concentration.
In this first experimental series a standardised and validated laboratory analytical tool (HPLC option
on the Liquid Chromatograph – Mass Spectrometer, or LCMS) was also used to measure
standardised ATP, and this provided a comparative data set. The Cv for the HPLC was very low,
whilst the Cv for each of the commercial ATP devices was routinely high.
Another advantage of the Cv over the more frequently used standard deviation, is that whilst the
standard deviation is unique for each of the discreet sample groups, the merging of Cv and average
into a single ratio, normalised all of the data from each of the discreet sample groups, thus allowing
a true comparison. Figure 1 from the second paper is shown below in colour to illustrate the
problems of variability observed in this first experimental series.
The authors’ initial experimental studies on the ATP testing devices demonstrated that instrument
performance required additional consideration in regards to validation and to practical use. A
limitation of the first laboratory study on ATP testing devices which provided the data for the first
and second published papers, was that the testing was limited to only pure ATP solutions. This

18
opened a reasonable opportunity for additional study using bacteria. Studies were commenced
using bacteria to challenge the performance of ATP testing devices.
Figure 2: Coefficient of Variance for three portable ATP bioluminometers (source: second
Whiteley Paper: ICHE 2013:34:538-540)
Consideration of Failure Risk arising from Cleaning Monitoring Methods
Whilst this laboratory based research into ATP device variability was continuing, an important
strategic question arose in regard to the findings. The initial two publications had demonstrated that
the reliability of measurements was an underlying and uncontrolled variable for the field use of ATP
testing within healthcare settings. The next question was to consider the impact of the published
findings (from the first two papers) on current uses of the ATP testing devices within healthcare
settings. The impact of this unreliability in measurement required a risk assessment.
The earlier work outlined in one of the authors 2010 posters (“The importance of practical zero in
cleaning performance indicators”) mapped out a risk management approach that accounted for both
false positive and false negative interpretation risks from the data (Appendix B1). These could be
considered as type I and type II statistical errors. This methodological approach had been used in
studies attempting to deduce a ‘best option’ for a cleanliness threshold using ATP testing where a

19
Receiver Operating Curve (ROC) was developed to position the proposed cleaning threshold based
on a proposed RLU level.51
A risk-based study was undertaken to consider the impact of the variability of the ATP testing
devices in practical use within healthcare settings. Given that failure risk can include both false
positive and false negative outcomes, and that failure risk applies to all of the cleaning monitoring
methods, the study was widened to also include FM, visual inspection and microbiological recovery
methods.
The use of each of the monitoring methods was considered using the innovative application of
Failure Mode and Effects Analysis (FMEA), which is a standard tool used in the medical device
manufacturing sector.52,53 Whilst this focused the study onto the failure risks of each of the methods,
the literature revealed that these risks were more clearly identified than any positive association
with any of the cleaning monitoring methods.
Far from being a negative study (as implied by the word ‘failure’), this FMEA process allowed the
combination of the different methods to reveal a new approach and integrated use of each of the
cleaning monitoring methods (see Figure 3 below).
This integrated monitoring approach reflected the risk overview shown in Figure 1 from the first
poster in 2011. In that earlier figure, the four possible outcomes from any cleaning process were
outlined as true positive, false positive, true negative and false negative (indicated as the worst
possible failure risk in red colouring). In this third paper, the monitoring methods were combined
into an integrated framework so as to minimise the risks of any one method providing a false
negative outcome (this would be an indication of cleanliness where in fact pathogenic microbes
remained despite the cleaning processes).
The third paper, which used the FMEA approach was submitted for publication in August 2014 and
accepted for publication in October 2014.53
This FMEA study linked all of the monitoring methods, including the ATP testing, and contextualised
the application of the cleaning monitoring methods in a new and novel way. This work both built on
the ATP validation work and extended a justification for continued use of ATP testing despite the
risks of measurement variability. The work also demonstrated that ATP testing has a distinct role in
cleaning monitoring that is unique in its timeliness, quantitation of cleanliness, and ease of use.

20
Figure 3: An integrated model for cleaning monitoring (source: third Whiteley paper: AJIC:
2015:43:147)
Continuing the Laboratory Phase
Experimental work on the validation of the ATP devices was extended to also consider the detection
and measurement of bacterial ATP. Given that the swab materials and lysis chemistry were fixed
(each determined by each of the ATP device manufacturers) and that the swabbing techniques
required for environmental cleaning were well reviewed by others, the focus of the remaining
laboratory work with ATP devices was on the essential responsiveness of the ATP devices to the
suspensions of bacterial cultures. This extended the experimental phase using several known
bacterial species in quantitated dilution series. These experiments with suspension cultures were
used to examine the variability of the devices ATP-Luciferase reaction and to compare this to the
variability observed when only pure ATP had been tested.
A number of experimental runs using different bacterial species were commenced. Bacterial cultures
were selected on the basis of gram staining and general relevance to healthcare settings. The
bacteria initially chosen were laboratory strains of Staphylococcus epidermidis (ATCC 12228) (S
epidermidis), Escherichia coli (ATCC 25922) (E coli) and Pseudomonas aeruginosa (ATCC 15692) (P
aeruginosa).
The use of bacterial species required an extensive period of range finding and experimental
exploration in order to develop sound techniques and approaches to underpin the microbiological
21
validity of the project. Refreshing the benchtop microbiology methods was an important personal
feature of the journey. The preparation period was extensive and ensured that repeatability in the
results was attained, including issues such as quantitation of the dilutions of the suspension cultures.
The microbiological work added materially to the validation process as range finding work confirmed
the new variables to be controlled. An example of the value of the preliminary work was that the use
of E. coli was discontinued following what appeared to be lysis failure for both of the 3M and
Hygiena ATP devices/consumables. Another validation issue was that the use of Triptone Soy Broth
(TSB) as a growth media for the suspension cultures was observed to interfere with two of the
devices/consumables (Kikkoman and 3M) whereas Phosphate Buffer Solution (PBS) had no impact.
The use of TSB was thereafter discontinued in preparation of the bacterial dilution series for
validation testing.
An additional (fourth) commercially branded ATP device was made available through the University
of Tulsa in Oklahoma and the Cleaning Industry Research Institute International in the USA. This ATP
device (Charm Inc) added a new dimension to the work as its scaling was much higher than the
existing three commercial devices used in the earlier studies.
The methodological approach for the microbiological challenge to the ATP testing devices followed
the earlier work using pure solutions of ATP as used in the first study. The statistical analysis using
the Cv approach used in the second study was also followed and so the results of this extended
laboratory phase of the validation work were all translated from the raw data into Cv results.
The initial studies using pure ATP dilutions were also repeated to ensure comparability and
completeness, although data from all of the pure ATP dilution series of studies was included in the
full presentation of Cv analysis. Statistical advice was obtained through Mr Paul Fahey who also
agreed to be included as co-author on the paper.
The results from the studies using bacterial cultures demonstrated that the variability observed
using ATP from a known source, was precisely the same variability levels seen when testing against
bacterial species. Whilst the lysis variable was still uncontrolled, the results mirrored the earlier
finding on variability.
The fourth Whiteley paper was written and then in November 2014 it was submitted to the leading
healthcare epidemiology journal, Infection Control and Hospital Epidemiology (ICHE) which is
published on behalf of the Society of Healthcare Epidemiologists of America (SHEA).54 This paper
confirmed the experimental findings on variability and demonstrated the importance of a thorough
validation approach prior to any field based applications of ATP testing and interpretation of the
data arising. This study is the first published paper to demonstrate that the variability seen when

22
challenging ATP testing devices with pure ATP solutions was exactly mirrored by the variability
observed when testing those same devices against quantitated bacterial dilution series’.
Communicating the message on ATP testing variability
During the period of writing up this fourth paper, a study by Visrodia et al., was published (also in
ICHE) which used ATP testing to ‘validate’ endoscope cleaning.55 The work was supported with
funding by the commercial manufacturer whose ATP testing device was exclusively used in the
study. The paper failed to provide validation data and used a single point sampling method, which
overlooked potential variability, flaws in the sampling methodology and statistical analysis.
A response was initiated by this author and a letter to the editor was submitted for publication in
September of 2014 (accepted October 2014), which focused on two problems with the Visrodia
paper.56
Firstly, the issue of using a single brand and not cross correlating with a second branded unit was
discussed to illustrate the dangers of the relative scaling and lack of unit interoperability. A
commentary on the Visrodia paper had made a similar, albeit unreferenced remark.57
Secondly, the Visrodia paper indicated that the sampling method used to obtain ATP readings was
based on single point samples (not even duplicate sampling was conducted) and therefore variability
issues were unrecognised. The statistical analysis of the raw data was done on this sample set and
found with significant findings. This raised the significant risk of type I statistical error.
In the reply from Visrodia et al., the most important responsive comment was “Given the imperative
for cost containment and to improve efficiencies on the front lines, we believe it would not be
desirable to perform duplicate or triplicate testing as suggested by Whiteley et al. Their concern
about variability within and between ATP measuring devices deserves additional study.” 58
The fourth Whiteley paper, which focused specifically on the issue of recurrent variability in ATP
testing, was published just three ICHE editions later in the June 2015.53 This fourth paper set out the
critical issue of variability and for the first time proposed a quantitated risk of misreading based on
the high variability. Earlier mathematical work by Reed et al., had proposed that where the Cv is
above 0.4, then there is a 20% likelihood that any one reading (in RLU) could be out by a factor of
two.59 In this context a reading of say 100 RLU, could indicate a true reading of between 50 RLU or
up to a true reading of 200 RLU. This gave insight into the variability observed in the first Whiteley
paper when the 20% dilution series were undertaken.50

23
In that first study, the log scale differences had minimised the impact of this variability (difference is
‘10-fold’ and not just ‘2-fold’).50 Whereas by using a 20% dilution series the RLU readings presented
in figures 2 – 4 in the first published paper, showed that there was often overlap between what
should have been clearly differentiated readings/data sets.
This insight also goes some way to explaining why many of the statistical findings on earlier studies
by other groups produced insignificant results, and results which did not correlate well with parallel
measurements such as microbial recovery. Whilst the ATP testing does read a wider variety of ATP
soils, and not just bacterial ATP, the results often obtained were incongruous.
A good example is in the paper by Sherlock where in several instances the ATP readings go up after
cleaning whilst the microbial results decrease.60 In Lewis et al., readings using an ATP cleanliness
threshold of 250 RLU (a 3M ATP device) also often show failures where below threshold microbial
growth is noted.61
To further add to the confusion and variability difficulties with interpretation of results from ATP
testing, there is no standardised size of sampling area for swabbing. When ATP testing was first
suggested by Griffiths et al., the sampling area suggested was a 10x10cm (100cm2) area with a target
level of cleanliness of 500 RLU using a Cleantrace (3M) ATP testing device.35 Following studies using
the same branded equipment and same sampling area concluded that the cleanliness standard
should be reassessed and suggested a cut-off of 250 RLU.61
A study by Andersen et al., suggested that the cleanliness standard be reduced to just 100 RLU using
a similar 10x10cm = 100 cm2 sampling area but using a different brand of ATP testing equipment
(Hygiena).62 The swabbing area for use in ATP testing has often followed the recommendations of a
100cm2 area (10cm x 10 cm) in both food and healthcare settings whilst using non-comparable
equipment. 63,35,43,62 Another study selected a smaller sampling area of just 16cm2 (e.g. 4cm x 4cm =
16cm2).64 Finally, another study using the Hygiena ATP reaffirmed the 100 RLU cleanliness threshold,
but reduced the sampling area to a more practical 2 x 5 cm (10cm2) area.51
The variability problems with these useful little devices could be mitigated substantially with the
development of a unified RLU scale against which the ATP testing devices could be calibrated. This
would allow for accuracy and improved precision.
Another approach taken in an effort to determine a reliable RLU ‘cut-off’ is the use of an ROC curve
correlated with bacterial recovery from similar surfaces. The work in Mulvey et al., used the ROC
curve approach and concluded that this method provided only ‘weak support’ for the 100 RLU cut-
off.51 Similarly, in Smith et al., after application of the ROC curve approach, using a different ATP
testing device (Cleantrace, 3M), the ROC supported an elevated RLU threshold or cutoff at 800 RLU

24
on a 10x10cm=100cm2 sample area.65 This threshold outcome was not able to be correlated
between the three cleanliness monitoring methods used in their study.
The issues of different RLU scales, unpredictable readings in RLU readings due to inherent variability,
the non-standardised swabbing area used in differing studies, the poor correlation with bacterial
presence on surfaces, the weak evidence provided through methods such as the ROC curve
approach, and the differing performance characteristics between ATP testing device brands can all
work together to confound practical studies using ATP testing. The practical reality is that a pre-
determined, single cleanliness threshold expressed in RLU, which is common to all ATP testing
devices is statistically unobtainable at this point in time. Any field based study requires very careful
consideration to mitigate these issues, which was the point made in response to Visrodia et al. 56
The practical application of the findings through a (pilot) field based study
In August and September 2014 an opportunity arose to use the ATP testing devices in a practical
field application in a real healthcare setting. This study integrated the earlier findings with an
existing clinical microbiological research program through the School of Medicine at Western Sydney
University. This study – lead by Professor Iain Gosbell – was investigating the locations of MRO
embedded within dry surface biofilms which are present within an Intensive Care Unit (ICU).66, 18
The first sampling attempt to locate the biofilms used a list of likely sites and objects within the ICU.
This sampling round used only microbial recovery and required a more aggressive form of surface
swabbing based on a method originally proposed in ICHE by Corbella et al., whilst that Corbella team
were searching for Acinetobacter baumannii.67 The biofilm research was interested in locating any
multi drug resistant organisms (MRO) imbedded within biofilms on environmental surfaces. To
recover the MRO a selective growth media was used, followed by further identification methods.
However, the initial results from the first sampling round were poor with only a single sample from
twenty three total samples returning positive growth on the selective media.
The candidate posed the question: ‘Could the ATP testing assist in the identification of more dirty
areas when used in combination with the microbial recovery methods as per the teaching of the
third Whiteley paper?’ 52 The sampling methodology in this pilot study used both ATP and surface
microbiology at matched sites within the ICU. The sampling method used two of the ATP testing
devices at each sample location and in tandem with the aggressive biofilm swabbing approach.
In the second sampling session – a trial run – the sampling approach using two ATP devices and
microbial recovery. Whilst at every sampling site one of the sampling methods was used (either of

25
the ATP devices and sometimes microbial recovery), at only a limited number of the sites were all of
the three methods used. The two ATP devices used were the Hygiena and Kikkoman devices and
accompanying consumables. The Hygiena device was used more extensively in this initial ATP
sampling session which followed on from teaching by Andersen et al.68
A third sampling run was organised for early in September where all of the samples taken were fully
matched. The collaborative approach provided excellent results.
The statistical analysis indicated that the ATP testing did assist in identifying the surfaces with higher
levels of microbial soil (Chi-Square P>0.025[corrected for Yates] and Fishers Exact P=0.01). The
sampling sequence was 1/23 MRO positive samples on the first round, with 12/36 MRO positive
samples on the combined second and third sampling rounds when the samples were fully matched.
Importantly, the sampling locations with higher ATP readings in many instances grew MRO, although
on the day of ATP testing and microbial sampling, it was only the ATP testing in real time which gave
the indication of the more soiled surfaces with higher RLU readings. The microbial recovery results
were not known for five days after the sampling, and longer for the accurate microbial identification
of the specific MRO which were recovered.
Whilst the more aggressive sampling method did assist in higher recovery rates than normal
swabbing methods might have achieved, the statistically significant findings demonstrated that using
a list and visual observation, was poorly successful (1/23). Whereas, with real time feedback via an
ATP testing device (where the matched samples were conducted), sampling revealed a large number
and variety of MRO on environmental surfaces available to potentially infect patients (12/36). This
use of a combination of the recognised cleaning monitoring methods largely followed the teaching
of the earlier work in the third Whiteley paper.52
The results in real time of the ATP testing, indicated that the focus of the sampling should be moved
from the patient surrounds to the area around the clinical work station including chairs and highly
touched devices with which staff were in frequent hand contact. This proved a decisive approach
despite concerns over the use of ATP in healthcare settings.69 The discussion section of the published
paper identified a number of potential flaws in interpretation of the results but also indicated
improvements for further and on-going studies to improve infection prevention strategies focused
on environmental surface hygiene within healthcare settings.
The fifth paper was submitted to the American Journal of Infection Control for publication in June
2015 and was accepted in July 2015. It was published in the December 2015 edition of the journal.70

26
This fifth paper is the first Australian study to have located such a high number and variety of
contaminated surfaces (13 separate locations) with such a variety of MRO inside an active ICU.
The paper was written with a clear outline of the flaws in the pilot study, but with the statistical
findings clearly described and discussed.
The paper also made some other very important observations. Using two ATP devices in parallel
within a healthcare setting has been documented in only one other paper.68 The paper by Andersen
et al., used a 3M device and a Hygiena device. Whilst the Hygiena device provided a platform of
results that were significant for some measurements, the ‘before-and-after-cleaning’ readings from
the 3M device were not statistically significant. Unfortunately, there was no attempt in the Andersen
paper to correlate the ATP readings (in RLU) between the two ATP testing devices.
In this fifth Whiteley paper the correlation between the two devices was subject to direct
comparison. The first important finding of this paper in respect to rapid ATP testing devices and their
variability was the almost zero correlation (r2=0.0144) between the sampling results of the two
branded ATP devices – Hygiena and Kikkoman – that were used in the study. Whilst the
manufacturer of one of the ATP devices used (Kikkoman) does note the capacity of the consumables
to measure other components (including Adenosine Mono-Phosphatase = AMP) this finding
warrants additional research in subsequent studies.71
The second important observation made in the fifth paper relating to ATP testing, was that provided
that the teaching of the third Whiteley paper (using FMEA) was followed with parallel/alternative
cleanliness measurements, rapid ATP testing did contribute significantly towards indicating surface
cleanliness. This is a very positive finding for the use of ATP testing when examining the cleanliness
of surfaces. The use with biofilm studies also warrants additional and future research.
This fifth paper is a neat conclusion to the work. As a pilot study the paper demonstrated the
learning achieved through this confluent body of work. It takes the findings of the earlier validation
and risk studies and extends them practically in a new and novel manner with outstanding results, all
based on the findings of the four other (included) Whiteley papers.
The essential goal of cleaning monitoring is to ensure that the cleaning is achieved both in terms of
efficacy and efficiency. FM can play a qualitative role in efficiency monitoring as indicated in the
posters presented from the earlier project findings. The use of rapid ATP testing as presented in this
fifth paper provides a timely (rapid) indication of surface cleanliness that allows further intervention
or investigation if required. The validation work achieved through this study has demonstrated both
the problems and failure risks with commercial rapid ATP testing devices (as they are currently

27
configured). The implications arising from this observation contrast earlier critical for the use of
rapid ATP testing within healthcare settings.72
The validation work also contextualised these flaws when ATP testing is used within the healthcare
setting, and outlined how the flaws can be minimised, whilst taking full advantage of the benefits of
the ATP testing and real time readings.73 The final and fifth paper demonstrated how the variability
was both present in the study, and yet the real time impact and cleanliness indication was
sufficiently useful to direct microbial sampling to uncover a wide array of MRO lurking in plain sight
and within the clinical area of an active ICU.
The following chapters set out:
a. In Chapter two, the overview of the methods used in this thematic study;
b. In Chapter three, how the five papers demonstrate the work and meld together into a single
PhD thesis as a complete body of novel findings; and
c. In Chapter four, how the work has opened up a wide new pathway of further and on-going
research.
References
1. Nimmo GR, Pearson JC, Collignon PJ, Christiansen KJ, Coombs GW, Bell JM, McLaws ML; Prevalence of MRSA among Staphylococcus aureus isolated from hospital inpatients, 2005: Report from the Australian Group for Antimicrobial Resistance. Com Dis Intell: 2007: 31:288-296
2. Weinstein RA & Henderson DK; A double edged sword and a golden opportunity for healthcare epidemiology: Infect Control Hosp Epidemiol; 2009:30:1-3
3. Turnidge JD, Nimmo GR, Pearson J, Gottlieb T & Collignon PJ. Epidemiology and outcomes for Staphylococcus aureus bacteraemia in Australian hospitals, 2005-6; Com Dis Intell: 2007:31:398-403
4. Christiansen KJ, Turnidge JD, Bell JM, George M, Pearson JC. Prevalence of antimicrobial resistance in Enterococcus isolates in Australia, 2005; Com Dis Intell:2007:31:392-397
5. Hota B, Blom DW, Lyle EA, Weinstein RA, Hayden MK; Interventional evaluation of environmental contamination by vancomycin-resistant enterococci: failure of personnel, product or procedure?: J Hosp Infect:71:123-131
6. National Health and Medical Research Council [NHMRC]. Australian Guidelines for the Prevention and Control of Infection in Healthcare, 2006. Department of Health and Ageing, Canberra, Australia
7. Graves N, Halton KA, Paterson D, WHitby M. The economic rationale for infection control in Australian hospitals; Healthcare Infect: 2009:14:81-88
8. Scott DR II. The direct medical costs of Healthcare-Associated Infections in US Hospitals and the benefits of prevention; 2009: Report from the Division of Healthcare Quality Promotion. Centers for Disease Control, USA: CS200891-A

28
9. Australian Council on Safety and Quality in Healthcare (ACSQH). National Safety and Quality Health Service Standards. ACSQH; Commonwealth of Australia, Sydney, Australia, 2012 ISBN: 978-1-921983-04-7
10. Pittet D, Hugonnet S, Harbarth S, et al. Effectiveness of a hospital wide program to improve compliance with hand hygiene. Lancet 2000; 356:1307-1312
11. Sax H, Allegranzi B, Uckay I, Larson E, Boyce J, Pittet D; ‘My five moments for hand hygiene’: a user-centred design approach to understand, train, monitor and report hand hygiene; J Hosp Infect: 2007: 67: 9-21
12. Hand Hygiene Australia. National data period one, 2015. Avail: http://www.hha.org.au/ LatestNationalData.aspx. Accessed May 2015
13. Bhalla A, Pultz NJ, Gries DM, Ray AJ, Eckstein EC, Aron DC, Donskey CJ. Acquisition of nosocomial pathogens on hands after contact with environmental surfaces near hospitalized patients. Infect Control Hosp Epidemiol: 2004 :25:164-167
14. Dancer SJ, Coyne M, Speekenbrink A, Samavedam S, Kennedy J, Wallace PGM. MRSA acquisition in an intensive care unit. Am J Infect Control: 2006:34:10-17
15. Al-Hamad A, Maxwell S. How clean is clean? Proposed methods for hospital cleaning assessment. J Hosp Infect:2008:70:328-334
16. Dancer SJ. Importance of the environment in meticillin-resistant Staphylococcus aureus acquisition: the case for hospital cleaning. Lancet Infect Dis: 2008:8:101-113
17. Carling PC, Briggs J, Highlander D, Perkins J. An evaluation of patient area cleaning in 3 hospitals using a novel targeting methodology. Clinical Infect Dis:2006:34:513-519
18. Hu H, Johani K, Gosbell IB, Jacombs ASW, Almatroudi A, Whiteley GS, Deva AK, Jensen S, Vickery K. Intensive care unit environmental surfaces are contaminated by multidrug-resistant bacteria in biofilms: combined results of conventional culture, pyrosequencing, scanning electron microscopy, and confocal laser microscopy. J Hosp Infect: 2015:91:35-44
19. Loveday HP, Pellow C, Jones SR, Pratt RJ. A systematic review of the evidence for interventions for the prevention and control of meticillin-resistant Staphylococcus aureus (1996-2004): report to the Joint MRSA Working Party (subgroup A); J Hosp Infect: 2006: 65S:S45-S70
20. Huang SS, Datta R, Platt R. The risk of acquiring antibiotic-resistant bacteria from prior room occupants. Arch Int Med:2006:166:1945-1951
21. Mitchell BG, Wilson F, Dancer SJ, McGregor A. 2013. Methods to evaluate environmental cleanliness in healthcare facilities. Healthcare Infect. 18(1) 23-30
22. Hardy KJ, Oppenheim BA, Gossain S, Goa F, Hawkey PM. A study of the relationship between environmental contamination with methicillin-resistant Staphylococcus aureus (MRSA) and patients acquisition of MRSA. Infect Control Hosp Epidemiol: 2006:27:127-132
23. Price EH, Ayliffe G. Hot hospitals and what happened to wash, rinse and dry? Recent changes to cleaning, disinfection and environmental ventilation. J Hosp Infect; 2008:69:89-98
24. Therapeutic Goods Administration. Therapeutic Goods Order 54, 1996. Australian Government, Canberra, Australia
25. Glasbey T, Whiteley GS. The importance of stakeholder consultation for infection control guidelines. Healthcare Infect; 2009:14:9
26. Whiteley GS, Glasbey T. Flawed recommendations on surface hygiene within the existing Interim Influenza Pandemic National Infection Control Guidelines. Healthcare Infect: 2009:14:177-179
27. NSW, Government of; Department of Health NSW. Infection Control Policy, PD2007_036: May 2007. Accessed March 2010 at http;//www.health.nsw.gov.au/policies
28. Rutala W & Weber D and HICPAC [Healthcare Infection Control and Practices Advisory Committee] 2008: Guideline for disinfection and sterilization within healthcare facilities, 2008: Centers for Disease Control: US Department of Health and Human Services, GA, USA

29
29. Australian/New Zealand Standard (AS/NZS) 4187:2003. Cleaning, disinfecting and sterilizing reusable medical and surgical instruments and equipment, and maintenance of associated environments in health care facilities; Standards Australia/Standards New Zealand: 2003: ISBN 0 7337 5024 9
30. Victoria, State of; Department of Health. Cleaning standard for Victorian health facilities. 2011. Original Publication 2000, Revised 2005, 2011; Government of State of Victoria. Accessed from: http://www.health.victoria.gov.au/Cleaningstandards/standards.htm. Access date November 2014
31. Loveday H, Wilson JA, Pratt RJ, Golsorkhi M, Tingle A, Bak A, Browne J, Prieto J, Wilcox M. EPIC 3 National Evidence Based Guidelines for Preventing Healthcare-Associated Infections in NHS Hospitals in England. J Hosp Infect: 2014:86: Supplement 1
32. Dancer SJ, White LF, Lamb J, Girvan EK, Robertson C. Measuring the effect of enhanced cleaning in a UK Hospital: a prospective cross-over study; BMC Infect Med:2009:7:28-33
33. Denton M, Wilcox MH, Parnell P. Role of environmental cleaning in controlling an outbreak of Acinetobacter baumannii on a neurosurgical intensive care unit; J Hosp Infect: 2004: 56: 106-110
34. Hawronskyj J-M, Holah J. ATP: A universal hygiene monitor. Trends in Food Science and technology. 1997: 8:79-84
35. Griffith CJ, Cooper RA, Gilmore J, Davies C & Lewis M; “An evaluation of hospital cleaning regimes and standards”; J Hosp Infect:2000:45:19-28
36. Worsfold PJ, Nabi A. Bioluminescent assays with immobilised firefly luciferase based on flow injection analysis. Analytica Chimica Act. 1986: 179:307-313
37. Griffith CJ. Choosing a luminometer. International Food Hyg: 2008:19:23-25 38. Shama G, Malik DJ. The uses and abuses of rapid bioluminescence-based ATP assays.
International J Hygiene and Environmental Health: 2013:216:115-125 39. Slonczewski JL, Foster JW. Microbiology, An evolving science. International Student Edit., 2nd
Edit., W.W. Norton and Co., New York, NY USA. ISBN 978-0-393-93447-2 40. Griffith CJ, Malik R, Cooper RA, Looker N, Michaelis B. Environmental surface cleanliness and
the potential for contamination during hand washing; Am J Infect Control:2003:31:93-96 41. Malik RE, Cooper RA, Griffith CJ. Use of audit tools to evaluate the efficacy of cleaning
systems in hospitals. Am J Infect Control: 2003:31:181-187 42. Larson EL, Aiellob AE, Gomez-Duartec C, Linc SX, Leed L, Della-Lattae P, Lindhardt C.
Bioluminescence ATP monitoring as a surrogate marker for microbial load on hands and surfaces in the home. Food Microbiology; 2003: 20:735–739
43. Cooper RA, Griffith CJ, Malik RE, Obee P, Looker N. Monitoring the effectiveness of cleaning in four British hospitals. Am J Infect Control:2007:35:338-341
44. Griffith CJ, Obee P, Cooper RA, Burton NF, Lewis M. The effectiveness of existing and modified cleaning regimens in a Welsh Hospital. J Hosp Infect:2007:66:352-359
45. Carling PC, Parry MM, Rupp ME, Po JL, Dick B, Von Beheren S. Improving cleaning of the environment surrounding patients in 36 acute care hospitals. Infect Control Hosp Epidemiol: 2008:29:1035-1041
46. Goodman ER, Platt R, Bass R, Onderdonk AB, Yokoe DS, Huang SS. Impact of an Environmental Cleaning Intervention on the Presence of Methicillin-Resistant Staphylococcus aureus and Vancomycin-Resistant Enterococci on Surfaces in Intensive Care Unit Rooms Infect Control Hosp Epidemiol; 2008: 29:593–599
47. International Conference on Harmonisation (ICH) of technical requirements for registration of pharmaceuticals for human use. Validation of Analytical Procedures: text and methodology [(Q2(R1)]. Step 4 version, November 2005
48. Whiteley GS, Derry C, Glasbey T. The comparative performance of three brands of portable ATP-bioluminometer intended for use in hospital infection control. Healthcare Infection: 2012:17:91-97

30
49. Lord Kelvin. Electrical Units of Measurement: Popular Lectures and Addresses; 1891-1894, vol. 1, 1883.
50. Whiteley GS, Derry C, Glasbey T. Reliability testing for portable Adenosine Triphosphate Bioluminometers. Infect Control Hosp Epidemiol: 2013:34:5:538-540
51. Mulvey D, Redding P, Robertson C, Woodall C, Kingsmore P, Bedwell D, Dancer SJ. Finding a benchmark for monitoring hospital cleanliness. J Hosp Infect; 2011:77:25-30
52. McDermott RE, Mikulak RJ, Beauregard MR. The basics of FMEA. 2nd Edit, 2009; Taylor and Francis Group, Productivity Press, New York, NY, USA
53. Whiteley GS, Derry C, Glasbey T. Failure analysis in the identification of synergies between cleaning monitoring methods. Am J Infect Control: 2015:43:147-153
54. Whiteley GS, Derry C, Glasbey T, Fahey P. The perennial problem of variability in Adenosine Triphosphate (ATP) tests for hygiene monitoring within healthcare settings. Infect Control Hosp Epidemiol: 2015:36(6):658-663
55. Visrodia KH, Ofstead CL, Yellin HL, Wetzler HP, Tosh PK, Baron TH. The use of rapid indicators for the detection of organic residues on clinically used gastrointestinal endoscopes with and without visually apparent debris. Infect Control Hosp Epidemiol. 2014: 35:987–994
56. Whiteley GS, Derry C, Glasbey T. Sampling plans for use of rapid Adenosine Triphosphate (ATP) monitoring must overcome variability or suffer statistical invalidity Infect Control Hosp Epidemiol: 2015:36:236 – 237
57. Petersen BT. Monitoring endoscope reprocessing: accumulating data but best practices remain undefined. Infect Control Hosp Epidemiol 2014: 35:995–997
58. Visrodia KH, Ofstead CL, Yellin HL, Wetzler HP, Tosh PK, Baron TH. Reply to Whiteley et al., Infect Control Hosp Epidemiol: 2015:36:237 – 238
59. Reed GF, Lynn F, Meade BD. Use of coefficient of variation in assessing variability of quantitative assays. Clinical Diagnostic Lab Immunology: 2002:9:6:1235-1239
60. Sherlock O, O’Connell N, Creamer E, Humphreys H. Is it really clean? An evaluation of the efficacy of four methods for determining hospital cleanliness. J Hosp Infect: 2009:71:140-146
61. Lewis T, Griffith CJ, Gallo M, Weinbren M. A modified ATP benchmark for evaluating the cleaning of some hospital environmental surfaces. J Hosp Infect: 2008:69:156-163
62. Anderson RE, Young V, Stewart M, Robertson C, Dancer SJ. Cleanliness audit of clinical surfaces and equipment: who cleans what? J Hosp Infect: 2011: 78, 178-181
63. Tebbutt GM, Bell V, Aislabie J. Verification of cleaning efficiency and its possible role in programmed hygiene inspection of food businesses undertaken by local authority officers. J App Microbiol. 2007: 102, 1010-1017
64. Carrascosa C, Saavedra P, Millan R, Jaber JR, Perez E, Grau R, Raposo A, Mauricio C, Sanjuan E., 2012. Monitoring of cleanliness and disinfection in diaries: Comparison of traditional microbiological and ATP bioluminescence methods. Food Control. 28, 368-373
65. Smith PW, Sayles H, Hewlett A, Cavalieri RJ, Gibbs SG, Rupp ME. A study of three methods for assessment of hospital environmental cleaning. Healthcare Infect: 2013:18:80–85
66. Vickery K, Deva A, Jacombs A, Allan J, Valente P, Gosbell IB. Presence of biofilm containing viable multi-resistant organisms despite terminal cleaning on clinical surfaces in an intensive care unit. J Hosp Infect: 2012:80:52-55
67. Corbella X, Pujol M, Argerich MJ, Ayats J, Sendra M, Pefia C, Ariza J. Environmental sampling of Acinetobacter baumannii: Moistened swabs versus moistened sterile gauze pads. Infect Control Hosp Epidemiol: 1999:20(7):458-460
68. Anderson BM, Rasch M, Kvist J, Tollefsen T, Lukkassen R, Sandvik L, Welo A. Floor cleaning: effect on bacteria and organic materials in hospital rooms. J Hosp Infect: 2009:71:57-65
69. Malik DJ, Shama G. Estimating bacterial surface contamination by means of ATP determinations: 20 pence short of a pound. J Hosp Infect: 2012:80:354-356
70. Whiteley GS, Knight JL, Derry CW, Jensen SO, Vickery K, Gosbell IB. A pilot study into finding the bad bugs in a busy Intensive Care Unit (ICU). Am J Infect Control: 2015:43:1270-1275

31
71. Kikkoman Lucipac technical advice: 2014: accessed online via: http://biochemifa.kikkoman. co.jp /e/eisei/ fukitori.html. Accessed: October 2015
72. Roady L. Abundant Research in Support of ATP Cleaning Verification's Applicability in Healthcare. Infect Control Hosp Epidemiol: 2015:36:1367
73. Whiteley GS, Derry C, Galsbey T, Fahey PP. Reply to Roady. Infect Control Hosp Epidemiol: 2015:36:1368

32
Chapter 2
Methods used within the study
Précis
This chapter outlines the background for the methods used within each of the five papers and
explains how these methods interlock in a single confluent theme within the PhD. The full details of
each of the methods are described in each of the five papers. This chapter sets out the salient
reasoning for selection and development of each of the methods and the contextualisation for each
application. This chapter also discusses the implications of the methods for further investigation into
the use of ATP testing for cleanliness monitoring within healthcare settings.
A brief outline of the methods used in the five papers
The backbone of the study is the laboratory phase which investigated the validation issues for rapid
ATP testing. The laboratory methods followed the applicable principles of pharmaceutical industry
guidelines to establish the responsiveness of the ATP testing devices and their consumables.1 The
data were generated through the novel ‘direct droplet’ method of analysis whereby ATP was directly
applied to each of the ATP swabs using a micro-titre pipette. The data were then plotted, statistically
analysed for association and also analysed the using coefficient of variance (Cv) method. The use of
this approach provided a basis to normalise the data across the full array of the experimental series
and to compare each of the branded ATP devices.
The first, second and fourth of the papers included in the PhD study outline the methods of analysis
for the ATP responsiveness and the results obtained from the testing program. The ability of the ATP
devices to meet the core validation criteria of linearity, dynamic range, accuracy, precision and limits
of detection are demonstrated in the results. The methods used demonstrate that uncontrolled
variability is an issue for all of the ATP device brands tested in this study. A key quality assurance
concern for any application of ATP testing within healthcare settings, is that the measurements
provided by the ATP testing must be reliable and well understood so that interpretation of the ATP
data is able to stimulate an appropriate quality assurance response.
The second phase of the work, as outlined in the third paper, took the data from the ATP testing and
considered how to integrate ATP testing into a cleanliness monitoring process. The study used the
risk based method of ‘Failure Mode Effects Analysis’ (FMEA) to assess the impact of the hazards of
cross infection where any of the four main methods of cleanliness monitoring are used. A novel

33
proposal for an integrated cleanliness monitoring approach within healthcare settings was a key
finding arising directly as a result of the novel application of this FMEA method.
The fifth paper outlines the final phase of the work where a field based pilot study was conducted.
This study followed and applied the findings arising from firstly the ATP validation studies and
secondly the new integrated cleanliness monitoring process. This pilot study was conducted within a
working Intensive Care Unit (ICU) in a modern teaching hospital. The sampling method used two ATP
devices, a novel approach to microbial sampling, and the statistical analysis compared the findings
when using microbial sampling only, with the integrated use of visual inspection/observation,
microbial sampling and rapid ATP testing.
Table 1: The methods used in the Five Whiteley papers
Paper Number
Abbreviated Title Journal, Year
Method of Analysis Statistical Analysis
1st Paper
Comparative performance of 3x ATP Bioluminometers
HI, 2012 1. ATP analysis using ATP devices - using pure sourced ATP; 2. ATP analysis using HPLC
1. Test of association (Kruskal-wallis) 2. Linear correlation (HPLC) 3. Box and whisker graphs for precision testing
2nd Paper
ATP Device Reliability Testing
ICHE, 2013
Used data from 1st paper
Coefficient of Variance (CoV or Cv)
3rd Paper
FMEA & Synergies AJIC, 2015
Risk analysis using FMEA
Not applicable
4th Paper
The Perennial problem of variability of using 4x ATP bioluminometers
ICHE, 2015
1. ATP analysis using ATP devices - using pure sourced ATP; 2. ATP analysis using 4x ATP devices using 2x bacterial suspension cultures; 3. ATP analysis using HPLC
1. Coefficient of Variance (Cv) 2. Box and whisker graphs to indicate data spread
5th Paper
Pilot study in finding the bad bugs in an ICU using ATP & Microbiology
AJIC, 2015
1. ATP analysis using 2x ATP devices in an active ICU setting 2. Microbial recovery using swabbing and selective media with ID specificity analysis (Vitek)
1. Test of association using Chi-square and Fishers Exact Test; 2. ROC Curve (sensitivity analysis); 3. Linear correlation with results with the 2x ATP devices
Key: Abbreviations: HPLC = High Powered Liquid Chromatography; ICU = Intensive Care Unit; ROC = Receiver Operating Curve Journals: HI = Healthcare Infection; ICHE = Infection Control Hospital Epidemiology; AJIC = American Journal of Infection Control

34
In each paper the methods of analysis and statistical methods were overseen and re-checked with
supervisors and co-authors for the papers. In the first 3 papers the primary author was Whiteley plus
two co-authors (Dr Derry and Dr Glasbey). In the 4th paper a third co-author was added (Paul Fahey).
The 5th and final paper had the principle author (Whiteley) and one of the prior co-authors (Dr
Derry), plus four additional co-authors (Jessica Knight, Professor Gosbell, Associate Professor Jensen,
and Associate Professor Vickery).
The methods of analysis and statistical and drawing tools used in each of the five papers are shown
in Table 1 where they are briefly outlined.
Methods of analysis for ATP testing devices (Whiteley Papers 1, 2 and 4)
The method that underpins the first three of the papers used a novel approach to measuring the
accuracy of the dose-response for the application of ATP or ATP containing soils with the various ATP
testing devices and their associated consumables. This new approach used a calibrated pipette to
directly and quantitatively apply the test solutions directly onto each of the ATP device swabs. Until
the first of the papers in this PhD, all of the studies in healthcare had used bacterial suspensions,
either applied to a surface or dried onto surface, to assess responsiveness and other characteristics
of the rapid ATP testing devices.
In the period leading up to the initial study (the first paper), only one paper had been published in
infection control journals which used a validation style of approach to ATP testing devices.2 In this
paper by Aiken et al, the test solutions were bacteria dried onto a surface.
The Aiken paper used only a single microorganism (Staphylococcus aureus) but tested a range of ATP
bioluminescence tests (including rapid ATP devices) and the results indicated many inconsistencies
in the ATP results including a large variance in results and a reported Cv of ‘133’. The results
compared readings in RLU and ATP light emissions across a dilution series on a log scale (ten-fold
dilutions) and concluded that ATP bioluminescence was not an accurate way to measure the number
of bacteria on a test surface. The work also noted that the number of bacteria was frequently
underestimated (by a factor of up to 10 times) and that the highest level of inaccuracy was at the
lower levels of bacteria being present.
In early 2012 a paper by Shama and Malik reviewed and strongly criticised the use of ATP testing for
hygiene monitoring.3 The authors engaged in a series of letters which responded to a series of
papers on ATP which were published without suitable reference to the difficulties of using ATP
testing and particularly in response to articles propositioning the ATP testing and use of cut-offs of

35
various RLU values.4 A paper by Heller et al., also presented data which suggested that the 250 RLU
cut-off did not correlate well with the presence of MRO on hospital surfaces using a Neogen ATP
testing device.5
Another of the papers in 2012 examined the comparative reading and reliability efficiencies of three
branded ATP devices using three microorganisms across a log scale dilution series.6 This work by
Sciortino et al also used microorganisms dried onto surfaces. This paper also identified that
consistency was a problem for all brands, although a ‘best brand’ was selected. A close examination
of the results suggests that variability was a constant problem and that variables such as swab
material, swabbing efficiency and even lysis efficiency were uncontrolled and unrecognised until
later in the experimental phase.
The authors also hinted that use of a direct droplet application onto the swabs may produce a
different result from application of the swabs to a dried inoculum on a surface, but there were many
‘random effects’ noted in the paper. The reasoning for this conclusion was based on the response of
one organism (Candida albicans) which showed higher readings using dried inoculum rather than
directly applied volumes of a suspension culture. As a retrospective reading of their data, the
authors suggested that swabbing in combination with the lysis agent may in itself liberate bacterial
ATP, however this was unproven, and somewhat questionable given the other inconsistencies in the
various results. The important findings from the paper were that the three ATP bioluminometers all
read on different RLU scales, and that the sensitivity of response to different bacteria was somewhat
brand specific.
There was an interesting exchange between Dr Malik and Dr Sciortino in a subsequent edition of the
journal in regards to the validity of the results presented in the paper.7, 8 Dr Malik warns against
overstating the case in favour of ATP testing and cautions explicitly against using ATP testing as “…a
surrogate indicator of microbial burden and hence risk of infectious agents”.7 The response from Dr
Sciortino defended their laboratory validation, but threw the issue of protocol development and
validation for field use back onto the hospital staff thus leaving unresolved the practical issues of
implementation for ATP testing within healthcare settings.8
This highlighted the difficulties in the use of ATP testing for practical cleanliness monitoring
purposes. Whilst the ATP devices are broadly and proportionately reactive to bacterial ATP in any
series of ten-fold concentration dilutions, the practical applications require reliability on
comparative cleanliness including detection of bacterial contamination.2,6,3-5 To move the ATP testing
from the laboratory validation into use for cleanliness monitoring, reliability was the significant
concern as any over-reaction in ATP readings could have cost implications (additional cleaning

36
required), whilst any under-reaction might allow infectious organisms to persist despite cleaning
processes. Reliability in the precision of response of ATP testing devices to ATP was identified as an
issue for exploration.
In the work for the first Whiteley paper, the first research goal was to focus on the reliability of the
ATP reaction response by the ATP devices to be tested. To achieve this outcome it was necessary to
remove or minimise (as best as possible), all of the extraneous variables, including swab material
dynamics, swabbing efficiency, lysis efficiency and even species sensitivity. It was agreed that the
use of a pure (known and validated source of ATP) would allow the examination of just the ‘ATP +
Luciferase’ reaction. A ten-fold dilution series of pure ATP which was directly applied onto the swab
via a calibrated micro-titre pipette, removed the non-essential variables and focused the results on
only the reaction dynamics.
As an extension of this work and to test the precision of response (by the ATP devices), on a
narrower basis, a 20% dilution series was also tested. This provided additional insight into the
precision around smaller variances in ATP concentration.
The use of a fully validated HPLC method, anchored the findings in terms of a “gold standard”
against which the precision of the ATP devices could be compared.
This novel direct application method was used as the basis for all of the ATP data in the first, second
and fourth Whiteley papers. This included using the direct droplet method for the experiments using
suspension cultures of bacteria.
For each experiment, the suspension culture was diluted from a freshly grown laboratory stock of
the selected bacteria. Confirmation of live bacterial was performed using serial ten-fold dilution onto
agar plates. Each of the experiments were repeated on multiple separate occasions to ensure
repeatability. The data arising from the final set of repeats using bacterial suspensions were used in
the 4th Whiteley paper. The work using pure ATP and the four ATP testing devices was also repeated
to ensure that all of the ATP devices available for the validation work were considered as part of the
final validation paper (the Charm ATP device had not been used in the earlier work).
The statistical analysis using Cv was repeated using both Microsoft Excel (2010) and box and whisker
graphs were drawn using Sigma Plot 12.5 (2013).
This approach using direct application for the testing and validation of the ATP devices was novel
and this PhD study documents the first use of this method. The confluent application of the novel
direct application method, and then the use of coefficient of variance for statistical analysis was a

37
comprehensive approach to the validation which allowed a uniform understanding to be developed
on the reliability of the ATP devices across the various branded platforms.
One important finding through this comprehensive methodology (both the ATP analysis and the
statistical methods) was that the outliers shown in the box and whisker plots were both above and
below the 10th and 90th percentile whiskers. This was a regular event and not just a single time
incident. This was observed with all of the ATP devices tested, and was observed in all of the tests
including pure ATP and both bacterial species. There is no warning of this variability to users of the
ATP testing devices. The methodological approach used in the 4th Whiteley paper is the only paper
published which has demonstrated so clearly this level of unreliability.
Risk Analysis using FMEA (Whiteley paper 3)
The results from the first laboratory phase provided a more robust approach to the interpretation of
the data arising from ATP testing. The uncontrolled variability in ATP test data requires careful
consideration when preparing a sampling plan for cleanliness monitoring using ATP testing. The
strong benefits of ATP testing such as the timeliness of a quantitative data reading has meant that
research on using ATP testing within healthcare settings has continued to be widely published. The
goal of using ATP to provide a quantitative basis for cleanliness monitoring and even the use other
monitoring systems with an integrated approach to cleaning monitoring had been attempted.9-11
The early PhD work on risk with the posters etc., opened a pathway to reconsider the cleaning
monitoring methods with the data that had been generated on the ATP testing and FM spot
experiments. Clearly the risks around failure were more significant than the benefits alone, and so
consideration was given to the appropriate risk assessment tool with which to consider the
integration of ATP testing into a cleanliness monitoring process in conformity with the Australian
requirements.
The Australian Commission on Safety and Quality in Healthcare produced a new framework in 2012
of ‘National Safety and Quality Health Service Standards’ (NSQHSS).12 This introduced into Australian
healthcare the requirement for a uniform approach to quality standards setting, quality
improvement goals, and risk based management of hazards for patients and all stakeholders.
There are ten broadly focused “national safety and quality health service standards” within the
NSQHSS. The third standard focuses on “preventing and controlling healthcare associated

38
infections”. Under standard three, criteria 3.15 states that healthcare facilities should comply with
the intention of a clean and hygienic environment by “Using risk management principles to
implement systems that maintain a clean and hygienic environment for patients and healthcare
workers”.
The introduction of NQHSS standardised approach to quality assurance and risk assessment in
principle provided an ideal backdrop for the application of a risk assessment based approach to
examining each of the four cleaning monitoring methods.
A review of various methods of the risk assessment was undertaken with consideration of the
significant reference document, which was ISO 31010 (IEC/FDIS) titled “Risk Management – Risk
assessment techniques”.13 This comprehensive review document covers the 31 major techniques for
risk assessment. The document also provides a ranking assessment for applicability. Two of the
authors of the third Whiteley paper had experience with FMEA, but the process was also well rated
for reliability and applicability for the intended task.
After reviewing the literature on risk assessment methods and tools, the decision was confirmed to
use Failure Mode and Effects Analysis (FMEA) to examine all of the four major cleaning monitoring
methods. FMEA is a prospective method that through an FMEA committee uses the known,
described, documented or identified failure risks, and compares their individual impacts on the
intended outcome. The FMEA method also then considers and recommends possible strategies to
mitigate these impacts in practical settings. The FMEA process within industry settings frequently
uses a 10 point rating scale, but so as to fit into the Australian quality framework which uses a three
tier rating approach the method was adjusted to conform to the Australian NSQHSS approach to risk
assessment.
The committee of three (authors) individually considered what would be the failure modes for each
of the cleaning monitoring methods, and subsequently what would be the rating against the three
scoring criteria used with FMEA including frequency, severity and detectability. The American
Journal of Infection Control has a limit of 4000 words and a limit of just three graphs or tables, and
so only the 15 high and medium failure modes could be included in the paper.
This paper is the first ever comprehensive assessment of the failure modes of each of the cleaning
and cleanliness monitoring assessment methods. The application of this method allowed for the
consideration of the combination of the four methods which took account of the failures but which
also allowed the benefits to be respected.

39
The critically important recommendation arising from the study was the outline by Figure 1 in the
FMEA paper (the 3rd Whiteley paper) which proposed a new way to combine all of the cleaning
monitoring methods into a single integrated approach to cleanliness and cleaning monitoring. The
recommendation on integration demonstrates that the strengths of each of the respective methods
can be combined to overcome the weaknesses of the other methods. The use of FMEA as a method
of assessment for cleanliness monitoring is novel and contextualises the work within the PhD on
building a proposal to constructively resolve a new scientifically valid and integrated approach to
cleanliness monitoring within healthcare settings.
The paper was submitted using this approach and has been viewed or down-loaded on more than
300 occasions with one citation so far.
Pilot Study Methods (Whiteley paper 5)
The fifth paper within the PhD study was a pilot study that applied the learning from the early ATP
papers, and applied the recommended integrated method for cleanliness monitoring within a busy
and fully operational Intensive Care Unit (ICU). In this case the cleanliness monitoring integrated
three of the four methods into a singular approach.
The particular ICU was concerned about the potential for transmissions of healthcare associated
infections (HAI). The project team for this study (co-authors) included staff from the School of
Medicine, the Ingham Institute and Macquarie University. The project was approved by the ICU
(Medical Director) and the project didn’t require ethics approval (a survey of the environmental
cleanliness not involving patients or staff is not included by the Western Sydney University ethics
guidelines).
The three cleanliness monitoring methods used were visual inspection, rapid ATP testing and
microbiological sampling of surfaces including growth on selected media. The methods used in the
study are well described in the paper and the discussion here is intended to amplify the reasoning
behind the approach taken in the study.
The comparison and first method used in the study was a sampling run using pre-determined lists of
high touch objects (HTO). These HTO were identified from the literature. This first sampling run used
a lone researcher and applied a novel sampling approach and re-growth based on selective media

40
using biofilm recovery principles.14, 15 The sampling on this basis yielded a very low recovery rate for
MRO of just 1/23.
The role of visual inspection is core to the Australian approach to the monitoring of both cleaning
and cleanliness.16, 17 Whilst the auditing approach taken in the reference documents rates various
items on a checklist, the approach in this study was more observational and took account of items
and surfaces that were seen to be frequently touched by staff in the ICU.
Notes were also taken on terminal cleaning efficiency following patient removal and methods of
decontamination during terminal cleaning. Staff handwashing practices were observed but not
audited. No feedback was provided to staff on either cleanliness or handwashing or touching items
with gloved hands outside the immediate patient zones.
There are five separate findings arising from the study that are well discussed in the paper. The
methodological approach on the second sampling day in particular had recognised flaws, but even
despite this the application of the learning on ATP sampling proved a decisive benefit when
combined with the visual component in providing almost immediate and immediacy of feedback on
relative cleanliness of different surfaces. This mixed method approach allowed more targeted
microbiological sampling which significantly enhanced the results in locating the presence of multi-
drug-resistant-organisms (MRO).
The method of duplicate sampling using two different ATP testing devices was also highly novel and
illustrated the risks of uncontrolled variability and a lack of a uniform scaling approach. The almost
complete non-correlation of the two devices was another previously unpublished and highly novel
outcome which is well discussed in the paper with reference to past literature. This was a
particularly interesting finding given the overall results which demonstrated the benefit of using
rapid ATP testing.
The statistical analysis used followed conventional methods. The use of chi-square adjusted for low
sample numbers (with incorporation of the ‘Yates’ correction) and Fishers exact test indicated the
significance of the core findings using this new integrated methodological approach to cleanliness
monitoring. The low sample numbers did limit the potential for a realistic finding using a Receiver
Operating Curve (ROC) to establish appropriate cleanliness thresholds for each of the devices and
these were distinctly different numbers, albeit without comparative statistical significance.18, 19
The basic approach to finding biofilms in an ICU remains under development and only recently has
the presence of dry surface biofilms been demonstrated within an ICU.15, 20 The methods for
reproducing biofilm growth in laboratory conditions are also in the early stages of development.21

41
The presence in ICU of dry surface biofilms which harbour MRO poses a profoundly increased hazard
and elevated risk for the cross infection of already vulnerable patients.
The integrated method demonstrated in this paper showed improvements over all previous
attempts for the identification of the locations of MRO which may be residential on hospital
surfaces. This method also had a very significant outcome in indicating that the HTO that are of high
risk for harbouring MRO are not just clustered on the near patient surfaces around the ICU patient
bed.22-24 By using the visual component of assessment to identify HTO, and then applying the rapid
ATP testing to those surfaces, the real time effect directed the microbiological sampling to clinical
workspace well out of the anticipated sampling locations around the near patient surrounds.
This new integrated method for cleanliness monitoring demonstrated that there was a 7 fold greater
likelihood of quickly finding the less clean locations than using a simple HTO list approach which has
been the dominant method in Australia and elsewhere. This exciting development has only been
enabled by the new methods developed and trialled during this PhD.
References 1. International Conference on Harmonisation (ICH) of technical requirements for registration
of pharmaceuticals for human use. Validation of Analytical Procedures: text and methodology [(Q2: (R1)]. Step 4 version, November 2005
2. Aitken ZA, Wilson M, Pratten J. Evaluation of ATP bioluminescence assays for potential use in a hospital setting. Infect Control Hosp Epidemiol: 2011:32:507-509
3. Shama G, Malik DJ. The uses and abuses of rapid bioluminescence-based ATP assays. International J Hygiene and Environmental Health: 2013:216:115-125
4. Malik DJ, Shama G. Estimating bacterial surface contamination by means of ATP determinations: 20 pence short of a pound. J Hosp Infect: 2012:80:354-356
5. Heller M, Thompson PA, Loock MH, Sawchuk A, Guerrero DM. Variability of Adenosine Triphosphate – Based Bioluminescence Assay Readings among Drug-Resistant Pathogens. Infect Control Hosp Epidemiol: 2012:33:1286-1288
6. Sciortino CV, Giles RA. Validation and comparison of three adenosine triphosphate luminometers for monitoring hospital surface sanitization: A rosetta stone for adenosine triphosphate testing. Am J Infect Control: 2012:40:e233-239
7. Malik DJ. Assessment of infection risk from environmental contamination using rapid ATP surface measurements. Am J Infect Control: 2013:41:469-479
8. Sciortino CV, Giles RA. Response to “Assessment of infection risk from environmental contamination using rapid ATP surface measurements”. Am J Infect Control: 2012:41:479-480
9. Boyce JM, Havill NL, Lipka A, Havill H, Rizvani BS. Variations in hospital daily cleaning practices. Infect Control Hosp Epidemiol: 2010; 31:99-101
10. Moore G, Smyth D, Singleton J, Wilson P. The use of adenosine triphosphate bioluminescence to assess the efficacy of a modified cleaning program implemented within an intensive care setting. Am J Infect Control: 2010:38:617-622
11. Boyce JM, Havill NL, Havill HL, Mangione E, Dumigan DG, Moore BA. Comparison of fluorescent marker systems with 2 quantitative methods of assessing terminal cleaning practices. Infection Control Hospital Epidemiology: 2011:32:1187-1193

42
12. Australian Council on Safety and Quality in Healthcare (ACSQH). National Safety and Quality Health Service Standards. ACSQH; Sydney Australia, 2012
13. ISO/IEC 31010:2009(E); Risk management – Risk assessment techniques: International Standards Organisation (ISO). International Electrotechnical Commission, Geneva Switzerland
14. Corbella X, Pujol M, Argerich MJ, Ayats J, Sendra M, Pefia C, Ariza J. Environmental sampling of Acinetobacter baumannii: Moistened swabs versus moistened sterile gauze pads. Infect Control Hosp Epidemiol: 1999:20(7):458-460
15. Vickery K, Deva A, Jacombs A, Allan J, Valente P, Gosbell IB. Presence of biofilm containing viable multi-resistant organisms despite terminal cleaning on clinical surfaces in an intensive care unit. J Hosp Infect: 2012:80:52-55
16. NHMRC 2010 National Health and Medical Research Council [NHMRC], .Australian Guidelines for the Prevention and Control of Infection in Healthcare, 2006. Department of Health and Ageing, Canberra, Australia
17. Victoria, State of; Department of Health. Cleaning standard for Victorian health facilities. 2011. Accessed from: http://www.health.victoria.gov.au/Cleaningstandards/standards.htm. Access date November 2014
18. Mulvey D, Redding P, Robertson C, Woodall C, Kingsmore P, Bedwell D, Dancer SJ. Finding a benchmark for monitoring hospital cleanliness. J Hosp Infect; 2011:77:25-30
19. Smith PW, Sayles H, Hewlett A, Cavalieri RJ, Gibbs SG, Rupp ME. A study of three methods for assessment of hospital environmental cleaning. Healthcare Infect: 2013:18:80–85
20. Hu H, Johani K, Gosbell IB, Jacombs ASW, Almatroudi A, Whiteley GS, Deva AK, Jensen S, Vickery K. Intensive care unit environmental surfaces are contaminated by multidrug-resistant bacteria in biofilms: combined results of conventional culture, pyrosequencing, scanning electron microscopy, and confocal laser microscopy. J Hosp Infect: 2015:91:35-44
21. Almatroudi A, Hu H, Deva A, Gosbell IB, Jacombs A, Jensen SO, Whiteley G, Glasbey T, Vickery K. A new dry-surface biofilm model: An essential tool for efficacy testing of hospital surface decontamination procedures. J Microbiol Methods: 2015:117:171-176
22. Carling PC, Parry MM, Rupp ME, Po JL, Dick B, Von Beheren S; “Improving cleaning of the environment surrounding patients in 36 acute care hospitals”:Infect Control Hosp Epidemiol:2008:29:1035-1041
23. Hota B, Blom DW, Lyle EA, Weinstein RA, Hayden MK; “Interventional evaluation of environmental contamination by vancomycin-resistant enterococci: failure of personnel, product or procedure?”: J Hosp Infect:2009:71:123-131
24. Muzslay M, Moore G, Turton JF, Wilson AP. Dissemination of antibiotic-resistant enterococci within the ward environment: The role of airborne bacteria and the risk posed by unrecognized carriers. Am J Infect Control: 2013:41:57-60

43
Chapter 3
A thematic & critical review of each of the papers included for PhD
Précis
This chapter provides a thorough review of each of the papers included in this PhD submission. The
chapter outlines how the five papers together establish a cohesive thematic study which comprises
this single body of original research. Each paper will be contextualised for contemporary relevance,
methodology, results and contents, and the contribution of each of the papers into the single theme
for this PhD thesis. The learning attained and the contribution of the principle author and
contributions of the various co-authors in each of the five papers will also be outlined in this chapter.
The papers are presented in chronological order.
Introduction
In the consideration of this PhD by a series of publications, there are five fully peer reviewed papers
which have been published in scholarly journals. The five papers outline the validation of ATP testing
devices and their application for cleanliness monitoring within healthcare settings. These five papers
interlock as a continuous theme on the validation and use of rapid ATP testing. The study
commences with laboratory work focussed on ATP device performance in a limited range of
controlled experiments, and then moves onto statistical work focused on the reliability of the ATP
testing devices. From here the theme of the study contextualises the use of rapid ATP testing as a
cleanliness monitoring tool within healthcare settings, before coming back to the laboratory to more
fully document the performance of the ATP devices using bacterial cultures replicative of healthcare
applications. The final paper is a field based pilot study that uses two ATP testing devices that
demonstrates a practical application of these devices within healthcare settings by building on both
the risks of use and the validation process.
The first paper is the initial validation study published to reveal both useful and concerning findings
on ATP measurement comparing three commercial brands of ATP devices.
The second paper develops the work of first paper, but applies the coefficient of variation (Cv) as a
statistical measure of variance in the ATP readings obtained during the controlled experiments.

44
The third paper steps back from the benchtop work to consider the overlapping flaws of rapid ATP
testing and the other accepted cleanliness monitoring methods used within healthcare settings. The
study looked into the flaws of each cleaning monitoring method, and also useful synergies from the
use of ATP testing with the other three major cleanliness monitoring tools. This third paper
introduces to infection prevention professionals a new novel risk assessment approach using Failure
Mode Effects Analysis (FMEA). A new and novel approach to cleaning/cleanliness monitoring is
outlined in the paper.
The fourth paper extends the work of the first and second papers and investigates the statistical
problems of uncontrolled variability using the commercially available ATP devices using both pure
ATP and two representative bacteria which are commonly found within healthcare settings. The
fourth paper applies Cv to establish the case for careful interpretation of data arising from field
based use of ATP testing devices based on the validation studies.
The fifth paper takes two of the ATP testing devices out of the laboratory and uses the strengths of
rapid ATP testing to overcome the weaknesses of environmental microbiology. This fifth paper
demonstrates that rapid ATP testing, once validated, and despite imprecision and other flaws, can
contribute practical usefulness in cleanliness monitoring and infection prevention within healthcare
settings. This paper applies the teaching of papers 1, 2 and 4 (instrument dynamic range and
limitations, variability and imprecision) and paper 3 (FMEA revised risk based approach) in a field
based study within an active Intensive Care Unit.

45
First paper review Authors: Whiteley GS, Derry C, Glasbey T.
Title: The comparative performance of three brands of portable ATP-bioluminometer intended for use in hospital infection control
Publication: Healthcare Infection: 2012:17:91-97
Impact Factor: Not available: CSIRO as Publisher indicates IF <1
Citations: 11 (Scopus search 4th February 2016)
The seminal paper by Griffiths et al., for rapid ATP testing within healthcare was published in 2000.1
Griffiths applies his personal experience in using rapid ATP testing within the context of food
manufacturing and plant hygiene and through this small field based study indicated that ATP testing
would be highly suitable for a similar application in cleanliness monitoring within healthcare settings.
The findings demonstrated that ATP testing was superior to both visual inspection and
environmental microbiology as a cleanliness monitoring tool within a healthcare setting. What was
surprising in the papers which followed was that the studies were undertaken without having
conducted any validation process for the ATP testing devices used in the studies.
In 2011 a single ‘concise communication’ paper was published that attempted to provide a
validation process for ATP testing against quantitated bacterial suspensions using Staphylococcus
aureus.3 The findings were that of the five commercial ATP devices tested, all of the ATP devices
lacked robustness in quantitation, particularly at low bacterial concentrations.
Against that backdrop, in this first study, we set out to validate three commercially available ATP
devices using a validation process in accordance with Pharmaceutical Industry guidelines.4 This
meant firstly looking for linearity of response and comparing the results to a ‘gold standard’ and fully
validated reference test. For this purpose, an HPLC method was used as a comparison.
It was also recognised that testing against live bacterial cultures was also subject to the risks of
variability in cellular lysis and ATP content. A new method was required, so in this first paper a pure
(known source) of ATP was used and a standard volume (20µL) was applied directly to the ATP
swabs using a validated micro-titre pipette. The advantage of this approach is that the experiments
focused on only one measurement variable, which was the ATP reading (in RLU) from each device.
This was a novel and previously unpublished method for validating these ATP devices.
The findings of the paper were also novel. This remains the first published study in the medical
literature that has focused on validating the dynamic range and reading scale of commercial ATP

46
devices based on pure ATP, directly applied to the swabs, and thus free from other confounding
variables (cellular lysis, swab absorption, ATP cellular density and others).
The results outlined in this first paper demonstrated that ATP devices could be relied upon when
testing serial dilutions where concentrations were 10 fold differentiated as shown in Figure 1 within
the published paper. The dynamic range of ATP readings (from lower limit of detection [LLD] to
upper limit of detection [ULD]), was also shown to be different for different devices. The work also
clearly demonstrated that at any quantitated application of ATP, each of the ATP devices showed a
different scale on RLU.
This first paper also clearly demonstrated that the reading scale of the different branded ATP devices
lacked any overlap and therefore had nil interoperability. This has dramatic implications on the prior
published cleaning threshold values in RLU from studies with only one branded ATP device, which
could not meaningfully be applied to any other ATP device. The recommended ATP cleanliness
threshold of 100 RLU was clearly marked on Figure 1 in the paper to illustrate this problem.
However, the study also demonstrated that where the concentrations of serial dilutions were less
well differentiated (we used 20%) then the ATP devices would reliably differentiate between the
dilutions as the data irregularly overlapped as shown in figures 2-4 within the published paper. For
each of these figures the 100 RLU cleanliness threshold was also marked illustrating how
inappropriate this single level measurement was for the different branded ATP devices.
The single level cleanliness threshold was a major problem not previously identified in the literature.
In fact several studies had accepted the suggested RLU cleanliness threshold from 500 RLU using a
3M branded device and this level of 500 RLU was reconfirmed in another study (2009) which also
noted a lack of correlation between ATP/RLU results and microbiological results (cfu/mL)1,5. In
another study the threshold value was recommended to be reduced from 500 RLU down to 250 RLU
in an effect to improve the comparability with comparative results using environmental
microbiology, and this was done using a 3M branded ATP device.6
A study published in 2009 by a separate group compared two different devices (3M and Hygiena)
without doing any comparative validation and simply noted the difference in results.7 Finally,
another published study preferred the Hygiena branded ATP device and in the study seamlessly
moved to recommend that the cleanliness threshold using ATP be reduced from 250 RLU (3M) down
to 100 RLU (Hygiena), without any comment over the difference in scaling (interoperability) between
the different branded ATP devices, thus assuming uniformity of scaling.8

47
In the same time period, a number of papers were published, or accepted for publication which
posed questions over the validation of ATP for applications in healthcare cleanliness monitoring.9-10.
Whilst the methods and commentary used were not based on the first paper method of direct
application of ATP, a common issue identified was the lack of uniformity in scaling, the risks posed
by uncontrolled confounders, and the lack of correlation with ATP data and contamination,
particularly at the lower levels which was critical for healthcare applications.
Another notable finding was the identification of the differing abilities of the ATP testing devices to
quantitate the ATP concentrations at both ends of the dynamic range (Figure 1 from the paper).
Within healthcare settings the instrument performance at the upper limits of the dynamic range is of
a lesser concern than performance towards the lower end of the dynamic range. At the lower end of
the dynamic range, two of the ATP testing devices (3M and Kikkoman) demonstrated poor
quantitation below 100 RLU and could not reliably demonstrate any reading below 30-50 RLU. The
introduction of the concept of a Practical Zero was important for field usage of these ATP devices.11
In this first paper, the study results both supported and extended the findings of Aiken et al.3
However, the paper also outlined through a controlled validation processes using only pure ATP, that
the dynamic range of different brands of ATP testing devices was an unrecognised variable for
studies using ATP testing. The problems of scaling, variability and imprecision required careful
validation and consideration and particularly where measurements were attempting to distinguish
between similarly soiled surfaces. The findings of the first paper were the foundation for the
following work as part of the PhD study.
There were some limitations to this paper. Firstly, the data set was based solely on exposure to pure
ATP and not to any bacterial species. Secondly, it was published in a local Australian journal which
somewhat limited its global reach and limited the possible influence of the findings. Thirdly, only a
single ATP device from each brand source was used, and consumables, whilst stored as per
manufacturers’ instructions, were not tested linearly across the time-line of recommended shelf life
(to determine if the shelf life of the consumables is another variable).
In the peer review of this paper both of the peer reviewers commented that this research would
enhance the discussion on environmental hygiene.1 The first reviewer said that research when
published “…will add to the discussion around evaluation of environmental hygiene in healthcare and
also provide direction for further research into this subject”. The second reviewer similarly
1 email: official response from the editor dated 9th July 2012

48
commented “This study may generate and lead to further discussion…” and also that the research
raised “Valid concerns regarding the concept of a cleaning benchmark…” which is precisely the
outcome expected from the findings. There have been 9 citations so far of this paper.
The learning outcomes from this paper were substantial. Firstly, this was the first major authored
paper and required substantial changes to my writing style. Secondly, the work itself reset my
practices around experimental design, management of the resources (including time and co-authors)
and also the recording and presentation of the results into a format suitable for publication.
The co-authors contributed through various of the practical aspects of the study, including Dr
Glasbey in setting up, validating and working with the HPLC, and ensuring that the pure ATP
remained stable for the period of the experiments. Dr Derry contributed in editorial assistance and
also in the preparation of the statistical analysis including tests of association and reframing Figure 1
of the paper as used for the published version. The principle author was responsible for all re-writing
and re-drafting following consultation with the co-authors, the recording, preparation and
presentation of results including graphs, statistical analysis in consultation with Dr Derry, and
primary responsibility for the submission and peer review of the paper.

49
Second paper review Authors: Whiteley GS, Derry C, Glasbey T
Title: Reliability testing for portable adenosine triphosphate bioluminometers
Publication: Infection Control and Hospital Epidemiology: 2013:34:5:338-540
Impact Factor: 2015 IF: 4.15 5 Yr IF: 4.50 (Source: Research Gate: 4th February 2016)
Citations: 6 (Scopus search: 4th February 2016)
In this second study, the results from the first study, using only pure source ATP and testing against
the three branded ATP devices, were examined using a variance measure. The paper was accepted
for publication into a ‘Special Topic’ edition to coincide with a “SHEA Spring Conference” with the
theme “The role of the environment in infection prevention”. One of the peer reviewers
commented2 on the paper “Overall, clearly written… I think that it [the paper] highlights a significant
issue related to interpretation of results due to variability among different manufacturer products”,
which was precisely the point of the findings.
The results from the first study showed an unexpected level of variance. This was particularly so
given the carefully quantitated volumes of pure ATP applied to the different ATP device swabs, from
the same ATP solution container, on the same day, in the same experimental round with
quantitation confirmed using a validated HPLC which had demonstrated almost no variability. Whilst
the first paper had demonstrated the dynamic range of the ATP devices, and their poor precision
when using closely separated dilutions series (20%), the level of variance was considered in this
second paper using a variance measure of Coefficient of Variation (Cv).
The Cv is a calculation of the standard deviation for an individual data set over the mean for the
same data set. Cv is a simple expression of the variance and is the inverse of the signal to noise ratio.
The paper set out the results from the calculations in graphical form in figure 1 as a scatter plot. In
this paper all three of the ATP devices demonstrated a Cv as high as 0.4, i.e. the standard deviation
for a data set was as high as 40% of the data mean. This level of imprecision is very poor and
normally would be considered unacceptable for a scientific measurement device.
This was the first study to use Cv as a measure for variance with ATP testing devices. All of the
brands performed equally poorly and none of the brands gave any indication to users as to the level
of variability. This paper presented a new confounding factor for studies where ATP testing was used
as a measure of cleanliness. Whilst a standardised level of ATP (RLU) may be set with any particular
2 email: official response from the editor dated 28th October 2012

50
ATP device brand, the high and uncontrolled level of variance that is obtained in actual use of the
ATP device, limits the meaningfulness of any RLU threshold due to device reading imprecision.
This paper added to the debate over the usefulness of ATP/RLU cut-offs/thresholds for setting
cleanliness standards for infection prevention in environmental surfaces and has received a number
of independent citations. The implications of this work in combination with the first paper have been
to undermine any suggestions that a universal ATP/RLU cut-off or threshold could be used for
cleanliness monitoring in the context of hospital infection control. There remains the need to
develop better science around cleanliness monitoring but at the point of publication of this paper,
more work was required to thoroughly validate the ATP testing systems.12
The limitations of this study were similar to that of the first study. Firstly, the work focused on
application of pure ATP to the swabs rather than bacterial suspension or cultures. The second
limitation was that although published in one of the key global journals in this infection prevention
field, the paper was a “Research Brief” (word limit of 900 word plus one figure or table, and < 10
references), and this so was not a full-length research paper. Finally, this second paper did not
attempt to assess whether ageing or storage of the consumables had any impact on the variability of
ATP/RLU readings.
The learning experiences from the paper were highly productive. Firstly, the application of the Cv as
a measure of variance provided a new platform from which to assess instrument reliability. It had
been quite a confronting experience to find the unexpected variability and so separate statistical
advice was sought from Mr Paul Fahey, who is acknowledged at the end of the paper. The
authorship lessons from this paper were also that the strict limitation on word count required focus
and acuity to ensure that the paper adequately described the work and expressed the implications
for the findings. That the peer reviewers recognised this aspect was most pleasing.

51
Third paper review Authors: Whiteley GS, Derry C, Glasbey T
Title: Failure analysis in the identification of synergies between cleaning monitoring methods
Publication: American Journal of Infection Control: 2015:43:147-153
Impact Factor: 2015 IF: 2.21 5 Yr IF: 2.50 (Source: Research Gate: 4th February 2016)
Citations: There have been 300+ downloads of the paper since publication but citations have not yet appeared in the literature.
Following the publication of the first two papers in 2012 and 2013, and a range of other critical
publications on the appropriateness of ATP testing in cleanliness monitoring, a re-evaluation of the
project was required. The clear advantages of rapid ATP testing were still present, but were now
offset by the findings of the first two papers and several other relevant publications. One significant
paper, which went on-line in 2012 (Sciortino et al.), proposed to have achieved validation of three
commercial ATP devices.13 However, even the singing endorsement of ATP testing by Sciortino et al.,
was subjected to pointed criticism over the poor response of the ATP devices at the LLD and a
number of other confounders.14
The need for a suitable audit tool for cleanliness monitoring and cleaning validation had already
been established and the practicality of rapid ATP testing recognised.15,16 A second important
cleaning verification tool that had become available from 2006 was the Fluorescent Marker (FM)
invented by Dr Phillip Carling. This innovation used a small dab of polysaccharide based glue, laden
with fluorescing material that dried to a clear film (still clearly visible under small low power UV
light) but which could be wiped off easily through normal cleaning processes.17 Because the film is
thin and clear the removal of the FM became an easy way to assess if a surface or object had been
subjected to the intended cleaning (wiping) process. A broad array of participating hospitals took
part in a large validation trial and the results indicated that this tool not only improved the rate of
cleaning but also appeared contributed to a diminishment to overall recovery rates of microbes
responsible for HAI.18
Some laboratory work was conducted on two forms of the FM which were supplied directly by Dr
Carling. The first was the original “dab-on” solution. The second was the licenced/commercialised
version under the tradename “DAZO” from Ecolab (Minneapolis-St Paul, MN). Laboratory studies as
part of the PhD project considered drying characteristics and visibility. The results from those studies

52
were contained in several posters but as these findings only reconfirmed the literature the work was
not submitted for publication.
Several pertinent studies verified the usefulness of FM including one in Australia and another study
where the technology was used in tandem with ATP testing.19,20 FM was also found to be an ideal
tool for cleaning staff feedback and education, but it could also be misleading when cleaning staff
could themselves identify the FM spot locations and then selectively clean and remove just the FM
spots.21-23 Even by itself the results of FM still can lag the Hawthorne effect of personal
observation.24
The substantial observation on FM was that its use within healthcare settings was a constructive way
of monitoring surface wiping and therefore reducing bioburden. Whilst FM does not provide any
quantitative assessment of surface cleanliness per se, it does reflect that surface cleaning has been
attempted and thus is a qualitative measure of cleaning (staff) efficiency. Studies using FM, ATP and
studies using both FM and ATP have all demonstrated the usefulness of timely feedback to cleaning
staff through these new cleaning monitoring methods.25-27
However, there was still no credible alternative cleanliness monitoring method that provided all of
the requisite information to provide an adequate level of quality assurance over environmental
surface cleanliness within healthcare settings. There remain only four practical options for
cleanliness monitoring and cleaning validation which are all reviewed in the paper. The four cleaning
monitoring methods are visual inspection, microbial recovery, ATP testing and FM technologies.
Each of the methods has advantages, but equally all of the methods have shortcomings that limit
their practical usefulness for cleaning auditing as an aid in infection prevention.
This third paper is a study that steps back from the overlapping and sometimes conflicting array of
advantages and disadvantages of the different cleaning and cleanliness monitoring methods. The
goal of the study was to conduct a structured risk assessment on the proposition for using ATP
testing within the broadest context of cleaning monitoring and compare the risks associated with
ATP testing with the three risks associated with the three other cleaning monitoring methods.
A structured risk based approach using Failure Mode and Effects Analysis (FMEA) was used by our
small team to reflect on the data from the earlier studies, and from the broader and developing
infection control literature. The FMEA team then assessed the failure risks of each of the
cleaning/cleanliness monitoring methods. FMEA allows for the interrogation of potential or
recognised failures for use each of the methods of cleaning/cleanliness monitoring and to both
grade and attempt to mitigate each failure mode.

53
Only one other reference using FMEA in this field could be located, and it was for a poster
presentation only and no paper was published.41 Therefore, this third paper is the first of its kind
published in the infection control literature.
The study in this third paper, was an important breakthrough in novel thinking on how to integrate
the cleaning/cleanliness monitoring methods and unlock potential synergies between the various
methods. Figure 1 in the published paper proposes a new pathway forward using all of the available
cleaning/cleanliness monitoring methods with a scientifically based, integrated assessment of
cleaning and cleanliness on hospital surfaces. In all prior publications authors have tended to
recommend their pet/partisan method over and above the other methods. Whereas using FMEA to
structure the risk assessment, this study arrived at a recommendation for process improvement that
contextualised the use of ATP testing, as well as recognising the advantages of visual inspection
without the need to denigrate visual inspection as an inferior monitoring method.
The Australian requirements for a three-tiered risk classification were followed in the paper to
provide a simple and locally flavoured outcome.28 FMEA also assesses and grades each failure mode
for its likely frequency and the severity of the failure, and combines these two criteria with an
assessment of the detectability of the failure mode to arrive at an overall risk quotient. The scoring
approach reflected the Australian requirement for a three tier scoring scheme (graded 1 to 3) which
once the risk quotient was obtained allowed each failure mode to be then grouped into risk
classifications. The risk classification approach used in the paper separates the failure risk for each of
the failure modes for each of the cleaning monitoring methods. In the paper, only the worst case
failure modes are shown in Table 2 of the published paper.
This novel approach to risk assessment for the cleaning and/or cleanliness monitoring methods had
several limitations. Firstly, it was a small team used for the study and only two of the authors had
previous experience with the FMEA methodology. As a small team care had to be taken to ensure
the findings were anchored in objective literature and not just a circular and biased selection of
failure modes. Secondly, as a novel approach it was initially difficult to secure peer review
acceptance with reviewers who were unfamiliar with risk assessment strategies and methods, which
tend to be predictive and qualitative. Finally, the small team did not use any practising healthcare
professionals nor anyone currently engaged in an infection prevention role.
This was a challenging paper to write. One of the peer reviewers commented “…the use of one
monitoring technique to supplement another monitoring technique is new. Also, the use of FMEA for
the purposes of evaluation is new and provides food for thought for the infection preventionists and

54
for environmental services.”3 This was an encouraging outcome after the effort applied in taking
FMEA as a medical devices standard risk method and applying it in the assessment of methods with
products, but for the common purpose of cleaning/cleanliness monitoring.
In the process of this study and the writing of this paper a large number of lessons were learned.
Whilst the outcome of the findings was pleasing, the process taught the importance of perseverance
and the value of finishing the task. The management of the team process with the risk of selection
bias in findings required additional rigour and reflection. The peer review process for this paper
required major reconstruction of the paper and the key findings shown in Table 2, so as to bring the
paper back to an acceptable size and format for the journal. The entire co-author/team group
participated in the FMEA process, but I was the principle author in every aspect. Dr Derry also
assisted greatly in the framing of Figure 1.
This paper has been downloaded on more than 300 separate occasions since publication in February
of 2015, and citations are expected. The full influence of this paper will be on-going and an abstract
for an oral presentation is being submitted for the next meeting of the American Practitioners of
Infection Control conference in 2016. The American Journal of Infection Control is recognised
globally as the number one ranked Nursing journal on Infection Control and has an enormous
readership.
3 email: official response from the editor dated 25 September 2014

55
Fourth paper review Authors: Whiteley GS, Derry C, Glasbey T, Fahey P
Title: The perennial problem of variability in adenosine triphosphate (ATP) tests for hygiene monitoring within healthcare settings
Publication: Infection Control and Hospital Epidemiology: 2015:36:6:658-663
Impact Factor: 2015 IF: 4.15 5 Yr IF: 4.50 (Source: Research Gate: 4th February 2016)
Citations: Publication was June 2015. No citations at this time.
The fourth paper extended the work of the first and second paper, attempting to overcome some of
the shortcomings of the earlier papers by broadening the work validating the ATP devices beyond
pure ATP into bacterial responses. The methods used followed the teaching of the first paper in that
the materials were applied directly onto the ATP swabs in order to remove variability arising from
swab materials or swabbing technique. The use of different bacterial species opened up the issue of
cellular lysis as a variable but the use of multiple units and quadruplicate applications minimised the
impact of this source of variability.
The work in the study consisted of a range of dilution series, both 10-fold and 20% dilution series.
The freshly prepared bacteria suspensions were provided but all dilution series, including
preparation of materials, confirmation of validation for pipettes, dilution series, application of the
diluted suspension, enumeration and confirmation of enumeration, recording and interpretation of
results, and work area clean up were all conducted by the principle author under both direct and
delegated supervision within a PC2 Microbiology Laboratory.
The purpose of the series experiments was in the first instance to investigate and reconfirm the
dynamic range of each of the ATP devices using both two bacterial species and a pure ATP solution.
Quantitation of the ATP was again confirmed using a validated HPLC method. Learning from the
earlier work, nearly every individual dilution sample was tested in quadruplicate with each of the
ATP devices. The benefit of this was that the Cv could again be calculated for the entire sample
group and thus express clearly the difficulty of this uncontrolled variability in the use of ATP devices.
This paper has the benefit of further time to reflect more appropriately the breadth of literature that
has been published in relation to ATP testing. Even during the preparation of this fourth paper, a
separate study was published (manufacturer funded), using just one branded ATP device and that
study not only failed to reflect on the critical literature in the field, but used a single point sampling
methodological approach.29 A letter to the editor (principle author GS Whiteley) was written and
submitted to Infection Control and Hospital Epidemiology criticising the sampling method, and this

56
letter was published by the journal.30 What was interesting in the reply was the concession by
Visrodia et al., that the work would have benefited from a better sampling method, but they were
concerned over the “cost” implications for field work applications.31
This was the perfect introduction to the importance of the extension of the earlier work and the new
paper submitted. One of the peer reviewers appropriately commented as follows: “This important
report represents an in-depth extension of prior studies by the authors which increases both the
depth and breadth of analysis of practical aspects of the use of ATP bioluminometers which had been
widely marked for use in evaluating the cleanliness of near-patient surfaces in healthcare settings.
Although concerns regarding the accuracy and sensitivity of ATP testing in clinical settings have been
repeatedly raised during the past five years, this report represents the first in vitro analysis to
objectively and independently (not manufacturer sponsored) assess the accuracy of the ATP systems
currently being used…The methods of evaluation were innovative and appropriate. The use of co-
efficient variation (Cv) was particularly appropriate.”4
The work itself both extended the findings of the earlier work, but also introduced a fourth and
again distinctly differentiated ATP device (Charm). As this paper was a full research submission the
expression of the data could also be amended to better reflect the data sets covering the variability
found with testing against pure ATP and the two bacteria (Pseudomonas aeruginosa and
Staphylococcus epidermidis). The analysis of the data was conducted using Cv and as part of the
statistical analysis the decision was taken to express the spread of the Cv data using box and whisker
plots rather than the dot plot format. The box and whisker format allowed a more simplified
presentation on the spread of the data and also showed outliers.
Each of the ATP devices demonstrated similar patterns of variability which are shown as box and
whisker plots as shown in Figures 1 to 3 in the published paper. An important observation was that
outliers were present in the data as outliers, both above and below the whiskers which were placed
at the 10th and 90th percentile calculations for each device and against each test solution. This has
major implications for sampling methods and perfectly illustrated the point which was made in the
earlier letter to the editor.30 Figure 4 presented another aspect to the data which simply expressed
the range and median points for the range of Cv for each device in each test platform. Whilst it looks
like the ATP devices could be ranked for performance, in fact the key finding is that every one of the
branded ATP devices showed a Cv range above 0.4 which means that for any reading obtained in the
field, there is a 20% possibility that the reading could be wrong by a factor of 2.
4 email: official response from the editor dated 3rd January 2015

57
This is a highly important finding and suggests an explanation for the poor precision of the ATP
device when tested using a 20% dilution series (first paper). This finding also underscores the
importance of getting the sampling methods correct. A quadruplicate sampling approach with
calculation of the arithmetic median will provide the most reliable pathway to flattening out the
uncontrolled variability in ATP data obtained through sampling in the field. This is not always
possible in field work, but there are other ways being considered in fresh research that could
provide an alternative approach that would be equally suitable.
This fourth article had some limitations. Firstly, the work on dynamic range which compares the
response to ATP and to two bacterial species could not be included in a single paper. Secondly, only
one ATP device per brand was available for use in the experiments. Thirdly, the data set again could
not accommodate measures that assessed variability across the entire shelf life period of the
consumables.
A major benefit of the journal chosen (Infection Control and Hospital Epidemiology) is that the
primary readership are clinicians who are the members of the Society of Healthcare Epidemiology of
America (SHEA). Predominantly the membership is comprised of practising infectious diseases
physicians. The journal also has a broad global readership amongst infectious diseases clinicians and
other infection prevention professionals.
The full impact of this paper will continue for some time. But in response to this paper, one of the
manufacturers of ATP devices has already responded with a letter to the editor.32 This letter is from
a marketing manager and strongly puts a case in favour of the use of ATP devices for cleanliness
monitoring within healthcare settings, citing much of the literature already published in support of
that view. The response from Whiteley et al., author group will agree with the basic proposition that
ATP has an important place in healthcare settings, as indicated in paper 3, but that the issue of
uncontrolled variability does require an active response from manufacturers. This variability issue is
a different problem from attempting to correlate ATP readings with just bacterial contamination. 33

58
Fifth paper review Authors: Whiteley GS, Knight JL, Derry CW, Jensen SO, Vickery K, Gosbell IB
Title: A pilot study into locating the bad bugs in a busy intensive care unit
Publication: American Journal Infection Control: 2015:43:1270-1275
Impact Factor: 2015 IF: 2.21 5 Yr IF: 2.50 (Source: Research Gate: 4th February 2016)
Citations: Publication was June 2015. No citations at this time.
This pilot study took key learnings from the first four papers and applied them within the challenging
environment of an active Intensive Care Unit (ICU) in a primary care hospital. The context for the
study was the attempt to locate dry surface biofilms.34, 35 The second author on this paper (Jessica
Knight) had been tasked with the application of a new and more aggressive environmental recovery
approach in an attempt to locate the presence of MRO and the possible locations of dry surface
biofilms.36 The first run of sampling was applied to high touch object (HTO) locations that the prior
literature had indicated were potential reservoirs. Only a single sample from 23 swabs demonstrated
growth of an MRO.
After discussions amongst the co-authors, it was agreed to trial the use of ATP testing as a rapid,
real-time and relative indicator of surface cleanliness levels. It was hoped the ATP testing would
discriminate between what was considered a clean surface and what may be indicated as a soiled
surface and potentially contaminated. The sampling was somewhat ad hoc, and the methodology at
risk of selection bias as was clearly indicated in the paper. The use of ATP testing did assist in
directing the sampling locations towards the more contaminated surfaces in and around the clinical
work area as shown in Figure 1 in the published paper. A significantly greater amount of samples
demonstrated the presence of MRO once ATP testing was included in the field sampling and
particularly on HTO and surfaces within the clinical work station as indicated in Table 2 in the
published paper. Unfortunately as a Pilot study the number of samples was limited, and access into
the working ICU was even more tenuous, thus preventing the extension of the work to extend the
sampling and expand the number of surfaces to be examined.
The importance of this paper is demonstrated by the five separate important findings revealed in the
results of the study. Firstly, the field testing reconfirmed that the two ATP devices used provided
readings in RLU on a different scale which practically demonstrated the lack of instrument
interoperability. Secondly and surprisingly these two sets of readings in a real life application had
almost no correlation (R2=0.0144), thus any comparison between the two sets of RLU readings could
not be accomplished. Both of these findings are shown in Figure 2 of the paper.

59
Thirdly, the ATP testing gave the expected rapid outcomes which did aid in assessing the relative
cleanliness of the different areas. As the results were quick and several “trial” readings were taken in
the clinical work station, the actual readings were higher than for the other surfaces in the
immediate patient zone (using the Hygiena ATP device), thus indicating a relatively more unclean set
of surfaces. The readings were separated in some cases by an order of magnitude on the RLU scale
which satisfied the concerns on where readings were differentiated by less than a factor of two (4th
paper) and as per the dynamic range findings (1st paper). The real time response of the ATP testing
demonstrated that the strength of the ATP testing (instantaneous results) helped to overcome the
weakness of the microbial recovery i.e. real-time delay between testing and results.
Fourthly, the statistically significant finding of the paper was that the use of ATP testing did assist in
finding more MRO through environmental microbial recovery alone by providing the immediacy of
feedback on surfaces sampled. Broadly the results were 1/23 on sampling without the assistance of
ATP testing, and 12/36 with the assistance of ATP testing (using a matched sampling approach). As
discussed in the paper, it was the very low recovery number (just 1 MRO positive sample) on the first
sampling round that grounded the statistical findings. Another part of the reason for this may have
been bias with the introduction of a second more experienced operator (the principle author), and
this was also noted as a limitation on the paper.
The fifth and final finding was the significantly large number of MRO recovered from surfaces within
the clinical work area (13 separate MRO locations). We are not aware of any similar findings, using
any methods, of as many MRO recovered from an ICU in a single study in such a short period of time,
although recent evidence supports a more aggressive approach to investigation.37 This aspect of the
work is continuing to be actively researched under a separate and on-going series of linked studies
by several of the co-authors.
The peer review comments on the paper were emphatically positive.5 Said the first reviewer: “This
was an exceptionally well written study with a tremendous amount of promise for MRO in the ICU.
The study had a strong structure, analysis of results, and appropriate identification of strengths/
weaknesses.”
The second reviewer said “This was a very well planned and executed study, pertinent and timely.
The novel approach to detecting MRO outside of patient care areas can provide infection control
practitioners with another tool to identify and correct otherwise undetected sources of nosocomial
infection. The statistical tools used were clearly described and appropriate to the study.”
5 email: official response from the editor dated 22nd June 2015

60
This was the strongest set of peer reviewer comments of any of the five papers and sets a ringing
endorsement to the work. The other pleasing thing about this feedback is that it included the lead
up work of the earlier publications and provides a positive platform on which to use ATP testing.
One of the challenges arising from this focused series of studies on validation of ATP testing devices
has been remaining positive when there were so many findings that indicate difficulties in working
with ATP testing devices. This fifth paper was another deeply rewarding experience as it allowed the
ATP devices to be used in a valid and significant way. This study took advantage of the advantages of
ATP testing, and allowed to the problems in interpretation and disadvantages of the RLU relative
reading scale to be cast in context and not overstated.
As the primary author my role in the research field work used skills acquired over my working
lifetime, including extending my (long-ago) undergraduate training as an environmental health
officer in observing the real aspects of field work in the ICU. Whilst my first co-author (Jessica Knight)
did the microbial sampling I was able to conduct all of the matched ATP testing. As the principle
author I also did all of the statistical analysis, although due thanks to Dr Chris Derry for his assistance
in setting up the chi-square framework and revision based on the Yates correction due to the low
sample numbers. The level of analysis in this ‘pilot study’ was more detailed and varied than any of
the earlier papers and has greatly extended my analytical and statistical skill. Thanks also to
Associate Professor Karen Vickery on the suggestions to run Fishers Exact test as a second tier and
confirmatory method in addition to the chi-square.
The study limitations were very well covered in the paper, but it is appropriate to add some
commentary on the implications of the findings as part of the PhD theme.
Firstly, a number of other studies have used predicative models including receiver operating curves
(ROC) in justification of suggested hygiene thresholds that could be applied to ATP testing.8,38,39 Each
of these attempts at a single standardised RLU hygiene threshold have been based on a single
branded ATP device with the assumption on the uniformity of scaling using RLU. This fifth paper is
the first since Anderson et al., (2009) that used two differently branded/ scaled devices in a field
study, and which appropriately expressed the quite distinct scaling in both the application and
findings.6 In this fifth paper the use of an ROC method suggested two distinctly different RLU
thresholds (20 RLU: Hygiena and 350 RLU: Kikkoman), although neither threshold was correlated
with MRO recovery.

61
Secondly, the findings whilst statistically significant in assisting with the locations of appropriate
sampling locations within the ICU favoured no particular brand of ATP testing device. This too was an
important outcome for the study.
Thirdly, this fifth paper provided an appropriate thematic close to the PhD as a single unit of study.
This paper used the findings of all of the earlier papers and demonstrated the findings and learning
gained through the study to finalise this single piece of work. Rather than using the ATP testing
devices as a regular monitoring tool where the data indicates poor performance, this paper used the
ATP tests as a one off method of determining the relative cleanliness of different surfaces for the
purpose of environmental microbial recovery. The relative difference in cleanliness in the study was
indicated by more than ten-fold differences in the RLU readings which our earlier data clearly
validated as a strength.
The risks of single point sampling were overcome through the method of use, and through using a
second ATP testing device as an alternative reading value. Whilst this had its own limitations, such as
no discernible correlation between the two devices, the devices themselves both were able to
indicate higher values for the more highly soiled surfaces.
The fifth paper was published in the December 2015 edition of the American Journal of Infection
Control and was given the prominence of the lead article for that edition of the journal. A separate
press release on the study and its implications for cleanliness monitoring and infection prevention
more generally was authorised and circulated by the American Practitioners of Infection Control for
general media. An accompanying Australian press release was also prepared by Western Sydney
University to coincide with the publication.

62
The PhD Theme summarised
The project title for the PhD study is “A study into the validation of ATP testing devices for integrated
cleanliness monitoring within healthcare settings”. The work commenced with a range of
experiments focused broadly on the validation of three commercial brands of rapid ATP testing
devices. At the time of commencement of the laboratory work, there were a number of published
studies suggesting that ATP testing could be used as an alternative to microbial recovery as a
benchmark for cleanliness and hygiene standards within healthcare settings. Prior to this body of
work, no independent study had been published validating the ATP devices using a method based on
standardised industry technical validation guidelines.
The first paper demonstrated problems with the devices that required additional studies and
illustrated the need for a full validation process prior to any broad acceptance of ATP testing. The
second paper focused on the difficulties with data precision, which were demonstrated statistically
using Cv, albeit on a study platform using only a known source pure ATP. The third paper continued
the validation theme by examining the place that ATP testing had amongst the range of cleaning
monitoring methods. This third paper contextualised both the place of ATP testing in cleaning
monitoring and mitigated the weaknesses identified through the laboratory studies.
The fourth paper extended the work on the first and second papers with a greater array of validation
directed experiments and accentuated the expression of the imprecision of the commercial ATP
devices through the use of Cv as an already accepted and appropriate statistical platform. This work
using bacterial suspension as well as ATP, and building on the earlier work with ATP alone, clearly
outlined for the healthcare sector the difficulty of measurements using the current generation of
ATP testing devices. The problems with ATP testing have been broadly recognised.40
The fifth and final paper concluded the thematic approach of the study and demonstrated that with
a constructed approach to field use of ATP testing, and to interpretation of the data, the ATP devices
can play an important role in monitoring of cleanliness and cleaning within healthcare settings. This
was the goal of the study. The PhD thesis has demonstrated that the validation of the ATP testing
devices is possible even with the limitations of the ATP testing devices revealed through these
studies. The thesis and series of published findings has also shown that using ATP testing within an
integrated cleanliness monitoring method provides a substantially improved approach versus the
conventional methods. This has tremendous benefits for infection prevention across the entire
global healthcare system.

63
References 1. Griffith CJ, Cooper RA, Gilmore J, Davies C, Lewis M. An evaluation of hospital cleaning
regimes and standards. J Hosp Infect:2000:45:19-28 2. Heller M, Thompson PA, Loock MH, Sawchuk A, Guerrero DM. Variability of Adenosine
Triphosphate – Based Bioluminescence Assay Readings among Drug-Resistant Pathogens. Infect Control Hosp Epidemiol: 2012:33:1286-1288
3. Aiken ZA, Wilson M, Pratten J. Evaluation of ATP bioluminescence assays for potential use in a hospital setting. Infect Control Hosp Epidemiol: 2011:32:507-509
4. International Conference on Harmonisation of technical requirements for registration of pharmaceuticals for human use. ICH Harmonised Tripartite Guideline for Validation of Analytical Procedures: text and methodology Q2 (R1). ICH Guidelines 2008
5. Sherlock O, O’Connell N, Creamer E, Humphreys H. Is it really clean? An evaluation of the efficacy of four methods for determining hospital cleanliness J Hosp Infect: 2009:72:140-146
6. Lewis T, Griffith C, Galo M, Weinbren M. A modified ATP benchmark for evaluating the cleaning of some hospital environmental surfaces. J Hospital Infection:2008:69:156-163
7. Andersen BM, Rasch M, Kvist J, Tollefsen T, Lukkassen R, Sandvik L, Welo A. Floor cleaning: effect on bacteria and organic materials in hospital rooms. J Hosp Infect: 2009:71: 57-65
8. Mulvey D, Redding P, Robertson C, Woodall C, Kingsmore P, Bedwell D, Dancer SJ. Finding a benchmark for monitoring hospital cleanliness. J Hosp Infect; 2011:77:25-30.
9. Malik DJ, Shama G. Estimating bacterial surface contamination by means of ATP determinations: 20 pence short of a pound. J Hosp Infect: 2012:80:354-356
10. Shama G, Malik DJ. The uses and abuses of rapid bioluminescence-based ATP assays. International J Hygiene and Environmental Health: 2013:216:115-125
11. Whiteley GS, Derry C. The importance of practical zero in cleaning performance indicators. In: Abstracts of the 14th Congress of the International Federation of Infection Control; 2011; Oct 12–15: Venice; through Craigavon Lte, Northern Ireland: IFIC: 2011
12. Dancer J. Hospital cleanliness: establishing a new science. J Hosp Infect: 2012:80:354-356 13. Sciortino CV, Giles RA. Validation and comparison of three adenosine triphosphate
luminometers for monitoring hospital surface sanitization: A rosetta stone for adenosine triphosphate testing. Am J Infect Control: 2012:40:e233-239
14. Malik DJ. Assessment of infection risk from environmental contamination using rapid ATP surface measurements. Am J Infect Control: 2013:41:469-479
15. Malik RE, Cooper RA, Griffith CJ, Use of audit tools to evaluate the efficacy of cleaning systems in hospitals. Am J Infect Control: 2003:31:181-187
16. Boyce JM, Havill NL, Lipka A, Havill H, Rizvani BS. Variations in hospital daily cleaning practices. Infect Control Hosp Epidemiol: 2010; 31:99-101
17. Carling PC, Briggs JL, Perkins J, Highlander D. Improved cleaning of patient rooms using a new targeting method. Clinical Infect Dis: 2006; 42:385-388
18. Carling PC, Parry MM, Rupp ME, Po JL, Dick B, Von Beheren S. Improving cleaning of the environment surrounding patients in 36 acute care hospitals. Infection Control Hospital Epidemiology: 2008:29:1035-1041
19. Murphy Cl, Macbeth DA, Derrington P, Gerrard J, Faloon J, Kenway K, Lavender S, Leonard S, Orr A, Tobin D, Carling P. An assessment of high touch object cleaning thoroughness using fluorescent marker in two Australian hospitals. Healthcare Infection: 2011:16:156-163
20. Boyce JM, Havill NL, Havill HL, Mangione E, Dumigan DG, Moore BA. Comparison of fluorescent marker systems with 2 quantitative methods of assessing terminal cleaning practices. Infection Control Hospital Epidemiology: 2011:32:1187-1193
21. Sylvia Munoz Price: DAZO: ICHE 2012. Decreasing Operating Room Environmental Pathogen Contamination through Improved Cleaning Practice. Munoz-Price LS, Birnbach DJ, Lubarsky DA, Arheart KL, Fajardo-Aquino Y, Rosalsky M, Cleary T, DePascale D, Coro G, Namias N, Carling P. Infect Control Hosp Epidemiol: 2012:33:897-904

64
22. Rupp ME, Adler A, Schellen M, Cassling K, Fitzgerald T, Sholtz L, Lyden E, Carling P. The Time Spent Cleaning a Hospital Room Does Not Correlate with the Thoroughness of Cleaning time spent does not correlate: ICHE 2013:34:100-012
23. Carling PC, Huang SS. Improving healthcare environmental cleaning and disinfection: current and evolving issues. Infect Control Hosp Epidemiol: 2013:34:507-513
24. Guerrero DM, Carling PC, Jury LA, Ponnada S, Nerandzic MM, Donskey CJ. Beyond the Hawthorne Effect: Reduction of Clostridium difficile Environmental Contamination through Active Intervention to Improve Cleaning Practices. Infect Control Hosp Epidemiol: 2013:34: 524-526
25. Rupp ME, Huerta T, Cavalieri RJ, Lyden E, Van Schooneveld T, Carling P. Optimum Outliers: ICHE 2013 re cheating cleaning staff Optimum Outlier Model for Potential Improvement of Environmental Cleaning and Disinfection Infect Control Hosp Epidemiol: 2014:35:721-723
26. Smith PW, Beam E, Sayles H, Rupp ME, Cavalieri RJ, Gibbs S, Hewlett-Smith A. Cleaner feedback ATP Impact of Adenosine Triphosphate Detection and Feedback on Hospital Room Cleaning. Infect Control Hosp Epidemiol: 2014:35:564-569
27. Trajtman AN, Manickam K, Macrae M, Bruning NS, Alfa MJ. Continuing performance feedback and use of the ultraviolet visible marker to assess cleaning compliance in the healthcare environment. J Hosp Infect: 2013:84:166-172
28. Australian Council on Safety and Quality in Healthcare (ACSQH). National Safety and Quality Health Service Standards. ACSQH; Sydney Australia, 2012
29. Visrodia KH, Ofstead CL, Yellin HL, Wetzler HP, Tosh PK, Baron TH. The Use of Rapid Indicators for the Detection of Organic Residues on Clinically Used Gastrointestinal Endoscopes with and without Visually Apparent Debris. Infect Control Hosp Epidemiol: 2014:35:987-994
30. Whiteley GS, Derry C, Glasbey T. Sampling Plans for Use of Rapid Adenosine Triphosphate (ATP) Monitoring Must Overcome Variability or Suffer Statistical Invalidity. Infect Control Hosp Epidemiol: 2015:36:236 - 237
31. Visrodia KH, Ofstead CL, Wetzler HP, Tosh PK, Baron TH. Reply to Whiteley et al. Infect Control Hosp Epidemiol: 2015:36:237 - 238
32. Roady L. Abundant Research in Support of ATP Cleaning Verification's Applicability in Healthcare. Infect Control Hosp Epidemiol: 2015 :36:1367
33. Whiteley GS, Derry C, Glasbey T, Fahey P. Response to Roady. Infect Control Hosp Epidemiol: 2015:36:1368
34. Vickery K, Deva A, Jacombs A, Allan J, Valente P, Gosbell IB. Presence of biofilm containing viable multi-resistant organisms despite terminal cleaning on clinical surfaces in an intensive care unit. J Hospital Infection: 2012:80:52-55
35. Hu H, Johani K, Gosbell IB, Jacombs A, Almatroudi A, Whiteley GS, Deva AK, Jensen S, Vickery K. Intensive care unit environmental surfaces are contaminated by multi-resistant bacteria in biofilms: combined results of conventional culture, pyrosequencing, scanning electron microscopy and confocal laser microscopy. J Hosp Infect: 2015: 91:35-44
36. Corbella X, Pujol M, Argerich MJ, Ayats J, Sendra M, Pena C, Ariza J. Environmental Sampling of Acinetobacter baumannii : Moistened Swabs Versus Moistened Sterile Gauze Pads Infect Control Hosp Epidemiol: 1999:20:458-460
37. Humphreys H, Fitzgerald-Hughes D. Search and you will find: detecting Extended-Spectrum –Lactamase-Producing Klebsiella pneumonia from a patient’s immediate environment. Infection Control Hospital Epidemiology: 2013:34:5:534-536
38. Moore G, Smyth D, Singleton J, Wilson P. The use of adenosine triphosphate bioluminescence to assess the efficacy of a modified cleaning program implemented within an intensive care setting. Am J Infect Control: 2010:38:617-22
39. Smith PW, Sayles H, Hewlett A, Cavalieri RJ, Gibbs SG, Rupp ME. A study of three methods for assessment of hospital environmental cleaning. Healthcare Infect: 2013:18:80–85

65
40. Loveday H, Wilson JA, Pratt RJ, Golsorkhi M, Tingle A, Bak A, Browne J, Prieto J, Wilcox M. EPIC 3 National Evidence Based Guidelines for Preventing Healthcare-Associated Infections in NHS Hospitals in England. J Hosp Infect: 2014:86: Supplement 1
41. Monti s, Jefferson J, Mermel L, Parenteau S, Kenyon S, Cifelli B. Use of failure mode and effect analysis (FMEA) to improve active surveillance for methicillin-resistant Staphylococcus aureus (MRSA) at a university-affiliated medical center. Abstract ID 54565. Am J Infect Control: 2005: 33:5: E158

66
Chapter 4
Conclusions and Recommendations
Précis
This PhD set out to validate the use of rapid ATP testing for use in healthcare settings, and to
integrate the use of ATP testing into an improved approach to cleanliness monitoring. This chapter
draws the conclusions from the study arising from the findings of the five published papers. This
chapter also comments on the apparent and remaining gaps in the knowledge and recommends the
pathway for further research into this topical subject.
Conclusions arising from the study
The initial goal was to validate the use of rapid ATP testing for applications in cleanliness monitoring
within healthcare settings. The study and publications of this PhD are the most comprehensive set of
independent studies to date in the field of ATP testing, and have the advantage of comparing across
a number of branded ATP testing devices. The studies incorporate a number of novel methods whilst
following a standard industry process of instrument validation.
The major conclusions arising from this PhD are summarised below.
Findings from the laboratory validation phase of the research
1. The reading scale for rapid ATP testing uses relative light units (RLU). Unfortunately the scale
is relative in every sense and no two meters tested use the same algorithm to arrive at a
common reading or RLU level. This leads to a number of subset problems including:
a. The absence of a standardised scale means that none of the branded devices
provide a data set which is in common with any other branded ATP testing device;
b. The lack of a common scale removes the capacity to calibrate the ATP testing
devices on a uniform basis, thus it is not possible to achieve accuracy in the
measurements in the normal scientific manner;
c. The lack of a common RLU scaling leads to interoperability between differently
branded ATP testing devices;

67
d. The readings from different units appear so totally dissimilar that no comparison is
possible from individual readings between differently branded ATP testing devices;
e. The scaling is relative and so product innovation includes in one case additional
reactivity (Kikkoman reacts to AMP as well as ATP) and in another the scaling
algorithm includes a first step of at least three logs for a baseline (Charm). The
impact of this is to further disassociate the commonality of RLU scaling;
f. The different ATP testing devices have different dynamic ranges when tested against
quantitated and pure ATP (Figure 1, from the first of the published papers);
g. The limits of quantitation (lower and upper) for each of the ATP testing devices are
reached without any indication given to instrument users;
h. The poor reading precision at the lowest part of the dynamic range for both the 3M
and Kikkoman branded ATP testing devices leads to a practical zero point around
100 RLU. Readings below this level are relatively meaningless as the readings are
below the lower limit of quantitation. The Hygiena ATP testing device demonstrated
better reliability at the lower end of the dynamic range and showed a lower limit of
quantitation at the indicated “0” (zero) point on the instrument. The Charm ATP
testing device results are not shown in the included papers but that branded device
appeared to have a lower limit of quantitation above 1000 RLU on its reading scale;
i. All four of the ATP testing devices have poor precision in RLU readings across their
full dynamic ranges;
j. And, none of these problems is clear to any user without having done their own
comprehensive validation.
2. Rapid ATP testing devices are capable of distinguishing between cleanliness levels that are
differentiated by a ten-fold difference in underlying ATP levels. Figure 1 of the first paper
demonstrates that each of the ATP devices was reliable in this measurement criterion when
using a median reading approach. This has important and practical implications for reliability
in the interpretation of field based readings from surfaces to distinguish between strongly
differentiated levels of organic soiling on various surfaces.
3. The ATP testing devices have a poor capacity to distinguish between relatively similar levels
of organic soiling is poor due to imprecision (Figures 2 -4 from the first paper). The poor
precision with apparently uncontrolled variability in RLU readings suggests that the
commercially available rapid ATP testing devices are generally not suitable for routine

68
testing against any specific cleanliness threshold expressed in RLU, and particularly where
the surfaces have similar before and after levels of underlying ATP (cellular soils)
contamination.
4. The cleanliness thresholds that have been suggested in publications as suitable for ATP
testing, imply that there is a single and consolidated scale which is universally applied to all
branded ATP testing devices, which is incorrect. A single RLU cleanliness threshold is not
possible as each branded device has its own unique scale without interoperability. The first
cleanliness threshold readings on the RLU scale were 500 RLU and 250 RLU, based on work
using the 3M device.1,2 The more recent 100 RLU was based on the Hygiena device.3
5. The uncontrolled variability in readings is not recognisable by normal users who are not
trained in the interpretation of data arising from ATP testing devices. This variability is the
same whether testing pure ATP or bacterial cultures. The variability is inherent within the
rapid ATP testing systems (see Figures 1-4, fourth published paper). Thus, significant care is
required prior to any sampling planning, and further care is required for the interpretation
of any RLU data from field usage of ATP testing devices.
6. The high variability can be demonstrated using the statistical method of the coefficient of
variance (Cv) as demonstrated in the fourth published paper. This statistical approach has
allowed all of the discreet test points and samples at those points to be normalised for
comparison purposes.
7. The Cv for each of the branded ATP devices tested, regularly reached above 0.4 meaning the
standard deviation was frequently above 40% of the sample mean (see Figure 4, fourth
Whiteley paper). At this level, there is a 20% chance that any reading will be inaccurate by a
factor of 2. In practical terms, this implies that any individual reading should be regarded as
subject to an error level of from 50% to 200% of the original reading.
8. The frequency of outlier results, both above and below the 10th and 90th percentile, both in
sample values and Cv, strongly suggests that any sampling methodology should be based
around the use of medians and not means due the likelihood of asymmetrical distribution
within any data set.

69
Findings from the FMEA study
9. ATP testing rapidly indicates surface cleanliness whereas FM spot removal indicates the
performance of a cleaning task and the overall achievement level in surface wiping by a
cleaning process. Thus ATP is an efficacy measurement and FM is an efficiency
measurement.
10. FM has the advantage of very rapid feedback to cleaning staff on cleaning efficiency. None
of the other three cleaning monitoring methods (ATP testing, visual inspection or
microbiological sampling) indicated cleaning efficiency as reliably as FM usage.
11. ATP testing provides a rapid digital readout from measurement of the residual biological
soiling levels (cleanliness) of a surface. The speed of feedback on relative cleanliness by ATP
testing provides advantages over the alternative cleaning and cleanliness monitoring
methods (FM, visual inspection and surface microbiology).
12. ATP testing can be integrated into a cleanliness and cleaning monitoring with each of the
other three cleaning and cleanliness monitoring methods to provide a better quality
assurance outcome (see Figure 1, third published paper). This integrated approach uses the
relative strengths of the different monitoring methods, to overcome the inherent
weaknesses in each of the same monitoring methods. An example is that ATP testing can be
used to guide microbial sampling by providing rapid feedback on relative surface cleanliness.
Findings from the field application of ATP testing within an integrated
cleanliness monitoring process
13. The use of ATP testing to guide microbial sampling is significantly more likely to result in
confirmation of contaminated areas as opposed to a list based approach or visual inspection
alone.
14. The integrated methodology as per Figure 1 in the third published paper, was shown to be
superior to using visual inspection or a list based approach in isolation when looking to
identify less clean surfaces on which MRO may be coincidentally present on HTO or surfaces.

70
15. This active and integrated approach to cleanliness monitoring provides an improved
understanding of the spread of soils and level or risk of transmission of infective organisms
across both patient and non-patient/clinical zones within hospital ICUs. Elimination of sites
where MRO are present is an evidenced based application of cleanliness standards that
should contribute to reducing the risks of HAI.
16. The use of ATP testing was validated in accordance with the goals for the study. Despite the
findings on precision and reliability, the use of an integrated monitoring methodology using
the advantages of ATP testing resulted in findings which suggest that ATP testing can be
used within healthcare settings for the purpose of integrated cleanliness monitoring.
Additional notes on practical ATP Testing for use within a Healthcare setting
17. A well planned study within a healthcare setting using ATP testing should be based on the
following elements to enable the most representative results:
a. The ATP testing device and consumables should be well understood and
consumables to be used should be within the sue by dates;
b. The High Touch Objects or surfaces (HTO)to be sampled using ATP testing should be
selected and a sampling plan arranged that takes account of cleaning schedules and
cleaning materials being used. Not every HTO needs to be tested in a sampling plan,
but a selection of HTO should be tested on each sampling run, and if possible the
HTOs tested should be randomised or varied between each sampling run;
c. Each site to be subjected to ATP testing should be initially tested, cleaned
thoroughly, and then re-tested to ensure that the expected “best outcome” is
established prior to any application of ATP testing within healthcare settings;
d. The sampling plan and frequency should take account of the budget for the cleaning
monitoring processes using ATP testing, including the labour time;
e. Each surface should be sampled in duplicate (at least) and the sampling area should
be the same amount of area for each duplicate sample. As note in this thesis,
outliers can occur both above and below the median for any single reading and the
possibility exists for a Cv >0.4 resulting in a 20% chance that any individual reading
could be wrong by a factor of two. Consequently, if the duplicate samples are found
to be very dissimilar (say separated by a 10-fold difference in RLU), then a third or

71
even fourth sample might be required. The median should always be preferred to an
average result;
f. The sampling plan for any study should commence with an initial period that defines
the ‘normal’ or ‘expected’ cleanliness level across the HTO sampled;
g. A second stage might involve an intervention which could include a new method of
cleaning, or cleaning frequency, and/or staff feedback on the findings from the initial
and subsequent sampling runs;
h. A final stage might involve a follow up sampling run to determine the success or
sustainability of the intervention and may confirm the need for continued random
monitoring to sustain any improvements in cleanliness;
i. Statistical models should follow standard pathways, although duplicate samples
should use the median approach as the true reading.
Recommendations on future testing and investigation
This PhD study has opened a pathway for further investigation on a number of aspects of rapid ATP
testing. These are not limited to the following suggestions but these proposals may form the basis of
additional and subsequent research projects.
There several identified key project areas, which are summarised in the following paragraphs.
Researching a new scale for ATP testing devices
18. This project into a new and universal scale for ATP testing devices would include the
following issues:
a. The RLU scaling approach is not standardised against a quantitative mass of ATP.
This problem could be rectified, but there has been no suggestions from any of the
commercial organisations to replace the subjective RLU scale with considerations of
a suitable scientific approach to a new standardised scale for the expression of ATP
reactivity;
b. The various manufacturers of ATP testing devices are in commercial competition
with each other. Therefore, care will be required to avoid any suggestions of
anticompetitive conduct or collusion between competitors, even for the desirable

72
scientific goal of a commonly agreed scale for ATP testing to replace the current RLU
scales.
c. An independent and non-commercial organisation may be best suited to facilitate
this outcome through a collaborative research program and dialogue with the ATP
device manufacturers;
d. The testing conducted within this PhD demonstrated that a common reaction drives
the response across the dynamic range (Figure 1, first published paper). This rate of
response is seen to be on a common basis for three of the branded ATP testing
devices. This common response to ATP across the dynamic range should be also
investigated with respect to bacterial suspension cultures so as to confirm the dose-
response curve for each branded ATP testing device.
e. The investigation of the new scale could be initiated by plotting the dose-response
to ATP on a ten-fold dilution scale for each device. The slope of the line could be
calculated and the data for each device mathematically converted onto a normalised
scale to provide a new and quantitative scale for measurement of ATP.
f. The range of the ATP scaling could be reduced by recalculating the readings into the
log10 for each number. Thus the variability that is so apparent on the existing scale is
also flattened out when reduced to its log10 base value.
g. The new scale would need to reduce this variability and provide a sufficiently
discreet distance between each value in the scale that overlap of readings is reduced
thus improving the precision of each discreet reading point on the new scale. The
scaling will also therefore likely reduce the range of the numerical scale between the
lower and upper ends of the dynamic range.
h. It has been noted that the lower limit of detection for ATP testing devices when
testing against a suspension culture of bacteria is between 10 up to 100 cfu/mL.4
However, this will vary by organism possibly due to differences in lysis capacity.5 The
most preferential approach would be to conduct a validation process for a new scale
using a pure and validated source of ATP, and then to cross check the device
sensitivity with a panel of suitable bacteria.
i. The most important issue for any new ATP reading scale will be the need for
improved precision at the lower end of the dynamic range. For all of the ATP testing
devices, the lower limit of quantitation will also require improved reliability towards
and at the indicated “0” (zero) level. The most important cleanliness related

73
applications are for data produced at the lower end of the dynamic range and so this
is the most important part of any rescaling consideration.
j. A common scale would provide the ATP testing devices with a quantitative basis on
which standardised and uniform calibration could be achieved.
k. The ability to calibrate ATP testing devices would introduce the capacity to indicate
accuracy of ATP measurements against a common scale to improve reliability. This
common scaling would be the best platform on which to provide a competitive
advantage between the commercial organisations, through improvements in both
accuracy and precision in readings of ATP.
l. Once the accuracy of response to a calibrated range is established, variability would
then be subject to competitive amongst manufacturers. The most competitive ATP
testing devices would then have both measureable accuracy and calibration, with
the added advantage of lower variability (better precision), whether due to
improved reagent stability, light detection, or with better pricing.
m. The attainment of the goals outlined above can only be achieved through a properly
constructed and validated measurement scale for ATP which is calibrated against a
known quantity of ATP.
Researching a new method for cleaning product validation
The results shown in this PhD demonstrate that ATP testing devices reliably distinguish between ATP
based data sets when tested on the basis of a ten-fold difference in underlying ATP. It is accepted
that sanitising and cleaning compounds are intended to clean and remove up to 3 logs of bacterial
soils.6 The difficulty of using live bacterial suspensions for this testing includes both the cost and the
time taken to achieve feedback (it is very time inefficient). A testing system that can provide
measurements that indicate results in a quick and efficient manner would be a major benefit to both
industry and healthcare settings where these cleaning products are used in this global market.
19. Researching a new test method cleaning product validation using ATP testing would include
the following considerations:
a. There are additional methodological issues to be considered with any cleaning
process such as wiping technique, wiping pressure, and wiping material
characteristics.7 However, the significant advantage of using a standardised ATP

74
testing approach would be the improved efficiency through reduced response time
which would allow each of the variable to be controlled and independently
measured, and have almost immediate feedback from the testing;
b. The faster feedback from ATP testing as opposed to standard microbiological
techniques would provide the opportunity to increase the number of test replicates
thus improving the reliability of any results;
c. The issue of relative scaling with RLU is not a problem as it has already been
established that for each of the brands tested, the three log change in ATP is
measured at the same response rate. Therefore, this work could be conducted
irrespective of the brand and scaling approach used by the ATP testing devices;
d. The key qualifying feature of a three log diminishment in soiling could easily be
validated against any of the ATP testing devices once the methodological approach
to cleaning processes are considered.
e. The use of a “scrub testing” device similar to those used for paint and other surface
coating testing systems would standardise many of the concerns such as wipe
direction, wipe pressure and overall wipe repeatability.
f. The ATP enriched soiling systems would also then be validated using both ATP
testing devices and compared with results using live bacterial suspensions in a
controlled laboratory environment. In this way both the soils and the methods could
be validated to be applied as a single test methodology;
g. The possibility of cleaning products affecting the ATP reaction and thereby causing
interference in the RLU readings will also need to be broadly addressed. This would
involve a number of fairly simple controlled experiments which as yet the literature
has not reported. The findings using actual products would have immediate
relevance to field usage of ATP testing devices and would be ideally published
quickly as a short report or similar.
Researching a new sampling algorithm for ATP testing devices
20. The researching of a new algorithm approach, to guide the sampling methodology in the
normal use of ATP testing could be used to define cleanliness thresholds based on a
statistical model that could be applied to any brand of ATP testing device. This might be
achieved even with the current and inadequate RLU scale.

75
Within healthcare settings there is a public health need to both characterise and standardise
surface or environmental cleanliness. Without a common scale on which to measure ATP
standardisation is probably not possible without a more complex and mathematically driven
approach to both sampling and data interpretation.
So then, applying the principle established in the fourth published paper, i.e. that anyone
reading has a 20% chance of being wrong by a factor of two, a bandwidth approach to data
interpretation might be workable. This would allow any individual reading, or set of replicate
readings, to be interpreted within a surrounding zone. This could also allow a cleanliness
threshold to be determined that accounted for the current level of imprecision.
Further work on investigating this approach would be a useful and very practical application
of the findings that could produce a useful platform for benchmarking studies within any
healthcare settings. This approach might also be validated for cleanliness studies
investigating cleanliness outcomes from medical device cleaning processes.
Applications in other fields such as environmental health could also be considered. One
advantage of the environmental health applications is the criteria used for cleanliness
monitoring. Cleaning in food preparation areas is measured on a clean versus unclean
approach where a numerical cut-off or cleaning threshold is less important and undefined.
Extending ATP testing into Applied Epidemiology with Cleanliness and
Cleaning Monitoring
21. The ultimate goal of cleanliness monitoring and cleaning monitoring is to improve the
standards of hygiene within healthcare settings and to thus reduce the risks associated with
MRO on uncleaned or insufficiently clean surfaces. There are an enormous range of
potential confounding factors for a study of this type. In fact, there may need to be a layered
approach of several studies, each of which isolates a limited number of factors, but each one
builds on the results of the earlier findings.

76
The range of confounding factors includes all of the ATP testing issues identified in this
thesis, and also factors such as cleaning materials, cleaning methods, cleaning frequencies,
cleaning supervision, cleaning and cleanliness monitoring methods, management systems,
quality assurance factors, hand hygiene compliance monitoring (ideally validated), patient
monitoring and even cohorting, interlocutory microbiological testing of patients and
environmental surfaces, microbial identification technologies including genetics (whole
genome sequencing) to confirm identification of MRO and transmission associated events,
initial epidemiology and follow up, properly designed and randomised trials and of course a
cost versus benefit aspect on the processes.
Cost versus benefit is a critical feature of the infection prevention paradigm. Clearly the
hazards presented by an insufficiently clean healthcare environment involve patient
morbidity and potential mortality. However, the budgets within healthcare are not unlimited
and the value of a life concept is to be compared against hard costs such as effective and
efficient cleaning services, materials, and the management overheads required to ensure
cleaning and cleanliness standards are set and achieved. These costs are also to be
compared with the costs associated with a patient who sustains an HAI and then has
extended treatments, length of hospital stay, and potentially diminished quality of life
following the HAI.
These critically important matters will need to be addressed, but at this time the nature of
the cost benefit study, and the epidemiology are beyond the boundaries for this thesis.
Continuing to promote and publish results from this PhD study
22. Publishing the results of this PhD more widely would also be useful in combating the “weight
of numbers” approaches taken by ATP testing device promotors and manufacturers.8 There
has been a number of abstract submissions for conferences in 2016 that are being submitted
in the normal manner.

77
References
1. Griffith CJ, Cooper RA, Gilmore J, Davies C, Lewis M. An evaluation of hospital cleaning regimes and standards. J Hosp Infect:2000:45:19-28
2. Lewis T, Griffith C, Galo M, Weinbren M. A modified ATP benchmark for evaluating the cleaning of some hospital environmental surfaces. J Hospital Infection:2008:69:156-163
3. Mulvey D, Redding P, Robertson C, Woodall C, Kingsmore P, Bedwell D, Dancer SJ. Finding a benchmark for monitoring hospital cleanliness. J Hosp Infect; 2011:77:25-30
4. Aiken ZA, Wilson M, Pratten J. Evaluation of ATP bioluminescence assays for potential use in a hospital setting. Infect Control Hosp Epidemiol: 2011:32:507-509
5. Sciortino CV, Giles RA. Validation and comparison of three adenosine triphosphate luminometers for monitoring hospital surface sanitization: A rosetta stone for adenosine triphosphate testing. Am J Infect Control: 2012:40:e233-239
6. Rutala WA, Weber DJ, and the Healthcare Infection Control Practices Advisory Committee (HICPAC). Guideline for Disinfection and Sterilization in Healthcare Facilities, 2008. Centers for Disease Control, Department of Health and Human Services, USA, Government of., Accessed May 2010: http://www.cdc.gov/hicpac/Disinfection_Sterilization/acknowledg.html
7. Maillard J-Y, Sattar SA, Bradley C, Letter to the Editor Missing a trick? Response to: ‘Disinfectant wipes are appropriate to control microbial bioburden from surfaces’, J Hosp Infect: 2015: doi: 10.1016/j.jhin.2015.11.003
8. Roady L. Abundant Research in Support of ATP Cleaning Verification's Applicability in Healthcare. Infect Control Hosp Epidemiol: 2015:36:1367

78
Section Two
The five publications
The published papers appear in the chronological order of publication
1st paper
Journal: Healthcare Infection (HI): 2012:17:91-97 Authors: Whiteley GS, Derry C, Glasbey T.
Title: The comparative performance of three brands of portable ATP-bioluminometer intended for use in hospital infection control
2nd paper
Journal: Infection Control & Hospital Epidemiology (ICHE): 2013:34:5:338-540
Authors: Whiteley GS, Derry C, Glasbey T Title: Reliability testing for portable adenosine triphosphate
bioluminometers
3rd paper
Journal: American Journal of Infection Control (AJIC): 2015:43:147-153 Authors: Whiteley GS, Derry C, Glasbey T
Title: Failure analysis in the identification of synergies between cleaning monitoring methods
4th paper
Journal: Infection Control & Hospital Epidemiology (ICHE): 2015:36:6:658-663
Authors: Whiteley GS, Derry C, Glasbey T, Fahey P Title: The perennial problem of variability in adenosine
triphosphate (ATP) tests for hygiene monitoring within healthcare settings
5th paper
Journal: American Journal of Infection Control (AJIC): 2015:43:1270-1275
Authors: Whiteley GS, Knight JL, Derry CW, Jensen SO, Vickery K, Gosbell IB
Title: A pilot study into locating the bad bugs in a busy intensive care unit
79
Chapter 5
The comparative performance of three brands of
portable ATP-bioluminometer intended for use in
hospital infection control

The comparative performance of three brands of portableATP-bioluminometer intended for use in hospitalinfection control
G. S. Whiteley1,2,3 MSafetyScience
C. Derry1 MSc (Med)
T. Glasbey2 PhD
1School of Science and Health, University of Western Sydney, Penrith, NSW 2751, Australia.2Whiteley Corporation, 12 Mount Street, North Sydney, NSW 2060, Australia.3Corresponding author. Email: [email protected]
Abstract. Background: Portable adenosine triphosphate (ATP)-bioluminometers have been used in the foodindustry to monitor the effectiveness of surface cleaning but their intended use in hospital infection control suggests aneed for instrument validation to confirm effective technology transfer.
Methods:The performance of three readily available brands of portable bioluminometer was compared in terms oftheir ability to generate relative light units (RLU) from a range of standardATP solutions. Quality control of standardswas carried out using high pressure liquid chromatography (HPLC).
Results: There was no significant difference (P = 0.05) in the ability of different meters to effectively measurehygiene change on a log scale in a central measurement range of 0.001 to 1.0mgL–1 ATP. Outside this range meterperformance deteriorated, with the possibility of individual and comparative measurement error. No out-of-rangewarning system existed for any of the meters. While different brands generated widely different log10RLU values forfixed quantities ofATP in this range, curve similarities suggested standardisation possibilities to enable comparison ofresults. Testing at a higher level of resolution in the 0.0001 to 0.002mgL–1 ATP range proximate to a proposed 100RLU cleaning benchmark also revealed poor repeatability as a potential for measurement error.
Conclusions: Portable ATP-bioluminometers, when used to indicate surface cleaning effectiveness, demonstratereliable performance when measuring over a very wide range of ATP concentrations. Monitoring hygiene in terms ofan absolute threshold value such as a cleaning benchmark may, however, be invalid as a concept when using existingportable ATP-bioluminometer technology.
Received 12 July 2012, accepted 19 July 2012, published online 28 August 2012
IntroductionAssessment of the effectiveness of hospital surface cleaning inAustralia relies primarily on direct visual examination, apractice enshrined in National infection control guidelines.1
Although unreliable, visual assessment persists because ofsimplicity of approach and immediacy of feedback to guidethe cleaning process.2,3 The alternative of microbiologicalmonitoring offers the advantage of quantitative results forchanges in surface loads of indicator organisms andpathogens, but demands time and technical expertise whichare not always available. To address these issues severalinnovative methods of cleaning assessment combiningaccuracy, quantification and immediacy of results are underconsideration internationally.4
One possibility is the use of fluorescent ‘soiling spots’marked on high touch objects (HTOs) or near-patient surfaces
before cleaning, with subsequent examination underultraviolet light to detect cleaning efficacy through either fullor partial removal.5,6While the chemiluminescent technologyis simple and immediate, results do not measure soiling butrather cleaning efficiency and readings are qualitative only.Another approach relies on portable bioluminometry tomeasure adenosine triphosphate (ATP) residues on relevantsurfaces, potentially yielding quantitative results.7 While thishas been successfully used in the food industry for at least15 years to monitor contact-surface hygiene, validation foruse in the hospital setting still requires attention, and thisserved as motivation for the research described in this paper.
ATP is the energy currency of living cells and is, therefore,capable of acting as proxy for a broad range of contaminationtypes in the hospital setting, including microorganisms,human cells, food waste, vomitus and faeces.8,9 ATP-
Journal compilation � Australian Infection Control Association 2012 www.publish.csiro.au/journals/hi
CSIRO PUBLISHING
Healthcare Infectionhttp://dx.doi.org/10.1071/HI12021

bioluminometry is not, however, specific for these substancesor for any microbial indicator or pathogenic species.10 ATPdetection alone cannot indicate factors such as infectivity,virulence or infectious dose that are related to diseasetransmission risk, which cannot be assessed withoutidentification of specific microorganisms.11 ATP monitoringcan, however, act as a proxy for surface hygiene changeassociated with adequacy of cleaning practice.12
The ability of commercially available portablebioluminometers to achieve accurate ATP measurementdepends on several factors, the most basic of which is thetechnical performance of the instrument itself.13 It is,therefore, surprising that minimal research attention has beengiven towards instrument validation before the conducting ofintervention research studies in the hospital setting.
In validating any instrumentation the intended operationalenvironment must be taken into account. Importantdifferences may exist between the hospital sector, where theuse is intended, and the food industry where the meters havebeen successfully used in the past. Preliminary investigationshowed that in the food industry the instruments are primarilyused in hazard analysis critical control point (HACCP)assessment, aimed atmonitoringwell defined control points inrelatively linear food production processes, with riskparameters lying within circumscribed ranges.14–16
Hospital monitoring presents fundamental differences,including the verywide range of environments and surfaces tobe monitored, the ad hoc nature of the cleaning processrequired at any time, and the unpredictability of contaminantlevel and type to which a surface may be exposed.17 Inaddition, an interest in comparing results for differenthospitals and units, where different brands of meters withdifferent performance characteristics may be in use, has beenidentified.18
In terms of the different operating principles employed bydifferent instrument manufacturers, it is important not only tovalidate ATP-bioluminometry in general for hospital use, butto include different brands of instrument in such validation.19
The authors see the ultimate establishment of validationcriteria for portable bioluminometers as a complex processrequiring clear definition of healthcare sector objectives anddetermination of the capacity of the main types of unit to meetthese objectives. The paper discusses findings on the
reproducibility of ATP readings relating to individual andcomparative metering performance of three existing brandswith the aim of encouraging dialogue on the validation issuesidentified.
The fundamental principle of all ATP-bioluminometryis the measurement of light from the two-stage luciferinreaction, which give fireflies and glow-worms their ‘glow’:(i) luciferin (in reagent) +ATP (from surface) ! luciferyl
adenylate + inorganic pyrophosphate(ii) luciferyl adenylate +O2! oxyluciferin +AMP+ visible
light (read by bioluminometer)While this biochemical reaction is highly efficient in terms
of chemical to light energy transfer, it presents challenges tothose wishing to capture the reaction chain in vitro, withmanufacturers using a variety of reagents and meteringarrangements to achieve their aims.20 In anticipation ofvariations in results during different monitoring events,bioluminometer read-out is given in relative light units(RLU), based on ordinal rather than interval scaling. Ordinalscales allow results in a specific series of observations to beranked against one another, although numerical differencesbetween successive values may not be constant, in contrastto those in interval scales such as the Celsius temperaturescale. Unfortunately there is no benchmark to determinewhat constitutes a ‘specific series of observations’ inbioluminometry so that monitoring at different times, indifferent settings, and with different brands or designs ofmeter might produce unwanted variability in the results.
While attempts have been made in the past to test meterperformance in terms of microbiological standards relating topathogens and indicator counts, several complications haveintervened, includingvariation inATP level basedondifferentspecies and phase of growth.21–23 This potential confounderwas avoided in the current project by assessingRLUgeneratedagainst standard ATP solutions monitored for stability atregular intervals using calibrated HPLC.
Materials and methodsThree commercially available portable ATP-bioluminometerkits and fresh manufacturers’ reagent tubes including swabswere obtained from laboratory suppliers in the Sydney region.Two of the brands were from large multinationalmanufacturers and had been referred to by name in healthcarepublications in the United Kingdom and United States ofAmerica, whereas the third was a relatively new brand. Otherbrands are believed to exist. In this paper the brands aredescribed as Brands A, B and C for purposes of anonymity.Manufacturers’ packaging claims suggested suitability ofthe bioluminometers for use in both food and healthcaresettings.
ATPwas obtained from SigmaAldrich (Castle Hill, NSW,Australia) and a nine-step, 10-fold dilution series in the0.00001mgL–1 to 1000mgL–1 range was made up using aphosphate buffer diluent immediately before validationtesting. An additional five-step, linear dilution sub-series wasmade up in the 0.0001 to 0.002mgL–1 ATP range to assess
Implications* Portable ATP bioluminometers reliably indicatelargely different ATP levels.
* Monitoring of hygiene using an absolute thresholdsuch as a cleaning benchmark may be invalid usingexisting technology.
* The paper suggests that equipment design and ATPmeasurement scaling be revised before the equipmentis accepted for use within healthcare settings.
B Healthcare Infection G. S. Whiteley et al.

meter resolution within a critical ATP band relating to arecently proposed 100 RLU hospital cleaning benchmark.24
ATP solutions were stored in sterile equipment, on ice duringeach bioluminometer assessment run.
The bioluminometerswere set up as per themanufacturers’instructions and the reagent tubes checked for freshness interms of expiry date. In using the bioluminometers themanufacturers’ instructions were adhered to, which typicallyinvolved placing the manufacturers’ swabs with collectedATP in the tubes provided, releasing the reagent, mixingfor a controlled period, and positioning the tube in thebioluminometer for reading. To remove potential errorsrelating to surface swabbing, however, the recommendedswabbing procedure was modified by directly applying a20mL aliquot of each solution in the standard ATP series ontoeach swab using a 10–100mL calibrated micropipette, withnew micropipette tips for each standard. The amount of20mLwas selected by empirically determining the absorptivecapacity of each manufacturer’s swab type, and using thelowest capacity which could safely be absorbed without riskof over-saturation. Assessment was repeated six times foreach bioluminometer at each ATP concentration, and wheremore than two swabs exceeded the interquartile range formeasured ATP, five additional swabs were tested at thatconcentration. This yielded a total of 95, 93 and 90 readingsfor bioluminometers A, B and C, respectively.
Quality control for ATP solutions was carried out usinghigh pressure liquid chromatography (HPLC) before and aftereach test series. The standard curve for the stock solution wasderived from a certified ATP standard (Sigma Aldrich),
calibration samples being run in triplicate, with resultsshowing strong positive linear correlation (r2 = 0.9998).
Raw RLU data generated at each ATP concentration wassaved in Excel spreadsheets (Microsoft, Seattle, WA, USA)and median, interquartile and total ranges estimated. Non-parametry of data was confirmed using a Normal ProbabilityPlot and a relevant test of statistical significance(Kruskal–Wallis) applied using Minitab (Minitab Inc., StateCollege, PA, USA) to identify association between relateddatasets at the assumed level of significance (P = 0.05).Graphs of overall performance, and performance at thehypothesised cleaning benchmark were prepared usingPASW (IBM, New York, NY, USA).
ResultsCurves were generated for the bioluminometers usinglogarithmic scales for bothRLUandATP to accommodate thevery wide metering range and to assist visual interpretation ofresults (Fig. 1). Median values for RLU at each ATPconcentration were used as a summary index in preference tomeans, in terms of the relatively small datasets with highinterquartile and total ranges.25
A test of association indicated no significant differencebetween performance of the three bioluminometers in themiddle of themeasurement range, from0.001 to1mgATPL–1
(P< 0.39), when logs of both RLUs and ATP median valueswere analysed. The Chi-square test, however, assesses ratiorelationships and marked differences in absolute values ofRLU at specific ATP concentrations existed (curves are
1
10
100
1000
10 000
100 000
1 000 000
10 000 000
1E–0
5 1 10 100
1000
0.00
01
0.00
10
0.01
00
0.10
00
Med
ian
RLU
s
Concentration of ATP standard (mg L–1)
Brand A
Brand B
Brand C
Hypothesised cleaning benchmark
Fig. 1. Performance curves for three brands of portable ATP-bioluminometer.
Portable ATP-bioluminometer reliability Healthcare Infection C

parallel but not coterminous). For example, at the 0.01mgATP L–1 standard there is an 11-fold difference in RLUbetween the most and least optimistic instruments.
In terms of the upper end of the range (1 to 1000mg ATPL–1), a significant difference in performancewas found to existbetween the bioluminometers (P < 0.03), as suggested by theconvergence of curves for two of the meters, with rapidflattening and divergence of the curve for the thirdmeter. Thismay relate to differences in light measuring technologybetween the meters, including variations in the chemicalextinction point for the available luciferin reagent.
At the lower end of the range (0.00001 to 0.001mg ATPL–1) there was also a fall-off in monitoring performance, withsignificant differences between the three brands (P< 0.04).None of the meters, however, had a warning system orautomatic shut down to alert the user to the fact that it wasoperating outside its apparent effective (accurate) range.
Next the ability of meters to measure fine changes in ATPlevel in the vicinity of an absolute cleaning benchmark, asrecently proposed in the literature, was assessed.23 Thiscleaning benchmark is basically an action-threshold limitvalue (TLV) which is intended to indicate when a sufficientstate of hygiene exists for the surface to be considered ‘safe’,and does not require further cleaning.
Five linear sub-dilutions of standard ATP, lying within therange 0.0001 to 0.002mgL–1, which relates to the potential‘window’ in which the cleaning benchmark subsists, weretested. The results are presented in Figs 2 to 4 as line graphswith box and whisker plots indicating spread of data atindividual ATP concentrations. It should be noted that ATPlevels in these graphs are in mg L–1 and that end points of thecurves do not comply exactly with those shown in Fig. 1because different median values are in use. Proximity of theline graphs to the 100 RLU cleaning benchmark does not
indicate meter accuracy but is an artefact based on windowselection.
A test of association showed significant difference inmonitoring ability for median RLU generated by the threebrands at this level of resolution (P < 0.002).While the graphssuggested that each meter was capable of generating arelatively linear response based on median data from four tofive swabs for each ATP value, interquartile and total rangesfor RLU at specific concentrations of ATP was unacceptablylarge, in many cases overlapping the range of adjacentmeasurements.
While the preliminary validation described here essentiallyinvolved the capacity of the instrumentation to accurately
600
500
400
300
200
100
0
0.10Control
Concentration of ATP standard (µg L–1)
RLU
0.32 0.64 0.96 1.28 1.60
Fig. 2. Performance curve forBioluminometerA,proximate to the100RLUcleaning benchmark.
300
250
200
150
100
50
0
0.10Control
Concentration of ATP standard (µg L–1)
0.32 0.64 0.96 1.28 1.60
RLU
4
Fig. 3. Performance curve forBioluminometerB, proximate to the100RLUcleaning benchmark.
100
80
60
RLU
40
20
0
0.10 0.32 0.64Control
Concentration of ATP standard (µg L–1)
0.96 1.28 1.60
4
Fig. 4. Performance curve forBioluminometerC, proximate to the100RLUcleaning benchmark.
D Healthcare Infection G. S. Whiteley et al.
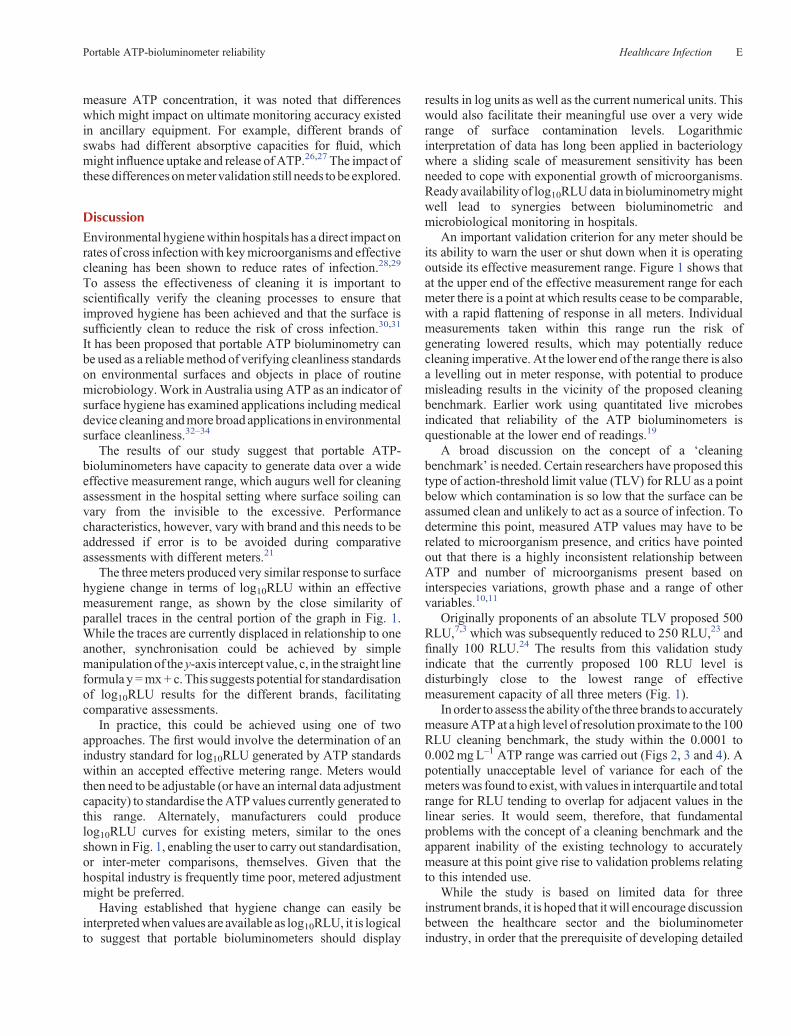
measure ATP concentration, it was noted that differenceswhich might impact on ultimate monitoring accuracy existedin ancillary equipment. For example, different brands ofswabs had different absorptive capacities for fluid, whichmight influence uptake and release of ATP.26,27 The impact ofthese differences onmeter validation still needs tobe explored.
DiscussionEnvironmental hygienewithin hospitals has a direct impact onrates of cross infectionwith keymicroorganisms and effectivecleaning has been shown to reduce rates of infection.28,29
To assess the effectiveness of cleaning it is important toscientifically verify the cleaning processes to ensure thatimproved hygiene has been achieved and that the surface issufficiently clean to reduce the risk of cross infection.30,31
It has been proposed that portable ATP bioluminometry canbe used as a reliablemethod of verifying cleanliness standardson environmental surfaces and objects in place of routinemicrobiology.Work in Australia using ATP as an indicator ofsurface hygiene has examined applications including medicaldevice cleaning andmore broad applications in environmentalsurface cleanliness.32–34
The results of our study suggest that portable ATP-bioluminometers have capacity to generate data over a wideeffective measurement range, which augurs well for cleaningassessment in the hospital setting where surface soiling canvary from the invisible to the excessive. Performancecharacteristics, however, vary with brand and this needs to beaddressed if error is to be avoided during comparativeassessments with different meters.21
The threemeters produced very similar response to surfacehygiene change in terms of log10RLU within an effectivemeasurement range, as shown by the close similarity ofparallel traces in the central portion of the graph in Fig. 1.While the traces are currently displaced in relationship to oneanother, synchronisation could be achieved by simplemanipulation of the y-axis intercept value, c, in the straight lineformula y =mx + c.This suggests potential for standardisationof log10RLU results for the different brands, facilitatingcomparative assessments.
In practice, this could be achieved using one of twoapproaches. The first would involve the determination of anindustry standard for log10RLU generated by ATP standardswithin an accepted effective metering range. Meters wouldthen need to be adjustable (or have an internal data adjustmentcapacity) to standardise theATP values currently generated tothis range. Alternately, manufacturers could producelog10RLU curves for existing meters, similar to the onesshown in Fig. 1, enabling the user to carry out standardisation,or inter-meter comparisons, themselves. Given that thehospital industry is frequently time poor, metered adjustmentmight be preferred.
Having established that hygiene change can easily beinterpretedwhenvalues are available as log10RLU, it is logicalto suggest that portable bioluminometers should display
results in log units as well as the current numerical units. Thiswould also facilitate their meaningful use over a very widerange of surface contamination levels. Logarithmicinterpretation of data has long been applied in bacteriologywhere a sliding scale of measurement sensitivity has beenneeded to cope with exponential growth of microorganisms.Ready availability of log10RLUdata in bioluminometrymightwell lead to synergies between bioluminometric andmicrobiological monitoring in hospitals.
An important validation criterion for any meter should beits ability to warn the user or shut down when it is operatingoutside its effective measurement range. Figure 1 shows thatat the upper end of the effective measurement range for eachmeter there is a point at which results cease to be comparable,with a rapid flattening of response in all meters. Individualmeasurements taken within this range run the risk ofgenerating lowered results, which may potentially reducecleaning imperative. At the lower end of the range there is alsoa levelling out in meter response, with potential to producemisleading results in the vicinity of the proposed cleaningbenchmark. Earlier work using quantitated live microbesindicated that reliability of the ATP bioluminometers isquestionable at the lower end of readings.19
A broad discussion on the concept of a ‘cleaningbenchmark’ is needed. Certain researchers have proposed thistype of action-threshold limit value (TLV) for RLU as a pointbelow which contamination is so low that the surface can beassumed clean and unlikely to act as a source of infection. Todetermine this point, measured ATP values may have to berelated to microorganism presence, and critics have pointedout that there is a highly inconsistent relationship betweenATP and number of microorganisms present based oninterspecies variations, growth phase and a range of othervariables.10,11
Originally proponents of an absolute TLV proposed 500RLU,7,3 which was subsequently reduced to 250 RLU,23 andfinally 100 RLU.24 The results from this validation studyindicate that the currently proposed 100 RLU level isdisturbingly close to the lowest range of effectivemeasurement capacity of all three meters (Fig. 1).
Inorder to assess the ability of the three brands to accuratelymeasureATP at a high level of resolution proximate to the 100RLU cleaning benchmark, the study within the 0.0001 to0.002mgL–1 ATP range was carried out (Figs 2, 3 and 4). Apotentially unacceptable level of variance for each of themeterswas found to exist, with values in interquartile and totalrange for RLU tending to overlap for adjacent values in thelinear series. It would seem, therefore, that fundamentalproblems with the concept of a cleaning benchmark and theapparent inability of the existing technology to accuratelymeasure at this point give rise to validation problems relatingto this intended use.
While the study is based on limited data for threeinstrument brands, it is hoped that it will encourage discussionbetween the healthcare sector and the bioluminometerindustry, in order that the prerequisite of developing detailed
Portable ATP-bioluminometer reliability Healthcare Infection E

validation criteria and manufacturer specifications can beattended to as precursory to investigative studies based onward monitoring. To achieve this, further research is requiredinto the extent and intended use of the instruments, theirmeasuring characteristics and capacity, the format and qualityof data required for integration into ward-focussedassessment, and the nature of the integrative risk monitoringframework to be informed in the future by hospitalbioluminometry.
Conflict of interestGregWhiteley is a PhDcandidate at theUniversity ofWesternSydney (UWS) and with Trevor Glasbey is an employee ofWhiteley Corporation. Chris Derry is principal lecturer andresearch supervisor in environmental epidemiology andtoxicology in theSchoolofScience andHealth,UWS.Noneofthe parties has any commercial association or can gain benefitfrom any bioluminometer manufacturer or supplier.
Funding sourcesConsumables were funded by the UWSPhD support programand by Whiteley Corporation. Devices were provided byUWS and Whiteley Corporation. No ATP meter brandprovided authorisation orfiscal support for the study and thereis no connection between Whiteley Corporation and anyagency or company which materials were used in this study.
References1. NationalHealth andMedical ResearchCouncil [NHMRC]. Australian
Guidelines for the Prevention and Control of Infection in Healthcare.Department of Health and Ageing, Canberra: Commonwealth ofAustralia; 2010.
2. Lipscomb IP, Sihota AK, Keevil CW. Comparison between visualanalysis andmicroscope assessment of surgical instrument cleanlinessfrom sterile service departments. J Hosp Infect 2008; 68: 52–8.doi:10.1016/j.jhin.2007.08.009
3. Malik RE, Cooper RA, Griffith CJ. Use of audit tools to evaluate theefficacy of cleaning systems in hospitals.AmJ Infect Control 2003; 31:181–7. doi:10.1067/mic.2003.34
4. Boyce JM, Havill NL, Mangione E, Dumigan DG, Moore BA.Comparisonoffluorescentmarker systemswith2quantitativemethodsof assessing terminal cleaning practices. Infect Control HospEpidemiol 2011; 32: 1187–93. doi:10.1086/662626
5. Carling PC, Parry MM, Rupp ME, Po JL, Dick B, Von Beheren S.Improving cleaning of the environment surrounding patients in36 acute care hospitals. Infect Control Hosp Epidemiol 2008; 29:1035–41. doi:10.1086/591940
6. Murphy CL,Macbeth DA, Derrington P, Gerrard J, Faloon J, KenwayK, et al. An assessment of high touch objects cleaning thoroughnessusing a fluorescent marker in two Australian hospitals. Healthc Infect2011; 16: 156–63. doi:10.1071/HI11024
7. Griffith CJ, Cooper RA, Gilmore J, Davies C, LewisM. An evaluationof hospital cleaning regimes and standards. J Hosp Infect 2000; 45:19–28. doi:10.1053/jhin.1999.0717
8. Boyce JM, Havill NL, Dumigan DG, Golebiewski M, Balogun O,Rizvani R. Monitoring the effectiveness of hospital cleaningpractices by use of an adenosine triphosphate bioluminescenceassay. Infect Control Hosp Epidemiol 2009; 30: 678–84.doi:10.1086/598243
9. Griffith CJ, Obee P, Cooper RA, Burton NF, Lewis M. Theeffectiveness of existing and modified cleaning regimens in a WelshHospital. J Hosp Infect 2007; 66: 352–9. doi:10.1016/j.jhin.2007.05.016
10. Malik DJ, Sharma G. Estimating bacterial surface contaminationby means of ATP determinations: 20 pence short of a pound. J HospInfect 2012; 80: 354–5. doi:10.1016/j.jhin.2011.12.021
11. Shama G, Malik DJ. The uses and abuses of rapid bioluminescence-based ATP assays. Int J Hyg Environ Health, in press. doi:10.1016/j.ijheh.2012.03.009
12. Cooper RA, Griffith CJ, Malik RE, Obee P, Looker N. Monitoringthe effectiveness of cleaning in four British hospitals. Am J InfectControl 2007; 35: 338–41. doi:10.1016/j.ajic.2006.07.015
13. Griffith CJ. Choosing a luminometer. International Food Hyg 2008;19: 23–5.
14. García LA, Díaz M. Cleaning in Place, in ComprehensiveBiotechnology, 2011. 2nd edn., vol. 2 (Eds Moo-YoungM, Butler M,Webb C, et al.), New York. Pergamon.
15. Hawronskyj J-M, Holah J. ATP: a universal hygiene monitor. TrendsFood Sci Technol 1997; 8: 79–84. doi:10.1016/S0924-2244(97)01009-1
16. Jasson V, Jacxsens L, Luning P, Rajkovic A, Uyttendaele M.Alternative microbial methods: an overview and selection criteria.Food Microbiol 2010; 27: 710–30. doi:10.1016/j.fm.2010.04.008
17. SherlockO,O’Connell N, Creamer E,HumphreysH. Is it really clean?An evaluation of the efficacy of four methods for determining hospitalcleanliness. J Hosp Infect 2009; 72: 140–6. doi:10.1016/j.jhin.2009.02.013
18. Dancer SJ. How do we assess hospital cleaning? A proposal formicrobiological standards for surface hygiene in hospitals. J HospInfect 2004; 56: 10–5. doi:10.1016/j.jhin.2003.09.017
19. Aiken ZA, Wilson M, Pratten J. Evaluation of ATP bioluminescenceassays for potential use in a hospital setting. Infect Control HospEpidemiol 2011; 32: 507–9. doi:10.1086/659761
20. Roda A, ed. Chemiluminescence and Bioluminescence: Past, Presentand Future. 1st edn. London: RSC Publishing; 2010.
21. AndersenBM,RaschM,Kvist J,TollefsenT,LukkassenR,SandvikL,et al. Floor cleaning: effect on bacteria and organic materials inhospital rooms. J Hosp Infect 2009; 71: 57–65. doi:10.1016/j.jhin.2008.09.014
22. Hong Y, Brown DG. Variation in bacterial ATP level and protonmotive force due to adhesion to a solid surface.AppEnvironMicrobiol2009; 75: 2346–2353. doi:10.1128/AEM.02671-08
23. Lewis T, Griffith CJ, Gallo M, Weinbren M. A modified ATPbenchmark for evaluating the cleaning of some hospital environmentalsurfaces. J Hosp Infect 2008; 69: 156–63. doi:10.1016/j.jhin.2008.03.013
24. Mulvey D, Redding P, Robertson C, Woodall C, Kingsmore P,Bedwell D, et al. Finding a benchmark for monitoring hospitalcleanliness. J Hosp Infect 2011; 77: 25–30. doi:10.1016/j.jhin.2010.08.006
25. Spiegel MR. Statistics. 2nd edn. New York: McGraw-Hill; 2011.26. Hedin G, Rynbäck J, Loré B. New technique to take samples from
environmental surfaces usingflockednylon swabs. JHosp Infect2010;75: 314–7. doi:10.1016/j.jhin.2010.02.027
27. Kim C, Hsieh Y-L. Wetting and absorbency of nonionic surfactantsolutions on cotton fabrics. Colloids Surf A Physicochem Eng Asp2001; 187–188: 385–97. doi:10.1016/S0927-7757(01)00653-7
28. Dancer SJ. Importance of the environment in meticillin-resistantStaphylococcus aureus acquisition: the case for hospital cleaning.Lancet Infect Dis 2008; 8: 101–13. doi:10.1016/S1473-3099(07)70241-4
F Healthcare Infection G. S. Whiteley et al.

29. Dancer SJ,White LF, Lamb J,GirvanEK,RobertsonC.Measuring theeffect of enhanced cleaning in a UK hospital: a prospective cross-overstudy. BMC Med 2009; 7: 28. doi:10.1186/1741-7015-7-28
30. Whiteley GS, Derry C. The importance of practical zero in cleaningperformance indicators. In: Abstracts of the 14th Congress of theInternational Federationof InfectionControl; 2011Oct12–15;Venice;Craigavon, Northern Ireland: IFIC; 2011.
31. Anderson RE, Young V, Stewart M, Robertson C, Dancer SJ.Cleanliness audit of clinical surfaces and equipment:who cleanswhat?J Hosp Infect 2011; 78: 178–81. doi:10.1016/j.jhin.2011.01.030
32. Heathcote R, Stadelmann B. Measuring of ATP bioluminescence asa means of assessing washer disinfector performance and potentiallyas a means of validating the decontamination process. Healthc Infect2009; 14: 147–51. doi:10.1071/HI09019
33. Gillespie EE, Scott C, Wilson J, Stuart R. Pilot study to measurecleaning effectiveness in health care. Am J Infect Control 2012; 40:477–8. doi:10.1016/j.ajic.2011.06.010
34. Wilson F, Wells A. Evaluating environmental cleanliness in hospitalandother healthcare settings.Healthc Infect2012; 17: 70. doi:10.1071/HI12016
Portable ATP-bioluminometer reliability Healthcare Infection G
www.publish.csiro.au/journals/hi

87
Chapter 6
Reliability testing for portable Adenosine
Triphosphate bioluminometers

infection control and hospital epidemiology may 2013, vol. 34, no. 5
Wednesday Mar 20 2013 04:25 PM/ICHE33384/2013/34/5/sgardiner/pmilne/pmilne/mnh2/corrected proof to production/1006/use-graphics/narrow/default/
r e s e a r c h b r i e f
Reliability Testing for Portable AdenosineTriphosphate Bioluminometers
Measurement of adenosine triphosphate (ATP) using portablebioluminometers has been adapted from the food manufac-turing sector, and it has been suggested that it could be usedas an indicator of surface soiling or cleanliness in hospitalsettings.1 Some healthcare authorities are considering the useof portable ATP bioluminometers as a tool for standard set-ting for surface cleanliness to improve cleaning standards.2
Central to this approach is the use of a commonly acceptedlevel of detected ATP—expressed as relative light units(RLUs)—that may be used as a surrogate for underlying soil-ing, including the presence of pathogenic microorganisms.3
It has been demonstrated that improvements can be madeto cleaning processes with fluorescent markers through a sim-pler approach that provides a qualitative efficiency measure-ment of the cleaning process.4 Measurement of surface hy-giene using ATP bioluminometers is thought to provide amore quantitative surrogate of surface cleanliness.5
A proposed ATP/RLU standard for acceptable cleanlinesshas been revised from 500 RLUs, originally suggested by Grif-fith et al,1 to 250 RLUs by Lewis et al6 and most recently to100 RLUs by Mulvey et al.7 However, a close examination ofthe references reveals that different brands of ATP biolumi-nometers were used to establish the data in each reference—a substantial problem given that each unit reads on a differentrelative scale.8 Even with a single branded unit variable resultsare observed without a clear explanation.9 There also is debateover the validity of using ATP measurement as an analoguefor surface soils and the presence of pathogenic microorgan-isms.10
Our aim was to validate the reliability of measurement of3 commonly available brands of portable ATP bioluminome-ters. Two of the brands selected (Hygiena and 3M) featureprominently in the published literature, and the third brand(Kikkoman) provided a different approach to luciferase pre-sentation (a powder rather than a preprepared liquid).
Our method was selected to minimize confounding vari-ables, such as brand-to-brand differences in RLU scaling,swab absorption, cell lysis mechanism and efficiency, liber-ation of cellular ATP, and variations in cellular ATP duringbacterial cycles. To achieve this, the method used an ATPsource of known purity (Sigma-Aldrich). The ATP was dilutedacross multiple dilution series, which enabled testing of the3 devices across the full dynamic range of detection for eachdevice, from the lower limit of detection to response tapering.We included multiple 10-fold dilution series as well as mul-tiple narrower-range dilution series. A calibrated micropipette(Thermo Scientific) was used to apply the diluted ATP directly
onto the swabs for each of the portable ATP bioluminometers,following an earlier method.11
At each dilution point, each brand was tested in triplicateor more frequently. The swabs for each brand were from mul-tiple batches, stored in accordance with the manufacturers’recommendations, and used within the use-by dates. High-performance liquid chromatography (HPLC; Shimadzu) wasused to validate accuracy, precision, specificity, and linearityand as a quantitative control for ATP.
Materials used in our experiments included 667 ATP swabsin 153 separately measured dilution series (3M: 246 swabs in57 runs; Kikkoman: 222 swabs in 49 runs; Hygiena: 199 swabsin 47 runs). HPLC data were generated over 22 runs against72 dilutions. ATP concentrations ranged from 10�5 mg/L to1,000 mg/L.
Similar to many other studies, our results indicated con-siderable variability; data are shown in Figure 1. The raw datawere subjected to test of association, which found no signif-icant difference. The nonstandardized RLU scaling, which wasdifferent for each brand, required a single common calcu-lation for comparison. The coefficient of variance was de-termined to be the best method of expression of the variabilityin RLU readings. The experimental method of multiple runs(153 test runs plotted in Figure 1) over the full dynamic rangeof detection did not allow for an overall standard deviationor mean to be determined for each device. HPLC demon-strated a lack of variability with excellent precision and re-peatability of ATP analysis, provided that the limits of de-tection were observed.
The variability of the coefficient of variance shown in theATP data for the 3 brands strongly suggests that these ana-lytical systems were rarely able to produce a reliable responseno matter the dilution or quantity of ATP. These findingshave implications for interpretation of data obtained using aportable ATP bioluminometer when monitoring surface hy-giene as part of infection control practice. Use of these devicesin the food sector is based on a validation pathway quitedistinct from the way in which usage has been trialed in thehealthcare setting.1,3
Portable ATP bioluminometer units are reliable for distin-guishing between very different levels of ATP where the con-centration is varied by at least an order of magnitude, thusreducing the relative impact of the variance.8 The usefulnessof these units in healthcare settings is not ruled out by ourfindings provided that usage allows for wide disparity in nar-rowly focused measurements of similarly clean or soiled sur-faces. We caution against use of a finite measure of cleanlinessbased on RLUs until standard measures are improved andthe units are able to read reliably on a common RLU scale,with a clear association with quantitated ATP levels.
This content downloaded from 137.154.16.32 on Mon, 27 Jan 2014 20:27:04 PMAll use subject to JSTOR Terms and Conditions

2 infection control and hospital epidemiology may 2013, vol. 34, no. 5
Wednesday Mar 20 2013 04:25 PM/ICHE33384/2013/34/5/sgardiner/pmilne/pmilne/mnh2/corrected proof to production/1006/use-graphics/narrow/default/
figure 1. Coefficient of variance (CoV) for 3 portable adenosine triphosphate bioluminometers. n values indicate the number of separatedilutions tested per brand. HPLC, high-performance liquid chromatography.
acknowledgments
We thank Paul Fahey (School of Mathematics and Statistics, University ofWestern Sydney) for his advice on methods of analysis and statistical revisionof this report.
Financial support. None of the authors have any financial connectionwith any of the ATP device manufacturers or their consumables. All con-sumables and devices were purchased and included as part of PhD fundingthrough the University of Western Sydney and Whiteley Corporation.
Potential conflicts of interest. All authors report no conflicts of interestrelevant to this article. All authors submitted the ICMJE Form for Disclosureof Potential Conflicts of Interest, and the conflicts that the editors considerrelevant to this article are disclosed here.
Greg S. Whiteley, MSafetySc;1,2 Chris Derry, MSc(Med);1
Trevor Glasbey, PhD2
Affiliations: 1. University of Western Sydney, Hawkesbury Campus, Rich-mond, New South Wales, Australia; 2. Whiteley Corporation Pty Ltd, NorthSydney, New South Wales, Australia.
Address correspondence to Greg S. Whiteley, MSafetySc, Whiteley Cor-poration Pty Ltd, PO Box 1076, North Sydney, New South Wales 2059,Australia ([email protected]).
Received September 18, 2012; accepted December 11, 2012; electronicallypublished March XX, 2013.Infect Control Hosp Epidemiol 2013;34(5):000-000� 2013 by The Society for Healthcare Epidemiology of America. All rightsreserved. 0899-823X/2013/3405-00XX$15.00. DOI: 10.1086/670208
references
1. Griffith CJ, Cooper RA, Gilmore J, Davies C, Lewis M. Anevaluation of hospital cleaning regimes and standards. J HospInfect 2000;45:19–28.
2. Wilson F, Wells A. Evaluating environmental cleanliness in hos-pital and other healthcare settings. Healthc Infect 2012;17:70.
3. Boyce JM, Havill NL, Dumigan DG, Golebiewski M, BalogunO, Rizvani R. Monitoring the effectiveness of hospital cleaningpractices by use of an adenosine triphosphate bioluminescenceassay. Infect Control Hosp Epidemiol 2009;30:678–684.
4. Carling PC, Parry MM, Rupp ME, Po JL, Dick B, Von BeherenS; Healthcare Environmental Hygiene Study Group. Improvingthe environment surrounding patients in 36 acute care hospitals.Infect Control Hosp Epidemiol 2008;29:1035–1041.
5. Boyce JM, Havill NL, Havill HL, Mangione E, Dumigan DG,Moore BA. Comparison of fluorescent marker systems with 2quantitative methods of assessing terminal cleaning practices.Infect Control Hosp Epidemiol 2011;32:1187–1193.
6. Lewis T, Griffith CJ, Gallo M, Weinbren M. A modified ATPbenchmark for evaluating the cleaning of some hospital envi-ronmental surfaces. J Hosp Infect 2008;69:156–163.
7. Mulvey D, Redding P, Robertson C, et al. Finding a benchmarkfor monitoring hospital cleanliness. J Hosp Infect 2011;77:25–30.
8. Whiteley GS, Derry C, Glasbey T. The comparative performanceof three brands of portable ATP-bioluminometer intended foruse in hospital infection control. Healthc Infect 2012;17:91–97.
9. Aiken ZA, Wilson M, Pratten J. Evaluation of ATP biolumi-nescence assays for potential use in a hospital setting. InfectControl Hosp Epidemiol 2011:32;507–509.
10. Shama G, Malik DJ. The uses and abuses of rapid biolumines-cence-based ATP assays. Int J Hyg Environ Health 2013;216:115–125.
11. Carrick K, Barney M, Navarro A, Ryder D. The comparison offour bioluminometers and their swab kits for instant hygienemonitoring and detection of microorganisms in the brewery.J Inst Brew 2001;107:31–37.
This content downloaded from 137.154.16.32 on Mon, 27 Jan 2014 20:27:04 PMAll use subject to JSTOR Terms and Conditions

n = number of separate
dilutions tested per brand

91
Chapter 7
Failure analysis in the identification of synergies
between cleaning monitoring methods

lable at ScienceDirect
American Journal of Infection Control 43 (2015) 147-53
Contents lists avai
American Journal of Infection Control
journal homepage: www.aj ic journal .org
American Journal of Infection Control
Major article
Failure analysis in the identification of synergies between cleaningmonitoring methods
Greg S. Whiteley MSafetySci a,b,*, Chris Derry MSc(Med) a, Trevor Glasbey PhD b
aUniversity of Western Sydney, Richmond, New South Wales, AustraliabWhiteley Corporation, North Sydney, New South Wales, Australia
Key Words:FMEAATPFMVisual inspectionMicrobial recovery
* Address correspondence to Greg S. Whiteley, MSSydney, NSW, Australia 2059.
E-mail address: [email protected] (G.S. WhiConflicts of interest: None to report.
0196-6553/$36.00 - Copyright � 2015 by the Associahttp://dx.doi.org/10.1016/j.ajic.2014.10.026
Background: The 4 monitoring methods used to manage the quality assurance of cleaning outcomeswithin health care settings are visual inspection, microbial recovery, fluorescent marker assessment, andrapid ATP bioluminometry. These methods each generate different types of information, presenting achallenge to the successful integration of monitoring results. A systematic approach to safety and qualitycontrol can be used to interrogate the known qualities of cleaning monitoring methods and provide aprospective management tool for infection control professionals. We investigated the use of failure modeand effects analysis (FMEA) for measuring failure risk arising through each cleaning monitoring method.Methods: FMEA uses existing data in a structured risk assessment tool that identifies weaknesses inproducts or processes. Our FMEA approach used the literature and a small experienced team to constructa series of analyses to investigate the cleaning monitoring methods in a way that minimized identifiedfailure risks.Results: FMEA applied to each of the cleaning monitoring methods revealed failure modes for each. Thecombined use of cleaning monitoring methods in sequence is preferable to their use in isolation.Conclusions: When these 4 cleaning monitoring methods are used in combination in a logical sequence,the failure modes noted for any 1 can be complemented by the strengths of the alternatives, therebycircumventing the risk of failure of any individual cleaning monitoring method.
Copyright � 2015 by the Association for Professionals in Infection Control and Epidemiology, Inc.Published by Elsevier Inc. All rights reserved.
Cleaning in health care settings is a manageable activity that canbe audited for consistency and quality.1 The processes of cleaningenvironment surfaces within hospitals can be monitored by 4distinct methods: visual inspection, microbial recovery, rapid ATPbioluminometry detection, and use of fluorescent marker (FM)technologies.2 Each of these monitoring methods generates adistinct type of information that is difficult to integrate into a singlemonitoring result.3,4
Although cleaning has the goal of removing soils and pathogens,the monitoring methods used for management and supervision ofcleaning have a distinct quality assurance role.5 The goal of anymonitoring method is to provide feedback on cleaning failure toassist in the management and improvement of environmentcleaning within health care settings.6-9
The sampling approach taken for the monitoring of environ-ment surfaces within health care settings is a constant problem.10,11
afetySci, PO Box 1076, North
teley).
tion for Professionals in Infection C
The apparently random distribution of soils, including dry surfacebiofilms and pathogens, presents a challenge for any sampling planinvestigating the nature of environment contamination, and iscomplicated by the presence high-touch objects.12-14 Health careenvironment cleaning protocols are management tools that set outthe practical steps to achieving the goal of removing soils andimproving the quality of environment surface hygiene.15,16
Health care cleaning processes are designed on a risk-basedformat with the highest risk areas requiring the most frequent orhighest-intensity cleaning.17 The secondary process of cleaningmonitoring is intended to ensure that soil removal goals are metwith optimal efficiency and efficacy.18
If the cleaning monitoring method is flawed due to uncontrolledorunrecognized failure, then thedataoncleaningoutcomeswill alsobeflawedandunreliable. This compromises themanagementgoal ofensuring that the primary process of cleaning has been achieved.
We focused on the failure of cleaning monitoring methods andnot on the actual processes of cleaning. Failure mode and effectsanalysis (FMEA) is a reliable safety and quality management risk-assessment tool that identifies potential failure conditions or er-rors that may cause failure for products or processes.19 The FMEA
ontrol and Epidemiology, Inc. Published by Elsevier Inc. All rights reserved.

Table 1Ordinal conversion table for assigning values to identified failure risk cofactors
Failure risk cofactor and criteria Descriptor Value
FrequencyThe failure mode is unlikely to occur, or cannot
occur, during normal monitoring operationsLow risk 1
The failure mode is fairly likely to occur duringnormal monitoring operations
Medium risk 2
The failure mode is highly lightly to occur, oralways occurs, during normal monitoringoperations
High risk 3
SeverityOccurrence of the failure mode will have minimal
or no effect on the monitoring results, or onthe associated cleaning outcome
Low risk 1
Occurrence of the failure mode will have someeffect on the monitoring results, or on theassociated cleaning outcome
Medium risk 2
Occurrence of the failure mode will haveconsiderable or extreme effect on themonitoring results, or on the associatedcleaning outcome
High risk 3
DetectabilityOccurrence of the failure mode is easy to detect.
Feedback is likely to inform immediatemonitoring-failure mitigation
Low risk 1
Occurrence of the failure has a possibility of beingdetected. Feedback may inform earlymonitoring-failure mitigation
Medium risk 2
Occurrence of the failure mode is difficult orimpossible to detect. Feedback is unlikely toinform monitoring-failure mitigation
High risk 3
G.S. Whiteley et al. / American Journal of Infection Control 43 (2015) 147-53148
applied here investigated if current cleaning monitoring methodscould be optimized to reduce cleaning failures as a type of medicalerror.20,21
Within this management context, FMEA as a risk tool can addvalue by systematically examining failures to mitigate or minimizetheir influence on the cleaning process being undertaken.22 Anultimate aim is the identification of failure modes within cleaningmonitoring systems as a quality improvement process in healthservice provision.23
FMEA is typically conducted on products or processes, throughthe application of existing information on identified failures orfailure modes to anticipate failure events. A failure mode is definedas a “loss of intended function” under normal operating conditions.FMEA was selected as a suitable method for prospective riskassessment of the 4monitoringmethods due to its applicability as aforecast model and as a risk-assessment tool that is frequently usedin the context of medical devices.24
A risk-assessment team of 3 individuals with collective skills inFMEA and cleaning monitoring using each of the 4 methods wasformed, with the following aims:
� To identify a modified approach for the application of FMEA infailure analysis relating to the 4 commonly used cleaningmonitoring methods,
� To test the feasibility of the approach by carrying out a pre-liminary assessment of the 4 monitoring methods using themodified FMEA approach and to identify areas of commonalityand work toward a monitoring model that could include the 4methods in an integrated monitoring approach, and
� To identify strategies for the development of potential syn-ergies during an integrated application of the 4 cleaningmonitoring methods.
For each of the identified failure modes, literature support wasrequired as part of the process of identification and consideration ofmitigation for each major failure mode.
METHODS
The initial step in the FMEA process was for the FMEA teammembers to identify all possible causes of failure (loss of intendedfunction) for each of the 4 cleaning monitoring methods.24 Eachidentified failure mode was substantiated by relevant material inthe literature. Where similar, multiple, or overlapping causes offailure were identified, these were gathered under a commonfailure mode. A comprehensive list of failure modes was noted foreach cleaning monitoring method.
The risk associated with each of the failure modes was thenassessed individually by each of the FMEA team members. Each ofthe failure modes was graded against 3 distinct categories withassociated risk criteria. These categories were first graded for thelikely frequency of occurrence of that failure mode during normaluse, second for the severity of the effect of this failure mode on thevalidity of the information produced, and finally the assessmentwas also graded for whether the failure mode had any detectabilityin the normal course of its use. The grading system applied for thisstudy is shown in Table 1. It uses a 3-tiered scoring approach similarto the 3-tiered risk criteria that are used in Australian InfectionPrevention.23 In the FMEAmethod used in our study, each categorywas assigned a score of 1-3 (low to high).
After the grading of each failure mode against each of the 3categories (frequency, severity, and detectability), the grades foreach failure mode were multiplied to produce a single score knownas the risk priority number (RPN). The RPN is an overall indicator asto whether the failure mode requires further consideration or
mitigation to minimize the identified failure risks. Whereas someauthors have suggested use of weighting to accentuate criticalfailures, for the purposes of simplicity no weighting of the RPN wasused in our study.25 Using the 3-point grading system outlined inTable 1, there are only 10 possible RPN scores, with a minimumscore of 1, a median of 7, and a maximum score of 27. The RPN foreach failure mode was noted and ranked from high risk to low riskof the nominated failure occurrence.
Following the establishment of each RPN a structured dialoguewas conducted to arrive at a common view on the RPN score using amodified Delphi approach.26 The FMEA team members thenreconfirmed each identified failure mode through the publishedliterature andwhere no published evidence in support of the failuremode was available then that failure mode was discarded.
The RPN scores were finally ranked and divided into 3 classesbased on a low, medium or high risk classification.23 For ease ofinterpretation, the failure modes with RPN scores less than themedian of 7 were accepted as low risk. Scores >7 and <13 were setas medium risk. Scores >13 were accepted as high risk.
The combined FMEA results were then considered to investigatewhether combinations of the cleaning monitoring methods wouldprovide mitigation of the effects of failure modes. This allowed forthe FMEA team members to identify any novel approaches thatcould provide an enhanced approach to cleaning monitoring. Thisstep allows for mitigation to be used as a form of redundancywhereby a reduction of the overall risks arising from cleaningfailure is practically achieved by reducing the risks of failure of thecleaningmonitoringmethods. Thus the risk assessment approach isused as predictive tool to improve practice in advance of failure.This will lead to further research opportunities.
RESULTS
For the 4 cleaning monitoring methods 32 failure modes wereidentified and risk-assessed. Table 2 shows the 15 failure modes

G.S. Whiteley et al. / American Journal of Infection Control 43 (2015) 147-53 149
ultimately found to be associated with the highest RPNs andassociated failure risk.
The consideration of mitigation identified a novel combinationof the 4 cleaning monitoring methods. This was particularly crucialfor the high and medium risk failure modes. The new model forcleaning monitoring is outlined in Figure 1.
Costs were considered on a desktop basis for the purposes ofcost consideration on both individual basis and as a combination ofall 4 methods.
The high and medium risk failure modes identified using FMEAfor each of the cleaning monitoring methods is noted below foreach of the cleaning monitoring methods.
Visual inspection
The highest RPN was for visual inspection. Although a surfacemay look clean, human vision cannot detect microscopic-levelcontamination.11 This method is the current standard approach fornormal cleaningmonitoring within Australian and American healthcare settings.27,28
Similarly, visual inspection cannot detect nonpathogenic soilsthat can be left in situ due to a flawed cleaning method, or a lack ofcleaning.6,7,12
Visual triggers for cleanliness have a major behavioral effect andcannot be discounted as important.29 The usefulness of visual in-spection is that it is the only cleaning monitoring method that as-sesses the visual appearance of the hospital, which is also seen bypatients, their families, and the other noncleaning staff members.Visual inspection is the only cleaning monitoring method thatmatches the appreciation of hospital cleanliness with all of thestakeholders and that provides a representative outcome of thehospital aesthetics. It is also noted that visual inspection carriesonly an existing cost overhead in terms of staff time used.
Mitigations noted for visual inspection included each of theother cleaning monitoring methods.
Microbial recovery (environmental Swabs)
A high RPN and high risk classification was also associated withthe delay between microbial sampling and reading results, whichfrequently takes longer than 48 hours.27,28 This delay renderscleaning monitoring results to low relevance because the patient,the cleaning processes, and the environment may have changedseveral times in the interim.10
Medium and high risk was associated with technical swabbingissues and poor sampling planning.11 Sampling planning is parti-cularly vulnerable to statistical error in terms of representativesampling due to the low level of sampling and the high surface areafor potential contamination, even with high-touch objects or sur-faces. Using a validated sampling and recoverymethod canmitigatemany of these failures. Sampling plans should also take into ac-count the risks of pathogenic viruses where appropriate becausebacterial recovery methods will not work.30 The presence ofbiofilm-mediated pathogens presents yet another challenge thatwas assessed as a medium risk failure mode.13 Interference due todisinfecting solutions use can also be overcome through the use ofvalidated protocols with appropriate robustness.10
As noted in Table 2, the use of the other cleaning monitoringmethods (ATP bioluminometry and FM) can mitigate the timefailuremode and assist in targeting the environmental surfaces thatrequire samples collection for microbial recovery.
Rapid ATP detection
Since use of rapid ATP testing was first suggested, many tech-nical problems have been described with regard to its use within
health care settings.6,31-33 The failure modes identified from ourFMEA, which are categorized as medium risk, are noted in Table 2.
The 3 highest RPN and medium risk scores came from unrep-resentatively low ATP readings due to a failure of ATP detection.32
The correlation between high ATP bioluminometry readings andmicrobes has been established, but there does not appear to be anyATP level (in relative light units) that correlates with nosocomialpathogens at low levels, nor with viruses present on surfaces.34-37
The lack of correlation with specific pathogens is not recognizedas a failure insofar as the setting of an appropriate alert level notingthat none of the brands of ATP bioluminometers claim direct cor-relation with known pathogenic microbes, particularly at lowconcentrations on surfaces.8,36,37
Difficulties interpreting the results of ATP are a medium riskfailure mode that underscores the importance of validation andtraining.16,31,33
Mitigations noted against ATP testing are the adjunct use ofmicrobial recovery methods and FM to indicate the frequency ofcleaning on relevant environment surfaces, a validated samplingplan, and appropriate levels of training in the use an interpretationof ATP readings.32
FM technologies
The data for FM technologies are impressive with excellentcorrelationwith cleaning outcomes.38 Failuremodes noted for wereonly for unintended or detectable visibility (and preferentialremoval of FM marker) and for the lack of quantitative informationprovided through the removal of an FMmarker. FM technologies inthemselves only measure whether a surface has been attempted tobe cleaned, and do not provide an indication of the quantitativehygienic status of a surface. If the FM spot is removed then the datagenerated are nominal (pass or fail) and are therefore qualitative,although the authors note the highly impressive value of the dataand the evidence in favor of this cleaning monitoring method.4,8,39
In Table 2, the 2 medium risk failure modes can both be miti-gated through the use of alternative cleaning monitoring methods.The visibility of the FM spots is a noted problem, and the additionalproblem of well-prepared cleaning staff (with their own fluores-cent lights to identify the location FM spots) can be mitigatedthrough the sequential or parallel use of rapid ATP detection.40
Mitigation
The FMEA assessors considered the failure modes in combina-tion with all 4 cleaning monitoring methods. The failure modesidentified for visual inspection were given the classification of highand medium risk, but in each case the use of an alternative rapidmethod such as ATP bioluminometry could mitigate the risk rating.For microbial recovery, the use of a rapid method of testing, againsuch as ATP, could work well to mitigate the delay issues, given thatcorrelation has been established with at least high levels of mi-crobial contamination. The classification of medium risk for failuremodes of ATP testing can in each case be mitigated through theconcurrent use of FM or microbial recovery (during any outbreak ofdisease). The lack of quantitative information as a failure mode forFM can be mitigated easily through adjunct use of ATP.
Figure 1 outlines a new theoretical approach that attempts toovercome the identified failure modes of the cleaning monitoringmethods by using the strengths of 1 method to cover the weak-nesses of another method. Figure 1 demonstrates the potentialsynergy provided by using the cleaning monitoring methodsconcurrently and in sequence, rather than in isolation or in a par-allel trial. When considered together as a bundle of solutions forcleaningmonitoring, the 4methodswork best in combination, with

Table 2Fifteen failure modes ultimately found to be associated with the highest risk priority numbers (RPN) and associated failure risk
Cleaning Monitoringmethod Failure mode Frequency* Severity* Detectability* RPNy
Riskclassificationz Mitigation suggestions
Visual Inspection Surface looks clean but is contaminated with pathogenicmicrobes11
3 3 3 27 High Testing of surfaces with a quantitative method fordetermining surface hygienemay indicate contamination(eg, ATP testing)
Surface looks clean but is contaminated with non-visiblesoils6
3 2 3 18 High Testing of surfaces with a quantitative method fordetermining surface hygienemay indicate contamination(eg, ATP testing)
Surface looks clean but has not been subject to routinecleaning processes12
2 2 3 12 Medium Use of an FM technology will indicate surface cleaningfrequency rate. ATP testing alone will not be sufficient toindicate cleaning frequency
Microbial recovery Result from sampling is delayed by 48 h or more27 3 3 2 18 High Testing of surfaces with a rapidmethod (eg, ATP testing) canrapidly inform the sampling processes by indicating anyloci of contamination
Pathogenic bacteria are not detected on swab but arepresent on high-touch obejects10
2 2 3 12 Medium Validation of sampling methods with examination ofdifferent methods results can improve microbialrecovery
Viruses (pathogenic) are not detected by samplingmethods30
2 3 2 12 Medium Selection of a virus-sensitive sampling and recoverymethodis required where cross-infection with viruses is a knownrisk factor
Pathogenic bacteria are not detected due to poorenvironmental sampling plan or methodology11
2 2 2 8 Medium Validation of sampling methods with examination of theeffect of different methods can improve microbialrecovery. Adjunct use of rapid ATP detection can assist inidentification of possibly contaminated environmentallocations
Pathogenic bacteria are present in biofilms that are notrecovered in normal sampling13
2 2 2 8 Medium Swabbing techniques should utilize different approaches todislodge resident organisms. Subsequent recoverytechniques may be required for cultures to adjust forslower recovery dynamics
ATP bioluminometry Failure to detect the ATP present on contaminated surfaces(possible lysis failure by ATP consumables-reagent)32
2 2 3 12 Medium Microbial recovery can be used for confirmatory qualitycontrol where FM indicates inadequate cleaning but lowATP readings do not reflect inadequate cleaning. Avalidated sampling plan will ensure testing isrepresentative
ATP swab fails to pick up sufficient bacteria to indicatesurface contamination (falsely low ATP reading)32
2 2 3 12 Medium Microbial recovery can be used for confirmatory qualitycontrol where FM indicates inadequate cleaning but ATPreadings are in the low range and biofilm is suspected
Failure to detect viruses due to absence of ATP32 3 2 2 12 Medium Use of an FM technology is low cost andwill indicate surfacecleaning frequency in addition to use of rapid ATPdetection. A suitable microbial recovery method for virusdetection could also be used
Similar before-and-after ATP readings that do not indicatethat cleaning has or has not occured31
2 2 2 8 Medium Rapid ATP detection requires a carefully consideredsampling plan to ensure that multiple readings are takenfor proper interpretation of the results. Adjunct use of FMwill indicate if cleaning has occurred
Incorrect interpretation of the ATP readings from thehospital surfaces33
2 2 2 8 Medium ATP readings are subject to both variability and samplingerror. Careful validation of the sampling plan and use ofATP will reduce both types of error. Adjunct use of FMwill indicate cleaning. Training in reading ATP results isessential
G.S.W
hiteleyet
al./American
Journalof
InfectionControl
43(2015)
147-53150

FMtech
nolog
ies
FMsp
otsarevisibleto
clea
ningstaffan
darepreferentially
remov
ed40
23
212
Med
ium
Testingof
surfaces
prior
touse
ofFM
will
indicatesu
rface
suitab
ility
foruse
ofFM
FMassessmen
tdoe
snot
indicateaqu
antitative
leve
lof
clea
nlin
esshas
been
achieve
dby
theclea
ningprocess,
even
when
theclea
ningprocess
isco
nducted
asintended
8
32
212
Med
ium
Validationof
theclea
ningprocesses
shou
ldbe
conducted
toascertainthequ
antitative
contribution
oftheclea
ning
method
totheprimarypurposeof
soilremov
alas
aprimaryaim.A
TPmea
suremen
twill
providean
adjunct
mea
suremen
tof
surfaceclea
nlin
essthat
issemiquan
titative
FM,fl
uorescentmarke
r.*1
¼low,2
¼med
ium,a
nd3¼
high.
y RPN
¼Freq
uen
cy�
seve
rity
�detectability.
z High¼
RPN
15,m
edium
¼RPN
>8<
15,a
ndlow
¼RPN
<7.
G.S. Whiteley et al. / American Journal of Infection Control 43 (2015) 147-53 151
system redundancy built in to the process of monitoring throughcarefully considered and adjunct use of each of the availablemethods.
The costs attached to cleaning monitoring method are a sub-stantial concern, but these do vary by geographic region, com-mercial availability, and local practices. The individual costcomponents on any 1 cleaning monitoring method are outside ofthe range of this study and will require further investigation andquantitation. The opportunity for cost-efficiency in the mixedmonitoring approach outlined in Figure 1 should be furtherinvestigated to find the balance between cost and efficiency in thesupervision of cleaning services.
In an integrated study using the 4 monitoring systems in par-allel, costs could be managed in a very different manner to suit thelocation of the monitoring and the specific infection controlcircumstance.
DISCUSSION
The worst of all failure modes observed from the 4 cleaningmonitoring methods was for visual inspection.6 The use of micro-bial recovery through environmental sampling has a major failuremode due to the delay in receiving results.10 Clearly FM is a simpletool that provides excellent quality data on the frequency of non-cleaning; that is, the qualitative question of how often the cleaningis not conducted as intended.38 There is also a need for a moni-toring process that has the role of quantitation of cleaning perfor-mance in terms of surface cleanliness, and rapid ATP testing couldbe developed to fill this void, subject to interpretation and valida-tion issues.8,31-36
Not 1 of the current cleaning monitoring methods could over-come all of the potential failure modes that were identified for thatmonitoring method when considered in isolation.
When the cleaning monitoring was considered in a singleflowchart (Fig 1), it became clear that use of the monitoringmethods in combination offered the opportunity to mitigate theeffect of failure modes through the synergistic value of the cleaningmonitoring methods were used both in parallel and in sequence.The strength of visual inspection was maximized, whereas thehigh-risk failure modes are mitigated through use of both FM andATP bioluminometry. A highly targeted (adjunct) use of microbialrecovery, particularly during an outbreak, can be used to providequantitative information against any specific pathogens of concernwhere timely feedback is less of a concern.27,28,37
When using both FM and ATP testing for cleaning monitoring,health care providers must set a suitable acceptable level of pass orfail using the data generated.8 For example, FM will indicate thefrequency of cleaning for surfaces and infection control pro-fessionals (ICPs) should consider the acceptable level of successbefore any intervention on the quality of the cleaning serviceprovided.4 Similarly for rapid ATP, the appropriate level of pass orfail for the brand of ATP device should be carefully consideredbefore implementation of use of rapid ATP detection, so thatintervention on the quality of cleaning service provided isappropriate.36
The issue of cost of monitoring is the subject of ongoing studies,and costs will vary by location and commercial issues. The outlineconsidered in Figure 1 demonstrates that by using an integratedapproach, costs of monitoring can be managed to achieve thelowest potential cost to yield the greatest likelihood of successfulcleaning performance.
This work is intended as an exemplar on the use of FMEA, and isby no means fully comprehensive. The failure modes identified byour FMEA assessors are subjective and may not fully reflect all ofthe potential failures in cleaning monitoring methods. However,

Fig 1. Model for cleaning monitoring.
G.S. Whiteley et al. / American Journal of Infection Control 43 (2015) 147-53152
the work in reconstructing the approach of cleaning monitoringusing all 4 available methods does offer ICPs a new approach todrive quality improvements in environmental cleaning processesthrough more reliable data collection in ongoing studies. Furtherstudies are underway to investigate and confirm the findings of thisFMEA-based risk assessment study.
References
1. Gordon L, Bruce N, Suh K, Roth V. Evaluating and operationalizing an envi-ronmental auditing program: a pilot study. Am J Infect Control 2014;42:702-7.
2. Mitchell BG, Wilson F, Dancer SJ, McGregor A. Methods to evaluate environ-mental cleanliness in healthcare facilities. Healthcare Infection 2013;18:22-30.
3. Sherlock O, O’Connell N, Creamer E, Humphreys H. Is it really clean? an eval-uation of the efficiency of four methods for determining hospital cleanliness.J Hosp Infect 2009;72:140-6.
4. Carling PC, Huang SS. Improving healthcare environmental cleaning anddisinfection: current and evolving issues. Infect Control Hosp Epidemiol 2013;34:507-13.
5. Malik RE, Cooper RA, Griffith CJ. Use of audit tools to evaluate the efficacy ofcleaning systems in hospitals. Am J Infect Control 2003;31:181-7.
6. Griffith CJ, Cooper RA, Gilmore J, Davies C, Lewis M. An evaluation of hospitalcleaning regimes and standards. J Hosp Infect 2000;45:19-28.
7. Lewis T, Griffith C, Galo M, Weinbren M. A modified ATP benchmark forevaluating the cleaning of some hospital environmental surfaces. J Hosp Infect2008;69:156-63.
8. Boyce JM, Havill NL, Havill HL, Mangione E, Dumigan DG, Moore BA. Com-parison of fluorescent marker systems with 2 quantitative methods ofassessing terminal cleaning practices. Infect Control Hosp Epidemiol 2011;32:1187-93.
9. Trajtman AN, Manickam K, Macrae M, Bruning NS, Alfa MJ. Continuing per-formance feedback and use of the ultraviolet visible marker to assess cleaningcompliance in the healthcare environment. J Hosp Infect 2013;84:166-72.
10. Galvin S, Dolan A, Cahill O, Daniels S, Humphreys H. Microbial monitoring ofthe hospital environment: why and how? J Hosp Infect 2012;82:143-51.
11. Humphreys H, Fitzgerald-Hughes D. Search and you will find: detectingextended-spectrum betaelactamase-producing Klebsiella pneumonia from apatient’s immediate environment. Infect Control Hosp Epidemiol 2013;34:534-6.
12. Hota B, Blom DW, Lyle EA, Weinstein RA, Hayden MK. Interventional evalua-tion of environmental contamination by vancomycin-resistant enterococci:failure of personnel, product or procedure? J Hosp Infect 2009;71:123-31.
13. Vickery K, Deva A, Jacombs A, Allan J, Valente P, Gosbell IB. Presence of biofilmcontaining viable multi-resistant organisms despite terminal cleaning onclinical surfaces in an intensive care unit. J Hosp Infect 2012;80:52-5.
14. Huslage K, Rutala WA, Gergen MF, Sickbert-Bennett EE, Weber DJ. Microbialassessment of high-, medium-, and low-touch hospital room surfaces. InfectControl Hosp Epidemiol 2013;34:210-2.
15. Dancer SJ. Hospital cleanliness: establishing a new science. J Hosp Infect 2012;80:354-6.
16. Smith PW, Beam E, Sayles H, Rupp ME, Cavalieri RJ, Gibbs S, Hewlett A. Impactof Adenosine Triphosphate detection and feedback on hospital room cleaning.Infect Control Hosp Epidemiol 2014;35:564-9.
17. Victorian State Government, Department of health state. Cleaning standardsfor Victorian health facilities. State of Government Victoria, Melbourne,Australia; 2011.
18. Luick L, Thompson PA, Loock MH, Vetter SL, Cook J, Guerrero DM. Diagnosticassessment of different environmental cleaning monitoring methods. Am JInfect Control 2013;41:751-2.
19. IEC 31010:2009(E); Risk management e risk assessment techniques: Interna-tional standards Organisation (ISO). International Electrotechnical Commission,Geneva Switzerland (accessed September 2013).
20. Monti S, Jefferson J, Mermel L, Parenteau S, Kenyon S, Cifellie B. Use of Failuremode and effect (FMEA) analysis to improve active surveillance for methicillin-resistant Staphylococcus aureus (MRSA) at a university affiliated medical center.Am J Infect Control 2009;33:E158.
21. Chiozza ML, Ponzetti C. FMEA: A model for reducing medical errors. Clin ChimActa 2009;404:75-8.
22. Geum Y, Cho Y, Park Y. A systematic approach for diagnosing service failure:service specific FMEA and grey relational analysis approach. Math ComputModel 2011;54:3126-42.
23. Australian Council on Safety and Quality in Healthcare (ACSQH). Nationalsafety and quality health service standards. Sydney, Australia: ACSQH; 2012.
24. McDermott RE, Mikulak RJ, Beauregard MR, Taylor and Francis Group. Thebasics of FMEA. 2nd ed. New York, NY, USA: Productivity Press; 2009.
25. Xiao N, Huang H-Z, Li Y, He L, Jin T. Multiple failure modes analysis andweighted risk priority number evaluation in FMEA. Engineering Failure Anal-ysis 2011;18:1162-70.
26. Derry C, Attwater R. Risk perception relating to effluent reuse on a universitycampus. Water; 2006:44-9.
27. Rutala WA, Weber DJ. Healthcare Infection Control Practices Advisory Com-mittee (HICPAC). Guideline for disinfection and sterilization in healthcare fa-cilities. Centre for Disease Control, Department of Health and Human Services,Government of the United States of America, Atlanta, Georgia, USA; 2008.
28. NHMRC (National Health and Medical Research Council). Australian Guidelinesfor the Prevention and Control of Infection in Healthcare. Department of Healthand Ageing, Canberra, Australia; 2010.
29. Jackson C, Griffiths P. Dirt and disgust as key drivers in nurses’ infectioncontrol behaviours: an interpretative, qualitative study. J Hosp Infect 2014;87:71-6.
30. Ganime AC, Carvalho-Costa FA, Mendonca MCL, Vieira CB, Santos M, Filho RC,et al. Group A rotavirus detection on environmental surfaces in a hospitalintensive care unit. Am J Infect Control 2012;40:544-7.
31. Whiteley GS, Derry C, Glasbey T. The comparative performance of three brandsof portable ATP-bioluminometer intended for use in hospital infection control.Healthcare Infection 2012;17:91-7.
32. Shama G, Malik DJ. The uses and abuses of rapid bioluminescence-based ATPassays. Int J Hyg Environ Health 2013;216:115-25.
33. Whiteley GS, Derry C, Glasbey T. Reliability testing for portable adenosinetriphosphate bioluminometers. Infect Control Hosp Epidemiol 2013;34:538-40.

G.S. Whiteley et al. / American Journal of Infection Control 43 (2015) 147-53 153
34. Aitken ZA, Wilson M, Pratten J. Evaluation of ATP bioluminescence assays forpotential use in a hospital setting. Infect Control Hosp Epidemiol 2011;32:507-9.
35. Sciortino CV, Giles RA. Validation and comparison of three adenosine triphos-phate luminometers formonitoring hospital surface sanitization: a Rosetta stonefor adenosine triphosphate testing. Am J Infect Control 2012;40:e233-9.
36. Mulvey D, Redding P, Robertson C, Woodall C, Kingsmore P, Bedwell D, et al.Finding a benchmark for monitoring hospital cleanliness. J Hosp Infect 2011;77:25-30.
37. Gibbs SG, Sayles H, Chaika O, Hewlett A, Colbert EM, Smith PW. Evaluation ofthe relationship between ATP bioluminescence assay and the presence of
organisms associated with healthcare-associated infections. Healthcare Infect2014;19:101-7.
38. Carling PC, Parry MM, Rupp ME, Po JL, Dick B, Von Beheren S. Improvingcleaning of the environment surrounding patients in 36 acute care hospitals.Infect Control Hosp Epidemiol 2008;29:1035-41.
39. Carling PC, Briggs JL, Perkins J, Highlander D. Improved cleaning of patientrooms using a new targeting method. Clin Infect Dis 2006;42:385-8.
40. Munoz-Price LS, Fajardo-Aquino Y, Arheart KL. Ultraviolet powder versus ul-traviolet gel for assessing environmental cleaning. Infect Control Hosp Epi-demiol 2012;33:192-5.

99
Chapter 8
The perennial problem of variability in adenosine
triphosphate (ATP) tests for hygiene monitoring
within healthcare settings

o r i g i n a l a r t i c l e
The Perennial Problem of Variability In Adenosine Triphosphate(ATP) Tests for Hygiene Monitoring Within Healthcare Settings
Greg S. Whiteley, M Safety Sc;1,2 Chris Derry, MSc(Med);1,3 Trevor Glasbey, PhD;2 Paul Fahey, MMedStat1
objective. To investigate the reliability of commercial ATP bioluminometers and to document precision and variability measurementsusing known and quantitated standard materials.
methods. Four commercially branded ATP bioluminometers and their consumables were subjected to a series of controlled studies withquantitated materials in multiple repetitions of dilution series. The individual dilutions were applied directly to ATP swabs. To assess precisionand reproducibility, each dilution step was tested in triplicate or quadruplicate and the RLU reading from each test point was recorded. Resultsacross the multiple dilution series were normalized using the coefficient of variation.
results. The results for pure ATP and bacterial ATP from suspensions of Staphylococcus epidermidis and Pseudomonas aeruginosa arepresented graphically. The data indicate that precision and reproducibility are poor across all brands tested. Standard deviation was as high as50% of the mean for all brands, and in the field users are not provided any indication of this level of imprecision.
conclusions. The variability of commercial ATP bioluminometers and their consumables is unacceptably high with the current technicalconfiguration. The advantage of speed of response is undermined by instrument imprecision expressed in the numerical scale of relative lightunits (RLU).
Infect Control Hosp Epidemiol 2015;36(6) :658–663
The original suggestion to use rapid adenosine triphosphate(ATP) bioluminometers to monitor surface hygiene has yet tosee practical fulfilment among healthcare infection control andprevention practitioners.1 Rapid ATP bioluminometry hasbeen shown to reliably distinguish between 10-fold serialdilutions of various common bacterial species.2,3 ATP devicesalso produce a nearly instantaneous measurement of surfacecleanliness, which has been suggested to provide useful feed-back for quality improvement of cleaning services.4
Currently, authoritative sources have declined to endorse ATPtesting on a stand-alone basis for monitoring surface hygiene inhealthcare settings.5–7 While the detection of ATP on differentsurfaces has been validated with multidrug-resistant organisms(MDROs) where a large amount of contamination is present,little correlation has been made using ATP measurements whensmall amounts of infectious contaminants are present.8,9
Variability has been identified as a concern in the use ofhandheld ATP bioluminometers,10,11 and 3 particular aspectsare troublesome. First, the ATP reading scale known as relativelight units (RLUs) lacks quantitation against a known standardand therefore cannot be calibrated, coincidentally diminishinginterbrand comparability.12
Second, as we have shown previously, this high variabilityleads to poor precision (repeatability) at a magnitude thatprevents ATP devices from adequately distinguishing betweensimilar ATP concentrations or similar levels of contamina-tion.12 In this earlier study, the presence of raw data ‘outlier’readings was unpredictable and nominally undetectable tothose using an ATP device, and these outliers can occur bothabove and below the interquartile range.12 This variability cancause unexpected and unusual results, such as ATP readingsthat are higher following cleaning than prior to cleaning.13
Third, the impact of this variability is greatest at the mea-surement level that defines the boundary between acceptableand unacceptable cleanliness. This criterion has been suggestedthrough various studies at the lower end of the RLU readingrange, between 500 RLU and 100 RLU, and is dependent uponthe brand of ATP bioluminometer.14,15 Attempts to correlateproposed cleaning standards with benchmarks expressed inRLUs, at the low RLU levels required for hospital hygiene, havebeen manifestly unsuccessful.16–19 Even the applications of amethod utilizing a receiver operating curve have not resultedin a widely accepted definitional boundary for an ATP-basedcleaning benchmark.15,20
Affiliations: 1. University of Western Sydney, School of Science and Health, Richmond, NSW, Australia; 2. Whiteley Corporation, North Sydney, NSW,Australia; 3. WHO Collaborating Centre for Environmental Health Development, Richmond, NSW, Australia.
© 2015 by The Society for Healthcare Epidemiology of America. All rights reserved. 0899-823X/2015/3606-0008. DOI: 10.1017/ice.2015.32Received December 9, 2014; accepted February 3, 2015; electronically published March 3, 2015
infection control & hospital epidemiology june 2015, vol. 36, no. 6

Uncontrolled variability leading to poor precision is amajor problem for statistical methods comparing differingtreatment or control groups.21 The risk of type I and type IIerrors in environmental monitoring is increased if thedevices are subject to substantial variability.22 These type Iand II errors using handheld ATP bioluminometers can pre-sent as false-positive or false-negative results, generatingadditional costs either way. Variability in results from ATPbioluminometers is the most recurrent technical concernregarding their use in cleaning monitoring studies using quasi-experimental frameworks.
Another particular concern with portable ATP devices is therisk of random error, which is undetectable in single mon-itoring samples.23 Most studies have been focused on the risksof systemic error through reading inaccuracy over a wide rangeof dilutions; however, the magnitude of random error andaccompanying dispersion of the data set (ie, RLU readings) hasconfused many studies.2,3 The issues of systematic error withATP devices are not considered in this paper.
In this study, a continuation of our work, 4 commercial brandsof rapid ATP bioluminometers were tested to validate theirperformance in a series of controlled experiments. The aim ofthis study was to assess the precision of and reproducibility ofresults from the ATP devices to qualify their role in cleanlinessmonitoring. The critical aspects of this study were the evaluationof the precision of the ATP measurements as expressed in RLUsand the assessment of the magnitude of random error using bothpure-source ATP and bacterial ATP.
This paper outlines our findings regarding variability for allof the ATP devices we tested under controlled conditions.
methods
The 4 commercial brands of ATP bioluminometers and theirconsumables were considered in this work: 3M (Cleantrace),Kikkoman (Lucipac-pen), Hygiena (Ultrasnap), and Charm(Pocket Swab Plus). This series of experiments investigatedthe response of each brand of ATP device across dilutionseries to known ATP quantities and to various bacteria insuspension cultures through direct application to swabs.12 Thismethod of application removed swab technique as a variable,thus exposing more clearly the underlying variability of the ATPdevices. The use of multiple repetitions of dilution seriesestablished a practical dynamic range of concentrations for eachof the ATP bioluminometers, both for a known source ofATP and for the ATP of bacterial species included in the studies.Each ATP device and its consumables were used in accordancewith the respective manufacturer’s instructions, includingrefrigerated storage, use at room temperature, and consumablesused prior to the expiration date.
Testing Using Quantitated ATP
Our study used a known source of ATP (Sigma Aldrich, CastleHill, Australia) to assess ATP device response; while the
quantitative aspects of the concentration of the ATP wereconfirmed using high-performance liquid chromatography(HPLC; Shimadzu, Japan) in a validated method. The use of afully validated, laboratory HPLC allowed a defined quantityof ATP to be used on each sample, thus anchoring theexperimental results and qualifying the confusing RLU scalingto minimize the risks of random and/or systematic errors inmeasurement. The method of application used 10 µL of eachconcentration of ATP solution applied directly to each swabusing a calibrated pipette.12
At each dilution point, replicated testing with a minimum of3 swabs was used for each ATP bioluminometer, and whereverpossible, test points were sampled in quadruplicate. For eachdilution series, the experiment was repeated at least twice,using multiple batches of consumables from each of the ATPdevice suppliers.The ATP solutions were tested in both a 10-fold dilution
series and in a number of 20% dilution series at variousconcentrations of ATP. In total, >840 swabs were used tosample >200 concentrations. The Charm device and con-sumables were obtained toward the end of the study, so thenumber of sample concentrations and total number of swabsused to test that brand were smaller than for the other threebrands.
Microbiological Testing
The experiments using bacterial-suspension cultures wereeach repeated on multiple occasions. At each concentration inthe dilution series, testing was conducted in quadruplicate, andmedians have been used to present typical responses.The bacteria used in the experiments were Staphylococcus
epidermidis (ATCC 12228) and Pseudomonas aeruginosa(ATCC 15692). All were tested as suspension cultures. Whilethe strains tested are not regarded as intrinsically invasive,both S. epidermidis and P. aeruginosa have been associatedwith implanted device failure (S. epidermidis), multi-drug-resistant organisms (P. aeruginosa), and healthcare-associatedinfections.24,25
Staphylococcus epidermidis and P. aeruginosa were enumer-ated by dilution series onto nutrient agar–spread plates(Oxoid, Thermo Scientific, Waltham, MA) incubated at 37°Cfor 48 hours. The P. aeruginosa plates were read at both24 hours and 48 hours. The quantitative enumeration of thesuspension cultures allowed for quantitation of the results andalso minimized the risks of systematic error from RLUmeasurements.Phosphate-buffered saline solution (PBS; Univar, Sydney,
Australia) was used for the dilution series at 10 mMol/Land buffered to pH 7.0 The solution was freshly made andsterilized with each experimental round. During an earlyexperimental round, dilutions prepared with tryptone soybroth (TSB) were found to interfere with one of the ATPbioluminometers (Kikkoman), and the use of TSB wasdiscontinued thereafter. This TSB interference observation was
the perennial problem of variability in atp testing 659

confirmed subsequently with separate laboratory operators inan independent test run.
Tests were conducted in 10-fold dilution series and anumber of 20% dilution series at various concentrations ofsuspension culture. All test concentrations were tested inquadruplicate; however, in some instances samples weremeasured in triplicate. Testing against bacterial cultures wasconducted by direct application in the same way ATP wastested, with 10 µL applied per swab. In this study, we used>1200 ATP swabs and ~ 300 individual concentrations ofbacterial suspensions.
Statistical Approach
Because the ATP bioluminometer readings in RLU were notcomparable between brands, absolute measures of randomerror, such as standard deviation, were not directly comparablebetween brands. The standard deviation increased withincreases in the underlying value of tested dilutions, so anotherstatistical measure was required.26 To assess the relative size ofthe random error, measurements were normalized using thecoefficient of variation (CV), which is the ratio of standarddeviation to the mean.27 This method is particularly helpfulwith non-symmetrical data.28
This normalized measurement allowed the comparison ofinstrument precision among brands at varying concentrations.A CV of 0.4 implies the average distance between observationsat a single concentration for that ATP device; the mean ofthose observations is 40% (0.4) of that mean. Alternatively, ifthe mean was equal to the absolute truth of the measurementfor that ATP device, the expected error (or precision in thiscase) would be ~0.4 times the mean, but according to Reedet al,27 a 1 in 5 chance remains that the reading will be incor-rect (imprecise) by a factor of 2 or more.27 The higher the CV,the lower the precision of the equipment.
The replicated data from the experiments were used to obtainthe individual CV for each set of readings for each device at eachconcentration point, which captured the precision in a highlyvariable data set with these rapid ATP bioluminometers.10,29 Theuse of CV as statistical approach can also capture both the ran-dom error and some of the systematic errors, which directlyaffects the precision of ATP measurements.
The distribution of CVs is summarized in Figures 1–3 usingboxplots. In the plots, the central line in each box representsthe median value, with a box drawn around the second andthird interquartile ranges. The whiskers (the lines extendingboth below and above the box) represent the tenth and nine-tieth percentiles of the range; the dots above and belowrepresent values that are outside the expected spread of results(ie, outliers).
The regularity of outliers both above and below the inter-quartile ranges of samples was noted as a problem early inthese studies. Arithmetic median was used rather than averagesto remove the distortion caused by outliers in raw data sets.When considering dynamic range, however, this sampling
approach is not always available for use in field-based mea-surements. The CV method was preferred to signal-to-noiseratio (x/σ) due to the large volume of random error.All calculations were conducted and graphs were produced
in Microsoft Excel 2010 (Microsoft, Seattle, WA), and whererequired, these calculations were confirmed using Sigma Plot(Systat, San Jose, CA) or SPSS (IBM, NY).
results
Variability measures for all 4 bioluminometers were standar-dized using the coefficient of variance (CV). The 3 testingplatforms for the ATP bioluminometers and their consum-ables first quantitated pure-source ATP (Figure 1) then theATP of the 2 bacterial species S. epidermidis (Figure 2) andP. aeruginosa (Figure 3). The variability expressed as CV waspresent across the full dynamic range for all ATP biolumin-ometer brands tested and was not concentration dependent.Figure 1 indicates the CV present in all 4 ATP biolumin-
ometers and displays the contrast of very low CV calculatedfor the HPLC. HPLC measurements, taken in triplicate,demonstrated a correlation of r= .998, indicating the highprecision and low variance expected of a fully calibratedprecision laboratory instrument. When compared with theHPLC values, all 4 of the ATP devices indicated higherlevels of variance, and 2 of the devices (Kikkoman andHygiena) produced CV> 0.4. In a prior study, also usingknown-source and quantitated ATP, the 3M device alsoproduced CV= 0.4.10
Figure 2 shows the CV for all 4 ATP bioluminometers whenmeasured against quantitated dilution series using the Gram-positive bacterium S. epidermidis. Figure 2 indicates that all 4ATP bioluminometers scored a CV> 0.4 and 2 of the devices(Kikkoman and Charm) showed CV> 1.0 (σ> x).
figure 1. Coefficient of variation for 4 ATP bioluminometersusing ATP testing.
660 infection control & hospital epidemiology june 2015, vol. 36, no. 6
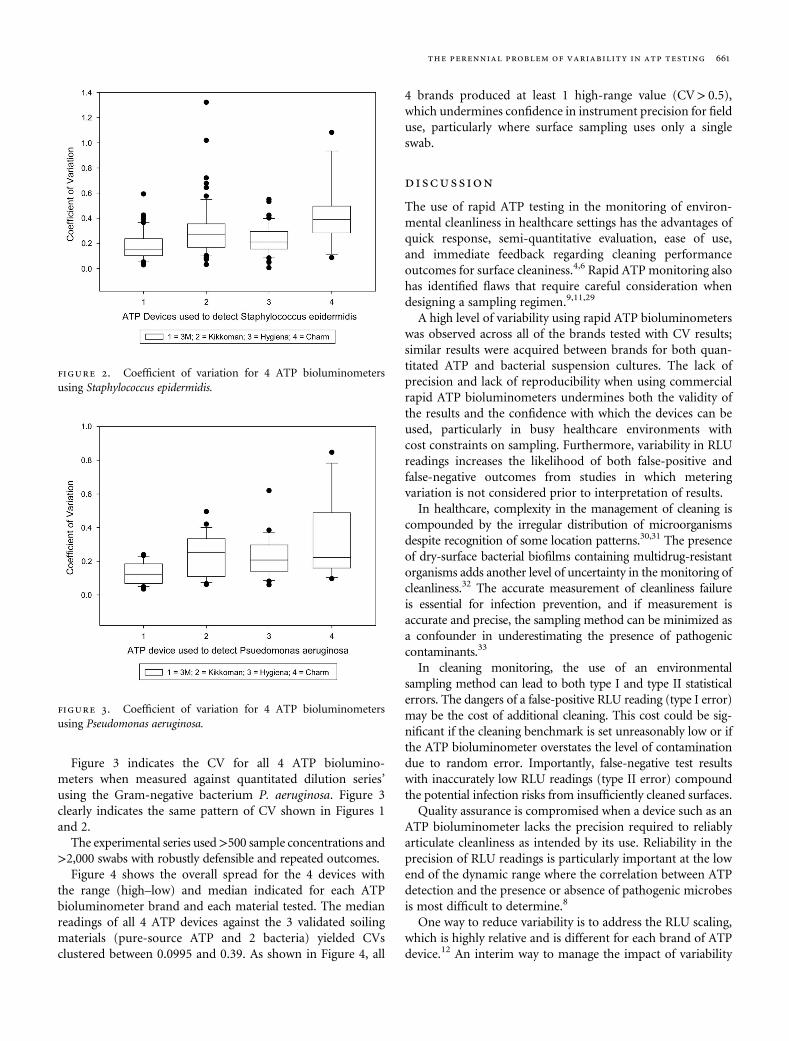
Figure 3 indicates the CV for all 4 ATP biolumino-meters when measured against quantitated dilution series’using the Gram-negative bacterium P. aeruginosa. Figure 3clearly indicates the same pattern of CV shown in Figures 1and 2.
The experimental series used>500 sample concentrations and>2,000 swabs with robustly defensible and repeated outcomes.
Figure 4 shows the overall spread for the 4 devices withthe range (high–low) and median indicated for each ATPbioluminometer brand and each material tested. The medianreadings of all 4 ATP devices against the 3 validated soilingmaterials (pure-source ATP and 2 bacteria) yielded CVsclustered between 0.0995 and 0.39. As shown in Figure 4, all
4 brands produced at least 1 high-range value (CV> 0.5),which undermines confidence in instrument precision for fielduse, particularly where surface sampling uses only a singleswab.
discussion
The use of rapid ATP testing in the monitoring of environ-mental cleanliness in healthcare settings has the advantages ofquick response, semi-quantitative evaluation, ease of use,and immediate feedback regarding cleaning performanceoutcomes for surface cleaniness.4,6 Rapid ATP monitoring alsohas identified flaws that require careful consideration whendesigning a sampling regimen.9,11,29
A high level of variability using rapid ATP bioluminometerswas observed across all of the brands tested with CV results;similar results were acquired between brands for both quan-titated ATP and bacterial suspension cultures. The lack ofprecision and lack of reproducibility when using commercialrapid ATP bioluminometers undermines both the validity ofthe results and the confidence with which the devices can beused, particularly in busy healthcare environments withcost constraints on sampling. Furthermore, variability in RLUreadings increases the likelihood of both false-positive andfalse-negative outcomes from studies in which meteringvariation is not considered prior to interpretation of results.In healthcare, complexity in the management of cleaning is
compounded by the irregular distribution of microorganismsdespite recognition of some location patterns.30,31 The presenceof dry-surface bacterial biofilms containing multidrug-resistantorganisms adds another level of uncertainty in the monitoring ofcleanliness.32 The accurate measurement of cleanliness failureis essential for infection prevention, and if measurement isaccurate and precise, the sampling method can be minimized asa confounder in underestimating the presence of pathogeniccontaminants.33
In cleaning monitoring, the use of an environmentalsampling method can lead to both type I and type II statisticalerrors. The dangers of a false-positive RLU reading (type I error)may be the cost of additional cleaning. This cost could be sig-nificant if the cleaning benchmark is set unreasonably low or ifthe ATP bioluminometer overstates the level of contaminationdue to random error. Importantly, false-negative test resultswith inaccurately low RLU readings (type II error) compoundthe potential infection risks from insufficiently cleaned surfaces.Quality assurance is compromised when a device such as an
ATP bioluminometer lacks the precision required to reliablyarticulate cleanliness as intended by its use. Reliability in theprecision of RLU readings is particularly important at the lowend of the dynamic range where the correlation between ATPdetection and the presence or absence of pathogenic microbesis most difficult to determine.8
One way to reduce variability is to address the RLU scaling,which is highly relative and is different for each brand of ATPdevice.12 An interim way to manage the impact of variability
figure 2. Coefficient of variation for 4 ATP bioluminometersusing Staphylococcus epidermidis.
figure 3. Coefficient of variation for 4 ATP bioluminometersusing Pseudomonas aeruginosa.
the perennial problem of variability in atp testing 661

with ATP devices is to manage the sampling plan through thesequential and parallel use of different methods of cleaningmonitoring.34
The results presented here were obtained with the advantagesof controlled conditions, multiple repetitions, large numbers ofswabs used in a wide array of concentrations across the entirereading range of the devices. Unfortunately, this strictly con-trolled approach probably underestimates the level of variationthat occurs in uncontrolled field-based studies; for example, swabtechnique adds additional variability. A shortfall of this study wasthat just 1 ATP device per brand was used in the experiments.Purchased consumables (albeit used according to manufacturerrecommendations) lack consistency that may not be reflected inmanufacturer-supported studies with fresh consumables andstrict batch controls. However, this work does represent thenormal experience of field use, suggesting that all brands of ATPdevices exhibit similar variability and lack of precision.
Furthermore, in this study, more repetitions may havedecreased the range of CV results, thus bringing the meanand median into closer alignment. However, the range data(Figure 4) would be unaffected.
Rapid ATP measurement using handheld devices is quickand relatively inexpensive, but caution is required in the
interpretation of results. As ATP devices are currently config-ured, the inherent variability and lack of precision in theresults obtained may lead to erroneous conclusions; thus, datacollected using these devices and the conclusions stemmingfrom them warrant careful consideration.
acknowledgments
The authors are grateful to DrMichael Phillips (Senior Lecturer, Microbiology,University of Western Sydney) and to Ms Carol Adkins (Laboratory Manager,Microbiology, University of Western Sydney, Hawkesbury Campus) forassistance with microbiology, culture production, and laboratory materials.The authors thank Dr Richard Shaughnessy, University of Tulsa, and theCleaning Industry Research Institute International for the loan of the unit forATP testing.Financial support: No financial support of any kind was received from any
company or person involved in the manufacture, sale, or distribution of aspecific brand of ATP bioluminometer or its consumables. GSW and TG areemployees of Whiteley Corporation; GSW is a PhD student at the University ofWestern Sydney. Funds for consumables and ATP devices were provided byUWS and Whiteley Corporation. CD and PF are staff at the University ofWestern Sydney.Potential conflicts of interest:None of the authors has any potential conflict of
interest with any of the materials or products mentioned in this paper.Whiteley Corporation has no affiliation of any type with ATP bioluminometers
figure 4. Coefficient of variation: range and median for all brands tested and all test materials.
662 infection control & hospital epidemiology june 2015, vol. 36, no. 6
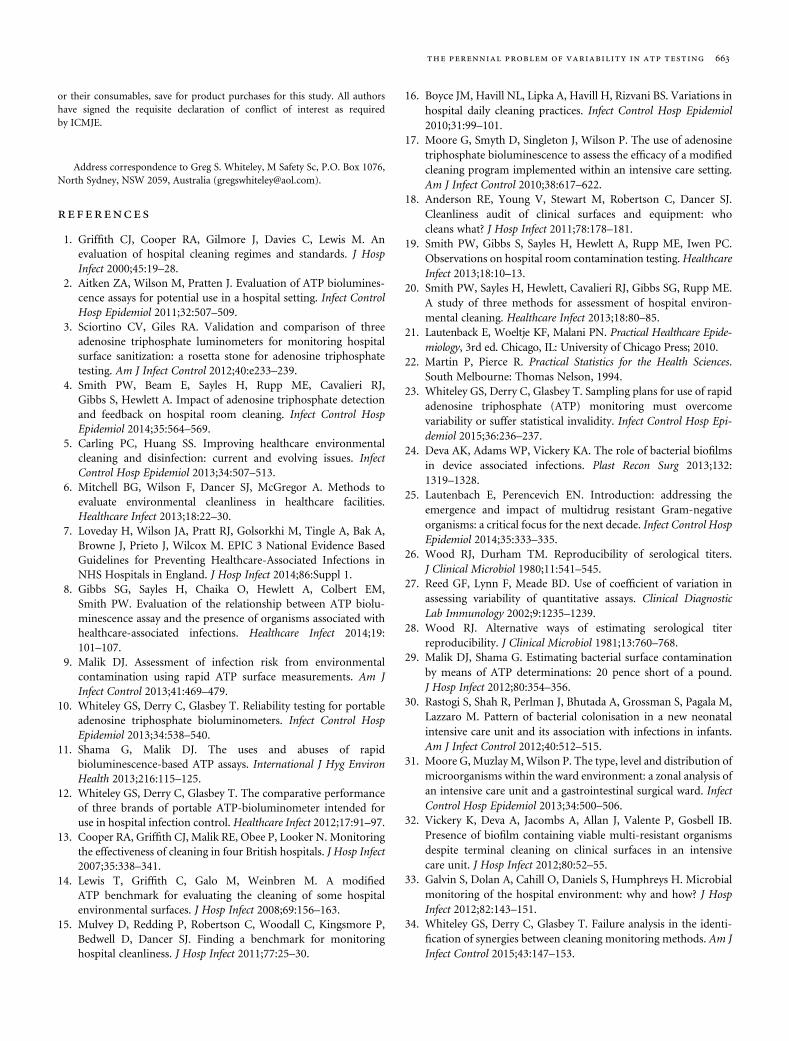
or their consumables, save for product purchases for this study. All authorshave signed the requisite declaration of conflict of interest as requiredby ICMJE.
Address correspondence to Greg S. Whiteley, M Safety Sc, P.O. Box 1076,North Sydney, NSW 2059, Australia ([email protected]).
references
1. Griffith CJ, Cooper RA, Gilmore J, Davies C, Lewis M. Anevaluation of hospital cleaning regimes and standards. J HospInfect 2000;45:19–28.
2. Aitken ZA, Wilson M, Pratten J. Evaluation of ATP biolumines-cence assays for potential use in a hospital setting. Infect ControlHosp Epidemiol 2011;32:507–509.
3. Sciortino CV, Giles RA. Validation and comparison of threeadenosine triphosphate luminometers for monitoring hospitalsurface sanitization: a rosetta stone for adenosine triphosphatetesting. Am J Infect Control 2012;40:e233–239.
4. Smith PW, Beam E, Sayles H, Rupp ME, Cavalieri RJ,Gibbs S, Hewlett A. Impact of adenosine triphosphate detectionand feedback on hospital room cleaning. Infect Control HospEpidemiol 2014;35:564–569.
5. Carling PC, Huang SS. Improving healthcare environmentalcleaning and disinfection: current and evolving issues. InfectControl Hosp Epidemiol 2013;34:507–513.
6. Mitchell BG, Wilson F, Dancer SJ, McGregor A. Methods toevaluate environmental cleanliness in healthcare facilities.Healthcare Infect 2013;18:22–30.
7. Loveday H, Wilson JA, Pratt RJ, Golsorkhi M, Tingle A, Bak A,Browne J, Prieto J, Wilcox M. EPIC 3 National Evidence BasedGuidelines for Preventing Healthcare-Associated Infections inNHS Hospitals in England. J Hosp Infect 2014;86:Suppl 1.
8. Gibbs SG, Sayles H, Chaika O, Hewlett A, Colbert EM,Smith PW. Evaluation of the relationship between ATP biolu-minescence assay and the presence of organisms associated withhealthcare-associated infections. Healthcare Infect 2014;19:101–107.
9. Malik DJ. Assessment of infection risk from environmentalcontamination using rapid ATP surface measurements. Am JInfect Control 2013;41:469–479.
10. Whiteley GS, Derry C, Glasbey T. Reliability testing for portableadenosine triphosphate bioluminometers. Infect Control HospEpidemiol 2013;34:538–540.
11. Shama G, Malik DJ. The uses and abuses of rapidbioluminescence-based ATP assays. International J Hyg EnvironHealth 2013;216:115–125.
12. Whiteley GS, Derry C, Glasbey T. The comparative performanceof three brands of portable ATP-bioluminometer intended foruse in hospital infection control. Healthcare Infect 2012;17:91–97.
13. Cooper RA, Griffith CJ, Malik RE, Obee P, Looker N. Monitoringthe effectiveness of cleaning in four British hospitals. J Hosp Infect2007;35:338–341.
14. Lewis T, Griffith C, Galo M, Weinbren M. A modifiedATP benchmark for evaluating the cleaning of some hospitalenvironmental surfaces. J Hosp Infect 2008;69:156–163.
15. Mulvey D, Redding P, Robertson C, Woodall C, Kingsmore P,Bedwell D, Dancer SJ. Finding a benchmark for monitoringhospital cleanliness. J Hosp Infect 2011;77:25–30.
16. Boyce JM, Havill NL, Lipka A, Havill H, Rizvani BS. Variations inhospital daily cleaning practices. Infect Control Hosp Epidemiol2010;31:99–101.
17. Moore G, Smyth D, Singleton J, Wilson P. The use of adenosinetriphosphate bioluminescence to assess the efficacy of a modifiedcleaning program implemented within an intensive care setting.Am J Infect Control 2010;38:617–622.
18. Anderson RE, Young V, Stewart M, Robertson C, Dancer SJ.Cleanliness audit of clinical surfaces and equipment: whocleans what? J Hosp Infect 2011;78:178–181.
19. Smith PW, Gibbs S, Sayles H, Hewlett A, Rupp ME, Iwen PC.Observations on hospital room contamination testing.HealthcareInfect 2013;18:10–13.
20. Smith PW, Sayles H, Hewlett, Cavalieri RJ, Gibbs SG, Rupp ME.A study of three methods for assessment of hospital environ-mental cleaning. Healthcare Infect 2013;18:80–85.
21. Lautenback E, Woeltje KF, Malani PN. Practical Healthcare Epide-miology, 3rd ed. Chicago, IL: University of Chicago Press; 2010.
22. Martin P, Pierce R. Practical Statistics for the Health Sciences.South Melbourne: Thomas Nelson, 1994.
23. Whiteley GS, Derry C, Glasbey T. Sampling plans for use of rapidadenosine triphosphate (ATP) monitoring must overcomevariability or suffer statistical invalidity. Infect Control Hosp Epi-demiol 2015;36:236–237.
24. Deva AK, Adams WP, Vickery KA. The role of bacterial biofilmsin device associated infections. Plast Recon Surg 2013;132:1319–1328.
25. Lautenbach E, Perencevich EN. Introduction: addressing theemergence and impact of multidrug resistant Gram-negativeorganisms: a critical focus for the next decade. Infect Control HospEpidemiol 2014;35:333–335.
26. Wood RJ, Durham TM. Reproducibility of serological titers.J Clinical Microbiol 1980;11:541–545.
27. Reed GF, Lynn F, Meade BD. Use of coefficient of variation inassessing variability of quantitative assays. Clinical DiagnosticLab Immunology 2002;9:1235–1239.
28. Wood RJ. Alternative ways of estimating serological titerreproducibility. J Clinical Microbiol 1981;13:760–768.
29. Malik DJ, Shama G. Estimating bacterial surface contaminationby means of ATP determinations: 20 pence short of a pound.J Hosp Infect 2012;80:354–356.
30. Rastogi S, Shah R, Perlman J, Bhutada A, Grossman S, Pagala M,Lazzaro M. Pattern of bacterial colonisation in a new neonatalintensive care unit and its association with infections in infants.Am J Infect Control 2012;40:512–515.
31. Moore G, Muzlay M,Wilson P. The type, level and distribution ofmicroorganisms within the ward environment: a zonal analysis ofan intensive care unit and a gastrointestinal surgical ward. InfectControl Hosp Epidemiol 2013;34:500–506.
32. Vickery K, Deva A, Jacombs A, Allan J, Valente P, Gosbell IB.Presence of biofilm containing viable multi-resistant organismsdespite terminal cleaning on clinical surfaces in an intensivecare unit. J Hosp Infect 2012;80:52–55.
33. Galvin S, Dolan A, Cahill O, Daniels S, Humphreys H. Microbialmonitoring of the hospital environment: why and how? J HospInfect 2012;82:143–151.
34. Whiteley GS, Derry C, Glasbey T. Failure analysis in the identi-fication of synergies between cleaning monitoring methods. Am JInfect Control 2015;43:147–153.
the perennial problem of variability in atp testing 663

106
Chapter 9
A pilot study into locating the bad bugs in a busy
intensive care unit

lable at ScienceDirect
American Journal of Infection Control 43 (2015) 1270-5
Contents lists avai
American Journal of Infection Control
journal homepage: www.aj ic journal .org
American Journal of Infection Control
Major article
A pilot study into locating the bad bugs in a busy intensive care unit
Greg S. Whiteley BAppSc, MSafetySc, Dip AICD a,b,*,Jessica L. Knight DipSc, BSc(Hons) c,d,e, Chris W. Derry BSc(Med)Hons, MSc(Med), PhD a,Slade O. Jensen BSc(Hons), PhD c,d,e, Karen Vickery BVSc(Hons), MSc, PhD f,Iain B. Gosbell MBBS, MD, FRACP c,d,e,g
a School of Science and Health, University of Western Sydney, Richmond, NSW AustraliabWhiteley Corporation Pty Ltd, North Sydney, NSW Australiac School of Medicine, University of Western Sydney, Campbelltown, NSW Australiad Ingham Institute for Applied Medical Research, Antibiotic Resistance and Mobile Elements Group, Campbelltown, NSW AustraliaeMolecular Medicine Research Group, Liverpool, NSW Australiaf Surgical Infection Research Group, Faculty of Medicine and Health Sciences, Macquarie University, North Ryde, NSW AustraliagDepartment of Microbiology and Infectious Diseases, Sydney South West Pathology Service, Liverpool, NSW Australia
Key Words:MDRO locationsATP correlationDry surface biofilmIntensive care unitStaff work areaHigh-touch objects
* Address correspondence to Greg S. Whiteley, BApBox 1076, North Sydney, NSW 2096, Australia.
E-mail address: [email protected] (G.S. WhiteConflicts of interest: None to report.
0196-6553/$36.00 - Copyright � 2015 by the Associahttp://dx.doi.org/10.1016/j.ajic.2015.07.013
Background: The persistence of multidrug-resistant organisms (MDROs) within an intensive care unit(ICU) possibly contained within dry surface biofilms, remains a perplexing confounder and is a threat topatient safety. Identification of residential locations of MDRO within the ICU is an intervention for whichnew scientific approaches may assist in finding potential MDRO reservoirs.Method: This study investigated a new approach to sampling using a more aggressive environmentalswabbing technique of high-touch objects (HTOs) and surfaces, aided by 2 commercially availableadenosine triphosphate (ATP) bioluminometers.Results: A total of 13 individual MDRO locations identified in this pilot study. The use of ATP bio-luminometers was significantly associated with the identification of 12 of the 13 individual MDRO lo-cations. The MDRO recovery and readings from the 2 ATP bioluminometers were not significantlycorrelated with distinct cutoffs for each ATP device, and there was no correlation between the 2 ATPdevices.Conclusion: The specific MDRO locations were not limited to the immediate patient surroundings or toany specific HTO or type of surface. The use of ATP testing helped rapidly identify the soiled locations forMDRO sampling. The greatest density of positive MDRO locations was around and within the clinical staffwork station.
Copyright � 2015 by the Association for Professionals in Infection Control and Epidemiology, Inc.Published by Elsevier Inc. All rights reserved.
5,6
Pathogenic microorganisms are a persistent risk to patientsafety in modern health care settings, particularly within activeintensive care units (ICUs).1 The presence of multidrug-resistantorganisms (MDROs) embedded within dry surface biofilms addsfurther complexity to the cleaning process.2 A validated scientificapproach to evidence-based cleaning requires a multidisciplinaryunderstanding of all intersecting parts of the hygiene puzzle.3The location of MDROs within an ICUmay be subject to patternsof localization and dispersion.4 There is an expected “hot zone” ofbacterial surface contamination normally focused around the bed
pSc, MSafetySc, Dip AICD, PO
ley).
tion for Professionals in Infection
of an infected patient. The transfer of these MDROs away fromthe patient area and throughout the ICU is thought to occur largelyvia unwashed hands and gloved hands.7,8 High-touch objects(HTOs) are located throughout clinical areas and can provide alikely transit point for microbes owing to the frequency of handtouches.9
A lack of cleaning in the clinical workspace, which is distantfrom the direct patient surroundings, may allow biofilm develop-ment without mitigation.10 This opens the potential for MDRO tomove seamlessly between residential biofilm locations either closeto or away from the patient, and then back and forth via hands ontosurfaces and objects that are frequently touched within the ICU.11
The identification of residential biofilm locations thus becomes acritical requirement in the validation of any cleaning process withinhealth care settings and particularly in ICUs.12
Control and Epidemiology, Inc. Published by Elsevier Inc. All rights reserved.

G.S. Whiteley et al. / American Journal of Infection Control 43 (2015) 1270-5 1271
The use of adenosine triphosphate (ATP) for monitoring ofcleaning has been shown to be superior to visual inspection ofcleaning performance.13 Various studies have indicated that ATPdevices can detect and reliably indicate high readings in relativelight units (RLU) when high numbers of bacteria or ATP sources arepresent.14-16 Recent studies have further indicated that despite thelack of species identification, commercial ATP devices may aid thedetection of MDRO species on surfaces.17 The use of commercialATP devices in ICU settings has been shown to add limitedimprovement to cleaning validation within ICUs.18,19
The poor level of precision with the current generation of ATPmeters requires careful consideration in the methodology of anysampling plan.20 Field trials using different brands have not shownany definitive correlation either with cleaning or betweenbrands.21-23 The use of overlapping monitoring approaches hasbeen suggested as a method to overcome individual weaknesses inmonitoring systems.24
In the present study, conducted within an active ICU, a series ofenvironmental cleanliness assessments were conducted to identifylocations of MDROs. Microbial sampling was also conducted toconfirm the presence and location of MDROs and likely hotspots forthe presence of dry surface biofilms. Two commercially availableATP devices were evaluated to determine whether they could bereliably used to indicate soiled versus relatively clean surfaces as arapid indicator for prospective sampling locations.
METHODS
In this pilot study, 3 separate sampling runs were conducted. Allsampling sites were identified as HTOs that have been previouslyreported in the literature.2,9,10,25 The first sampling run was per-formed by a single operator only obtaining microbial swabs usingthe method described below. On the second and third samplingruns, 2 operators sampled various HTO locations, performingmicrobiology and ATP sampling. The full set of sample locations islisted in Table 1.
Environmental swabs were taken using a sterile gauze clothsoaked in a 0.9% sodium chloride solution, swabbed onto the sur-face using sterile tweezers, and then immediately immersed insterile tryptic soy broth (TSB).26 The gauze swabs were then incu-bated at 37�C for 24 hours and tested for the presence ofmethicillin-resistant Staphylococcus aureus, vancomycin-resistantenterococci, and multidrug-resistant gram-negative bacteria byspread plating onto methicillin-resistant S aureus and vancomycin-resistant enterococci chromogenic media (bioMérieux, Marcy-l’Étoile, France), extended-spectrum beta-lactamase chromogenicmedia, and horse blood agar (Edwards, Sydney, Australia). PotentialMDRO growth was identified and tested for antibiotic susceptibilityviamatrix assisted laser desorption ionization time-of-flight (VITEKautomated microbial identification system; bioMérieux).
The 2 commercially available ATP bioluminometers and theirconsumables selected for the study were the Kikkoman ATP devicewith Lucipak-Pen swabs (Foodcare Systems, Leeton, Australia), andthe Hygiena ATP device with Ultrasnap swabs (Key Diagnostics,Lane Cove, Australia). All consumables were stored in accordancewith themanufacturers’ instructions. ATP swabs were taken at eachidentified location first with the Hygiena device and then with theKikkoman device. The final swab taken at each location was for themicrobial recovery of MDROs as described above.
The first sampling run used only environmental swabs on likelyHTOs. Sampling sites for the second and third runs were selectedafter the first run. The second run used both nonpaired and a pairedcombination of the 2 ATP devices with microbial sampling. Theselection process for the second sampling run was neither wellmatched nor randomized. The third run used a matched-paired
approach with both ATP devices and microbial sampling at eachsample location.
Statistical analyses were performed using both Excel 8.0(Microsoft, Redmond, WA) and Sigma Plot 12.0 (Systat, San Jose,CA). Tables and Figures were drawn using Microsoft Excel 8.0. Thec2 calculations were manually rechecked and corrected using theYates correction (for low sample numbers). The Yates correctionused 1 degree of freedom (df) in the calculation df ¼ (r � 1) (c � 1),where r represents rows and c represents columns.27 Fisher’s exacttest was calculated using Sigma Plot.
RESULTS
A total of 62 environmental swabs were obtained from the 3sampling runs (23 from the first run,16 from the second run, and 23from the third run). The first sampling run collected microbialswabs from 23 separate HTO locations. The second sampling runexamined 29 separate HTO locations, using a combination of 16environmental swabs and 43 ATP swabs (28 Hygiena and 15 Kik-koman). During the second sampling run, only 13 of the 29 loca-tions had the environmental swabs matched with the use of bothbrands of ATP swabs. The third sampling run used a fully matchedapproach, in which all 23 sites examined were subject to 23 envi-ronmental swabs and 23 of each of the branded ATP swabs(46 swabs). Table 1 lists the sampling locations and methods.
The first sampling run collected 23 microbiology swabs using asingle operator, without ATP testing. From this first sampling run, asingle MDRO-positive sample was confirmed from a patient folderwithin the immediate patient zone (MDRO recovery rate of 4.3%;n ¼ 23). The time interval from sampling to MDRO confirmationwas longer than 72 hours.
The second sampling run introduced the use of ATP testing. Theresults of ATP tests are expressed in RLU. The nearly immediate RLUreadings were accepted to indicate the general level of soiling ineach sample location.14-16 Many of the sampling locations withrelatively low RLU were not sampled for either MDRO or for the 2branded ATP tests. This sampling approach limited the power offindings from this pilot study and introduced the potential forsampling error, particularly with insufficient replicates from eachsample location.28 The rise in ATP levels in this second samplingrun, as sampling locations moved from the immediate patient zonetoward the clinical workstation, is illustrated in Fig 1.
This second sampling run examined a total of 29 individual HTOlocations. Environmental swabs were taken on all surfaces withrelatively higher RLU readings. Sixteen locationswere swabbed usingenvironmental swabs; 3 of the 16 swabs were taken using only asingle branded ATP reading (all Hygiena). All of these 13 locationswere examined with environmental swabs and using a pairedapproach using both brands of ATP tests. From the 13 swabs withmatching pairs, 5 of the environmental sampleswere later confirmed(>72 hours) as positive for anMDRO. From this second sampling run,only the 13 matched pairs were included in the statistical analysis.
The third sampling run sampled 23 locations focused around theclinical workstation, with all samples paired (both ATP devices andmicrobial swabs). Seven of the 23 locations were confirmed aspositive for a known MDRO. Several of the MDRO-positive itemswere later removed for further examination for microscopicinvestigation of dry surface biofilms.
The HTO sample locations that were positively identified withMDROs during the 3 sampling runs are listed in Table 2. Terminalcleaning was performed in the patient surroundings after evacua-tion of any patient from the individual bed bay during each of the 3sampling runs.
The combination of the paired testing in sampling runs 2 and 3,where the data were matched with both environmental microbial

Table 1Sampling locations and methods used for each sampling run
HTO First sampling run Second sampling run Third sampling run
Signage on patient chart table Micro onlyPathology folder on patient chart table Micro onlyCord holding MSDS in bedpan room Micro onlyIsolation room (MRSA patient), supply table, top ATP (Hyg and KK), microIsolation room (MRSA patient), chair, top ATP (Hyg)Isolation room (MRSA patient), chair, seat ATP (KK)Isolation room (MRSA patient), bed railing ATP (Hyg and KK), microIsolation room (MRSA patient), IV pole ATP (Hyg)Isolation room (MRSA patient), IV device top ATP (Hyg), microIsolation room (MRSA patient), IV pump face ATP (Hyg), microBedside monitor ATP (Hyg)Patient chart table top ATP (Hyg)Patient chart table, bulldog clip ATP (Hyg and KK), microPatient supply table, top ATP (Hyg and KK), microIV pole ATP (Hyg and KK), microBedside blood pump, face of device ATP (Hyg and KK)Bedside oxygen pump, face of device ATP (Hyg)Patient bathroom, soap dispenser button ATP (Hyg)Patient bathroom, door handle ATP (Hyg)Bedpan room, door handle ATP (Hyg)Bedpan room, bedpan washer handle ATP (Hyg), microBedpan room, boxes or crates (2 items) ATP (Hyg and KK), microBedpan room, inside storage box ATP (Hyg)Clinical work station, arterial blood gas machine ATP (Hyg and KK), microClinical work station, telephone ATP (Hyg and KK), microClinical work station, NUM clipboard ATP (Hyg and KK), microClinical work station, storage room door handle ATP (Hyg)Clinical work station, crash cart handle ATP (Hyg)Clinical work station, keyboard and mouse ATP (Hyg and KK), micro 6 samples: ATP (Hyg and KK), microClinical work station, crash cart clipboard ATP (Hyg and KK), micro 11 samples: ATP (Hyg and KK), microClinical work station, chair ATP (Hyg and KK), micro 6 samples: ATP (Hyg and KK), micro
Hyg, Hygiena; KK, Kikkoman; micro, microbial sampling; NUM, nurse unit manager.
Fig 1. Second sampling run, all sample locations using Hygiena ATP testing.
G.S. Whiteley et al. / American Journal of Infection Control 43 (2015) 1270-51272
swabs and both brands of ATP tests, identified MDROs at 12 of 36sampling locations (MDRO recovery rate of 33.3%; n ¼ 36).
Using this abridged approach, the first sampling run using onlymicrobiology swabs to locate MDROs (4.3%) was comparedwith thecombined matched dataset from the second and third samplingruns (36%). The MDRO success rate with and without the use of ATP
to guide sampling locations was tested and found to be significantlyassociated using both the c2 test (with Yates correction; P < .025)and Fisher’s exact test (P ¼ .01).
The data from the first sampling run and matched data from thesecond and third sampling runs are summarized in Table 3. Asshown in Table 3, the Hygiena device has a lower reading range (in

Table 3Data summary from the first sample run and matched data from the second and third sample runs
Samples MDRO identified MDRO negative
First run, n (%) 23 1 (4.3%) 22 (95.7%)Second and third runs, n (%) 36 12 (33.3%) 24 (66.7%)Hygiena range for MDRO 36 3-260 RLU (average, 87.3 RLU; median, 54.5 RLU) 5-297 (average, 69.6 RLU; median, 31.0 RLU)Kikkoman range for MDRO 36 378-2,833 RLU (average, 1,206.8 RLU; median, 864 RLU) 106-36,452 RLU (average, 2,449.2 RLU; median, 845.5 RLU)
Table 2Confirmed locations of MDRO
HTO Hygiena Kikkoman MDRO
Patient folder on patient notes bench No reading No reading MRSAIsolation room, patient bed railing 118 639 MRSABedpan room, clamp box lid 26 2,671 VREBedpan room, gray crate on shelf 3 786 VREClinical station, keyboard and mouse 260 2,436 VREClinical station, crash cart clipboard 221 1,125 VRE and ESBL (Enterobacter cloacae)Clinical station, computer keyboard, space bar 19 443 Enterococcus faecalisClinical station, crash cart clipboard, rear side bottom left corner 24 942 Acinetobacter baumanniiClinical station, chair height adjustment handle, front 27 2,833 Pantoea agglomeransClinical station, crash cart clipboard, front side, top left corner 32 378 MRSAClinical station, chair, top of back rest, center front (fabric) 77 1,321 Acinetobacter pittiClinical station, chair, side of seat, center (fabric) 106 483 Acinetobacter pittiClinical station, chair, side of seat, center (fabric) 134 425 Enterococcus faecium
ESBL, extended-spectrum beta-lactamase; MRSA, methicillin-resistant Staphylococcus aureus; VRE, vancomycin-resistant enterococci.
Fig 2. Data plotted for MDRO and ATP readings.
G.S. Whiteley et al. / American Journal of Infection Control 43 (2015) 1270-5 1273
RLU) than the Kikkoman device. In this study, the Hygiena devicerecorded readings ranging from 3 to 260 RLU for MDRO-positivelocations and from 5 to 297 RLU for MDRO-negative locations.Compared with the Kikkoman device, both datasets for the Hygienadevice showed lower average and median results. The average andmedian results were quite well separated, with the average higherthan the median. The median results for the Hygiena device weregigher for the MDRO-positive locations.
Application of the c2 test demonstrated that the Hygiena de-vice was incapable of indicating MDRO locations when a cutoff of15 RLU was applied (P > .15 with 1 df). The cutoff value of 15 RLUwas determined using a receiver operating curve sensitivityanalysis.
The results for the Kikkoman ATP device showed readingsranging from 378 to 2,833 RLU for MDRO-positive locations andfrom 106 to 36,452 RLU for MDRO-negative locations. The Kikko-man data also showed a significant separation between the averageand median values.
Our c2 analysis failed to demonstrate that the Kikkoman ATPdevice was capable of indicating MDRO locations at a cutoff of 350RLU (P > .15 with 1 df). This 350 RLU cutoff was determined using areceiver operating curve sensitivity analysis.
Data for the Kikkoman and Hygiena devices are plotted togetherin Fig 2. There was no correlation between the 2 sets of readings(R2 ¼ 0.0144).
DISCUSSION
In this pilot study, it would be easy to overstate the significanceof the results, owing to a range of potential methodological flaws.These concerns include the selection method used for sampling ofHTOs, the introduction of a more experienced operator with ATPsampling in the second sampling run, the variability of readingswith the portable ATP devices as a potential confounder, theaggressive swabbing technique used to locate MDROs and potentialbiofilm-related organisms, and lack of assessment of total hetero-trophs in the microbial sampling. The statistical analysis wascomplicated, because a fully matched dataset could not be obtainedfrom the second sampling run.
Nonetheless, the ATP testing served as a relative indicator ofsurface cleanliness, and the timely results guided the microbialsampling, whichwas otherwiseweakened by the delay in obtainingresults of microbial sampling in isolation.24 As indicated in Fig 1, thetimeliness provided by the ATP testing contributed to the signifi-cantly improved sampling outcomes when searching for MDROs onsurfaces within and around the ICU (P < .025, c2 test with 1 df,and P ¼ .01, Fisher’s exact test). The results were significant evenwith all microbial samples (including 3 nonpaired samples)included (P < .05, c2 test with 1 df; P ¼ .021, Fisher’s exact text).
The purpose of cleaning is to remove soils including bacteria andother biologicalmaterials; however, cleaning has been described as aweak science, with poor reliability.29 Part of the challenge inimproving cleaning performance is to enable better science thatallows staff to monitor and identify where the microbes of concernare located, and then whether or not the cleaning process has beenefficacious.30 The use of rapid ATP testing for the purpose ofassessing HTO cleanliness provides practical assistance forimproving the discovery rate for MDRO locations above that usingliterature or visual inspection alone as a guide to sampling locations.
The initial sampling of HTO was focused around the immediatepatient zone and the clinical treatment area with reference to

G.S. Whiteley et al. / American Journal of Infection Control 43 (2015) 1270-51274
recognized HTOs. When ATP testing was included, the higher RLUreadings from the 2 ATP devices suggested the need for intensiveinvestigation of the staff clinical area, inwhich all clinical staff werefrequently moving to and fro, with both ATP devices and environ-mental swabbing (Fig 1). The majority of MDRO-positive locationswere identified in this area.
In this pilot study, insufficient data were available to test thesignificance of the differences in RLU readings between HTOs in theimmediate patient zone and those in other areas within the ICU. Inthe clinical workstation, the focus of sampling was on HTO sitesthat were later found to be uncovered by any cleaning protocol orcleaning responsibility. The list of contaminated HTOs and therange of MDROs recovered is provided in Table 2.
Using the ATP devices significantly improved the samplingapproach. A cutoff of 350 RLU could reasonably be applied to theKikkoman readings, even though the threshold was not signifi-cantly associated with the likelihood of finding an MDRO. A cutoffof 15 RLU when using the Hygiena device might be possible for allbut 1 of the MDRO locations indicated with >15 RLU, which is arecognized standard for school cleaning.31
Our results underscore the danger of applying a single 100 RLUcutoff without first testing the appropriate cutoff for a particularATP device.32 With single point sampling results from ATP testing,there is a 20% chance of reading imprecision by a factor of 2.28 Thisvariability is also noticeable in the noncorrelation between the 2devices shown in Fig 2 (R2 ¼ 0.0144).
As indicated in Table 3, the RLU readings from the 2 ATP deviceswere 1 order of magnitude different at the average levels and morethan 1 order of magnitude different at the median levels. Thisfinding also highlights the danger of using average readings be-tween different brands of ATP devices.20 The reason for the differ-ence in relative sensitivity between the 2 branded ATP tests was notdetermined, but may be related to variability in swab material, lysissystems, or light detection, or even in broad reactivity of the un-derlying biochemistry of the enzymes used in the swabs.
In this pilot study, we found that many of the HTOs fromwhichMDROs were recovered were not items included in cleaning pro-tocols.10 Such items as telephones, computer keyboards, and chairswere sampled in between use by clinical staff. Other items (eg, thecrash cart clipboard) were not used during the sampling runs, butwere observed to be handled on several occasions to access nearbydrawers, cupboards, and, on one occasion, a handwashing sink.
Hand hygiene compliance was not audited during this pilotstudy, but is typically reported as adequate.33 Clinical staff wereobserved to use items in the clinical area both with and withoutgloved hands. Terminal cleaning by cleaning staff using disposablechlorine wipes inside vacated patient zones was observed duringthe sampling. No cleaning of the clinical workstation was observedduring any of the 3 sampling runs.
In conclusion, the findings of this study suggest the need toreview the hygiene standards adopted in the clinical workspace,away from the immediate patient zones in busy ICUs, and indicatethat ATP testing may help identify HTOs with less than optimalcleanliness. Better monitoring of cleaning may improve the surfacehygiene outcomes from effective cleaning protocols applied to allHTOs within and around clinical work areas inside ICUs.24 This pilotstudy was part of a wider project, and other studies of the variouscomponents required for hygiene improvement within health caresettings are currently underway.
References
1. Loveday HP, Wilson JA, Pratt RJ, Golsorkhi M, Tingle A, Bak A, et al. Epic 3:national evidence-based guidelines for preventing healthcare-associated in-fections in NHS hospitals in England. J Hosp Infect 2014;86(Suppl 1):S1-70.
2. Vickery K, Deva A, Jacombs A, Allan J, Valente P, Gosbell IB. Presence of biofilmcontaining viable multi-resistant organisms despite terminal cleaning onclinical surfaces in an intensive care unit. J Hosp Infect 2012;80:52-5.
3. Dancer SJ. Hospital cleanliness: establishing a new science. J Hosp Infect 2012;80:355.
4. Rastogi S, Shah R, Perlman J, Bhutada A, Grossman S, Pagala M, et al. Pattern ofbacterial colonisation in a new neonatal intensive care unit and its associationwith infections in infants. Am J Infect Control 2012;40:512-5.
5. Hota B, Blom DW, Lyle EA, Weinstein RA, Hayden MK. Interventional evalua-tion of environmental contamination by vancomycin-resistant enterococci:failure of personnel, product or procedure? J Hosp Infect 2009;71:123-31.
6. Muzslay M, Moore G, Turton JF, Wilson AP. Dissemination of antibiotic-resistant enterococci within the ward environment: the role of airborne bac-teria and the risk posed by unrecognized carriers. Am J Infect Control 2013;41:57-60.
7. Bhalla A, Pultz NJ, Gries DM, Ray AJ, Eckstein EC, Aron DC, et al. Acquisition ofnosocomial pathogens on hands after contact with environmental surfacesnear hospitalized patients. Infect Control Hosp Epidemiol 2004;25:164-7.
8. Moore G, Muzslay M, Wilson AP. The type, level and distribution of microor-ganisms within the ward environment: a zonal analysis of an intensive careunit and a gastrointestinal surgical ward. Infect Control Hosp Epidemiol 2013;34:500-6.
9. Huslage K, Rutala WA, Gergen MF. Sickbert-Bennett EE, Weber DJ. Microbialassessment of high-, medium-, and low-touch hospital room surfaces. InfectControl Hosp Epidemiol 2013;34:211-2.
10. Anderson RE, Young V, Stewart M, Robertson C, Dancer SJ. Cleanliness audit ofclinical surfaces and equipment: who cleans what? J Hosp Infect 2011;78:178-81.
11. Skally M, Duffy F, Burns K, Doyle D, Foley S, Thomas T, et al. What may belurking in the hospital undergrowth? Inapparent cross-transmission ofextended-spectrum beta-lactamaseeproducing Klebsiella pneumoniae. J HospInfect 2014;88:156-61.
12. Judge C, Galvin S, Burke L, Thomas T, Humphreys H, Fitzgerald-Hughes D.Search and you will find: detecting extended-spectrum ß-lactamaseeproducing Klebsiella pneumoniae from a patient’s immediate environment.Infect Control Hosp Epidemiol 2013;34:534-6.
13. Griffith CJ, Cooper RA, Gilmore J, Davies C, Lewis M. An evaluation of hospitalcleaning regimes and standards. J Hosp Infect 2000;45:19-28.
14. Aiken ZA, Wilson M, Pratten J. Evaluation of ATP bioluminescence assays forpotential use in a hospital setting. Infect Control Hosp Epidemiol 2011;32:507-9.
15. Whiteley GS, Derry C, Glasbey T. The comparative performance of three brandsof portable ATP-bioluminometer intended for use in hospital infection control.Healthcare Infect 2012;17:91-7.
16. Sciortino CV, Giles RA. Validation and comparison of three adenosinetriphosphate luminometers for monitoring hospital surface sanitization: aRosetta stone for adenosine triphosphate testing. Am J Infect Control 2012;40:e233-9.
17. Gibbs SG, Sayles H, Chaika O, Hewlett A, Colbert EM, Smith PW. Evaluation ofthe relationship between ATP bioluminescence assay and the presence of or-ganisms associated with healthcare-associated infections. Healthcare Infect2014;19:101-7.
18. Moore G, Smyth D, Singleton J, Wilson P. The use of adenosine triphosphatebioluminescence to assess the efficacy of a modified cleaning programimplemented within an intensive care setting. Am J Infect Control 2010;38:617-22.
19. Boyce JM, Havill NL, Havill HL, Mangione E, Dumigan DG, Moore BA. Com-parison of fluorescent marker systems with 2 quantitative methods ofassessing terminal cleaning practices. Infect Control Hosp Epidemiol 2011;32:1187-93.
20. Whiteley GS, Derry C, Glasbey T. Sampling plans for use of rapid adenosinetriphosphate (ATP) monitoring must overcome variability or suffer statisticalinvalidity. Infect Control Hosp Epidemiol 2015;36:236-7.
21. Andersen BM, Rasch M, Kvist J, Tollefson T, Lukkassen R, Sandvik L, et al. Floorcleaning: effect on bacteria and organic materials in hospital rooms. J HospInfect 2009;71:57-65.
22. Lewis T, Griffith C, Galo M, Weinbren M. A modified ATP benchmark forevaluating the cleaning of some hospital environmental surfaces. J Hosp Infect2008;69:156-63.
23. Colbert EM, Gibbs SG, Schmid KK, High R, Lowe JJ, Chaika O, et al. Evaluation ofadenosine triphosphate (ATP) bioluminescence assay to confirm surfacedisinfection of biological indicators with vaporized hydrogen peroxide (VHP).Healthcare Infect 2015;20:16-22.
24. Whiteley GS, Derry C, Glasbey T. Failure analysis in the identification of syn-ergies between cleaning monitoring methods. Am J Infect Control 2015;43:147-53.
25. Carling PC, Parry MM, Rupp ME, Po JL, Dick B, Von Beheren S. Improvingcleaning of the environment surrounding patients in 36 acute care hospitals.Infect Control Hosp Epidemiol 2008;29:1035-41.
26. Corbella X, Pujol M, Argerich MJ, Ayats J, Sendra M, Peña C, et al. Environmentalsampling of Acinetobacter baumannii: moistened swabs versus moistenedsterile gauze pads. Infect Control Hosp Epidemiol 1999;20:458-60.
27. Armitage P, Berry G. Statistical methods in medical research. 3rd ed. Oxford,UK: Blackwell Science; 1996.

G.S. Whiteley et al. / American Journal of Infection Control 43 (2015) 1270-5 1275
28. Whiteley GS, Derry C, Glasbey T, Fahey P. The perennial problem of variabilityin adenosine triphosphate (ATP) tests for hygiene monitoring within health-care settings. Infect Control Hosp Epidemiol 2015;36:658-63.
29. Harbarth S. What can we learn from each other in infection control? Experi-ence in Europe compared with the USA. J Hosp Infect 2013;83:173-84.
30. Mitchell BG, Wilson F, Dancer SJ, McGregor A. Methods to evaluate envi-ronmental cleanliness in healthcare facilities. Healthcare Infect 2013;18:22-30.
31. International Sanitary Suppliers Association. ISSA Clean Standard 0714e2014:measuring the cleanliness of K-12 schools. Lincolnwood, [IL]: InternationalSanitary Suppliers Association.
32. Mulvey D, Redding P, Robertson C, Woodall C, Kingsmore P, Bedwell D, et al.Finding a benchmark for monitoring hospital cleanliness. J Hosp Infect 2011;77:25-30.
33. Hand Hygiene Australia. National data period one, 2015. Available from: http://www.hha.org.au/LatestNationalData.aspx. Accessed May 1, 2015.

113
Section Three
Appendixes
Appendix A
Other papers published as part of the PhD study
Appendix B
Posters presented as part of the PhD study

114
Appendix A
Other papers published as part of the PhD study
A1 Letter to the editor: The importance of stakeholder consultation for infection control guidelines: Healthcare Infection: 2009:14:9
A2 Letter to the editor: Flawed recommendations on surface hygiene within the existing Interim Influenza Pandemic National Infection Control Guidelines: Healthcare Infection: 2009:14:177-179
A3 Letter to the editor and reply:
Letter: Whiteley GS et al. Sampling plans for the use of rapid adenosine triphosphate (ATP) monitoring must overcome variability or suffer statistical invalidity: Infect Control Hosp Epidemiol: 2015:36:236-237 Reply to Whiteley: Infect Control Hosp Epidemiol: 2015:36:237-238
A4 Letter to the editor and reply:
Letter: Roady L: The role of ATP luminometers in infection control: Infect Control Hosp Epidemiol: 2015:36:1367 Reply to Roady: Infect Control Hosp Epidemiol: 2015:36:1368

115
Appendix A1
Letter to the editor
The importance of stakeholder consultation for infection control guidelines

Letter to the editorThe importance of stakeholder consultationfor infection control guidelines
Trevor Glasbey1,3 BSc (Hons), PhD
Greg S Whiteley2 BSc (Appl), M SafetyScience
1Whiteley Corporation Pty Ltd, 19–23 Laverick Avenue, Tomago,NSW 2322, Australia.2Whiteley Corporation Pty Ltd, Suite 501, Level 5, 12Mount Street,North Sydney, NSW 2060, Australia.3Corresponding author. Email: [email protected]
We write regarding the Australian Infection Control Guidelines
(AICG), last published in 2004 andnow locatable on theAustralian
Government website at http://www.health.gov.au/internet/
main/publishing.nsf/Content/icg-guidelines-index.htm
When the AICG were first published the then process was that
there were several working drafts circulated to all of the
stakeholders for consultation.When one visits the website version
of the AICG, the face sheet is the same, the publication date is
indicated as 2004, and even the index is the same.
However, if one has a copy of the original printed version, once
you get into the body of the document you will find significant
differences. The website indicates that some amendments have
been made in December 2007, however, without a comparison
copy the extent and nature of these changes is not obvious. We
highlight three unacceptable changes in the internet version.
First, is the recommendation of the use of anionic detergents
in the chapter on prions and related diseases (Chapter 31). In the
original there were only two references to anionic detergents
for cleaning. However, an investigation of the revised chapter
on prions repeatedly and widely indicates the use of anionic
detergents for pre-cleaning of potentially contaminated
instruments. The recommendations are unreferenced and
contradict the literature, which is confused at best about anionic
detergents as a mandated step. We cannot determine where
the original reference arose.
Second, the revision of a single section has introduced somemajor
contradictions. For example, section 31.3.3 of the current (2007)
version states “instruments potentially contaminatedwith higher-
infectivity tissue should be immersed in a dedicated container in
sterile water until they are reprocessed”, which contradicts the
discussion point in an earlier section (16.3.4), which states
“Instruments potentially contaminatedwith CJD agents should be
kept immersed in a dedicated container in an anionic detergent
solution, at ambient temperature, until they are manually cleaned
and reprocessed using the methods shown in Table 31.9”.
Third, is the recommendation in the same chapter for the use
of ultrasonic cleaning machines for cleaning potentially
contaminated instruments. This represents an infection risk due to
the creation of aerosolised particles above the liquid phase.
No safety instructions are given and the recommendation is not
referenced (and is in fact in contradictionwith advice given earlier
in section 16.3.4).
In summary, the new amendments have not been subject to
widespread consultation. This is in contravention of official
government policy and the Council of Australian Government
(COAG) Principles. The errors contained in the document might
increase risks for health care workers. This is a good example of
why consultation among all of the stakeholders is always a good
plan for a guidelines document of this nature.
Conflicts of interest
Whiteley Corporation manufacturer a range of cleaning,
decontaminating and disinfecting products for reuseable medical
devices and hospital surfaces.
Healthcare Infection 2009; 14: 9Healthcare Infection 2009; 14: 9
9� Australian Infection Control Association 2009 DOI: 10.1071/HI09002

117
Appendix A2
Letter to the editor
Flawed recommendations on surface hygiene within the existing Interim Influenza Pandemic National
Infection Control Guidelines

Flawed recommendations on surface hygienewithin the existing Interim Influenza PandemicNational Infection Control GuidelinesGreg Whiteley1,3 MSafety Sc, BAppSc
Trevor Glasbey2 PhD, BSc (Hons)
1Whiteley Corporation, Suite 501, Level 5, 12 Mount Street, North Sydney, NSW 2060, Australia.2Whiteley Corporation, 19-23 Laverick Avenue, Tomago, NSW 2322, Australia.3Corresponding author. Email: [email protected]
Abstract
The Interim Infection Control Guidelines for Pandemic Influenza in Healthcare and Community Settings, published by the Australian
Commonwealth Government in 2006, have been reviewed and found to contain recommendations that, if they were made by a private
organisation, would be potentially illegal under the Therapeutic Goods Act 1989, and also raise some concern in relation to occupational
health and safety. The guidelines also fail to recommend the use of disinfecting productswith specific claims relating to influenza virus that
have been approved by the Therapeutic Goods Agency.
In 1996, the Australian Government through the gazetting of
Therapeutic Goods Order Number 54, 1996 (as amended),
introduced a range of controls over the disinfectant market in
Australia. During the following year, all states of the
Commonwealth formally ceded their powers in this area to the
Australian Government. The Therapeutic Goods Administration
(TGA) administers the regulatory scheme, which was augmented
in 2002 with the Medical Devices Regulations (2002) to cover not
just the higher risk products under a uniform international
scheme, but also to bring under control even the cleaning products
intended for use within healthcare. The TGA, through a range of
instruments, also controls the label claims of all products in this
category, and for any of the products intended for use exclusively
within healthcare, this is a pre-market scheme. In practice, this
means that any therapeutic claims (such as efficacy in disinfection
of, for example, influenza virus) are required to be approvedby the
TGA, and that in order to gain TGA approval, the manufacturer is
required to submit fully validated test data for review. It is
therefore particularly strange that the Australian Guidelines for
Infection Control within the context of an influenza pandemic1 do
not even mention the TGA as the regulator of therapeutic goods.
The recommendations contained within these guidelines for
surface disinfection focus generically on alcohol and chlorine as
active materials. There are four areas of concern over the
recommendations as they are currently framed. The affirmation of
these guidelines by distinguished authors2 lends weight to the
opinions expressed within the guidelines, but fails to address the
legal requirements of the Therapeutic Goods Act or allow for a
hierarchy of control so important in managing risk, and
particularly risk in occupational safety.3
First, there is the equity problem of unqualified recommendation
of products by brand name within the official interim guidelines
where the opportunity of consideration of legal alternatives is not
provided. The products named are chlorine-based disinfectants
without any specific approved claims (e.g. for killing of the
influenza virus on surfaces). The most galling situation is the
specific recommendations superimposed, wherein information is
provided by the guidelines which if repeated by the companies
involvedwould be strictly illegal under the Therapeutic Good Act
1989. These guidelines as they stand are very good for the
company named, but deny equity to all other companies, even
when some other companies have products registered and
accepted to kill influenza virus, information that the named
products do not have on their official labels.
Second, while the strengths recommended for disinfection
(1000ppm or 0.1%) would not be classifiable as hazardous under
the Australian Occupational Health and Safety regulations,4 such
solutions are not available off the shelf. In the case of liquid
chlorine, the actual disinfectant solution will be prepared by
dilution of a significantly higher concentration solution. Such
solutions are highly corrosive and classifiable as both a hazardous
substance and a dangerous good under Australian Occupational
Health and Safety regulations. Sodium hypochlorite solutions are
also notoriously unstable with respect to loss of active chlorine,
and therefore ameansof analysing for active chlorine is essential to
ensure a correct working dilution.
Solid chlorine (sodium dichloroisocyanurate), although more
stable than liquid chlorine, is also ahazardous substance (irritating
Healthcare Infection 2009; 14: 177–179Healthcare Infection 2009; 14: 177–179
177� Australian Infection Control Association 2009 DOI: 10.1071/HI09016

to skin and eyes, and the respiratory system). It is also a powerful
oxidising agent (classified under theAustralian Dangerous Goods
Code as a class 5.1 oxidising agent). There is therefore aworkplace
requirement5 to segregate this material from certain other
dangerous goods (e.g. class 3 flammable liquids such as alcohol).
By contrast, many hospital grade disinfectants with TGA
approved claims relating to influenza are not classifiable as
hazardous substances or dangerous goods.
Third, the recommendation for use only of chlorine-based
disinfectant, at 1000-times the strength of what is used in
swimming pools, is completely impractical. During a pandemic,
the need for surface disinfection is not limited to clinical areas. For
example, a patientwaiting roomwill be amixed environmentwith
fabrics, carpet, magazines, chairs and other objects that may
become contaminated by droplets or fomites from a coughing and
sneezing viremic patient. The use of chlorine-based disinfectants
may also affect safety measures such as the fire resistance of
upholstery.6 Clearly, the inexpensive option of a chlorine-based
solution will be likely to lead to damage that far outweighs the
initial cost of purchase. This is so unnecessary when there are
products registered to kill influenza virus on surfaces, which are
not corrosive, are non-staining and are safe to use when used as
directed on the approved label.
Fourth, the unpleasantness and impracticality associated with use
of chlorine products at this strength will likely also lead to
incorrect, insufficient or inappropriate non-use. This elevates the
recommendations to the level of the absurd. It is humannature that
unpleasant tasks are avoided. The problems with hand washing
compliance are a case in point. Widespread non-compliance with
the recommendations will almost certainly lead to the
psychological phenomenon known as ‘normalised deviance’ and
in fact raise the risk of transmission via contaminated inanimate
surfaces.
Readers should be aware that this is not at all a fanciful problem, as
evidenced by the findings on the last two major pandemics that
affected Australians. (i) SARS, involving a coronavirus, was
spread and its virulence increased via inanimate surface spread.7,8
(ii) The 2007 outbreak of equine influenza occurred primarily due
to a breakdown in surface disinfection within the quarantine
process, which saw the virus escape quarantine via inanimate
objects taken out of quarantine by humans and then infect other
horses.9 The Honorable Ian Callinan, who led the Commission of
Inquiry into the Equine Influenza outbreak, said about the
outbreak:
‘I find that the most likely way that the virus entered the
general horse population is by its escape from infected
horses at EasternCreekQuarantine Station on contaminated
person or persons or equipment leaving the Quarantine
Station and coming into contact with a horse.’9
The current Interim Infection Control Guidelines for Pandemic
Influenza in Healthcare and Community Settings (2006) make the
point that the human influenza virus does remain viable on
surfaces for up to 48 h.
The problems that have arisen in the guidelines could have easily
been avoided through a consultation process in accordance
with the accepted Council of Australian Governments
recommendations. A consultation process with the stakeholders
involved in this sector would have pointed the authors back to
legislative process and included the correct references to the
regulator. The corrections are quite simple.
Recommendations
(1) Remove all reference to company brand names.
(2) Recommend use of only TGA approved hospital grade
disinfectants with label claims noted against influenza virus
on surfaces.
(3) Refer inquirers with questions on specific products to the
online portal for the Australian Register of Therapeutic Goods
for information regarding the general approval status of
products being recommended by category.
At the present time, the Australian Infection Control Guidelines
are undergoing amajor revision by theAustralian Commission on
Safety and Quality in Health Care, and this revision offers an
opportunity to bring the Australian Infection Control Guidelines
in line with not only global best practice, but with Australian
Therapeutic Goods legislation. In this respect, it is perhaps
advisable to include both regulators and industry representatives
alongside clinicians while drafting such guidelines. It is also
highly recommended that all guidelines shouldbe reviewedby the
relevant governmental agencies for compliance with existing and
upcoming legislation.
References
1. Australian Government Department of Health and Ageing. Interiminfection control guidelines for pandemic influenza in healthcare andcommunity settings (June 2006). Canberra: Commonwealth ofAustralia; 2006.
2. Collignon PJ, Carnie JA. Infection control and pandemic influenzaMed J Aust 2006; 185: S54–7.
3. Australian Government. National code of practice for the control ofworkplace hazardous substances: National Occupational Health andSafety Commission. Canberra: Commonwealth of Australia; 2007.
4. Australian Government. Approved criteria for classifying hazardoussubstances, [NOHSC:1008(2004)]. Canberra: Commonwealth ofAustralia; 2004.
5. WorkCover NSW. Storage and handling of dangerous goods, code ofpractice 2005. Gosford: WorkCover NSW; 2005.
Healthcare Infection G. Whiteley and T. Glasbey
178

6. Communicable Diseases Network Australia. Interim guidance foraircraft cleaningwhenH1N1 influenza 09 (human swine influenza) issuspected in a passenger or crewmember. Canberra: CommunicableDiseases Network Australia; 2009.
7. Health Department of Hong Kong. Investigation SARS. Summary offindings. Hong Kong: Health Department of Hong Kong; 2003.
8. Hong Kong Government Information Centre. Amoy gardensoutbreak case study. Hong Kong: Hong Kong GovernmentInformation Centre; 2004.
9. Callinan I. Equine influenza: the August 2007 outbreak in Australia.The report of the inquiry. Canberra: Commonwealth of Australia;2008.
Flawed recommendations on surface hygiene Healthcare InfectionFlawed recommendations on surface hygiene Healthcare Infection
179

121
Appendix A3
Letter to the editor and reply
Appendix A3.1
Letter: Whiteley GS et al.
Sampling plans for the use of rapid adenosine
triphosphate (ATP) monitoring must overcome
variability or suffer statistical invalidity
Appendix A3.2
Reply to Whiteley

acknowledgments
Financial support. This clinical study was performed at the Robley RexDepartment of Veterans Affairs Medical Center, Louisville, KY, as part of ourAntimicrobial Stewardship Program. All authors report no conflicts of interestrelevant to this article.
Carmen V. Sciortino, PhD;1,2
Mary Kemper, PhD, ASCP;1
Latha Parthasarathy, PhD, ASCP;1
James Lay, BS, MT, ASCP1
Affiliations: 1. Robley Rex Veterans Medical Center, Louisville, Kentucky;2. Division of Infectious Diseases, University of Louisville, School of Medi-cine, Louisville, Kentucky.
Address correspondence to Carmen Sciortino, PhD, Robley Rex VeteransMedical Center, Pathology and Laboratory Medicine (113), 800 Zorn Avenue,Louisville, KY 40206 ([email protected]).
Infect Control Hosp Epidemiol 2015;36(2):235–236© 2014 by The Society for Healthcare Epidemiology of America. All rightsreserved. 0899-823X/2015/3602-0019. DOI: 10.1017/ice.2014.10
references
1. Bactroban (mupirocin calcium ointment, 2%) nasal packageinsert. Research Triangle Park, NC; GlaxoSmithKline; 2009 Apr.
2. Anderson DJ, Podgorny K, Berríos-Torres SI, et al. Strategies toprevent surgical site infections in acute care hospitals:2014 update. Infect Control Hosp Epidemiol 2014;35:605–627.
3. Bratzler DW, Dellinger ED, Olsen KM, et al. Clinical practiceguidelines for antimicrobial prophylaxis in surgery. Am J Health-Syst Pharm 2013;70:195–283.
4. Vasquez JE, Walker ES, Franzus BW, Overbay BK, Reagan DR,Sarubbi FA. The epidemiology of mupirocin resistance amongmethicillin-resistant Staphylococcus aureus at a Veterans’ Affairshospital. Infect Control Hosp Epidemiol 2000;21:459–464.
5. Babu T, Rekasius V, Parada JP, Schreckenberger P, Challapalli M.Mupirocin resistance among methicillin-resistant Staphylococcus
aureus–colonized patients at admission to a tertiary care medicalcenter. J Clin Microbiol 2009;47:2279–2280.
6. Patel JB, Gorwitz RJ, Jernigan JA. Mupirocin resistance. ClinInfect Dis 2009;49:935–941.
7. Miller MA, Dascal A, Portnoy J, Mendelson J. Development ofmupirocin resistance among methicillin-resistant Staphylococcusaureus after widespread use of nasal mupirocin ointment. InfectControl Hosp Epidemiol 1996;17:811–813.
8. Bode L, Kluytmans J, Wertheim H, et al. Preventing surgical-siteinfections in nasal carriers of Staphylococcus aureus. N Engl J Med2010;362:9–17.
Sampling Plans for Use of Rapid AdenosineTriphosphate (ATP) Monitoring MustOvercome Variability or Suffer StatisticalInvalidity
Reply to Visrodia
To the Editor—We write with respect to the article by Visrodiaet al.1 on using a commercial rapid adenosine triphosphate(ATP) device for validation of cleaning of flexible gastro-endoscopes. The importance of timeliness in quality assurancetesting in this device area is critical owing to the time pressureson the use of the gastroendoscopes by clinical staff involved inpatient care. The work is a useful additional contribution tothis growing field of use for ATP devices.2
Nonetheless, we highlight concerns with 2 aspects of themethod adopted within the work by Visrodia et al.1 First, thiswork, like earlier references, utilizes only a single brand ofrapid ATP device with acknowledged manufacturer support.The recommendations on “validated” relative light units(RLU) are entirely device specific and exclude other com-mercial devices. And, whilst the ATP/RLU readings in Visrodiaet al.1 may seem dramatic (some > 100,000 RLU), the worklacks evaluation of microbial presence that could anchor thestudy against a quantitated standard.3
Second, the work does not address any of the major pub-lished criticisms of the use of ATP systems as they are currentlyconfigured. Several authors have commented on the dangers ofoverstating the usefulness of these commercial ATP devices,the risks of alternative sources of ATP, the lack of correlationwith specific pathogens of concern, the amount of ATP presentwithin any particular cells or bacterial species, and the mea-surement variability that undermines statistical measuresapplied to the research.4–7
In this regard, and of specific concern in terms of methodin Visrodia et al.,1 is the way that ATP measurements andsamples were obtained—for example, samples from the brushand flush sampling were divided into only 2 parts, with onepart apparently used for a single ATP test and the otherpart tested for protein residues. The entire sample set of
0.063
0.113
0.163
0.213
0.263
0.313
0.363
0.413
0.463
0.513
0.563
Combined Group 1 Group 2
Mu
pir
oci
n M
inim
um
Inh
ibit
ory
Co
nce
ntr
atio
n
Subgroups
figure 1. Box-and-whisker chart of mupirocin-susceptible,methicillin-resistant S. aureus isolates. Left to right: combinedgroups 1 and 2; group 1, tissue isolates; group 2, nares isolates.
236 infection control & hospital epidemiology february 2015, vol. 36, no. 2

ATP testing appears to be without duplicates or preferablytriplicate testing. Reliance by Visrodia et al.1 upon thesample means of groups of singular ATP readings is under-mined by the knowledge of variability where the standarddeviation can be as high as 40% of the data mean for the indivi-dual brand of device used.8 The authors themselves note the riskof singular testing in the body of the discussion: “to sample morethan one… and to use more than 1 rapid indicator,” but wewonder how the statistical assumptions hold valid without mul-tiple (replicate) samples taken for the ATP testing.
We also note 2 problems with the scaling of all commercialATP devices. First, the scale of RLU is completely relative andcannot be used interoperatively between differently brandeddevices.2,3 Second, the variability for each of the brands is so highthat without a sampling approach that accounts for multiplesamples at any one point, the ability of the scientists involved tomeaningfully apply statistical methods renders the article subjectto first principle flaws.9 Reporting the RLU readings on a logscale is not the same as taking multiple samples, identifying themedian value, and then log plotting the data. Perhaps this wasdone, but it remains unclear within the text.
We feel obliged to inform those who may be reliant uponthe work to take care in not applying the work using one brandof ATP device to another brand of ATP device, as noted inthe commentary by Petersen.10 Likewise, we caution againstrelying on the statistical positioning in the field use of ATPwithout an appropriately constructed sampling plan toaccount for inherent variability. This overlay of concern willcontinue to apply until all ATP device manufacturers can agreeto a commonly applicable scale that minimizes the impactof variability, no matter what the assignation given to thereplacement reading scale.
acknowledgments
Financial support. None reported.Potential conflicts of interest. All authors report no conflicts of interest rele-
vant to this article.
Greg S. Whiteley, MSafetySc;1,2
Chris Derry, MSc(Med);1
Trevor Glasbey, PhD2
Affiliations: 1. University of Western Sydney, New South Wales, Australia;2. Whiteley Corporation Pty, North Sydney, New South Wales, Australia
Address correspondence to Greg S. Whiteley, MSafetySc, PO Box 1076,North Sydney, New South Wales 2060, Australia ([email protected])
Received: September 23, 2014; Accepted: September 29, 2014.Infect Control Hosp Epidemiol 2015;36(2):236–237© 2014 by The Society for Healthcare Epidemiology of America. All rightsreserved. 0899-823X/2015/3602-0020. DOI: 10.1017/ice.2014.24
references
1. Visrodia KH, Ofstead CL, Yellin HL, Wetzler HP, Tosh PK,Baron TH. The use of rapid indicators for the detection of organic
residues on clinically used gastrointestinal endoscopes with andwithout visually apparent debris. Infect Control Hosp Epidemiol2014;35:987–994.
2. Alfa MJ, Fatima I, Olson N. The adenosine triphosphate testis a rapid and reliable audit tool to assess manual cleaningadequacy of flexible endoscope channels. Am J Infect Control2013;41:249–253.
3. Sciortino CV, Giles RA. Validation and comparison of threeadenosine triphosphate luminometers for monitoring hospitalsurface sanitization: a Rosetta Stone for adenosine triphosphatetesting. Am J Infect Control 2013;40:e233–e239.
4. Malik DJ, Shama G. Estimating bacterial surface contaminationby means of ATP determinations: 20 pence short of a pound.J Hosp Infect 2012;80:354–356.
5. Shama G, Malik DJ. The uses and abuses of rapid bioluminescence-based ATP assays. Int J Hygiene Environ Health 2013;216:115–125.
6. Mulvey D, Redding P, Robertson C, Woodall C, Kingsmore P,Dancer SJ. Finding a benchmark for monitoring hospital clean-liness. J Hosp Infect 2011;77:25–30.
7. Whiteley GS, Derry C, Glasbey T. The comparative performanceof three brands of portable ATP-bioluminometer intendedfor use in hospital infection control. Healthcare Infect 2012;17:91–97.
8. Whiteley GS, Derry C, Glasbey T. Reliability testing for portableadenosine triphosphate bioluminometers. Infect Control HospEpidemiol 2013;34:538–540.
9. Lautenback E, Woeltje KF, Malani PN. Practical Healthcare Epide-miology, 3rd ed. Chicago, IL: University of Chicago Press; 2010.
10. Petersen BT. Monitoring endoscope reprocessing: accumulatingdata but best practices remain undefined. Infect Control HospEpidemiol 2014;35:995–997.
Reply to Whiteley et al
To the Editor—We appreciate the commentary byWhiteley et al1
on our study in which several rapid indicators were used todetect residual contamination in gastrointestinal endoscopesfollowing manual cleaning.2 The authors raise several concernsabout an adenosine triphosphate (ATP) measuring device usedin our study, including our use of a single commercially availableATP device, our reliance on only 1 ATP test per componentsampled, possible variability in ATP results, and the inability ofATP monitors to identify specific microbes or quantify colonycounts.1 Indeed, rapid indicator testing in endoscope reproces-sing is a relatively new arena, and more research is undoubtedlyneeded to evaluate the utility of various devices and determinethe association between residual organic debris, viable microbes,and patient outcomes.Our study was a small pilot project designed to evaluate
materials and methods that could be used to assess endoscopecleaning effectiveness. At that time, we sought to determinewhether the recommended practice of visual inspection was anadequate standard for verifying whether manual cleaning had
letters to the editor 237

sufficiently removed residual contamination prior to exposingendoscopes to high-level disinfection.3,4 In addition to inspectingeach component and the sampling materials for visually appar-ent evidence of residual contamination, our team conductedrapid indicator tests for blood, protein, and ATP. Multipletypes of rapid indicators were used in order to assess variousapproaches for monitoring cleaning effectiveness and to com-pare their results. In summary, we found2 that endoscopeswith and without visually apparent debris had levels of blood,protein, and ATP exceeding previously validated benchmarks.5,6
Although high ATP levels may indicate the presence of viablemicrobes,7,8 such results could also reflect the presence of bloodor other types of cells.9 Indeed, we found ATP levels were quitehigh in every sample that also tested positive for blood.
As noted by Whiteley et al1 and acknowledged in thelimitations section of our article, we did not include theperformance of microbial cultures, because the goal was toevaluate multiple rapid indicators and sample collectionmethods. Furthermore, the value of conducting microbialcultures prior to high-level disinfection seems limited. In asubsequent study conducted by our team (as yet unpublished)we used microbial cultures as one of the indicators ofendoscope reprocessing effectiveness.
The main goal of our study was to identify user-friendlymaterials and methods that could be used to evaluate manualcleaning effectiveness in the clinical setting. The chosen ATPmonitoring system provided a numerical result reflecting theamount of ATP present. We found this to be superior to mon-itoring systems that measure residual protein or blood, whichrequire users to interpret color changes on swabs or dipsticks.
Given the imperative for cost containment and to improveefficiencies on the front lines, we believe it would not bedesirable to perform duplicate or triplicate testing as suggestedby Whiteley et al.1 Their concern about variability within andbetween ATP measuring devices deserves additional study.However, we found that post–manual cleaning ATP and pro-tein levels far exceeded benchmarks for manually cleanedendoscopes and perhaps are less likely to be affected by thedegree of variability cited.
Quality assurance in endoscope reprocessing is needed, andrapid indicator testing is an area of growing interest andunderstanding. ATP testing offers potential, but given itsrelatively recent application to this field, additional research isnecessary to better define its role.
acknowledgments
We thank Evan Doyle, BS, and Otis Heymann, BA, for their editorialassistance.
Financial support. C.L.O. reports that she is employed by Ofstead &Associates, which has received research funding and speaking honoraria rela-ted to infection prevention from 3M Company, Medivators, Boston ScientificCorporation, invendo medical, Steris, Johnson & Johnson, and Ecolab. H.P.W.reports that he is employed by Ofstead & Associates.
Potential conflicts of interest. 3M Company provided funding and materialsto Ofstead & Associates for the study discussed in the Commentary (to which
this letter replies). 3M Company did not have access to any study data and wasnot involved in the preparation of this letter. Additional research support wasprovided by Mayo Clinic and Ofstead & Associates. Neither the physiciansat Mayo Clinic (K.H.V., P.K.T.) or University of North Carolina (T.H.B)nor their departments received monetary compensation for participatingin the study.
Kavel H. Visrodia, MD;1
Cori L. Ofstead, MSPH;2,3
Harry P. Wetzler, MD, MSPH;2
Pritish K. Tosh, MD;3
Todd H. Baron, MD4
Affiliations: 1. Department of Internal Medicine, Mayo Clinic, Rochester,Minnesota; 2. Ofstead & Associates, Saint Paul, Minnesota; 3. Divisionof Infectious Diseases, Mayo Clinic, Rochester, Minnesota; 4. Division ofGastroenterology and Hepatology, University of North Carolina School ofMedicine, Chapel Hill, North Carolina.Address correspondence to Cori L. Ofstead, MSPH, Ofstead & Associates,
400 Selby Ave., Suite V, Blair Arcade West, Saint Paul, MN 55102([email protected]).
Infect Control Hosp Epidemiol 2015;36(2):237–238© 2014 by The Society for Healthcare Epidemiology of America. All rightsreserved. 0899-823X/2015/3602-0021. DOI: 10.1017/ice.2014.57
references
1. Whiteley GS, Derry C, Glasbey T. Sampling plans for use ofrapid adenosine triphosphate (ATP) monitoring must overcomevariability or suffer statistical invalidity. Infect Control HospEpidemiol 2014; doi: 10.1017/ice.2014.24.
2. Visrodia KH, Ofstead CL, Yellin HL, Wetzler HP, Tosh PK, BaronTH. The use of rapid indicators for the detection of organic resi-dues on clinically used gastrointestinal endoscopes with andwithout visually apparent debris. Infect Control Hosp Epidemiol2014;35:987–994.
3. Society of Gastroenterology Nurses and Associates. SGNA Stan-dards: standards of infection control in reprocessing of flexiblegastrointestinal endoscopes. Gastroenterol Nurs 2010;33:70–80.
4. Rutala WA, Weber DJ; Healthcare Infection Control PracticesAdvisory Committee (HICPAC). Guideline for disinfection andsterilization in healthcare facilities, 2008. Atlanta: Centers forDisease Control and Prevention; 2008.
5. Alfa MJ, Fatima I, Olson N. Validation of adenosine triphosphateto audit manual cleaning of flexible endoscope channels. Am JInfect Control 2013;41:245–248.
6. Alfa MJ, Degagne P, Olson N. Worst-case soiling levels for patient-used flexible endoscopes before and after cleaning. Am J InfectControl 1999;27:392–401.
7. Hansen D, Benner D, Hilgenhoner M, Leisebein T, Brauksiepe A,Popp W. ATP measurement as method to monitor thequality of reprocessing flexible endoscopes. Ger Med Sci 2004;2:Doc04.
8. Fushimi R, Takashina M, Yoshikawa H, et al. Comparison ofadenosine triphosphate, microbiological load, and residual proteinas indicators for assessing the cleanliness of flexible gastrointestinalendoscopes. Am J Infect Control 2013;41:161–164.
9. Turner DE, Daugherity EK, Altier C, Maurer KJ. Efficacy andlimitations of an ATP-based monitoring system. J Am Assoc LabAnim Sci 2010;49:190–195.
238 infection control & hospital epidemiology february 2015, vol. 36, no. 2

125
Appendix A4
Letter to the editor and reply
Appendix A4.1 Letter: L Roady
The role of ATP luminometers in infection control
Appendix A4.2 Reply to Roady

l e t t e r s t o th e e d i t o r
The Role of ATP Luminometers in InfectionControl
To the Editor—I would like to caution readers on the interpreta-tion of the article by Whitely et al1 in this issue. This study, likemany before, makes themistake of assessing ATP luminometers asbacterial detection systems. Studies have demonstrated,2 andresponsible manufacturers will confirm, that there is not a 100%direct correlation between ATP and plate counts, so evaluatingan ATP system’s performance based on bacterial detection isan impractical assessment of the tool. For hospitals seeking tomonitor microbial cleanliness, the necessary testing method isconventional microbiology plating. ATP testing is not a substitutefor microbiology testing, and responsible ATP manufacturers donot make that claim. Furthermore, the author makes a hastyjudgment on the value of ATP systems: “The original suggestion touse rapid adenosine triphosphate (ATP) bioluminometers tomonitor surface hygiene has yet to see practical fulfillment amonghealthcare infection control and prevention practitioners.”
In reply, I direct readers to the abundant published evidenceto the contrary.3–8 ATP testing is designed to demonstratewhether cleaning regiments are working correctly and whethercleaning agents and techniques are working properly to removebiological contaminants such as blood, protein tissues, skin cells,etc., which can facilitate microbial growth. ATP testing plays akey role in training, process improvement, and ongoingmonitoring of overall hospital cleanliness. There is undeniableand plentiful evidence that monitoring cleaning with an objec-tive tool like ATP testing improves cleaning thoroughness,improves staff training, and optimizes cleaning regiments. Infact, ATP testing has been proposed as an acceptable method bythe Centers for Disease Control and Prevention (CDC) in theUnited States and accepted as a national standard by Danishgovernment. The benefits of ATP are also recognized in the UKNational Health Service Healthcare Cleaning Manual (2009).
ATP testing has proven effective as an intervention tool over andover. In comparison to other proposed methods such as fluor-escent gel black light or visual inspection, ATP testing is the bestavailable option to monitor cleanliness other than microorganismtesting, which is impractical for the determination of roomcleanliness.9–11 ATP testing systems are the best available optionfor improving cleaning regiments, training employees, demon-strating effectiveness of cleaning agents, and improving hygiene inthe environment with the end goal of reducing the spread ofinfection. ATP systems play a very important and valuable role inoverall efforts to improve cleaning. Considering the purpose of theATP systems and additional studies cited, there is overwhelmingevidence that ATP testing is a very valuable aspect of cleaningmonitoring and improvement within healthcare industry.
acknowledgment
Potential conflict of interest. Lauren Roady, MBA, is Marketing Manager forHygiena, one of the ATP technology brands referenced in Whiteley, et al.1
Lauren Roady, MBA
Affiliation: Hygiena LLC, Camarillo, California.Address correspondence to Lauren Roady, MBA, Marketing Manager, Hygiena
LLC, 941 Avenida Acaso, Camarillo, CA 93012 ([email protected]).Infect. Control Hosp. Epidemiol. 2015;36(11):1367–1367© 2015 by The Society for Healthcare Epidemiology of America. All rightsreserved. 0899-823X/2015/3611-0023. DOI: 10.1017/ice.2015.209
references
1. Whiteley GS, Derry C, Glasbey T, Fahey P. The perennialproblem of variability in adenosine triphosphate (ATP) tests forhygiene monitoring within healthcare settings. Infect ControlHosp Epidemiol 2015;36:658–663.
2. Ayclcek H, Oguz U, Karci K. Comparison of results of ATPbioluminescence and traditional hygiene swabbing methods forthe determination of surface cleanliness at a hospital kitchen. Int JHyg Environ Health 2006;209:203–206.
3. Branch-Elliman W, Robillard E, McCarthy G Jr, Gupta K. Directfeedback with the ATP luminometer as a process improvementtool for terminal cleaning of patient rooms. Am J Infect Control2014;42:195–197.
4. Heathcote R, Stadelmann B. Measuring of ATP Bioluminescenceas a means of assessing washer disinfector performance andpotentially as a means of validating the decontamination process.Healthcare Infect 2009;14:147–151.
5. Bruno-Murtha LA, Fridman A, Osgood R. A quantitativeassessment of cleanliness in the operating room. Am J InfectControl 2014;42:S36.
6. Smith PW, Beam E, Sayles H, Rupp ME, Cavalieri RJ, Gibbs S,Hewlett A. Impact of adenosine triphosphate detection andfeedback on hospital room cleaning. Infect Control Hosp Epide-miol 2014;35:564–569.
7. Malik R, Cooper R, Griffith C. Use of audit tools to evaluate theefficacy of cleaning systems in hospitals. Am J Infect Control2003;31:181–187.
8. Willis C, Morley R, Westbury J, Greenwood M, Pallett A.Evaluation of ATP bioluminescence swabbing as a monitoringand training tool for effective hospital cleaning. J Infect Prev 2007;8:17–21.
9. Boyce JM, Havill NL, Havill HL, Mangione E, Dumigan DG,Moore BA. Comparison of fluorescent marker systems withtwo quantitative methods of assessing terminal cleaning practices.Infect Control Hosp Epidemiol 2011;32:1187–1193.
10. Carling P, Bartley J. Evaluating hygienic cleaning in health caresettings: what you do not know can harm your patients. Am JInfect Control 2010;38:S41–S50.
11. Mulvey D, Redding P, Robertson C, Woodall C, Kingsmore P,Bedwell D. Finding a benchmark for monitoring hospitalcleanliness. J Hosp Infect 2011;77:25–30.
infection control & hospital epidemiology november 2015, vol. 36, no. 11

Reply to Roady
To the Editor—We welcome the engagement and comments ofMs. Roady in response to our research article.1 We agree thatthe use of rapid ATP testing has a growing body of publishedsupport. However, the lack of common acceptance for rapidATP testing at this point in time is well expressed in the EPIC 3Guidelines (2014) from an expert committee in the UnitedKingdom.2
Unfortunately, Ms Roady somewhat misses the pointof our paper. In our study, we did not attempt to equate rapidATP testing with detection of bacterial contamination. Weshowed that the variability that occurs when measuringresponses to controlled quantitated microbial culturesis the same variability that occurs when controlled con-centrations of pure ATP solutions are measured. Theissue is therefore not correlation with detection but datavariability.
This variability is undetectable to ATP device users andapplies to all sources of detected ATP. The ATP variabilityproblem (ie, imprecision in results) that we have outlined inour most recent paper is common to each of the ATP devicebrands we tested. This finding does have implications forsampling methodology and analysis.3
We set out to validate several branded ATP devicesusing a standardized approach and focusing on precisionand accuracy.4 The first issue we encountered was uncon-trolled variability and the lack of precision at any testingpoint. The issue of accuracy is problematic because thescale of relative light units (RLU) is neither universallystandardized nor standardized among ATP devicesuppliers.
We welcome the engagement with the industry. We wouldlike to see better quality of results for ATP testing devices,including testing for precision and the development of acommon measurement scale. There remains a tremendousupside for ATP use once these issues are resolved.
acknowledgments
Potential conflicts of interest. None of the authors has any conflict of interest todeclare.
Greg S. Whiteley, M Safety Sc;1,2
Chris Derry, PhD;1,3
Trevor Glasbey, PhD;2
Paul Fahey, MMedStat4
Affiliation: 1. University of Western Sydney, School of Science and Health;2. Whiteley Corporation; 3. WHO Collaborating Centre for EnvironmentalHealth Development; 4. University of Western Sydney
Infect. Control Hosp. Epidemiol. 2015;36(11):1368–1368© 2015 by The Society for Healthcare Epidemiology of America. All rightsreserved. 0899-823X/2015/3611-0024. DOI: 10.1017/ice.2015.210
references
1. Whiteley GS, Derry C, Glasbey T, Fahey P. The perennialproblem of variability in adenosine triphosphate (ATP) tests forhygiene monitoring within healthcare settings. Infect Control HospEpidemiol 2015;36:658–663.
2. Loveday H, Wilson JA, Pratt RJ, Golsorkhi M, Tingle A, Bak A,Browne J, Prieto J, Wilcox M. EPIC 3 National Evidence BasedGuidelines for Preventing Healthcare-Associated Infections in NHSHospitals in England. J Hosp Infect 2014;86:Supplement 1.
3. Whiteley GS, Derry C, Glasbey T. Sampling plans for use ofrapid adenosine triphosphate (ATP) monitoring must overcomevariability or suffer statistical invalidity. Infect Control HospEpidemiol 2015;36:236–237.
4. International Conference on Harmonisation of TechnicalRequirements for Registration of Pharmaceuticals for Human Use.ICH Harmonised Tripartite Guideline for Validation of AnalyticalProcedures: Text and Methodology Q2(R1). ICH Guidelines 2008.
Infection Control Implications of ProtractedLengths of Stay With Noninfluenza ViralInfluenza-Like Illnesses in Hospitalized AdultsDuring the 2015 Influenza A (H3N2) Epidemic
To the Editor—Infection control (IC) precautions for hospi-talized adults with influenza consist of standard, contact, anddroplet precautions with single rooms recommended or withpatients cohorted, but guidelines for viral influenza-like ill-nesses (ILIs) are not standardized.1 During the January 2015influenza A (H3N2) epidemic in our location, the high volumeof patients with ILIs became problematic, creating a majorstrain on bed availability.In January 2015, a total of 54 adults were admitted with
influenza A (H3N2) and 37 adults were admitted with viral ILIsdiagnosed by multiplex polymerase chain reaction (PCR) assayof nasopharyngeal swab samples. Of the 54 influenza casepatients, 53 (98%) had influenza A (H3N2) and 1 (2%) hadinfluenza B. One patient had a dual-positive rapid influenzadiagnostic test for influenza A and influenza B, but PCR testingwas positive for influenza A (H3N2).
2–6
Of the 37 adults with viral ILIs, 16 (43%) had respiratorysyncytial virus (RSV), 10 (27%) had rhinovirus/enterovirus(R/E), 5 (14%) had human parainfluenza virus type 3(HPIV-3), 4 (11%) had human metapneumovirus (hMPV),and 2 (5%) had coronavirus (Table 1). Elderly patients, morecommonly admitted for viral ILIs, had longer LOS for viralILIs than for influenza. RSV patients were older (mean age,83 years), with LOS similar to that of influenza patients.Importantly, HPIV-3 patients had the longest LOS of any viralILI (mean, 19 days) and were more seriously ill, with 1 deathdue to HPIV-3 pneumonia. Two patients had co-colonization
1368 infection control & hospital epidemiology november 2015, vol. 36, no. 11

128
Appendix B
Posters presented as part of the PhD study
B1 The Importance of Practical Zero in cleaning performance indicators: IFIC Conference 2011
B2 Validation of cleaning indicators for healthcare surfaces: IFIC Conference
2011 B3 The problem of rapid ATP systems many be scaling using Relative Light
Units (RLU): HIS Conference 2014 B4 Evidence based cleaning and cleaning validation using FM and ATP systems:
HIS Conference 2014 B5 A new method for practical quality control in monitoring the cleaning of
healthcare surfaces: ASID Conference 2015
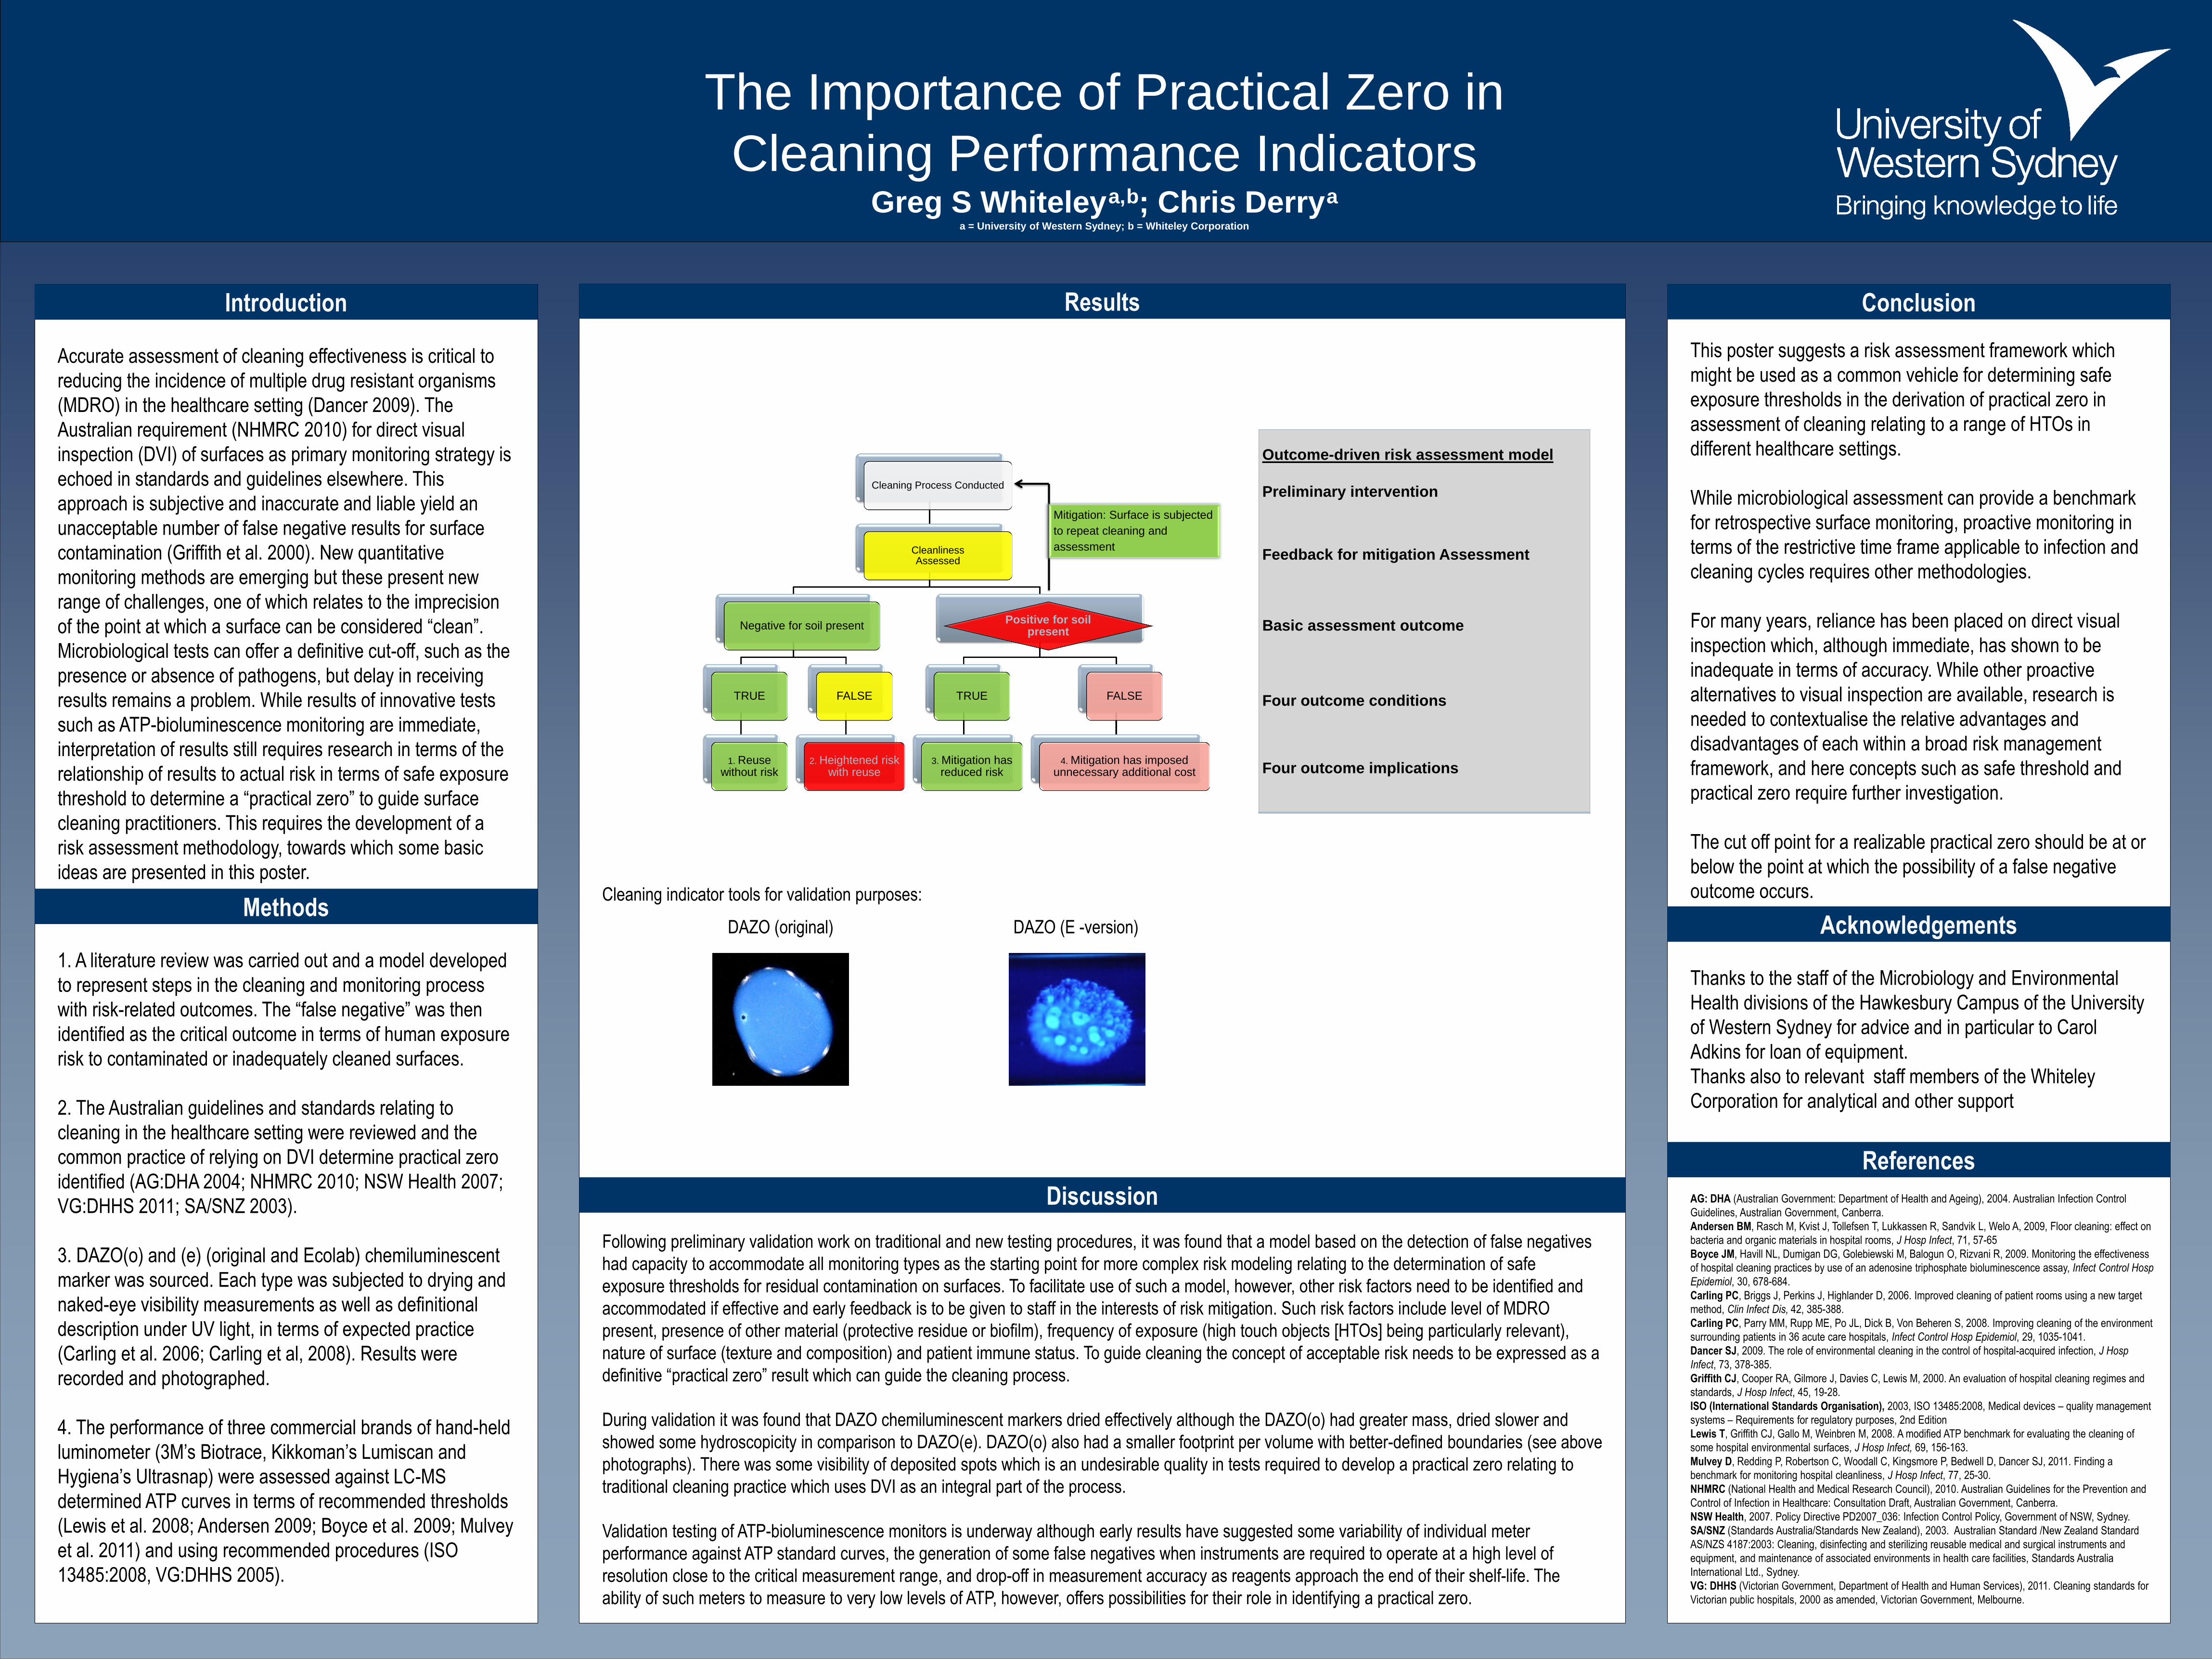
The Importance of Practical Zero in
Cleaning Performance Indicators Greg S Whiteley
a,
b; Chris Derry
a
a = University of Western Sydney; b = Whiteley Corporation
Introduction
Methods
Results
Discussion
Conclusion
Acknowledgements
References
AG: DHA (Australian Government: Department of Health and Ageing), 2004. Australian Infection Control
Guidelines, Australian Government, Canberra.
Andersen BM, Rasch M, Kvist J, Tollefsen T, Lukkassen R, Sandvik L, Welo A, 2009, Floor cleaning: effect on
bacteria and organic materials in hospital rooms, J Hosp Infect, 71, 57-65
Boyce JM, Havill NL, Dumigan DG, Golebiewski M, Balogun O, Rizvani R, 2009. Monitoring the effectiveness
of hospital cleaning practices by use of an adenosine triphosphate bioluminescence assay, Infect Control Hosp
Epidemiol, 30, 678-684.
Carling PC, Briggs J, Perkins J, Highlander D, 2006. Improved cleaning of patient rooms using a new target
method, Clin Infect Dis, 42, 385-388.
Carling PC, Parry MM, Rupp ME, Po JL, Dick B, Von Beheren S, 2008. Improving cleaning of the environment
surrounding patients in 36 acute care hospitals, Infect Control Hosp Epidemiol, 29, 1035-1041.
Dancer SJ, 2009. The role of environmental cleaning in the control of hospital-acquired infection, J Hosp
Infect, 73, 378-385.
Griffith CJ, Cooper RA, Gilmore J, Davies C, Lewis M, 2000. An evaluation of hospital cleaning regimes and
standards, J Hosp Infect, 45, 19-28.
ISO (International Standards Organisation), 2003, ISO 13485:2008, Medical devices – quality management
systems – Requirements for regulatory purposes, 2nd Edition
Lewis T, Griffith CJ, Gallo M, Weinbren M, 2008. A modified ATP benchmark for evaluating the cleaning of
some hospital environmental surfaces, J Hosp Infect, 69, 156-163.
Mulvey D, Redding P, Robertson C, Woodall C, Kingsmore P, Bedwell D, Dancer SJ, 2011. Finding a
benchmark for monitoring hospital cleanliness, J Hosp Infect, 77, 25-30.
NHMRC (National Health and Medical Research Council), 2010. Australian Guidelines for the Prevention and
Control of Infection in Healthcare: Consultation Draft, Australian Government, Canberra.
NSW Health, 2007. Policy Directive PD2007_036: Infection Control Policy, Government of NSW, Sydney.
SA/SNZ (Standards Australia/Standards New Zealand), 2003. Australian Standard /New Zealand Standard
AS/NZS 4187:2003: Cleaning, disinfecting and sterilizing reusable medical and surgical instruments and
equipment, and maintenance of associated environments in health care facilities, Standards Australia
International Ltd., Sydney.
VG: DHHS (Victorian Government, Department of Health and Human Services), 2011. Cleaning standards for
Victorian public hospitals, 2000 as amended, Victorian Government, Melbourne.
Accurate assessment of cleaning effectiveness is critical to
reducing the incidence of multiple drug resistant organisms
(MDRO) in the healthcare setting (Dancer 2009). The
Australian requirement (NHMRC 2010) for direct visual
inspection (DVI) of surfaces as primary monitoring strategy is
echoed in standards and guidelines elsewhere. This
approach is subjective and inaccurate and liable yield an
unacceptable number of false negative results for surface
contamination (Griffith et al. 2000). New quantitative
monitoring methods are emerging but these present new
range of challenges, one of which relates to the imprecision
of the point at which a surface can be considered “clean”.
Microbiological tests can offer a definitive cut-off, such as the
presence or absence of pathogens, but delay in receiving
results remains a problem. While results of innovative tests
such as ATP-bioluminescence monitoring are immediate,
interpretation of results still requires research in terms of the
relationship of results to actual risk in terms of safe exposure
threshold to determine a “practical zero” to guide surface
cleaning practitioners. This requires the development of a
risk assessment methodology, towards which some basic
ideas are presented in this poster.
1. A literature review was carried out and a model developed
to represent steps in the cleaning and monitoring process
with risk-related outcomes. The “false negative” was then
identified as the critical outcome in terms of human exposure
risk to contaminated or inadequately cleaned surfaces.
2. The Australian guidelines and standards relating to
cleaning in the healthcare setting were reviewed and the
common practice of relying on DVI determine practical zero
identified (AG:DHA 2004; NHMRC 2010; NSW Health 2007;
VG:DHHS 2011; SA/SNZ 2003).
3. DAZO(o) and (e) (original and Ecolab) chemiluminescent
marker was sourced. Each type was subjected to drying and
naked-eye visibility measurements as well as definitional
description under UV light, in terms of expected practice
(Carling et al. 2006; Carling et al, 2008). Results were
recorded and photographed.
4. The performance of three commercial brands of hand-held
luminometer (3M’s Biotrace, Kikkoman’s Lumiscan and
Hygiena’s Ultrasnap) were assessed against LC-MS
determined ATP curves in terms of recommended thresholds
(Lewis et al. 2008; Andersen 2009; Boyce et al. 2009; Mulvey
et al. 2011) and using recommended procedures (ISO
13485:2008, VG:DHHS 2005).
Cleaning indicator tools for validation purposes:
Following preliminary validation work on traditional and new testing procedures, it was found that a model based on the detection of false negatives
had capacity to accommodate all monitoring types as the starting point for more complex risk modeling relating to the determination of safe
exposure thresholds for residual contamination on surfaces. To facilitate use of such a model, however, other risk factors need to be identified and
accommodated if effective and early feedback is to be given to staff in the interests of risk mitigation. Such risk factors include level of MDRO
present, presence of other material (protective residue or biofilm), frequency of exposure (high touch objects [HTOs] being particularly relevant),
nature of surface (texture and composition) and patient immune status. To guide cleaning the concept of acceptable risk needs to be expressed as a
definitive “practical zero” result which can guide the cleaning process.
During validation it was found that DAZO chemiluminescent markers dried effectively although the DAZO(o) had greater mass, dried slower and
showed some hydroscopicity in comparison to DAZO(e). DAZO(o) also had a smaller footprint per volume with better-defined boundaries (see above
photographs). There was some visibility of deposited spots which is an undesirable quality in tests required to develop a practical zero relating to
traditional cleaning practice which uses DVI as an integral part of the process.
Validation testing of ATP-bioluminescence monitors is underway although early results have suggested some variability of individual meter
performance against ATP standard curves, the generation of some false negatives when instruments are required to operate at a high level of
resolution close to the critical measurement range, and drop-off in measurement accuracy as reagents approach the end of their shelf-life. The
ability of such meters to measure to very low levels of ATP, however, offers possibilities for their role in identifying a practical zero.
This poster suggests a risk assessment framework which
might be used as a common vehicle for determining safe
exposure thresholds in the derivation of practical zero in
assessment of cleaning relating to a range of HTOs in
different healthcare settings.
While microbiological assessment can provide a benchmark
for retrospective surface monitoring, proactive monitoring in
terms of the restrictive time frame applicable to infection and
cleaning cycles requires other methodologies.
For many years, reliance has been placed on direct visual
inspection which, although immediate, has shown to be
inadequate in terms of accuracy. While other proactive
alternatives to visual inspection are available, research is
needed to contextualise the relative advantages and
disadvantages of each within a broad risk management
framework, and here concepts such as safe threshold and
practical zero require further investigation.
The cut off point for a realizable practical zero should be at or
below the point at which the possibility of a false negative
outcome occurs.
Thanks to the staff of the Microbiology and Environmental
Health divisions of the Hawkesbury Campus of the University
of Western Sydney for advice and in particular to Carol
Adkins for loan of equipment.
Thanks also to relevant staff members of the Whiteley
Corporation for analytical and other support
Cleaning Process Conducted
Cleanliness Assessed
Negative for soil present
TRUE
1. Reuse without risk
FALSE
2. Heightened risk with reuse
Positive for soil present
TRUE
3. Mitigation has reduced risk
FALSE
4. Mitigation has imposed unnecessary additional cost
Mitigation: Surface is subjected
to repeat cleaning and
assessment
Outcome-driven risk assessment model
Preliminary intervention
Feedback for mitigation Assessment
Basic assessment outcome
Four outcome conditions
Four outcome implications
DAZO (original) DAZO (E -version)

Validation of Cleaning Indicators for Healthcare SurfacesGreg S Whiteley a,b; Chris Derry a: Trevor Glasbey b
a = University of Western Sydney (UWS); b = Whiteley Corporation Pty Ltd
Abstract
Methods
Results
Discussion
Conclusion
Acknowledgements
References
Technology including ATP measurement, Artificial Test Soils
(ATS) and other methods are being trialed in order to provide a
validated basis for cleaning and hygiene performance standards
(Griffiths 2000, Boyce 2009). It is important that measure which
provide a numerical reading are appropriately qualified and
validated so as to provide a meaningful data set which indicate
clearly, accurately and with good repeatability the actual hygiene
status of the surface to be examined.
We took three commercially available hand held instruments
used to measure ATP as an indicator of soiling presence on a
surface. We also used two versions of a chemiluminescent
Artificial Test Soil (Carling 2006). Each system was subjected to a
qualification process for validation as per ISO 13485:2008 and
the ICH Guidelines (ICH 2005).
Results demonstrated that whilst the ATP hand held units have
reasonable performance across a log scale, variability across a
narrow range of data is variable and repeatability may be difficult
to achieve.
These findings may undermine some publications where
interpretation is based on data without linearity within the range
of the tests being undertaken. The results highlight the need to
thoroughly understand a device prior to purchase and to ensure
that readings are interpreted with some care.
ATP Hand Held Units Validation
Three commercial brands of ATP hand held measurement devices
were selected from brands available in the Australian market. The
three brands were Biotrace (3M); Lumiscan (Kikkoman), and
Ultrasnap (Hygiena). Each of the brands were used with their own
dedicated surface sampling consumables. All three brands of
consumables were tested close to the end of the stated shelf life of
the consumables to represent a worst case outcome as intended in
a sampling system under ISO 13485:2008. ATP was sourced from
SIGMA laboratories as an individual reagent and also within a
Adenosine 5’-triphosphate (ATP) Bioluminescent Assay Kit. Storage
of the ATP was as per recommendations (<20oC) until use.
Standard solutions were made up as per instructions and buffered
to pH 7.8. All stock solutions/reagents were stored in ice until
immediately prior to use. Using a calibrated microtitre pipette
precisely 10µL of the ATP solution was placed directly onto each
swab. The swabs were aseptically re-capped and reactant solutions
released as per instructions and mixed for 15 seconds and then
placed into the ATP meter. Readings were recorded. All readings
were taken in quadruplicate with some samples repeated on five
separate occasions (outliers). Readings of individual swabs were
regularly reconfirmed to ensure individual reading repeatability. All
ATP readings were calibrated using LC-MS (HPLC mode).
Artificial Test Soil – ATS Chemiluminescent Validation
Original ATS Chemiluminescent marker was sourced from Dr
Carling and recently released DAZO spots were sourced from
Ecolab. Each type was subject to drying and naked eye visibility
measurements as well as definitional description under UV light.
Results were recorded and photographed.
ATP Readings
Higher concentration (< 1mg/L)
Biotrace Kikkoman Hygiena
Lower concentration (<0.1 to 40 µg/L)
Biotrace Kikkoman Hygiena
ATS Chemiluminescent Spot Markers
An essential component of any quality driven approach is accurate information. The standard approach to ensuring accurate information within
industrial and healthcare settings is validation. Full and proper validation ensures that the information provided will be accurate and defensible on
each and every occasion that information is required and measured.
Our experiments sought to provide a basic validation of the two newest forms of cleaning monitoring systems, these being ATP measurement using
commercially available hand held meters (and their requisite consumables), and the chemiluminescent spot marker systems (DAZO or equivalent).
The use of these measures is subject to separate consideration. This poster outlines the outcomes purely of the scientific measurements to achieve
validation of the two approaches.
ATP: as the normal use of the swab consumables involves a variable other than the machine (i.e. swab technique), it was decided to use the ATP
directly onto each swab thus eliminating a variable, and thus to more accurately assess the reliability (repeatability) of the ATP measurement via the
luciferase reaction (Boyce 2009). This approach demonstrated that each unit had considerable variability despite the accuracy of the application of
the ATP standards. Other issues observed in the data were the exhaustion of the luciferase reaction with the Hygiena Unit at high concentrations of
ATP (the reaction levels off). Generally the variability in the Kikkoman device was poor within the chosen dilution series.
ATS: both versions of the DAZO chemiluminescent markers dried effectively although the DAZO(o) [original] had greater mass, took longer to dry
and also exhibited some evidence of hydroscopicity. The DAZO(o) had a much smaller footprint, with well defined boundaries, whereas the DAZO(e)
had a larger footprint and less well defined margins.
ATP: Using a pure solution of ATP allowed the validation process to
demonstrate the lack of linearity and repeatability for the three hand
held ATP meters. Two brands performed more erratically under
these test conditions. The Biotrace Unit uses a Photo-multiplier
within the luminometer where as both the Hygiena and Kikkoman
units make use of Photo-Diode Array technology (Griffiths 2008).
It is essential that the units and scale of measure have separation
between different known levels of ATP present. This allows the
more contaminated areas to be clearly identified from the less
contaminated areas. This is important as it saves time in
unnecessary rectification work by cleaning staff.
All three brands of ATP units demonstrated a lack of separation
between known levels of ATP. This undermines the reliability of any
individual reading. In our experiments readings were conducted in
quadruplicate to allow for calculation of median values. Even so,
the variability was particularly high for the Kikkoman unit.
For any use of these units in the field, it is very hard to see much
costs savings as readings will best be conducted in quadruplicate in
order to minimise variability.
DAZO: each of the two types of chemiluminescent marker
performed reliably and repeatedly. The slightly hydroscopic nature
of the original DAZO(o) was not a diminishing feature. Both
versions yellowed over time but neither were ostensibly visible.
Both versions were validated as suitable for use with repeatability
in application, appearance and removal. This system has been
demonstrated well in the literature (Carling 2008).
Thanks are due to laboratory staff at the University of Western
Sydney (Hawkesbury Campus).
Thanks are also due to staff at the Whiteley Corporation facility at
Tomago in NSW.
Thanks also to Carol Adkins for the extended use of the
luminometer from the Department of Microbiology at Hawkesbury.
Thanks also to the Higher Degree Research staff for the Poster
format with UWS colours.
Boyce JM, Havill NL, Dumigan DG, Golebiewski M, Balogun O & Rizvani R; “Monitoring the
effectiveness of hospital cleaning practices by use of an adenosine triphosphate bioluminescence
assay”: Inf Control Hosp Epidemiol:30:678-684:2009
Carling PC, Briggs J, Perkins J, Highlander D; “Improved cleaning of patient rooms using a new
target method”:Clin Infect Dis:42:385-388:2006
Carling PC, Parry MM, Rupp ME, Po JL, Dick B, Von Beheren S; “Improving cleaning of the
environment surrounding patients in 36 acute care hospitals”: Infect Control Hosp
Epidemiol:29:1035-1041:2008
Griffith CJ, Cooper RA, Gilmore J, Davies C & Lewis M; “An evaluation of hospital cleaning
regimes and standards”; J Hosp Infect:45:19-28:2000
Griffith CJ; “Choosing a luminometer”: International Food Hyg: 19:23-25:2008
ICH Expert Working Group; “Validation of Analytical Procedures: Text and Methodolgy Q2(R1)”;
International Conference on Harmonisation of Technical Requirements for Registration of
Pharmaceuticals for Human Use: ICH Harmonised Tripartite Guidelines: 2005
0
50,000
100,000
150,000
200,000
0 0.2 0.4 0.6 0.8 1
Rela
tiv
e L
igh
t U
nit
s (
RL
U)
ATP in mg/L
Biotrace ATP meter
0
1000
2000
3000
4000
5000
6000
7000
8000
0 10 20 30 40
Rela
tiv
e L
igh
t U
nit
s (
RL
U)
ATP in µg/L
Biotrace ATP meter
0
500
1000
1500
2000
2500
3000
3500
0 10 20 30 40
Rela
tiv
e L
igh
t U
nit
s (
RL
U)
ATP in µg/L
Kikkoman ATP meter
0
100
200
300
400
500
600
700
800
900
1000
0 10 20 30 40
Rela
tiv
e L
igh
t U
nit
s (
RL
U)
ATP in µg/L
Hygiena ATP meter
0.000000
0.000050
0.000100
0.000150
0.000200
0.000250
0.000300
0.000350
0.000400
0.000450
0.000500
starting weight 12 mins 24 mins 40 mins 60 mins
Weig
ht
(g
)
DAZO(o) weight - dried onto glass cover slips
A
B
C
D
E
control
0
2
4
6
8
10
12
14
16
18
20
Start 60 mins next day
Weig
ht
(mg
)
Drying time - room temperature
DAZO(e) drying time and weight
averages
[N = 20]
DAZO (o) DAZO (e)

POSTER TEMPLATE BY:
www.PosterPresentations.com
The problem of rapid ATP systems may be
scaling using Relative Light Units (RLU) Greg S Whiteley*, M Safety Sc., PhD (Candidate)1,2 Chris Derry, MSc (Med), PhD (Candidate)1 Trevor Glasbey, PhD2
* Principle & Corresponding Author : email [email protected] 1University of Western Sydney; 2Whiteley Corporation
Introduction
A
B
Figure 1: Relative Light Unit (RLU) scaling shown as both
linear and Log10: Co-efficient of Variance (CoV)
Table 1: Quantitative background
Figure 2: Existing Data on CoV
Showing the Coefficient of Variance (CoV) as a dot plot clearly demonstrate that portable ATP
meters do have the same level of reproducible reliability and robustness as a fully validated HPLC.
The current methodological approach for ATP measurement, using field based, hand held devices
cannot be expected to possess accuracy at the level of a stabilised analytical system. The variance
displayed by all brands is much higher than might otherwise be expected as seen in Figure 2 below.
Discussion
References
OPTIONAL
LOGO HERE
The problem of variability with use of rapid ATP
bioluminometers has been overlooked in
published work and is invisible where single
point sampling is undertaken without duplicate,
triplicate, or preferably quadruplicate sample
measurements. (Whiteley 2014) Thus variability
in the use of rapid ATP bioluminometers is the
most recurrent technical concern for cleaning
monitoring studies within healthcare applications
using quasi experimental frameworks.
The risk of type I errors due to unrepresentative
sampling in environmental monitoring worsens if
the ATP devices used for monitoring have
uncontrolled variability. (Martin 1994)
In this work the variability which has plagued so
many of the published studies using rapid ATP
monitoring has been fully investigated and
defined. The four brands used in the study have
their own characteristics which form the basis of
brand to brand differences, but it an up to
individual preference when making a purchasing
decision. (Griffiths 2008) What this study has
clearly indicated is that variability in the readings
obtained require careful consideration when
developing sampling plans for use of ATP
monitoring within healthcare settings.
The findings on variability in the use of rapid ATP
bioluminometers appear to be uniform across all
of the brands tested with CoV results showing
no difference between brands, either in the
spread of variance or clustering of CoV
outcomes. The implications of this work are
directly relevant to how cleaning monitoring with
ATP bioluminometers is conducted and the
impact on any statistical measures to be applied
to the findings. (Whiteley 2014) As we have
noted above, the use of median results provide a
more consistent platform on which statistical
findings could be based, thus suggesting a
discontinuance of averages as an approach to
sampling standardisation with ATP. This is
particularly important at the low end of the
dynamic range where the issue of a practical
zero is applied to ensure low end conformity of
data.
The alteration of the scaling from its normal
linear scale into the log10 of the original data
and then recalculating the CoV illustrate the
problem with the current scaling approach. As
seen in Figure 1, none of the ATP devices
compare favourably with the HPLC, although
when the data is in the Log phase, variability
(CoV) is reduced to a manageable level.
Conversion of the current scaling into a single
and unified scale that is in the log phase, rather
than the current disassociated and non-unified
Linear RLU scale will be highly desirable to
reduce variability and improve practicability in
rapid ATP testing. Further studies are underway.
The data on variance is plotted as range data with the median noted on each data set
Linear Log 10 Linear Log 10 Linear Log 10 Linear Log 10 Linear Log 10
3M Kikkoman Hygiena Charm HPLC
High 0.3941 0.1239 0.4840 0.1215 0.6304 0.3287 0.8249 0.1721 0.0681 0.0369
Low 0.0128 0.0023 0.0128 0.0024 0.0121 0.0013 0.0033 0.0002 0.0011 0.0001
Median 0.1145 0.0208 0.1022 0.0236 0.1022 0.0236 0.1296 0.0148 0.0037 0.0004
0.0000
0.1000
0.2000
0.3000
0.4000
0.5000
0.6000
0.7000
0.8000
0.9000
Co
eff
icie
nt
of
Vari
an
ce (
Co
V)
CoV Range and Median as Linear and Log 10
High
Low
Median
3M Kikkoman Hygiena Charm HPLC
30 runs 31 runs 29 runs 12 runs 22 runs
94 data points 97 data points 91 data points 49 data points 72 data points
Method
ATP Testing
In this series of experiments, a known source of ATP (Sigma
Aldrich, Castle Hill, Australia) was used to assess ATP device
response. The quantitative aspects of the concentration of the ATP
were confirmed using HPLC (Shimadzu, Japan) in a validated
method. The method of application followed the prior published
method. (Whiteley 2012)
Experimental work demonstrated that direct application by micro-
titre pipette of 10 – 20 µL of ATP , stored in ice during the
experiment, provided a robust, repeatable and defensible method of
application that removed other error from the work. At each dilution
point a minimum of three swabs were used for each device and
wherever possible test points were sampled in quadruplicate.
The use of medians was preferred in range finding as the use of
averages was found to be affected by the regularity of outliers in the
sampling groups.
The ATP work was repeated on multiple occasions, with multiple
operators present. All swabs were used prior the recommended
expiry period. All swabs were stored in below 5oC until prior to use
when they were allowed to reach room temperature. Multiples of
differing batch lots were tested.
The Charm device and consumables were obtained for testing
towards the end of the study, and so the number of sample points
(runs) and total number of swabs used is somewhat less than the
other three brands.
Statistics and Graphs
The ATP readings are made in Relative Light Units (RLU). Each
branded device has its own unique numerical presentation and
scaling for RLU. No two units share a common scaling.
In these studies the RLU were noted for each data point and the
mean, standard deviation and Coefficient of Variance (CoV) were
calculated for each sampling run. The raw data was then converted
to its log 10 and the statistics were re-calculated using MS Excel
(Microsoft Corp, Seattle, USA). The graphs was also drawn using
MS Excel.
The use of rapid Adenosine Triphosphate (ATP) bioluminometers in
the monitoring of surface hygiene as originally suggested by Griffiths
has yet to see practical fulfilment amongst healthcare infection
control and prevention practitioners. (Griffiths 2000) Reviewers have
noted the potential for the use of ATP in providing near instantaneous
results on quantitative measurements of surface hygiene. (Carling &
Huang 2013; Mitchell et al 2013) Despite a large number of studies,
authoritative sources have declined to declare ATP monitoring has
sufficient evidentiary support for regular use in the monitoring of
surface hygiene within healthcare settings. (Loveday et al., 2014)
Rapid ATP bioluminometry has a reliable capacity to distinguish
between ten-fold serial dilutions of ATP and various common
bacterial species. (Aitken 2011, Whiteley 2012) Brand to brand
benefits have been suggested in controlled studies in the endeavour
to pick winners, despite clear problems with sensitivity within the
scaling. (Andersen 2009, Sciortino 2013; Malik 2013)
There have been problems noted in use of ATP monitoring including
unexpected and unusual results that often presented, such as
readings of ATP which were higher following cleaning than
measurement prior to cleaning being conducted. (Cooper 2007) The
correlation between contamination due to microorganisms of concern
often correlates poorly with ATP measurement which tend to be
higher. (Smith et al., 2013; Boyce 2011) Unexplained variability has
impeded efforts to identify a suitable benchmark. (Lewis 2008,
Moore 2010, Anderson 2011) Even collection of sufficient data and
application of a receiver operating curve model has not resulted in a
standardised and widely accepted definitional boundary on hygiene
based on ATP measurements expressed as Relative Light Units
(RLU). (Mulvey 2011, Smith 2013)
In response to these attempts at solidifying a suitable cleanliness
benchmark using rapid ATP bioluminescence, conceptual concerns
have been highlighted with ATP as a surrogate for surface hygiene
assessment, particularly noting the issues arising from variability.
(Malik & Shama “20 pence” JHI 2011) The coefficient of variation has
been noted as an problem with ATP monitoring, subsequently poor
correlation (r2 was 0.078). (Shama & Malik IJHEH 2013)
A controlled laboratory model indicated that whilst rapid ATP
bioluminometers could distinguish well between ten-fold dilutions, all
of the systems tested struggled with a 20% dilution series. (Whiteley
2012) Coefficient of Variance (CoV) used to normalise data sets has
shown variance as a substantial issue in using rapid ATP monitoring.
(Whiteley 2013)
Uncontrolled variability in data sets is a major problem for statistical
applications. (Lautenbach 2012)
In this work, the variability of 4 commercial brands of rapid ATP
bioluminometers were tested in a series of laboratory studies using a
standardised pharmaceutical industry approach (ICH 2005). The four
brands of ATP bioluminometers and their consumables used in this
work were 3M – Cleantrace; Kikkoman – Lucipac-pen; Hygiena –
Ultrasnap; and Charm – Pocket Swab Plus. A calibrated HPLC using
a fully validated method for ATP detection was used as a control for
variability.
Griffith CJ, Cooper RA, Gilmore J, Davies C, Lewis M. An evaluation of hospital cleaning regimes
and standards. J Hospital Infection:2000:45:19-28
Carling PC, Huang SS. Improving healthcare environmental cleaning and disinfection: current and
evolving issues. Infection Control Hospital Epidemiology: 2013:34:507-513
Mitchell BG, Wilson F, Dancer SJ, McGregor A. Methods to evaluate environmental cleanliness in
healthcare facilities. Healthcare Infection: 2013:18:22-30
Loveday H, Wilson JA, Pratt RJ, Golsorkhi M, Tingle A, Bak A, Browne J, Prieto J, Wilcox M. EPIC
3 National Evidence Based Guidelines for Preventing Healthcare-Associated Infections in NHS
Hospitals in England. J Hospital Infection: 2014:86: Supplement 1
Aitken ZA, Wilson M, Pratten J. Evaluation of ATP bioluminescence assays for potential use in a
hospital setting. Infection Control Hospital Epidemiology: 2011:32:507-509
Whiteley GS, Derry C, Glasbey T. The comparative performance of three brands of portable ATP-
bioluminometer intended for use in hospital infection control. Healthcare Infection: 2012:17:91-97
Andersen RE, Young V, Stewart M, Robertson C, Dancer SJ. Cleanliness audit of clinical surfaces
and equipment: who cleans what? J Hosp Infect: 2011:78:178-181
Sciortino CV, Giles RA. Validation and comparison of three adenosine triphosphate luminometers
for monitoring hospital surface sanitization: A rosetta stone for adenosine triphosphate testing. Am J
Infection Control: 2012:40:e233-239
Malik DJ. Assessment of infection risk from environmental contamination using rapid ATP surface
measurements. Am J Infection Control: 2013:41:469-479
Cooper RA, Griffith CJ, Malik RE, Obee P, Looker N. Monitoring the effectiveness of cleaning in four
British hospitals. Am J Infection Control: 2007: 35:338-341
Smith PW, Gibbs S, Sayles H, Hewlett A, Rupp ME, Iwen PC. Observations on hospital room
contamination testing. Healthcare Infection: 2013:18:10-13
Boyce JM, Havill NL, Havill HL, Mangione E, Dumigan DG, Moore BA. Comparison of fluorescent
marker systems with 2 quantitative methods of assessing terminal cleaning practices. Infection
Control Hospital Epidemiology: 2011:32:1187-1193
Lewis T, Griffith C, Galo M, Weinbren M. A modified ATP benchmark for evaluating the cleaning of
some hospital environmental surfaces. J Hospital Infection:2008:69:156-163
Moore G, Smyth D, Singleton J, Wilson P. The use of adenosine triphosphate bioluminescence to
assess the efficacy of a modified cleaning program implemented within an intensive care setting. Am
J Infect Control: 2010:38:617-622
Anderson RE, Young V, Stewart M, Robertson C, Dancer SJ. Cleanliness audit of clinical surfaces
and equipment: who cleans what? J Hosp Infect: 2011:78:178-181
Mulvey D, Redding P, Robertson C, Woodall C, Kingsmore P, Bedwell D, Dancer SJ. Finding a
benchmark for monitoring hospital cleanliness. J Hosp Infect; 2011:77:25-30.
Malik DJ, Shama G. Estimating bacterial surface contamination by means of ATP determinations: 20
pence short of a pound. J Hospital Infection: 2012:80:354-356
Shama G, Malik DJ. The uses and abuses of rapid bioluminescence-based ATP assays.
International J Hygiene and Environmental Health: 2013:216:115-125
Whiteley GS, Derry C, Glasbey T. Reliability testing for portable Adenosine Triphosphate
Bioluminometers. Infection Control Hospital Epidemiology: 2013:34:5:538-540
Lautenback E, Woeltje KF, Malani PN; Practical Healthcare Epidemiology 3rd Edit, 2010, ISBN 978-
0-226-47102-0; The University of Chicago Press, Chicago, USA
ICH Harmonised Tripartite Guidelines. Validation of Analytical Procedures: text and methodology
Q2(R1). International Conference on Harmonisation of Technical Requirements for the registration of
Pharmaceuticals for Human Use. 4th Edition. 2005
Whiteley GS, Derry C, Glasbey T. Sampling plans for use of rapid Adenosine Triphosphate (ATP)
monitoring must overcome variability or suffer statistical invalidity. Infect Control Hosp Epidemiol:
2014: [pre-publication approval]
Martin P, Pierce R. Practical Statistics for the Health Sciences. 1994. ISBN 0 17 008976 2; Thomas
Nelson – Australia, South Melbourne, Australia
Griffith C.J., 2008. Choosing a luminometer. International Food Hyg. 19, 23-25.

POSTER TEMPLATE BY:
www.PosterPresentations.com
Evidence based cleaning and cleaning validation
using FM and ATP systems
Greg S Whiteley*, M Safety Sc., PhD (Candidate)1,2 Chris Derry, MSc (Med), PhD (Candidate)1 Trevor Glasbey, PhD2
* Principle & Corresponding Author : email [email protected] 1University of Western Sydney; 2Whiteley Corporation
Introduction
Results
Revised Management Approach based on Failure Mode Effects Analysis (FMEA)
Discussion
References
Acknowledgements
OPTIONAL
LOGO HERE
Cleaning is a process that when conducted efficiently and effectively
can reduce the risk of cross infection via surfaces within healthcare
settings (Popp 2013). The four monitoring tools available for
monitoring of environmental cleaning are: (i) visual inspection; (ii)
microbial recovery; (iii) Fluorescent Marker products (FM); and (iv)
rapid ATP (Adenosine Triphosphate) bioluminescence (Carling 2013,
Mitchell 2013).
Australia has moved to a quality driven process through the adoption
of the National Service and Healthcare Quality Standards (NSHQS)
introduced in 2012, which have the two pronged goal of
standardisation and continuing improvement (ACSHQ 2012)
including the risk of infection associated with environmental cleaning
failure. This study investigated the use of Failure Mode Events
Analysis (FMEA) as a risk analysis tool in the monitoring of cleaning
processes using rapid ATP and FM.
When conducted thoroughly, the cleaning process has been shown
to reduce environmental contamination and also to reduce risks of
cross infection (Hota 2009, Dancer 2009, Friedman 2013). When
cleaning is conducted poorly, inefficiently or ineffectively, the
outcome will produce a hazard element and provide a risk platform
for cross infection within healthcare settings (Dancer 2012).
The difficulty in developing a clinical approach to cleaning verification
is highlighted by the recent comment that that ‘cleaning is a “weak
science” based usually on a poetic theory not grounded in fact’
(Harbath 2013). This highlights the need to take a risk based
methodology to link the underlying and sometimes disjointed
sciences into a cohesive “process control” approach.
The significant problem with environmental “cleaning” is twofold.
Firstly it is a relatively straightforward process of wiping and
removing soils from a surface. Secondly however, cleaning is also a
multi-faceted process and not just one science or a single scientific
discipline. It is a complex array of linked activities that involve many
scientific inputs to arrive at a single desired output (a clean surface).
Human factors add a tertiary layer of complexity in the application of
the task of cleaning (Jackson 2014).
The total approach to cleaning validation remains poorly studied or
little understood (Gillespie 2013). In Australia, various auditing
approaches and measurements have been used to indicate cleaning
performance incorporating the verification tools available (Victorian
Government 2005, NHMRC 2010, Murphy 2011). Moving to a
“process control approach” within a standards framework is required
to achieve management control overall cleaning process outcome.
The analysis of how bring these diverse issues together and to insert
the use of the cleaning verification tools into the cleaning process
was considered as per Australian Standard AS/NZS 31000:2009,
“Risk Management – Principles and Guidelines” (Standards
Australia, 2009). This standard outlines the principles for conducting
an overall risk management process. For cleaning, the primary risk is
failure of the process. For this study we focused solely on the
cleaning verification tools on the basis that if the verification tools fail
to work, then underlying cleaning failure will not be identified and
corrected, leading to overall process failure.
The use of FM is a validated method of checking that surface
cleaning/wiping has occured (Carling 2008). The use of ATP has
been shown to correlate well with high levels of bacterial pathogens
on the surfaces found within healthcare settings (Smith 2014).
Our team selected FMEA as the most appropriate tool for our study
FMEA as a risk assessment tool has been used or suggested on a
number of occasions in the field of infection prevention but has not
gained any wide spread acceptance (Monti 2009, Chiozza 2009).
The greatest use of FMEA as a semi-quantitative risk assessment
tool is in the pharmaceutical and medical device sectors (van
Leuwwan 2009).
0.0
20.0
40.0
60.0
80.0
100.0
0s 1'00" 2'00" 3'00" 4'00" 5'00" 6'00" 7'00" 8'00" 9'00" 10'00" 11'00" 12'00"
No
rmal
ise
d t
o 1
00
%
Drying time at room temperature (21oC) in minutes
DAZO(e) Drying time with plot points
1ST RUN
2ND RUN
3RD RUN
4TH RUN
5TH RUN
0.000000
0.000050
0.000100
0.000150
0.000200
0.000250
0.000300
0.000350
0.000400
0.000450
0.000500
starting weight 12 mins 24 mins 40 mins 60 mins
DAZO original version (CID 2006) - eye dropper application
Series1
Series2
Series3
Series4
Series5
Series6
Cleaning Verification using
FM spot
FM spot Removed
Tested POSITIVE
Surface was effectively cleaned
TRUE POSITIVE
Surface was NOT effectively cleaned
FALSE POSITIVE
FM spot
Not Removed
Tested NEGATIVE
Surface was not cleaned
TRUE NEGATIVE
Surface was cleaned
FALSE NEGATIVE
Cleanliness benchmark is set
using ATP
High ATP reading
POSITIVE
TRUE POSITIVE
Surface is unclean
FALSE POSITIVE
Surface is clean
Low ATP reading
NEGATIVE
TRUE NEGATIVE
Surface is clean
FALSE NEGATIVE Surface is
contaminated
Figure 3: Identified failure profile with FM Figure 4: Identified failure profile with ATP
Results of FM laboratory studies
REPEAT
CLEANING
PROCESS
Results of FMEA (structural) failures
The results of the first stage of failure mode are shown in Figures 1 and 2 below, in regards to drying of the FM. Results of the
validation work on ATP systems are shown separately (Poster 3133).
DAZO original and DAZO (e) both take several minutes to dry. In the period of time when drying is underway, the risk of inadvertent
removal is quite high as the intention is to apply the FM dots to High Touch Objects or surfaces. Early removal other than by
intentional cleaning cannot be detected and allows for a false reading. Our work identified this failure as a False Positive result (the
intention is to remove the FM through a cleaning/wiping process). This is a high risk failure as it is not able to be mitigated in the
normal course of cleaning activity. FM is noted to only provide qualitative information on cleaning efficiency and not cleaning efficacy.
This failure is noted in Figure 3.
For ATP the significant failure risk identified is that the ATP is read and the RLU outcome is below the intended threshold. But if
pathogenic organisms remain on the surface, or the ATP reads low due to a lack of detection then the low RLU is a false indication
of surface cleanliness. Our work identified this failure as a False Negative result (the intention is to detect unclean surfaces through
high RLU readings and a low RLU reading when surfaces remain contaminated with pathogenic and multi-drug-resistant-organisms
[MDRO] is a false negative result). This failure is noted in Figure 4 below.
Figure 1: Drying of DAZO original Figure 2: Drying of DAZO (e)
Photo 1: DAZO original Photo 2: DAZO (e) Popp W; “Cleaning – on the way to evidence based knowledge”; Hospital Infection:
2013:18:1-2
Australian Council on Safety and Quality in Healthcare (ACSQH): “National Safety
and Quality Health Service Standards”; ACSQH; Sydney Australia, 2012.
Carling PC, Huang SS; “Improving healthcare environmental cleaning and disinfection:
current and evolving issues”; Infection Control and Hospital Epidemiology: 2013:34:507-
513)
Mitchell BG, Wilson F, Dancer SJ, McGregor A; “Methods to evaluate environmental
cleanliness in healthcare facilities”; Healthcare Infection: 2013:18:22-30
Hota B, Blom DW, Lyle EA, Weinstein RA, Hayden MK; “Interventional evaluation of
environmental contamination by vancomycin-resistant enterococci: failure of personnel,
product or procedure?”: J Hosp Infect:71:123-131
Dancer SJ, White LF, Lamb J, Girvan EK, Robertson C; “Measuring the effect of
enhanced cleaning in a UK Hospital: a prospective cross-over study”: BMC Infect
Med:2009:7:28
Friedman ND, Walton AL, Boyd S, Tremonti C, Low J, Styles K, Harris O, Alfredson D,
Athan E; “The effectiveness of a single-stage versus traditional three-staged protocol of
hospital disinfection at eradicating vancomycin-resistant Enterococci from frequently
touched surfaces”; Am J Infection Control: 2013:41:227-231.
Dancer SJ. Hospital cleanliness: establishing a new science. J Hospital Infection:
2012:80:354-356
Harbath S; “What can we learn from each other infection control? Experience in Europe
compared with the USA”; J Hospital Infection: 2013:83:173-184
Jackson C, Griffiths P. Dirt and disgust as key drivers in nurses’ infection control
behaviours: an interpretative, qualitative study. J Hosp Infect; 2014:87:71-76
Gillespie EE; Scott C, Wilson J, Stuart R; “Pilot study to measure cleaning effectiveness
in health care”; Am J Infection Control: 2012:40:477-478
Victorian Government, Department of Health and Human Services; “Cleaning
standards for Victorian public hospitals, 2000, Revised 2005”: State of Victoria, 2005
Murphy Cl, Macbeth DA, Derrington P, Gerrard J, Faloon J, Kenway K, Lavender S,
Leonard S, Orr A, Tobin D, Carling P; “An assessment of high touch object cleaning
thoroughness using fluorescent marker in two Australian hospitals”: Healthcare Infection:
2011:16:156-163
Standards Australia; “Risk management – principles and guidelines – AS/NZS
31000:2009”; Standards Australia, Sydney Australia
Carling PC, Parry MM, Rupp ME, Po JL, Dick B, Von Beheren S; “Improving cleaning of
the environment surrounding patients in 36 acute care hospitals”:Infect Control Hosp
Epidemiol:2008:29:1035-1041
Monti S, Jefferson J, Mermel L, Parenteau S, Kenyon S, Cifellie B; Use of Failure mode
and effect (FMEA) analysis to improve active surveillance for methicillin-resistant
Staphylococcus aureus (MRSA) at a university affiliated medical center”; Abstract: Am J
Infection Control:2009:33:E158
Chiozza ML, Ponzetti C; “FMEA: A model for reducing medical errors”; Clinica Chimica
Acta; 2009:404:75-78
van Leuwwen JF, Nauta MJ, de Kaste D, Odekerken-Rombouts YMCF, Oldenhof MT,
Vredenbregt MJ, Barends DM; “Risk analysis by FMEA as an element of analytical
validation”: J Pharmaceutical and Biomedical Analysis: 2009:50:1085-1087
McDermott RE, Mikulak RJ, Beauregard MR; “The basics of FMEA”, 2nd Edit, 2009;;
Taylor and Francis Group, Productivity Press, New York, NY, USA.
Malik RE, Cooper RA, Griffith CJ; “Use of audit tools to evaluate the efficacy of cleaning
systems in hospitals”: Am J Infect Control: 2003:31:181-187
Malik DJ, Shama G. Estimating bacterial surface contamination by means of ATP
determinations: 20 pence short of a pound. J Hospital Infection: 2012:80:354-356
The risk assessment of any cleaning process should
consider not just the overall risk, but each of the
individual sub-tasks and the risks attached to each.
For our study we focused solely on the cleaning
verification tools and the risks associated with each
tool, on the basis that no matter what the cleaning
materials and methods chosen, if the verification tools
fail to work, then underlying failure will not be
identified and corrected, leading to overall process
failure.
This FMEA indicates that use of FM has a low risk of
failures but also is qualitative and does not indicate
the quantitative efficacy achieved through the cleaning
process. Whilst ATP bioluminescence measurements
can indicate the quantitative level of surface hygiene,
the failure modes identified suggest that it should be
carefully managed within a risk based system (Malik
2003, Malik 2012).
The results presented indicate that the FM and the
ATP should be used both in parallel and in sequence
to mitigate the substantial failure risk associated with
these cleaning monitoring tools.
This study has focused on the overall failure risk as
informed by FMEA. A full study has been submitted
for publication and is currently in peer review. The
results here are the preliminary and overall impacts of
the two most significantly identified failure modes foe
both FM and ATP.
The overall impact of using both FM and ATP to
mitigate each other provides a new approach for
cleaning monitoring within healthcare settings. Further
studies are currently underway to further investigate
the potential of overcoming the well recognised flaws
in hygiene science within hospitals globally.
Figure 5: a revised approach to use of FM and ATP in cleaning monitoring
Grateful thanks to the following people in the preparation of this
poster and research work:
Mr Paul Fahey, Senior Lecturer, Biostatistics, School of Science &
Health, University of Western Sydney
Also thanks to Darran Leyden, Hannah Walmsley and Sally
Everingham (all from Whiteley Corporation, Australia) for assistance
in printing and timely delivery to the conference.
The two identified cleaning verification methods of rapid ATP and FM
were assessed by the Risk Assessment team members to identify the
structural or procedural failure modes.
FMEA is a structured methodology which provides a quantitative
predictive assessment of a process so as to prevent problems or
failures before they occur (McDermott 2009). FMEA looks at the
process and predicts possible failure modes. This identification of
failure mode is by type so that subtle variations can be assessed
together as they will provide a similar failure outcome.
A small multi-disciplinary team was convened to consider and risk
assess failure modes of the two cleaning monitoring tools, ATP and
FM.
FMEA also allows for the team members to note both the existence
of underlying redundancy in the risk assessment (i.e. is the risk
already overcome by an existing factor not clearly seen in the risk
assessment for the characteristics). The possibility of further
intervention can also be noted to indicate any observations as to the
best way to lower or mitigate the identified risks.
The method used by the risk assessment team considered the major
clinical failures a structured approach to consider worst possible
failure event outcomes.
Mitigation was actively considered following identification of key
failure modes and interaction with possible redundancy factors.
Method

POSTER TEMPLATE BY:
www.PosterPresentations.com
A new method for practical quality control in monitoring
the cleaning of healthcare surfacesAuthors: Whiteley GS1,2; Derry C1; Glasbey T2
1University of Western Sydney, School of Science and Health2Whiteley Corporation, North Sydney, Australia
Introduction
Cleaning within healthcare
settings is an intervention that is
both practical and cost effective.
Quality assurance over cleaning
remains problematic with four
monitoring methods being visual
inspection, microbial recovery,
Fluorescent Markers (FM) and
ATP bioluminometry (ATP)
(Mitchell 2013).
When conducted thoroughly, the
cleaning process has been
shown to reduce environmental
contamination and also to reduce
risks of cross infection (Hota
2009, Dancer 2009, Friedman
2013). When cleaning is
conducted poorly, inefficiently or
ineffectively, the outcome will
produce a hazard element and
provide a risk platform for cross
infection within healthcare
settings (Dancer 2012).
In Australia, various auditing
approaches and measurements
have been used to indicate
cleaning performance
incorporating the verification
tools available (Victorian
Government 2005, NHMRC
2010, Murphy 2011). Moving to a
“process control approach” within
a standards framework is
required to achieve management
control overall cleaning process
outcome.
The use of FM is a validated
method of checking that surface
cleaning/wiping has occured
(Carling 2008). The use of ATP
has been shown to correlate well
with high levels of bacterial
pathogens on the surfaces found
within healthcare settings (Smith
2014). The variability identified
with ATP use can be overcome
through appropriate sampling
methodology (Whiteley 2015).
Our team selected FMEA as the
most appropriate tool for our
study as it allowed a comparison
based on the risks of failure,
rather than a direct association
(Whiteley 2015).
This poster demonstrates the
results of investigations into the
cleaning monitoring processes. A
new method of integrated
assessment for cleaning
monitoring is proposed.
Method & Results
ATP TestingIn this series of experiments, a known source of ATP (Sigma Aldrich, Castle Hill, Australia) was used to assess ATP device response. The
quantitative aspects of the concentration of the ATP were confirmed using HPLC (Shimadzu, Japan) in a validated method. The method of
application followed the prior published method using direct application by micro-titre pipette . (Whiteley 2012) At each dilution point a minimum
of three swabs (usually four swabs) were used for each device. The ATP work was repeated on multiple occasions, with multiple operators
present. All swabs were used prior the recommended expiry period. All swabs were stored in below 5oC until prior to use when they were
allowed to reach room temperature. Multiples of differing batch lots were tested. The Charm device and consumables were obtained for
testing towards the end of the study, and so the number of sample points (runs) and total number of swabs used is somewhat less than the
other three brands.
Statistics and GraphsThe ATP readings are made in Relative Light Units (RLU). Each branded device has its own unique numerical presentation and scaling for
RLU. No two units share a common scaling. In these studies the RLU were noted for each data point and the mean, standard deviation and
Coefficient of Variance (Cv) were re-calculated using MS Excel (Microsoft Corp, Seattle, USA). The graphs were drawn using MS Excel. Cv
was preferred for the normalisation of the data given that each concentration was individual and not comparable.
FMEA Key Failures identified
Fluorescent Markers (FM)
For the purposes of the FMEA study, our work focused on the
DAZO system developed by Dr Phillip Carling. The drying time
was identified as a important characteristic for field based use so
a series of laboratory based drying studies were undertaken to
establish the drying characteristics to be used for the FMEA
comparison. Drying with the second generation series (DAZO –
Ecolab) are shown.
Conclusions
References
DIsclosures
Disclosure statement:None of the authors have any connection to any of the
materials studied or presented in this study. This work
has been completed as part of studies toward a PhD by
the principle author. There is no affiliation with any 3rd
party mentioned as part of this study. GS Whiteley and Dr
T Glasbey are both employees of Whiteley Corporation.
Dr Derry is a Senior Lecturer at UWS.
OPTIONAL
LOGO HERE
Cleaning is a feature of hospital
infection control but lacks a
robust mechanism to achieve
the desired quality assurance
over cleaning outcomes. The
Australian Healthcare System
endorses a risk based approach
to the prevention of healthcare
associated infections, including
surface hygiene within hospitals
(ACSQH 2011). Our study
focused on the cleaning
verification tools and the risks
associated with each tool, on
the basis if the verification tools
fail to work, then underlying
failure will not be identified and
corrected, leading to overall
process failure.
Further studies are currently
underway to further investigate
the potential of concomitant use
of the four cleaning monitoring
methods. The results presented
indicate that the four cleaning
monitoring methods should be
used synergistically to mitigate
the substantial failure risk
associated with any one of the
individual cleaning monitoring
tools when those tools are used
in isolation.
Mitchell BG, Wilson F, Dancer SJ, McGregor A; “Methods to evaluate
environmental cleanliness in healthcare facilities”; Healthcare Infection:
2013:18:22-30
Hota B, Blom DW, Lyle EA, Weinstein RA, Hayden MK; “Interventional
evaluation of environmental contamination by vancomycin-resistant
enterococci: failure of personnel, product or procedure?”: J Hosp
Infect:71:123-131
Dancer SJ, White LF, Lamb J, Girvan EK, Robertson C; “Measuring the
effect of enhanced cleaning in a UK Hospital: a prospective cross-over
study”: BMC Infect Med:2009:7:28
Friedman ND, Walton AL, Boyd S, Tremonti C, Low J, Styles K, Harris O,
Alfredson D, Athan E; “The effectiveness of a single-stage versus traditional
three-staged protocol of hospital disinfection at eradicating vancomycin-
resistant Enterococci from frequently touched surfaces”; Am J Infection
Control: 2013:41:227-231.
Dancer SJ. Hospital cleanliness: establishing a new science. J Hospital
Infection: 2012:80:354-356
Victorian Government, Department of Health and Human Services;
“Cleaning standards for Victorian public hospitals, 2000, Revised 2005”:
State of Victoria, 2005
National Health and Medical Research Council [NHMRC]. Australian
Guidelines for the Prevention and Control of Infection in Healthcare.
Department of Health and Ageing, Canberra: Commonwealth of Australia;
2010.
Murphy Cl, Macbeth DA, Derrington P, Gerrard J, Faloon J, Kenway K,
Lavender S, Leonard S, Orr A, Tobin D, Carling P; “An assessment of high
touch object cleaning thoroughness using fluorescent marker in two
Australian hospitals”: Healthcare Infection: 2011:16:156-163
Carling PC, Parry MM, Rupp ME, Po JL, Dick B, Von Beheren S; “Improving
cleaning of the environment surrounding patients in 36 acute care
hospitals”:Infect Control Hosp Epidemiol:2008:29:1035-1041
Smith PW, Gibbs S, Sayles H, Hewlett A, Rupp ME, Iwen PC. Observations
on hospital room contamination testing. Healthcare Infection: 2013:18:10-13
Whiteley GS, Derry C, Glasbey T. Sampling plans for use of rapid
Adenosine Triphosphate (ATP) monitoring must overcome variability or suffer
statistical invalidity. Infect Control Hosp Epidemiol: 2015:36(2):236-237
Whiteley GS, Derry C, Glasbey T. Failure analysis in the identification of
synergies between cleaning monitoring methods. Am J Infect Control:
2015:43:147-153
Whiteley GS, Derry C, Glasbey T. The comparative performance of three
brands of portable ATP-bioluminometer intended for use in hospital infection
control. Healthcare Infection: 2012:17:91-97
McDermott RE, Mikulak RJ, Beauregard MR; “The basics of FMEA”, 2nd
Edit, 2009;; Taylor and Francis Group, Productivity Press, New York, NY,
USA.
Australian Council on Safety and Quality in Healthcare (ACSQH):
“National Safety and Quality Health Service Standards”; ACSQH; Sydney
Australia, 2012.
0.000000
0.000050
0.000100
0.000150
0.000200
0.000250
0.000300
0.000350
0.000400
0.000450
0.000500
starting weight 12 mins 24 mins 40 mins 60 mins
DAZO original version (CID 2006) - eye dropper application
Series1
Series2
Series3
Series4
Series5
Series6
Failure Mode Risk Class Mitigation suggestions Mitigation
Option
Vis
ual In
spectio
n
Surface looks clean but
is contaminated with
pathogenic microbes or
other soils
High
Testing of surfaces with a quantitative
method for determining surface hygiene
may indicate contamination e.g. ATP
testing or Microbial Recovery ATP or
Micro
Surface looks clean but
has not been subject to
routine cleaning
process12
MediumUse of an FM technology will indicate
surface cleaning frequency rate.
FM
Mic
robia
l re
covery
Result from sampling is
delayed by 48 hours or
more29
High
Testing of surfaces with a rapid method
(e.g. ATP testing) can inform and guide
the sampling processes by indicating any
loci of contamination through use of ATP
ATP
Pathogenic microbes
are not detected on
swab but are present on
HTOs10
Medium
Validation of the sampling methods can
improve microbial recovery rates - check
cleaning with FM
FM
AT
P b
iolu
min
om
etr
y
ATP Detection failure
(Possible lysis system
failure), or insufficient
bacteria recovered
Medium
Microbial recovery can be used for
confirmatory quality control where FM
indicates inadequate cleaning but ATP
readings are inconclusive FM or
Micro
Failure to detect viruses
due to absence of ATPMedium
Use of an FM technology is low cost and
will indicate surface cleaning frequency in
additon to use of rapid ATP detection. A
suitable microbial recovery method for
virus detection could also be used. FM or
Micro
FM
technolo
gie
s
FM spots are visible to
cleaning staff and are
preferentially removed
Medium
Testing of surfaces prior to use of FM and
coincidental use of ATP will indicate
surface hygiene
ATP
FM assessment does
not enable
measurement of the
level of effectiveness of
the cleaning process
MediumATP measurement will provide an adjunct
measurement of surface cleanliness
ATP or
Micro
FMEA is a structured methodology which provides a
quantitative predictive assessment of a process so as to
prevent problems or failures before they occur (McDermott
2009). FMEA looks at the process and predicts possible
failure modes. This identification of failure mode is by type
so that subtle variations can be assessed together as they
will provide a similar failure outcome.
A small multi-disciplinary team was convened to consider
and risk assess failure modes of the two cleaning
monitoring tools, ATP and FM.
FMEA also allows for the team members to note both the
existence of underlying redundancy in the risk assessment
(i.e. is the risk already overcome by an existing factor not
clearly seen in the risk assessment for the characteristics).
The possibility of further intervention can also be noted to
indicate any observations as to the best way to lower or
mitigate the identified risks.
This table presents a snapshot of the two worst failure
modes for each of the monitoring methods (Whiteley 2015).
Answering the key validation questions
Has the cleaning method and
materials been validated?
Has the cleaning process ensured suitable surface
cleanliness
Has a cleaning process been
attempted on this HTOs
HTOs to be cleaned
Identify the HTOs to be
cleaned
Yes
No
Is the method of cleaning effective?
Are the materials used
efficacious?
YesHTOs is Ok for continued use
No Re-cleanReassess
HTOs hygiene
Cleaning Monitoring FM ATP Micro
The FM drying is achieved within a
practical times of less than 2 minutes,
although full drying can take up to 12
minutes depending on the brand. Newer
brands dry virtually instantly. The ATP tests
lack precision but are robust when
considered over a wide range of
contamination. Each of the four cleaning
monitoring methods has risks which, in
isolation, limit their usefulness. FMEA
highlights overlapping of weaknesses with
strengths, suggesting a new integrated
approach to cleaning monitoring within
healthcare.

134
End
This page is deliberately blank