a study comparing the technical problem solving abilities
TRANSCRIPT

Old Dominion University Old Dominion University
ODU Digital Commons ODU Digital Commons
OTS Master's Level Projects & Papers STEM Education & Professional Studies
1998
A Study Comparing the Technical Problem Solving Abilities of A Study Comparing the Technical Problem Solving Abilities of
Middle School Students who have Participated in one or more Middle School Students who have Participated in one or more
Technology Education Courses to those of students having no Technology Education Courses to those of students having no
course work in Technology Education course work in Technology Education
Anthony A. Cardoza Old Dominion University
Follow this and additional works at: https://digitalcommons.odu.edu/ots_masters_projects
Part of the Education Commons
Recommended Citation Recommended Citation Cardoza, Anthony A., "A Study Comparing the Technical Problem Solving Abilities of Middle School Students who have Participated in one or more Technology Education Courses to those of students having no course work in Technology Education" (1998). OTS Master's Level Projects & Papers. 293. https://digitalcommons.odu.edu/ots_masters_projects/293
This Master's Project is brought to you for free and open access by the STEM Education & Professional Studies at ODU Digital Commons. It has been accepted for inclusion in OTS Master's Level Projects & Papers by an authorized administrator of ODU Digital Commons. For more information, please contact [email protected].

A STUDY COMPARING THE TECHNICAL PROBLEM
SOLVING ABILITIES OF MIDDLE SCHOOL STUDENTS
WHO HA VE PARTICIPATED IN ONE OR MORE
TECHNOLOGY EDUCATION COURSES TO THOSE OF
STUDENTS HAVING NO COURSE WORK
IN TECHNOLOGY EDUCATION
A RESEARCH STUDY PRESENTED TO
THE GRADUATE FACULTY OF THE
DEPARTMENT OF OCCUPATIONAL MID TECHNICAL STUDIES
OLD DOMINION UNIVERSITY
BY
ANTHONY A. CARDOZA
JULY, 1998
Signature Page
This study was prepared by Anthony A. Cardoza under the supervision of Dr. John M. Ritz in OTED 636, Problems in Education. It was submitted to the Graduate Program Director as partial fulfillment of the requirements for the Master of Science in Technology Education Degree.
Approved by:
~ru?:·7?t Advisor and Graduate Program Director
Date 7-i- i8
1

Table of Contents
Signature Page
Table of Tables
Table of Figures
Chapters
I. INTRODUCTION
Statement of the Problem
Hypothesis
Background and Significance
Limitations
Assumptions
Procedures
Definition of Terms
Overview of Chapters
II. REVIEW OF LITERATURE
The Nature of Problem Solving
The Problem Solving Approach
Summary
11
Page
1
IV
V
1
3
3
3
5
6
6
7
7
9
9
15
23

III. METHODS AND PROCEDURES
Introduction
Population
Research Variables
Instrument Design
Classroom Procedures and Data Collection
Statistical Analysis
Summary
IV. FINDINGS
Introduction
Presentation of Data
Statistical Analysis
Summary
24
24
24
27
28
30
30
31
32
32
32
36
40
V. SUMMARY, CONCLUSIONS AND RECOMMENDATIONS 42
Summary
Conclusions
Recommendations
REFERENCES
APPENDIX I Instrument for Evaluating the Technical Problem
42
46
48
51
Solving Skills of Middle School Students 53
111

Table of Tables
Page
Table 1 Technological Design and Problem Solving Rubric 28
Table 2 Scores for Control Group: Students that Have Not Taken a Course in Technology Education 34
Table 3 Scores for Treatment Group: 7th Grade Students Enrolled in a Technology Education Class 35
Table 4 Scores for Treatment Group: 8th Grade Students Enrolled in a Technology Education Class 36
lV

Table of Figures
Page
Figure 1 Basic Components in Problem Solving 17
Figure 2 Problem Solving Process Wheel 18
Figure 3 Top-Down Problem Solving Method 19
V

CHAPTER I
INTRODUCTION
Technology has an impact on every aspe:ct of our daily lives - the work
we do, our forms of entertainment, the food we: eat, the homes we live in, the
conveyances used to transport ourselves and our goods, how we
communicate around the globe, and so on. Technological advance has
provided the greatest source of economic development. It has increased the
production of goods and services, resulting in a tremendous increase in our
material lives. New products have been created, and the quality of existing
ones has been improved. Advances in technology shape society. These
advances are occurring at an ever increasing rate.
It has become increasingly clear that industry needs employees well
trained in basic skills in order to remain competitive in the high-tech global
marketplace. These employees need to be abl1e to adapt to rapidly changing
conditions, to communicate effectively, to work with different people, and to
solve problems. ( Connections, August 1997, p. 1; Meier, Hovde & Meier,
1996, p. 230) In particular, technological problem solving has been identified
Page 1

as being a critical survival skill in our advanced technological world. (Wu,
Custer & Dryenfurth, 1996, p. 1)
It has also become clear that industry worldwide is experiencing a
work force that is ill prepared to meet the needs of the fast changing,
technologically advanced workplace. (Connections, August 1997, p. 1)
Government, business leaders, and educators in response are calling for more
emphasis on enhancing the problem solving capabilities of students and
employees. (Wu, Custer & Dyrenfurth, 1996, p. 1; Boser, 1993, p. 1) Most
educational disciplines claim to teach students to critically analyze
information and to effectively solve problems. Both the National Council of
Teachers of Mathematics and the National Scit:nce Education Standards
have set problem solving as one of their primary goals. (Meier, Hovde &
Meier, 1996, p. 232) Likewise, technology education programs almost
universally claim the enhancement of student technologic problem solving
abilities as a primary goal (Boser, 1993, p. I; Virginia Department of
Education, Technology Education Service Competency Package, 1989, p. 7)
With the emphasis on promoting problem solving skills in the students of
today's classrooms, are our schools developing these skills? This research
will investigate the success of one middle school as it attempts to accomplish
this goal.
Page 2

STATEMENT OF THE PROBLEM
The problem in this study was to compare the technical problem
solving capabilities of middle school students that have had one or more
nine-week courses in technology education with the technical problem
solving capabilities of middle school students that have had no course work in
technology education.
HYPOTHESIS
H1: Middle school students that have taken at least one nine-week
course in technology education have superior technical problem solving skills
compared to middle school students who have had no course work in
technology education.
BACKGROUND AND SIGNIFICANCE
With the need established for employees with technical problem
solving skills, when is the best time to start teaching these skills to the future
work force? In their research published in 1993, Grant and Alexander
showed that by teaching first year college students emolled in the
pharmaceutical/chemical technology program 1the basic steps in problem
Page 3

solving, their mean test scores at midterm - as compared to a control group -
were considerably higher at the 0.95 significance level. (Grant & Alexander,
1993, p. 14) They recommended further research to clarify the need to
include problem solving in the college curricula.
Other research indicates that the current college curricula does not
significantly change either the personal or technological problem solving
styles of students between the freshman and senior class years. (Wu, Custer
& Dyrenfurth, 1996, p. 10) The authors of that study went on to postulate
that substantial change could be effected if students were taught problem
solving at a much earlier age, such as in elementary school. They reasoned
that training received before critical style and attitudinal characteristics could
solidify would be much more effective.
There is a plethora of articles calling for this emphasis on developing
problem solving skills. Many programs in various disciplines claim to
achieve this goal. No research was found that examines the success of
middle school curricula in improving the probllem solving skills of its
students. Nor was any research discovered that investigates how well the
technology education programs at the middle school level accomplishes an
improvement in students' technical problem solving capabilities.
Page4

LIMITATIONS
The following limitations should be considered during a critique of this
research study:
1. Landstown Middle School is in a suburban area. The results of this
study may not be relevant to schools in urban or rural areas.
2. The students in this study are from varied socioeconomic
backgrounds.
3. Students that participated in this study were randomly selected from
the population at Landstown Middle School.
4. The study was conducted during the spring semester of academic
year 1997-98.
5. A test of technical problem solving was given to a group of students
participating in a technology education course as well as to a control group of
students participating in a non-technology education course in order to
determine the technical problem solving skills of both groups.
ASSUMPTIONS
The following assumptions should be considered when evaluating this
research study:
Page 5

1. The instrument utilized to measure the tee ical problem solving
skills of the students is valid and reliable.
2. The academic background of all students i volved in this research is
essentially the same, e.g., all students have had simil r instruction in
mathematics, science, English, history, social studies etc.
PROCEDURES
The research was conducted to compare the technical problem solving
capabilities of Landstown Middle School studc:nts wltro have completed a
minimum of one nine-week course in technology education to those of
students that have had no technology education. To ccomplish this, a test of
technical problem solving was given to two groups o seventh-grade students
and one group of eighth-grade students enrolled in a echnology education
class and to a control group of students that were e olled in four non
technology education classes. The control group co sisted of three
seventh-grade math classes and one eighth-grade co
The data were analyzed to determine if there as a statistically
significant difference in the technical problem solvin skills of the students
that had instruction in a technology education class c mpared to students
receiving no such instruction.
Page 6

DEFINITION OF TERMS
The following terms are defined so that the reader can understand their
special meaning as they apply to this study.
Problem Solving - a generic ability to de:al with problem situations.
Technical Problem Solving - the systematic way of investigating a
situation and implementing technical solutions.
Problem Solving Approach - a teaching method that encourages the
development of new insights and useful thinking processes through active
investigative learning.
OVERVIEW OF CHAPTERS
Our highly technological global market requires industry to have
employees that are flexible, good at working in groups, take responsibility for
quality products, and are skilled at solving problems. The American
education system has responded to the concerns of industry by setting goals
to improve the ability of students in such core areas as mathematics, science,
and problem solving capabilities. Technology education has embraced the
problem solving approach as a central focus of inst1111ctional activity. (Boser,
1993, p. 1)
Page 7

The following chapter will review the literatur written by educators
that present their findings concerning the need to cul ivate problem solving
capabilities of students in preparation for entry level mployment in industry.
Chapter III will discuss the methods and procedures tilized in this study to
examine the success of the program at Landstown · ddle School in achieving
the goal of technical problem solving development o its students. The
findings of the research study will be presented in C apter IV. Chapter V
will present a summary of what was learned as a res It of the study and
conclusions will be drawn. Recommendations for ture research will also be
made.
Page 8

CHAPTER II
REVIEW OF LITERATURE
Chapter II of this study is the Review of Literature. Within this chapter
are found a section with an overview of the nature of problem solving and a
section which discusses the problem solving approach.
THE NATURE OF PROBLEM SOLVING
In Chapter I, the general term "problem solving" was defined as a
generic ability to deal with problem situations. Problem solving can be
further defined as the process used to obtain a solution to a perplexing
question or situation. (Meier, Hovde, & Meier, 1996, p. 232) The important
point to note is that problem solving is a process. It is a very important
process. The skill level of students in performing the problem solving
process can determine their future employabiliity and the ability of our
industries to compete in the global marketplace. Many educators believe that
it may be the single most important factor in determining the future success of
the students.
Page 9

To become skilled in solving problems, the student must have a
knowledge base that is pertinent to the content of the problem being solved;
the ability to locate, identify, obtain, and evaluate missing information; the
cognitive skills to analyze, reason, classify, and establish relationships;
attitudinal skills to cope with ambiguity, fear, anxiety, and procrastination;
and the ability to use creativity, intuition, and analytical reasoning to reach
the "best" solution to the problem being solved. (Grant & Alexander, 1993,
p. 2)
The following have been identified as common shortcomings of
students in problem solving: difficulty in isolating the problem; lack of a
systematic procedure for solving the problem; inability to hypothesize
solutions; overlooking evidence; making inappropriate associations between
problem elements; functional constraints - the bias to see problem elements in
only their usual function; habitual constraints ·· the tendency to repeat an
already successful solution path; perspective constraints - the inability to view
the problem from other vantages, or viewing it from a restricted perspective;
failure to use all relevant information due to stereotyping, other limiting
biases, or limited memory; emotional constraints - fear of failure; and using
inappropriate representation. (Lee, 1996, p. 8.; Anderson, 1989, p. 6)
Page 10

Bloom's taxonomy of the cognitive domain is taught to prospective
teachers to be used in writing behavior objectives and organizing curriculum
content. Bloom's cognitive domain levels begin at the lower order skills of
knowledge, comprehension, and application and progress to the higher order
skills of analysis, synthesis, and evaluation.
Level one, knowledge, requires the knowledge of specific facts,
terminology, ways of organizing information, sequences, and trends. These
are all basic facts and information residing in the memory of the students.
The next level, comprehension, requires the student to understand what has
been taught. Application, the third level, demands that the students are able
to apply the information they have received to different situations. Analysis
is the ability of the students to recognize the differences in hypotheses and to
critically separate alternative hypotheses. The: ability to collect various parts
and put them together to form a whole is known as synthesis. Evaluation, the
highest order cognitive skill, is the ability to apply judgment and use criteria
and standards to appraise outcomes. (Anderson, 1989, p. 4)
Problem solving requires the student to operate in all six levels of the
cognitive domain. Some of the activities of problem solving that relate to the
cognitive domain levels include:
• gathering information
Page 11

• formulating alternative solutions
• checking the application of alternative solutions in different situations
• analyzing information and determining its relationship to the problem
• synthesizing new solutions
• evaluating the options and selecting the optimal one
In the next section of this chapter, The Probler Solving Approach, the
levels of cognitive domain will be related to specific I steps in the problem
solving process. J
In their research investigating the differences tetween technological
and personal problem solving styles, Wu, Cusiter, an~ Dyrenfurth point out
I
that there are a wide range of problems - such as mafhematics, marital, i I
financial, personal difficulties, alcohol, design enginfering, technology - that I I
need to be solved. According to the authors, 1he ge1eric term "problem
solving" is insufficient to cover this wide array of prbblems. They contend I
that these activities are substantially different in typ~, focus, and intent. Their
study focused on problem solving style - the tendencty to respond in a certain
way - rather than on ability or strategies used to solve problems. Style
should not be confused with knowledge or capability.
The authors used a standardized self-report instrument designed to
assess perceptions of personal problem solving styles and abilities. The
Page 12

instrument contains three sub scales: (1) Problem solving confidence - self
assurance while engaging in problem solving activities. (2)
Approach/ Avoidance - a general tendency of students to approach or avoid
problem solving activities. (3) Personal Control - the extent to which
individuals believe that they are in control of their emotions and behavior
while solving problems. (Wu, Custer, & Dyrenfurth, 1996, p. 2)
One purpose of the study was to determine whether style differences
existed when students were confronted with different types of problems. The
results of the study showed evidence to suppmt that differences do exist
between technological and personal problem solving styles of the university
students in the study. (Wu, Custer, & Dyrenfu.rth, 1996, p. 10) The authors
went on to state that problem solving should be viewed as nature specific.
Different types of problems ( e.g., technological or personal) demand different
kinds and levels of knowledge and capability.
Other researchers have conducted studies on the effects that teaching
problem solving strategies has on student performance. Some specific
strategies that have been shown to be successful will be discussed in the
following section of this chapter. Problem solving is a learned skill that can
be taught. Practice and exercise of the skill - like practice and exercise of any
skill such as music, athletics, flying an aircraft - improves the level of skill.
Page 13

In her research with fifth grade students, King showed that by teaching
strategic problem solving skills to students, existing knowledge was
supplemented by the process, student success was facilitated, and superior
performance on both practical problems and \\ritten problems was attained.
Further, general strategies that are content free: can be applied in any problem
context, as indicated by the trained students ( the treatment group) to
outperform the untrained students (the control group) in solving a novel
problem. (King, 1991, p. 316)
In his article, Patrick also supports the contention that teaching a
general approach to problem solving has application to a broad range of
problems. Although the process or strategy may be taught in a technology,
science, or mathematics course, it will be transferable to other tasks as well.
The technique he suggests is a methodological approach to obtaining real
solutions to open-ended problems and provides a means for logically
understanding a problem prior to attempting a solution. Patrick argues that it
is applicable to any of life's problems and can be a very useful tool for a
child's entire education if taught at an early age. (Patrick, 1993, p. 1) Boser,
a strong proponent of teaching pedagogical skills to teachers that promote
problem solving capabilities in students, reports that practice in applying
Page 14

problem solving skills in a variety of instructional settings may facilitate
transfer of those skills to novel situations. (Boser, 1993, p. 5)
King discovered in her research that students do not naturally or
spontaneously exhibit a strategic approach to solving a problem without
explicitly being trained to do so. (King, 1991, p. 316) Patrick has observed
that unless taught a more sophisticated solution approach to problems, people
tend to continue to utilize methods which are both inefficient and frustrating,
resulting in a lack of confidence in one's problem solving skills. (Patrick,
1993, p. 2)
THE PROBLEM SOLVING APPROACH
Problem solving is a learned skill. It has been identified by industry
and the teaching profession as a skill key to success and required by students
graduating from our secondary schools. There has been much emphasis
placed on teaching this skill across many academic disciplines.
The problem solving approach involves the students in "hands on",
investigative learning that enhances understanding. Students remember more
of what they are taught by the "doing" associated with problem solving. By
participating in a series of practical problem solving activities such as
designing, modeling, and testing technological solutions, students will acquire
Page 15

both technological knowledge and higher order cognitive skills. (Boser, 1993,
p. 2; Sellwood, 1989, p. 4)
There is much that has been written about the process to help achieve
success as a problem solver. A select few approach s will be presented to
expose the reader to some of the variety being off ere in the classrooms
across the country. Although the approaches vary in their proposed specific
steps, the basic concepts are essentially the same. It is important to note at
this point that the specific steps of any one of the ap roaches is not as
important as the process itself. Additionally, the ste sin the approaches
should not be considered as linear. Often times, so e steps are repeated
several times, while others may be omitted.
Garcia provides the following basic compone ts to a systematic
approach to problem solving: a good problem statem nt, a research and
development component, a testing of solutions comp nent, and an evaluation
component. (Garcia, 1994, p. 5) This approach req ires that the student:
• Understand the problem - read the problem c efully; determine what
to look for; and identify relevant information.
• Develop a systematic plan - break the proble down into small,
manageable steps; identify the concepts that a ply to each step; select
Page 16

the best concepts to solve each step; decide how to integrate the
identified concepts.
• Check the solution - verify that all relevant concepts are used; check
that the answer is feasible.
This approach is shown below in Figure: 1. (Garcia, 1994, p. 6)
Problem Solving
Statement d
Testing of Research J --- an 1__., .
Development Solutions Evaluation
Figure 1. Basic Components in Problem Solving.
Another approach can be depicted as a proble solving process wheel
(Figure 2) which has the following six steps (Lee, 1
• Identify the problem - clearly understand the ature, specifications, and
desired results of the problem.
• Gather information - collect as much informat on about the problem as
possible, analyze the data and condense: it to t e main factors or
causes.
• Develop solutions - use divergent thinking to et as many alternative
solutions as possible.
• Select solution - use convergent thinking to fi d the optimal solution.
• Implement solution - try out the solution and et actual results.
Page 17

• Evaluate results - analyze and evaluate the res Its, make modifications
as necessary.
6. Evaluate results
5. lrrplement solution \,
Figure 2. Problem Solving Process heel
Many authors use an acronym to help student remember the basic
steps of the systematic approach. One such acrony1 is IDEAL (Anderson,
1989, p. 5):
• I - Identify the problem.
• D - Define the problem, clarify and sharpen t e boundaries.
• E - Explore alternative approaches.
• A - Act on a plan.
• L - Look at the effects.
Many other acronyms and process models ar available. One last
model that will be reviewed is one that is common! taught in technology
education. As can be seen in Figure 3, it is very si ilar to the others already
Page 18

presented, but visually depicts the reiterative nature of some of the steps
(Patrick, 1993, p. 3)
r-==--1 Problem L.:::.J--------- Definition
Idea c=] Problem --------- Development ---------~ --------- Evaluation --------- Solution
t '
Figure 3. Top-Down Problem Solving Method
In all these methods, some steps are important to remember. The
problem needs to be closely scrutinized to ensure that it is clearly understood.
Complex problems should be reduced to parts that can be more easily solved,
and the criteria by which the solution will be judged must be understood. In
looking for alternate solutions, there are many activities that are called upon
to explore all possible solutions to the problem: working in teams and using
brainstorming and thinking aloud help with creativity and logic. The breadth
of background that the team approach brings is very useful at the alternative
solutions stage. A depth of content knowledge is required to effectively
analyze the alternatives and to determine the most feasible one.
In general, the problem solving skills in students were best developed
by the following:
• provide modeling and practice with feedback.
• use realistic, true-to-life problems.
Page 19

• present material frequently and in varied contexts.
• use a variety of relevant instructional techniques ( small group problem
solving was the most highly ranked technique, but it is considered
desirable to employ a variety of techniques).
• guide the learner through successive levels of complexity.
• make connections between new information and previously acquired
knowledge.
• teach practical communication and social skills.
• use an appropriate representation of a problem solving model (such as
one of those presented in this chapter).
(Boser, 1993, p. 9; Garcia, 1994, p. 7; Lee, 1996, p. 8; Johnson & Thomas,
1992, p. 10)
Several authors recommended "thinking aloud" as a technique to help
students with the meta-cognitive process and to allow fellow students to
observe the logic path of their peers. In her research, King taught fifth grade
students a strategy of asking peers generic guided questions that prompted
them to create their own higher order questions, which in turn drew more
elaborate explanations from the group. King proposed that the requirement
placed upon the student to explain their ideas to someone else forced them to
clarify concepts, elaborate on them, and to reorganize content. (King, 1991,
Page 20

p. 308) The questions were designed to guide the students through the
stages of problem solving as well as to cause them to pay more attention to
their thought processes. The questions caused the participants to: determine
the nature of the problem more precisely; access prior knowledge more
completely; foster greater access to known strategies; generate new ideas and
unique perspectives; analyze components of the problem; reconceptualize the
problem; and to help monitor progress through the process. (King, 1991, p.
310, 315) As noted earlier in this chapter, the results of learning this
questioning technique were superior problem solving capabilities in both
practical and written problems as well as superior problem solving abilities
that were transferred to a novel problem.
As presented earlier in this chapter, problem solving requires the
student to operate in all six levels of the cognitive domain. In the first stage
of problem solving, the student must utilize knowledge, comprehension, and
application to clearly define the problem and to come to a clear understanding
of the final objective. Thinking must be logical and based upon content
knowledge of material previously learned. When the student is looking for
alternative solutions and idea development, ht::: must operate in the cognitive
levels of application and synthesis. Creative thinking is being utilized to
generate as many solutions as possible. The knowledge of material
Page 21

previously learned is applied to this new situation that the student is
attempting to solve. Various ideas generated may be combined to form new
ideas. The student must use analysis and evaluation skills to judge the
options when selecting the best one to be utilized to solve the problem. Each
idea is broken down and its feasibility discussed. The merits of each idea is
evaluated and compared to other ideas. All of the cognitive levels are
employed to some extent during the implementation or testing stage. This is
the active "doing" - or making - stage in which the student is predicting,
measuring, estimating, assembling, using trial and error, and revising until the
solution is obtained. (Sellwood, 1989, p. I 0) Knowledge, comprehension,
application, and synthesis skills are employed when constructing the solution.
Analysis and evaluation skills are constantly being utilized to judge the
effectiveness of the solution and to make modifications. This is a constant,
reiterative portion of the problem solving process. Finally, the solution is
evaluated to determine if it effectively satisfies the final objective. The
students ask themselves, "Have we successfully met the requirements of the
problem? What could we have done better? \Vhat have we learned from this
problem?" Evaluation skills - the highest ordt:r cognitive level - are actively
employed throughout much of the problem solving process.
Page 22

SUMMARY
The process of solving problems is a learned skill that can be
effectively taught to students. There are numerous examples of successful
programs at different educational levels ranging from elementary school to
college that have been instituted to teach the process of problem solving. It is
widely accepted that effective problem solving skills are critical to the
continued success of the individual students, industry, and even our nation.
The debate continues regarding the specificity of problem solving styles for
various types of problems that can be encountered. This author contends that
teaching a generic approach to problem solving - e.g., teaching students a
successful problem solving process - has broad application to a wide range of
problems. Once a student has been taught a process to solve problems
effectively, the main factor that will determine successful solving of the
problem is the content knowledge that the student possesses regarding the
problem.
Page 23

CHAPTERIII
METHODS AND PROCEDURES
Chapter III of this quasi-experimental study covers the methods and
procedures used to collect data. Within this chapter are found sections which
are concerned with the population used in the study, the research variables of
the study, the instrument design, classroom procedures, methods used in data
collection, and methods of statistical analysis.
POPULATION
The population utilized in this study are male and female students in
grades seven and eight at Landstown Middle School in Virginia Beach,
Virginia. Landstown Middle School is in a predominantly suburban area with
a small proportion of the population coming from rural areas. The population
comes from varied socioeconomic backgrounds, with the majority in the
middle class range.
The sample population that was tested for this study consisted of
seventy-eight students - fifty-two in the treatment group and twenty-six in the
control group. The treatment group consisted of students that were enrolled
Page 24

in a technology education class - two seventh-·grade and one eighth-grade
classes. Four groups of students were used as a control for this study - three
were enrolled in a seventh-grade general track math class and one in an
eighth-grade computer class. Students were sdected based on enrollment in
the specific class with no regard to gender, academic performance, or
socioeconomic background. Test results were excluded from the study for
those students in the control groups that had previously taken technology
education.
Students at Landstown Middle School may take technology education
as an elective course once during each of their three years at the school. The
sixth- and seventh-grade students take the course for a nine-week period.
The course at these grade levels consists entirely of Synergistics modules.
The specific modules include: computer assisted design, automotive research,
research and design ( CO2 car), drafting, engineering (bridge building),
plastics, materials and processes (wood and Plexiglas desk caddie),
aerospace, flight technology, rocketry and space technology, computer
graphics and animation, computer-based problem solving, computer
fundamentals and MS-DOS, electricity, electronics, Lego/TC Logo, computer
applications, transportation, power and energy mechanics, energy and power
Page 25
transmission, audio broadcasting, biotechnology, satellites, and desktop
publishing.
The eighth-grade students taking technology education are enrolled for
an entire 18-week semester. The eighth-grade course is divided into two
parts: Synergistics modules for nine weeks and two separate project activities
for nine weeks. The project activities are conducted by two different
instructors. One instructor introduces the problem solving process during a
period of two to three days of instruction. In addition, other academic
material relevant to technology education is presented by both instructors.
Specific activities aimed at reinforcing problem solving skills are not
presented.
The project in one class requires the students, working in groups of
two or three, to design an original electronic device. The students conduct
research in the area of the device they are designing, produce a computer
aided drawing of the device, and build a concept model using electronic parts.
The project in the other class is conducted along the lines of a "design brief'.
The students are given a problem to solve within certain design constraints
(such as types and amounts of materials allowed). This project requires the
students to produce an original design, an accurate drawing, and a working
product that solves the given problem.
Page 26

RESEARCH VARIABLES
The research variables in this study include variations in the manner in
which course materials are taught within the general education courses taken
by all students. Although differences in teaching methods - with
corresponding success of students' performance in academics - do exist, it
was assumed for this study that the differences were negligible.
Student backgrounds and experiences outside the classroom
surroundings also differ. Some students may be exposed to learning problem
solving through situations other than those presented in the academic
environment. Considering the age and developmental stage of the population,
this variable was considered inconsequential for this study.
Students at this stage of development vary significantly in emotional
maturity. This may have a considerable impact on learning. The groups were
picked based solely on enrollment in specific classes. Math is a required
class for all students. Technology education is an elective taken by a diverse
group of students - e.g., the enrolled population is not specifically skewed. It
is therefore assumed that there is equal chance of having an equivalent spread
of emotional development levels among the population.
Page 27

INSTRUMENT DESIGN
The instrument used in this study was designed by the author. It is
based on an assessment rubric that was developed by Custer, Valesey, and
Burke for their research titled "Evaluating the Effects of the Design Under
Constraint Approach to Technological Problem Solving". The rubric
incorporates learner outcome dimensions and strands of technological design
and problem solving as illustrated in Table 1 below.
Technological Design and Problem Solving Rubric
Dimension: 1. Constraint 2. Development 3. Construct a 4. Evaluate Clarification of Preliminary Prototype Design &
Design Incorporate Solution Refinements
Strand 1: Gain a clear Brainstorm Select Critical analysis understanding possible appropriate of design and of problem solutions methods/tools prototype
Strand 2: Clarify design Select a solution Alter design as Evaluate design constraints based on needed to in light of
constraints construct a design prototype constraints
Strand 3: Address group Develop Assess quality Redesign and organization & implementation of prototype refinement process issues olans solutions
Strand 4: Access information from other academic areas (math, science)
Table 1
The instrument is designed to test each of the four dimensions:
constraint clarification, development of preliminary design solution, construct
Page 28

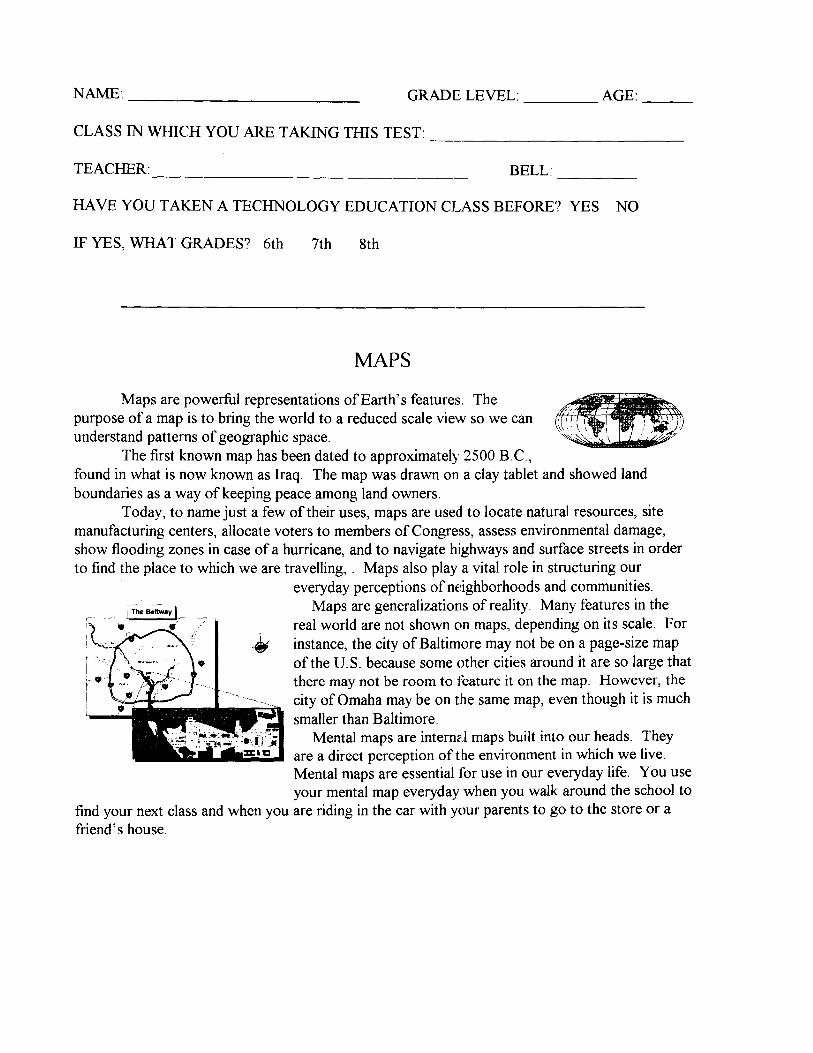
a prototype, and evaluate design and incorporate refinements. The instrument
consists of a short passage to orient the students regarding the importance and
usage of maps. Next, the students are given information regarding the road
segments which can be used to construct a map of the local area between
their school and a major shopping mall approximately four miles away.
Dimension one, constraint clarification, is evaluated by a series of five
questions. These questions challenge the student to think about such map
characteristics as scale, direction (use of a compass rose), and a legend.
Development of preliminary design solution, dimension two, is evaluated by
challenging the students to construct two maps of the area described in the
paragraph above as possible solutions. The five questions posed and the
information on road segments provide information to guide the students in
creating possible solutions (maps) which are credible. Dimension three,
construct a prototype, is evaluated by asking the students to alter their designs
as necessary and create a final solution - draw a final map showing the area
between their school and the shopping mall. Finally, the students were given
a copy of a commercial map and asked to evaluate their final design, in order
to judge dimension four - evaluate design and incorporate refinements. The
instrument is presented in Appendix I.
Page 29

CLASSROOM PROCEDURES AND DATA COLLECTION
Students worked alone on the test. The test was administered at one
time to each class during a period of forty-five minutes. Students in the
control classes were asked to indicate on the test whether they had previously
taken a technology education course.
Due to the somewhat subjective nature of evaluating this instrument,
the tests were graded by a panel of two teachers to evaluate quality of
responses. Each dimension was evaluated on a scale of 1-5, with 1 being the
lowest possible score and 5 the highest. A score of 1 represents an
evaluation of unsatisfactory, 2 is below average, 3 average, 4 above average,
and 5 represents an excellent score. Scores were tabulated by group:
treatment groups (7th grade and 8th grade grouped separately) and control
group (7th and 8th grades grouped together).
STATISTICAL ANALYSIS
The mean, the range, and the standard deviation were computed for the
scores for each group. A series of one tail t-tests were conducted to
determine if there was a significant difference between the means of the
different groups.
Page 30

SUMMARY
The instrument designed for this quasi-1;!xperimental study by the
author will help to determine the technical problem solving abilities of middle
school students with varying backgrounds in technology education. Using the
results of the test, it may be determined statistically if one group of students
had a superior ability to solve the problems presented. Once it has been
determined which groups were better able to solve the problems presented by
the test instrument, conclusions can be drawn. Chapter IV of the study will
present test scores and research findings.
Page 31

CHAPTERIV
FINDINGS
The findings of this study are presented in Chapter IV. The purpose of
this study - to compare the technological problem solving capabilities of
middle school students that have had one or more technology education
classes to those of students having had no course work in technology
education - was accomplished by administering an instrument designed by the
author. The results of the test will be presented for both the treatment group
and the control group. The treatment group results are further separated into
8th grade and 7th grade groups to investigate whether the different curricula
in the technology education courses make a difference in the problem solving
abilities of the students. Data are presented in both narrative form and in
tables.
PRESENTATION OF DATA
The scores are based on a scale of 1-5, with 1 being the lowest score
and 5 the highest. A score of 1 represents an evaluation of unsatisfactory, 2
is below average, 3 average, 4 above averag,~, and 5 represents an excellent
score.
Page 32

The control group consisted primarily of students in 7th grade general
track mathematics, with one student from an 8th grade computer course
included. The mean overall score for the control group was 2.432, with a
range of 2. 83, a variance of O. 4 23 9, and a standard deviation of O. 6 511. The
scores for the control group are presented in Table 2. Each student's
performance is recorded for each dimension and an overall score is presented
as well, using the 1-5 scale. Dimension 1 is constraint clarification;
dimension 2 is development of preliminary design solutions; construct a
prototype is dimension 3; and evaluate design and incorporate refinements is
dimension 4.
The performance on the instrument of the first treatment group - 7th
grade students that are enrolled in a technology education class - is presented
in Table 3. Their mean overall score was 2.24, with a range of 2.73, a
variance of0.5525, and a standard deviation of0.7433.
The second treatment group - 8th grade students enrolled in a
technology education class - scored a mean overall of 2. 69 on the test, with a
range of2.57, a variance of 0.4278, and a standard deviation of 0.6616. The
individual student scores for this group are presented in Table 4.
Page 33

SCORES FOR CONTROL GROUP Students That Have NOT Taken a Technology Education Class
Stud# Dim 1 Dim2 Dim 3 Dim 4 Total (mean) 1 1.7 1 1.5 1.5 1.43 2 4.4 2.5 3 3 3.23 3 3.3 2 3 1 2.33 4 2 3 3 2.5 2.63 5 4.8 2.5 4 4 3.83 6 3.3 1.5 3
,., 2.7 .,
7 2.7 2 3 3 2.68 8 3.6 2 3 4 3.15 9 1 1 1 1 1 IO 2.9 3 3 1.5 2.6 11 2.1 2.3 1 2 1.85 12 2.4 2.5 2.5 2 2.35 13 1.9 1.5 2 2 1.85 14 1.8 2 2 3 2.2 15 2 2 3 2 2.25 16 3.9 3 2.5 2.5 2.98 17 2.5 2 2.5 2 2.25 18 2.2 2 2.5 1 1.93 19 2.6 2 2.5 2 2.28 20 2.8 2.5 4 3 3.08 21 1.5 2 2 1 1.63 22 2.3 2 1 1 1.58 23 2.9 2.3 3.3 3.5 3 24 3.6 1.8 2 3.5 2.73 25 3.8 3 2.5 4.5 3.45 26 3 1.5 2.5 2 2.25
mean: 2.73 2.11 2.51 2.37 2.43
Table 2
Page 34

SCORES FOR TREATMENT GROUP 7th Grade Students Enrolled in a Technology Education Class
Stud# Dim 1 Dim 2 Dim 3 Dim 4 Total (mean) 1 1.3 1.3 1.5 1.5 1.4 2 3.1 2.8 4 5 3.73 3 3.2 2.5 1 2 2.18 4 3.4 1.3 1 2.5 2.05 5 4.8 3 3 1.5 3.08 6 1.6 1 1 1 1.15 7 1.7 1 I 1 1.18 8 2.7 1.3 3 3 2.5 9 2.4 2 1.5 4.5 2.6 10 2 2 1 1 1.5 11 2.9 3.5 4 2.5 3.23 12 2.7 3 2.5 3 2.8 13 2.9 1.5 1.5 1 1.73 14 1.6 2.3 2.5 2 2.1 15 1.6 2.8 2.5 2 2.23 16 1.3 3 4 3 2.83 17 2.2 2.3 2.5 1 2 18 2.9 2.8 2.5 1.5 2.43 19 2.3 3 4 2.5 2.95 20 2.4 1.5 1 1 1.48 21 2.4 1.3 1 1 1.43 22 3.2 2.5 4 4.5 3.55 23 1.4 1 1 5 2.1 24 2.3 3.3 3 2.5 2.78 25 1 1 1 1 1 26 2 1 1 3.5 1.63 27 4 3.3 3 3.5 3.45 28 1.5 1.5 2 3.5 2.13 29 1 2 1 3.5 1.88
II mean: 2.34 2.1 2.14 2.43 2.24
Table 3
Page 35
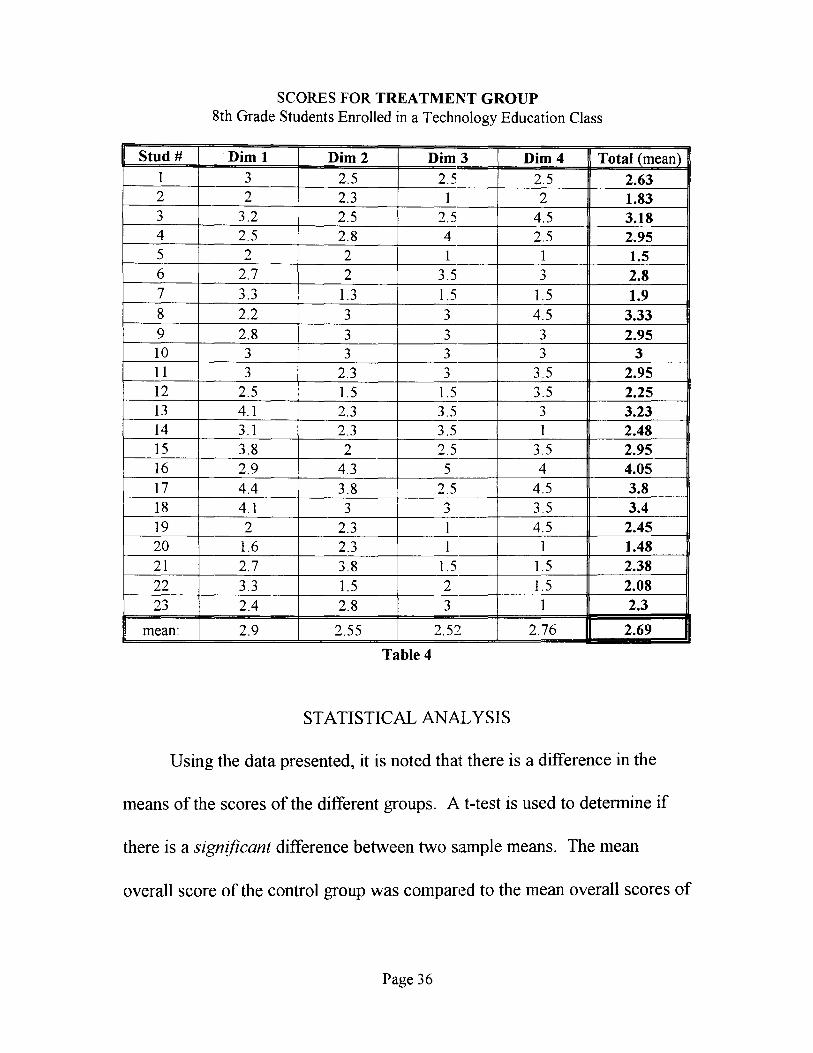
SCORES FOR TREATMENT GROUP 8th Grade Students Enrolled in a Technology Education Class
Stud# Dim 1 Dim2 Dim 3 Dim 4 Total (mean) 1 3 2.5 2.5 2.5 2.63 2 2 2.3 1 2 1.83 3 3.2 2.5 2.5 4.5 3.18 4 2.5 2.8 4 2.5 2.95 5 2 2 1 1 1.5 6 2.7 2 3.5 3 2.8 7 3.3 1.3 1.5 1.5 1.9 8 2.2 3 3 4.5 3.33 9 2.8 3 3 3 2.95 10 3 3 3 3 3 11 3 2.3 3 3.5 2.95 12 2.5 1.5 1.5 3.5 2.25 13 4.1 2.3 3.5 3 3.23 14 3.1 2.3 3.5 1 2.48 15 3.8 2 2.5 3.5 2.95 16 2.9 4.3 5 4 4.05 17 4.4 3.8 2.5 4.5 3.8 18 4.1 3 3 3.5 3.4 19 2 2.3 1 4.5 2.45 20 1.6 2.3 1 1 1.48 21 2.7 3.8 1.5 1.5 2.38 22 3.3 1.5 2 1.5 2.08 23 2.4 2.8 3 1 2.3
mean: 2.9 2.55 2.52 2.76 2.69
Table 4
STATISTICAL ANALYSIS
Using the data presented, it is noted that there is a difference in the
means of the scores of the different groups. At-test is used to determine if
there is a significant difference between two sample means. The mean
overall score of the control group was compared to the mean overall scores of
Page 36

each of the treatment groups using the statistical t-test method. Additionally,
the mean score of the control group for each dimension was compared to the
mean scores of each of the treatment groups for each corresponding
dimension using the statistical t-test method. The one tail t-test calculations
were performed using the computer-based program StatMost, Statistical
Analysis and Graphics.
Seventh Grade Overall Comparison
The resulting calculation for the one tail t-test comparing the mean
overall score of the control group to the mean overall score of the treatment
group of 7th graders enrolled in technology education is O. 9718 at a
confidence level of 0.95 and with a degree of freedom of 53. The critical
t-value is 1.6741.
Eighth Grade Overall Comparison
The resulting calculation for the one tail t-test comparing the mean
overall score of the control group to the mean overall score of the treatment
group of 8th graders enrolled in a technology education class is 1.3439 at a
confidence level of 0.95 and with a degree of freedom of 47. The critical
t-value is 1.6779.
Page 37
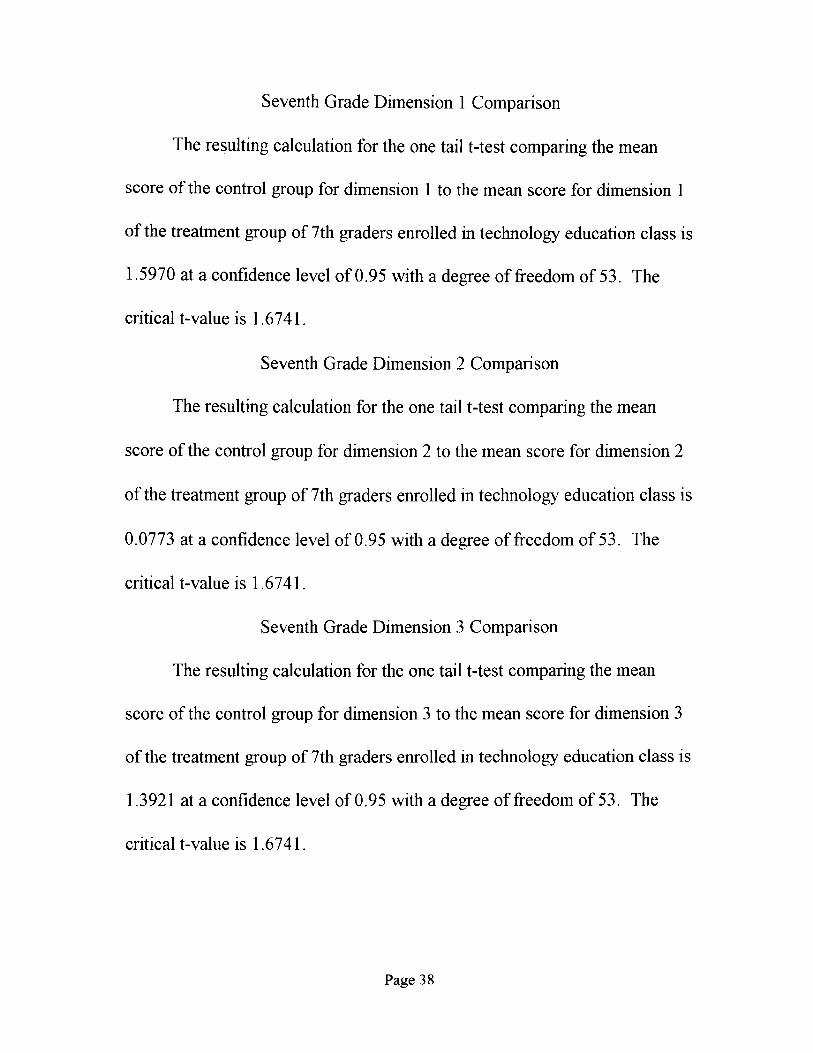
Seventh Grade Dimension 1 Comparison
The resulting calculation for the one tail t-test comparing the mean
score of the control group for dimension 1 to the mean score for dimension 1
of the treatment group of 7th graders enrolled in technology education class is
1.5970 at a confidence level of0.95 with a degree of freedom of 53. The
critical t-value is 1.6741.
Seventh Grade Dimension 2 Comparison
The resulting calculation for the one tail t-test comparing the mean
score of the control group for dimension 2 to the mean score for dimension 2
of the treatment group of 7th graders enrolled in technology education class is
0.0773 at a confidence level of0.95 with a degree of freedom of 53. The
critical t-value is 1.6741.
Seventh Grade Dimension 3 Comparison
The resulting calculation for the one tail t-test comparing the mean
score of the control group for dimension 3 to the mean score for dimension 3
of the treatment group of 7th graders enrolled in technology education class is
1.3921 at a confidence level of0.95 with a degree of freedom of 53. The
critical t-value is 1.6741.
Page 38

Seventh Grade Dimension 4 Comparison
The resulting calculation for the one tail t-test comparing the mean
score of the control group for dimension 4 to the mean score for dimension 4
of the treatment group of 7th graders enrolled in technology education class is
0.2069 at a confidence level of0.95 with a degree of freedom of 53. The
critical t-value is 1.6741.
Eighth Grade Dimension I Comparison
The resulting calculation for the one taill t-test comparing the mean
score of the control group for dimension 1 to the mean score for dimension 1
of the treatment group of 8th graders enrolled in technology education class is
0.6895 at a confidence level of 0.95 with a degree of freedom of 47. The
critical t-value is 1.6779.
Eighth Grade Dimension 2 Comparison
The resulting calculation for the one tail t-test comparing the mean
score of the control group for dimension 2 to the mean score for dimension 2
of the treatment group of 8th graders enrolled in technology education class is
2.3468 at a confidence level of 0.95 with a degree of freedom of 47. The
critical t-value is 1.6779.
Page 39
Eighth Grade Dimension 3 Comparison
The resulting calculation for the one tail t-test comparing the mean
score of the control group for dimension 3 to the mean score for dimension 3
of the treatment group of 8th graders enrolled in technology education class is
0.0381 at a confidence level of0.95 with a degree of freedom of 47. The
critical t-value is 1.6779.
Eighth Grade Dimension 4 Comparison
The resulting calculation for the one tail1 t-test comparing the mean
score of the control group for dimension 4 to the mean score for dimension 4
of the treatment group of 8th graders enrolled in technology education class is
1.2206 at a confidence level of 0.95 with a degree of freedom of 47. The
critical t-value is 1.6779.
SUMMARY
The findings of the research study, obtained by using a one tail t-test
to determine if there is a significant difference in the means of the control
group compared to the means of the treatment groups of students enrolled in
a technology course at either the 7th grade or 8th grade level, were presented
in this chapter. Chapter V will provide a summary of this research study, a
Page 40

conclusion based upon the data that has been collected and statistically
analyzed, and recommendations on how this research may be of value.
Page 41

CHAPTER V
SUMMARY, CONCLUSIONS AND RECOMMENDATIONS
This chapter will summarize the preceding four chapters. It will review
the problem of the study, the research goals, why the study is significant, the
limitations of the study, the population used for the research, the instrument
used to obtain data, data collection procedures, and statistical procedures.
Conclusions will be offered based upon the findings of the research. That is,
the research goals will be answered based upon the data that was collected.
Finally, recommendations will be suggested as to how the research findings
may be practically implemented.
SUMMARY
The problem in this study was to compare the technical problem
solving capabilities of middle school students that have had one or more
nine-week courses in technology education with the technical problem
solving capabilities of middle school students that have had no course work in
technology education.
Page 42

Research goals are presented to provid,~ the direction or framework to
solve the problem. The goal for this research is presented in the following
hypothesis:
H,: Middle school students who have taken at least one nine-week
course in technology education have superior technical problem solving skills
compared to middle school students who have had no course work in
technology education.
A review of literature indicates that in order to be competitive in the
global marketplace, industry needs employees that are well trained in problem
solving, able to communicate effectively, are flexible to changing work
conditions, and are able to work well with different people. It was found that
many disciplines in our schools claim to achieve the goal of developing
problem solving skills in students. In particular, modem technology
education programs universally claim to improve the students' abilities in the
area of solving technological problems. Despite all this emphasis on teaching
problem solving skills, no research was found that examines the success of
middle school programs in improving their students' abilities in this area.
Neither was any research discovered that investigates how well middle school
technology education programs currently in place are able to improve the
students' technological problem solving abilitie:s.
Page 43
This study was conducted at Landstown Middle School in Virginia
Beach, Virginia, during the spring semester of 1998. The school is in a
suburban area, with the majority of the students from the middle
socioeconomic class. Therefore, the results of this study may not be relevant
to schools in urban or rural areas.
The population used in this study consisted of both male and female
students in grades seven and eight at Landstown Middle School. Three
seventh-grade general track math classes and one eighth-grade computer class
were utilized as a control group for this study. The results of those students
from these classes that indicated that they had previously taken a technology
education class were omitted from the study. A total of 26 students indicated
that they had no previous instruction in technology education. Only one
eighth-grader was in this category. The treatment group consisted of students
currently enrolled in technology education classes. One class of twenty-three
eighth graders and two classes for a total of twenty-nine seventh graders were
used as the treatment groups in the study.
The seventh-grade technology education curriculum at Landstown
Middle School consists of nine weeks of "career exploration", utilizing only
Synergistics modules. No other technology concepts are taught outside of
what the modules present. The eighth-grade curriculum lasts an entire
Page 44

semester and is divided into two nine-week periods. One nine-week period
consists of the same Synergistics modules that the sixth- and seventh-grade
students use. The other nine-week period consists of instruction on the
history of technology, the problem solving process, basic mechanical
drawing/sketching, machine safety, and materials processes. The instruction
is a prelude to completing two separate projects. One project requires the
students to research, design, and build a concept model of an original
electronic device utilizing electronic parts. The other project is a "design
brief' type problem that challenges the students to find a solution to a given
problem within certain design constraints. The project involves materials
processing with primarily wood and Plexiglas. Although the problem solving
process is introduced to the students, the concepts are not specifically
reinforced with practice problems or drills.
The instrument used in this study was designed by the author. It is
based on an assessment rubric that was developed by Custer, Valesey, and
Burke for their research titled "Evaluating the Effects of the Design Under
Constraint Approach to Technological Problem Solving". The rubric
incorporates learner outcome dimensions and strands of technological design
and problem solving. The instrument is designe:d to test each of the four
dimensions: constraint clarification, development of preliminary design
Page 45

solution, construct a prototype, and evaluate design and incorporate
refinements.
Students worked alone on the test. The test was administered during
the end of the semester at one time for each class during a period of forty-five
minutes. Due to the somewhat subjective nature of evaluating this
instrument, the tests were graded by a panel of two teachers to evaluate
quality of responses. Each dimension was evaluated on a scale of 1-5, with 1
being the lowest possible score and 5 the highc:st. A score of I represents an
evaluation of unsatisfactory, 2 is below average, 3 average, 4 above average,
and 5 represents an excellent score. Scores were tabulated by group:
treatment groups (7th grade and 8th grade grouped separately) and control
group (7th and 8th grades grouped together).
The mean, the range, and the standard dc:viation were computed for the
scores for each group. A series of one tail t-tests were conducted to
determine if there was a significant difference between the means of the
different groups.
CONCLUSIONS
The goal for this research is presented in the following hypothesis:
Page 46

H1: Middle school students who have taken at least one nine-week
course in technology education have superior technical problem solving skills
compared to middle school students who have had no course work in
technology education.
The mean overall score for the control group was 2.432, with a range
of 2.83, a variance of 0.4239, and a standard deviation of0.6511. The mean
overall score of the seventh grade treatment group was 2.24, with a range of
2.73, a variance of 0.5525, and a standard deviation of 0.7433. The mean
overall score for the eighth grade treatment group was 2. 69, with a range of
2.57, a variance of 0.4278, and a standard deviation of 0.6616. The resulting
calculation for the one tail t-test comparing the control group mean to the
eighth grade treatment group mean is 1.3439. The critical t-value at the 0.95
confidence level is 1.6779. Based upon the statistics reported, the hypothesis
is rejected.
After observing the curriculum at Landstown Middle School, the
author suspected that the sixth- and seventh-grade technology education
programs, which are based solely upon Synergistics modules, would yield no
significant difference in the technological problem solving skills of the
students enrolled. In fact, the treatment group at the seventh-grade level
actually achieved lower on the mean overall score than did the control group.
Page 47

Though, it was not statistically a significantly lower score. While the
Synergistics modules may provide the developing, middle school-age student
exposure to different technological career areas, presented as a stand alone
program they do not enhance the technical problem solving capabilities of the
students.
The treatment group at the eighth-grade level achieved a higher overall
mean score than did the control group. However, the difference was not
significant at the 0.95 confidence level.
The students in Landstown Middle School technology education
classes at the eighth-grade level receive an introduction to the problem
solving process - though no drills/exercises are utilized to reinforce primary
learner outcome dimensions and strands of technological design and problem
solving. The curriculum at this level appears to have some beneficial impact
on the students' abilities to solve technological problems, though not a
profound effect.
RECOMMENDATIONS
From this study it is apparent that modular, computer-based instruction
that is independent of any other pedagogy does not effectively improve
students' technical problem solving capabilities. Additionally, the teaching of
Page 48

the problem solving process without emphasis on learning to effectively
perform each portion of the process results in very limited student success in
technical problem solving. Based on these observations and the review of
literature, the following recommendations are made:
• Technology education courses should include the teaching of problem
solving strategies with exercises, drills, and projects used to reinforce
concepts.
• The focus of teaching problem solving skills should be on the
systematic process, not fact memorization.
• Problems presented to challenge the teclmical problem solving abilities
of the students should be practical, with relevant, real-world
applications. The problems should be open ended and multi-faceted.
• Technology education programs in the schools should review their
curriculum to evaluate whether or not the goals of the program are
being met. Exposure to high tech equipment does not necessarily mean
that the students' minds are actively engaged in the identification and
solution of problems.
• Students should have the opportunity to work in pairs or small groups
in problem solving activities. Thinking aloud, strategic questioning,
Page 49

positive responses to questioning, and ideation strategies should be
emphasized.
• Provide positive reinforcement to individual students that exhibit
appropriate problem solving strategies.
Page 50

REFERENCES
Anderson, Lowell D. (1989). Problem Solving in Technology Education. The Technology Teacher, September/October 1989, 3-7.
Boser, Richard A. (1993). The Development of Problem Solving Capabilities in Pre-service Technology Teacher Education. Journal of Technology Education, Spring 1993, Vol. 4 No. 2.
Custer, Rodney L., Valesey, Brigitte, and Burke, Barry (1997). Evaluating the Effects of the Design Under Constraint Approach on Technological Problem-solving. CTTE Research Proposal.
Falcioni, John G. (1995). Teaching Technology Early On. Mechanical Engineering, May 1995, Vol. 117 Issue 5, 4.
Garcia, Julio R. (1994). Use of Technology in Developing Problem Solving/Critical Thinking Skills. Paper presented at San Jose State University, May 5, 1994. Educational Resources Information Center.
Grant, George F. and Alexander, William E. (1993). Problem Solving Strategies for Pharmaceutical/Chemical Technology College Students, Educational Resources Information Center.
James, William Karl (1990). Development of Creative Problem-Solving Skills. The Technology Teacher. February 1990, 29-30.
Johnson, Scott D. and Thomas, Ruth (1992). Technology Education and the Cognitive Revolution. The Technology Teacher. January 1992, 7-12.
King, Alison (1991). Effects of Training in Strategic Questioning on Children's Problem-Solving Performance. Journal of Educational Psychology, 1991, Vol. 83 No. 3, 307-317.
Lee, Lung-Sheng Steven (1996). Problem Solving as Intent and Content of Technology Education. Paper presented at International Technology Education Association Annual Conference, March 31-April 2, 1996.
Page 51

Meier, Sherry L., Hovde, Robert L., and Meit!r, Ronald L. (1996). Problem Solving: Teachers' Perceptions, Content Area Models, and Interdisciplinary Connections. School Science & Mathematics, May 1996, Vol. 96 Issue 5, 230-238.
Morse, Linda W. (1995). The Influence of Problem-Solving Strategies and Previous Training on Performance of Convergent and Divergent Thinking. Journal of Instructional Psychology, December 1995, Vol. 22 Issue 4, 341-349.
Patrick, Charles (1993). Teaching Top-Down Problem Solving. Paper presented at the Annual Conference of the American Vocational Association, December 3-7, 1993.
Sellwood, Peter (1989). The Role of Problem Solving in Developing Thinking Skills. The Technology Teacher, December 1989, 3-10.
Wu, Tain-Fung, Custer, Rodney L., and Dyrenfurth, Michael J. (1996). Technological and Personal Problem Solving Styles: Is There a Difference? Journal of Technology Education, Spring 1996, Vol. 7 No. 2.
Zuga, Karen F. and Bjorkquist, David C. (1989). The Search for Excellence in Technology Education. Journal of Technology Education, Fall 1989, Vol. I No. 1.
Page 52

Appendix I
Instrument for Evaluating the Technical Problem Solving Skills of Middle School Students
Page 53
NAME: -------------- GRADE LEVEL: ____ AGE: __ _
CLASS IN WHICH YOU ARE TAK.ING THIS TEST:
TEACHER: ------------------ BELL: ___ _
HA VE YOU TAKEN A TECHNOLOGY EDUCATION CLASS BEFORE? YES NO
IF YES, WHAT GRADES? 6th 7th 8th
MAPS
Maps are powerful representations of Earth's features. The purpose of a map is to bring the world to a reduced scale view so we can understand patterns of geographic space.
The first known map has been dated to approximately 2500 B.C., found in what is now known as Iraq. The map was drawn on a clay tablet and showed land boundaries as a way of keeping peace among land owners.
Today, to name just a few of their uses, maps are used to locate natural resources, site manufacturing centers, allocate voters to members of Congress, assess environmental damage, show flooding zones in case of a hurricane, and to navigate highways and surface streets in order to find the place to which we are travelling, . Maps also play a vital role in structuring our
everyday perceptions of m:ighborhoods and communities. Maps are generalizations of reality. Many features in the
real world are not shown on maps, depending on its scale. For ... instance, the city of Baltimore may not be on a page-size map
of the U.S. because some other cities around it are so large that • there may not be room to feature it on the map. However, the
city of Omaha may be on the same map, even though it is much smaller than Baltimore.
Mental maps are internal maps built into our heads. They are a direct perception of the environment in which we live. Mental maps are essential for use in our everyday life. You use your mental map everyday when you walk around the school to
find your next class and when you are riding in the car with your parents to go to the store or a friend's house.

CONSTRUCTING YOUR OWN MAP
Later, during this class, you will be asked to construct a map showing the most direct route to get from Landstown Middle School to Lynnhaven Mall. Listed below are distances and headings between major intersections as well as intersections of interest in order for you to make your map as accurate as possible. The map will have to fit on half a standard sheet of paper, e.g. the size of the paper will be 5½ in. X 8½ in. The entire area that the map will represent is approximately 3 mi. X 3 mi.
SePment of Road Distance (mi.'1 Initial HeadinP Landstown M.S. - Concert Dr. 0.2 Southeast Recreation Dr. - Princess Anne Rd. 0.4 Northeast Concert Dr. - Independence Blvd 1.1 Northwest Independence Blvd - Lynnhaven Pkwy ( on Princess Anne) 0.5 Northwest Princess Anne - Independence ( on Lynnhaven) 0.6 Northeast Princess Anne - Lynnhaven (on Independence) 0.4 North Independence - Holland 1.6 Northeast Holland - Lynnhaven Mall Main Entrance (at International Parkway) 1.7 Northeast
LMS direct to Mall ( as crow flies) 3.7 Northeast
Questions
1. What is the maximum scale that can be used for the map that you draw (i.e. x in. = y mi.)?
2. How will a user of your map know what the scale is?
3. How will a user of your map know what direction the roads are going (i.e. north, northwest, south, etc.)?
4. How will a user of your map know which roads are highways, major surface streets, or minor surface streets?
5. How will special interest locations such as schools, churches, and shopping malls be indicated on your map? How will the user of the map know what the symbols mean? _______ _

..
!'
': I ' I , ' I --· ----· -- - ---- --:<>-----t--1---1------ -- :~-, -.-- :--t-+-, ,·. ~1'-;--,-4--~,---,--r-t-;---,---+---+---,--r-~-+--+---.,--,-
-~ ------~-~--------'-+-----'------f-; _;_~..,..: -'---;------+' t -+-·--i-+-+-H--i--+--+-++-.:._"--iri-'-......;...-l...+...\.-!--,--'-_;___;_
,- - -: _/_1_/_ I ' I I I
I I I I I
I I i I i ! I
: i I
I I i I I I ! I I I
------ - --,-----:--;,-:-:-t-~~--r--,-----:--:-:---+-----;_.._+-+-1-H-+-H_i_+--+~4++--:-....Lµ+-!-l-_.;_JI
I :-i---:__-I
i j I I I I
_ --=--=~::-- =--==: ---,_-:_-,_-_++----_-_f ___ i__,_:_-_c_-__ -=_:--l -: i : :--~-,-, :-H-+1-+---+--+-+-1--i--'--+--+-~-'-+-+----'--+--,--+-~:...-. .......... -!
I
! i I
I !
I I
i I i i ' I I I
' i ; --+--'-' -' --~-1---,-' -'--i - ---- _J_L_I_I -'--' _i'--1--'---'-- I l-+-f-'1--i-+--+--~-'--+-'--i--'--+--'--+----'--f-''-'--'-~-+--..;.,_..
'ii i'I ~ I : I ! I / I I I i --~-+-+---t--+-H-+-+--,-++--'--+-c-l--'--+-+--t-+-f-i-r-+---
I I I ! i
I ! I I ~
I I i,
I : I i
I I I I
-- -·--+---t--"''--t-1 -t---:-----' ~I --t---'--' --:'~---:--:--+-l.._Cl_;__-+_11---'i-+I +_j; ___ j....i' +.!..i -H'-++++-ih_;__j.:..+--:-:-t-!--l.......L.l-l-J-1.._L--4-L'._ ' I I I I I
I I I l I !
i I ! : i ' ! I i I
I I
: I i I i
.......--:;
I I i I ! I I ! !
I i i I I ! I i ! i
i i ' '
I i ! I
I I I
I ! I
i I ! I I I I t
: ---t---;--t,, ~,1-+;-t-t--1~,--t-:--
1-:-, --:---,--1-_;_+-'-:--l--'--++-'--~~+~~-l--l-l---l-l--4-+-+--4--'-+-H-+-+-_j...--1-.LU-;._
I I I I I
I I I
I ! I ! I
I J l
] I
I ! I l '
I I
I !
t I i ' i ' '
I I !
i
I ' I I I I I ! I I I I I I I ! :
I i i I • I
I I :
I I ·--:t-I I I I I I I i I I I
I
I I i i i I I i !
! i I i I
I ! / I I I i I
I I I I ! I l I ! ! i I i I ' I i
I i I i ! '
I ! I
! ! !
- --------1--------,---;--;--t-f-t-+-+-+--..;._-t-f--;-;-+-+-+--+----'--t---~---'--+-·~--
I .. : ' I ~ I I I . -~,·-----. --- ---- _. __ ----r+·---+--+--t--
---l--, -, --'----'--+--------·--'"-·-----------<---
I I . -1---::---
I ! : I I
: i I ! I !
I ' I I
I I
I ! -------- ----------t----'--,--,----+-------- ~---------..__ __
----+---~--------'-, --,-· ~-=~-------~~~~~- _ _: __ ' : ,-'--,-:- --~ --L-----=--~-=--=-=---=--=-:==-===-=--- __ _L _______ - -------:----1-r---;-b ' ~~ --- - I
- ' ' I ---· -~ --j '
---j I ' ' ' t ' - -,-.---,----,1--,-1-t----~---,-r-+-t--;-+-;-
i i ! ' I i I i
I I
I ! I
' ; : I I
i I I l I i I l I
' I
;
4
I
I I i i. I _ ....... _ .... _ _J.__ • ......._ _.J._ .. -~--,---'---'--'--'_____.!--'-, ---+----.":·-:-, --!~--...,'-'-c--t------,-~,---j-Ll __ ~-,-1 -_· f--i--t--+-~
Draw Your First Possible Solution Above This Line Draw Your Second Possible Solution Below
I l r ! ' I l -1 -r-·--r r ·1-r · ·TT ' . I --~,- r-r,1-r· -:-i-1 l -- 1 .
! I I i ', : I I I i ! : ' I I ! ' I i I I ! ! ' I I I I i : ! I i
I ' ! I : : i I I ·I I I t ~ I r I
I ~ i ! I !
I I I I I : I
I ! i ! ! I ! i i i I I i I I
'· ' i I I I I l : ' I I
' I I ' ! I ! !
--+-------'-----+--+----'--'-----'---'---+--'--+----'---+--+--+----+-,.....,.;--+-+--1---+--+-;.-;,.....;._,..-+--+---+-+-'-I --ii'-'--+--+---,---'-\ _1 -'--'---'----1------ .
------"-rl-t---'---+--'---~-,--'-1µ--i--+....J.....+--+-"-1---'---'---'---L-f--lf-+-+-+--+-+-+-H-+-L/ -+-'H'-+-++-+!-+, +1 -:---'-+-__j _____ --! I; I E:_ __ ! __ _ I I ! i I: ----
--+-~-'--'------'--+--1---'----'-'-----l-----'--'---'--L...J'--'---1- '--'--'---'--+---i-l-i---!-+-+--+---'---'--¼-->---'--'---l---.-....;......J-..+--~ :_, _i _, -- _;_ -----'---'---'--<~---------'--l--'---,----+-+-++....;---'---'--'--'-+--+--4-+-+-H--i---'---+--+-.J.',_.:_i -+-+...;-..;.-~f---'----~ --~--.
--!-------+--+---·--·-'--;--:- -*·i'--+-+-+-+-.,__;---'---'--!-+-l-sH-+-+-+--,-+-!---i--+1-+1 -+---+-+-+---;----,------ ----
I
I I I I l I
I
! I I
I I I i i·, : I I ' I I I t ! I I I ' I j : I
i I
' --i--'---l---+-+-+-l-f--1--l--i _,___._+-+--'f-4-+--+-+-+-+ !, -++-+i-+-+-+--+----'--+-!---'--'1--'-!--;-11 -+---;--
·--tf; I I ' -,
. ' ! I : i i
i ,- I i ! i. I I i I / t
I I ' I / I I
I I '.J I r '
I., I I I i I I ! i
I I ·I' i i j I j i i : I I ! i
I I· i I i j I l I j
I. I I •l ~
! I l. ! I I I .1
j i . ! I I I I : i
I
I I ! ' : I I
I I
l
/ \ .. · _'(_,'
I I ':, .~ ..

I I : I I i I ' I I i i I
I ! ! i I I I : I
! i ! i I ' I I I !
---~----·--t---·-------+----- ' ! -+-- ----,-, -+------+--+--_.....~.;_-+-+---,---i--..-:--+-~-+-_;__i----'---+--------+-
1 ! i i I r I
·- _...._ - ·--------~ i i i I I
-+--+-.... -l-+-'---"----+-....;.....--~---- ________ ..._. __ : . I '
I I I i I i I I ! I I
I ' i I
------j -- i ' ' I ! I ' I i ' I I -•. · 4--------J---· ·--·-_' ...,..' --+-~-,-...------+--' ............. --+-+-+---+-............ ' ...,..· -.--+-,-i--,--1-' ...,..1 -+--' _i-,-r------- ---I I ! --'-+'----'---'---4--~--'-'------1---+-:........-+-'---'---+-l----+~l-+-J.--+-i--'--~+--"----+--------~------ --------,--- I__ , i --'--~--+-----;-+----r-+--._,..~-;--,--;--;-t--t.......;....-+-~--
I i i
--. --- _ -----. _===r-_ -__ -_-----''.'----'-·-.,..., -_~'--4--_.,..,::::_~::.~:-~:1:::::.=-:::::::::~~:~::::::.=-::;::::::::::r~::::::_:1--r------+---I - -~-+ ' ' -"--·-+-'-....;....---'-~1-----+--+--+-i--~-+------'-"--t--------- - --·-
: i
! I i ! i ! i I i I
'
' I I r I
I !
' ! I . ·t· . ---t ' 10-~· : ' ~-: ; ! ! '
I ' I
I ! I j ' : _ _.] ~-~-·--·==-==- ~-- I ------ ~_J___;_,_;...._;_i_+--1: ....;........L..~'-..:......:...--'-+J-f--'jj-+-+---.1.........-i--'--';.......+j-,-!-t---,---,---...--t---( '· ; ! I ' i I I
-:--~--r- ----~_-_: ·--=1'- ---:_ . -: .=i=- -r--~---=- __ ,.,..i._· ...l-..L._--1-+'-+-' ...l-..;..,:_'-...l,;_J._--+-...,.l-:.....Li --'---'--4---'.....,.---t------·==~-~~4~=----• _--=_ , I _ _-_ -- . ==l ·--=·---:_·-·-~;--_-_:...:-·....jl+---.1...: ..... ;__;_: .....:....-1-.J-..::_,_: ~--'--~-+....;.....+-~''-+-' -'1-+-------t----
-. ~-=+ . . 34 ' __ JF-- ---1-___ -__ ,'_ .!......;; i~i~:-e--LJ=-+-; ~: _ _)._: _;'.-~~==-=-~'='--'~l~-=---=-·-=~--------==:~=.:-=~~=-;~r-------~3:-----'---_-_-_ -2rt. -~-=-------~ -• : ; l_:_i : ·-r- , I --- ; -- --t-·----
1 . I i , , . , :...· ---'-· -,-' ---ii-i--'----l-+-'--'';---;--t-', -'-C---+---;--'---c.........:.-'--,---t-----! __ --r--__ --- - }- -- --~ I ;-~·-. : -: : ·-,_:_L: I ; ! ! I : ! ·~ ----~----- -- ;
Draw Your Final Solution Above
6. After you have been given time to draw your final map, the teacher will give you a photocopy of a commercial map showing the area that you have been challenged to draw. Using this map, evaluate the map that you have drawn. List below the thing!; that you would change to make your map better.
..... -~ ,-:,. .. _~ ......... -. ·-

MAP OF
NORFOLK VIRGINIA BEACH
PORTSMOUTH CHESAPEAKE
AND VICINITY VIRGINIA
0 ¾ I MILE
©1993 DOLPH MAP CO .• INC. 430 North Federal Highway Fort Lauderdale, FL 33301
1-800-877-3649 Thltlll•...,,.......-,,llnd~by_,. __ _,_,... orinpen,......,....._,___tn:Mntne......._.ilnw:11y pnllhaNled. n. infom.1-1 ,howft an tNa -p. whle ,_ .---., by N ,,.....__ t..s been.....,...~ off"ICW , __ Any cflenvN. enors or...___ aa.ct tG - an_,.,., .,...._.,........,_ledandwilbelfldudiMon_,..•t..aDon
l_,.,. ·" ·----·· ::..~~~!! ,.!~?;': :~. ·~
l--;:-s,: ~:_~~;'. _ _:~~:£:~"Le-. t LEGEND c:
MAIN ROADS
STREETS
~ INTERSTATE HWYS
=@=- FEDERAL HWYS
~ STATE ROADS
~---, '
RAILROADS
SCHOOLS & COUEGES
PARKS. GOLF COURSES. & CEMETERIES
SHOPPING CENTERS INDUSTRIAL PARKS
CITY LIMITS
., 111 ., S.11
11ST •1• 111 ,11 ,.1.111 .....
"' m lU
' 11-11 .. IU .. . .. I JU I ol It JU
111-11.••• • 1111 " .1,
2:;-457 ZIP CODES ~!~ .... ,u1
L...------.:.z•_•_c_oo_e_•_o_UN_o_..,_v___. :: ~ :: ;;;;;;-,,- 11i N ufti si"·i 11 ; ;;
_., -Cl
=,:n .. _, .. ...... " ........ Ml0fffU ==~ .. , ... n .. ?Mat(T .. ,....,,u1 •nouu ...... ...... ~
p
-~ :.• .... :~.
), ... ~
... i-., 0 ... i-., c• ,,or· ..... ""·' .. ,..,,n i• l"lt~n ll M,C'O
... ~o.lf1•r: l"tllU(! .,11, .. 1.1 .... 11i.~