a study and examples of power gains achieved by fog …
TRANSCRIPT
A STUDY AND EXAMPLES OF POWER GAINS ACHIEVED BY FOG INLET AIR COOLING OF GAS TURBINES IN S.E. ASIA.
1
A STUDY AND EXAMPLES OF POWER GAINS ACHIEVED BY
FOG INLET AIR COOLING OF GAS TURBINES IN S.E. ASIA.
1. Introduction
From its introduction to the gas turbine world in 1989, inlet air fog cooling of gas
turbines has demonstrated significant advantages in price, ease of installation and
operation around the world. There are now over 700 fog-cooling installations in
operation on a wide variety of land based gas turbines from 2MW to 250MW in size.
Power gains of up to 30% are possible with fog cooling, depending on turbine type and
site location.
2. What is Fog Inlet Cooling?
One basic method of increasing gas turbine output in a fixed speed application
such as electric power generation, is to cool the inlet air. Cooler air is denser and so more
power can be generated. The more conventional methods of cooling inlet air are:
1. Media Type Evaporative Systems
2. Refrigeration Type Chillers
3. Absorption Type Chillers
All of these methods have been in use for the past 30 years or so. Fog cooling
most closely resembles media type evaporative cooling, except instead of using a passive,
water saturated media through which the inlet air is passed, fog cooling is an active
system and uses very fine fog droplets of high purity water injected at discrete points
across the inlet duct through special atomizing nozzles, at high pressure to create the
cooling effect. The amount of fog to be added is continuously controlled by a weather
station that monitors dry and wet bulb ambient conditions and adjusts the amount of fog
cooling as needed.
A STUDY AND EXAMPLES OF POWER GAINS ACHIEVED BY FOG INLET AIR COOLING OF GAS TURBINES IN S.E. ASIA.
2
A typical fog cooling system consists of a high-pressure pump skid connected by
feedlines to an array of manifolds located at a suitable plane across the compressor inlet
duct. The manifolds have a number of fog nozzles positioned along their length, which
inject very fine droplets of water into the inlet air. Each nozzle flows at 3 ml per second
and produces about 3 billion droplets per second. The very fine fog evaporates very
quickly, thus dropping inlet temperature. Figure A shows a typical fog-cooling array in
a gas turbine inlet duct.
3. Advantages of Fog Cooling
There are a number of unique advantages of fog cooling over these other conventional
cooling technologies:
a. Ease of Retrofit on Existing gas turbines, no major changes/additions or
extensions to inlet ducts needed.
b. Lowest cost per MW gain of all inlet cooling technologies, about 1/6 th that of
chillers and 1/3 th that of media evaporators.
c. Lowest downtime for installation, typically 1 to 3 days.
d. Fastest payback, sometimes less than 1 year.
e. Pressure drop in the duct is negligible, less than 0.1� water. (Compare with
media evaporative systems where pressure drop is typically 1 to 2 inches,
resulting in a significant performance penalty year round).
f. Close to 100% evaporation possible with fog, so higher evaporation
effectiveness than media type evaporative system is possible.
g. Overspray possible, where extra fog is deliberately injected into the
compressor inlet, thus generating further power.

A STUDY AND EXAMPLES OF POWER GAINS ACHIEVED BY FOG INLET AIR COOLING OF GAS TURBINES IN S.E. ASIA.
3
Figure A � Typical Large Turbine Inlet Fog Cooling Array
4. Weather Conditions in Asia
There appears to be a misconception amongst power producers in some Asian
regions that inlet evaporative cooling of gas turbines cannot yield useful economic gains.
Local weather conditions are considered to be too humid to make any attempt at inlet
evaporative cooling economically worthwhile. This idea may be based on the earlier
evaporative cooling technologies, which required higher up -front costs, longer down-
times and major changes/additions to inlet duct design and were less effective at
achieving wet bulb conditions.

A STUDY AND EXAMPLES OF POWER GAINS ACHIEVED BY FOG INLET AIR COOLING OF GAS TURBINES IN S.E. ASIA.
4
The introduction of inlet air fog cooling with its lower initial and operating costs,
short down-time and higher cooling efficiency has changed the economics enough to
make it a viable option for power augmentation even in the more humid regions of Asia.
4.1 Weather Data �Reporting
Another important factor to consider is that reported weather data can often be
misleading. Rarely are the dry bulb temperature and the coincident wet bulb data
available. Weather services will often quote the highest dry bulb temperature of
the day and the highest humidity, BUT these do not occur at the same period of
time. There is a lot more evaporative cooling available than is at first realized.
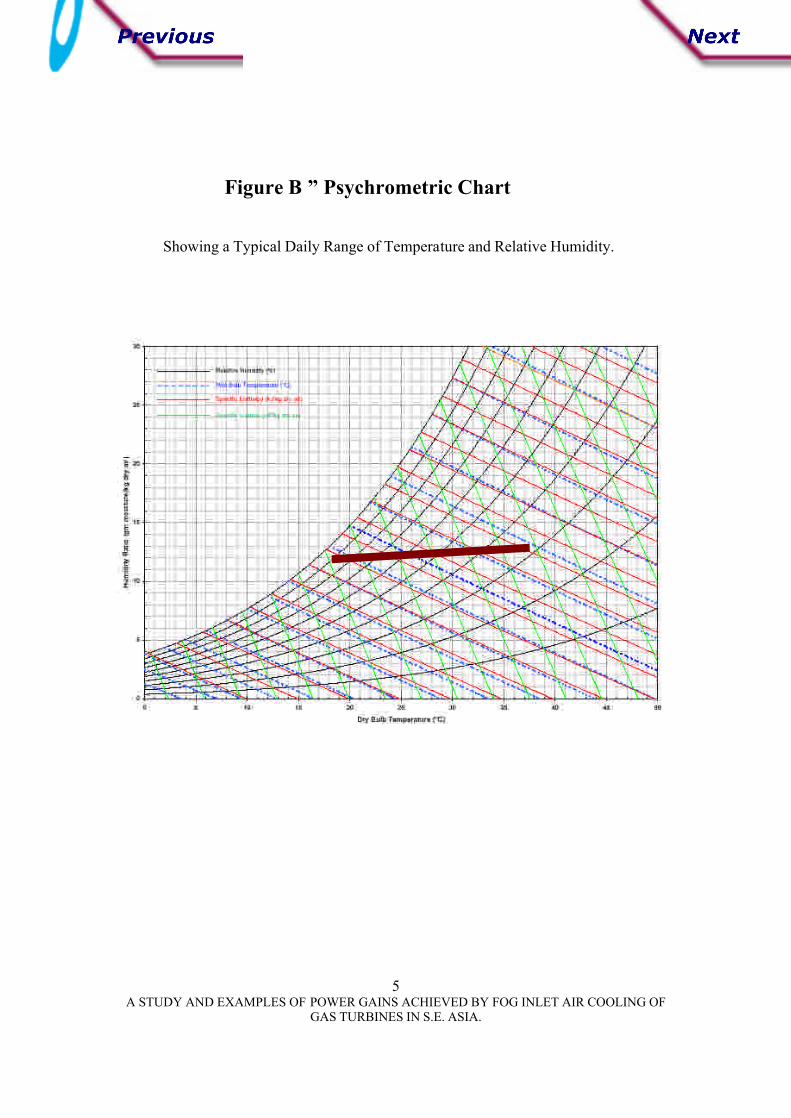
A review of Figure B demonstrates this relationship. Figure B is a standard
psychrometric chart with a solid line showing the variation of temperature and
relative humidity over a 24-hour period of a typical Asian coastal region. The
actual amount of water in the air is surprisingly constant and is determined by
local conditions such as ocean temperature and wind direction.
As we can see from the chart, a night-time temperature of 19°C will have a
relative humidity (r.h.) of 90% but during the day, but as dry bulb temperature
rises, and humidity drops, and since the water content of the air does not change
much in the course of a day, we can reach a dry bulb temperature of 37C and the
coincident r.h. has now dropped to 33%.
Thus at the hotter condition we could achieve 13°C of evaporative cooling, which
can generate a 13% power gain on a typical gas turbine, by fog evaporative
cooling.
A STUDY AND EXAMPLES OF POWER GAINS ACHIEVED BY FOG INLET AIR COOLING OF GAS TURBINES IN S.E. ASIA.
5
Figure B � Psychrometric Chart
Showing a Typical Daily Range of Temperature and Relative Humidity.

A STUDY AND EXAMPLES OF POWER GAINS ACHIEVED BY FOG INLET AIR COOLING OF GAS TURBINES IN S.E. ASIA.
6
5. Definition of Fog Cooling Terms
To start off this discussion we will address the following definitions of some terms. The
key terms used in defining evaporative cooling potential are:
- Wet Bulb Depression (or Possible Cooling Degrees)
This is the difference between dry bulb and wet bulb temperature at a given
moment in time. During a typical day, the maximum wet bulb depression occurs
at the hottest times of the day. This is a measure of how much cooling is possible
from evaporative cooling.
- Site Evaporative Cooling Degree Hours (ECDH)
This is the number of Evaporative Cooling Degrees times the number of hours
that they occur in a given time period for a particular site.
A good source of Asian weather data is available from NCDC (National Climatic
Data Center) in the USA. We used 2 databases for our study:
1. International Station Meteorological Climate Summary Weather Data
1996 of over 6,300 sites around the world.
2. Engineering Weather Data of 800 worldwide sites.
From the recorded weather data we can calculate the number of ECDH that occur
over a day, week, month or year at a given site. This data is easily extracted from
the weather data for the specific site as discussed above.
- Site Design Point Cooling Potential
A STUDY AND EXAMPLES OF POWER GAINS ACHIEVED BY FOG INLET AIR COOLING OF GAS TURBINES IN S.E. ASIA.
7
This is the maximum expected wet bulb depression (WBD) as extracted from the
site yearly weather data and is used to size the fog cooling system. WBD is the
difference between dry bulb and wet bulb temperature at any given moment.
In a typical gas turbine site the maximum WBD from the weather data may only
occur for 0.5 hours per year, so the design point figure is usually selected for a
WBD that occurs or is exceeded at least 20 hours a year or more, depending on
the site conditions and the need for more power under these extreme conditions.
This number defines the maximum cooling capacity and therefore the overall size
and cost of the fog cooling system.
- Expected Gas Turbine Power Gain �MW
This is calculated from the gas turbine manufacturer�s rating for the particular
turbine, and reflects the cooling effect of the fog system on the inlet air. Typically
a frame gas turbine will generate slightly less than 1% extra power for each 1 °C
of inlet cooling. Thus a fog system designed to give 15°C of cooling will
generate an extra 10-15% more power at the design point. This gain can be even
higher in the case of an aeroderivative gas turbine such as a GE LM 6000, a RR
Avon or a P&W FT-4.
- Expected Site Power Gain MW-hrs
Of more general interest to users is the total amount of extra power that can be
generated by the fog cooling system at a particular site on a particular turbine.
This can be calculated from the weather data ECDH for the particular site.
The formula for this is simply:
Site Power Gain = Base MW x ECDH x %Power Gain/Cooling Degree
A STUDY AND EXAMPLES OF POWER GAINS ACHIEVED BY FOG INLET AIR COOLING OF GAS TURBINES IN S.E. ASIA.
8
Thus for a typical Asian turbine site with an ECDH of 20,000, a gas
turbine average output of 80 MW in the summer months and with
1%/Degree C power gain we can predict a site power gain of:
80 x 20,000 x 0.01 = 16,000 MW-hrs from fog cooling
With a value of $30/MW-hr this fog power generates an extra $480,000 in
revenue. A fog system for this turbine would be priced in the range of
$190,000, so you can see that the payback is very good. Inlet air fog
cooling also improves heat rate, which further enhances payback as is
discussed later.

A STUDY AND EXAMPLES OF POWER GAINS ACHIEVED BY FOG INLET AIR COOLING OF GAS TURBINES IN S.E. ASIA.
9
6. Weather Data for Specific Asian Sites
The following tables present weather studies of a wide diversity of regions in Asia. This
weather data has been taken from the NCDC databases discussed earlier.
Table 1 - Site Evaporative Cooling Degree Hours
As the data shows, there is a surprising amount of site Evaporative Cooling Degree Hours
(ECDH) available in most Asian regions. The data is based on a minimum wet bulb
temperature of 12.8°C. Below this condition the fog system is automatically turned off.
REGION CITY ECDH
JAPAN Tokyo 17,300
JAPAN Osaka 18,300
KOREA Seoul 13,500
MALAYASIA Kuala Lumpur 21,900
PHILIPPINES Manila 28,800
SINGAPORE Singapore 17,300
TAIWAN Taipei 21,000
THAILAND Bangkok 35,900
VIETNAM Ho Chi Minh 29,800
AUSTRALIA Adelaide 23,100
BURMA Rangoon 28,700
CHINA Hong Kong 26,200
CHINA Beijing 17,100
INDIA Mumbai 37,800
Delhi 51,200

A STUDY AND EXAMPLES OF POWER GAINS ACHIEVED BY FOG INLET AIR COOLING OF GAS TURBINES IN S.E. ASIA.
10
Table 2 - Site Power Gain (MW-hrs) by Region
This data shows the power gain expected at the various sites for different types of gas
turbine. Aeroderivative gas turbines are most sensitive to temperature changes and so
they show the largest gains.
Site
Country-City
Turbine Make
/Model
Base Power
MW
Fog Gain
MW-hrs
148.6 10,035
228.8 26,900
JAPAN
- Tokyo
ABB 13E2
Mitsubishi 701F
GE LM6000PC 32.30 8,750
148.6 12,700
228.8 33,900
MALAYSIA
-Kula Lumpur
ABB 13E2
Mitsubishi 701F
GE LM6000PC 32.30 11,000
148.6 20,800
228.8 55,800
THAILAND
-Bangkok
ABB 13E2
Mitsubishi 701F
GE LM6000PC 32.30 18,200
148.6 14,940
228.8 40,300
CHINA
- Hong Kong
ABB 13E2
Mitsubishi 701F
GE LM6000PC 32.30 13,100
148.6 29,200
228.8 79,700
INDIA
- Delhi
ABB 13E2
Mitsubishi 701F
GE LM6000PC 32.30 25,900

A STUDY AND EXAMPLES OF POWER GAINS ACHIEVED BY FOG INLET AIR COOLING OF GAS TURBINES IN S.E. ASIA.
11
7. Fog Overspray Power Gain- An Added Benefit
Fog cooling allows another method of power gain, which is different from inlet air-
cooling. It is called overspray cooling. Since fog cooling is an active system, more fog
can be added to the airflow than can be fully evaporated. This extra fog flow is injected
directly into the compressor and inter-cools the air between compression stages thus
improving overall turbine efficiency.
This inter-stage cooling method is not as efficient as inlet air cooling in terms of water
usage but it has the advantage of being independent of weather conditions and so can be
run continuously, thus generating extra power at all dry bulb temperatures above 12.8°C.
A number of overspray systems are now in operation with as much as 0.6% to 1%
overspray being achieved.
Table 3. Overspray Power Gain
This table shows the extra power in MW generated from a fog system with 0.6%
overspray (O/S), running for 8,000 hours a year on various gas turbine models with an
average ambient temperature of 22°C and 50% r.h..
Turbine Model Base MW
EvapFog MW
0.6% O/S Fog
MW
0.6% O/SFog
MW-hrGE Frame 5361 23.8 25.2 27.1 15,200
GE Frame 9171E 115.7 120.9 128.1 57,600
Westinghouse 501D5 101.9 106.9 114.0 56,800
Mitsubishi 701F 252.6 263.8 278.0 113,600
ABB 13E2 150.3 157.1 167.1 80,000
LM6000 PC 37.6 42.0 NA NA
As can be seen from the data above, the overspray power gain numbers are impressive.
The data was derived using GT-Pro software by Thermoflow Inc., USA. Compare with
Table 2 data for Evaporative Fog Power Gain MW-hrs.
A STUDY AND EXAMPLES OF POWER GAINS ACHIEVED BY FOG INLET AIR COOLING OF GAS TURBINES IN S.E. ASIA.
13
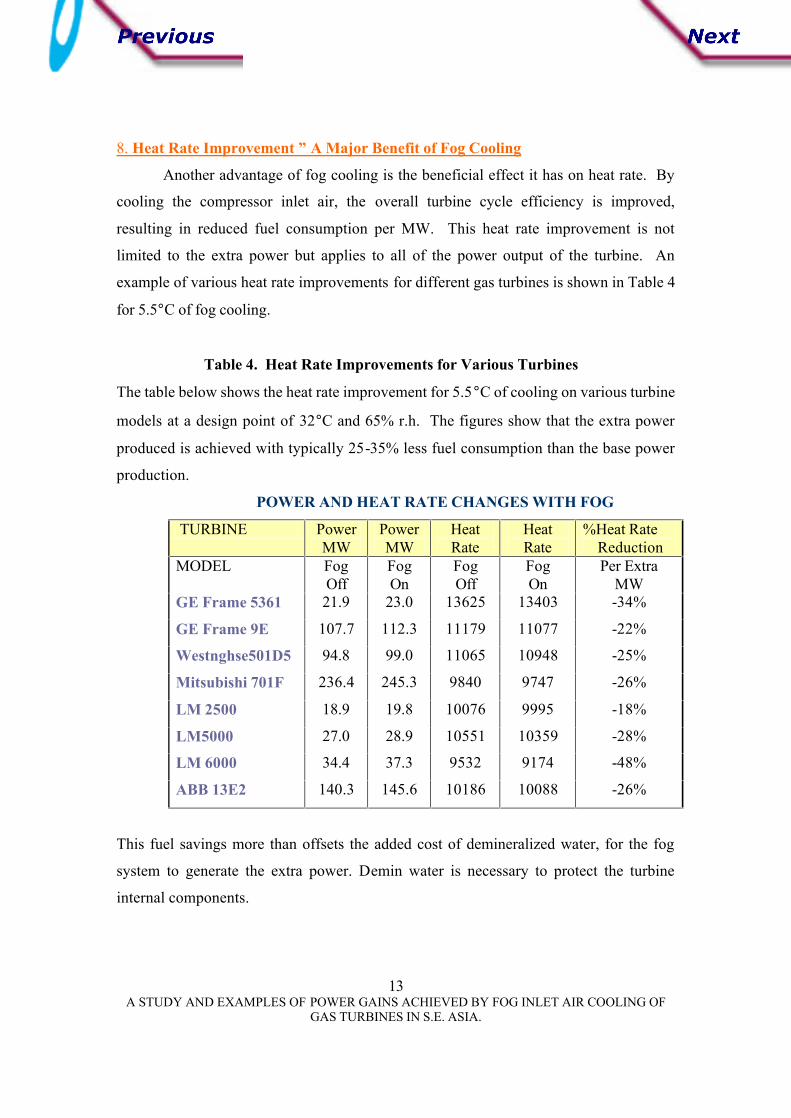
8. Heat Rate Improvement � A Major Benefit of Fog Cooling
Another advantage of fog cooling is the beneficial effect it has on heat rate. By
cooling the compressor inlet air, the overall turbine cycle efficiency is improved,
resulting in reduced fuel consumption per MW. This heat rate improvement is not
limited to the extra power but applies to all of the power output of the turbine. An
example of various heat rate improvements for different gas turbines is shown in Table 4
for 5.5°C of fog cooling.
Table 4. Heat Rate Improvements for Various Turbines
The table below shows the heat rate improvement for 5.5°C of cooling on various turbine
models at a design point of 32°C and 65% r.h. The figures show that the extra power
produced is achieved with typically 25-35% less fuel consumption than the base power
production.
POWER AND HEAT RATE CHANGES WITH FOG
TURBINE PowerMW
Power MW
Heat Rate
Heat Rate
%Heat Rate Reduction
MODEL Fog Off
FogOn
FogOff
FogOn
Per Extra MW
GE Frame 5361 21.9 23.0 13625 13403 -34%
GE Frame 9E 107.7 112.3 11179 11077 -22%
Westnghse501D5 94.8 99.0 11065 10948 -25%
Mitsubishi 701F 236.4 245.3 9840 9747 -26%
LM 2500 18.9 19.8 10076 9995 -18%
LM5000 27.0 28.9 10551 10359 -28%
LM 6000 34.4 37.3 9532 9174 -48%
ABB 13E2 140.3 145.6 10186 10088 -26%
This fuel savings more than offsets the added cost of demineralized water, for the fog
system to generate the extra power. Demin water is necessary to protect the turbine
internal components.
A STUDY AND EXAMPLES OF POWER GAINS ACHIEVED BY FOG INLET AIR COOLING OF GAS TURBINES IN S.E. ASIA.
14
9. Operating and Maintenance Costs of Fog System
The largest operating cost of the fog system is demineralized water. A typical fog system
consumes about 200 gallons (800 liters) of water per MW-hr of extra power. Again this
number is much lower for aeroderivative turbines. Thus for the 80 MW example
discussed above, where an extra 16,000 MW-hrs is produced by fog cooling, this
translates to 3.2 million gallons of demin water consumed per year. This sounds high but
the average water consumption would be in the order of 18 gpm (67 lpm) over the
estimated 3,000 hours of fog cooling operation.
With an average cost of US$0.0015 per gallon, the cost of demin water will be around
US$16 per hour, or $48,000 for the year. Maintenance costs of the fog system are about
$3 per operating hour. Based on 3,000 hours usage this amounts to $9,000 per year. The
fog system high-pressure pumps consume a very small amount of the power increase, in
the order of $2,500 per year.
9.1 Fuel Savings
The fuel savings easily offsets all of these costs. As described above, the extra
power is generated with 25% less fuel than the base power as shown in Table 5
above.
With fuel costs at say $4/MMBTU and an average heat rate of 10,000 BTU/kW-
hr, the yearly fuel savings for the extra 16,000 MW-hr (or 16,000,000 kW-hr) of
power generated by fog cooling is:
16,000,000 x 0.25 x 10,000 x $4 /1,000,000 = $160,000.
Thus fuel savings alone is almost 3 times more than all of the operating, water
and maintenance costs of the fog system.

A STUDY AND EXAMPLES OF POWER GAINS ACHIEVED BY FOG INLET AIR COOLING OF GAS TURBINES IN S.E. ASIA.
15
10. Examples of Existing Fog Cooling Applications in Asia
Now we will cover some actual fog cooling installations and see what results were
achieved. There are already a number of fog cooling installations in Asia and actual
measured performance data from some of these is presented.
10.1 Example A - Kuala Lumpur. Malaysia
An inlet fog cooling system was installed on an ABB 13E simple cycle for
Tenaga Nacional Bernad at their Connaught Bridge Power Station near Kuala
Lumpur, Malaysia. The fog installation was completed on time and an in-depth
test of the fog system was done to ensure that it met the guaranteed power gains at
the design point. The test was successful and the power gain exceeded the
guarantee by a significant margin.
10.2 Test Results:
The guarantee point was an increase of 8.5% (11.0 MW) at the design
temperature of 32°C and 65% r.h. The fog system had a cooling capacity of
21.9°C of cooling with a flow rate of 266 lpm. All fog stages were on, thus there
was about 6.3°C evaporative cooling (equivalent to 0.24% of air mass-flow) and
the remaining fog flow was injected into the compressor (equivalent to 0.6% of
air mass-flow) as overspray.
A summary of the test results taken on March 21st and 22nd 2001 are shown
below.

A STUDY AND EXAMPLES OF POWER GAINS ACHIEVED BY FOG INLET AIR COOLING OF GAS TURBINES IN S.E. ASIA.
16
CONNAUGHT BRIDGE �TEST RESULTS
TEST �1 (21-3-2001)
FOG POWER GAIN RESULTS
FOG Tdry bulb R.H. Measured Corrected* MW Gain % Gain
OFF 31.9 C 59.6% 129.9 129.2 - -
ON 32.5 C 57.6% 143.2 143.2 14.0 11.1%
Another test was run the next day and the following power gains were measured.
TEST �2 (22-3-2001)
FOG POWER GAIN RESULTS
FOG Tdry bulb R.H. Measured Corrected* MW
Gain
% Gain
OFF 30.2 C 59.0% 133.0 131.8 - -
ON 31.3 C 55.5% 143.5 143.5 11.7 8.2%*Corrected for change in ambient temperature effect on power between the 2 test points.
10.3 Power Gain Test Results
The tests showed an average power gain of 9.7%, thus comfortably exceeding the
guaranteed value of 8.5%.

A STUDY AND EXAMPLES OF POWER GAINS ACHIEVED BY FOG INLET AIR COOLING OF GAS TURBINES IN S.E. ASIA.
17
10.4 Fog System Operation
The fog flow, fuel flow and other data measured during the actual test program is
presented in the Table below:
Table 4� Test Results
Measured Parameter Fog
OFF
Fog
ON
Temp 31.9 32.5
r.h.% 59.6 57.6
Cooling Available 6.3 6.7
GT Output MW 129.9 143.2
GT Fuel Flow SCM/hr 38,982 41,182
Fog Water Flow (lpm) - 270
Fuel Flow SCM/MW-hr
Overall Fuel Reduction
300
-
288
(-4%)
Power Gain - 13.7MW
Fuel Flow Increase/Power Gain
Net Fuel Reduction on Power Gain
- 161
(-46%)
Note that the extra power gain was produced with an overall fuel savings of 4%
on the entire turbine output power. Or put another way, the extra power gain was
produced with 46% less fuel per MW than that used for the base load power.
A STUDY AND EXAMPLES OF POWER GAINS ACHIEVED BY FOG INLET AIR COOLING OF GAS TURBINES IN S.E. ASIA.
18
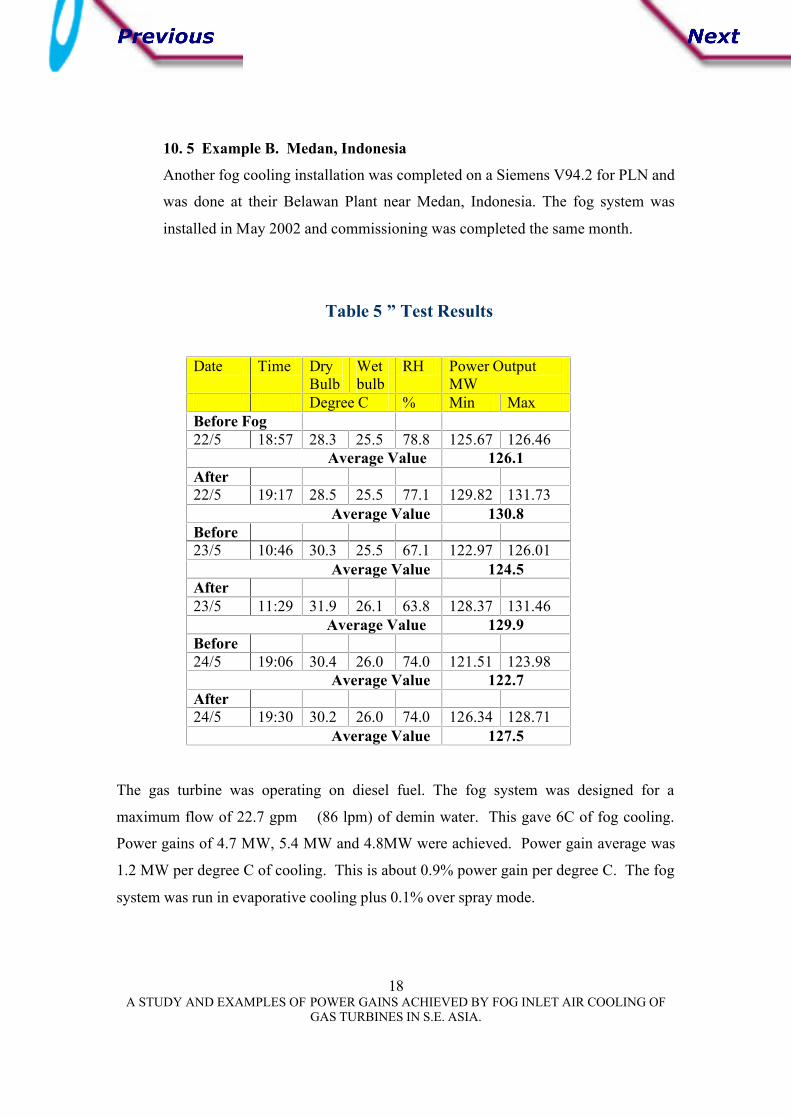
10. 5 Example B. Medan, Indonesia
Another fog cooling installation was completed on a Siemens V94.2 for PLN and
was done at their Belawan Plant near Medan, Indonesia. The fog system was
installed in May 2002 and commissioning was completed the same month.
Table 5 � Test Results
Date Time Dry Bulb
Wet bulb
RH Power Output MW
Degree C % Min MaxBefore Fog22/5 18:57 28.3 25.5 78.8 125.67 126.46 Average Value 126.1After 22/5 19:17 28.5 25.5 77.1 129.82 131.73 Average Value 130.8Before23/5 10:46 30.3 25.5 67.1 122.97 126.01 Average Value 124.5After23/5 11:29 31.9 26.1 63.8 128.37 131.46 Average Value 129.9Before24/5 19:06 30.4 26.0 74.0 121.51 123.98 Average Value 122.7After24/5 19:30 30.2 26.0 74.0 126.34 128.71 Average Value 127.5
The gas turbine was operating on diesel fuel. The fog system was designed for a
maximum flow of 22.7 gpm (86 lpm) of demin water. This gave 6C of fog cooling.
Power gains of 4.7 MW, 5.4 MW and 4.8MW were achieved. Power gain average was
1.2 MW per degree C of cooling. This is about 0.9% power gain per degree C. The fog
system was run in evaporative cooling plus 0.1% over spray mode.
A STUDY AND EXAMPLES OF POWER GAINS ACHIEVED BY FOG INLET AIR COOLING OF GAS TURBINES IN S.E. ASIA.
19
11. Conclusions
Over the past 12 years, gas turbine inlet fog cooling has demonstrated that it is an
effective and economical method of cooling inlet air on gas turbines and thus generating
extra power. The technology has now been installed in over 700 gas turbine installations
worldwide, so has a well-established track record.
Due to its lower installed and operating costs, fog cooling has proven to be an
economically viable method for increasing power output of gas turbines in S.E. Asian
regions, which might otherwise be considered marginal for the previously available
cooling technologies.
Fog cooling systems have been installed on a wide variety of gas turbine makes and
models, both in simple cycle and combined cycle plants from 2MW to 250 MW
capacities.
Typical fuel savings from fog cooling and the revenue from extra power generated can
pay for the installation costs and operating costs including demineralized water
consumed, in 2 years or less, depending on the site location, the turbine type and local
power demands.
Fog cooling power gain can be further augmented by use of overspray and a number of
overspray fog systems have been installed. Overspray has the added attraction of
producing power independently of the weather conditions.