a structural equation model of customers’ behavioural
TRANSCRIPT

A structural equation model of customers’ behavioural
intentions in the Chinese restaurant sector
Volume: 1
By Jing Cao
Supervisor: Dr. Mitchell. Ness
A thesis for the degree of Doctor of Philosophy at Newcastle
University Business School
January 2012
I
Abstract
The aim of this study is to develop a structural equation model (SEM) of customers’
behavioural intentions towards restaurant patronage in China. The study is set in the
economic context of the Chinese open door policy of 1978 and the emergence of a
service sector and middle class consumers with higher disposable incomes.
The conceptual SEM is developed from the existing literature on customer loyalty,
which includes constructs of perceived quality, sacrifice, perceived risk, perceived value,
the Chinese cultural value of face, satisfaction, reputation, trust and behavioural
intentions. A set of hypotheses concerning direct and indirect links between constructs is
derived from the literature.
The research methodology employs a self completion survey of customers of targeted
restaurants that generated 489 valid responses. The questionnaire was designed with
three thematic sections concerning restaurant visit behaviour, measures for each of the
constructs, and respondents’ characteristics.
Measurement scales for the constructs satisfied the minimum requirements of
Cronbach’s alpha coefficient. The measurement models of the SEM constructs were
evaluated using confirmatory factor analysis (CFA). They were accepted on the basis of
measures of fit, the statistical significance and the signs of the coefficients.
Preliminary analysis led to the modification of the conceptual SEM. The modified SEM
was accepted on the basis of measures of fit, statistical significance and signs of
coefficients, composite reliability, variance extracted and squared multiple correlation
coefficients. Tests of hypotheses and tests for mediation provided for the analysis and
decomposition of total effects on dependent constructs.
The study establishes the relevance of traditional loyalty constructs, such as perceived
quality, sacrifice, perceived risk, perceived value, satisfaction and reputation, and
confirms the relevance of the Chinese cultural value of face. Total effect analysis reveals
the importance of satisfaction, perceived value and perceived quality on customers’
behavioural intentions with associated benefits to commercial marketers in the
hospitality sector.
II
Acknowledgement
I am heartily thankful to my supervisor, Dr. Mitchell. Ness, whose encouragement,
supervision and support from the preliminary to the concluding level helped me to
complete this work.
I offer my regards and blessings to all of those who supported me in any respect during
the completion of the study. Special thanks should be given to my student colleagues,
especially Dr. Yan. Zeng, who helped me in many ways.
Finally, words alone cannot express the thanks I owe to my parents, and Xiaohua Song,
my husband, for their encouragement and assistance, and my amazing dog, Lennon,
who gave me lots of love and fun when I felt upset.
III
Table of Contents
Chapter 1 Introduction ..................................................................................................................... 1
1.1 Introduction ................................................................................................................................ 1
1.2 The Economic and Social Research Background ....................................................................... 1
1.2.1 The economic growth of China since 1978 ......................................................................... 1
1.2.2 The potential of the consumer market in China .................................................................. 3
1.2.3 The emergence of middle class consumers ......................................................................... 5
1.3 The Academic Research Background ......................................................................................... 7
1.3.1 The importance of loyalty research ..................................................................................... 7
1.3.2 Definition of customer loyalty through behavioural intentions ........................................... 8
1.3.3 The Q-V-S-L model ............................................................................................................. 9
1.4 Identification of the Research Gap ........................................................................................... 10
1.5 Research Aims and Objectives ..................................................................................................11
1.6 Outline of the Thesis ................................................................................................................ 12
Chapter 2 Literature review ........................................................................................................... 13
2.1 Introduction ....................................................................................................................... 13
2.2 Important Factors in Restaurant Sector Research .................................................................... 13
2.3 Perceived Service Quality ........................................................................................................ 15
2.4 Perceived Value ........................................................................................................................ 16
2.5 Satisfaction ............................................................................................................................... 17
2.6 Sacrifice ................................................................................................................................... 19
2.7 Perceived Risk .......................................................................................................................... 19
2.8 Face .......................................................................................................................................... 20
2.8.1 Why face ........................................................................................................................... 20
2.8.2 Characteristics of face ....................................................................................................... 21
2.9 Corporate Reputation ............................................................................................................... 22
2.10 Trust ....................................................................................................................................... 23
2.11 Loyalty ................................................................................................................................... 24
2.11.1 Consumer loyalty ............................................................................................................ 24
2.11.2 Behavioural intentions ..................................................................................................... 25
2.12 Why Q-V-S-L model .............................................................................................................. 25
Chapter 3 Methodology ................................................................................................................. 27
3.1 Introduction .............................................................................................................................. 27
3.2 Development of the Conceptual Model.................................................................................... 27
3.2.1 Interrelationship between all constructs ............................................................................ 27
3.2.2 Direct and indirect effects between constructs .................................................................. 34
3.3 Questionnaire Design and Structure ......................................................................................... 36
3.3.1 Reason for using positivism research ................................................................................ 36
3.3.2 Questionnaire .................................................................................................................... 37
3.3.3 Cross-Cultural issues ......................................................................................................... 39
3.3.4 Reason for targeting full-service restaurants ..................................................................... 40
3.3.5 Pre-testing questionnaire ................................................................................................... 41
IV
3.4 Survey Method ......................................................................................................................... 41
3.5 Sampling Method ..................................................................................................................... 43
3.6 Analytical Strategy ................................................................................................................... 45
3.6.1 Descriptive statistics .......................................................................................................... 45
3.6.2 Statistical analysis ............................................................................................................. 46
3.7 Implementation of Data Collection .......................................................................................... 49
3.8 Reliability Analysis .................................................................................................................. 51
Chapter 4 Results ........................................................................................................................... 54
4.1 Introduction .............................................................................................................................. 54
4.2 Sample (socio-demographics) Characteristics ......................................................................... 54
4. 3 Mean Scores for Scales ........................................................................................................... 56
4.3.1 Perceived quality ............................................................................................................... 56
4.3.2 Perceived value ................................................................................................................. 57
4.3.3 Satisfaction ........................................................................................................................ 58
4.3.4 Sacrifice............................................................................................................................. 59
4.3.5 Trust .................................................................................................................................. 59
4.3.6 Face ................................................................................................................................... 60
4.3.7 Reputation ......................................................................................................................... 61
4.3.8 Perceived risk .................................................................................................................... 61
4.3.9 Behavioural intentions....................................................................................................... 62
4.4 Structural Equation Modelling ................................................................................................. 63
4.4.1 Introduction ....................................................................................................................... 63
4.4.2 Confirmatory factor analysis ............................................................................................. 63
4.4.3 Structural equation model analysis for the Conceptual Model .......................................... 70
4.4.4 Structural equation model for the Modified Conceptual Model ........................................ 74
4.4.5 Goodness of fit for Modified Conceptual Model. ............................................................. 76
4.4.6 Tests of hypotheses ............................................................................................................ 80
4.5.7 Direct, indirect and total effects on Modified Conceptual Model ..................................... 86
Chapter 5 Discussion ..................................................................................................................... 90
5.1 Introduction .............................................................................................................................. 90
5.2 Summary of the Study .............................................................................................................. 90
5.3 Implications .............................................................................................................................. 96
Chapter 6 Conclusion ................................................................................................................... 101
6.1 Introduction ............................................................................................................................ 101
6.2 Restatement of Aims and Objectives...................................................................................... 101
6.3 Summary of the Research Design .......................................................................................... 102
6.3 Summary of Findings ............................................................................................................. 103
6.4 Theoretical Contribution of the Study .................................................................................... 104
6.5 Managerial Contribution of the Study .................................................................................... 106
6.6 Limitations of the Study ......................................................................................................... 108
6.7 Suggestions for Further Research .......................................................................................... 109
6.8 Conclusions .............................................................................................................................110
V
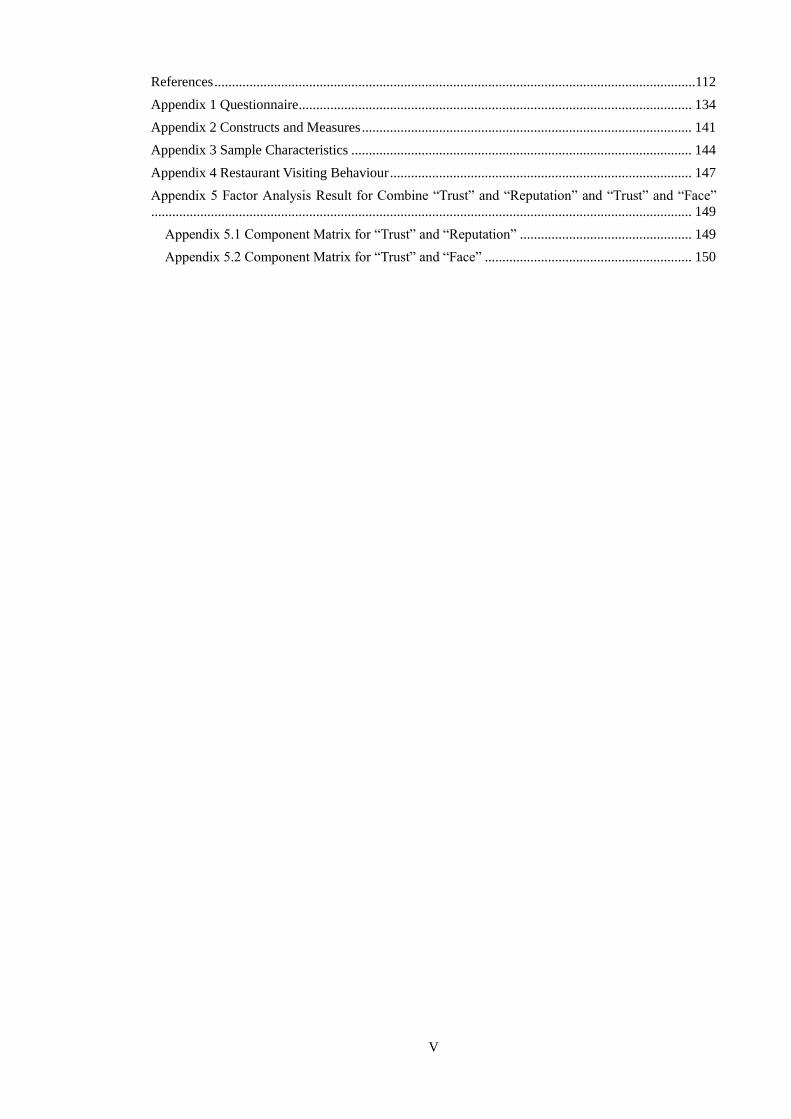
References .........................................................................................................................................112
Appendix 1 Questionnaire ................................................................................................................ 134
Appendix 2 Constructs and Measures .............................................................................................. 141
Appendix 3 Sample Characteristics ................................................................................................. 144
Appendix 4 Restaurant Visiting Behaviour ...................................................................................... 147
Appendix 5 Factor Analysis Result for Combine “Trust” and “Reputation” and “Trust” and “Face”
.......................................................................................................................................................... 149
Appendix 5.1 Component Matrix for “Trust” and “Reputation” ................................................. 149
Appendix 5.2 Component Matrix for “Trust” and “Face” ........................................................... 150

VI
List of Tables
Table 1-1 Sources of China’s economic growth during 1978-2001 .................................. 2
Table 1-2 Basic conditions of urban household ................................................................ 4
Table 3-1 Reliability of constructs .................................................................................. 53
Table 4-1 Socio-demographics analysis .......................................................................... 55
Table 4-2 Mean scores for perceived quality. ................................................................. 57
Table 4-3 Mean scores for perceived value .................................................................... 58
Table 4-4 Mean scores for satisfaction ............................................................................ 58
Table 4-5 Mean scores for sacrifice ................................................................................ 59
Table 4-6 Mean scores for trust ....................................................................................... 60
Table 4-7 Mean scores for face ....................................................................................... 60
Table 4-8 Mean scores for reputation .............................................................................. 61
Table 4-9 Mean scores for perceived risk ....................................................................... 62
Table 4-10 Mean scores for behavioural intentions ........................................................ 62
Table 4-11 Confirmatory factor analysis ......................................................................... 68
Table 4-12 Structural equation model for Conceptual Model ......................................... 71
Table 4-13 Structural equation model for Modified Conceptual Model ......................... 77
Table 4-14 Summary of hypothesis tests ........................................................................ 86
Table 4-15 Summary of direct, indirect and total effects by construct ........................... 89
List of Figures
Figure 3.1 Conceptual Structural Model ......................................................................... 34
Figure 4.1 Modified Conceptual Model .......................................................................... 75

1
Chapter 1 Introduction
1.1 Introduction
The aim of this chapter is to present an outline of the research. It provides a description
of the research background including both the social and the academic research
backgrounds, and then identifies the research gap. This is followed by an explanation of
the research aims and objectives, the methodology, and the structure of the dissertation
in terms of the themes of subsequent chapters.
1.2 The Economic and Social Research Background
The material in this section explains the economic growth of China from 1978, the
potential of the growing consumer market and the rise of an emerging middle-class
consumer.
1.2.1 The economic growth of China since 1978
The rapid economic growth of China since the beginning of economic reform in 1978
has captured the imagination of Western commentators and researchers (Holz, 2007). In
1978, after years of state control of all productive assets, the government of China
embarked on a major program of economic reform (Hu and Khan, 1997). The Chinese
government encouraged the formation of rural enterprises and private business,
liberalised foreign trade and investment, relaxed state control over some prices, and
invested in industrial production and the education of the workforce (Hu and Khan,
1997). A report on the state of the economy in 2005 noted that China's economy had
enjoyed average annual growth rates in excess of 9% over the previous two decades and
it was estimated the country's gross domestic product (GDP) would reach US$2.3
trillion or US$1,700 per capita by 2010 based on the prices and exchange rates in 2000;
after decades of rapid economic development, China's overall GDP ranked sixth in the
world, with the nation's per capita GDP exceeding US$1,200 (Xu, 2005).
Table 1.1 documents the change in China’s economy as a comparison between the
periods 1978-1995 and 1996-2001. In the 6 years from 1996 to 2001, China’s GDP

2
grew at an average annual rate of 8.2 %, which is lower than the 9.8 % growth rate
during 1978–95. The annual growth rate of labour productivity was 7.0 % in 1996–2001,
slightly lower than the 7.2 % of 1978–95. Capital stock grew at 11.8 % per annum in
1996–2001 versus 9.3 % in 1978–95, and the human-capital growth rate (measured by
the number of years of education received by people over 15 years of age) was 2.8 %
and 2.2 % during these two periods respectively. The annual growth rate of the capital
stock per worker of 10.6 % in 1996–2001 was the highest and the fastest-growing since
the founding of the People’s Republic of China in 1949; this indicates an acceleration of
“capital deepening” (Hu, 2005, p.167). Total factor productivity growth averaged 2.3 %
annually in 1996–2001 compared with 4.6 % in 1978–95. From the beginning of the
economic reforms in 1978-2005, gross domestic product (GDP) showed an average
growth of 9.6% per year (Holz, 2007).
Table 1-1 Sources of China’s economic growth during 1978-2001
(average annual % age change)
Economic Indicator 1978-1995
%
1996-2001
%
Population 1.4 0.9
GDP 9.8 8.2
Per capita GDP 8.4 7.3
Number of employees 2.6 1.2
Labor productivity 7.2 7.0
Capital stock 9.3 11.8
Human capital 2.2 2.8
Capital productivity 0.5 -3.6
Capital stock per labor 6.7 10.6
Total factor productivity 4.6 2.3
Sources: Comprehensive Statistical Data and Materials on 50 Years of New China
(1999), China Statistical Yearbook 2003, and China Statistical Abstract 2004. (Cited in
Hu, 2005, p. 168).
Note: When calculating total factor productivity, the weight of capital input is taken as
0.4, the weight of labour input is 0.3, and the weight of human capital input is 0.3.
The Chinese economy achieved an annual GDP growth rate of 11.1% during the period
of the 11th
Five-Year Plan 2006-2010 (James, 2010). In October 2010, the Central

3
Committee of the Communist Party of China (CPC) approved the guiding principles of
China’s 12th
Five-Year Plan for National, Economic and Social Development (FYP)
(2011-2015). The 12th
FYP’s guiding principles will promote the government’s focus on
“inclusive growth”, which means ensuring the benefits of economic growth are spread
among a greater proportion of Chinese citizens. The plan’s key themes are rebalancing
the economy, ameliorating social inequality and protecting the environment. The 12th
FYP includes a national GDP growth rate target of 7%, promoting consumerism over
investments and exports, closing the income gap through minimum wage hikes and an
increased social safety net, and a range of energy efficiency targets (Xinhua, 2010).
China’s economic development in the reform period fits well with the broad
development patterns of structural change, catching up, and factor price equalisation.
Following all three patterns, China faces another 30 years of continued growth (Holz,
2007).
1.2.2 The potential of the consumer market in China
China's size, the abundance of its resources, and its having about 20% of the world's
population living within its borders for the last two centuries means its role in the world
economy will continue to grow. The consumer revolution that began in the 1980s could
be seen as a revolution taking place at the heart of the pre-existing mass consumer
structure with strong homogeneous tendencies. The Chinese government announced on
20 July 2005 that the purchasing power by Chinese consumers had increased by 2.3% in
2004 compared with 2003. In the first six months of 2005, the total sales of the retail
and service industry were US$461.7 billion, an increase of 13.2% compared to the first
six months of 2004. Up to July 2005, people’s income in the cities had increased by
9.5%, and in the countryside had increased by 12.5% compared to 2004 (Zheng, 2005).
Today, 77% of urban Chinese households live on less than 25,000 Yuan a year;
according to the data from the McKinsey Global Institute analysis, by 2025, that figure
will have dropped to 10%. By then, urban households in China will make up one of the
largest consumer markets in the world, spending about 20 trillion Yuan annually (Farrell
et al., 2006).
The rising economy in China has lifted hundreds of millions of households out of
poverty. As an increasing number of Chinese households began to enjoy disposable
4
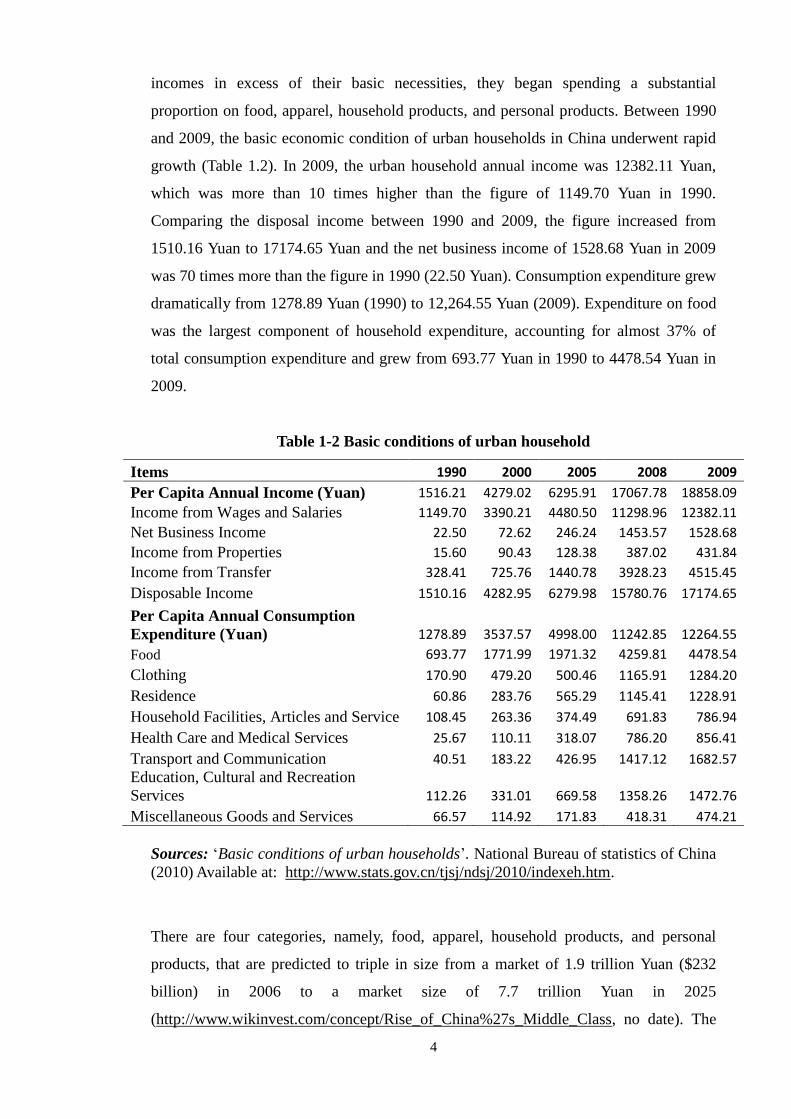
incomes in excess of their basic necessities, they began spending a substantial
proportion on food, apparel, household products, and personal products. Between 1990
and 2009, the basic economic condition of urban households in China underwent rapid
growth (Table 1.2). In 2009, the urban household annual income was 12382.11 Yuan,
which was more than 10 times higher than the figure of 1149.70 Yuan in 1990.
Comparing the disposal income between 1990 and 2009, the figure increased from
1510.16 Yuan to 17174.65 Yuan and the net business income of 1528.68 Yuan in 2009
was 70 times more than the figure in 1990 (22.50 Yuan). Consumption expenditure grew
dramatically from 1278.89 Yuan (1990) to 12,264.55 Yuan (2009). Expenditure on food
was the largest component of household expenditure, accounting for almost 37% of
total consumption expenditure and grew from 693.77 Yuan in 1990 to 4478.54 Yuan in
2009.
Table 1-2 Basic conditions of urban household
Items 1990 2000 2005 2008 2009
Per Capita Annual Income (Yuan) 1516.21 4279.02 6295.91 17067.78 18858.09
Income from Wages and Salaries 1149.70 3390.21 4480.50 11298.96 12382.11
Net Business Income 22.50 72.62 246.24 1453.57 1528.68
Income from Properties 15.60 90.43 128.38 387.02 431.84
Income from Transfer 328.41 725.76 1440.78 3928.23 4515.45
Disposable Income 1510.16 4282.95 6279.98 15780.76 17174.65
Per Capita Annual Consumption
Expenditure (Yuan) 1278.89 3537.57 4998.00 11242.85 12264.55
Food 693.77 1771.99 1971.32 4259.81 4478.54
Clothing 170.90 479.20 500.46 1165.91 1284.20
Residence 60.86 283.76 565.29 1145.41 1228.91
Household Facilities, Articles and Service 108.45 263.36 374.49 691.83 786.94
Health Care and Medical Services 25.67 110.11 318.07 786.20 856.41
Transport and Communication 40.51 183.22 426.95 1417.12 1682.57
Education, Cultural and Recreation
Services 112.26 331.01 669.58 1358.26 1472.76
Miscellaneous Goods and Services 66.57 114.92 171.83 418.31 474.21
Sources: ‘Basic conditions of urban households’. National Bureau of statistics of China
(2010) Available at: http://www.stats.gov.cn/tjsj/ndsj/2010/indexeh.htm.
There are four categories, namely, food, apparel, household products, and personal
products, that are predicted to triple in size from a market of 1.9 trillion Yuan ($232
billion) in 2006 to a market size of 7.7 trillion Yuan in 2025
(http://www.wikinvest.com/concept/Rise_of_China%27s_Middle_Class, no date). The

5
potential consumer market for business is substantial, as retailers such as Carrefour,
B&Q and IKEA have discovered. They have expanded into China by investing in or
establishing a joint venture with local retail chains. Carrefour already has more than 200
stores in China and, in 2005, had sales of about $2.4 billion. As China’s home
improvement market is the fastest growing in the world, with $50 billion in sales in
2005 and increasing by 12% a year, this has created great success for B&Q, which is the
largest Do-It-Yourself retailer in Europe and the third-largest in the world. In 2005,
B&Q sales rose by nearly 48% to £313 million ($611 million), its sixth consecutive year
of double-digit growth since it entered China in 1999. The IKEA group entered China in
1998 as a joint venture; IKEA’s China sales increased by 35% in 2003 and by 50% in
the first quarter of 2004 after they had lowered prices by nearly 10%. The above
retailers are reliable proof of the huge potential consumer market in China that is
creating excellent business opportunities, meaning businesses can profit, regardless of
the source of their goods.
1.2.3 The emergence of middle class consumers
The expanding middle class in China is indicative of the country’s economic success
and is extremely important to both local and international companies due to their
significant purchasing power.
The new middle class denotes the section of the population that relies on knowledge,
acquired skills and intelligence to achieve a stable standard of living as opposed to other
sections of the population that rely either on physical strength, capital or assets to earn a
living. They are educated to degree level and either already own a home and car or are
in a position to be able to do so. Monthly household income for this group is in excess
of 5000 Yuan, and personal income exceeds 3000 Yuan (Wang http://docs.china-europa-
forum.net/doc_669.pdf no date).
Present estimates of the size of the middle class in China range from 100 million to 247
million, depending on how the group is defined according to annual disposable income
(http://www.wikinvest.com/concept/Rise_of_China%27s_Middle_Class, no date).
There are several reasons for targeting middle-class consumers. First, it was estimated
that by around 2011, the lower middle class would number some 290 million people,

6
representing the largest segment in urban China and accounting for about 44% of the
urban population. Growth in this group should peak around 2015, with a total spending
power of 4.8 trillion Yuan. By 2025, this segment will comprise a staggering 520
million people, which is more than half of the expected urban population of China, and
will have a combined total disposable income of 13.3 trillion Yuan (Farrell et al., 2006).
Second, the meteoric rise in China’s middle class is tied to dramatic increases in its per
capita income, which is growing at an incredible rate. The first industrial revolution
created a 250% increase in per capita income over a 100-year period. The second
industrial revolution triggered 350% per capita income growth over 60 years. In
comparison, China is on track to create a 700% growth in per capita income in just 20
years (http://www.wikinvest.com/concept/Rise_of_China%27s_Middle_Class, no date).
Third, the middle-class consumers command 500 billion Yuan, which represents nearly
10% of urban disposable income despite accounting for just 1% of the total population.
They consume globally branded luxury goods voraciously, allowing many companies to
succeed in China without significantly modifying their product offerings or the business
systems behind them. In addition, since this segment is currently concentrated in the
biggest cities, it is easy to serve, both for companies now entering the Chinese market
and for established firms seeking a steady revenue stream (Farrell et al., 2006). Fourth,
the growing middle class in China will open up opportunities for companies in a range
of sectors, For example, in 2006, the proportion of private consumption in China's total
GDP was 38.0%, well below the world's average of 59.2%. The expansion of the middle
class will help to boost the role of private consumption in the Chinese economy, turning
it into a key driver of economic growth. This will reduce the reliance on exports for
China's economic expansion (Hodgson, 2007).
In conclusion, the biggest opportunity for companies selling mass-consumer goods and
services will be the newly empowered middle class (Farrell et al., 2006) and the
substantial and rising number of middle class consumers with their growing incomes
will transform the Chinese consumer market (Hodgson, 2007).
1.2.4 The growth of food services in China
Consumer food services in China have grown rapidly in recent years, driven primarily
by the growth of the Chinese economy, which has led to rapid urbanisation and rising
disposal income in China (My Decker Capital, 2010). The economic growth, although
7
not indicative of future growth, has in turn led to changes in consumption patterns in
China, including growing numbers of consumers dining out for convenience or for the
dining experience. According to Euromonitor, the Chinese consumer food service
market grew from RMB 1,106.0 billion ($133.6 billion) in 2004 to RMB 1,996.6 billion
($294.4 billion) in 2009, representing a compound annual growth rate, or CAGR, of
12.5% over the five-year period (My Decker Capital, 2010). Euromonitor estimated that
this market would continue to grow to RMB 3,047.0 billion ($449.3 billion) in 2014,
representing a CAGR of 8.8% from 2009 (My Decker Capital, 2010). Urban Chinese
consumers have changed their consumption patterns amid China’s robust economic
growth and the increasing affluence of its urban middle-class. Both the number and the
frequency of people dining out have increased. In the past, most people in China dined
out only on special occasions, but today, many people dine out multiple times a week
for convenience. Urban residents tend to spend more time at work and participating in
social activities, and they put increasingly more value on the time saved from preparing
meals in the kitchen, which outweighs the added cost of dining out. In addition, dining
out in groups has become a social event for many people in China (My Decker Capital,
2010).
There are several types of restaurant in China including hotpot restaurants, full-service
restaurants, Western cuisine and quick-food services. Full-service restaurants in China
provide food services to patrons who order and are served while seated and pay after
eating (i.e., table service) (IBIS world, 2012). Full-service restaurants in China account
for the largest share of revenue of all the industries in China's catering subsector.
Revenue for this subsector is expected to total $471.8 billion in 2012, of which 61.0%
or $287.8 billion will be generated by the full-service restaurant industry (IBIS world,
2012).
1.3 The Academic Research Background
This section explains the academic research background of this thesis, which included
the importance of loyalty research, the link between customer loyalty and behavioural
intentions and the Q-V-S-L model.
1.3.1 The importance of loyalty research
8
Loyalty marketing is a popular topic among marketers (Duffy, 1998). In an increasingly
competitive environment, companies must be customer oriented. Loyalty customers can
bring benefits to a company (Brunner et al., 2007); repeat patronage through loyalty
enhancement contributes to a firm’s increased profits, increased purchasing, lowered
price sensitivity, and recommendations as well as making it immune to competitors’
promotion efforts (Reichheld and Schefter, 2000). It is better for a company to spend
resources to keep existing customers than to attract new ones (Athanassopoulos et al.,
2001; Fornell and Wernerfelt, 1987; Olorunniwo et al., 2006). This is because when
customers are lost, new ones must be captured to replace them, which is expensive for
the following two reasons: first, costs for advertising, promotion, sales, and discovering
new customers’ needs are high; and second, new customers need a “grace” period until
they become profitable (Athanassopoulos et al., 2001). Both researchers and
practitioners in business and marketing have attempted to find more effective ways to
generate customer loyalty and uncover the factors contributing to loyalty enhancement
(Lee and Feick, 2001; Yang and Peterson, 2004).
Regarding the current competitive restaurant market, generating customer loyalty has
become an important goal for every restaurant operation (Jang and Mattila, 2005;
Ladhari et al., 2007; Mattila, 2002). Loyal customers offer repeat business and generate
income for the companies to whom they are loyal. In this regard, hospitality
professionals in both academia and industry have attempted to identify the major factors
that influence and enhance customer loyalty (Kim and Han, 2008).
1.3.2 Definition of customer loyalty through behavioural intentions
Traditionally, the concept of loyalty may be understood as the consumer expectations or
the predisposition to repurchase a product or service (Auh and Johnson, 2005). One
means of assessing customer loyalty, and hence the likelihood of customers returning, is
through customers’ behavioural intentions (Jones and Sasser, 1995; Nijssen et al., 2003;
Pritchard et al., 1999). When the behavioural components are favourable, which is the
goal of service providers, customers positively affirm their likelihood of revisiting the
provider and then spread positive reviews to others with whom they are in contact (Jani
and Han, 2011).
The majority of researchers agree that customer loyalty includes both intentional and
9
behavioural dimensions (e.g., Dick and Basu, 1994; Guenzi and Pelloni, 2004; Kim and
Han, 2008). The intentional dimension is also described as loyalty intentions (Chiou and
Shen, 2006; Guenzi and Pelloni, 2004) and focuses on a customer’s willingness to
repurchase and recommend; the behavioural dimension focuses on the repeated
purchase of products/services and usage frequency (Baldinger and Robinson, 1996;
Wong and Sohal, 2003). A good example of the intentional dimension is how existing
customers and loyal customers create positive word-of–mouth (WOM), which is
outstanding as a highly trusted information source, such as giving recommendations
about a service provider, passing along positive comments about particular service
aspects and encouraging friends and family to purchase from a particular provider (Jani
and Han, 2011; Ng et al., 2011). WOM assists in attracting new customers, which is
important for a firm’s long-term economic success (Hennig-Thurau et al., 2002).
Moreover, customers who remain loyal to the company are likely to engage in
favourable WOM behavioural responses. In addition, the company may be able to cross-
sell to these customers or even charge them a premium price (Athanassopoulos et al.,
2001). With regard to a customer’s decision to re-purchase a product or service for
convenience, repeat purchase may not always be an adequate indicator of loyalty (Chiou
and Shen, 2006). Accordingly, the scales used in this study were considered only for the
intentional dimension of customer loyalty (loyalty intentions).
1.3.3 The Q-V-S-L model
The behavioural intentions of customers are recognised in the literature as an important
predictor of the profitability of service firms (Reichheld and Sasser, 1990; Slater and
Narver, 1995). To date, the study of service quality, service value, and satisfaction issues
have dominated the services literature (Cronin et al., 2000). With economic
development and increasing personal disposable income, competition in the service
market has changed from a focus on price to a focus on quality. The characteristics of
service marketing, including intangibility, separability, perishability and consumer
loyalty, are not directly measurable, so the Q-V-S-L model (Cronin et al., 2000) is
widely used in the service marketing research field.
Perceived quality, perceived value, and customer satisfaction have a direct effect and an
indirect effect through their potential linkage to consumer loyalty (Cronin et al., 2000).
These three factors are considered as the determinant factors that influence consumer

10
loyalty. Customer loyalty research has led to substantial research in service marketing in
the USA and Europe for many years and numerous empirical studies have investigated
the relationships among the constructs of service quality, perceived value, customer
satisfaction, and behavioural intentions in a variety of industries and cultures. These
include studies of the low-cost airline carriers in Thailand (Saha and Theingi, 2009), on-
line purchasing in Australia (Hackham et al., 2006), the restaurant industry in the US
(Jani and Han, 2011), health care providers in South Korea (Choi et al., 2002), and food
quality and preference in Europe (Ness et al., 2009).
1.4 Identification of the Research Gap
Chinese consumer loyalty research has received much attention in the popular press but
research literature is scarce and more limited in scope. Though consumer perceptions of
price, quality and value are considered pivotal determinants of shopping behaviour and
product choice, research on these concepts and their linkages has provided few
conclusive findings (Zeithaml, 1988). Cronin et al. (2000) examine the effects of quality,
value and customer satisfaction on consumer behavioural intentions in the service
environment; in their view, even a cursory evaluation of the literature reveals a myriad
of conflicting results, as no research has simultaneously compared the relative influence
of these three important constructs on service encounter outcomes. This gap in the
literature has generated a new call for research, referring to the effects of quality, value,
and satisfaction on consumer purchase intentions as well as consumer loyalty to a
particular service environment. There exists a large body of literature including models
and theories of consumer behaviour, but most of the studies were conducted within the
European and US market. The Q-V-S-L model was created and developed in a Western
cultural environment and, due to cultural differences, it is likely that cultural factors will
influence its applicability. Consequently, the stability and applicability of past findings
across different national/cultural settings remain largely untested.
As a developing country, the Chinese economic environment has a degree of uncertainty;
in addition, the cultural factor of face is considered an important factor which can
influence Chinese customer loyalty. Face has been the focus of many scholars’ research
interests (Gilbert and Tsao, 2000; Hoare and Butcher, 2008; Imrie et al., 2002) but none
of them has tested face as a construct in a Q-V-S-L model and using a structural
equation model (SEM) approach. Cronin et al. (2000) stress that the Q-V-S-L model is
11
not designed to include all possible influences on consumer decision-making for
services. Snoj et al. (2004) also suggest that researchers should expand the model with
more indicators on perceived value and perhaps study relationships between perceived
value, intentions to buy, customer satisfaction and loyalty. It is widely accepted that
there is an effect on perceived value by perceived risk (Agarwal and Teas, 2004; Snoj et
al., 2004; Teas and Agarwal, 2000); thus, perceived risk is considered to add to the
Conceptual Model. The significant link between reputation and trust is confirmed by
Tian et al. (2008), Martín and Camarero (2008) and Kim and Han (2008). Keh and Xie
(2009) suggest that customer satisfaction can be considered as an antecedent of
reputation in future studies to form a more comprehensive framework and provide
additional insights into the development, management and benefits of reputation.
Consequently, perceived risk, face, reputation, and trust should be added to the Q-V-S-L
model according to Cronin et al.’s (2000) suggestion for future research. Testing the
new expanded model for consumer loyalty and the constructs’ interrelationships in
Chinese restaurant industry will generate a new call for research.
1.5 Research Aims and Objectives
To date, the study of service quality, service value, and satisfaction issues has dominated
the services literature. The focus of these discussions has been both operational and
conceptual, with particular attention being given to identifying the relationships among
and between these constructs (Cronin et al., 2000). These efforts have enabled us to
discriminate better between the variables, resulting in an emerging consensus as to their
interrelationships, and have included the integration of these factors to identify
consumer loyalty under different cultural backgrounds. The aim of this study was to
develop a structural equation model (SEM) of customers’ behavioural intentions
towards restaurant patronage in China. Customer loyalty is defined in terms of
behavioural intentions. The determinants of customer loyalty are defined as perceived
quality, perceived value, sacrifice, perceived risk, face, satisfaction, reputation, trust and
behavioural intentions. In accordance with the research aim, seven research objectives
were specified, as follows:
1. to identify the determinants of customer loyalty in the context of the Chinese
culture from a review of the existing literatures

12
2. to formulate hypotheses concerning the interrelationship between the determinants
of customer loyalty from a review of the existing literature
3. to develop a structural model to explain the interrelationships between constructs
4. to develop scales for each of the constructs in the structural model and evaluate
them in terms of reliability and validity to estimate measurement models for each of
the constructs in the model and evaluate them in terms of measures of fit and
interpretation
5. to estimate a structural equation model for the determination of customer loyalty
and evaluate it in terms of measures of fit and interpretation
6. to test hypotheses concerning the interrelationships among constructs
7. to estimate the direct and indirect effects of relevant constructs on behavioural
intention.
1.6 Outline of the Thesis
The study is presented in five chapters. A literature review is presented in Chapter 2.
Chapter 3 explains the methodology used in this research, including the hypotheses
associated with the Conceptual Model, and presents detail of the model framework that
is employed in the analysis. This is followed by the presentation of the results of the
analysis in Chapter 4. Chapter 5 is the discussion of the research results and the
implications of the results. The final section, Chapter 6, provides a summary of the
work, limitations of the research and suggestions for future research.
13
Chapter 2 Literature review
2.1 Introduction
The aim of this chapter is to review the literature on research in the restaurant sector
regarding customer loyalty and the Q-V-S-L model. The review establishes the
foundation on which a conceptual structural model is developed and focuses on the
constructs that are relevant to the issue of loyalty. Consequently, the structure of the
chapter is organised in sections 2.2-2.12 that review issues of important factors in
restaurant sector research, namely, perceived service quality, perceived value,
satisfaction, sacrifice, perceived risk, face, corporate reputation, trust, loyalty and the Q-
V-S-L model respectively.
2.2 Important Factors in Restaurant Sector Research
Today, customers are no longer willing to sacrifice poor service or dining environment
(atmosphere) to good tasting food when they seek an exotic experience in ethnic
restaurants. An excellent overall dining experience via excellent food in conjunction
with a good atmosphere and high-quality service needs to be achieved to ensure their
satisfaction (Ryu et al. 2012).
Like most service industries, the importance of perceived quality has been recognised in
the restaurant industry (McCollough, 2000; Oh, 2000). Previous researchers have
generally agreed that those who evaluate perceived quality as being high are more likely
to be satisfied with restaurant services (Namkung and Jang, 2008). In a restaurant
setting, there are many quality factors that could influence the customer’s satisfaction
(Dulen, 1999; Susskind and Chan, 2000). Dulen (1999) asserts that food, physical
environment and service are the major features in increasing the accuracy of customer
assessments of a restaurant’s quality. In addition, Susskind and Chan (2000) claim that
food, physical environment, and service are significant determinants that can boost
guest check averages and set restaurants apart from competitors in the consumer’s
estimation; these factors are key components of the restaurant experience in evaluating
restaurant service quality (Chow et al., 2007; Namkung and Jang, 2008; Ryu et al.,
2010). A proper combination of these vital attributes should result in customers’
14
perceptions of high restaurant service quality, which in turn, should enhance customer
satisfaction and customer loyalty in the restaurant industry (Ryu et al., 2012).
That food is the most essential part of the overall restaurant experience is confirmed by
many scholars (Kivela et al., 1999; Sulek and Hensley, 2004). According to Peri (2006),
food quality is an absolute requirement to satisfy the needs and expectations of
restaurant customers.
The physical environment itself may produce feelings of excitement, pleasure, or
relaxation. Consequently, various aspects of atmospherics may be used by customers as
tangible cues to assess the quality of services provided (Aubert-Gamet and Cova, 1999).
Maintaining a differentiated restaurant image compared to the competition is an
important task of restaurant operators. Managing a consistent and distinct restaurant
image is an important marketing strategy component for them, which in turn, has an
influence on customer perceived value and satisfaction (Ryu et al., 2012).
Service quality is the single most researched subject in services marketing (Fisk et al.,
1993), and the SERVQUAL scale introduced by Parasuraman et al. (1988) has
dominated the study of the conceptualisation and measurement of service quality
constructs (Brady et al., 2002). Despite its broad applicability across all service sectors,
attention should be paid to adapting SERVQUAL to a specific setting.
Customer satisfaction is also considered as an important factor in restaurant sector
research (Kivela et al., 1999; Qu, 1997; Yau and Lee, 1996). Exacting customer
demands mean that restaurant organisations must endeavour to deliver not only quality
products and services, but also a high level of dining satisfaction that will lead to
increased customer return and a greater market share (Kivela et al., 1999). The
importance of customer satisfaction in relation to occupancy rates and return rates is
clear and both management experts and researchers in the hospitality field have long
exhorted profitability (Kivela et al., 1999). Customer satisfaction is equally important
for marketers, who are responsible for measuring dining satisfaction, and who must
position restaurant operations competitively in the existing and future marketplace
(Almanza et al., 1994; Lee and Hing, 1995; Oh and Jeong, 1996; Qu, 1997; Yau and
Lee, 1996).
15
2.3 Perceived Service Quality
The most important characteristic of services, and probably the only really unique one,
is the fact that services are processes, not things (Grönroos, 1984). Quality is defined as
conformance with a customer’s specifications (Berry et al., 1994). Because of its critical
role in the customer’s evaluation and decision-making process, perceived quality is
considered to be a critical concept in business and marketing (Kim and Han, 2008).
Zeithaml (1988) described perceived quality as customers’ evaluation of the overall
excellence of a product or service; it concerns personal responses to product or service
attributes from the customer’s viewpoint (Holbrook and Corfman, 1985). Lee et al.
(2000) suggest perceived service quality should be treated strictly as a relativistic (not
absolute), cognitive (not affective), product-related (not consumer-related), post-
purchase (not pre-purchase) evaluation of get-components (not sacrifices).
Service quality has been assigned various definitions (Ozdemir and Hewett, 2010).
Traditionally, definitions of service quality revolve around the idea that it is the result of
the comparison that customers make between their expectations about a service and
their perception of the way the service has been performed (Lewis and Booms, 1983;
Grönroos, 1984; Parasuraman et al., 1985, 1988, 1991, 1994). Cronin and Taylor (1992)
argued it is appropriate to use a perceptions-only operationalisation instead of
conceptualizing a gap between expectations and performance, and this is supported by
some researchers, who viewed service quality as an overall evaluation of services
(Taylor and Baker, 1994).
The way to achieve quality service has been investigated in the service marketing
literature by several scholars. For example, Lee et al. (2000) note that service managers
should place emphasis on the performance perceived by customers rather than the
difference between perceived performance and prior expectations. Iglesias and Guillén
(2004) identify that a service manager should manage customers’ predictive
expectations to increase customer perceptions of overall service quality. This view was
followed by Hamer (2006), who indicates that perceived service quality is a weighted
average of perceived performance and expectations.
In the restaurant and food services sector, research evidence has been inconclusive
regarding which service quality dimension is important to customer loyalty (Hoare and

16
Butcher, 2008). Lehtinen and Lehtinen (1982) give a three-dimensional view of service
quality; they see it as consisting of what they term ‘interaction’, ‘physical’ and
‘corporate' quality. This view is improved by Caruana et al. (2000), who investigate the
issue at a higher level, and essentially from a customer's perspective; they see quality as
being two dimensional, consisting of “process” and “output” quality. Caruana et al.’s
(2000) view of quality is supported by Swanson and Davis (2003); they conclude that
service quality can be divided into two types. The first type is technical quality, which
relates to what is delivered, and the second quality dimension is how the service is
delivered (i.e., functional or process) and is evaluated during the service delivery. The
direct effects of functional and technical quality on overall service quality are
comparable; however, the effect of functional (process) quality on image is larger than
the effect of technical quality (Kang and James, 2004). How the service is delivered
(functional or process quality) is essential to consumers’ subsequent evaluations
(Swanson and Davis, 2003).
Service quality is considered a very important factor in the corporate environment;
financial performance, costs, customer satisfaction and customer retention are all
closely linked to service quality (Bowbrick, 1980). Improving service quality is thought
to lead ultimately to firms gaining new, as well as retaining current, customers
(Swanson and Davis, 2003). Service quality is also considered as an important decision-
making criterion for service consumers (Cronin et al., 2000).
2.4 Perceived Value
Customer perceived value has been discussed in marketing research for a long time
(Chang and Wang, 2010). Indeed, understanding and delivering customer value is seen
as a cornerstone of marketing and competitive strategy (Lindgreen and Wynstra, 2005).
Value is the determinant of several aspects of social behaviour including attitude,
ideology, beliefs and justifications (Boksberger and Melsen, 2009) and is regarded as a
key determinant of loyalty (Sweeney and Soutar, 2001). Value is a cognitive construct
(Choi et al., 2002); it has its origin in equity theory (Chang and Wang, 2010) and is
based on a trade off between the quality/benefits customers receive and customers’
sacrifice to obtain such quality/benefits (Agarwal and Teas, 2004; Choi et al., 2002;
Dodds et al., 1991; Fornell et al., 1996; Iglesias and Guillén, 2004; Oh, 2000; Slater,

17
1997; Yang and Peterson, 2004; Zeithaml, 1988). Zeithaml (1988) identifies four
consumer definitions of product value: (1) value is low price, (2) value is whatever I
want in a product, (3) value is the quality I get for the price I pay, and (4) value is what I
get for what I give. These four definitions have been brought together, and perceived
value has been defined as the consumers' overall assessment of the utility of a product
based on perceptions of what is received and what is given (Caruana et al., 2000; Choi
et al., 2002; Zeithaml, 1988).
The importance of the perceived value of the product centres on the fact that it will
determine the greater or lesser willingness shown by consumers to purchase the
products, such that the greater the perceived value, the greater the purchase intent
shown by consumers (Dodds and Monroe, 1985, p. 88). When customer perceived value
is high, customers have positive evaluations and affective attitudes towards the product
(Fornell et al., 1996); therefore, customers will always search for a business that can
provide better customer value (Chang and Wang, 2010). Researchers agree that
perceived value is a major influence on customer loyalty (e.g., Fornell et al., 1996; Oh,
2000; Yang and Peterson, 2004). High value provides a customer with a strong
motivation to repeat patronage (Yang and Peterson, 2004) and ensures successful long-
term business performance (Woodruff, 1997).
2.5 Satisfaction
Customers will buy services that provide more satisfaction rather than the highest
quality of service (Høst and Andersen, 2004) so customer satisfaction has long been
recognised as playing an essential role in success and survival in today’s competitive
environment (Athanassopoulos et al., 2001); furthermore, it reflects customers’ overall
feelings, derived from the value of services they have received (Woodruff, 1997).
Customer satisfaction has also been defined in various ways (Brunner et al., 2008).
Traditionally, satisfaction has been defined as an evaluation process in which the
customer compares prior expectations of the service (or perceived service) to the
experience of the service (Gilbert et al., 2004) and it is an effective response following
an expectancy-disconfirmation experience that involves a cognitive process (Oliver,
1980). Olsen (2002) argued that several studies seemed to have concluded that
satisfaction is an affective construct rather than a cognitive construct. Most recently,
18
customer satisfaction has been defined as the consumers’ overall evaluation based on
their overall experience (Bontis et al., 2007).
The measures of satisfaction have attracted the interest of many researchers. Cronin and
Taylor (1992) defined and measured customer satisfaction as a one-item scale that asks
for the customers’ overall feelings towards an organisation. The weakness of the
measure was obvious, and was improved by Bitner and Hubert (1994, p. 85), who used
four items to measure the customers’ overall satisfaction with the service provider. Their
research was followed by Price et al. (1995), who used a six-item scale, and this was
further improved by Shemwell et al. (1998), who used a five-item scale to model
customer satisfaction. Cronin et al. (2000) assessed service satisfaction using items that
include interest, enjoyment, surprise, anger, wise choice, and doing the right thing.
Researchers have also acknowledged the multi-dimensional nature of customer
satisfaction and have established global measures (capturing the satisfaction at multiple
levels in the organisation) that view overall satisfaction as a function of satisfaction with
multiple experiences or encounters with the service providers (Sureshchandar et al.,
2002).
Satisfied customers will repeat their purchases, will be more loyal to the firm and
moreover, will become the most efficient and effective communication resource of the
firm by generating favourable communication (Iglesias et al., 2004), so satisfaction is a
key variable influencing customer brand loyalty (Ha et al., 2009). However, satisfaction
in itself will not translate into loyalty (Jones and Sasser, 1995) but will foster loyalty to
the extent that it is a prerequisite for maintaining a favourable relative attitude and for
recommending and repurchasing from the store (Jones and Sasser, 1995). Bowen and
Chan (2001) note that a small increase in customer satisfaction boosts customer loyalty
dramatically.
Satisfaction is also recognised as an antecedent of brand trust and it is accepted that
there exists a moderate effect of customer involvement in the overall satisfaction-brand
trust relationship (Ballester and Alemán, 2001). Satisfaction is essential to reduce the
consumer’s uncertainty about the virtual firm’s honesty and its ability to provide
products and services efficiently (Martín and Camarero 2009).

19
2.6 Sacrifice
Sacrifice is defined as what is given up in the process of acquiring a product or service
(Zeithaml, 1988). Consumers sacrifice both money (Agarwal and Teas, 2004) and other
resources (e.g., time, energy, effort) to obtain products and services (Zeithaml, 1988)
and the perceived sacrifice has a negative effect on the perceived value of products
(Snoj et al., 2004).
The multidimensional concept expresses sacrifice in terms of measures of monetary and
non-monetary costs with the acquisition of a product or service (Agarwal and Teas,
2004; Dodds et al., 1991; Snoj et al., 2004; Zeithaml, 1988). Perceived sacrifice refers
to the (typically) non-monetary costs, such as the psychic cost, which represents
customers’ mental stress or emotional labour during the shopping experience (Baker et
al., 2002); convenience, which is the trade-off between what is delivered and the effort
required to obtain it (Butcher et al., 2002); and time/effort costs, which involve
customers’ perceptions of the time and effort they are likely to expend at a store (Baker
et al., 2002). Items that represent consumers’ perception of the monetary and the non-
monetary price associated with the acquisition and use of a service were used as
indicators of the sacrifice constructs (Cronin et al., 2000).
2.7 Perceived Risk
Risk plays an essential role in consumer behaviour, and it makes a valuable contribution
towards explaining information-searching behaviour and consumer purchase decision
making (Barnes et al., 2007; Corbitt et al., 2003; Mayer et al., 1995). Stone and Winter
(1985) view risk as an expectation of loss, and the more certain one is about this
expectation, the greater the risk for the individual. Though there is no consensus on the
definition of risk (Gefen et al., 2002), in general, perceived risk is considered to be a
multi-aspect construct, influenced by many variables of benefits and sacrifices, which
has a very dynamic nature (Snoj et al., 2004). The multi-dimensional concept includes
potential financial (losing or wasting income) performance (does not meet the need) and
physical (personal illness, injury or health risk), psychological (emotional pressure) or
social losses (being seen as unfashionable or having a lower status) (Stone and
Gronhaug, 1993) as well as time risk, which is a risk that time spent in searching for a
product will be lost if a product does not perform according to a consumer’s
20
expectations (Mumel, 1999, cited in Snoj et al., 2004). All of these factors are
associated with a purchase decision (Yuksel and Yuksel, 2007), although applications
do not always include all these components (Ness et al., 2010). In disciplines such as
economics, psychology, statistical decision theory and game theory, the concept of risk
is related to choice situations involving both potentially positive and potentially
negative outcomes (Stone and Gronhaug, 1993).
The risk perceived in purchases varies across people and products (Stone and Gronhaug,
1993), and consumer behaviour involves risks in a sense that any action by a consumer
will produce consequences which s/he cannot anticipate with anything approximating
certainty, and some of those at least are likely to be unpleasant (Snoj et al., 2004). A
number of authors have shown that services are riskier than products (Guseman, 1981;
Mitchell and Greatorex 1993); this is because the inherent properties of services, i.e.,
heterogeneity, perishability, inseparability and intangibility, undermine consumer
confidence and increase the perceived risk, mainly by augmenting the degree of
uncertainty in the decision (Mitchell, 1999). These all result in perceived risk, in
practice and theory, and are a neglected field of research that needs to be examined as
much in research activity as in the resolution of managers (Sonj et al., 2004).
2.8 Face
2.8.1 Why face
Research on cross-cultural psychology, sociology, and anthropology suggests that the
influence of face on social interactions is both pervasive and powerful in Asia (Kim and
Nam, 1998). Face is an important Chinese cultural concept that has penetrated every
aspect of Chinese life. It is also a cultural concept that has been influencing Chinese life
for thousands of years (Dong and Lee, 2007). The mutual nature of face is probably its
most important characteristic. Saving one’s own face and giving face to one’s partners
are effective strategies to enhance communication and cooperation (Dong and Lee,
2007).
In China, face has to do with the image or credibility of the person you are dealing with.
You should never insult, embarrass, shame, yell at or otherwise demean a person (China
Unique, 2011). Applying the Chinese use of face, if someone is able to save his/her own
face while giving face to his/her partners, s/he gains credibility and will build a
21
harmonious relationship in future interaction or communication (Dong and Lee, 2007).
Face shows up in many ways and really begins early in life. Chinese children learn it as
they are growing up; as the child grows, face exerts a strong pressure to encourage an
individual to excel (China Unique, 2011).
As today’s technology and economy transform the world into a global village, business
people who currently operate/plan to launch businesses in the Asian market, specifically
in China, must be aware of the influence of face on business communication (Dong and
Lee, 2007). Negotiations should be conducted to ensure that the person at the other end
of the negotiating table maintains face even if the deal should not be concluded
successfully (China Unique, 2011). Face has a significant business impact (China
Unique, 2011), as there is nothing more important than face in Chinese culture (Zhong,
2007).
2.8.2 Characteristics of face
Cross-cultural research presents many challenges, particularly in situations where the
cultures studied are very different (Doran, 2002). China is a high context culture in
which people are deeply involved with others and information is widely shared (Hall,
1976). Chinese culture is particularly characterised by a strong desire to gain or protect
face (Hoare and Butcher, 2008). “Guanxi” and “mianzi” (face) are the dominating
characteristics in Chinese business relationships (Gilbert and Tsao, 2000).
It is quite common for studies of customer loyalty in China to acknowledge issues of
cultural values (Gilbert and Tsao, 2000; Hoare and Butcher, 2008; Imrie et al., 2002).
Face and harmony are the most significant factors which can affect customer loyalty
(Hoare and Butcher, 2008). Although face is a human universal behaviour, the Chinese
have developed sensitivity to it and use it as a reference point in behaviour in a much
more sophisticated and developed way than do other cultural groups (Gilbert and Tsao,
2000). Face is found to be important in evaluating service delivery among Chinese
consumers (Hoare and Butcher, 2008) and is something valuable that can be achieved;
the amount of face a person has is a function of social status (Gilbert and Tsao, 2000).
Service providers need to protect or give face to the host of a dining party in front of his
family, friends or guests (Hoare and Butcher, 2008). By doing so, a customer feels that
his status has been enhanced, consequently increasing satisfaction with the experience;
as a result, a long-term relationship is more likely to be maintained when face is present

22
in the service encounter. It was also found that face is a strong predictor in affecting
customer satisfaction (Hoare and Butcher, 2008).
2.9 Corporate Reputation
Reputation can be used as an effective means of predicting the outcome of the service-
production process, and can, perhaps, be considered the most reliable indicator of the
ability of a service firm to satisfy a customer’s desires (Nguyen and Leblanc, 2001). The
formation of a good reputation is a long-term process in an organisation; thus, it is an
intangible asset that is difficult for competitors to imitate (Keh and Xie, 2009) as well as
from an accounting perspective (Chun, 2005). Tian et al. (2008) indicated that
reputation operates as an extrinsic cue to the trustor to award trust to the trustee when
situational factors make it impossible to judge the credibility of the trustee. High
reputation can strengthen customers’ confidence and reduce risk perceptions when they
make a judgment on organizational performance and the quality of products or services
(Keh and Xie 2009).
Corporate reputation affects the way in which various stakeholders behave towards an
organisation, influencing, for example, employee retention, customer satisfaction and
customer loyalty (Chun, 2005). The concept of corporate reputation has drawn
academic attention from the management economic, sociology, and marketing areas
(Brown et al., 2006). From different perspectives, there are a variety of definitions of
corporate reputation (Berens and Van Riel, 2004; Chun, 2005). Bontis et al. (2007) note
a corporation does not have a single reputation, but has many, so no single definition of
corporate reputation has been accepted as a uniform definition; it is described as a
global valuation. Berens and Van Riel (2004) present three dominant conceptual streams
based on previous research: (1) the different social expectations that people have
regarding a company, (2) the different personality traits that people attribute to a
company and (3) the different reasons they have to trust or not to trust a company.
Because positive corporate reputation is based on superior performance over a certain
period of time (Keh and Xie 2009), building a reputation is a long-term behaviour and
thus the influence is time-lagged (Tian et al., 2008). As customers are more likely to
perceive companies with highly favourable reputations as trustworthy (Keh and Xie
2009), a favourable corporate reputation can have a significant positive effect on
23
financial performance (Robert and Dowling, 1997).
2.10 Trust
Trust in a person is a feeling of security based on the belief that his/her behaviour is
guided and motivated by favourable and positive intentions towards the welfare and
interests of his/her partner (Ballester and Alemán, 2001). It has recently become a
popular issue in marketing literature because of the relational orientation emerging in
marketing activities (Dywer et al., 1987; Morgan and Hunt, 1994), and according to
Ballester and Alemán (2001), trust is a feeling of security held by the consumer that the
brand will meet his/her consumption expectations.
The importance of trust has been widely recognised and, traditionally, trust has been
analysed from two different perspectives (Kumar et al., 1995; Mayer et al., 1995). On
the one hand, trust is the willingness of a party (trustor) to be vulnerable to the actions
of another party (trustee) based on the expectation that the other will perform a
particular action important to the trustor, irrespective of the ability to monitor or control
that other party (Mayer et al., 1995; Kumar et al., 1995). On the other hand, trust may
be analysed as a cognitive component, so that trust has also been associated with a set of
beliefs (Anderson and Narus, 1990; Doney and Cannon, 1997). The cognitive
perspective of trust is more usual in the literature and the cognitive component is
considered as an outcome or a potential indicator of trust (Casaló et al., 2007). When
considering trust as a cognitive component, the literature has usually suggested that trust
may be defined by three types of beliefs, namely, competence, honesty and benevolence
(Mayer et al., 1995; Ridings et al., 2002), and based on three components: reliability,
fairness, and goodwill (Dyer and Chu, 2000). Morgan and Hunt (1994) note that trust
will occur when one party has confidence in an exchange partner’s reliability and
integrity.
Trust is increasingly developed between partners; they develop greater knowledge and
appreciation for each other’s contribution to the relationship (Corsten and Kumar, 2005)
and are likely to become more satisfied with and dependent on one another (Tian et al.,
2008). Such increased knowledge, appreciation and dependency will strengthen their
intention to continue in the relationship (Li et al., 2006).
24
From a marketing point of view, trust has been considered as a key factor in order to
establish successful long-term oriented relationships (Anderson and Narus, 1990;
Dwyer et al., 1987), and it is considered as the central factor that contributes to
successful relationship marketing together with customer commitment because of their
ability to lead indirectly to cooperative behaviour and produce outcomes that promote
efficiency, productivity and effectiveness (Morgan and Hunt, 1994). Tian et al. (2008)
suggest ways to cultivate trust, including creating and enhancing company reputation,
and improving consumers’ satisfaction level.
2.11 Loyalty
2.11.1 Consumer loyalty
Increasing customer loyalty may be regarded as a fundamental goal of every business
(Kim and Han, 2008). It is more cost effective to retain a customer than to attract a new
one (Athanassopoulos et al., 2001; Fornell and Wernerfelt 1987; Lee et al., 2000) and
loyalty is believed to be a prime determinant of long-term financial performance (Jones
and Sasser, 1995). Brands with higher levels of loyalty may have higher consumer
involvement and expectations (Aaker et al., 2004; Thorbjørsen and Supphellen, 2004)
so all businesses should seek to boost loyalty and maximize their share of the customer
base (Duffy 1998).
The definition of loyalty has been conceptualised in various ways (Kim and Han, 2008);
for instance, Oliver (1997, p. 392) represented loyalty as “a deeply held commitment to
repurchase a preferred product or service in the future”. Latterly, loyalty has been
defined as an attitude and as a behaviour (Ball et al., 2004), but the most widely
accepted definition of loyalty is a behavioural response expressed over time (Dick and
Basu, 1994). Combinations of past frequent behaviours and intention to repurchase (e.g.,
Nijssen et al., 2003; Pritchard et al., 1999) are also used to assess a global and
cumulative loyalty (Tuu et al., 2011).
Building customer loyalty is a business strategy, not just a marketing program (Duffy
1998). In general, loyalty development has been an objective traditionally aimed at by
managers (Andreassen, 1999) since it results in higher future purchase intentions
(Casaló et al., 2007). More specifically, loyalty has been considered to be a key factor in

25
order to achieve company success and sustainability over time (Flavián et al., 2006;
Keating et al., 2003). The pursuit of customer loyalty is a perpetual one (Duffy 1998).
2.11.2 Behavioural intentions
Zeithaml et al. (1996) emphasize that behavioural intentions can be seen when a
customer decides to remain with or defect from the company. The construct of
behavioural intentions is considered to include revisit and WOM intentions (Han and
Ryu, 2006; Kim and Han, 2008) that can predict the future consumption behaviour of
the consumer and that of his or her WOM recipients. Positive behavioural intentions can
yield customer loyalty (Han and Ryu 2006). According to Chaudhuri and Holbrook
(2001), behavioural intentions, and not attitudinal intentions, can be linked to increased
market share.
The construct of behavioural intentions is of importance to a service provider
(Olorunniwo et al., 2006). The specific favourable behavioural intentions include
loyalty, switching intentions, willingness to pay more (WPM), external response, and
internal response (Baker and Crompton, 2000; Zeithaml et al., 1996). Ozdemir and
Hewett (2010) conceptualised behavioural intentions as a higher-order construct
consisting of (1) positive WOM, (2) willingness to recommend, and (3) intentions to
continue buying from a particular service provider. In particular, the positive WOM is
recognised as a very common and important form of communication for service
marketers (Swanson and Davis, 2003); it is also a powerful input in decision making as
an information source (Ng et al., 2011). However, the information need not only be
“positive”; the valence of these WOM activities may be negative or neutral (Swanson
and Davis, 2003). WOM has attracted much research interest (Athanassopoulos et al.,
2001; Ng et al., 2011; Swanson and Davis, 2003; Yang and Peterson, 2004). WOM
intentions refer to the customer’s belief that he or she will discuss an incident with at
least one person not directly related to the service encounter (Swan and Davis 2003).
2.12 Why Q-V-S-L model
Over the years, many researchers have proposed and evaluated alternative service
quality models and instruments for measuring service quality (Parasuraman et al., 1985;
Stevens et al., 1995; Zeithaml, 1988) and consumer loyalty (Cronin et al., 2000). The
26
SERVQUAL instrument has been applied in the study of service quality for many
different types of service; however, it has been the subject of a number of criticisms
(Cronin and Taylor, 1994; Parasuraman et al., 1994; Reeves and Bednar, 1994; Teas,
1994). The generalisability of SERVQUAL in different service industries has also been
questioned (Babakus and Boller, 1992) and its applicability across different cultures is
also an issue. SERVQUAL was developed in a Western environment and due to cultural
differences, it is likely that cultural factors will influence its applicability (Donthu and
Yoo, 1998).
The Price-Quality-Value Model (Zeithaml, 1988) defines the concepts of price, quality
and value from the consumer’s perspective. This model examines the indicators of
perceived quality, which are price and brand reputation, and it tests the interrelationship
between perceived quality, perceived value and re-purchase. However, it considers only
perceived quality and perceived value as the indicator of purchase while, as mentioned
by many scholars (Bowen and Chan, 2001; Ha et al., 2009; Iglesias et al., 2004; Jones
and Sasser, 1995), satisfaction is also an important factor which can directly
(Athanassopoulos et al., 2001; Bigné et al., 2008; Swanson and Davis, 2003; Tuu et al.,
2011) and indirectly (Bontis et al., 2007; Chun, 2005) affect repurchase and loyalty
intentions.
Stevens et al. (1995) created a service quality scale, DINESERV, by adapting the most
widely used service quality measure, SERVQUAL (Parasuraman et al., 1988), to
restaurant settings. Despite their endeavours, one of the essential components of the
restaurant experience, “food quality”, was not included as part of the DINESERV
measure (Namkung and Jang, 2007). Hence, most quality studies in restaurant settings
have concentrated on only a subset of quality, either atmospherics or employee services,
but have not comprehensively examined all the vital components of restaurant quality
(Namkung and Jang, 2008). Thus, these quality studies may not have appropriately
captured the idiosyncratic nature of the restaurant experience.
This thesis aimed to examine customer loyalty in the Chinese restaurant sector, so the
Q-V-S-L model (Cronin et al., 2000) was adopted as the basic model.

27
Chapter 3 Methodology
3.1 Introduction
The aim of this chapter is to explain the research methodology adopted to address the
research aim and objectives. The aim of the research is to test and examine the
determinants of consumer loyalty and the causality relationship among the determinants
in the context of the Chinese restaurant sector.
The key feature of the adopted methodology is the use of primary research to capture
data concerning restaurant behaviour, attitudes to restaurants and customers’
characteristics, in order to estimate the structural equation model. The research
instrument is a questionnaire linked to the survey methodology administered to a
sample of restaurant customers.
The structure of the chapter is as follows. Section 3.2 explains the development of a
conceptual structural model developed from the literature. This is followed in Section
3.3 with an explanation of the structure and content of the questionnaire. The survey
method used in this study is explained in Section 3.4. Section 3.5 is the theoretical
knowledge of the sampling method. Section 3.6 is the analytical strategy used in this
research, which includes descriptive analysis and statistical analysis. Factor analysis,
confirmatory factor analysis and structural equation modelling (SEM) are presented in
the statistical analysis section. This is followed in Section 3.7 by a discussion of the
implementation of the data collection and the response rate of the survey. Finally,
Section 3.8 deals with the reliability analysis of the constructs.
3.2 Development of the Conceptual Model
Section 3.2.1 provides theoretical support for the interrelationship between all
constructs and identifies the hypotheses based on the interrelationships. The Conceptual
Model is presented at the end of this sub section. Section 3.2.2 explains the direct and
indirect effect between the constructs of the Conceptual Model.
3.2.1 Interrelationship between all constructs
28
Keng et al. (2007) suggested that the perceived value reflects the product performance
and general consumer appreciation of a service provider who demonstrates expertise
and maintains a reliable service performance. The value of a service product is defined
largely by perceptions of quality (Cronin et al., 2000). This is supported by Oh (2000),
who found that a customer’s quality perception is positively and significantly related to
perceived value. Sweeney and Soutar (2001) noted that the perceived quality of small
household appliances has a positive impact on the perceived value; this was also
confirmed by Snoj et al. (2004) in their research on the mobile phone industry. A study
by Teas and Agarwal (2000) revealed a positive linkage between perceptions of quality
and value. Therefore, service quality becomes the indicator for determining perceived
values. In the customer satisfaction index (CSI) model, the value perceptions will be
directly influenced by perceived service quality (Chang and Wang, 2010). Therefore,
we proposed the following hypothesis:
H1: Consumer perceived quality (pqual) has a direct and positive effect on
perceived value (pval).
In accordance with Cronin et al. (2000) regarding the interrelationships leading to
satisfaction, we modelled service quality and service value as direct determinants.
Higher perceived quality positively affects satisfaction and brand loyalty for both South
Korean and Chinese consumers (Ha et al., 2009). Service quality perception is an
important determinant of customer satisfaction (Cronin et al., 2000) with regard to
determinants of satisfaction. Again, the quality of service is a key factor in achieving
online satisfaction (Martín and Camarero, 2009), so service quality is an antecedent to
satisfaction (Brady and Robertson, 2001; Lee et al., 2000; Sivadas and Prewitt, 2000).
On the basis of this evidence, Hypothesis 2 was defined as follows:
H2: Consumer perceived quality (pqual) has a direct and positive effect on
satisfaction (sat).
Cronin et al. (2000) provided evidence that quality directly influences behavioural
intentions; this is supported by Swanson and Davis (2003), who indicate the causality
relationship between service quality and behavioural intentions. Olorunniwo et al.
(2006) investigated the relationship between satisfaction, service quality and
behavioural intentions. They identify how service quality has a significant direct and

29
positive impact on behavioural intentions in some service contexts. Ha et al. (2009)
suggested managers trying to understand customer loyalty toward their brands would
benefit from researching customer perception of their brands, as well as their
evaluations of service quality, which is based on the relationship between service
quality and behavioural intentions. Therefore this led to the formulation of Hypothesis 3
as follows:
H3: Consumer perceived quality (pqual) has a direct and positive effect on
behavioural intentions (behint).
Cronin et al. (2000) indicate that both service quality and service value lead to
satisfaction, and the perceived value has a positive influence on satisfaction and
intention to repurchase (Fornell et al., 1996). The relationship between perceived value
and satisfaction is also confirmed by Bontis et al. (2007), and Kim and Han (2008) note
the perceived value was found to be a positive predictor of customer satisfaction and
trust. From these studies the following hypothesis was formulated:
H4: Consumer perceived value (pval) has a direct and positive effect on
satisfaction (sat).
Managers are interested in customer satisfaction because it is strongly associated with
loyalty (Anderson and Sullivan, 1993; Bontis et al., 2007; Cronin et al., 2000;
Sambandam and Lord, 1995). Satisfaction had a positive effect on loyalty (Bigné et al.,
2008; Tuu et al., 2011) and it has a significant, positive relationship with both WOM
and repurchase intentions (Swanson and Davis, 2003). Satisfaction is highly correlated
with behavioural responses, such as complaining behaviour, negative/positive WOM,
and repurchase intentions (Athanassopoulos et al., 2001) and customer satisfaction is
fundamental to the marketing concept, which holds that satisfying customer needs is the
key to generating customer loyalty (Chang and Wang, 2010). Companies should re-
evaluate their relative budget allocation to improve customer satisfaction (Spreng et al.,
1995) and, in turn, increase purchase intentions (Lee et al., 2000). Thus, customer
satisfaction exerts a stronger influence on purchase intentions than does service quality
(Lee et al., 2000). As a result of the above discussion, the following hypothesis was
proposed:
30
H5: Consumer satisfaction (sat) has a direct and positive effect on behavioural
intentions (behint).
Service value has a positive and significant effect on behavioural intentions (Brady and
Robertson, 2001); Cronin et al. (2000) provided evidence that quality, value and
satisfaction directly influence behavioural intentions. Perceived value has not just direct
effects on behavioural intentions; it also has a positive influence on satisfaction and
intention to repurchase (Fornell et al. (1996). This is very important, because customers’
perceptions of service quality and its value can influence customer satisfaction, and in
turn, purchase intentions (Lee et al., 2000; Iglesias and Guillén, 2004). By extending
this line of thinking, this study proposed and tested the following hypotheses:
H6: Consumer perceived value (pval) has a direct and positive effect on
behavioural intentions (behint).
H7: Consumer perceived value (pval) has an indirect effect on behavioural
intentions (behint) through satisfaction (sat) (pvalsatbehint).
Caruana et al. (2000) suggest that the effect of quality on satisfaction is not just direct
but is also mediated by value; these variables have increasingly played a key role in
services marketing generally and are believed to have a significant effect on customer
retention and, ultimately, long-term profitability. Therefore, the following hypothesis
was employed:
H8: Consumer perceived quality (pqual) has an indirect effect on satisfaction
(sat) through the mediating effect of perceived value (pval) (pqualpvalsat).
Brady and Robertson (2001) argue that since service quality is a cognitive evaluation, a
positive service quality perception can lead to satisfaction, which may, in turn, lead to
favourable behavioural intentions. Researchers have previously discussed satisfaction
and value’s mediating role in affecting brand loyalty (Bennett et al., 2005; Bitner and
Hubert, 1994; Cronin et al., 2000; Olorunniwo et al., 2006; Zeithaml et al., 1996).
Bitner and Hubert (1994, p. 82) point to this link by suggesting that improved service
quality will result in a satisfied customer, and Zeithaml et al. (1996) note that a
favourable assessment of service quality will lead to favourable behavioural intentions.
While service quality is an important driver of behavioural intentions, its indirect effect
31
through customer satisfaction is overwhelmingly greater than the direct effect in
generating favourable behavioural intentions (Olorunniwo et al., 2006). Perceived value,
acting as a mediator between service quality and behavioural intentions, appears to
make the impact of service quality on behavioural intentions even greater (Cronin et al.,
2000). Accordingly, the following hypotheses were proposed:
H9: Consumer perceived quality (pqual) has an indirect effect on behavioural
intentions (behint) through the mediating effect of satisfaction (sat)
(pqualsatbehint).
H10: Consumer perceived quality (pqual) has an indirect effect on behavioural
intentions (behint) through the mediating effect of perceived value (pval)
(pqualpvalbehint).
Time/effort and psychic costs have been proposed as determinants of perceived value
(Barker et al., 2002; Zeithaml, 1988). Regarding service value, we suggested that
service quality has a positive effect on service value whereas sacrifice has a negative
effect (Cronin et al., 2000). This is also supported by Bolton and Drew (1991) and
Agarwal and Teas (2004), who identify a negative linkage between perceptions of
sacrifice and value. Agarwal and Teas (2004) also indicate the negative linkage between
perceptions of risks and value and Snoj et al. (2004) support the idea that perceived
risks strongly, though negatively, influence perceived value based on their mobile phone
market research. Therefore, this led to the following hypotheses:
H11: Sacrifice (sac) has a direct and negative effect on perceived value (pval).
H12: Perceived risk (prisk) has a direct and negative effect on perceived value
(pval).
Although face is correlated to customer satisfaction and loyalty, it has no direct effect on
customer loyalty (Hoare and Butcher, 2007). Satisfaction is one of the most researched
variables in marketing (Bagozzi et al., 1999), but its mediating effect from a cross-
cultural perspective has not been clearly identified (Ha et al., 2009). Hoare and Butcher
(2008) suggest face is a strong predictor in affecting customer satisfaction in Chinese
service marketing research; the restaurant manager can use the face concept as a cultural
strategy to improve customer satisfaction (Gilbert and Tsao, 2000; Hoare and Butcher,
2007; Imrie et al., 2002). Thus, the following hypotheses were proposed:
32
H13: Face (face) has a direct and positive effect on consumer satisfaction (sat).
H14: Face (face) has an indirect effect on behavioural intentions (behint)
through the mediating effect of satisfaction (sat) (facesatbehint).
Higher satisfaction leads to higher reputation (Anderson and Sullivan, 1993; Bontis et
al., 2007). Bontis et al. (2007) suggest that corporate reputation among customers can
be improved by focusing on customer satisfaction. Brand reputation can also be treated
as a mediating variable between satisfaction and loyalty (Sandvik and Duhan, 1996;
Selnes, 1993); customer loyalty and the likelihood of customer recommendation also
can be enhanced by increasing reputation (Bontis et al., 2007). Satisfaction and loyalty
may be either antecedents to or consequences of reputation (Chun, 2005) so reputation
serves as a partial mediator of two links: customer satisfaction and loyalty, and
satisfaction and recommendation in the banking industry (Bontis et al., 2007).
Following from the discussion above, the following hypotheses were proposed:
H15: Consumer satisfaction (sat) has a direct and positive effect on reputation
(rep).
H16: Reputation has a direct and positive effect on behavioural intentions
(behint).
H17: Consumer satisfaction (sat) has an indirect effect on behavioural
intentions (behint) through the mediating effect of reputation (rep)
(satrepbehint).
The degree of overall pleasure or satisfaction felt by consumers in previous exchanges
(resulting from the ability of the service to fulfil the consumer’s desires, expectations
and needs in relation to the service) has been identified as an important antecedent of
trust (Ravald and Grönroos, 1996; Selnes, 1998) and consumer attitude (Oliver, 1980).
A series of positive encounters will increase consumer satisfaction and consequently
will enhance trust and the probability of repeat purchasing (Morgan and Hunt, 1994;
Selnes, 1998). All in all, overall satisfaction is an antecedent of brand trust (Ballester
and Alemán 2001). Thus, the following hypothesis was proposed:
H18: Consumer satisfaction (sat) has a direct and positive effect on trust
(trust).

33
Corporate reputation has positive direct effects on both customer trust and customer
identification (Keh and Xie, 2009). Doney and Cannon (1997) describe a seller’s
reputation as the collective memory of previous buyers regarding the seller’s integrity
and benevolence, two factors that play prominent roles in determining trust. This is also
supported by Kwon and Suh (2005), who demonstrated that partner reputation has a
significant and positive influence on the level of trust among supply chain members.
Thus, this led to the formulation of the following hypothesis:
H19: Reputation (rep) has a direct and positive effect on trust (trust).
Trust has a significant influence on loyalty (Tian et al., 2008; Casaló et al., 2007); in
addition, it creates positive attitudes about the future behaviour of the firm and
influences the consumer’s buying intentions, satisfaction and loyalty (Gefen, 2000;
Yoon, 2002). As a component of a relationship, trust is a perfect mediator for the
influence of customer satisfaction on commitment (Ok et al., 2005) and on behavioural
intentions (Jani and Han, 2011). Therefore, this led to the formulation of the following
hypotheses:
H20: Trust (trust) has a direct and positive effect on behavioural
intentions (behint).
H21: Satisfaction (sat) has an indirect effect on behavioural intentions
(behint) through the mediating effect of trust (trust) (sattrustbehint).
Figure 3.1 presents a Conceptual Model. The model was developed based on a thorough
review of the existing literature. The Conceptual Structural Model includes nine
constructs: perceived quality, perceived value, satisfaction, behavioural intentions,
sacrifice, perceived risk, face, trust and reputation. All the constructs were integrated
into the model to explain the formation of behavioural intentions clearly.
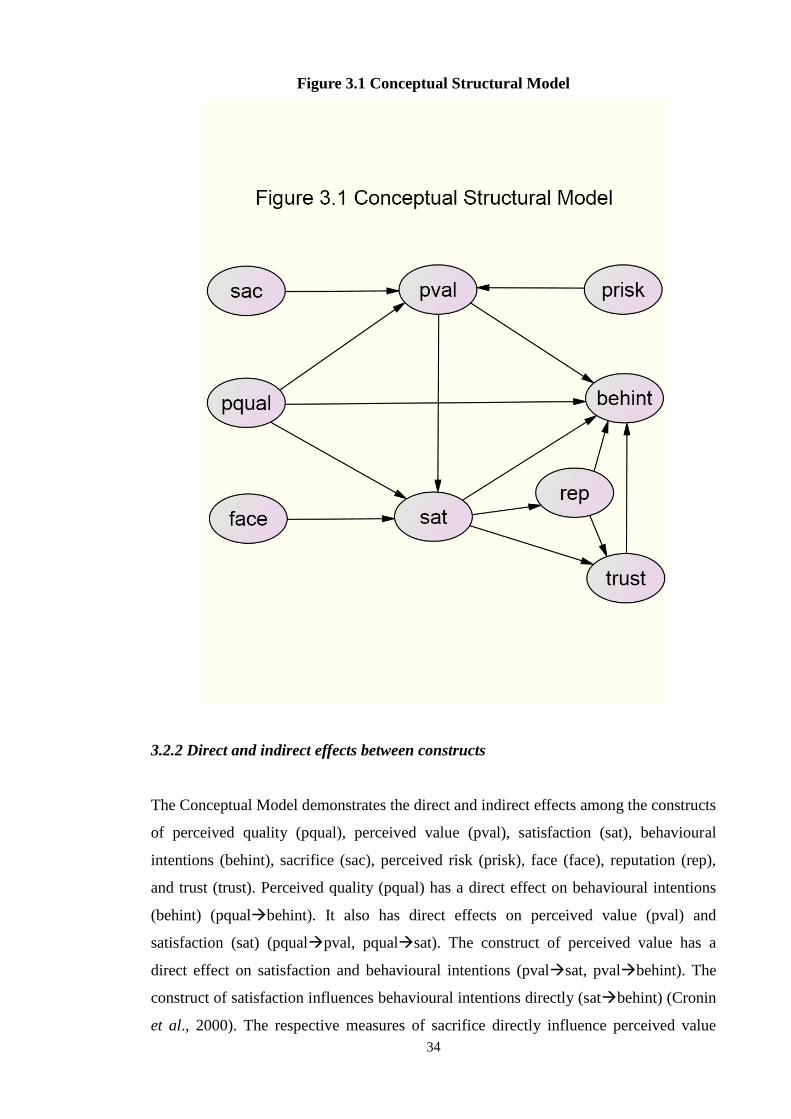
34
Figure 3.1 Conceptual Structural Model
3.2.2 Direct and indirect effects between constructs
The Conceptual Model demonstrates the direct and indirect effects among the constructs
of perceived quality (pqual), perceived value (pval), satisfaction (sat), behavioural
intentions (behint), sacrifice (sac), perceived risk (prisk), face (face), reputation (rep),
and trust (trust). Perceived quality (pqual) has a direct effect on behavioural intentions
(behint) (pqualbehint). It also has direct effects on perceived value (pval) and
satisfaction (sat) (pqualpval, pqualsat). The construct of perceived value has a
direct effect on satisfaction and behavioural intentions (pvalsat, pvalbehint). The
construct of satisfaction influences behavioural intentions directly (satbehint) (Cronin
et al., 2000). The respective measures of sacrifice directly influence perceived value

35
(sacpval) (Cronin et al., 2000), and perceived value is also directly influenced by
perceived risk (priskpval) (Agarwal and Teas, 2004; Snoj et al., 2004). The measure
of face directly influences satisfaction (facesat) (Hoare et al., 2007) and the measure
of reputation directly influences behavioural intentions (repbehint) (Ballester and
Alemán, 2001; Bontis et al., 2007). There is also a direct influence on reputation by
satisfaction (satrep) (Bontis et al., 2007) while satisfaction has a direct effect on trust
(sattrust) (Ballester and Alemán, 2001; Martín and Camarero, 2009; Tian et al., 2008).
Finally, trust is directly influenced by reputation (reptrust) (Jin et al., 2008, Tian et al.,
2008; Keh and Xie 2009) and it has a direct effect on behavioural intentions
(trustbehint) (Tian et al., 2008, Jing et al., 2008; Keh and Xie 2009).
There are also some indirect effects included in the Conceptual Model; for example,
perceived quality on behavioural intentions through the mediating effects of perceived
value and satisfaction (pqualpvalbehint, pqualsatbehint,
pqualpvalsatbehint). Perceived value has an indirect effect on behavioural
intentions through the mediation of satisfaction (pvalsatbehint). Sacrifice and
perceived risk influences behavioural intentions indirectly through the mediation of
perceived value and satisfaction (sacpvalbehint, sacpvalsatbehint,
priskpvalbehint, priskpvalsatbehint). Face influences behavioural intentions
indirectly through the mediation of satisfaction, reputation and trust (facesatbehint,
facesatrepbehint, facesattrustbehint, facesatreptrustbehint).
Reputation and trust are considered as very important not only in the mediation between
face and behavioural intentions, but also in other indirect links, such as sacrifice, which
indirectly influences behavioural intentions through perceived value, satisfaction,
reputation and trust (sacpvalsatrepbehint, sacpvalsattrustbehint,
sacpvalsatreptrustbehint); perceived risk indirectly influences behavioural
intentions through perceived value, satisfaction, reputation and trust
(priskpvalsatrepbehint, priskpvalsattrustbehint,
priskpvalsatreptrustbehint); and perceived quality indirectly influences
behavioural intentions through perceived value, satisfaction reputation and trust
(pqualpvalsatrepbehint, pqualpvalsattrustbehint,
pqualpvalsatreptrustbehint, pqualsatrepbehint,
pqualsattrustbehint, pqualsatreptrustbehint). Finally, perceived quality,
sacrifice and perceived risk have indirect effects on satisfaction through the mediation
of perceived value (pqualpvalsat, sacpvalsat, priskpvalsat).

36
3.3 Questionnaire Design and Structure
The aim of this section is to justify briefly the choice of a questionnaire, the structure
and content of the questionnaire that was designed for the study, the measures adopted
for each construct in the context of the literature, the consideration of cross-cultural
issues and, finally, the pre-testing procedure and subsequent modifications.
3.3.1 Reason for using positivism research
Most of the central debates among philosophers concern matters of ontology and
epistemology. Ontology is about the nature of reality and experience; epistemology is
about the best ways of enquiring into the nature of the world (Smith et al., 2012, p. 17).
This has formed the basis for a sustained debate among social scientists which has
focused on the respective merits of two contrasting views of how social science research
should be conducted: positivism and social constructionism (Smith et al., 2012, p.22).
In its broadest sense, positivism is a rejection of metaphysics. It is a position that holds
that the goal of knowledge is simply to describe the phenomena that we experience
(Web center for social research method, 2006). There has been a gradual shift from
positivism towards constructionism since the early 1980s, but there are many
researchers, both in management and social science research, who deliberately combine
methods from both traditions. Positivism, which provides the best way of investigating
human and social behaviour, originated as a reaction to metaphysical speculation (Aiken,
1956, cited in Smith et al., 2012 p.22). Since we cannot directly observe emotions,
thoughts and so on (although we may be able to measure some of the physical and
physiological accompaniments), these are not legitimate topics for a scientific
psychology (Web center for social research method, 2006). The implications of
positivism include the following: the observer must be independent, and the human
interests should be irrelevant. Explanation of the research result must demonstrate
causality and the research should progress through hypotheses and deductions. The
concepts need to be defined so that they can be measured. The research generalisation
through the statistical probability and the large numbers selected will be random (Smith
et al., 2012).
In accordance with the positivism method, the sample of this study was restaurant
37
customers and their observations were made independently. The research progressed
through hypotheses which were based on the Conceptual Model and the concepts were
defined to form the Conceptual Model. This study was generalised through several
statistical approaches including descriptive analysis, factor analysis, confirmatory factor
analysis and structural equation modelling. Finally, the aim was to make the sample as
representative as possible, as a large sample size was essential to this study. Thus, a
positivist approach was taken for this study.
3.3.2 Questionnaire
A questionnaire is a research instrument consisting of a series of questions and other
prompts for the purpose of gathering information from respondents. Although
questionnaires are often designed for the statistical analysis of the responses, this is not
always the case (Hair, et al., 2003, p. 225). A questionnaire is also identified as a
formalised framework consisting of a set of questions and scales designed to generate
primary raw data. Questionnaire construction involves taking established sets of scale
measurements and formatting them into a complete instrument for communicating with
and collecting raw data from respondents (Hair et al., 2003, p. 244).
Questionnaires have advantages over some other types of surveys in that they are more
cost effective, do not require as much effort from the questioner as do verbal or
telephone surveys, and often have standardised answers that make it simple to interpret
data (Hair. et al., 2003, p. 256). The main function of a questionnaire is to capture
people’s true thoughts and feelings about different issues or objectives. However, such
standardised answers may frustrate users. Questionnaires are also severely limited by
the fact that respondents must be able to read the questions and respond to them. Thus,
for some demographic groups, conducting a survey by questionnaire may not be
practical. As a type of survey, questionnaires also have many of the same problems
relating to question construction and wording that exist in other types of opinion poll.
The questionnaire in this study was organised in three thematic sections (Appendix1).
The first section was concerned with customer behaviour with respect to restaurant
visits to restaurants of a similar quality and to the target restaurant. It employed nominal
measures of frequency of visiting in a six-month period, the method of travel, the social
context of the visit and expenditure on the meal. The second section was concerned with
consumer attitudes to their experience in the target restaurant. It consisted of nine

38
constructs concerned with perceived quality, perceived value, satisfaction, behavioural
intention, sacrifice, perceived risk, face, reputation and trust (Appendix 1).
The construct of perceived quality was designed as 16 items which measured the service
quality including staffs’ attitudes, staffs’ service skills, freshness and taste of food and
the restaurant environment. The measures were mostly adopted from Hoare and Butcher
(2008), with single items concerned with music, aroma and interior design adopted from
Harris and Ezeh (2008). All measures were designed as five-point scales (1=Very low,
5=Very high) (Appendix 1).
Perceived value was designed as five items, which included overall value of the
restaurant, the value of the food, service, and atmosphere compared with other
restaurants, and the value compared with the effort invested by the customer to visit the
restaurant. All measures were adopted from Cronin et al. (2000). All measures were
designed as five-point scales (1=Very low, 5=Very high) (Appendix 1).
Satisfaction was designed as seven items, which included overall satisfaction,
satisfaction with the food, service and atmosphere, satisfaction from the enjoyment and
pleasure, and finally, satisfaction with the customer’s choice of the particular restaurant
in question. The measures were based upon those employed by Cronin et al. (2000) and
Hoare and Butcher (2008). All measures were designed as five-point scales (1=Very low,
5=Very high) (Appendix 1).
Sacrifice was designed as six items, which included the effort made to get to the
restaurant, the effort made to get the quality of service, the time taken to be seated at the
table and to get the meal, the price paid and the overall experience. All measures for the
construct were adapted from Harris and Ezeh (2008). All measures were designed as
five-point scales (1=Very low, 5=Very high) (Appendix 1).
Trust was designed as five items, which included quality of the meal, dealing with
consumer’s problems, recommending of new dishes, respect to consumers and service
attitude, and were adapted from Ballester and Alemán (2001). The construct of face was
designed as four items adapted from Hoare and Butcher (2008) and included the extent
of agreement with statements about saving face in all circumstances, that is, saving face
of the diners’ host, staff treating diners with respect and staff treating customers with

39
sensitivity. All measures were designed as five-point scales (1=Very low, 5=Very high)
(Appendix 1).
Reputation was designed as three items, which included the relevance of reputation as a
reason for visiting the restaurant, as a basis of comparison with alternative restaurants,
and as a basis to decide to visit any restaurant. The measures were adopted and designed
based on the concept of reputation through discussion with experienced colleagues. All
measures were designed as five-point scales (1=Very low, 5=Very high) (Appendix 1).
Perceived risk was designed as five items, which included consumer’s concern about
waste of money, disappointment about the choice of restaurant, freshness of the food,
quality of the service and loss of face among the dining companions. The measures of
perceived risk were not adapted from any particular study but were based upon the
conceptual components of perceived risk as defined in the literature by Sweeney et al.
(1999). The measures addressed the components of physical and intangible,
psychological, financial and social risk. All measures were designed as five-point scales
(1=Very low, 5=Very high) (Appendix 1).
Behavioural intention was designed as six items, which included the likelihood of
consideration of the restaurant as first choice, visiting frequently, recommendation of
the restaurant to others, and choosing the restaurant even if others of similar quality are
cheaper (Hoare and Butcher, 2008). All measures were designed as five-point scales
(1=Very low, 5=Very high) (Appendix 1).
Finally, the third section was concerned with the socio-demographic characteristics of
the respondents. This section included nominal measures of gender, age, educational
level, occupation and personal income.
3.3.3 Cross-Cultural issues
Though this research was based in PR China, the questionnaire was developed in the
UK, so cultural issues also were considered as an important element when designing the
questionnaire.
It is noted that empirical research presents researchers with a set of dilemmas and that

40
the researcher’s mission is to avoid as many of these as possible (McGrath, 1981).
Singh (1995) notes that international cross-cultural research presents additional
elements that may provoke problems of interpretation and inference. The research
instrument was a questionnaire that required translation into equivalent versions that
were consistent with the relevant cultures. Equivalence concerns language and the
treatment of the various constructs and measures. With respect to constructs, the ideal is
to achieve equivalence in terms of function, conception and interpretation (Singh, 1995).
Great care was taken to translate the constructs and measures into forms that were
equivalent, but it should be noted that while effective translation is necessary it is not
sufficient to guarantee equivalence (Peng, et al., 1991). In international research, the
translation of questionnaires into the relevant local languages is crucial. The problem is
that direct translation is unlikely to convey the intended meaning, because many
concepts and terms involve culture-specific connotations, so systematic bias would be
introduced. A meaningful translation requires the researcher not only to ensure overall
conceptual equivalence but also to deal with vocabulary, idiomatic, and syntactical
equivalence (Sekaran, 1983). Brislin (1980) suggests the use of simple sentence
structures, and clear and familiar wording.
The most frequently employed method of translation is back translation. The original
questionnaire is translated into the local language by one person and is then translated
back into the original language by a second person. The second version of the original
can be checked for retention of meaning, literal accuracy and mistakes. Despite this
rigour, there is no guarantee of overall conceptual equivalence (Peng et al., 1991).
Harpaz (2003) identifies two additional procedures: the bilingual method and the
committee procedure. In the bilingual method, the original and translated versions of the
questionnaire are sent to bilingual people and items are corrected based upon
inconsistencies in their responses. The committee method uses panels of bilingual
speakers to translate the questionnaire and discuss possible problems or mistakes.
Whichever method is used, pilot-testing is essential in international research.
3.3.4 Reason for targeting full-service restaurants
This field survey was conducted at four full-service restaurants. Full-service restaurants,
which include a broad range of restaurants (e.g., family, casual, and upscale), provide
waited table service for their patrons (Spears and Gregoire, 2006, cited in Jani and Han,

41
2011). According to Spears and Gregoire (2006) (cited in Jani and Han, 2011), full-
service restaurants are set apart by the fact that wait-staff take orders from and deliver
food to customers, payment is made after the meal is consumed, and customers
normally give tips to the wait-staff for their service. Individuals at these restaurants can
experience not only food but also a relatively high level of service and customer-
employee interaction (Han et al., 2009; Yuksel and Yuksel, 2002). Briefly, that means
customers at full-service restaurants can evaluate both the functional outcomes of the
service (e.g., the food itself) and detailed aspects of the service experience (Han et al.,
2009; Ladhari et al., 2007).
3.3.5 Pre-testing questionnaire
The initial version of the questionnaire was developed from the previous literature
(Ballester and Alemán, 2001; Cronin et al., 2000; Hoare and Butcher, 2008, Harris and
Ezeh, 2008; Imrie et al., 2002) and refined through consultation with academics
experienced in questionnaire design and scale development. The questionnaire was
designed in the UK and a paper copy of the questionnaire was pre-tested using a sample
of adults 18-65 yrs of age who had eaten in a restaurant at least once in the previous
three months.
Scale response categories were altered as respondents felt more comfortable with five-
point responses than with the original seven-point responses. The final version of the
questionnaire was evaluated in terms of instructions, ease of use, reading level, clarity,
item wording and response formats, and was judged to possess face and context validity
(Hair, 2006, p. 147).
3.4 Survey Method
Survey research methods tend to be the mainstay of marketing research in general and
are normally associated with descriptive and causal research situations (Hair et al.,
2003). Survey techniques are based upon the use of structured questionnaires given to a
sample of a population (Mazzocchi, 2008). Hair et al. (2003) identify the survey method
as having several advantages, such as the ability to accommodate large sample sizes and
distinguish small differences, the increased generalisability of results, the convenience
of managing and recording questions and answers, the capability of using statistical
42
analysis and the ability to tap into factors and relationships not directly measurable. The
disadvantages of the survey method also obviously exist, such as the difficulties of
questionnaire designs, the limits to the in-depth detail of data structures, the lack of
control over timeliness, possible low response rates, difficulties in determining whether
respondents are responding truthfully, misinterpretation of data results and inappropriate
use of data analysis procedures (Hair et al., 2003).
Hair et al. (2003) identify four main types of survey method: person-administered
survey, telephone interviews, self-administered surveys and online surveys.
The person-administered survey is distinguished by the presence of a trained
interviewer who asks questions and records the subject’s answers. A person-
administered survey includes in-home interviews, executive interviews, mall-intercept
interviews and purchase-intercept interviews.
Telephone interviews have become a major source of marketing information; this is
because, compared to face-to-face interviews, telephone interviews are less costly, faster
and offer much easier access to large numbers of respondents. There are two ways of
conducting telephone interviews: traditional telephone interviews, which involve
phoning a sample of respondents and asking them a series of questions, and computer-
assisted telephone interviews, which use a computerised questionnaire administered to
respondents over the telephone.
A self-administered survey is a data collection technique in which the respondent reads
the survey questions and records his or her own responses without the presence of a
trained interviewer (Hair et al., 2003). The advantages of the self-administered survey
include low cost and less interviewer bias. There are two main forms of self-
administered surveys: mail surveys and drop-off surveys.
Online survey methods have been totally revolutionised as people have increasingly
accepted the “new economy”, internet technology, and telecommunications, and
decision makers’ and researchers’ new demands for faster data acquisition, retrieval, and
the reporting of results in real time (Hair et al., 2003). There are three ways of
conducting an online survey, namely, fax surveys, e-mail surveys and internet surveys.

43
The survey instrument in this research was a self-administered survey with the author
dropping-off the surveys to the target restaurants. The advantage of using this method in
this research was that the author could get easy access to the waiters and waitresses and
was able to ask them give the surveys to the consumers to fill in after they had finished
their meals. In addition, the restaurants could be geographically dispersed, and the
survey could be conducted economically and efficiently by customers who had just
experienced visiting the restaurant. As a reward, every consumer who responded to the
survey received a 10-Yuan mobile top-up card.
3.5 Sampling Method
The sampling method is widely used in primary research nowadays, either in academia
or for marketing purposes. Sampling involves selecting a relatively small number of
elements from a larger defined group of elements in the anticipation that the information
gathered from the small group will allow judgments to be made about the larger group
(Hair et al., 2003). Thus, it is often used when conducting a census would be impossible
or impractical. When using a census, the research is interested in collecting primary data
about or from every member of a defined target population. It is easy to see that
sampling is less time-consuming and costly than conducting a census (Hair et al., 2003).
Hair et al. (2003) indicated that sampling plays an important role in the process of
identifying, developing, and understanding new marking constructs as well as playing
an important indirect role in the process of designing questionnaires.
Hair et al. (2003) state that the concept of sampling involves two basic issues; these are
making the right decision in the selection of items such as people, products or services
and so on, and feeling confident that the data generated by the sample can be
transformed into accurate information about the overall target population. Though there
are always different reasons for using the sampling method to approach the information
for the research, the main objective is to allow researchers to make inductive and
predictive judgments or decisions about the total target population on the basis of
limited information or in the absence of perfect knowledge (Hair et al., 2003).
There are two main types of sampling method: probability sampling and non-probability
sampling. In probability sampling, each sampling unit in the defined target population
has a known, nonzero probability of being selected for the sample (Hair et al., 2003, p.

44
350). The actual probability of selection for each sampling unit may or may not be equal
depending on the type of probability sampling design used (Hair et al., 2003, p. 350).
Probability sampling allows the researcher to judge the reliability and validity of the
raw data collected by calculating the probability that the findings based on the sample
would differ from the defined target population (Hair et al., 2003, p. 350). The results
obtained by using probability sampling designs can be generalised to the target
population within a specified margin of error through the use of statistical methods
(Hair et al., 2003, p. 350). There are four different types of probability sampling
methods, namely, simple random sampling (SRS), systematic random sampling
(SYMRS), stratified random sampling (STRS) and cluster sampling.
In non-probability sampling, the probability of the selection of each sampling unit is not
known and the selection of the sampling unit is based on some type of intuitive
judgment, desire, or knowledge of the researcher (Hair et al., 2003, p. 350). The degree
to which the sample may or may not be representative of the defined target population
depends on the sampling approach and how well the researcher executes and controls
the selection activities (Sudman 1976, cited in Hair et al., 2003, p. 360). The most
common reason to use non-probability sampling is because the non-probability samples
are easy and inexpensive to gather (Shao, 2002, p. 369). There are four different types
of non-probability sampling methods: convenience sampling, judgment sampling, quota
sampling and snowball sampling.
Sudman (1983) suggests that, before choosing the population samples, there are at least
two basic steps to be taken to define the population under study. The first step is to
decide whether the population is of individuals, households, institutions, transactions or
some other category. In this study, individuals were chosen, as restaurant visiting
decisions are made mainly by individual persons. The second step is to decide the units
to use. To do this, he suggests the following criteria for consideration: geography, age of
individuals, other demographic variables and individual variables.
Non-probability and convenience sampling were used in this study because there was
no list of restaurant users and it would not have been possible to calculate the
probability of selecting a single individual. In order to ensure that the sample
characteristics were representative of the population of the target restaurants’ customers
overall, attention was paid to the combined age of the people and their sex; all the

45
customers who had filled in the questionnaires were over 18 years old. The minimum
age for attitude research is usually eighteen. Since this study basically deals with
psychological measurements, it was logical to follow Sudman’s (1983) suggestion –
only respondents over 18 year-old were taken into consideration. The collection of
questionnaires was conducted in October 2009 and lasted six weeks in total. More than
700 customers were invited to fill in the survey and it yielded a total of 489 useable
responses.
3.6 Analytical Strategy
This section discusses the use of statistical techniques in this study. Descriptive statistics
is explained in the first section, and this is followed by the statistical analysis section.
There are three sub sections to be included in the statistical analysis section; these are
factor analysis, confirmatory factor analysis (CFA) and structural equation modelling
(SEM).
This present study used the Statistical Package for Social Sciences (SPSS) for
descriptive analysis. To test the proposed relationships among the study variables,
structural equation modelling (SEM) was conducted using the AMOS 19 program. As
suggested by Anderson and Gerbing (1988), construct validity was assessed by running
a confirmatory factor analysis (CFA) before testing the hypothesized paths using the
SEM.
3.6.1 Descriptive statistics
Descriptive statistics can be categorised into three groups. The first group deals with the
central tendency of the variable, and this may be represented by the mean, median, or
mode (Mazzocchi, 2008, p. 78). The mean is considered an average calculated as the
sum of the values in a data set divided by the number of values in the set. The major
characteristic of the mean is the computation of the mean based on all values of a set of
data. The median is the value of the middle item when the numbers are arranged in
order of magnitude. The major characteristics of the median are that, as it is a positional
average, it is not defined algebraically as is the mean, in some cases, it cannot be
computed exactly, as can the mean, and it is centrally located. The mode is the value
that occurs most frequently in the data set. The major characteristics of the mode are
46
that it is the highest frequency in a set of values, it is not affected by extreme values, the
mode of a set of discrete data is easy to compute, and the value of the mode may be
significantly affected by the method of designating the class intervals (Shao, 2002, p.
421). The second group represents dispersion; this can be estimated by using the range,
variation (for standard deviation), and the coefficient of variation (Mazzocchi, 2008, p.
79). The range is the difference between the lowest and highest values in a given data
set. The standard deviation and variation serve as measures of variability among the
sample data. The most commonly used measure of dispersion expressed in a relative
value is the coefficient of variance. This measure can be used only when the variable is
measured on a ratio scale (Shao, 2002, p. 422-423).
3.6.2 Statistical analysis
The statistical analysis method introduced in this section includes factor analysis,
confirmatory factor analysis and structural equation modelling.
3.6.2.1 Factor analysis
Factor analysis is an interdependence technique, whose primary purpose is to define the
underlying structure among the variables in the analysis (Hair et al., 2006, p. 104;
Mazzocchi, 2008, p. 223). It is a multivariate statistical technique that is used to
summarise the information contained in a large number of variables as a smaller number
of subsets or factors (Hair et al., 2003, p. 601; Mazzocchi, 2008, p. 223). It is also
treated as a foundation of structural equation modelling along with the multiple
regression analysis in statistical analysis (Hair et al., 2006, p. 711). Factor analysis is
also a multivariate technique that identifies the dimensions of the original observed
measures of a scale in terms of a hierarchical structure of non-observed latent variables
or factors. The items in the original scale should be metric and correlated. The factors
are arranged in descending order of importance in terms of their contributions to the
explanation of the total variance of the scale. The broad aims of the analysis are to
identify the number of factors and interpret what they represent.
The theoretical framework is the factor model that explains the observation on the
original variable, its variance and the covariance between pairs of variables. According
to the model, the original variables are determined by a linear combination of common

47
factors and the influence of a unique factor. The model is based upon a series of
assumptions. The original variables and the common factors are standardised to have
zero mean and unit variance. The covariance between common factors and unique
factors and between pairs of common factors and unique factors is zero.
The analysis employs principal components analysis and extracts factors with
eigenvalues greater than unity with Varimax rotation. Confirmation that the data are
correlated is evaluated using Bartlett’s test for sphericity, adopting a significance level
of five per cent. Goodness of fit is reported and evaluated using communalities, and
total variance is explained.
In this study, factor analysis is used to confirm the dimensionality of constructs and to
establish the discriminant validity between sets of constructs.
3.6.2.2 Confirmatory factor analysis
Hair et al. (2006) note the purpose of the factor analysis can be achieved from either an
exploratory or confirmatory perspective. Exploratory factor analysis is useful in
searching for structure among a set of variables or as a data reduction method. Hair et al.
(2006) use a six-stage decision process when discussing the application of SEM: “1.
Defining individual constructs, 2. Developing the overall measurement model, 3.
Designing a study to produce empirical results, 4. Assessing the measurement model
validity, 5. Specifying the structural model, and 6. Assessing structural model validity”
(Hair et al., 2006, p. 734). Confirmatory factor analysis (CFA) is commonly used to
cover the first four stages in the Hair et al. (2006) six-stage model.
CFA is a way of testing how well measured variables represent a smaller number of
constructs (Hair et al., 2006, p. 773). The researchers must specify both the number of
factors that exist within a set of variables and which factor each variable will load
highly on before results can be computed (Hair et al., 2006, p.774). Hair et al. (2006)
noted the CFA statistic can show how well the specification of the factors matches
reality (the actual data); it is a tool that enables researchers to either confirm or reject a
preconceived theory. A measurement theory is used to specify how sets of measured
items represent a set of constructs. CFA also estimates those relationships which link
constructs to variables and constructs to each other (Hair et al., 2006, p.779). When
48
used to illustrate the concepts such as factor loadings, covariance, and correlation, CFA
is always compared and contrasted with EFA. CFA tests measurement theory based on
the covariance between all measured items. Hair et al. (2006) note the CFA model
provides the foundation for all further theory testing.
3.6.2.3 Structural equation modelling (SEM)
Structural equation modelling (SEM) is a powerful, yet complex, analytical technique
(Shook et al., 2004). It is a method for measuring relationships among unobserved
variables and has been in use since early in the 20th century (Shah and Goldstein 2006).
It is a family of statistical models that seek to explain the relationships among multiple
variables, and it examines the structure of interrelationships expressed in a series of
equations, similar to a series of multiple regression equations (Hair et al., 2006, p. 711).
It is a unique combination of both interdependence and dependence techniques (Hair et
al., 2006, p. 711). It is particularly useful when one dependent variable becomes an
independent variable in a subsequent dependence relationship and it gives rise to the
interdependent nature of the structural model (Hair et al., 2006, p.711, p.718). There are
three characteristics of SEM which make it a unique statistical technique in multivariate
data analysis.
estimation of multiple interrelated dependence relationships
incorporating latent variables not measured directly
defining a model.
Today, SEM has become a well-known technique. Several textbooks (e.g., Hair et al.,
2006) have been published and different software packages (like AMOS, LISREL, EQS)
for computers have been developed (Henriksen and Pedersen, 2007). This has made
SEM an easily accessible analytical method. AMOS was adopted in this study because
the author had easier access to this program through Newcastle University.
The aim of this study was to develop a structural model of customers’ behavioural
intentions and explain the interrelationships between constructs in the Chinese
restaurant sector. A further aim was to develop scales for each of the constructs in the
structural model and evaluate them in terms of reliability and validity to estimate
measurement models for each of the constructs in the model and evaluate them in terms
49
of measures of fit and interpretation. So the SEM approach was chosen as the main
statistical technique used in this study.
Hair et al. (2006) indicate that SEM estimates a series of separate, but interdependent
variables. Normally, researchers will base the proposed relationship of a model upon the
theory and prior experience and then translate these variables into a series of structural
equations for each dependent variable; what makes SEM unique is that it allows only a
single relationship between dependent and independent variables.
SEM has the ability to incorporate latent variables into the analysis and it provides the
measurement model which specifies the rules of correspondence between measured and
latent variables. It also can improve statistical estimation, represent the theoretical
framework and identify the measurement error.
A complete SEM model consists of measurement and structural models. A model should
always be developed based on some underlying theory. A structural model involves
specifying structural relationships between latent constructs which can be related to
measured variables with a dependence relationship. Two types of relationships are
possible among constructs. The first is a dependence relationship, which is always
depicted by a straight arrow and used between an exogenous construct and an
endogenous construct. The second is a correlation relationship, which is depicted by a
two-headed arrow connection, which can be shared only between exogenous constructs.
A structural model’s goodness of fit is evaluated using RMSEA, the Tucker-Lewis
Index (TLI) and the Comparative Fit index (CHI) . The ideal value of RMSEA is 0 and
an acceptable value is less than 0.08. The ideal value for TLI and CFI is 1, while close
to 1 indicates a good fit. Construct reliability is evaluated using composite reliability
and average variance is extracted. Estimated coefficients are evaluated for statistical
significance and the correct sign. A squared multiple correlation coefficient (SMCC) is
used to identify the proportion of variance of a construct explained by antecedent
constructs or measures. The researcher has to approximate the value to the nearest
whole percentage.
3.7 Implementation of Data Collection
50
The primary research instrument in this study was a questionnaire (Appendix 1.1)
administered in Wuhan, the fourth biggest city in China. The reason for choosing
Wuhan as the target city for this survey is its location and because it has always been
classed as a middle-class city in China. As the capital of Hubei Province, Wuhan is a
modern metropolis with unlimited possibilities, a city situated in the heart of China
(http://www.wuhan.com/cmarter.asp?doc=310, no date). Wuhan is an energetic city, a
commercial centre of finance, industry, trade and science, with many international
companies located there. It is a transportation hub for air, railway and ferry traffic. The
distance from Beijing, Shanghai and Guangzhou is more or less equal. Because of its
central location in China, the residents are well linked to both the northern part and
southern part of China. Unlike in Beijing or Shanghai, where people have a much
higher income so most restaurants are very expensive, the restaurants in Wuhan are
always popular because the food is good and their prices are very reasonable so they
attract a largely middle-class Chinese clientele
(http://english.51766.com/detail/area_info_detail.jsp?prov_id=1004201&info_type=1,
no date). The author originally comes from Wuhan so has several contacts with local
restaurants; this helped make conducting the survey slightly easier. Initially, 20
randomly chosen middle-class full-service restaurants in Wuhan were contacted, with
the researcher eventually receiving permission to collect data from four full-service
restaurant operators.
The questionnaire was designed in English and translated into Chinese by the author,
and finally checked by a professional Chinese interpreter. Preliminary field work had
established the cooperation of restaurant owners. The survey instrument in this research
was self-administered and questionnaires were distributed to selected target full-service
restaurants.
Non-probability and a convenience sample were used in this study. Only restaurant
patrons who agreed to participate in the survey were given the questionnaire, which was
presented to customers after they had finished their meals. Survey participants were
requested to evaluate measurement items based on their dining experience and to place
the completed questionnaires on the table when they left. The survey was conducted in
October 2009 over six weeks, with more than 700 customers being invited to participate;
it yielded a total of 489 useable responses.

51
3.8 Reliability Analysis
Measures of reliability and validity should be assessed when using SEM (Shook et al.,
2004). Reliability is an indicator of the degree to which a set of indicators of a latent
construct is internally consistent based on how highly interrelated the indicators are;
that is, it represents the extent to which they all measure the same thing (Hair et al.,
2006, p.712). Reliability is assessed by determining the proportion of systematic
variation in a scale, which is done by determining the association between scores
obtained from different administrations of the scale (Mazzocchi, 2008, p.318). Scale
reliability refers to the extent to which a scale can reproduce the same measurement
results in repeated trials while random error produces inconsistency in scale
measurements, which leads to lower scale reliability (Hair et al., 2003, p.396). Hair et al.
(2003) identify two basic techniques that can help a researcher assess the reliability of
scales, namely, test-retest and equivalent form.
Test-retest involves repeating the administration of the scale measurement to either the
same sample of respondents at two different times or two different samples of
respondents from the same defined target population under as nearly the same
conditions as possible. The degree of similarity between the two measurements is
determined by computing a correlation coefficient; the higher the correlation, the greater
the reliability (Hair et al., 2003, p. 396; Mazzocchi, 2008, p.320).
Equivalent form (Hair et al., 2003), also known as alternative-forms reliability
(Mazzocchi, 2008), means the researchers can create two similar yet different scale
measurements for the given construct and administer both forms to either the same
sample of respondents or two samples of respondents from the same defined target
population. It can be assessed by measuring the correlations of the item-mean value
scores on the two scale measurements; the higher the correlation, the greater the scale
measurement reliability.
When investigating multidimensional constructs, summated scale measurements tend to
be the most appropriate scales. In this type of scale, each dimension represents some
aspect of the construct. Thus, the construct is measured by the entire scale, not just one
component (Hair et al., 2003, p. 397). Internal consistency means each item measures
some aspect of the construct measured by the entire scale, and the items should be
52
consistent in what they indicate about the construct; it also can be explained as the set of
attribute items that make up the scale being internally consistent. There are two
techniques used to assess internal consistency; these are split-half reliability and
Cronbach’s alpha, also known as the coefficient alpha. Split-half reliability is a simple
measure of internal consistency, which means the items on the scale are divided into
two halves and the resulting half scores are correlated: the higher the correlation
between the two halves, the higher the internal consistency. Cronbach’s alpha
(coefficient alpha) is the average of all possible split-half coefficients resulting from
different ways of splitting the scale items (Hair et al., 2003, p. 397). An important
property of the coefficient alpha is that its value tends to increase with an increase in the
number of scale items; therefore, the coefficient alpha may be artificially, and
inappropriately, inflated by the inclusion of several redundant scale items (Mazzocchi,
2008, p. 321).
In this study, scale reliability was evaluated using Cronbach’s alpha (coefficient alpha)
coefficient on SPSS, giving a measure of how well a set of manifest indicators measure
the scale (De Vellis, 2003 p.47 cited in Hair et al., 2006, p.128). The coefficient value
can range from 0 to 1, and, in most cases, a value of less than .6 would typically
indicate marginal to low (unsatisfactory) internal consistency (Hair et al., 2003, p.397).
Nunally (1978 cited in Hair et al., 2006, p.137) recommends an alpha value of .7 while
Robin, Shaver, and Wrightman (1991 cited in Hair et al., 2006, p. 137) suggest that a
value of .6 is acceptable for exploratory research. However, De Vellis (2003, p.95, cited
in Hair et al., 2006, p.138) notes that it is not unusual to find scales with lower
reliability coefficients.
Reliability analysis was conducted using Cronbach’s alpha coefficient for internal
consistency. The results are summarised in Table 3.1. The coefficient for perceived
quality is .907. This offers an improvement over the value of .88 for fast food
restaurants in Cronin et al. (2000) and the value of .83 in the study of Chinese diners by
Hoare and Butcher (2008). The result for sacrifice is .768. This reveals an improvement
over the values of .69 in the study by Cronin et al. (2000) and the value of .65 in a study
of UK restaurants by Harris and Ezeh (2008). In the case of perceived risk, the
coefficient is .883. This is equivalent to the value of .88 reported in the study by Cronin
et al. (2000). The result for satisfaction is .850. This matches the value in the study by
Cronin et al. (2000) and is higher than the value of .76 in the comparable study by
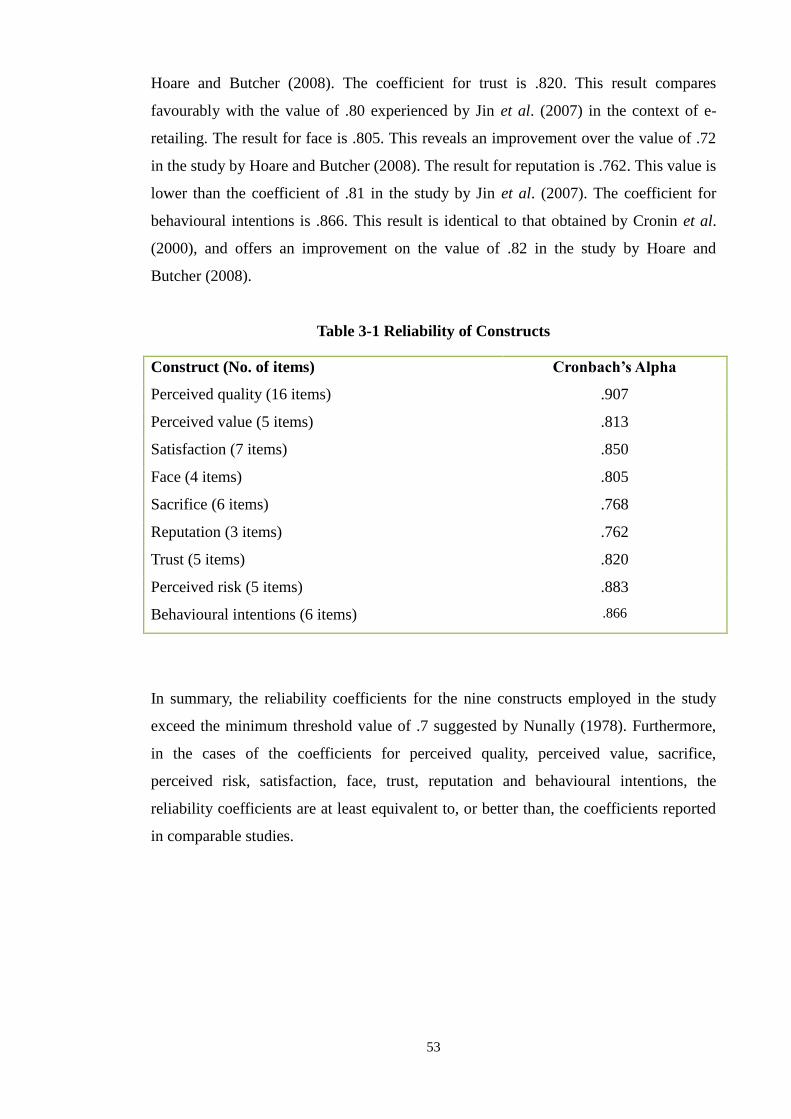
53
Hoare and Butcher (2008). The coefficient for trust is .820. This result compares
favourably with the value of .80 experienced by Jin et al. (2007) in the context of e-
retailing. The result for face is .805. This reveals an improvement over the value of .72
in the study by Hoare and Butcher (2008). The result for reputation is .762. This value is
lower than the coefficient of .81 in the study by Jin et al. (2007). The coefficient for
behavioural intentions is .866. This result is identical to that obtained by Cronin et al.
(2000), and offers an improvement on the value of .82 in the study by Hoare and
Butcher (2008).
Table 3-1 Reliability of Constructs
Construct (No. of items) Cronbach’s Alpha
Perceived quality (16 items) .907
Perceived value (5 items) .813
Satisfaction (7 items) .850
Face (4 items) .805
Sacrifice (6 items) .768
Reputation (3 items) .762
Trust (5 items) .820
Perceived risk (5 items) .883
Behavioural intentions (6 items) .866
In summary, the reliability coefficients for the nine constructs employed in the study
exceed the minimum threshold value of .7 suggested by Nunally (1978). Furthermore,
in the cases of the coefficients for perceived quality, perceived value, sacrifice,
perceived risk, satisfaction, face, trust, reputation and behavioural intentions, the
reliability coefficients are at least equivalent to, or better than, the coefficients reported
in comparable studies.
54
Chapter 4 Results
4.1 Introduction
The aim of this chapter is to present the empirical results. The results are presented in
association with five main analytical themes concerned with sample characteristics,
restaurant behaviour, mean scores for scales, reliability analysis, and SEM analysis.
4.2 Sample (socio-demographics) Characteristics
Sample characteristics were analysed using frequency distributions (Table 4.1). Analysis
shows gender groups are fairly evenly represented with 50.5% females. The modal age
group is 26-35 years (31.9%) with 60.5% in the range 26-45 years. With respect to level
of education, 37.8% of respondents had attended senior high school, 23.8% had
attended college and 30.0% had achieved an undergraduate or postgraduate degree. In
terms of employment status, the majority of respondents (77.5%) were employed. In
terms of employment types, 39.0% were in professional or managerial occupations and
48.6% in supervisory or skilled posts. With respect to monthly income, the most
frequent group is between 1001 and 5000 Yuan per month (54.5%) while the smallest
group is “more than 10,000 Yuan” per month (1.1%), which indicates that the targeted
restaurants are middle-class restaurants.
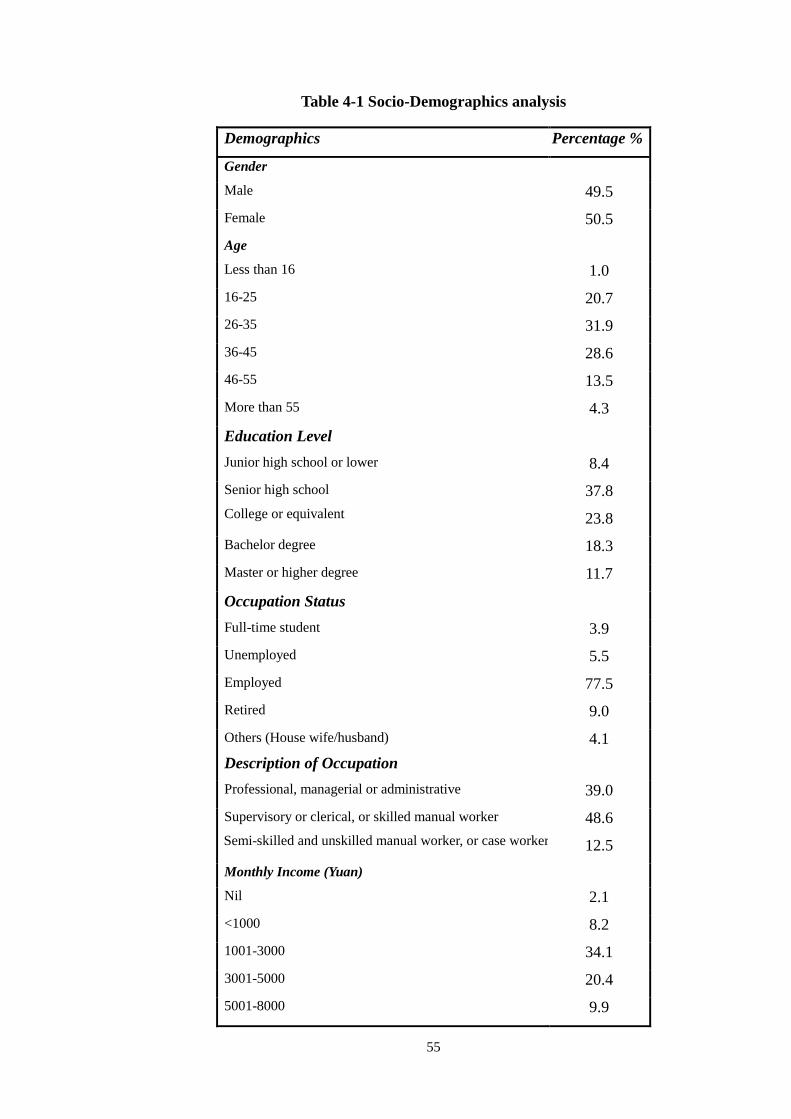
55
Table 4-1 Socio-Demographics analysis
Demographics Perce Percentage %
Gender
Male 49.5
Female 50.5
Age
Less than 16 1.0
16-25 20.7
26-35 31.9
36-45 28.6
46-55 13.5
More than 55 4.3
Education Level
Junior high school or lower 8.4
Senior high school
College or equivalent
37.8
23.8
Bachelor degree 18.3
Master or higher degree 11.7
Occupation Status
Full-time student 3.9
Unemployed 5.5
Employed 77.5
Retired 9.0
Others (House wife/husband)
Description of Occupation
4.1
Professional, managerial or administrative 39.0
Supervisory or clerical, or skilled manual worker
Semi-skilled and unskilled manual worker, or case worker
48.6
12.5
Monthly Income (Yuan)
Nil 2.1
<1000 8.2
1001-3000 34.1
3001-5000 20.4
5001-8000 9.9
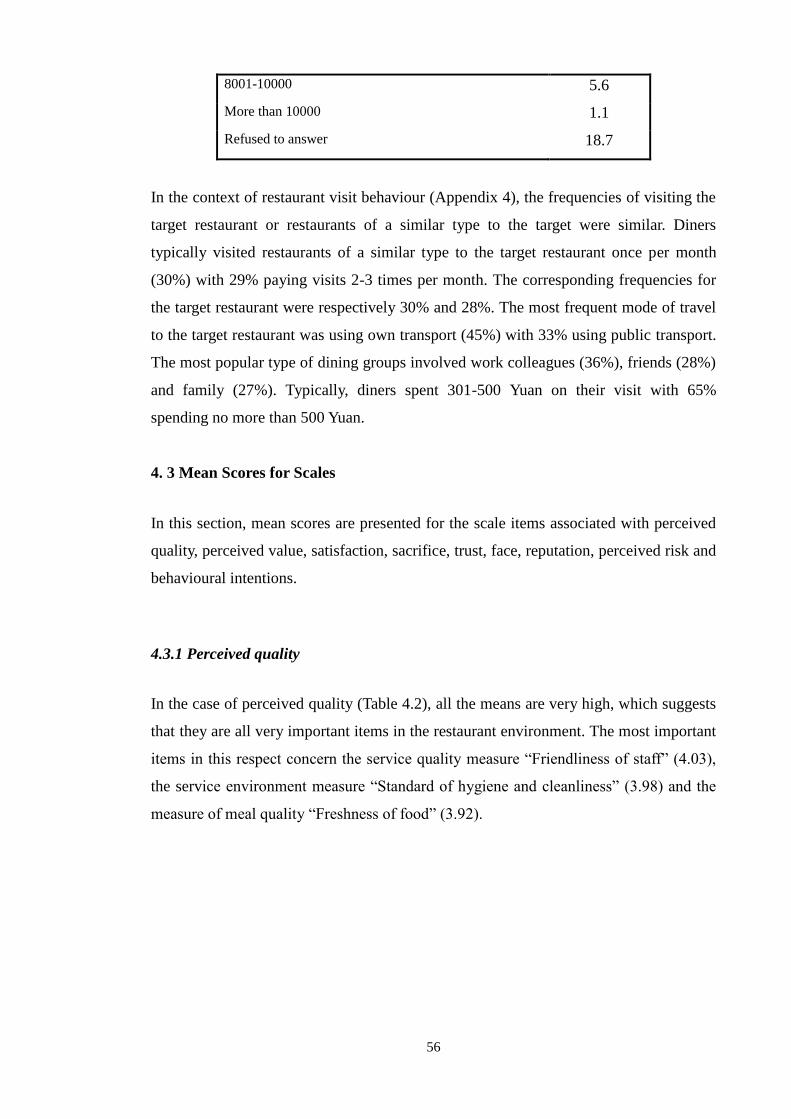
56
8001-10000 5.6
More than 10000 1.1
Refused to answer 18.7
In the context of restaurant visit behaviour (Appendix 4), the frequencies of visiting the
target restaurant or restaurants of a similar type to the target were similar. Diners
typically visited restaurants of a similar type to the target restaurant once per month
(30%) with 29% paying visits 2-3 times per month. The corresponding frequencies for
the target restaurant were respectively 30% and 28%. The most frequent mode of travel
to the target restaurant was using own transport (45%) with 33% using public transport.
The most popular type of dining groups involved work colleagues (36%), friends (28%)
and family (27%). Typically, diners spent 301-500 Yuan on their visit with 65%
spending no more than 500 Yuan.
4. 3 Mean Scores for Scales
In this section, mean scores are presented for the scale items associated with perceived
quality, perceived value, satisfaction, sacrifice, trust, face, reputation, perceived risk and
behavioural intentions.
4.3.1 Perceived quality
In the case of perceived quality (Table 4.2), all the means are very high, which suggests
that they are all very important items in the restaurant environment. The most important
items in this respect concern the service quality measure “Friendliness of staff” (4.03),
the service environment measure “Standard of hygiene and cleanliness” (3.98) and the
measure of meal quality “Freshness of food” (3.92).
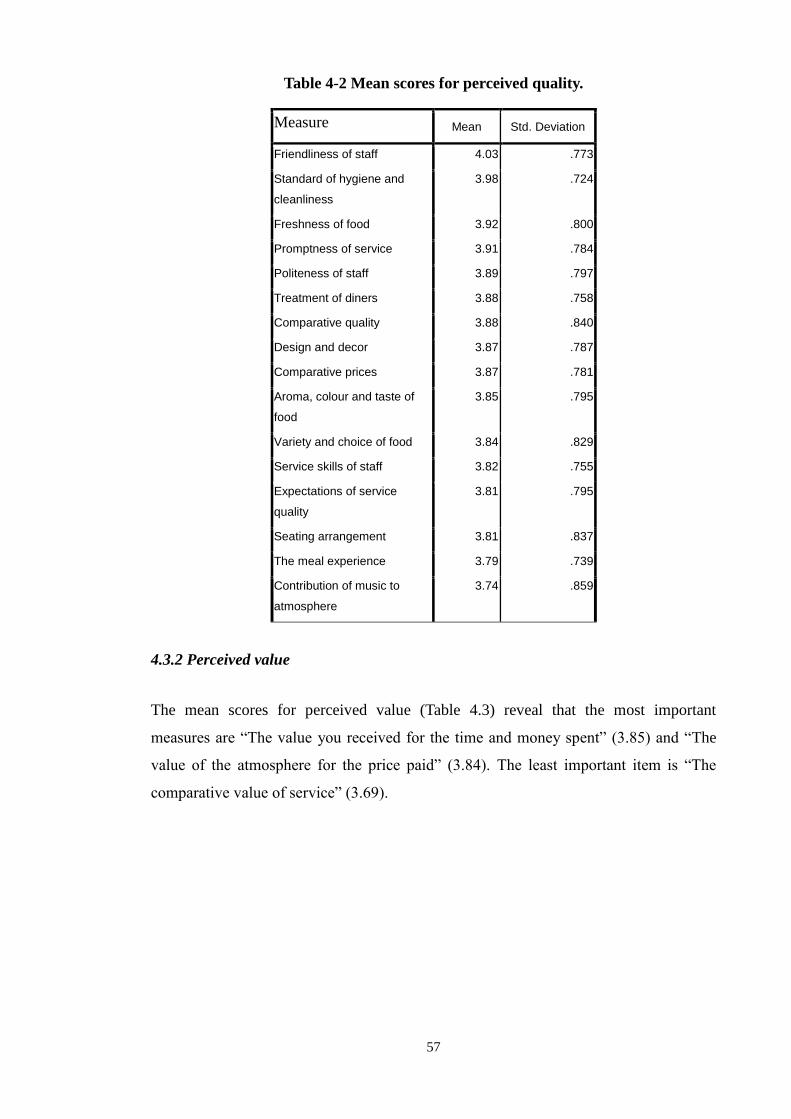
57
Table 4-2 Mean scores for perceived quality.
Measure Mean Std. Deviation
Friendliness of staff 4.03 .773
Standard of hygiene and
cleanliness
3.98 .724
Freshness of food 3.92 .800
Promptness of service 3.91 .784
Politeness of staff 3.89 .797
Treatment of diners 3.88 .758
Comparative quality 3.88 .840
Design and decor 3.87 .787
Comparative prices 3.87 .781
Aroma, colour and taste of
food
3.85 .795
Variety and choice of food 3.84 .829
Service skills of staff 3.82 .755
Expectations of service
quality
3.81 .795
Seating arrangement 3.81 .837
The meal experience 3.79 .739
Contribution of music to
atmosphere
3.74 .859
4.3.2 Perceived value
The mean scores for perceived value (Table 4.3) reveal that the most important
measures are “The value you received for the time and money spent” (3.85) and “The
value of the atmosphere for the price paid” (3.84). The least important item is “The
comparative value of service” (3.69).

58
Table 4-3 Mean scores for perceived value
Measure Mean Std. Deviation
The value you received for
the time and money spent
3.85 .814
The value of the atmosphere
for the price paid
3.84 .769
The comparative value of
meals
3.78 .764
The overall value of
restaurant
3.74 .753
The comparative value of
service
3.69 .790
4.3.3 Satisfaction
In the case of the measures of satisfaction (Table 4.4), all seven items seem to be of
similar importance in the measurement of satisfaction, since they have quite similar
mean values. The most important items are “Satisfaction with service” (3.94),
“Satisfaction with your choice of restaurant” (3.93) and “Satisfaction with meals” (3.86).
Table 4-4 Mean scores for satisfaction
Measure Mean Std. Deviation
Satisfaction with service 3.94 .747
Satisfaction with your choice
of this restaurant
3.93 .759
Satisfaction with meals 3.86 .747
Satisfaction from enjoyment
of your visit
3.83 .765
Satisfaction with the
atmosphere
3.83 .773
Satisfaction from the
pleasure of your visit
3.83 .800
Overall satisfaction 3.76 .742
Valid N (listwise)

59
4.3.4 Sacrifice
Previous research has suggested that in the measure of sacrifice, the lower the mean, the
higher the value consumers have perceived (Barker et al., 2002; Zeithaml, 1988). It is
evident from Table 4.5 that all the mean scores are low, which suggests that, on average,
customers have enjoyed a good service and meal experience except “The enjoyment and
pleasure experienced” which identifies the overall experience of the visit. Apart from
“The enjoyment and pleasure experienced”, the highest mean is associated with the
measure “The time it took for your meal to arrive” (2.29). In contrast, the lowest mean
value for sacrifice is associated with “The time it took for you to be seated at a table”
(2.14).
Table 4-5 Mean scores for sacrifice
Mean Std. Deviation
The enjoyment and
pleasure experienced
3.96 .772
The time it took for your
meal to arrive
2.29 .919
The effort spent to get the
quality of service you
wanted
2.18 .769
The effort spent to get to the
restaurant
2.17 .812
The price paid 2.16 .769
The time it took for you to
be seated at a table
2.14 .860
4.3.5 Trust
For the measure of trust (Table 4.6), the most important items are “Respect and value
you as a customer” (4.04), “Provide harmony and satisfaction” (4.03) and “Recommend
new dishes for you to try” (3.97) while “Offer you quality meals” (3.67) is of less
importance.

60
Table 4-6 Mean scores for trust
Measure Mean Std. Deviation
Respect and value you as a
customer
4.04 .713
Provide harmony and
satisfaction
4.03 .805
Recommend new dishes for
you to try
3.97 .812
Deal with your problems
quickly
3.88 .760
Offer you quality meals 3.67 .768
4.3.6 Face
In the case of face (Table 4.7), all the means seem to be similarly high, which suggests
that they are quite important items in the target restaurant environment. The most
important measures are “Restaurant service personnel should save customers’ face”
(4.02) and “I expect personnel to treat me with respect in front of my companions”
(3.98).
Table 4-7 Mean scores for face
Measure Mean Std. Deviation
Restaurant service personnel
should save customers’ face
4.02 .782
I expect personnel to treat
me with respect in front of
companions
3.98 .816
It is important for the host of
the dining party to gain face
3.96 .831
Restaurant personnel should
treat all customers with
sensitivity
3.91 .854

61
4.3.7 Reputation
In the case of the measurement of reputation (Table 4.8), the highest mean values are
associated with “Reputation is important in deciding to visit a restaurant” (3.98) and
“This restaurant has a better reputation than similar others” (3.85), while the lowest
mean is “You visit this restaurant because it has good reputation” (3.8).
Table 4-8 Mean scores for reputation
Measure Mean Std. Deviation
Reputation is important in
deciding to visit a restaurant
3.98 .813
This restaurant has a better
reputation than similar others
3.85 .748
You visit this restaurant
because it has good
reputation
3.80 .821
4.3.8 Perceived risk
Previous research has indicated that perceptions of value are greater when the risks
associated with a purchase are lower (Agarwal and Teas, 2004; Sweeney et al., 1999);
thus, when measuring the perceived risk, the lower the mean, then the higher the value
consumers have perceived. It is evident from Table 4.9 that all the mean scores are low,
which suggests that, on average, customers have enjoyed a good service and meal
experience. However, the highest mean is associated with the item “The food will
probably make you ill because it is not fresh” (2.01) and “You have wasted money”
(1.99). The lowest mean value for perceived risk is associated with “The service has
been poor” (1.93).
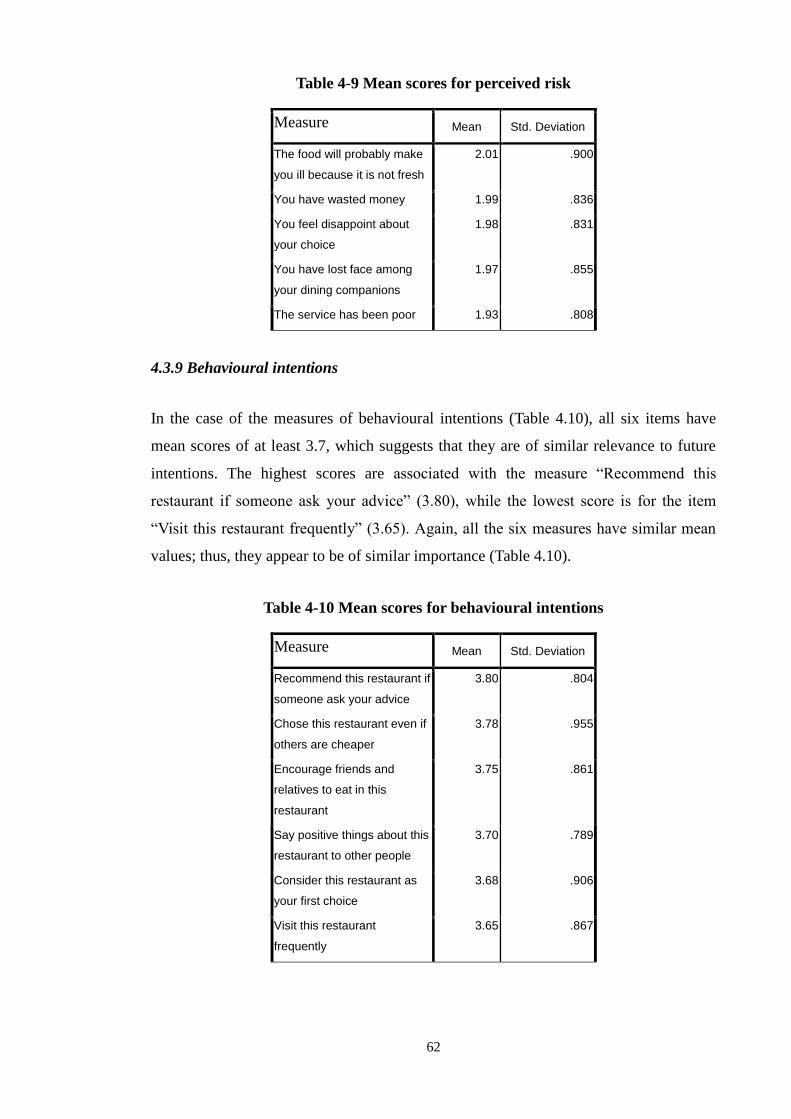
62
Table 4-9 Mean scores for perceived risk
Measure Mean Std. Deviation
The food will probably make
you ill because it is not fresh
2.01 .900
You have wasted money 1.99 .836
You feel disappoint about
your choice
1.98 .831
You have lost face among
your dining companions
1.97 .855
The service has been poor 1.93 .808
4.3.9 Behavioural intentions
In the case of the measures of behavioural intentions (Table 4.10), all six items have
mean scores of at least 3.7, which suggests that they are of similar relevance to future
intentions. The highest scores are associated with the measure “Recommend this
restaurant if someone ask your advice” (3.80), while the lowest score is for the item
“Visit this restaurant frequently” (3.65). Again, all the six measures have similar mean
values; thus, they appear to be of similar importance (Table 4.10).
Table 4-10 Mean scores for behavioural intentions
Measure Mean Std. Deviation
Recommend this restaurant if
someone ask your advice
3.80 .804
Chose this restaurant even if
others are cheaper
3.78 .955
Encourage friends and
relatives to eat in this
restaurant
3.75 .861
Say positive things about this
restaurant to other people
3.70 .789
Consider this restaurant as
your first choice
3.68 .906
Visit this restaurant
frequently
3.65 .867
63
4.4 Structural Equation Modelling
4.4.1 Introduction
Structural equation modelling (SEM) was used to test the proposed model and is a
method suitable for samples of more than 200 respondents (Snoj et al., 2004). SEM is
mostly used in social sciences, especially in testing hypotheses of causal influences
(Snoj et al., 2004). Compared with multivariate procedures, SEM is a more powerful
alternative that takes into account the correlated independents, measurement error and
multiple latent independents (Byrne, 2000, p.54). SEM has been widely used in
empirical studies (Kennedy et al., 2001; Lee, 2007; Sirdeshmukh et al., 2002).
To test the proposed relationships among the study variables, structural equation
modelling (SEM) was conducted using the AMOS 19 program (Arbuckle, 2010).
Following the recommendation of Anderson and Gerbing (1988), the SEM analysis
followed a two-stage process. First, construct validity was assessed by running a
confirmatory factor analysis (CFA) for the measurement model of each construct.
Second, the structural equation model was estimated for the Conceptual Model.
Following the evaluation of the Conceptual Model, a modified model (the Modified
Conceptual Model) was developed for subsequent analysis. The Modified Conceptual
Model is evaluated in terms of measures of fit, statistical significance of coefficients and
interpretation. Following are the summarized results of the hypotheses tests.
Subsequently, the mediating roles of perceived value, satisfaction, reputation and trust
were tested by examining the direct and indirect effects of these constructs’ predictors
on behavioural intentions.
4.4.2 Confirmatory factor analysis
Table 4.11 presents the results of the confirmatory factor analysis (CFA) for the
measurement models of all nine constructs of perceived quality (pqual), sacrifice (sac),
perceived risk (prisk), perceived value (pval), satisfaction (sat), reputation (rep) face
(face), trust (trust) and behavioural intentions (behint). The analyses are evaluated in
terms of the TLI and the CFI measures of fit; the statistical significance of the estimated
coefficients, squared multiple correlation coefficient, composite reliability and average
variance extracted are significantly associated with their observed variables because all
the estimation parameters of those variables are acceptable, which shows the signs are

64
positive. The measures of fit for the TLI and the CFI are evaluated in the context of
suggested minimum threshold values of .9 (Arbuckle, 2010). The statistical significance
of coefficients is evaluated in terms of the results of a hypothesis test with the null
hypothesis that the true coefficient is zero using a significance level of 5%. The SMCC
is evaluated in terms of the minimum value of .3 (Jőreskog and Sőrbom, 1983).
Construct reliability (CR) should have the lower threshold, which is equal to .7 and the
variance extracted (VE) should have the lower threshold, which is equal to .5. The
squared multiple correlation coefficient (SMCC) should be at least .3 (Jőreskog and
Sőrbom, 1983; Hair et al., 2006)
4.4.2.1 Perceived quality
The measures of fit for perceived quality are summarised by the TLI (.847) and the CFI
(.867). The value of the CFI approximates to .9 and hence the model is judged to have
an acceptable fit. All measures associated with the construct are statistically significant.
For each measure, the null hypothesis that the true value of the coefficient is zero is
rejected at the .001 level of significance. All measures have the correct positive signs.
With respect to the SMCC, all measures for perceived quality have an acceptable
coefficient, being very close to or greater than .3. Thus, all observed variables are
strongly significantly associated with perceived quality. Composite reliability (.956)
exceeds the minimum threshold of .7 while the average variance extracted of .359 is
lower than the minimum threshold of .5. From the results, an overall assessment is that
the model is acceptable.
4.4.2.2 Perceived value
With respect to the constructs of perceived value (pval), both the TLI and the CFI
measures of fit approximate to 1. Hence the measurement model is evaluated as very
acceptable. All measures associated with the construct are statistically significant. For
each measure, the null hypothesis that the true value of the coefficient is zero is rejected
at the .001 level of significance. All measures have the correct positive signs. With
respect to the SMCC, all measures for perceived quality have an acceptable coefficient
ranging from .4 to .5. Composite reliability (.845) exceeds the minimum threshold of .7
while the average variance extracted of .469 approximates to the minimum acceptable
threshold of .5. From the results, an overall assessment is that the measurement model
65
for perceived value is acceptable.
4.4.2.3 Satisfaction
For the construct of satisfaction, measures of fit according to the TLI (.963) and the CFI
(.975) exceed the minimum threshold of .9. Hence the model is judged to be acceptable
in terms of fit. All measures associated with the construct are statistically significant.
For each measure, the null hypothesis that the true value of the coefficient is zero is
rejected at the .001 level of significance. All measures have the correct positive signs.
With respect to the SMCC, all measures for satisfaction have an acceptable coefficient
ranging from .3 to .5. Composite reliability (.867) exceeds the minimum threshold of .7
while the average variance extracted of .441 is marginally lower than the minimum
acceptable threshold of .5. From the results, an overall assessment is that the
measurement model for perceived value is acceptable.
4.4.2.4 Sacrifice
The measures of fit for sacrifice are summarised by the TLI (.750) and the CFI (.850).
Although the TLI is a bit lower, the value of the CFI approximates to .9 and hence the
model is judged to have an acceptable fit. All measures associated with the construct are
statistically significant. For each measure, the null hypothesis that the true value of the
coefficient is zero is rejected at the .001 level of significance. All measures have the
correct positive signs. With respect to the SMCC, all measures for satisfaction have an
acceptable coefficient ranging from .3 to .5. Composite reliability (.799) exceeds the
minimum threshold of .7 while the average variance extracted (.296) is lower than the
minimum acceptable threshold of .5. From the results, an overall assessment is that the
measurement model for sacrifice is acceptable.
4.4.2.5 Trust
The measures of fit for trust are summarised by the TLI (.838) and the CFI (.919).
Hence on the basis of the CFI measure, the model is judged to have an acceptable fit.
All measures associated with the construct are statistically significant. For each measure,
the null hypothesis that the true value of the coefficient is zero is rejected at the .001
level of significance. All measures have the correct positive signs. With respect to the
66
SMCC, all measures for satisfaction have an acceptable coefficient ranging from .4 to .5.
Composite reliability (.867) exceeds the minimum threshold of .7 while the Average
Variance Extracted (.450) approximates to the minimum acceptable threshold of .5.
From the results, an overall assessment is that the measurement model for trust is
acceptable.
4.4.2.6 Face
With respect to the construct of face, the measures of fit are summarized by the TLI
(.976) and the CFI (.992). Both measures exceed the minimum threshold value of .9.
Consequently, the model is judged to have an acceptable fit. All measures associated
with the construct are statistically significant. For each measure, the null hypothesis that
the true value of the coefficient is zero is rejected at the .001 level of significance. All
measures have the correct positive signs. With respect to the SMCC, all measures for
satisfaction have an acceptable coefficient ranging from .6 to .8. Composite reliability
(.778) exceeds the minimum threshold of .7 while the average variance extracted (.540)
exceeds the minimum threshold value of .5. From the results, an overall assessment is
that the measurement model for face is acceptable.
4.4.2.7 Reputation
For the construct of reputation, the TLI is not available. The measure for the CFI (1.000)
indicates a very acceptable measure of fit for the model. All measures associated with
the construct are statistically significant. For each measure, the null hypothesis that the
true value of the coefficient is zero is rejected at the .001 level of significance. All
measures have the correct positive signs. With respect to the SMCC, all measures for
satisfaction have an acceptable coefficient ranging from .5 to .6. Composite reliability
(.847) exceeds the minimum threshold of .7 while the average variance extracted (.613)
exceeds the minimum threshold value of .5. From the results, an overall assessment is
that the measurement model for reputation is acceptable.
4.4.2.8 Risk
The measures of fit for risk are summarized by the TLI (.969) and the CFI (.985). Both
measures exceed the minimum threshold of .9. Hence the model is judged to have an
67
acceptable fit. All measures associated with the construct are statistically significant.
For each measure, the null hypothesis that the true value of the coefficient is zero is
rejected at the .001 level of significance. All measures have the correct positive signs.
With respect to the SMCC, all measures for satisfaction have an acceptable coefficient,
which approximate to a value of .6. Composite reliability (.890) exceeds the minimum
threshold of .7 while the average variance extracted (.602) approximates to the
minimum acceptable threshold of .5. From the results, an overall assessment is that the
measurement model for risk is acceptable.
4.4.2.9 Behavioural intentions
The measures of fit for behavioural intentions are summarised by the TLI (.967) and the
CFI (.980). Both measures exceed the minimum threshold of .9. Hence the model is
judged to have an acceptable fit. All measures associated with the construct are
statistically significant. For each measure, the null hypothesis that the true value of the
coefficient is zero is rejected at the .001 level of significance. All measures have the
correct positive signs. With respect to the SMCC, all measures for satisfaction have an
acceptable coefficient ranging from .3 to .6. Composite reliability (.894) exceeds the
minimum threshold of .7 while the average variance extracted (.500) satisfies the
minimum acceptable threshold of .5. From the results, an overall assessment is that the
measurement model for behavioural intentions is acceptable.
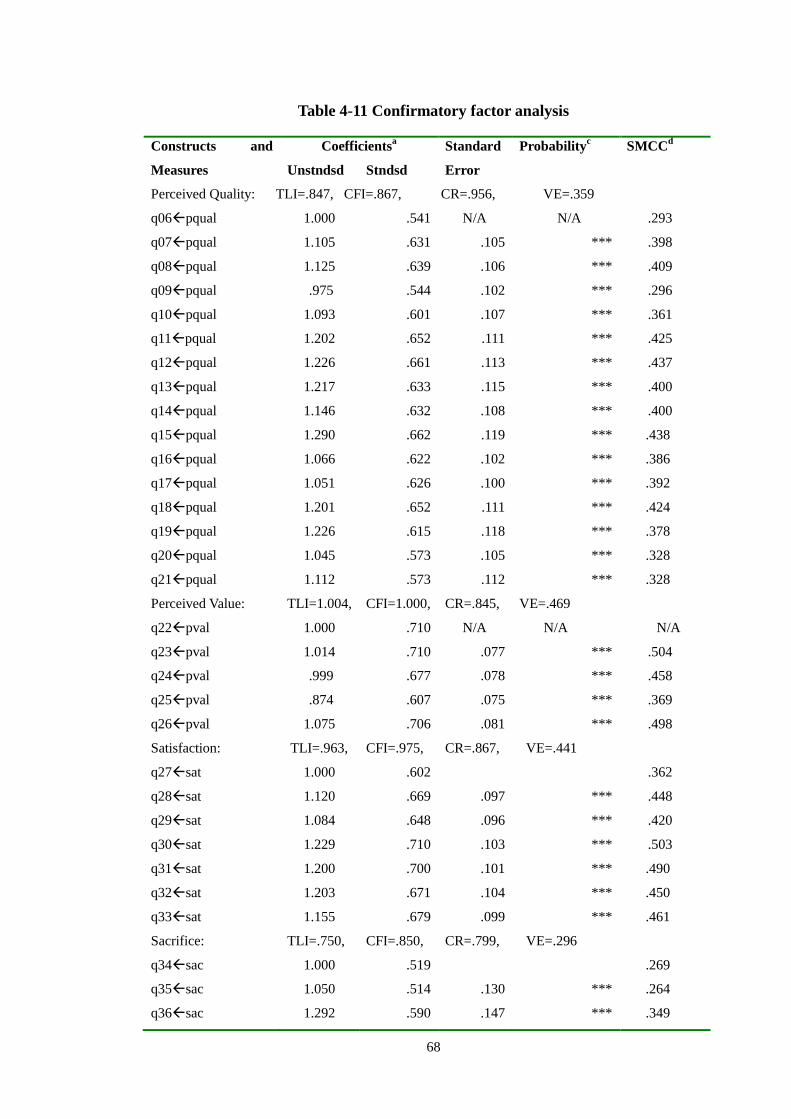
68
Table 4-11 Confirmatory factor analysis
Constructs and
Measures
Coefficientsa Standard
Error
Probabilityc SMCC
d
Unstndsd Stndsd
Perceived Quality: TLI=.847, CFI=.867, CR=.956,, VE=.359
q06pqual 1.000 .541 N/A N/A .293
q07pqual 1.105 .631 .105 *** .398
q08pqual 1.125 .639 .106 *** .409
q09pqual .975 .544 .102 *** .296
q10pqual 1.093 .601 .107 *** .361
q11pqual 1.202 .652 .111 *** .425
q12pqual 1.226 .661 .113 *** .437
q13pqual 1.217 .633 .115 *** .400
q14pqual 1.146 .632 .108 *** .400
q15pqual 1.290 .662 .119 *** .438
q16pqual 1.066 .622 .102 *** .386
q17pqual 1.051 .626 .100 *** .392
q18pqual 1.201 .652 .111 *** .424
q19pqual 1.226 .615 .118 *** .378
q20pqual 1.045 .573 .105 *** .328
q21pqual 1.112 .573 .112 *** .328
Perceived Value: TLI=1.004, CFI=1.000, CR=.845, VE=.469
q22pval 1.000 .710 N/A N/A N/A
q23pval 1.014 .710 .077 *** .504
q24pval .999 .677 .078 *** .458
q25pval .874 .607 .075 *** .369
q26pval 1.075 .706 .081 *** .498
Satisfaction: TLI=.963, CFI=.975, CR=.867, VE=.441
q27sat 1.000 .602 .362
q28sat 1.120 .669 .097 *** .448
q29sat 1.084 .648 .096 *** .420
q30sat 1.229 .710 .103 *** .503
q31sat 1.200 .700 .101 *** .490
q32sat 1.203 .671 .104 *** .450
q33sat 1.155 .679 .099 *** .461
Sacrifice: TLI=.750, CFI=.850, CR=.799, VE=.296
q34sac 1.000 .519 .269
q35sac 1.050 .514 .130 *** .264
q36sac 1.292 .590 .147 *** .349
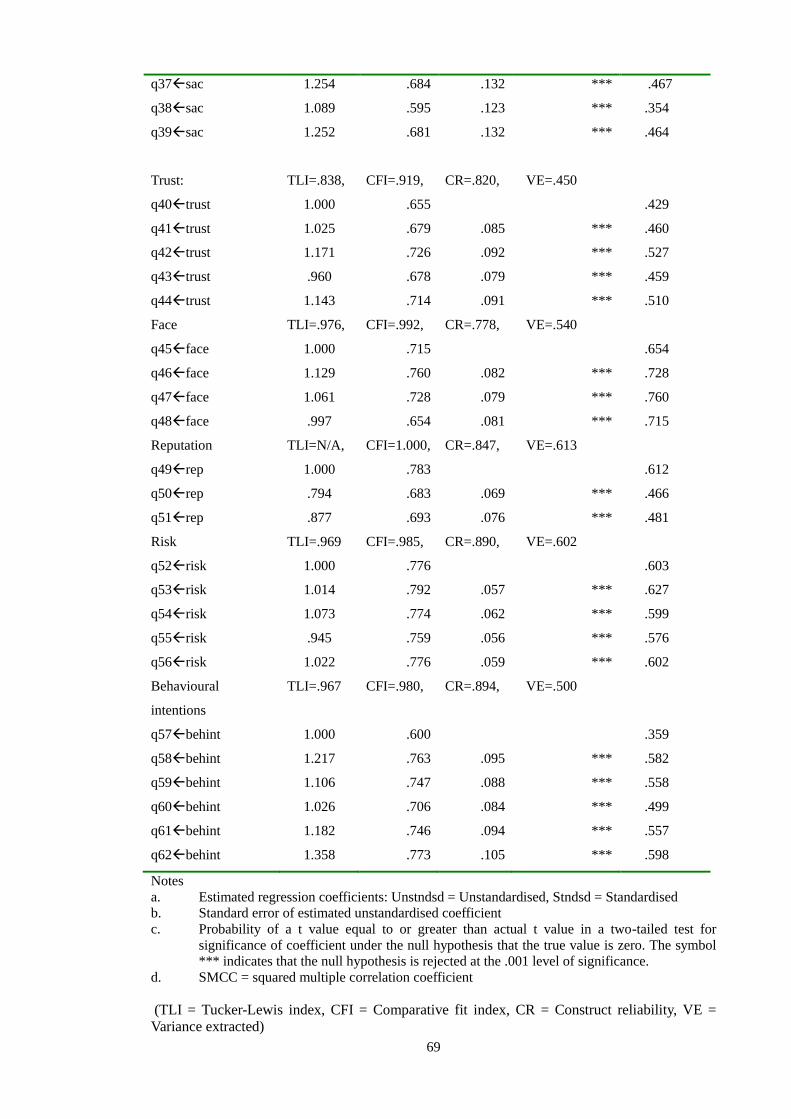
69
q37sac 1.254 .684 .132 *** .467
q38sac 1.089 .595 .123 *** .354
q39sac 1.252 .681 .132 *** .464
Trust: TLI=.838, CFI=.919, CR=.820, VE=.450
q40trust 1.000 .655 .429
q41trust 1.025 .679 .085 *** .460
q42trust 1.171 .726 .092 *** .527
q43trust .960 .678 .079 *** .459
q44trust 1.143 .714 .091 *** .510
Face TLI=.976, CFI=.992, CR=.778, VE=.540
q45face 1.000 .715 .654
q46face 1.129 .760 .082 *** .728
q47face 1.061 .728 .079 *** .760
q48face .997 .654 .081 *** .715
Reputation TLI=N/A, CFI=1.000, CR=.847, VE=.613
q49rep 1.000 .783 .612
q50rep .794 .683 .069 *** .466
q51rep .877 .693 .076 *** .481
Risk TLI=.969 CFI=.985, CR=.890, VE=.602
q52risk 1.000 .776 .603
q53risk 1.014 .792 .057 *** .627
q54risk 1.073 .774 .062 *** .599
q55risk .945 .759 .056 *** .576
q56risk 1.022 .776 .059 *** .602
Behavioural
intentions
TLI=.967 CFI=.980, CR=.894, VE=.500
q57behint 1.000 .600 .359
q58behint 1.217 .763 .095 *** .582
q59behint 1.106 .747 .088 *** .558
q60behint 1.026 .706 .084 *** .499
q61behint 1.182 .746 .094 *** .557
q62behint 1.358 .773 .105 *** .598
Notes
a. Estimated regression coefficients: Unstndsd = Unstandardised, Stndsd = Standardised
b. Standard error of estimated unstandardised coefficient
c. Probability of a t value equal to or greater than actual t value in a two-tailed test for
significance of coefficient under the null hypothesis that the true value is zero. The symbol
*** indicates that the null hypothesis is rejected at the .001 level of significance.
d. SMCC = squared multiple correlation coefficient
(TLI = Tucker-Lewis index, CFI = Comparative fit index, CR = Construct reliability, VE =
Variance extracted)
70
4.4.3 Structural equation model analysis for the Conceptual Model
The Conceptual Model was developed from the literature and is explained in Chapter 3.
The estimated structural equation model for the Conceptual Model is presented in Table
4.12. The measures of fit for the model are summarised by TLI (.815), CFI (.823) and
RMSEA (.057). Both TLI and CFI are marginally lower than the recommended
minimum threshold of .9. However, the RMSEA lies comfortably within the maximum
threshold of .08.
Consideration of the significance of the paths in the structural model indicates that of
the 14 estimated coefficients, 11 measures associated with the construct are statistically
significant. For 10 measures, the null hypothesis that the true value of the coefficient is
zero is rejected at the .001 level of significance (identified by the symbol ***).
Furthermore, the estimated coefficient for the path repbehint is significant at the 5%
level of significance (.036). In the case of the paths pqualbehint (p=.868),
trustbehint (p=.856) and pvalbehint (p=.629) the null hypothesis is at the 5% level
of significance.
A further problem is that from the perspective of interpretation, some of the paths,
though statistically significant, have contradictory signs. Inspection of the
unstandardised coefficients for pqualsat (-.410), trustbehint (-.017) and
pvalbehint (-.134) reveal that the signs are negative whereas on the basis of a priori
knowledge from the theory and the existing literature, they are expected to be positive.
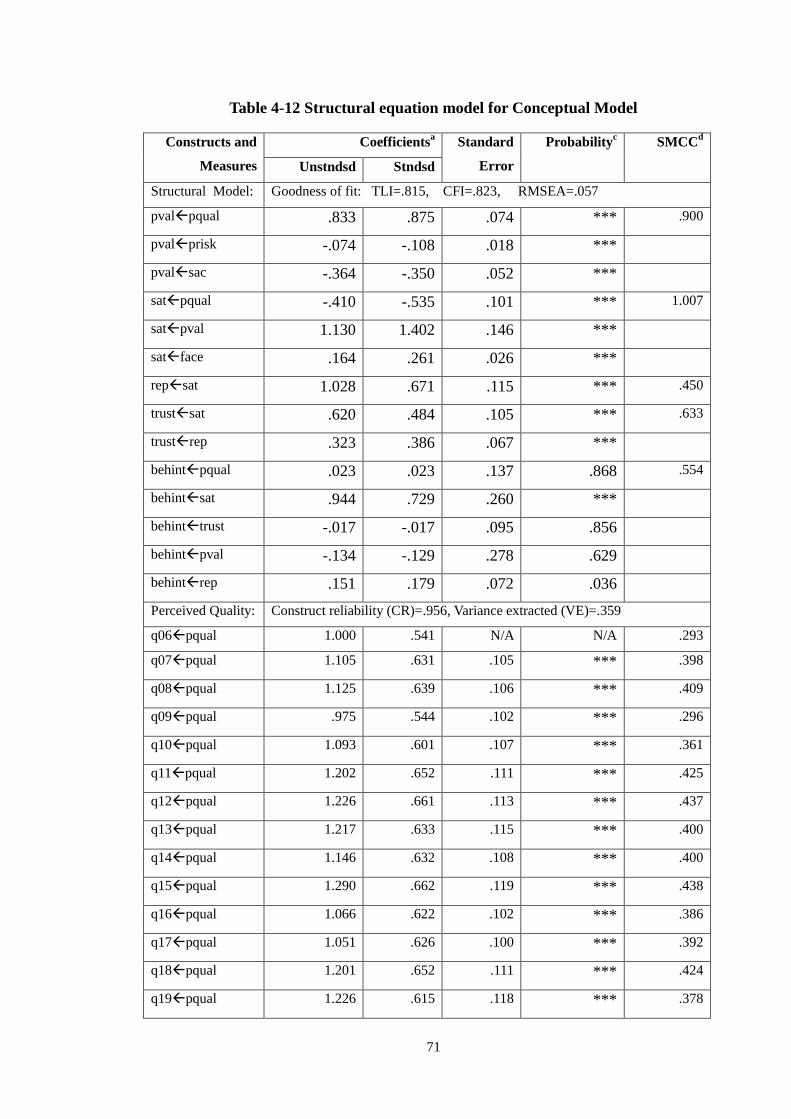
71
Table 4-12 Structural equation model for Conceptual Model
Constructs and
Measures
Coefficientsa Standard
Error
Probabilityc SMCC
d
Unstndsd Stndsd
Structural Model: Goodness of fit: TLI=.815, CFI=.823, RMSEA=.057
pvalpqual .833 .875 .074 *** .900
pvalprisk -.074 -.108 .018 ***
pvalsac -.364 -.350 .052 ***
satpqual -.410 -.535 .101 *** 1.007
satpval 1.130 1.402 .146 ***
satface .164 .261 .026 ***
repsat 1.028 .671 .115 *** .450
trustsat .620 .484 .105 *** .633
trustrep .323 .386 .067 ***
behintpqual .023 .023 .137 .868 .554
behintsat .944 .729 .260 ***
behinttrust -.017 -.017 .095 .856
behintpval -.134 -.129 .278 .629
behintrep .151 .179 .072 .036
Perceived Quality: Construct reliability (CR)=.956, Variance extracted (VE)=.359
q06pqual 1.000 .541 N/A N/A .293
q07pqual 1.105 .631 .105 *** .398
q08pqual 1.125 .639 .106 *** .409
q09pqual .975 .544 .102 *** .296
q10pqual 1.093 .601 .107 *** .361
q11pqual 1.202 .652 .111 *** .425
q12pqual 1.226 .661 .113 *** .437
q13pqual 1.217 .633 .115 *** .400
q14pqual 1.146 .632 .108 *** .400
q15pqual 1.290 .662 .119 *** .438
q16pqual 1.066 .622 .102 *** .386
q17pqual 1.051 .626 .100 *** .392
q18pqual 1.201 .652 .111 *** .424
q19pqual 1.226 .615 .118 *** .378
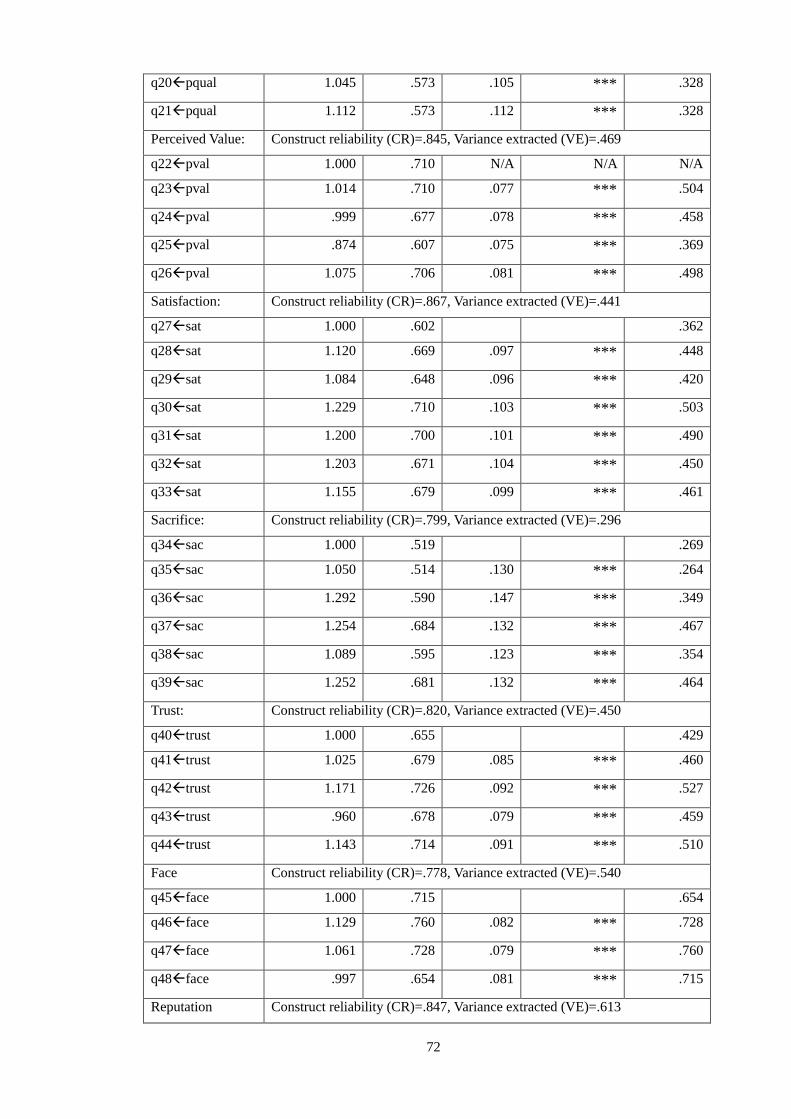
72
q20pqual 1.045 .573 .105 *** .328
q21pqual 1.112 .573 .112 *** .328
Perceived Value: Construct reliability (CR)=.845, Variance extracted (VE)=.469
q22pval 1.000 .710 N/A N/A N/A
q23pval 1.014 .710 .077 *** .504
q24pval .999 .677 .078 *** .458
q25pval .874 .607 .075 *** .369
q26pval 1.075 .706 .081 *** .498
Satisfaction: Construct reliability (CR)=.867, Variance extracted (VE)=.441
q27sat 1.000 .602 .362
q28sat 1.120 .669 .097 *** .448
q29sat 1.084 .648 .096 *** .420
q30sat 1.229 .710 .103 *** .503
q31sat 1.200 .700 .101 *** .490
q32sat 1.203 .671 .104 *** .450
q33sat 1.155 .679 .099 *** .461
Sacrifice: Construct reliability (CR)=.799, Variance extracted (VE)=.296
q34sac 1.000 .519 .269
q35sac 1.050 .514 .130 *** .264
q36sac 1.292 .590 .147 *** .349
q37sac 1.254 .684 .132 *** .467
q38sac 1.089 .595 .123 *** .354
q39sac 1.252 .681 .132 *** .464
Trust: Construct reliability (CR)=.820, Variance extracted (VE)=.450
q40trust 1.000 .655 .429
q41trust 1.025 .679 .085 *** .460
q42trust 1.171 .726 .092 *** .527
q43trust .960 .678 .079 *** .459
q44trust 1.143 .714 .091 *** .510
Face Construct reliability (CR)=.778, Variance extracted (VE)=.540
q45face 1.000 .715 .654
q46face 1.129 .760 .082 *** .728
q47face 1.061 .728 .079 *** .760
q48face .997 .654 .081 *** .715
Reputation Construct reliability (CR)=.847, Variance extracted (VE)=.613
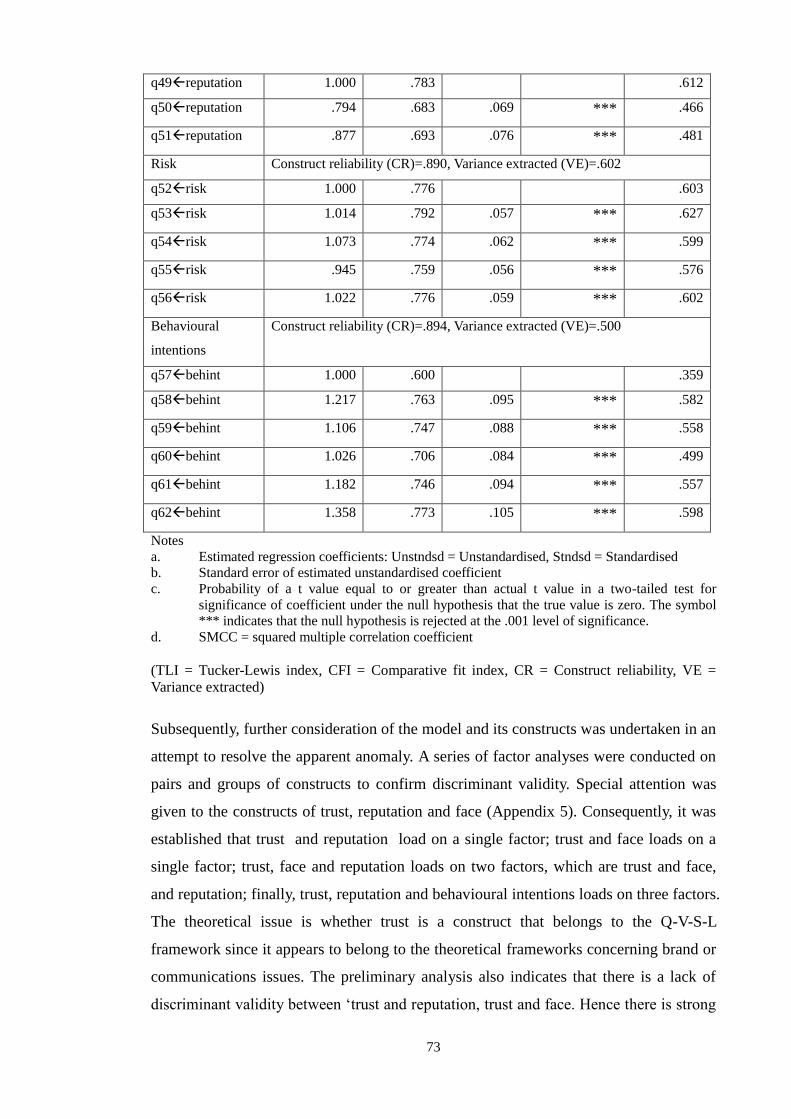
73
q49reputation 1.000 .783 .612
q50reputation .794 .683 .069 *** .466
q51reputation .877 .693 .076 *** .481
Risk Construct reliability (CR)=.890, Variance extracted (VE)=.602
q52risk 1.000 .776 .603
q53risk 1.014 .792 .057 *** .627
q54risk 1.073 .774 .062 *** .599
q55risk .945 .759 .056 *** .576
q56risk 1.022 .776 .059 *** .602
Behavioural
intentions
Construct reliability (CR)=.894, Variance extracted (VE)=.500
q57behint 1.000 .600 .359
q58behint 1.217 .763 .095 *** .582
q59behint 1.106 .747 .088 *** .558
q60behint 1.026 .706 .084 *** .499
q61behint 1.182 .746 .094 *** .557
q62behint 1.358 .773 .105 *** .598
Notes
a. Estimated regression coefficients: Unstndsd = Unstandardised, Stndsd = Standardised
b. Standard error of estimated unstandardised coefficient
c. Probability of a t value equal to or greater than actual t value in a two-tailed test for
significance of coefficient under the null hypothesis that the true value is zero. The symbol
*** indicates that the null hypothesis is rejected at the .001 level of significance.
d. SMCC = squared multiple correlation coefficient
(TLI = Tucker-Lewis index, CFI = Comparative fit index, CR = Construct reliability, VE =
Variance extracted)
Subsequently, further consideration of the model and its constructs was undertaken in an
attempt to resolve the apparent anomaly. A series of factor analyses were conducted on
pairs and groups of constructs to confirm discriminant validity. Special attention was
given to the constructs of trust, reputation and face (Appendix 5). Consequently, it was
established that trust and reputation load on a single factor; trust and face loads on a
single factor; trust, face and reputation loads on two factors, which are trust and face,
and reputation; finally, trust, reputation and behavioural intentions loads on three factors.
The theoretical issue is whether trust is a construct that belongs to the Q-V-S-L
framework since it appears to belong to the theoretical frameworks concerning brand or
communications issues. The preliminary analysis also indicates that there is a lack of
discriminant validity between ‘trust and reputation, trust and face. Hence there is strong

74
evidence to support the exclusion of trust from the Conceptual Model. The Modified
Conceptual Model was then developed.
4.4.4 Structural equation model for the Modified Conceptual Model
The Modified Conceptual Model (Figure 4.1) was developed following modification of
the original Conceptual Model as discussed in Section 4.5.3. Three paths were removed
from the Conceptual Model, specifically, pqualbehint, pvalbehint, pqualsat, and
one construct was removed from the Conceptual Model, namely, trust.
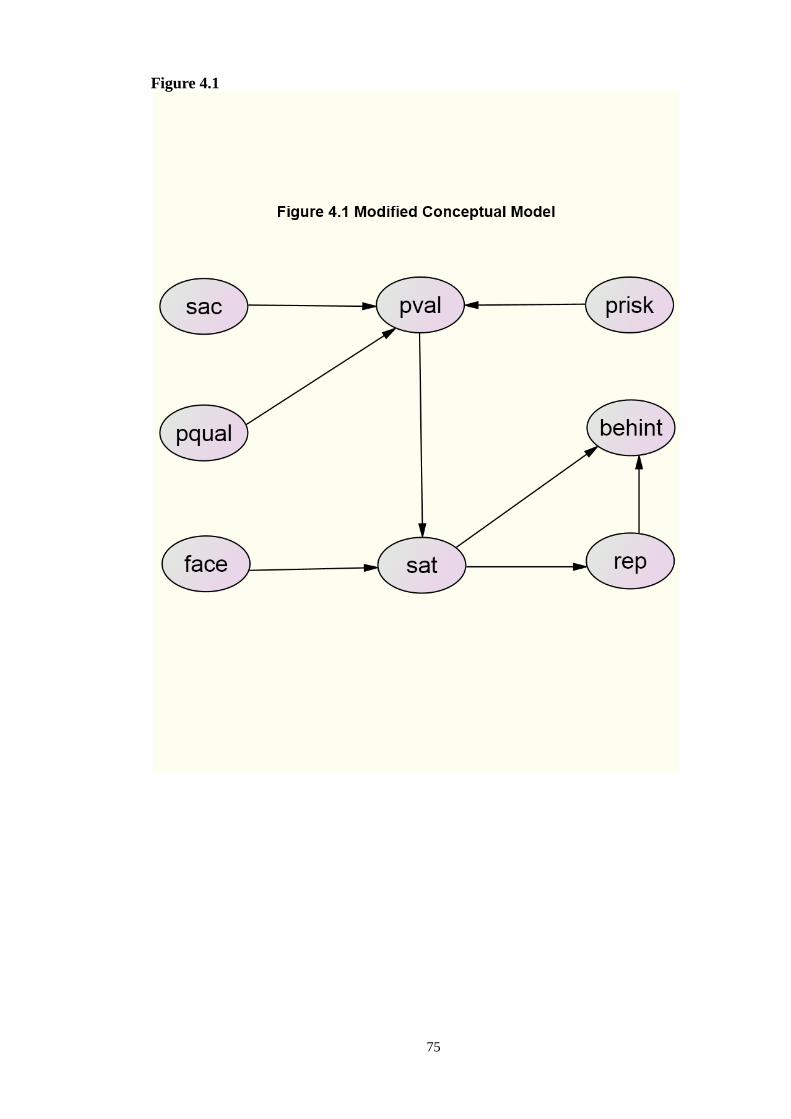
75
Figure 4.1
76
4.4.5 Goodness of fit for Modified Conceptual Model.
The estimated structural equation model Table 4.13 is the SEM output for the Modified
Conceptual Model as presented in Table 4.13. The measures of fit are summarised by
the TLI (.822), the CFI (.830) and RMSEA (.058). Compared with the comparable
results for the Conceptual Model (RMSEA=.057, TLI=.815, CFI=.823, RMSEA=.057),
there is a marginal improvement in fit for the TLI and the CFI while RMSEA is
marginally lower. Both the TLI and the CFI are very close to the minimum threshold
of .9. However, RMSEA lies within the suggested maximum threshold of .08.
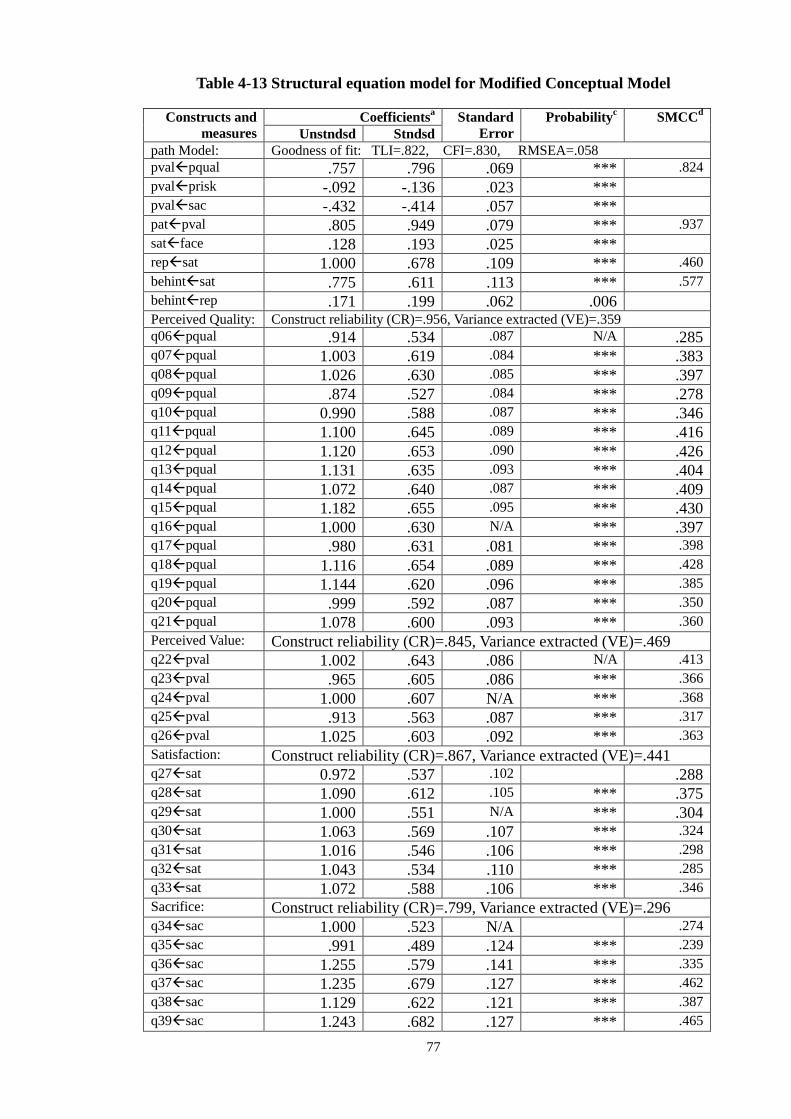
77
Table 4-13 Structural equation model for Modified Conceptual Model
Constructs and
measures
Coefficientsa Standard
Error
Probabilityc SMCC
d
Unstndsd Stndsd
path Model: Goodness of fit: TLI=.822, CFI=.830, RMSEA=.058
pvalpqual .757 .796 .069 *** .824
pvalprisk -.092 -.136 .023 ***
pvalsac -.432 -.414 .057 ***
patpval .805 .949 .079 *** .937
satface .128 .193 .025 ***
repsat 1.000 .678 .109 *** .460
behintsat .775 .611 .113 *** .577
behintrep .171 .199 .062 .006
Perceived Quality: Construct reliability (CR)=.956, Variance extracted (VE)=.359
q06pqual .914 .534 .087 N/A .285
q07pqual 1.003 .619 .084 *** .383
q08pqual 1.026 .630 .085 *** .397
q09pqual .874 .527 .084 *** .278
q10pqual 0.990 .588 .087 *** .346
q11pqual 1.100 .645 .089 *** .416
q12pqual 1.120 .653 .090 *** .426
q13pqual 1.131 .635 .093 *** .404
q14pqual 1.072 .640 .087 *** .409
q15pqual 1.182 .655 .095 *** .430
q16pqual 1.000 .630 N/A *** .397
q17pqual .980 .631 .081 *** .398
q18pqual 1.116 .654 .089 *** .428
q19pqual 1.144 .620 .096 *** .385
q20pqual .999 .592 .087 *** .350
q21pqual 1.078 .600 .093 *** .360
Perceived Value: Construct reliability (CR)=.845, Variance extracted (VE)=.469
q22pval 1.002 .643 .086 N/A .413
q23pval .965 .605 .086 *** .366
q24pval 1.000 .607 N/A *** .368
q25pval .913 .563 .087 *** .317
q26pval 1.025 .603 .092 *** .363
Satisfaction: Construct reliability (CR)=.867, Variance extracted (VE)=.441
q27sat 0.972 .537 .102 .288
q28sat 1.090 .612 .105 *** .375
q29sat 1.000 .551 N/A *** .304
q30sat 1.063 .569 .107 *** .324
q31sat 1.016 .546 .106 *** .298
q32sat 1.043 .534 .110 *** .285
q33sat 1.072 .588 .106 *** .346
Sacrifice: Construct reliability (CR)=.799, Variance extracted (VE)=.296
q34sac 1.000 .523 N/A .274
q35sac .991 .489 .124 *** .239
q36sac 1.255 .579 .141 *** .335
q37sac 1.235 .679 .127 *** .462
q38sac 1.129 .622 .121 *** .387
q39sac 1.243 .682 .127 *** .465

78
Face Construct reliability (CR)=.778, Variance extracted (VE)=.540
q45face 1.000 .721 N/A .520
q46face 1.115 .757 .080 *** .572
q47face 1.051 .727 .077 *** .528
q48face .987 .653 .079 *** .426
Reputation Construct reliability (CR)=.847, Variance extracted (VE)=.613
q49reputation 1.000 .726 N/A .527
q50reputation .827 .651 .072 *** .424
q51reputation .887 .641 .079 *** .410
Risk Construct reliability (CR)=.890, Variance extracted (VE)=.602
q52risk 1.000 .778 N/A .605
q53risk 1.014 .793 .057 *** .629
q54risk 1.067 .771 .062 *** .595
q55risk .944 .759 .055 *** .576
q56risk 1.021 .777 .058 *** .603
Behavioural
intentions
Construct reliability (CR)=.894, Variance extracted (VE)=.500
q57behint 1.000 .555 N/A .308
q58behint 1.166 .696 .105 *** .485
q59behint 1.054 .675 .097 *** .455
q60behint 1.007 .655 .094 *** .429
q61behint 1.149 .690 .104 *** .476
q62behint 1.348 .737 .118 *** .543
Notes
a. Estimated regression coefficients: Unstndsd = Unstandardised, Stndsd = Standardised
b. Standard error of estimated unstandardised coefficient
c. Probability of a t value equal to or greater than actual t value in a two-tailed test for
significance of coefficient under the null hypothesis that the true value is zero. The symbol
*** indicates that the null hypothesis is rejected at the .001 level of significance.
d. SMCC = squared multiple correlation coefficient
(TLI = Tucker-Lewis index, CFI = Comparative fit index, CR = Construct reliability, VE =
Variance extracted)
For the structural model, all eight estimated path coefficients are strongly statistically
significant. For each coefficient, the null hypothesis that the true value of the coefficient
is zero is rejected. In seven out of eight cases (pqualpval, priskpval, sacpval,
pvalsat, facesat, satrep, satbehint), the probability of a t value equal to or
greater than the actual t value is rejected at the .001 level of significance. All
coefficients have the expected positive signs except the path priskpval and sacpval;
in accordance with the previous research (Agarwal and Teas, 2004; Barker et al., 2002;
Bolton and Drew, 1991; Cronin et al., 2000; Zeithaml, 1988), these two paths also have
the expected negative sign. For the path coefficient repbehint, the null hypothesis is
rejected at the .006 level and the coefficient also has the expected positive sign.
With respect to the relative importance of constructs or measures on perceived value,

79
perceived quality has the strongest influence on perceived value (.796), followed by a
negative moderate impact on sacrifice (-.414) and a negative weak influence by
perceived risk (-.136). Perceived value has an extremely strong impact on satisfaction
(.949) and face has a weak impact on satisfaction (.193). Satisfaction has a moderate to
strong impact on behavioural intentions (.611) and reputation (.678). Reputation has a
weak impact on behavioural intentions (.199).
Consideration of the SMCCs for the structural model reveals that the model is very
successful at explaining the variation pval (SMCC =.824) and sat (SMCC =. 937), is
rather less successful in explain the variation in rep (SMCC = .460) and moderately
successful in explaining the variation in behint (SMCC =.577).
For each of the eight measurement models (pqual, pval, sat, sac, face, rep, prisk and
behint), the null hypothesis that the true value of the coefficient is zero is rejected at
the .001 level of significance.
There are several instances of mediation in the model. These effects are associated with
the constructs of perceived value (pval), ‘Satisfaction’ (sat) and reputation (rep). The
tests of statistical significance of indirect effects were based upon Sobel (1982), and
actual t statistics (t value) and probability values (p value) were computed from the
interactive website of Preacher and Leonardelli (2006).
Perceived value is a mediating variable for three paths that lead to satisfaction. Each of
these is statistically significant. It acts as a mediating variable between sacrifice (sac)
and satisfaction through the path sacpvalsat (t value = -6.081, p value = .000). It
mediates between perceived quality and satisfaction through the path pqualpvalsat
(t value = 7.466, p value =.000). The third instance links perceived risk with satisfaction
through the path priskpvalsat (t value = -3.721, p value = .000).
Satisfaction acts as a mediator for three paths that all affect reputation and behavioural
intentions. Each of these is statistically significant. Satisfaction acts as a mediating
variable between face (face) and reputation (rep) through the path facesatrep (t
value = 4.471, p value = .000). It acts as a mediating variable between perceived value
(pval) and behavioural intentions (behint) through the path pvalsatbehint (t value =
5.690, p value =.000). The third instance links face (face) with behavioural intentions
80
(behint) through the path facesatbehint (t value = 4.103, p value = .000).
Reputation is a mediating variable on one occasion. It mediates significantly between
satisfaction (sat) and behavioural intentions (behint) through the path satrepbehint
(t value = 2.641, p value = .008).
In summary, the mediating effects are all statistically significant. These effects are
relevant to some of the hypotheses, which are addressed in the following sub-section
(4.5.6) and represent indirect effects that are included in the discussion in Sub-section
4.5.7
4.4.6 Tests of hypotheses
The hypotheses generated from the literature review in Chapter 3 are evaluated in the
context of the original Conceptual Model and the Modified Conceptual Model. In some
cases, hypotheses are not supported because the process of modification was applied
only to the Conceptual Model; hypotheses will be rejected if the process is not applied
to the Modified Conceptual Model. A summary of the hypotheses, associated paths and
results is presented in Table 4.14. There is also a partial support listed in the table as
some hypotheses contain two paths, but only one path was supported.
4.4.6.1 Hypothesis H1: Consumer perceived quality (pqual) has a direct and
positive effect on perceived value (pval).
Hypothesis H1 is represented by the coefficient of the path pqualpval. It is supported
in the Modified Conceptual Model. The path coefficient is statistically significant (p
= .001) and it has the expected positive sign.
4.4.6.2 Hypothesis H2: Consumer perceived quality (pqual) has a direct and
positive effect on satisfaction (sat).
Hypothesis H2 is represented by the coefficient of the path pqualsat. This hypothesis
is not supported because the path coefficient of pqualsat in the Conceptual Model is
negative (-.410), though significant (p = .000), and as such, contradicts a priori
expectations of a positive sign. This path is deleted from the Modified Conceptual

81
Model so this hypothesis is rejected.
4.4.6.3 Hypothesis H3: Consumer perceived quality (pqual) has a direct and
positive effect on behavioural intentions (behint).
Hypothesis 3 is represented by the coefficient of the path pqualbehint. This
hypothesis is not supported in the Conceptual Model. The coefficient is not significant
at the 5% significance level (p = .868) although it has the expected positive sign (.023).
Hence the path was omitted in the Modified Conceptual Model so this hypothesis is not
supported.
4.4.6.4 Hypothesis H4: Consumer perceived value (pval) has a direct and positive
effect on satisfaction (sat).
The hypothesis is represented by the path pvalsat. The hypothesis is supported in both
models since the path coefficient is statistically significant (p = .001) and has the
expected positive sign.
4.4.6.5 Hypothesis H5: Consumer satisfaction (sat) has a direct and positive effect
on behavioural intentions (behint).
Hypothesis 5 is represented by the path satbehint. Hypothesis H5 is supported in the
Conceptual Model and the path is retained in the Modified Conceptual Model where it
is statistically significant at the 5% significance level (p = .001) and has the expected
positive sign.
4.4.6.6 Hypothesis H6: Consumer perceived value (pval) has a direct and positive
effect on behavioural intentions (behint).
Hypothesis H6 is represented by the path pvalbehint. This path is not statistically
significant at the 5% significance level (p= .629) and in addition, it does not have the
expected positive sign. Subsequently, the path is omitted in the Modified Conceptual
Model so this hypothesis is rejected.
4.4.6.7 Hypothesis H7: Consumer perceived value (pval) has an indirect effect on
82
behavioural intentions (behint) through satisfaction (sat) (pvalsatbehint).
Hypothesis 7 is supported in the Modified Conceptual Model because the coefficients
pval sat (p =.001) and satbehint (p = .001) are statistically significant and the
results of the mediations test indicates that the complete path pvalsatbehint is
significant (t value = 5.690, p value =.000).
4.4.6.8 Hypothesis H8: Consumer perceived quality (pqual) has an indirect effect
on satisfaction (sat) through the mediating effect of perceived value (pval)
(pqualpvalsat).
Hypothesis 8 is represented by the coefficient of the path pqualpvalsat. The
hypothesis is supported in the Modified Conceptual Model. The coefficients for the
respective paths pqual sat (p =.001) and satbehint (p = .001) are both statistically
significant and the result of the mediation test indicates that the complete path
pvalsatbehint is significant (t value = 7.466 p value =.000).
4.4.6.9 Hypothesis H9: Consumer perceived quality (pqual) has an indirect effect
on behavioural intentions (behint) through the mediating effect of satisfaction (sat)
(pqualsatbehint).
Hypothesis 9 is represented by the coefficients of the path pqualsatbehint. This
hypothesis is only partially supported. As reported for Hypothesis 2, the path coefficient
of pqualsat in the Conceptual Model is negative (-.410), though significant (p = .000);
thus, it is deleted from Modified Conceptual Mode, and as such, contradicts a priori
expectations of a positive sign. The remaining path satbehint is significant and is
retained in the Modified Conceptual Model. Partial support means that the hypothesis
coincides with Hypothesis 5, which is supported.
4.4.6.10 Hypothesis H10: Consumer perceived quality (pqual) has an indirect effect
on behavioural intentions (behint) through the mediating affect of perceived value
(pval) (pqualpvalbehint).
This hypothesis is represented by the coefficients of the path pqualpvalbehint.
There is only partial support for Hypothesis 10. The complete path pqualpvalbehint
83
cannot be tested. As reported in the case of Hypotheses 1 and 6, only the path
coefficient pqualpval is acceptable and so the path coefficient pvalbehint is omitted
from the Modified Conceptual Model.
4.4.6.11 Hypothesis H11: Sacrifice (sac) has a direct and negative effect on
perceived value (pval).
Hypothesis 11 is supported by the Modified Conceptual Model. The coefficient is
significant at the 5% significance level (p = .000) and it has the expected negative sign.
4.4.6.12 Hypothesis H12: Perceived risk (prisk) has a direct and negative effect on
perceived value (pval).
Hypothesis 12 is represented by the coefficient of the path priskpval. Hypothesis 12 is
supported. In the Modified Conceptual Model, it has a significant coefficient (p = .001)
and the expected negative sign.
4.4.6.13 Hypothesis H13: Face (face) has a direct and positive effect on consumer
satisfaction (sat).
Hypothesis 13 is represented by the coefficient of the path facesat. Hypothesis 13 is
supported. In the Modified Conceptual Model, it is significant (p = .001) and satisfies a
priori expectation of a positive sign.
4.4.6.14 Hypothesis H14: Face (face) has an indirect effect on behavioural
intentions (behint) through the mediating effect of satisfaction (sat)
(facesatbehint).
Hypothesis 14 is represented by the coefficients of the path ‘satbehint. The
hypothesis is supported in the Modified Conceptual Model. The coefficients facesat
(p =.001) and satbehint (p = .001) are statistically significant and the result of the
mediation test indicates that the complete path facesatbehint is significant (t value
= 4.103 p value =.001).
4.4.6.15 Hypothesis H15: Consumer satisfaction (sat) has a direct and positive
84
effect on reputation (rep).
Hypothesis 15 is represented by the path satrep. The hypothesis is supported. It is
significant at the 5 % significance level (p = .001) and has the expected positive sign.
4.4.6.16 Hypothesis H16: Reputation has a direct and positive effect on behavioural
intentions (behint)
Hypothesis 16 is represented by the coefficient of the path repbehint. Hypothesis H16
is supported. It is significant at the 5% significance level (p = .006) and has the
expected positive sign
4.4.6.17 Hypothesis H17: Consumer satisfaction (sat) has an indirect effect on
behavioural intentions (behint) through the mediating effect of reputation (rep)
(satrepbehint).
Hypothesis 17 is represented by the coefficients of the path satrepbehint. This
hypothesis is supported in the Modified Conceptual Model. The respective coefficients
for the paths sat rep (p =.001) and repbehint (p = .006) are statistically significant
and the result of the mediation test indicates that the complete path satrepbehint is
significant (t value = 2.641 p value =.008).
4.4.6.18 Hypothesis H18: Consumer satisfaction (sat) has a direct and positive
effect on trust (trust).
Hypothesis 18 is not supported, since the construct of trust is omitted from the Modified
Conceptual Model.
4.4.6.19 Hypothesis H19: Reputation (rep) has a direct and positive effect on trust
(trust).
Hypothesis 19 is not supported since the construct of trust is omitted from the Modified
Conceptual Model.
4.4.6.20 Hypothesis H20: Trust (trust) has a direct and positive effect on
85
behavioural intentions (behint).
Hypothesis 20 is not supported since the construct of trust is omitted from the Modified
Conceptual Model.
4.4.6.21 Hypothesis H21: Satisfaction (sat) has an indirect effect on behavioural
intentions (behint) through the mediating effect of trust (trust)
(sattrustbehint).
Hypothesis 21 is not supported since the construct of trust is omitted from the Modified
Conceptual Model.

86
Table 4-14 Summary of hypothesis tests
Hypothesis Path Result
H1 pqualpval S
H2 pqualsat NS
H3 pqualbehint NS
H4 pvalsat S
H5 satbehint S
H6 pvalbehint NS
H7 pvalsatbehint S
H8 pqualpvalsat S
H9 pqualsatbehint PS
H10 pqualpvalbehint PS
H11 sacpval S
H12 priskpval S
H13 facesat S
H14 facesatbehint S
H15 satrep S
H16 repbehint S
H17 satrepbehint S
H18 sattrust NS
H19 reptrust NS
H20 trustbehint NS
H21 sattrustbehint NS
Note:
Results of hypotheses are as follows: S=support, NS=not supported, PS=partial
support
4.5.7 Direct, indirect and total effects on Modified Conceptual Model
The Modified Conceptual Model (Figure 4.1) demonstrates direct and indirect effects
among all eight constructs. Direct and indirect effects are calculated based on all paths
between respective constructs with expected signs (positive) and exhibit strong
statistical significance.

87
The construct of perceived quality has a direct effect on perceived value (pqualpval),
perceived value has a direct effect on satisfaction (pvalsat), and satisfaction has a
direct effect on behavioural intentions (satbehint). The measures of sacrifice and
perceived risk directly influence perceived value (sacpval, priskpval), the measure
of face directly influences satisfaction (facesat) and the measure of reputation directly
influences behavioural intentions (repbehint). There is also a direct influence on
reputation by satisfaction (satrep).
Tests of the statistical significance of indirect effects were based upon Sobel (1982), and
t values and probability values were computed from the interactive website of Preacher
and Leonardelli (2006). There are several indirect effects; for instance, sacrifice,
perceived quality and perceived risk all have an indirect influence through the mediating
effect of perceived value on satisfaction (sacpvalsat, pqualpvalsat,
priskpvalsat). Perceived value and face have an indirect influence on behavioural
intentions through the mediating effect of satisfaction (pvalsatbehint,
facesatbehint). Perceived value and face influence reputation through the mediating
effect of satisfaction (pvalsatrep, facesatrep). Finally, satisfaction has an
indirect effect on behavioural intentions through the mediating effect of reputation
(satrepbehint).
The Modified Conceptual Model permits the evaluation of total effects on the
determination of behavioural intentions, arising from the combination of direct and
indirect effects of measures and constructs (Table 4.15). With respect to the relative
importance of constructs or measures on perceived value, perceived quality has the
strongest influence on perceived value (.796), followed by a negative and moderate
impact by sacrifice (-.414) and a negative weak influence by perceived risk (-.136).
Perceived value has an extremely strong impact on satisfaction (.949) and face has a
weak impact on satisfaction (.193). Satisfaction has a moderate to strong impact on
behavioural intentions (.611) and reputation (.678). Reputation has a weak impact on
behavioural intentions (.199).
There is no indirect effect on perceived value. Perceived quality, sacrifice and perceived
risk all have a significant indirect effect on satisfaction through the mediating effect of
perceived value. Perceived quality has the strongest indirect effect on satisfaction (.755)
(pqualpvalsat), sacrifice has a moderate indirect and negative effect on satisfaction

88
(-.393) (sacpvalsat) and perceived risk has a weak and negative indirect effect on
satisfaction (-.129) (priskpvalsat). There are five indirect effects on reputation;
perceived value has the strongest effect on reputation through the mediating effect of
satisfaction (.643) (pvalsatrep). This is followed by perceived quality, which has a
moderate indirect effect on reputation (.512) (pqualpvalsatrep). Sacrifice has a
weak and negative indirect effect on reputation (-.266) (sacpvalsatrep. Face has a
weak and positive indirect effect on reputation (.131) (facesatrep). Finally,
perceived risk has a weak and negative indirect effect on reputation (-.087)
(priskpvalsatrep). With respect to the relative importance of constructs,
perceived value has the strongest indirect effect on behavioural intentions (.707)
(pvalsatbehint). This is followed by other constructs: perceived quality (.563)
(pqualpvalsatbehint), sacrifice (-.293) (sacpvalsatbehint), face (.144)
(facesatbehint) and satisfaction (.135) (satrepbehint). Perceived risk has a
weak indirect and negative effect on behavioural intentions (-0.096)
(priskpvalsatbehint). There is only one total effect in this Modified Conceptual
Model, which is calculated based on the direct effect of satisfaction on behavioural
intentions (satbehint) and the indirect effect of satisfaction on behavioural intentions
through the mediating effect of reputation (satrepbehint). The standardised
coefficient of the total effect is .745, which indicates a strong total effect on behavioural
intentions.

89
Table 4-15 Summary of direct, indirect and total effects by construct
Constructs pval sat rep behint
Direct Indirect Total Direct Indirect Total Direct Indirect Total Direct indirect Total
face na na na 0.193 na 0.193 na 0.131 0.131 na 0.144 0.144
sac -0.414 na -0.414 na -0.393 -0.393 na -0.266 -0.266 na -0.293 -0.293
prisk -0.136 na -0.136 na -0.129 -0.129 na -0.087 -0.087 na -0.096 -0.096
pqual 0.796 na 0.796 na 0.755 0.755 na 0.512 0.512 na 0.563 0.563
pval na na na 0.949 na 0.949 na 0.643 0.643 na 0.707 0.707
sat na na na na na na 0.678 na 0.678 0.611 0.135 0.745
rep na na na na na na na na na 0.199 na 0.199
behint na na na na na na na na na na na na
According to the total effect of all constructs (Table 4.15) on behavioural intentions, the biggest effect can be identified as satisfaction
(.745). Perceived value has the second biggest effect on behavioural intentions with the coefficient .707. Perceived quality has a moderate
total effect on behavioural intentions, which is .563, followed by a negative effect, which are sacrifice (-.293), reputation (.199) and face
(.144). Perceived risk has the weakest but negative effect on behavioural intentions which is -.096.
90
Chapter 5 Discussion
5.1 Introduction
There are two main parts in this section. Section 5.2 is the summary of the study, which
includes an overall review of the study and theoretical support for all the hypotheses.
Section 5.3 gives the theoretical implications and the practical implications.
5.2 Summary of the Study
The study aimed to determine the factors that influence customer behavioural intentions
and their interrelationship in the restaurant industry in PR China. The targeted
restaurants were classified as full-service restaurants and the targeted customers were
middle-class consumers.
Sample characteristics are analysed using frequency distributions (Table 4.1). Gender
groups are fairly evenly represented with 50.5% females. The model age group is 26-35
years (31.9%) with 60.5% in the range 26-45 years. With respect to level of education,
37.8% of respondents had attended senior high school, 23.8% had attended college and
30.0% had achieved an undergraduate or postgraduate degree. In terms of employment
status, the majority of respondents (77.5%) were employed. In terms of employment
types, 39.0% were in professional or managerial occupations and 48.6% in supervisory
or skilled posts. With respect to monthly income, the most frequent group is between
1001 and 5000 Yuan per month (54.5%) while the smallest group is “more than 10000
Yuan” per month (1.1%).
In the context of restaurant visit behaviour (Appendix 4), the frequencies of visiting the
target restaurant and visiting the restaurants of a similar type were similar. Diners
typically visited restaurants of a similar type to the target restaurant once per month
(30.3%) and 28.8% visited 2-3 times per month. Most diners travelled to the restaurants
using their own transport (44.8%) while 32.7% used public transport. The most popular
type of dining groups involved work colleagues (35.6%), followed by groups of friends
(28.4%) and then family (27.2%). Typically, diners (35.2%) spent 301-500 Yuan on
their visit and 27.6% of diners spent more than 500 Yuan.
91
This study also aimed to model the determinants of restaurants’ consumers’ behavioural
intentions using a structural equation modelling (SEM) approach. The Conceptual
Model included perceived quality, perceived value, satisfaction, sacrifice, perceived risk,
face, reputation, trust and behavioural intentions. Through SEM analysis, the model was
revised, with three paths and one factor, namely, trust, discarded. With the significances
noted in the paths and the higher explanatory power of the Modified Conceptual Model
(RMSEA=0.058, satisfy goodness of fit, strong significant coefficient and all constructs
have correct signs.), the model proves itself applicable to full-service restaurants.
A total of 21 hypotheses were proposed based on the extensive review of the literature.
A self-complete survey was employed to collect data. The quality of the measures for
study constructs was assessed by examining the constructs’ reliability (Cronbach’s
alpha). Standardised coefficients between all the constructs through SEM analysis were
used to test the hypotheses. Direct, indirect and total effects were used to identify the
interrelationships between the constructs. The findings support 14 hypotheses; three are
partially supported and four rejected.
According to the research result, H1 (Consumer perceived quality (pqual) has a direct
and positive effect on perceived value (pval)) is fully supported. The standardised
coefficient for H1 is .796, which indicates a strong significant direct effect on perceived
value by perceived quality. A positive effect is also confirmed in restaurant customers’
loyalty research in the United States by Kim and Han (2008), (.68); the Q-V-S-L
research into health care providers in South Korea by Choi et al. (2002), (.67); the
customer satisfaction research into the jackets and sunglasses market in Sweden by
Agarwal and Teas (2004) (.46, .43 respectively); the relationship among perceived
quality, perceived risk and perceived value research towards students mobile users in
Slovenia by Snoj et al. (2004) (.316); a study of customer online-shopping behaviour in
the United States by Chang and Wang (2010) (.74); and the Q-V-S-L four models
comparison research into six industries in the United States by Cronin et al. (2000)
(Research Model.64, Value Model .46, Satisfaction Model .64, Indirect Model .70),
though their results of connections are a little weaker.
The standardised coefficient of H2 (Consumer perceived quality (pqual) has a direct and
positive effect on satisfaction (sat)) is not significant in this study because the negative
92
coefficient of perceived quality to satisfaction (Table 4.12) means there is no causal
relationship between perceived quality and satisfaction in this study. This is also
confirmed by research into European consumers’ behavioural intentions towards food
purchasing for four food products in six countries by Ness et al. (2009). The rejection of
H2 also indicates there is a partial support for H9 (Consumer perceived quality (pqual)
has an indirect effect on behavioural intentions (behint) through the mediating effect of
satisfaction (sat) (pqualsatbehint)).
The standardised coefficient for H3 (Consumer perceived quality (pqual) has a direct
and positive effect on behavioural intentions (behint)) is .023. The reason for rejecting
H3 is that standardised coefficient is not significant at the P<0.001 level. A similar result
was found by the research into ‘service quality, customer satisfaction and behavioural
intentions towards restaurants in the United States’ by Olorunniwo et al. (2006) (.10).
Their result is slightly weak, but it is significant at the P<0.05 level, so the hypothesis is
accepted in their research.
The widely accepted relationship between perceived value and satisfaction is confirmed
(H4 Consumer perceived value (pval) has a direct and positive effect on satisfaction
(sat)) by a strong significant standardised coefficient (.949). The direct effect on
satisfaction by perceived value is also consistent with restaurant customers’ loyalty
research in the United States by Kim and Han (2008) (.66); the research into European
consumers’ behavioural intentions towards food purchasing for four food products in six
countries by Ness et al. (2009) (.548 to .722); the Q-V-S-L research into health care
providers in South Korea by Choi et al. (2002) (.25); the research into the effect of
customer perceived value on online shopping behaviour in the United States by Chang
and Wang (2010) (.33); the Q-V-S-L models comparison research into six industries in
the United States by Cronin et al. (2000) (Research Model .42, Value Model (path is
specified satpval which is identified as having a different causality from the
coefficient .45), Satisfaction Model (.59), Indirect Model (.65)); and the research
undertaken among customers of an audit firm to determine the role of value in the UK
by Caruana et al. (2000) (.29).
The widely accepted theory that there is a direct link between satisfaction and
behavioural intentions (H5) is supported in this study too, and is consistent with the
93
restaurant customers’ loyalty research in the United States by Kim and Han (2008) (.61),
customer satisfaction with mortgage credit companies in Denmark by Høst and
Andersen (2004) (.44), the Q-V-S-L research into health care providers in South Korea
by Choi et al. (2002) (.56); research into the effect of customer perceived value on
online shopping behaviour in the United States by Chang and Wang (2010) (.84), the
research comparing new and experienced customers’ loyalty towards night-train
companies in Europe by Brunner et al. (2007) (new customer .71, experienced
customer .53), the Q-V-S-L models comparison research into six industries in the United
States by Cronin et al. (2000) (Research Model (.41), Value Model (not specified),
Satisfaction Model (.94), Indirect Model (.43)), the perceived risk in satisfaction-loyalty
relationship research in a food context in Vietnam by Tuu et al. (2011) (.45), the
research into consumer behavioural intentions at a museum and a theme park in Spain
by Bigné et al. (2008) (Museum .31, Theme Park .38), and the service quality and
behavioural intentions research at a family-style restaurant in the United States by
Swanson and Davis (2003).
H6 (Consumer perceived value (pval) has a direct and positive effect on behavioural
intentions (behint)) has a negative standard coefficient so it is rejected in this study. This
is supported by research into European consumers’ behavioural intentions towards food
purchasing for four food products in six countries by Ness et al. (2009) in the case of
Switzerland. However, this result is inconsistent with the restaurant customers’ loyalty
research in the United States by Kim and Han (2008) (.65), who found a significant
direct effect on behavioural intentions by perceived value. It still provides theoretical
support for H7 in this study, which predicts the indirect effect on behavioural intention
(behint) through satisfaction (sat) by perceived value (pval) (pvalsatbehint). The
result for H7 is also supported by research into the effect of customer perceived value
on online shopping behaviour in the United States by Chang and Wang (2010), who
found the indirect effect on loyalty through the mediating effect of perceived value by
perceived value to be .27. The non significant standard coefficient of perceived value to
behavioural intention (pvalbehint) also indicates that H10 (Consumer perceived
quality (pqual) has an indirect effect on behavioural intentions (behint) through the
mediating effect of perceived value (pval) (pqualpvalbehint)) is partially supported.
H8 (Consumer perceived quality (pqual) has an indirect effect on satisfaction (sat)

94
through the mediating effect of perceived value (pval)) is fully supported in this study. It
is also supported by the Q-V-S-L research into health care providers in South Korea by
Choi et al. (2002), whose result calculated the total effect among service quality, value
and satisfaction and found a significant indirect effect on satisfaction through value by
quality. Research into the effect of customer perceived value on online shopping
behaviour in the United States by Chang and Wang (2010) found the indirect effect on
satisfaction through the mediating effect of perceived value by service quality to be .24,
which is consistent with the research undertaken among customers of an audit firm to
determine the role of value in the UK by Caruana et al. (2000), who showed the effect
of quality on satisfaction is not just direct but is also moderated by value.
The result of H11 (Sacrifice (sac) has a direct and negative effect on perceived value
(pval)) (-.414) provides support for the Q-V-S-L model comparison research into six
industries in the United States by Cronin et al. (2000) and provides support for Zeithaml
(1988), who identified how anything that reduces the monetary sacrifice will increase
the perceived value of the product. It also presents a stronger impact compared with the
store environment research by Baker et al. (2002) (-.17).
With respect to H12 (Perceived risk (prisk) has a direct and negative effect on perceived
value (pval)) (-.136), the result provides additional support for the research into the
relationship among perceived quality, perceived risk and perceived value regarding
student users of mobile phones in Slovenia by Snoj et al. (2004) (-.738), the wrist-
watches and calculators market in the United States by Agarwal and Teas (2001) (-.19, -
.23), and the jackets and sunglasses market in Sweden by Teas and Agarwal (2000) (-.22,
-.10).
Regarding H13 (Face (face) has a direct effect on consumer satisfaction (sat)) and H14
(Face (face) has a direct effect on consumer satisfaction (sat)), they are both supported
in this study. The cultural factor face is fairly new in the Q-V-S-L model and has not
been studied previously. However, theoretical support can still be found in the customer
loyalty research field such as the research into Chinese cultural factors regarding
Chinese diners in Mainland China, Hong Kong and Taiwan by Hoare and Butcher
(2008). They found face has a significant direct effect on customer satisfaction (.22); it
has no direct relationship with customer loyalty but has an indirect effect on customer
95
loyalty through the mediating effect of satisfaction.
With respect to H15 (Consumer satisfaction (sat) has a direct effect on reputation (rep))
(.678), this study provides a strong coefficient to support Anderson and Sullivan (1993),
who claimed that “high customer satisfaction develops a positive reputation”.
With respect to H16 (Reputation has a direct effect on behavioural intentions (behint))
(.199), this hypothesis is supported with a weak standard coefficient, which provides
theoretical evidence to support customer loyalty and service recommendation in the
banking industry research in North America by Bontis et al. (2007). Based on the
findings of that research, it is concluded that reputation serves as a partial mediator of
customer satisfaction and loyalty, which is supported by H17 (Consumer satisfaction
(sat) has an indirect effect on behavioural intentions (behint) through the mediating
effect of reputation (rep) (satrepbehint)) in this study.
Regarding H18 (Consumer satisfaction (sat) has a direct effect on trust (trust)), the
hypothesis is rejected in this study due to the result of factor analysis that trust loads on
the single factor with reputation and face, so it is deleted from the Modified Conceptual
Model, but it has a significant coefficient in the Conceptual Model (.484) (Table 4.12).
This is also supported by research into the building of trust between logistic users and
third-party logistics providers in China by Tian et al. (2008), the full-service restaurant
consumer behaviour research in the United States by Jani and Han (2011), and the
perceived risk of online buying research in Spain by Martín and Camarero (2009).
Similar to H18, H19 (Reputation (rep) has a direct effect on trust (trust)) (.386) is
rejected in this study because trust is deleted from the Modified Conceptual Model, but
actually, the result of SEM found a significant effect on trust by reputation. This is also
supported by research into the building of trust between logistic users and third-party
logistics providers in China by Tian et al. (2008) and research into the perceived risk of
online buying in Spain by Martín and Camarero (2009).
Regarding H20 (Trust (trust) has a direct effect on behavioural intentions (behint)), this
hypothesis is rejected because trust is deleted from the Modified Conceptual Model; the
coefficient is negative and not significant in the SEM result. It also provides partial

96
support for H21 (Satisfaction (sat) has an indirect effect on behavioural intentions
(behint) through the mediating effect of trust (trust) (sattrustbehint)). H20 is
consistent with research into the building of trust between logistic users and third-party
logistics providers in China by Tian et al. (2008), but inconsistent with research into the
restaurant customers’ loyalty in the United States by Kim and Han (2008), which
reported the significant coefficient between trust and behavioural intentions.
5.3 Implications
The results from this study offer both theoretical and practical implications.
Theoretically, four implications are derived from the study result. First, perceived value
in full-service restaurants is most strongly influenced by perceived quality as compared
to being influenced by sacrifice and perceived risk. Second, satisfaction is strongly and
directly influenced by perceived value and weakly influenced by the cultural factor face.
It also has an indirect effect through the mediating effect of perceived value by
perceived quality, sacrifice and perceived risk. There is a non-significant direct
influence of perceived quality on satisfaction in this study, which is different compared
with research into customer perceived value on online shopping behaviour in the United
States by Chang and Wang (2010) (.65), the Q-V-S-L models comparison research into
six industries in the United States by Cronin et al. (2000) (Research Model.31, Value
Model (not specified), Satisfaction Model (.36), Indirect Model (not specified)),
research into restaurant consumer satisfaction in North Spain by Iglesias and Guillén
(2004) (.509), and the research undertaken among customers of an audit firm to
determine the role of value in the UK by Caruana et al. (2000) (.29). Third, behavioural
intentions in full-service restaurants in China only has direct effects on satisfaction and
reputation, and its influence on satisfaction is stronger than on reputation. Behavioural
intentions has indirect effects through the mediating effect of satisfaction by perceived
quality, perceived value and face, and it has indirect effects through the mediating effect
of reputation by satisfaction. There is no causal relation between perceived quality and
behavioural intentions in this study; the result is different compared to the Q-V-S-L
model research into health care providers in South Korea by Choi et al. (2002) (.18
weak but significant), and the Q-V-S-L models comparison research into six industries
in the United States by Cronin et al. (2000) (Research Model.24, Value Model (not
specified), the Satisfaction Model (not specified), Indirect Model (not specified)). There
97
is no direct effect on behavioural intentions by perceived value in this study, which is
different compared with the Q-V-S-L research into health care providers in South Korea
by Choi et al. (2002) (.17); the research into ‘restaurant customers’ loyalty in the United
States’ by Kim and Han (2008) (.65); the research into the effect of customer perceived
value on online shopping behaviour in the United States by Chang and Wang (2010)
(.34); and the Q-V-S-L model comparison research into six industries in the United
States by Cronin et al. (2000) (Research Model (.47), Value Model (.94), Satisfaction
Model (not specified), Indirect Model (.64)). Finally, the result of factor analysis
indicated trust and reputation, and trust and face load on a single factor, so trust is
deleted from the Modified Conceptual Model in this study.
Findings from this study provide several practical implications for full-service
restaurateurs in China. The significant influence of perceived quality on perceived value
(.796) (Figure 4.1) implies restaurateurs should direct their attention to the meal quality
and the service quality they provide. In the case of perceived quality in general, all
measures are strongly associated with the construct (Table 4.13), which suggests that all
the measures require attention to enhance perceived value and indirectly encourage
satisfaction and consumer behavioural intentions. However, the three strongest
measures are associated with quality of food compared to customers’ expectations,
quality of service compared to customers’ expectations and freshness of food. This
implication sheds light on the method of providing food in restaurants in China, in that
food should be fresh and be of a high standard to meet customers’ expectations. Full-
service restaurants in China provide service through staff interactions that should be
friendly, attentive, genuine and efficient while simultaneously meeting customers’ needs
and expectations.
There is a moderate and negative effect of sacrifice on perceived value (-.414) (Figure
4.1), which indicates sacrifice is an essential factor restaurateurs need to consider when
establishing business strategies. All measures are strongly associated with sacrifice
(Table 4.13), which suggests that all measures require attention to reduce sacrifice and
enhance perceived value and indirectly enhance satisfaction and consumer behavioural
intentions. The most important measures that should be noticed by restaurateurs are the
enjoyment and pleasure customers experience, the effort a customer makes to get the
quality of service they expect and the price customers pay.

98
There is a weak and negative effect of perceived risk on perceived value (-.136) (Figure
4.1), which means perceived risk is not very strongly associated with perceived value
compared with perceived quality and sacrifice but the importance of perceived risk is
non-ignorable. All measures for perceived risk are strongly associated with the construct
(Table 4.13), which suggests that all the measures need attention to reduce perceived
risk and enhance perceived value and indirectly to encourage satisfaction and
behavioural intentions. The significant influence of the three strongest measures on
perceived risk implies restaurateurs should direct their attention to the customers’
feelings about their choice of restaurant and their experience about the overall value of
the visit, and protect customers’ face in front of their dining companions.
The direct effect of perceived value on satisfaction has the strongest coefficient (.949)
(Figure 4.1) when compared to other direct effects in this study. The significant
influence of perceived value on satisfaction suggests restaurateurs should focus both on
the value of the meals and the value of the service customers experience to enhance the
overall value they receive and encourage consumer behavioural intentions. All measures
for perceived value are strongly associated with the construct (Table 4.13), especially
the overall value provided by the restaurant, the value of the service compared to similar
restaurants and the value of meals compared to similar restaurants. According to the
result, restaurateurs should not only pay attention to their own business, but also need to
observe closely the competitors’ business, keep information updated and enhance their
competitive power. In creating a favourable perceived value, restaurateurs can use
comparative marketing strategies that will lead customers to perceive the restaurant’s
food prices as reasonable and appropriate compared to those of other restaurants.
Compared to the coefficient between perceived value on satisfaction, face on
satisfaction has a weak direct effect (.193) (Figure 4.1). As a construct that is newly
added to the Q-V-S-L model, it is excellent to find that face has a significant direct
effect on satisfaction and an indirect effect on customer behavioural intentions. All
measures are strongly associated with face (Table 4.13), which suggests that all
measures require attention to enhance customer satisfaction and indirectly enhance
customer behavioural intentions. The significant influence of the three strongest
measures with face implies restaurateurs should direct their attention to the customers’
99
feeling of gaining face by receiving close attendance from restaurant personnel as a host,
try to meet customers’ expectations of restaurant personnel to treat them with respect in
front of their dining companions and, finally, always remind their employees of the
importance of saving customers’ face under any circumstances.
The significant influence of satisfaction on behavioural intentions (.611) (Figure 4.1)
suggests that restaurateurs should pay attention to customer satisfaction by improving
the meals and the service customers experience to encourage customer behavioural
intentions and enhance customer loyalty. Satisfied customers will repeat their purchases,
they will be more loyal to the firm and, moreover, they will become the most efficient
and effective communications resource of the firm by generating favourable
recommendations and positive word-of-mouth. All measures are strongly associated
with satisfaction (Table 4.13), which suggests that all measures require attention to
encourage customer behavioural intentions. The most important measures that should be
noticed by restaurateurs are customer overall satisfaction with meals, customer
satisfaction with their choice of the particular restaurant and their satisfaction with the
atmosphere. Increasing customer satisfaction (e.g., high quality food, menus with a
wide range of choices, a comfortable dining environment, reliable service, employee
friendliness, etc.) contributes to encouraging customer behavioural intentions directly
and indirectly through reputation.
With respect to reputation, all measures indicate a strong association. The most
important aspects of reputation in descending order of importance are “the reason for
visiting the restaurant is because it has a good reputation”, “comparison with restaurants
of similar level”, “the restaurant has a better reputation and reputation is an important
reason when choosing a restaurant”. The full mediation of reputation on satisfaction on
behavioural intentions implies restaurateurs, by enhancing customer satisfaction, can
create a sense of positive word-of-mouth, strengthen customers’ confidence and reduce
risk perceptions with respect to the restaurants’ service and meals, all of which are
elements of reputation.
Behavioural intentions are associated, in descending order of importance, with
“choosing this restaurant even if others are cheaper”, “visiting this restaurant frequently”
and “encouraging friends and relatives to eat in this restaurant”. The enhancement of
100
behavioural intentions can be attained directly through satisfaction and indirectly
through restaurant reputation. Consequently, upon enhancing customer satisfaction and
reputation, the restaurateur is likely to encourage higher customer behavioural
intentions of both revisiting the restaurant and recommending the restaurant to potential
customers.
101
Chapter 6 Conclusion
6.1 Introduction
The aim of this chapter is to present concluding comments on the study. The aim of the
study was to develop a structural equation model (SEM) of customers’ behavioural
intentions towards restaurant patronage in China. The study was set in the economic
context of the Chinese open door policy of 1978 and the emergence of a service sector
and middle-class consumers with higher disposable incomes.
This thesis conceptualised and investigated the relationship between determinants of
customer loyalty in the Chinese restaurant industry. The conceptual SEM was developed
from the existing literature on customer loyalty and includes constructs of perceived
quality, sacrifice, perceived risk, perceived value, the Chinese cultural value of face,
satisfaction, reputation, trust and behavioural intentions. A set of hypotheses concerning
direct and indirect links between constructs was derived.
The chapter begins with a re-statement of the research aims and objectives (Section 6.2)
and proceeds to provide a summary of the research design (Section 6.3). Section 6.4
provides a summary of the key results. This is followed by a discussion of the
contribution of the study (Section 6.5). Section 6.6 presents a re-statement of the
implications of the study, and the limitations of the study are presented in Section 6.7.
Finally, Section 6.8 provides suggestions for future research.
6.2 Restatement of Aims and Objectives
The aim of the study was to develop a structural equation model (SEM) of customers’
behavioural intentions towards restaurant patronage in China. Constructs of the model
included perceived quality, perceived value, sacrifice, perceived risk, face, satisfaction,
reputation trust and behavioural intention. By conducting this research, seven main
research questions were investigated: to identify the determinants of customer loyalty in
the context of Chinese culture from a review of the existing literature and formulate
hypotheses concerning the interrelationship between the determinants of customer
loyalty from a review of the existing literature; to develop a structural model to explain

102
the interrelationships between the constructs, develop scales for each of the constructs
in the structural model and evaluate them in terms of reliability and validity; to estimate
measurement models for each of the constructs in the model and evaluate them in terms
of measures of fit and interpretation; to estimate a structural equation model for the
determination of customer loyalty and evaluate it in terms of measures of fit and
interpretation; to test hypotheses concerning the interrelationships between constructs;
and, finally, to estimate the direct and indirect effects of relevant constructs on
behavioural intentions.
6.3 Summary of the Research Design
The rapid economic growth of China since the beginning of economic reform in 1978
has encouraged the formation of rural enterprises and private businesses, liberalised
foreign trade and investment, and relaxed state control over some prices, and has led to
investment in industrial production and the education of the Chinese workforce (Hu and
Khan, 1997). As mentioned in section 1.2.2, China's size, the abundance of its resources,
and its having about 20% of the world's population living within its borders for the last
two centuries, means that its role in the world economy will continue to grow. The
expanding middle class in China is indicative of the country’s economic success and is
extremely important to both local and international companies due to their significant
purchasing power. Expenditure on food is the largest component of household
expenditure (National Bureau of Statistics of China, 2010) and dining out with families
and friends has become more popular as people’s disposable income has increased.
Consequently, the restaurant industry is one of the most dynamic economic sectors in
China and a major source of financial activity; thus, creating customer loyalty in this
huge potential market is extremely important.
The Conceptual Model was tested using the results of a customer self-administered
survey held in selected full-service restaurants in Wuhan, which is the fourth biggest
city in PR China. Non-probability sampling was used in this study. As discussed in
subsection 3.2.2, the survey included 68 questions, which were grouped into three
sections. The questionnaire was organised in three thematic sections (Appendix 1). The
first section was concerned with customer behaviour with respect to restaurant visits to
restaurants of a similar quality and to the target restaurant. It employed nominal
measures of frequency of visiting in a six-month period, the method of travel, the social
103
context of the visit and expenditure on the meal. The second section was concerned with
consumer attitudes to their experience in the target restaurants. It consisted of nine
constructs concerned with perceived quality, perceived value, satisfaction, behavioural
intention, sacrifice, perceived risk, face, reputation and trust (Appendix 2). A five-point
Likert scale was used in this part as a scoring method (1=Very low, 5=Very high).
Finally, the third section was concerned with the socio-demographic characteristics of
the respondents. This section included nominal measures of gender, age, education level,
occupation and personal income. The survey produced 489 valid questionnaires.
For the statistical analysis of the primary data, descriptive analysis was used initially
(frequencies, percentages). Factor analysis, confirmatory factor analysis (CFA), and
structural equation modelling were used to test the Conceptual Model. Hypothesis
testing was employed in the analysis and the presentation of the findings of this study.
6.3 Summary of Findings
Customer loyalty is defined in terms of behavioural intentions. The determinants of
customer loyalty are defined as perceived quality, perceived value, sacrifice, perceived
risk, face, satisfaction, reputation trust and behavioural intentions. Measurement scales
of constructs satisfied the minimum requirements of Cronbach’s alpha coefficient. The
measurement models of the SEM constructs were evaluated using confirmatory factor
analysis (CFA). They were accepted on the basis of measures of fit, and the statistical
significance of coefficients and signs. Preliminary analysis led to the modification of the
conceptual SEM. The modified SEM was accepted on the basis of measures of fit,
statistical significance and signs of coefficients, composite reliability, variance extracted
and squared multiple correlation coefficients. Tests of hypotheses and tests for
mediation provided the analysis and decomposition of total effects on dependent
constructs. The study establishes the relevance of traditional loyalty constructs, such as
perceived quality, sacrifice, perceived risk, perceived value, satisfaction and reputation,
and confirms the relevance of the Chinese cultural value of face. Total effect analysis
reveals the importance of perceived quality, perceived value and satisfaction for
customers’ behavioural intentions with associated benefits to commercial marketers in
the hospitality sector. The biggest effect on perceived value is by perceived quality,
followed by sacrifice, and finally. perceived risk. The greatest effect on satisfaction is
by perceived value while the second greatest effect is by perceived quality, followed by

104
sacrifice. Face is the fourth biggest effect on satisfaction and, finally, perceived risk.
The biggest effect on reputation is satisfaction while the second biggest effect on
reputation is perceived value, then perceived quality, followed by sacrifice and face, and
finally, the negative effect of perceived risk. The biggest effect on behavioural
intentions is by satisfaction, and second biggest effect is by perceived value. Perceived
quality has the third biggest effect on behavioural intentions followed by sacrifice and
reputation. The cultural factor face has little effect on behavioural intentions compared
with other factors and perceived risk has the smallest but negative effect.
6.4 Theoretical Contribution of the Study
The study has achieved the broad objective of developing a structural equation model of
the determinants of restaurant customers’ behavioural intentions. The model confirms
the relevance of the Q-V-S-L model in this context and, in particular, that of the
constructs of perceived quality, perceived value and satisfaction. Furthermore, the
model also establishes the relevance of sacrifice, perceived risk and reputation in a
restaurant context.
However, the most important contribution made by this study is that the cultural factor
face has been added to and tested in the Q-V-S-L model. The Q-V-S-L model was
introduced and developed in a Western cultural background and not many scholars have
applied it to the Chinese restaurant sector. Chinese culture is particularly characterised
by a strong desire to gain or protect face (Hoare and Butcher, 2008) and face is the
dominating characteristic in Chinese business relationships (Gilbert and Tsao, 2000).
Face has attracted many scholars’ research interests (Gilbert and Tsao, 2000; Hoare and
Butcher, 2008) but none of them have tested face as a construct in the Q-V-S-L model
and using a structural equation model (SEM) approach. It was excellent to see face has a
significant result in the Conceptual Model in this study, and it indirectly affects
behavioural intentions in the Chinese restaurant sector.
This study filled the research gap suggested by Snoj et al. (2004) that researchers should
expand the model with more indicators on perceived value and perhaps study
relationships between perceived value, intentions to buy, customer satisfaction and their
loyalty. It also considered the widely accepted theory that there is a direct and negative
effect on perceived value by perceived risk (Agarwal and Teas, 2004; Snoj et al., 2004;

105
Teas and Agarwal, 2000); thus, perceived risk was added to the Conceptual Model and
achieved a significant result.
There are four implications derived from the study result. First, perceived value in full-
service restaurants is most strongly influenced by perceived quality as compared to the
influence of sacrifice and perceived risk. Second, satisfaction is strongly and directly
influenced by perceived value and weakly influenced by the cultural factor face. It also
has an indirect effect through the mediating effect of perceived value by perceived
quality, sacrifice and perceived risk. There is a non-significant direct influence of
perceived quality on satisfaction in this study, which is different compared with other
studies (Caruana et al., 2000; Chang and Wang, 2010; Cronin et al., 2000; Iglesias and
Guillén, 2004). Third, behavioural intentions in full-service restaurants in China only
has direct effects on satisfaction and reputation, and the influence on satisfaction is
stronger than on reputation. Behavioural intentions has indirect effects through the
mediating effect of satisfaction by perceived quality, perceived value and face, and it
has indirect effects through the mediating effect of reputation by satisfaction. There is
no causal relation between perceived quality and behavioural intentions in this study;
the result is different compared to other scholar’s studies (Choi et al., 2002; Cronin et al.
(2000). There is no direct effect on behavioural intentions by perceived value in this
study, which is different compared with the studies by Choi et al. (2002), Kim and Han
(2008), Chang and Wang (2010) and Cronin et al. (2000). Finally, the result of the factor
analysis indicated trust and reputation and trust and face load on a single factor, so trust
is deleted from the Modified Conceptual Model in this study.
It is confirmed by many scholars that middle-class consumers a have huge potential
purchasing power and their growing disposable income will transform the Chinese
consumer market (Farrell et al., 2006; Hodgson, 2007). The emergence of middle-class
consumers in China has brought big opportunities for companies who are selling mass-
consumer goods and services. Consumer loyalty is extremely important for the
consumer service sector to survive in this competitive service market. This study
investigated the determinants that affect customer behavioural intentions in China and
addressed the issues which most significantly affect perceived value, satisfaction and
behavioural intentions; this provided valuable practical implications for restaurateurs.
106
6.5 Managerial Contribution of the Study
From the practical point of view, the research result suggests that satisfaction is the most
important factor that has a significant effect on behavioural intentions. This means that
restaurateurs should pay attention to customer satisfaction by improving the meals and
the service customers experience to encourage customer behavioural intentions and
enhance customer loyalty. According to the results of the study, the second most
important factor that affects behavioural intentions is perceived value. In creating a
favourable perceived value, restaurateurs can use comparative marketing strategies that
will lead customers to perceive the restaurant’s food prices as reasonable and
appropriate compared to those of other restaurants. The third most important factor
which has a significant effect on behavioural intentions is perceived quality. This
implication sheds light on the means of providing food in restaurants in China; food
should be fresh and of a high standard to meet customers’ expectations. Full-service
restaurants in China provide service through staff interactions that should be friendly,
attentive, genuine and efficient while simultaneously meeting customers’ needs and
expectations.
The significant influence of perceived quality on perceived value implies restaurateurs
should direct their attention to the meal quality and the service quality they provide. In
general, all measures are strongly associated with the construct for perceived quality,
which suggests that all the measures require attention to enhance perceived value and
indirectly encourage satisfaction and consumer behavioural intentions. The implication
of the three strongest measures identified regarding the provision of food in restaurants
in China is that food should be fresh and of a high standard to meet customers’
expectations, and the service through staff interactions should be as recommended
above.
The moderate and negative effect of sacrifice on perceived value suggests that all
measures require attention to reduce sacrifice, enhance perceived value, and indirectly
enhance satisfaction and consumer behavioural intentions. The most important measures
that should be noticed by restaurateurs are the enjoyment and pleasure customers
experience, the effort the customer makes to get the quality of service they expect and
107
the price customers pay.
There is a weak and negative effect of perceived risk on perceived value, which
suggests that all the measures need attention to reduce perceived risk and enhance
perceived value and indirectly to encourage satisfaction and behavioural intentions. The
significant influence of the three strongest measures with perceived risk implies
restaurateurs should direct their attention to the customers’ feelings about their choice of
the restaurants, their experience of the overall value of the visit and protecting
customer’s face in front of their dining companions.
The significant influence of perceived value on satisfaction suggests restaurateurs
should focus both on the value of the meals and the value of the service customers
experience to enhance the overall value they receive and encourage consumer
behavioural intentions. The most important issue will be the overall value provided by
the restaurant, the value of the service compared to similar restaurants and the value of
meals compared to similar restaurants. According to the research result, restaurateurs
should pay attention not only to their own business but also need to observe closely
competitors’ businesses, keep information updated and enhance their competitive power.
In creating a favourable perceived value, restaurateurs can use comparative marketing
strategies that will lead customers to perceive the restaurant’s food prices as reasonable
and appropriate compared to those of other restaurants.
As a new construct added to the Q-V-S-L model, it is excellent to find that face has a
significant direct effect on satisfaction and an indirect effect on customer behavioural
intentions. The significant influence of the three strongest measures regarding face
implies restaurateurs should direct their attention to the customers’ feeling of gaining
face by receiving close attendance from restaurant personnel as a host, try to meet
customers’ expectations of restaurant personnel treating them with respect in front of
their dining companions and, finally, always remind their employees of the importance
of saving customers’ face under any circumstances.
The significant influence of satisfaction on behavioural intentions identified in the result
suggests that restaurateurs should pay attention to customer satisfaction by improving
the meals and the service customers experience to encourage customer behavioural

108
intentions and enhance customer loyalty. Satisfied customers will repeat their purchases,
they will be more loyal to the firm and, moreover, they will become the most efficient
and effective communications resource of the firm by generating favourable
recommendations and positive word-of-mouth. The most important measures that
should be noticed by restaurateurs are customer overall satisfaction with meals,
customer satisfaction with their choice of the particular restaurant and their satisfaction
with the atmosphere. Increasing customer satisfaction (e.g., high quality food, menus
with wide range of choices, comfortable dining environment, reliable service, employee
friendliness, etc) contributes to encouraging customer behavioural intentions directly
and indirectly through reputation.
The most important aspects of reputation in descending order of importance are “reason
for visiting the restaurant is because it has a good reputation”, “comparison with
restaurants of a similar level”, “the restaurant has a better reputation and reputation is an
important reason when choosing a restaurant”. The full mediation of reputation on
satisfaction on behavioural intentions implies restaurateurs, by enhancing customer
satisfaction, can create a sense of positive word-of-mouth, strengthen customers’
confidence and reduce risk perceptions with respect to the restaurant’s service and meals,
all of which are elements of reputation.
Behavioural intentions are associated with, in descending order of importance,
“choosing this restaurant even if others are cheaper”, “visiting this restaurant frequently”
and “encouraging friends and relatives to eat in this restaurant”. The enhancement of
behavioural intentions can be attained directly through satisfaction and indirectly
through restaurant reputation. Consequently, upon enhancing customer satisfaction and
reputation, the restaurateur is likely to encourage higher customer behavioural
intentions of both revisiting the restaurant and recommending the restaurant to potential
customers.
6.6 Limitations of the Study
There are several limitations of this study that should be considered when interpreting
its findings. First, although the sample of respondents used in this study was adequate

109
for the purpose of this study, it cannot be considered representative of the general
population. It may have a regional limitation which limits the generalisability of the
result because the sample was adopted from restaurants that were all located in the same
city in China.
Second, this survey was conducted with restaurant customers in China. However,
different countries have different cultures that lead to dissimilar consumer patterns; in
addition, while this study considered general customer restaurant patronage behaviour,
it is likely that consumers’ behavioural intentions will vary in different industry
categories. Therefore the results cannot be applied directly to other countries or
industries.
Third, the survey participants in this study completed the questionnaire based on their
dining experiences in a full-service restaurant. Thus, the current study findings may not
be generalized to limited-service segments of the restaurant industry, such as take-away
shops or quick-service.
The final limitation is associated with the sample size of this study. In terms of
obtaining the most appropriate result of SEM testing, every single measure in the survey
should at least have ten valid questionnaires and when the number of factors is larger
than six, the sample size requirements may exceed 500 (Hair et al., 2006, p.744). This
survey has 56 measurements in total for all nine constructs so the suggested sample size
will be 560, but the number of valid questionnaires is 489, which, although a good
sample size, does not meet the suggested sample size. This is also the reason TLI and
CFI values are slightly low. Future studies should adhere to the suggested rule to obtain
the most appropriate result.
6.7 Suggestions for Further Research
Several recommendations for future marketing and consumer behavioural intentions
research resulted from this study:
First, future studies could extend geographical coverage within China as this study may
have a regional limitation which limits the generalisability of the result due to the

110
samples being adopted from restaurants located in just one city in China.
Second, the results cannot be applied directly to other countries or industries because
this study examined particularly in full-service restaurants against the background of
Chinese culture. Therefore, future research should address these variations such as
testing the Modified Conceptual Model in another cultural background or in industries
other than the full-service restaurant industry in China.
Third, future studies could test the applicability to other types of restaurant. Current
study findings may not be generalised to limited-service segments of the restaurant
industry, such as take-away shops or quick-service. Future studies should test the
Modified Conceptual Model in other restaurant segments.
Fourth, other cultural factors, such as “guanxi” (relation), are also considered as
important and valuable determinants of customer loyalty in the Chinese hospitality
sector. “Guanxi” (relations) and “mianzi” (face) are the dominating characteristics in
Chinese business relationships (Gilbert and Tsao, 2000) and are among the most
important factors which can affect customer loyalty (Hoare and Butcher, 2008).
“Guanxi” (relations) means networking was the dominant form of transactional
governance in Chinese society long before the concept was taken up by Western
theorists (Gilbert and Tsao, 2000). Buttery and Leung (1997) suggest “guanxi” plays a
very important role regarding customer satisfaction. With the aim of expanding the
model a bit further and making it more appropriate to the Chinese hospitality sector,
future studies can consider adding relations as a construct to the Q-V-S-L model.
Finally, there could be further investigation of the relevance of trust, reputation and face
etc. In this study, the construct of trust was omitted from the final model because it was
confused with related constructs. Hence, further research could explore the relevance of
these constructs in the hospitality sector, that is, whether trust is more relevant to
relationships in the financial services or B2B marketing rather than in the restaurant
sector.
6.8 Conclusions
111
The result of this study revealed that behavioural intentions is directly and indirectly
affected by perceived quality, perceived value, sacrifice, perceived risk, satisfaction,
face and reputation in the Chinese restaurant industry. Understanding which constructs
have the biggest effect on satisfaction and further on behavioural intentions can help the
restaurateurs focus their efforts and investments to create a better business and to
increase satisfaction and customer loyalty. Satisfied customers are more likely to be
loyal customers and restaurateurs must make significant investments to maintain loyal
customers. This study contributes to the theoretical advancement of consumer
behavioural intentions formation in the restaurant industry; it also provides evidence to
substantiate the value of the cultural construct of face in the Q-V-S-L model. This
chapter discussed the summary of the conclusions drawn from this study, the
implications for future research, limitations of the study, and recommendations for
marketing strategies. The implications and insights that have been presented can be
valuable to both researchers and practitioners.
112
References
Aaker, J., Fournier, S. and Brasel, S. A. (2004) ‘When good brands do bad’, Journal of
Consumer Research, 31, (1), pp. 1-16.
Agarwal, S. and Teas, R. K. (2001) ‘Perceived value: mediating role of perceived risk’,
Journal of Marketing Theory and Practice, 9, (4), pp. 1-14.
Agarwal, S. and Teas, R. K. (2004) ‘Cross-national applicability of a perceived risk-
value model’, Journal of Product & Brand Management, 13, (4), pp. 242-256.
Almanza, B. A., Jaffe, W. and Lin, L. C. (1994), ‘Use of the service attribute matrix to
measure consumer satisfaction’, Hospitality Research Journal, Vol. 17 No. 2, pp. 63-75.
Anderson, E. and Sullivan, M. (1993) ‘The antecedents and consequences of customer
satisfaction for firms’, Marketing Science, 12, pp. 125-43.
Anderson, J. C. and Gerbing, D. W. (1988) ‘Structural equation modelling in practice:
A review and recommended two-step approach’, Psychological Bulletin, 103 (3), pp.
411-423.
Anderson, J. C. and Narus, J. A. (1990) ‘A model of distribution firm and manufacturer
firm working partnerships’, Journal of Marketing, 54, (1), pp. 42-58.
Andreassen, T. W. (1999) ‘What drives customer loyalty with complaint resolution?’,
Journal of Service Research, 1, (4), pp. 324-32.
Arbuckle, J. S. (2010) IBM SPSS® Amos™ 19 User’s Guide. Available at:
www.amosdevelopment.com/download/amos.pdf (Accessed: July 2011)
Athanassopoulos, A., Gounaris, S. and Stathakopoulos, V. (2001) ‘Behavioral responses
to customer satisfaction: an empirical study’, European Journal of Marketing, 35, (5/6),
pp. 687-707.
113
Aubert-Gamet, V. and Cova, B. (1999) ‘Servicescapes: from modern non places to
postmodern common places’, Journal of Business Research, 44 (1), pp. 37-45
Auh, S. and Johnson, M. D. (2005) ‘Compatibility effects in evaluations of satisfaction
and loyalty’, Journal of Economic Psychology, 26, pp. 35-57.
Babakus, E. & Boller, G. W. (1992) ‘An empirical assessment of the SERVQUAL
scale’, Journal of Business Research, 24, pp. 253- 268.
Ballester, E. D. and Alemán, J. L. M. (2001) ‘Brand trust in the context of consumer
loyalty’, European Journal of Marketing, 35, (11/12), pp. 1238-1258.
Baldinger, A. L. and Robinson, J. (1996) ‘Brand loyalty: the link between attitude and
behaviour’, Journal of Advertising Research, 36, (6), pp. 9–21.
Ball, D., Coelho, P. S. and Machas, A. (2004) ‘The role of communication and trust in
explaining customer loyalty: an extension to the ECSI model’, European Journal of
Marketing, 8, (9/10), pp. 1272-1293.
Baker, D. A. and Crompton, J. L. (2000) ‘Quality, satisfaction and behavioral
intentions’, Annals of Tourism Research, 27, (3), pp. 785-804.
Baker, J., Parasuraman, A., Grewal, D. and Voss, G. B. (2002) ‘The influence of
multiple store environment cues on perceived merchandise value and patronage
intentions’, Journal of Marketing, 66, (2), pp. 120-141.
Barnes, S. J., Bauer, H. H., Neumann, M. M. and Huber, F. (2007) ‘Segmenting
cyberspace: a customer typology for the internet’, European Journal of Marketing, 41,
(1/2), pp. 71-93.
Bennett, R., Härtel, C. E. J. and McColl-Kennedy, J. R. (2005) ‘Experience as a
moderator of involvement and satisfaction on brand loyalty in a business-to-business
setting 02-314R’, Industrial Marketing Management, 34, pp. 97-107.
114
Berens, G. and Van Riel, C. B. M. (2004) ‘Corporate associations in the academic
literature: three main streams of thought in the reputation measurement literature’,
Corporate Reputation Review, 7, (2), pp. 161-78.
Bigné, J. E., Mattila, A. S. and Andreu, L. (2008) ‘The impact of experiential
consumption cognitions and emotions on behavioural intentions’, Journal of Service
Marketing, 22/4, pp. 303-315.
Bitner, M. J. and Hubert, A. R. (1994) ‘Encounter satisfaction versus overall
satisfaction versus quality: the customer’s voice’, in Rust, R. T. and Oliver, R. L. (eds),
Service Quality : New directions in Theory and Practice pp. 72-94. Sage Publications,
London,
Boksberger, P. E. and Melsen, L. (2009) ‘Perceived value: a critical examination of
definitions, concepts and measures for the service industry’, Journal of Services
Marketing, 25/3, pp. 229-240.
Bolton, R. N. and Drew, J. H. (1991) ‘A multistage model of customers’ assessments of
service quality and value’, Journal of Consumer Research, 17, (4), pp. 375-384.
Bontis, N., Booker, L. D. and Serenko, A. (2007) ‘The mediating effect of
organisational reputation on customer loyalty and service recommendation in the
banking industry’, Management Decision, 45, (9), pp. 1426-1445.
Bowbrick, P. (1980) ‘Pseudo research in marketing: the case of the price/perceived
quality relationship’, European Journal of Marketing, 14, (8), pp. 466-470.
Brady, M. K., Cronin, J. J. Jr and Brand, R. R. (2002), ‘Performance-only measurement
of service quality: a replication and extension’, Journal of Business Research, Vol. 55
No. 1, pp. 17-31.
115
Brady, M. K. and Robertson, C. J. (2001) ‘Searching for a consensus on the antecedent
role of service quality and satisfaction: an exploratory cross national study’, Journal of
Business Research, 51, (1), pp. 53-60.
Brislin, R. W. (1980) ‘Back-translation for cross-cultural research’, Journal of Cross-
Cultural Psychology, 1, pp. 185-216.
Brown, T. J., Dacin, P. A., Pratt, M. G. and Whetten, D. A. (2006) ‘Identity, intended
image, construed image, and reputation: an interdisciplinary framework and suggested
terminology’, Journal of the Academy of Marketing Science, 34, (2), pp. 99−106.
Brunner, T. A., Stöcklin, M. and Opwis, K. (2007) ‘Satisfaction, image and loyalty: new
versus experienced customers’, European Journal of Marketing, 42, (9/10), pp. 1095-
1105.
Butcher, K., Sparks, B. and O’Callaghan, F. (2002) ‘Effect of social influence on
repurchase intentions’, Journal of Services Marketing, 16, (6), pp. 503-514.
Byrne, B. M. (2000). Structural Equation Modeling with AMOS: Basic Concepts,
Applications, and Programming. Lawrence Erlbaum Associates, Mahwah, NJ:
Lawrence Erlbaum Associate.
Caruana, A., Money, A. H. and Berthon, P. R. (2000) ‘Service quality and satisfaction-
the moderating role of value’, European Journal of Marketing, 34, (11/12), pp.1338-
1352.
Casaló, L., Flavián, C. and Guinalíu, M. (2007) ‘The impact of participation in virtual
brand communities on consumer trust and loyalty’, Online Information Review, 31, (6),
pp. 775-792.
Chang, H. H. and Wang, H-W. (2010) ‘The moderating effect of customer perceived
value on online shopping behaviour’, Online Information Review, 35, (3), pp. 333-359.
China Unique, (2011) Culture in China. Available at:
http://chinaunique.com/educate/culture.htm#face (Accessed: 20 April 2012)
116
Chiou, J. and Shen, C. (2006) ‘The effects of satisfaction, opportunism, and asset
specificity on consumers’ loyalty intention toward internet portal sites’, International
Journal of Service Industry Management, 17, (1), pp. 7–22.
Choi, K., Cho, W., Lee, S., Lee, H. and Kim, C. (2002) ‘The relationships among
quality, value, satisfaction and behavioral intention in health care provider choice: A
South Korean study’, Journal of Business Research, 57, pp. 913-921.
Chow, I. H., Lau, V.P., Lo, T. Y., Sha, Z. and Yun, H. (2007), ‘Service quality in
restaurant operations in China: decision- and experiential-oriented perspectives’,
International Journal of Hospitality Management, Vol. 26 No. 3, pp. 698-710
Chun, R. (2005) ‘Corporate reputation: meaning and measurement’, International
Journal of Management Reviews, 7, (2), pp. 91-109.
Corbitt, B. J., Thanasankit, T. and Yi, H. (2003) ‘Trust and e-commerce: a study of
consumer perceptions’, Electronic Commerce and Research Applications, 2, (3), pp.
203-215.
Corsten, D. and Kumar, N. (2005) ‘Do suppliers benefit from collaborative relationships
with large retailers? An empirical investigation of efficient consumer response
adoption’, Journal of Marketing, 69, (3), pp. 80-94.
Cronin, J. J. and Taylor, S. A. (1992) ‘Measuring service quality: a re-examination and
extension’, Journal of Marketing, 56, pp. 55-68.
Cronin, J. J., Jr & Taylor, S.A. (1994) SERVPERF versus SERVQUAL: reconciling
performance-based and perceptions-minus-expectations measurement of service quality,
Journal of Marketing, 58, pp. 125-131
117
Cronin, J. J., Brady, M. K. and Hult, G. T. M. (2000), ‘Assessing the effects of quality,
value, and customer satisfaction on consumer behavioural intentions in service
environments’, Journal of Retailing, 72, (2), pp. 193-218.
Dick, A. S. and Basu, K. (1994), ‘Customer loyalty: toward an integrated conceptual
framework’, Journal of the Academy of Marketing Science, 22, (2), pp. 99-113.
Dodds, W. B. and Monroe, K. B. (1985) ‘The effect of brand and price information on
subjective products evaluations’, in Hirschman, E. C. and Holbrook, M. B. (eds),
Advances in Consumer Research, 12 Association for Consumer research, Provo, UT, pp.
85-90.
Dodds, W. B., Monroe, K. B. and Grewal, D. (1991) ‘Effects of price, brand, and store
information on buyers’ product evaluations’, Journal of Marketing Research, 28, (3), pp.
307-319.
Doney, P. and Cannon, J. (1997) ‘An examination of the nature of trust in the buyer-
seller relationship’, Journal of Marketing, 61, (2), pp. 35-51.
Dong, Q. and Lee, Y. (2007) The Chinese concept of face: A perspective for business
communications. Available at:
www.swdsi.org/swdsi07/2007_proceedings/papers/401.pdf (Accessed: 18 April 2012).
Donthu, N. & Yoo, B. (1998) ‘Cultural influences on service quality expectations’,
Journal Service Research, 1, pp. 178- 186.
Dulen, J. (1999), ‘Quality control’, Restaurant & Institutions, 109 (5), pp. 38-52.
Dyer, J. H. and Chu, W. (2000) ‘The determinants of trust in supplier-automaker
relationships in the U.S., Japan, and Korea’, Journal of International Business Studies,
31, (2), pp. 259-285.
Dywer, F. R., Schurr, P. H. and Sejo, O. (1987) ‘Developing buyer-seller relationship’,
Journal of Marketing, 51, pp. 11-27.

118
Esterby-Smith, M., Thorpe, R. and Jackson, P. (2012) Management Research. 4th
edn.
SAGE publication Ltd.
http://english.51766.com/detail/area_info_detail.jsp?prov_id=1004201&info_type=1,
(no date) (Accessed: 18 April 2012).
Farrell, D., Ulrich, A. Gersch, and Stephenson, E. (2006). ‘The value of China’s
emerging middle class’. McKinsey Quarterly. Available at:
http://www.siboni.net/resources/China$27s+Middle+Class.pdf (Accessed: July 2011).
Fisk, R. P., Brown, S. W. and Bitner, M. J. (1993), ‘Tracking the evolution of services
marketing literature’, Journal of Retailing, 69 (1), pp. 61-103
Flavián, C., Guinalíu, M. and Gurrea, R. (2006) ‘The influence of familiarity and
usability on loyalty to online journalistic services: the role of user experience’, Journal
of Retailing and Consumer Services, 13, pp. 363-75.
Fornell, C., Johnson, M. D., Anderson, E. W., Cha, J. S. and Bryant, B. E. (1996) ‘The
American customer satisfaction index: nature, purpose, and findings’, Journal of
Marketing, 60 (4), pp. 7-18.
Fornell, C. and Wernerfelt, B. (1987) ‘Defensive marketing strategy by customer
complaint management: a theoretical analysis’, Journal of Marketing Research, 24, pp.
337-46.
Gefen, D. (2000) ‘E-commerce – the role of familiarity and trust’, The International
Journal of Management Science, 28, pp. 725-37.
Gefen, D., Rao, V. S. and Tractinsky, N. (2002) ‘The conceptualization of trust, risk and
their relationship in electronic commerce’, Proceedings of the 36th
Hawaii International
Conference on System Sciences (HICSS’ 03), Big Island, HI, pp. 92-201.
119
Gilbert, D. and Tsao, J. (2000), ‘Exploring Chinese cultural influences and hospitality
marketing relationships’, International Journal of Contemporary Hospitality
Management, 12, (1), pp. 45-53.
Gilbert, R. G., Veloutsou, C., Goode, M. M. H. and Moutinho, L. (2004) ‘Measuring
customer satisfaction in the fast food industry: A cross-national approach’, Journal of
Service Marketing, 18, (5), pp. 371-383.
Grönroos, C. (1984) ‘A service quality model and its marketing implications’,
European Journal of Marketing, 18, (14), pp. 36-44.
Guenzi, P. and Pelloni, O. (2004) ‘The impact of interpersonal relationships on
customer satisfaction and loyalty to the service provider’, International Journal of
Service Industry Management, 15, (4), pp. 365–384.
Guseman, D. S. (1981) ‘Risk perception and risk reduction in consumer services’, in
Donelly, J. H. and George, W. R. (eds), Proceedings of American Marketing
Association. Chicago: IL, pp. 200-204.
Ha, H. Y., Janda, S. and Park, S. K. (2009) ‘Role of satisfaction in an integrative model
of brand loyalty’, International Marketing review, 26, (2), pp. 198-220.
Hackman, D., Gundergan, S. P., Wang, P. and Daniel, K. (2006) ‘A service perspective
on modelling intentions of on-line purchasing’, Journal of Services Marketing, 20, (7),
pp. 459-470.
Hamer, L. O. (2006) ‘A confirmation perspective on perceived service quality’, Journal
of Services Marketing, 20, (4), pp. 219 – 232.
Hair J. F., Bush R. P., and Ortinau D. J. (2003). Marketing Research Within a Changing
Information Environment. 2nd
Edition. McGraw-Hill Companies.
Hair J. F., Black W. C., Babin B. J., Anderson R. E. and Tatham R. L. (2006).
Multivariate Data Analysis 6th
edn. Pearson Prentice Hall. New Jersey.

120
Han, H., Back, K. and Barrett, B. (2009) ‘Influencing factors on restaurant customers’
revisit intention: The role of emotions and switching barriers’, International Journal of
Hospitality Management, 28, pp. 563-572.
Han, H. and Ryu, K. (2006) ‘Moderating role of personal characteristics in forming
restaurant customers’ behavioral intentions: An upscale restaurant setting’, Journal of
Hospitality and Leisure Marketing, 15 (4), pp. 25-54.
Harpaz, I. (2003) ‘The essence of performing meaningful comparative international
survey research’, in Punnett B. J. and Shenkar O. (eds.) Handbook for International
Management Research. Ann Arbor: MI: 2nd
edn, p. 17-48.
Harris, L. C. and Ezeh, C. (2008) ‘Servicescape and loyalty intentions: an empirical
investigation’, European Journal of Marketing, 42, (3/4), pp. 390-422.
Hennig-Thurau, T., Gwinner, K. and Gremler, D. (2002) ‘Understanding relationship
marketing outcomes: an integration of relationship benefits and relationship quality’,
Journal of Service Research, 4 (3), pp. 230-247.
Hoare, R. J. and Butcher, K. (2008) ‘Do Chinese cultural values affect customer
satisfaction/loyalty?’, International Journal of Contemporary Hospitality Management,
20 (2), pp. 156-171.
Hodgson, A. (2007) ‘China’s middle class reaches 80 million’, 25 July. Available at:
http://blog.euromonitor.com/2007/07/chinas-middle-class-reaches-80-million.html
(Accessed: July 2011).
Holbrook, M. B. and Corfman, K. P. (1985) ‘Quality and value in the consumption
experience: Phaedrus rides again’, in Jacoby, J. and Olson, J. (ed.) Perceived quality.
Lexington: MA: Lexington Books, pp. 31-57.
Holz, C. A. (2007) ‘China’s Economic Growth 1978-2025: What We Know Today
About China’s Economic Growth Tomorrow’, World Development, 36 (10), pp. 1665-
121
1691.
Høst, V. and Andersen, M. (2001) ‘Modeling customer satisfaction in mortgage credit
companies’, The International Journal of Bank Marketing, 22 (1), pp. 26-42.
Hu, A. (2005) ‘Economic Growth and Employment Growth in China’ (1978-2001)’,
Asian Economic Papers, 3, (2), pp. 166-176.
Hu, Z. and Khan, M. S. (1997) ‘Why Is China Growing So Fast?’, in Fund, M. (ed).
Economic Issues, Vol. 8 Washington. D.C. pp. 1-9. Available at:
http://www.imf.org/external/pubs/ft/issues8/index.htm. (Accessed: May 2011).
IBIS World (2012) Full-Service Restaurants in China: Market Research Report, IBIS
World Market Research Report [Online]. Available at:
http://www.ibisworld.com/industry/china/full-service-restaurants-in-china.html
(Accessed: 25 April 2012).
Iglesias, M. P. and Guillén, M. J. Y. (2004) ‘Perceived quality and price: their impact on
the satisfaction of restaurant customers’, International Journal of Contemporary
Hospitality Management, 16, (6), pp.373-379.
Imrie, B. C., Cadogan, J. W. and McNaughton, R. (2002) ‘The Service Quality
Construct on a Global Stage’, Managing Service Quality, 12, pp. 10-18.
James (2010) Achievement review of 11th
5-year plan. Source from: CNTV [Download].
Available at:
http://english.cntv.cn/program/bizasia/20101019/101859.shtml (Accessed: June 2011).
Jang, D. and Mattila, A. S. (2005) ‘An examination of restaurant loyalty programs:
What kinds of rewards do customers prefer?’, International Journal of Contemporary
Hospitality Management, 17, (5), pp. 402–408.
122
Jani, D. and Han, H. H. (2011) Investigating the Key Factors Affecting Behavioural
Intentions: Evidence from a Full-Service Restaurant Setting. Unpublished PhD thesis.
Dong-A University.
Jones, T. O. and Sasser, W. E. Jr. (1995) ‘Why satisfied customers defect’, Harvard
Business Review, 73, (6), pp. 88-99.
Jőreskog Karl G. and Dag Sőrbom (1983), LISREL V: Analysis of Linear Structural
Relationships by the Method of Maximum Likelihood, Chicago: National Educational
Resources, Inc.
Kang, G. D. and James, J. (2004) ‘Service quality dimensions: an examination of
Grönroos service quality model’, Managing Service Quality, 14, (4), pp. 266-277.
Keating, B., Rugimbana, R. and Quazi, A. (2003) ‘Differentiating between service
quality and relationship quality in cyberspace’, Managing Service Quality, 13, (3), pp.
217-232.
Keh, H. T. and Xie, Y. (2009) ‘Corporate reputation and customer behavioural
intentions: The roles of trust, identification and commitment’, Industrial Marketing
Management, 38, pp. 732-742.
Keng, C. J., Huang, T. L., Zheng, L. J. and Hsu, M. K. (2007) ‘Modeling service
encounters and customer experiential value in retailing’, International Journal of
Service Industry Management, 18, (4), pp. 349-67.
Kennedy, M. S., Ferrell, L. K. and LeClair, D. T. (2001) ‘Consumers’ trust of
salesperson and manufacturer: an empirical study’, Journal of Business Research, 51,
(1), pp. 73-86.
Khalifa, A. S. (2004) ‘Customer value: a review of recent literature and an integrative
configuration’, Management Decision, 42, (5), pp. 645-66.

123
Kim, W. and Han, H. (2008) ‘Determinants of Restaurant Customers’ Loyalty
Intentions: A Mediating Effect of Relationship Quality’, Journal of Quality Assurance
In Hospitality & Tourism, vol 9, (3), pp. 218-239.
Kim, J. Y. and Nam, S. H. (1998) ‘The concept and dynamics of race: Implications for
organizational behavior in Asia’. Organization Science, Vol. 9, No. 4 pp.522-534.
Kivela, J., Inbakaran, R. and Reece, J. (1999), ‘Consumer research in the restaurant
environment, Part 1: a conceptual model of dining satisfaction and return patronage’,
International Journal of Contemporary Hospitality Management, 11 (5), pp. 205-22.
Kumar, N., Scheer, L. and Steenkamp, J. B. (1995) ‘The effects of supplier fairness on
vulnerable resellers’, Journal of Marketing Research, 32, (1), pp. 42-53.
Kwon, I. G. and Suh, T. (2005) ‘Trust, commitment and relationships in supply chain
management: a path analysis’, Supply Chain Management: An International Journal, 10
(1), pp. 26-33.
Ladhari, R., Brun, I. and Morales, M. (2007) ‘Determinants of dining satisfaction and
post-dining behavioural intentions’, International Journal of Hospitality Management,
27, pp. 563-573.
Lee, C. W. (2007) ‘The success of biotech new ventures when combined with strategic
alliance’, International Journal of Management & Enterprise Development, 4 (3), pp.
293-315.
Lee, Y. L. and Hing. N. (1995), ‘Measuring quality in restaurant operations: an
application of the SERVQUAL instrument’, International Journal of Hospitality
Management, Vol. 4 No. 3-4, pp. 293-310.
Lee, H., Lee, Y. and Yoo, D. (2000) ‘The determinants of perceived service quality and
its relationship with satisfaction’, Journal of Service Marketing, 14 (3), pp. 217-231.

124
Lee, J., and Feick, L. (2001) ‘The impact of switching costs on the customer
satisfaction-loyalty link: Mobile phone service in France’, Journal of Services
Marketing, 15 (1), pp. 35–48.
Lehtinen, J. R. and Lehtinen, U. (1982) ‘Service quality: a study of quality dimensions’,
Service Management Institute, unpublished Working Paper, Helsinki.
Li, D., Browne, G. J. and Chau, P. Y. K. (2006) ‘An empirical investigation of web site
use using a commitment-based model’, Decision Sciences, 37 (3), pp. 427-44.
Lindgreen, A. and Wynstra, F. (2005) ‘Value in business markets: what do we know?
Where are we going?’, Industrial Marketing Management, 34, (7), pp. 732-48.
Martín, S. S. and Camarero, C. (2009), ‘How perceived risk affects online buying’,
Online Information Review, 33 (4), pp. 629-654.
Mattila, A. (2002) ‘The role of narratives in promoting restaurant experiences’, Journal
of Hospitality and Tourism Research, 26, (4), pp. 379–395.
My Decker Capital (2010) ‘Chain Restaurants Industry in China’, My Decker Capital
reports [Online]. Available at:
http://www.mydeckercapital.com/.../20101201_MDC_Chain_Restaurants_Industry_in_
China.pdf - Cached - Similar (Accessed: 25 April 2012).
Mayer, R. C., Davis, J. H. and Schoorman, F. D. (1995) ‘An integrative model of
organizational trust’, Academy of Management Review, 20 (3), pp. 709-34.
Mazzocchi, M. (2008) Statistics for marketing and consumer research. 1st edn. SAGE
publications Ltd.
McCollough, M. A. (2000), ‘The effect of perceived justice and attributions regarding
service failure and recovery on post-recovery customer satisfaction and service quality
attitudes’, Journal of Hospitality and Tourism Research, 41 (3), pp. 423-47.

125
McGrath, J. E. (1981) ‘Dilemmatics: The study of research choices and dilemmas’,
American Behavioural Scientist, 25, pp. 179-210.
Mitchell, V. W. (1999) ‘Consumer perceived risk: conceptualisations and models’,
European Journal of Marketing, 33 (1/2), pp. 163-195.
Mitchell, V. W. and Greatorex, M. (1993) ‘Risk perception and reduction in the
purchase of consumer services’, The Service Industries Journal, 13 (4), pp. 179-200.
Morgan, R. M. and Hunt, S. D. (1994) ‘The commitment–trust theory of relationship
marketing’, Journal of Marketing, 58, pp. 20−38.
Namkung, Y. and Jang, S. (2008), ‘Are highly satisfied restaurant customers really
different? A quality perception perspective’, International Journal of Contemporary
Hospitality Management, 20 (2), pp. 142-55.
National Bureau of statistics of China (2010) Basic conditions of urban households.
Available at: http://www.stats.gov.cn/tjsj/ndsj/2010/indexeh.htm (Accessed: June 2011).
Ness, M., Brennan, M., Oughton, E., Ritson, C. and Ruto, E. (2009) ‘Modelling
consumer behavioural intentions towards food with implications for marketing quality
low-input and organic food’, Food Quality and Preference, 21 (1), pp. 100-111.
Ng, S., David, M. and Gagger, T. (2011) ‘Generating positive word-of-mouth in the
service experience’, Managing Service Quality, 21, (2), pp. 133-151.
Nguyen, N. and Leblanc, G. (2001) ‘Corporate image and corporate reputation in
customers’ retention decision in services’, Journal of Retailing and Consumer Services,
8 (4), pp. 227-36.
Nijssen, E., Singh, J., Sirdeshmukh, D. and Holzmüeller, H. (2003) ‘Investing industry
context effects in consumer firm relationships: preliminary results from a dispositional
approach’, Journal of the Academy of Marketing Science, 31, (1), pp. 46-60.
126
Oh, H. (2000), ‘Quality, value, and satisfaction: a practical viewpoint’, The Cornell
Hotel and Restaurant Administration Quarterly, 41 (3), pp. 58-66.
Oh, H. (2000) ‘The effect of brand class, brand awareness, and price on customer value
and behavioural intentions’, Journal of Hospitality and Tourism Research, 24 (2), pp.
136–162.
Oh, H. and Jeong, M. (1996), ‘Improving marketers' predictive power of customer
satisfaction on expectation-based target market levels’, Hospitality Research Journal,
19 (4), pp. 65-86.
Oliver, R. L. (1980) ‘A cognitive model of the antecedents and consequences of
satisfaction decisions’, Journal of Marketing Research, 17, pp. 460-9.
Oliver, R. L. (1997). Satisfaction: A Behavioural Perspective on the Consumer. New
York, NY: Irwin/McGraw-Hill.
Olorunniwo, F., Hsu, M. and Udo, G. (2006) ‘Service, quality, customer satisfaction,
and behavioural intentions in the service factory’, Journal of Service Marketing, 20 (1),
pp. 59-72.
Olsen, S. O. (2002) ‘Comparative evaluation and the relationship between quality,
satisfaction, and repurchase loyalty’, Journal of the Academy of Marketing Science, 30
(3), pp. 240-9.
Ozdemir, V. E. and Hewett, K. (2010) ‘The effect of collectivism on the importance of
relationship quality and service quality for behavioural intentions: A cross-national and
cross-contextual analysis’, Journal of International Marketing, 18 (1), pp. 41-62.
127
Parasuraman, A., Zeithaml, V. A. & Berry, L. L. (1988) ‘SERVQUAL: a multiple-item
scale for measuring consumer perceptions of service quality’, Journal of Retailing, 64,
pp. 12-40.
Parasuraman, A., Zeithaml, V. & Berry, L. L. (1994) ‘Reassessment of expectations as a
comparison standard in measuring service quality: implications for further research’,
Journal of Marketing, 58, pp. 111- 124.
Peng, T. K., Peterson, M. F. and Shyi, Y-P. (1991) ‘Quantitative methods in cross-
national management research: Trends and equivalence issues’, Journal of
Organisational Behaviour, 12, (2), pp. 87-107.
Peri, C. (2006), ‘The universe of food quality’, Food Quality and Preference, 17 (1-2),
pp. 3-8.
Preacher, K. J. and Leonardelli, G. J. (2006) Calculation for the Sobel test: An
interactive calculation tool for mediation. Available at:
http://quantpsy.org/sobel/sobel.htm. (Accessed: Jan 2011).
Price, L. L., Aronould, E. J. and Tierney, P. (1995) ‘Going to extremes: managing
service encounters and assessing provider performance’, Journal of Marketing, 59, pp.
83-97.
Pritchard, M. P., Havitz, M. E. and Howard, D. R. (1999) ‘Analyzing the commitment-
loyalty link in service contexts’, Journal of the Academy of Marketing Science, 27 (3),
pp. 333-48.
Qu, H. (1997), ‘Determinant factors and choice intention for Chinese restaurant dining:
a multivariate approach’, Journal of Restaurant and Foodservice Marketing, 2 (2), pp.
35-49.
Ravald, A. and Grönroos, C. (1996) ‘The value concept and relationship marketing’,
European Journal of Marketing, 30 (2), pp. 9-30.

128
Reeves, C. A. & Bednar, D. (1994) ‘Defining quality: alternatives and implications’,
Academy of Management Review, 19, pp. 419- 445.
Reichheld, F. F. and Sasser, W. E. (1990) ‘Zero defections: quality comes to services’,
Harvard Business Review, 68 (5) pp. 105-11.
Reichheld, F. F. and Schefter, P. (2000) ‘E-loyalty: Your secret weapon on the Web’,
Harvard Business Review, 78, pp. 105–113.
Ridings, C. M., Gefen, D. and Arinze, B. (2002) ‘Some antecedents and effects of trust
in virtual communities’, Journal of Strategic Information Systems, 11, (3-4), pp. 271-95.
Roberts, P. W. and Dowling, G. R. (1997) ‘The value of a firm's corporate reputation:
how reputation helps attain and sustain superior profitability’, Corporate Reputation
Review, 1 (1), pp. 72−76.
Ryu, K., Lee, H-R. and Kim, W. G (2012), ‘The influence of the quality of the physical
environment, food, and service on restaurant image, customer perceived value, customer
satisfaction, and behavioural intentions’, International journal of Contemporary
Hospitality Management, 24 (2), pp. 200-223.
Ryu, K., Han, H. and Jang, S. (2010), ‘The effect of hedonic and utilitarian values on
customers’ satisfaction and behavioural intention in the fast-casual restaurant industry’,
International Journal of Contemporary Hospitality Management, 22 (3), pp. 416-32
Sambandam, R. and Lord, K. (1995) ‘Switching behavior in automobile markets: a
consideration-sets model’, Journal of the Academy of Marketing Science, 23, pp. 57-65
Sandvik, K. and Duhan, D. (1996) ‘The effects of performance quality, customer
satisfaction, and brand reputation on customer loyalty’, in Beracs, J., Bauer, A. and
Simon, J. (eds), EMAC Proceedings Annual Conference, European Marketing Academy,
Budapest, pp. 983-99.
Selnes, F. (1993) ‘An examination of the effect of product performance on brand
129
reputation, satisfaction and loyalty’, European Journal of Marketing, 27 (9), pp. 19-35.
Selnes, F. (1998) ‘Antecedents and consequences of trust and satisfaction in buyer-
seller relationships’, European Journal of Marketing, 32 (3/4), pp. 305-22.
Sekaran, U. (1983) ‘Methodological and theoretical issues and advancements in cross-
cultural research’, Journal of International Business Studies, 14 (2), pp. 61-73.
.
Shemwell, D. J., Yavas, U. and Bilgin, Z. (1998) ‘Customer-service provider
relationships: an empirical test of a model of service quality, satisfaction and relationship
oriented outcome’, International Journal of Service Industry Management, 9, pp. 155-
168.
Shao, A. T. (2002) Marketing Research: An Aid to Decision Making. 2nd
ed: Melissa
Acuna.
Singh, J. (1995) ‘Measurement issues in cross-cultural research’. Journal of
International Business Studies, 26 (3), pp. 597-619.
Sirdeshmukh, D., Singh, J. and Sabol, B. (2002) ‘Consumer trust, value, and loyalty in
relational exchanges’, Journal of Marketing, 66 (1), pp. 15-37.
Sivadas, E. and Prewitt, J. L. (2000) ‘An examination of the relationship between
service quality, customer satisfaction, and store loyalty’, International Journal of Retail
& Distribution Management, 28 (2), pp. 73-82.
Slater, S. F. (1997) ‘Developing a customer value-based theory of the firm’, Journal of
the Academy of Marketing Science, 25 (2), pp. 162-7.
Slater, S. F. and Narver, J. C. (1995) ‘Market orientation and the learning organization’,
Journal of Marketing, 59, pp. 63-74.
Snoj, B., Korda, A. P. and Mumel, D. (2004) ‘The relationships among perceived quality,
perceived risk and perceived product value’, Journal of Product & Brand Management,

130
13 (3), pp. 156-167.
Spreng, R. A., Harrell, G. D. and MacKoy, R. D. (1995) ‘Service recovery: impact on
satisfaction and intentions’, Journal of Services Marketing, 9, (1), pp. 15-23.
Stevens, P., Knutson, B. and Patton, M. (1995), ‘DINESERV: a tool for measuring
service quality in restaurants’, The Cornell Hotel and Restaurant Administration
Quarterly, 36 (2), pp. 56-60.
Stone, R. N. and Gronhaug, K. (1993) ‘Perceived risk: Further considerations for the
marketing discipline’, European Journal of Marketing, 27, pp. 39–50.
Stone, R. N. and Winter, F. W. (1985) Risk in buyer behaviour contexts: a clarification,
Faculty Working Paper 1216 EWP 860505, College of Commerce and Business
Administration, University of Illinois, IL, December.
Sulek, J. M. and Hensley, R. L. (2004), ‘The relative importance of food, atmosphere,
and fairness of wait’, The Cornell Hotel and Restaurant Administration Quarterly, 45
(3), pp. 235-47.
Sureshchandar, G. S., Rajendran, C. and Anantharaman, R. N. (2002) ‘The relationship
between service quality and customer satisfaction- a factor specific approach’, Journal
of Services Marketing, 16 (4), pp. 363-379.
Susskind, A. M. and Chan, E. K. (2000), ‘How restaurant features affect check averages:
a study of the Toronto restaurant market’, The Cornell Hotel and Restaurant
Administration Quarterly, 41 (6), pp. 56-63.
Swanson, S. R. and Davis, J. C. (2003) ‘The relationship of differential loci with
perceived quality and behavioural intentions’, Journal of Services Marketing, 17 (2), pp.
202-219.
Sweeney, J. C. and Soutar, G. N. (2001) ‘Consumer perceived value: The development
of a multiple item scale’, Journal of Retailing, 77, pp. 203–220.

131
Teas, K. R. and Agarwal, S. (2000) ‘The effects of extrinsic product cues on consumers’
perceptions of quality, sacrifice, and value’, Journal of the Academy of Marketing
Science, 28 (2), pp. 278-290.
Teas, R. K. (1994) ‘Expectations as a comparison standard in measuring service quality:
an assessment of a reassessment’, Journal of Marketing, 58, pp. 132-139.
Thorbjørsen, H. and Supphellen, M. (2004) ‘The impact of brand loyalty on website
usage’, Journal of Brand Management, 11 (3), pp. 199-208.
Tian, Y., Lai, F. and Daniel, F. (2008) ‘An examination of the nature of trust in logistics
outsourcing relationship empirical evidence from China’, Industrial Management &
Data Systems, 108, (3), pp. 346-367.
Tuu, H. H., Olsen, S. O. and Linh, P. T. T. (2011) ‘The moderator effect of perceived
risk, objective knowledge and certainty in the satisfaction-loyalty relationship’, Journal
of Consumer Marketing, 28 (5), pp. 363-375.
Wang, J. P http://docs.china-europa-forum.net/doc_669.pdf (no date) (Accessed: July
2011).
Wikinvest (2008) Rise of China’s middle class. Available at:
http://www.wikinvest.com/concept/Rise_of_China%27s_Middle_Class (Accessed: July.
2011).
Web center for social research method (2006) Research method knowledge base.
Available at:
http://www.socialresearchmethods.net/kb/index.php (Accessed: 28 April 2012).
Wong, A. and Sohal, A. (2003) ‘Service quality and customer loyalty perspectives on
two levels of retail relationships’, Journal of Services Marketing, 17 (5), pp. 495–513.
132
Woodruff, R. B. (1997) ‘Customer value: The next source for competitive advantage’,
Journal of the Academy of Marketing Science, 25, pp. 139–153.
Wuhan.com http://www.wuhan.com/cmarter.asp?doc=310, (no date) (Accessed: 18
April 2012)
Xinhua (2010) China’s 12th
Five-Year Plan signifies a new phase in growth. Available at:
http://www.chinadaily.com.cn/bizchina/2010-10/27/content_11463985.htm (Accessed:
June 2011)
Xu, D. (2005) China's economy set to grow 8% from 2006 to 2010.
Available at: http://www.chinadaily.com.cn/english/doc/2005-
03/21/content_426838.htm (Accessed: July 2011).
Yang, Z. and Peterson, R. T. (2004) ‘Customer perceived value, satisfaction, and loyalty:
The role of switching costs’, Psychology and Marketing, 21 (10), pp. 799–822.
Yau, O. H. M. and Lee, E. (1996), ‘Restaurant Industry in Hong Kong: a conceptual
model’, Journal of Restaurant and Foodservice Marketing, 1 (¾), pp. 85-106.
Yoon, S. J. (2002) ‘The antecedents and consequences of trust in on-line purchase
decisions’, Journal of Interactive Marketing, 12 (2), pp. 47-63.
Yuksel, A. and Yuksel, F. (2002) ‘Measurement of tourist satisfaction with restaurant
services: A segment-based approach’, Journal of Vacation Marketing, 9 (1), pp. 52-68.
Yuksel, A. and Yuksel, F. (2007) ‘Shopping risk perception: effects on tourists’
emotion, satisfaction and expressed loyalty intentions’, Tourism Management, 28, pp.
303-13.
Zeithaml, V. A. (1988) ‘Consumer perceptions of price, quality and value: A means-end
model and synthesis of evidence’, Journal of Marketing, 52, pp. 2–22.

133
Zeithaml, V. A., Berry, L. L. and Parasuraman, A. (1996) ‘The behavioural
consequences of service quality’, Journal of Marketing, 60 (2), pp. 31-46.
Zhong, S. (2007) ‘Face’ as a market trend: understanding Chinese culture. Available at:
http://seekingalpha.com/article/26602-face-as-a-market-trend-understanding-chinese-
culture (Accessed: 18 April 2012).
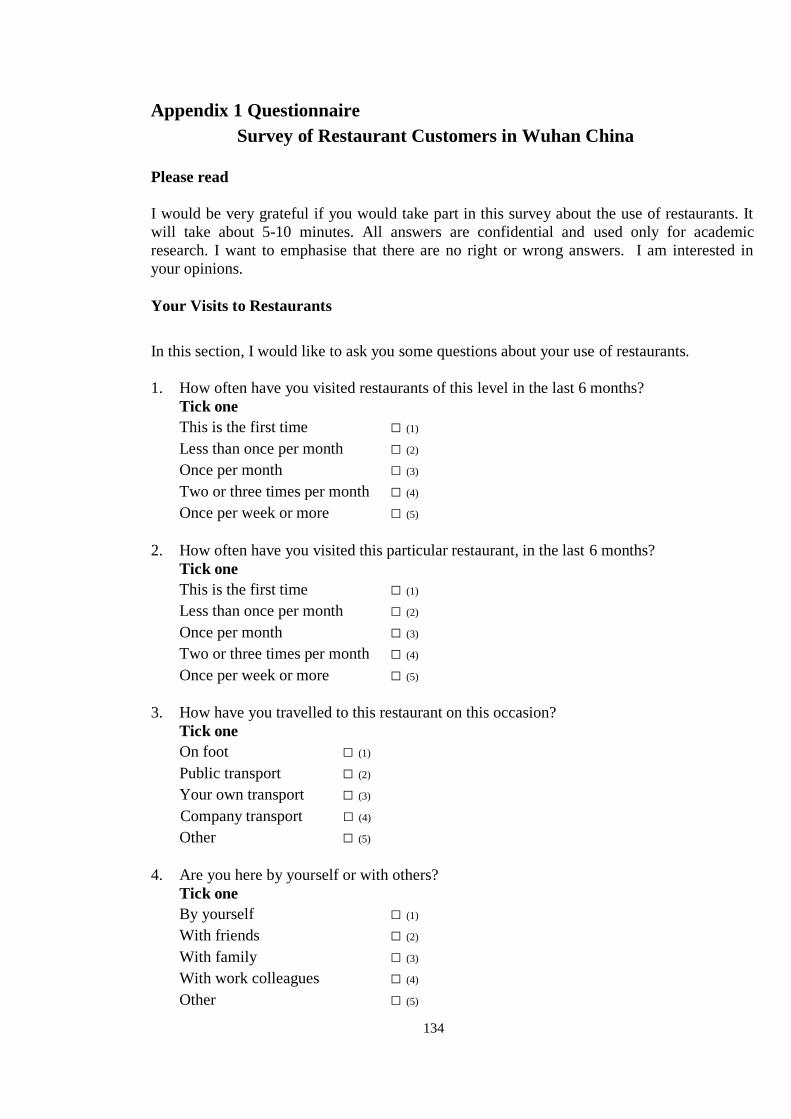
134
Appendix 1 Questionnaire
Survey of Restaurant Customers in Wuhan China
Please read
I would be very grateful if you would take part in this survey about the use of restaurants. It
will take about 5-10 minutes. All answers are confidential and used only for academic
research. I want to emphasise that there are no right or wrong answers. I am interested in
your opinions.
Your Visits to Restaurants
In this section, I would like to ask you some questions about your use of restaurants.
1. How often have you visited restaurants of this level in the last 6 months?
Tick one
This is the first time □ (1)
Less than once per month □ (2)
Once per month □ (3)
Two or three times per month □ (4)
Once per week or more □ (5)
2. How often have you visited this particular restaurant, in the last 6 months?
Tick one
This is the first time □ (1)
Less than once per month □ (2)
Once per month □ (3)
Two or three times per month □ (4)
Once per week or more □ (5)
3. How have you travelled to this restaurant on this occasion?
Tick one
On foot □ (1)
Public transport □ (2)
Your own transport □ (3)
Company transport □ (4)
Other □ (5)
4. Are you here by yourself or with others?
Tick one
By yourself □ (1)
With friends □ (2)
With family □ (3)
With work colleagues □ (4)
Other □ (5)

135
5. How much have you spent / plan to spend on this visit?
Tick one
Up to 100 yan □ (1)
100-300 yan □ (2)
More than 300 yan □ (3)
QUALITY OF PRODUCTS AND SERVICES
In this section, I would like to ask your opinions of the quality of your experience in this
restaurant for each of the items listed below. Please give a score from 1 to 5 to indicate the
level of quality you have experienced. (1 = Very low, 2 = Low, 3 = Average, 4 = High, 5 =
Very High).
Very Very
Low High
6 .Politeness of staff 1 2 3 4 5
7. Service skills of staff 1 2 3 4 5
8. Treatment of diners 1 2 3 4 5
9 . Friendliness of staff 1 2 3 4
5
10. Promptness of service 1 2 3 4 5
11. Aroma, color and tastiness of food 1 2 3 4 5
12. Freshness of food 1 2 3 4 5
13. Variety and choice of food 1 2 3 4 5
14. Prices compared to similar restaurants 1 2 3 4 5
15. Quality of food compared to your expectations 1 2 3 4 5
16. The meal experience 1 2 3 4 5
17. Standard of hygiene and cleanliness (both restaurant and toilet?) 1 2 3 4 5
18. Quality of service compared to your expectations 1 2 3 4 5
19. The contribution of the music to the atmosphere 1 2 3 4 5
20. The design and decoration 1 2 3 4 5
21. The seating arrangement 1 2 3 4 5
PERCEIVED VALUE
In this part, I would like you to indicate the value (1 = Very low, 2 = Low, 3 = Average, 4 =
High, 5 = Very High) delivered by the restaurant for the items listed below.
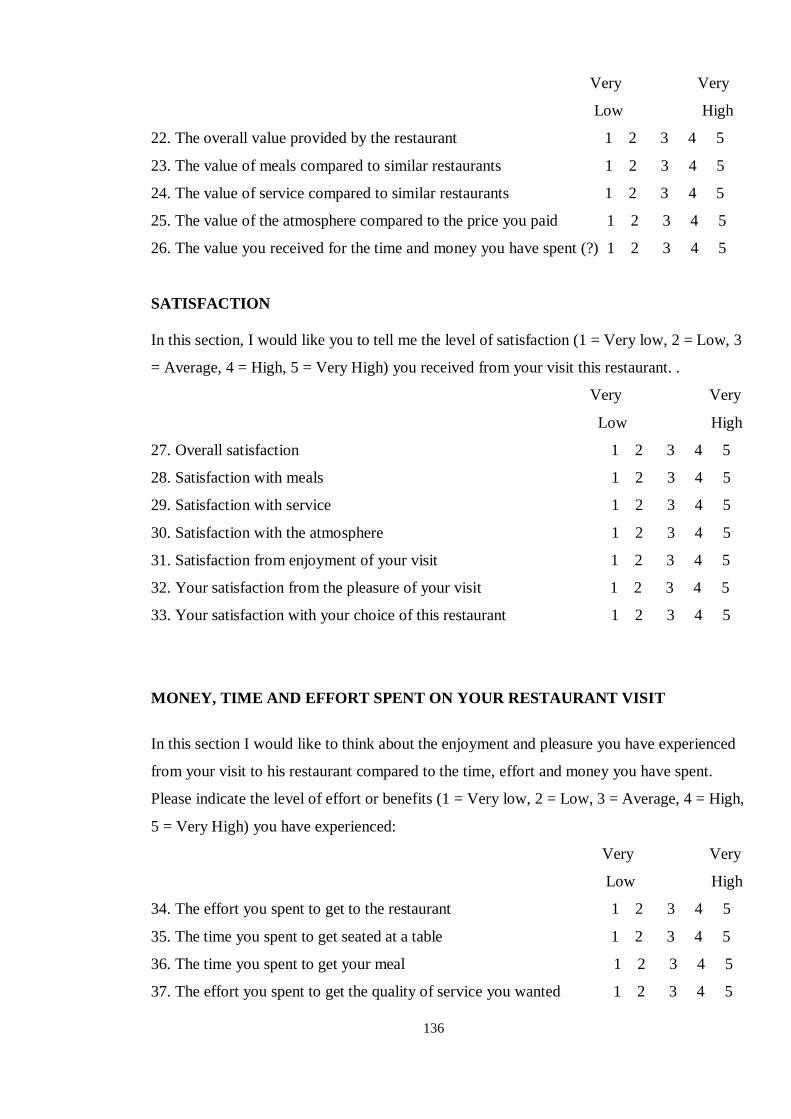
136
Very Very
Low High
22. The overall value provided by the restaurant 1 2 3 4 5
23. The value of meals compared to similar restaurants 1 2 3 4 5
24. The value of service compared to similar restaurants 1 2 3 4 5
25. The value of the atmosphere compared to the price you paid 1 2 3 4 5
26. The value you received for the time and money you have spent (?) 1 2 3 4 5
SATISFACTION
In this section, I would like you to tell me the level of satisfaction (1 = Very low, 2 = Low, 3
= Average, 4 = High, 5 = Very High) you received from your visit this restaurant. .
Very Very
Low High
27. Overall satisfaction 1 2 3 4 5
28. Satisfaction with meals 1 2 3 4 5
29. Satisfaction with service 1 2 3 4 5
30. Satisfaction with the atmosphere 1 2 3 4 5
31. Satisfaction from enjoyment of your visit 1 2 3 4 5
32. Your satisfaction from the pleasure of your visit 1 2 3 4 5
33. Your satisfaction with your choice of this restaurant 1 2 3 4 5
MONEY, TIME AND EFFORT SPENT ON YOUR RESTAURANT VISIT
In this section I would like to think about the enjoyment and pleasure you have experienced
from your visit to his restaurant compared to the time, effort and money you have spent.
Please indicate the level of effort or benefits (1 = Very low, 2 = Low, 3 = Average, 4 = High,
5 = Very High) you have experienced:
Very Very
Low High
34. The effort you spent to get to the restaurant 1 2 3 4 5
35. The time you spent to get seated at a table 1 2 3 4 5
36. The time you spent to get your meal 1 2 3 4 5
37. The effort you spent to get the quality of service you wanted 1 2 3 4 5
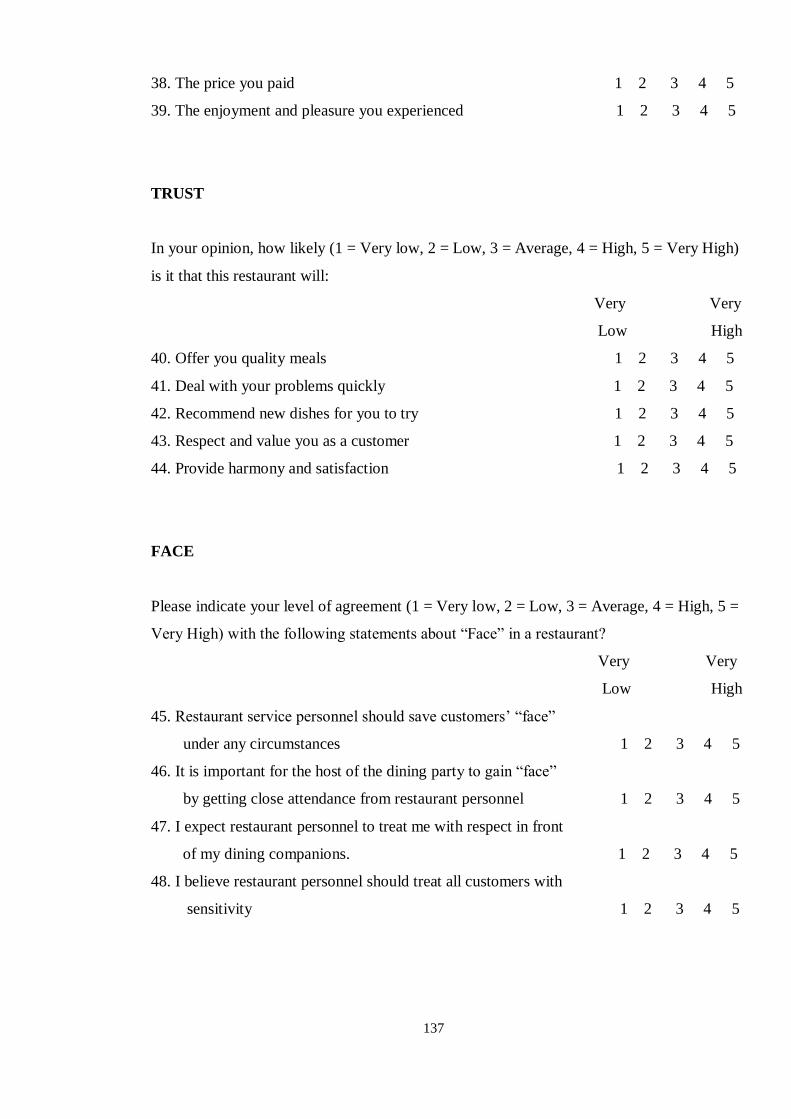
137
38. The price you paid 1 2 3 4 5
39. The enjoyment and pleasure you experienced 1 2 3 4 5
TRUST
In your opinion, how likely (1 = Very low, 2 = Low, 3 = Average, 4 = High, 5 = Very High)
is it that this restaurant will:
Very Very
Low High
40. Offer you quality meals 1 2 3 4 5
41. Deal with your problems quickly 1 2 3 4 5
42. Recommend new dishes for you to try 1 2 3 4 5
43. Respect and value you as a customer 1 2 3 4 5
44. Provide harmony and satisfaction 1 2 3 4 5
FACE
Please indicate your level of agreement (1 = Very low, 2 = Low, 3 = Average, 4 = High, 5 =
Very High) with the following statements about “Face” in a restaurant?
Very Very
Low High
45. Restaurant service personnel should save customers’ “face”
under any circumstances 1 2 3 4 5
46. It is important for the host of the dining party to gain “face”
by getting close attendance from restaurant personnel 1 2 3 4 5
47. I expect restaurant personnel to treat me with respect in front
of my dining companions. 1 2 3 4 5
48. I believe restaurant personnel should treat all customers with
sensitivity 1 2 3 4 5

138
REPUTATION
Please indicate your level of agreement (1 = Very low, 2 = Low, 3 = Average, 4 = High, 5 =
Very High) with the following statements about "reputation" of a restaurant?
Very Very
Low High
49. You visit this restaurant because it has good reputation. 1 2 3 4 5
50. Compared to restaurants of a similar level, this restaurant 1 2 3 4 5
has a better reputation.
51. Reputation is an important influence when you 1 2 3 4 5
decide to visit any restaurant.
PERCEIVED RISK
Sometimes a visit to a restaurant results in the feeling that you have made a bad decision
because of the poor quality food, poor quality service and a poor atmosphere. Please indicate
to what extent (1 = Very low, 2 = Low, 3 = Average, 4 = High, 5 = Very High) you believe
that your decision to visit to this restaurant has made you feel that:
Very Very
Low High
52. You have wasted money 1 2 3 4 5
53. You feel disappoint about your choice 1 2 3 4 5
54. The food will probably make you ill because the freshness 1 2 3 4 5
55. The service has been poor 1 2 3 4 5
56. You have lost face among your dining companions 1 2 3 4 5
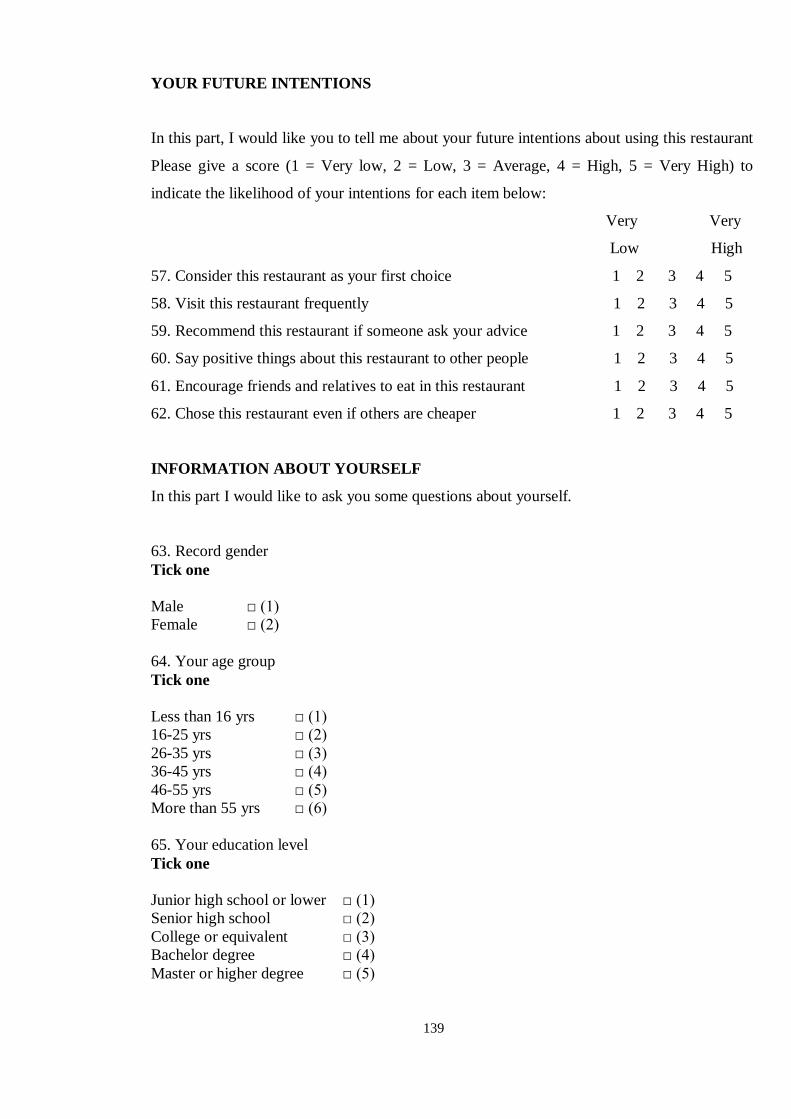
139
YOUR FUTURE INTENTIONS
In this part, I would like you to tell me about your future intentions about using this restaurant.
Please give a score (1 = Very low, 2 = Low, 3 = Average, 4 = High, 5 = Very High) to
indicate the likelihood of your intentions for each item below:
Very Very
Low High
57. Consider this restaurant as your first choice 1 2 3 4 5
58. Visit this restaurant frequently 1 2 3 4 5
59. Recommend this restaurant if someone ask your advice 1 2 3 4 5
60. Say positive things about this restaurant to other people 1 2 3 4 5
61. Encourage friends and relatives to eat in this restaurant 1 2 3 4 5
62. Chose this restaurant even if others are cheaper 1 2 3 4 5
INFORMATION ABOUT YOURSELF
In this part I would like to ask you some questions about yourself.
63. Record gender
Tick one
Male □ (1)
Female □ (2)
64. Your age group
Tick one
Less than 16 yrs □ (1)
16-25 yrs □ (2)
26-35 yrs □ (3)
36-45 yrs □ (4)
46-55 yrs □ (5)
More than 55 yrs □ (6)
65. Your education level
Tick one
Junior high school or lower □ (1)
Senior high school □ (2)
College or equivalent □ (3)
Bachelor degree □ (4)
Master or higher degree □ (5)

140
66. Your occupation status.
Tick one
Full-time student □ (1)
Unemployed □ (2)
Employed □ (3)
Retired □ (4)
Others (house wife/husband) □ (5)
67. If you are employed which of these best describes your occupation?
Tick one
-Professional, higher or intermediate managerial, administrative □ (1)
Junior professional, managerial, administrative, or
-Supervisory or clerical, or skilled manual worker □ (2)
-Semi-skilled and unskilled manual worker, or casual worker □ (3)
68. Would you mind giving me information about your salary? You don’t have to if you
don’t want to but it would be very useful for our analysis. (Yuan/Monthly)
Tick one
Nil □ (1)
<1000 □ (2)
1001-3000 □ (3)
3001-5000 □ (4)
5001-8000 □ (5)
8001-10000 □ (6)
More than 10000 □ (7)
Refused to answer □ (8)

141
Appendix 2 Constructs and Measures
Construct
and
measure
Description Cronbach’s
alpha
Mean Standard
deviation
Perceived
quality:
.907
q6 Politeness of staff 3.89 .797
q7 Service skills of staff 3.82 .755
q9 Treatment of diners 3.88 .758
q10 Friendliness of staff 4.03 .773
q10 Promptness of service 3.91 .784
q11 Aroma colour and tastiness of food 3.85 .795
q12 Freshness of food 3.92 .800
q13 Variety and choice of food 3.84 .829
q14 Prices compared to similar
restaurants
3.87 .781
q15 Quality of food compared to your
expectations
3.88 .840
q16 The meal experience 3.79 .739
q17 Standard of hygiene and cleanliness 3.98 .724
q18 Quality of service compared to your
expectations
3.81 .795
q19 The contribution of the music to the
atmosphere
3.74 .859
q20 The design and decoration 3.87 .787
q21 The seating arrangement 3.81 .837
Perceived
Value:
.813
q22 The overall value provided by the
restaurant
3.74 .753
q23 The value of meals compared to
similar restaurants
3.78 .764
q24 The value of service compared to
similar restaurants
3.69 .790
q25 The value of the atmosphere
compared to the price you paid
3.84 .769
q26 The value you received for the time
and money you have spent
3.85 .814
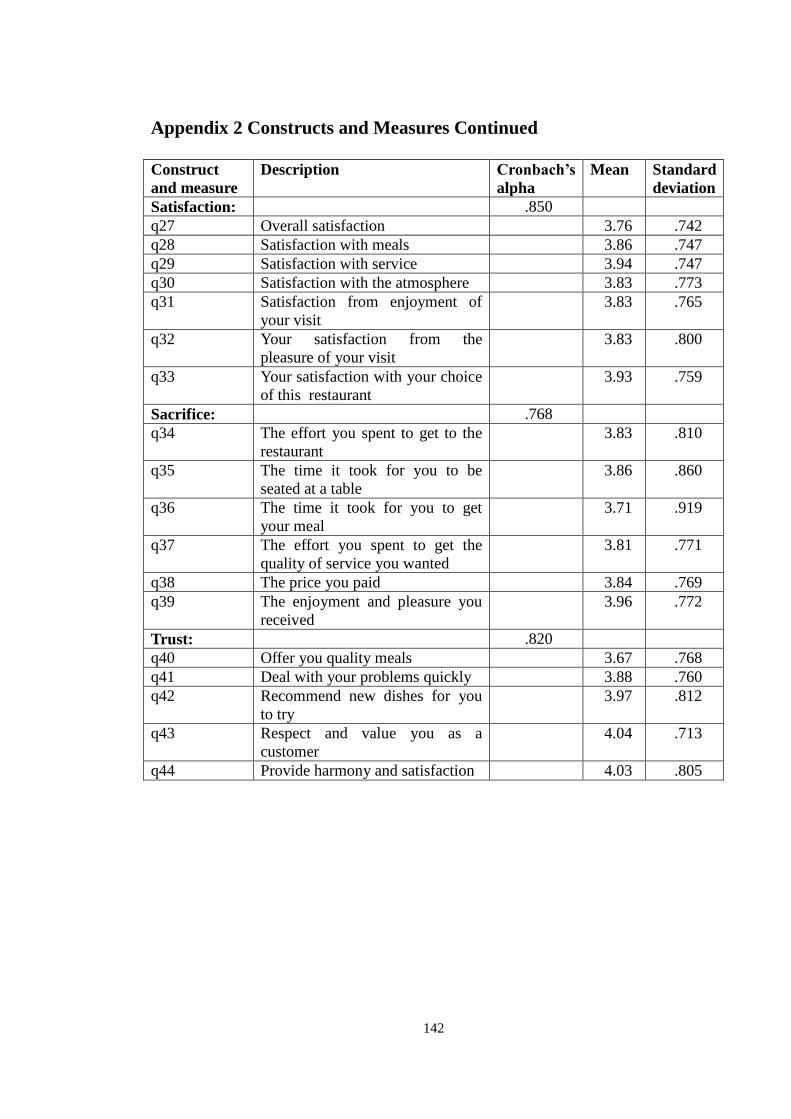
142
Appendix 2 Constructs and Measures Continued
Construct
and measure
Description Cronbach’s
alpha
Mean Standard
deviation
Satisfaction: .850
q27 Overall satisfaction 3.76 .742
q28 Satisfaction with meals 3.86 .747
q29 Satisfaction with service 3.94 .747
q30 Satisfaction with the atmosphere 3.83 .773
q31 Satisfaction from enjoyment of
your visit
3.83 .765
q32 Your satisfaction from the
pleasure of your visit
3.83 .800
q33 Your satisfaction with your choice
of this restaurant
3.93 .759
Sacrifice: .768
q34 The effort you spent to get to the
restaurant
3.83 .810
q35 The time it took for you to be
seated at a table
3.86 .860
q36 The time it took for you to get
your meal
3.71 .919
q37 The effort you spent to get the
quality of service you wanted
3.81 .771
q38 The price you paid 3.84 .769
q39 The enjoyment and pleasure you
received
3.96 .772
Trust: .820
q40 Offer you quality meals 3.67 .768
q41 Deal with your problems quickly 3.88 .760
q42 Recommend new dishes for you
to try
3.97 .812
q43 Respect and value you as a
customer
4.04 .713
q44 Provide harmony and satisfaction 4.03 .805

143
Appendix 2 Constructs and Measures Continued
Construct Description Alpha Mean Std dev
Face:
q45 Restaurant service personnel should
save customers’ face under any
circumstances
4.02 .782
q46 It is important for the host of the
dining party to gain face by getting
close attendance from restaurant
personnel
3.96 .831
q47 I expect restaurant personnel to treat
me with respect in front of my dining
companions.
3.98 .816
q48 I believe restaurant personnel should
treat all customers with sensitivity
3.91 .854
Reputation: .762
q49 You visit this restaurant because it
has a good reputation
3.80 .821
q50 Compared to restaurants of a similar
level this restaurant has a better
reputation
3.85 .748
q51 Reputation is an important influence
when you decide to visit any
restaurant
3.98 .813
Perceived
risk:
.883
q52 You have wasted money 1.99 .836
q53 You feel disappointed about your
choice
1.98 .831
q54 The food will probably make you ill
because it isn’t fresh
2.01 .900
q55 The service has been poor 1.93 .808
q56 You have lost face in front of your
dining companions
1.97 .906
Behavioural
intentions:
.866
q57 Consider this restaurant as your first
choice
3.68 .906
q58 Visit this restaurant frequently 3.65 .867
q59 Recommend this restaurant if
someone asks your advice
3.80 .804
q60 Say positive things about this
restaurant to other people
3.70 .789
q61 Encourage friends and relatives to eat
in this restaurant
3.75 .861
q62 Choose this restaurant even if others
are cheaper
3.78 .955

144
Appendix 3 Sample Characteristics
Statistics
Gender Age group Education level
Occupation
status Occupation
Monthly
salary
N Valid 489 489 487 489 449 466
Missing 0 0 2 0 40 23
Mean 1.51 3.46 2.87 3.04 1.73 4.42
Median 2.00 3.00 3.00 3.00 2.00 4.00
Mode 2 3 2 3 2 3
Gender
Frequency Percent Valid Percent
Cumulative
Percent
Valid Male 242 49.5 49.5 49.5
Female 247 50.5 50.5 100.0
Total 489 100.0 100.0
Age group
Frequency Percent Valid Percent
Cumulative
Percent
Valid Less than 16 yrs 5 1.0 1.0 1.0
16-25 yrs 101 20.7 20.7 21.7
26-35 yrs 156 31.9 31.9 53.6
36-45 yrs 140 28.6 28.6 82.2
46-55 yrs 66 13.5 13.5 95.7
More than 55 yrs 21 4.3 4.3 100.0
Total 489 100.0 100.0

145
Education level
Frequency Percent Valid Percent
Cumulative
Percent
Valid Junior high school or lower 41 8.4 8.4 8.4
Senior high school 184 37.6 37.8 46.2
College or equivalent 116 23.7 23.8 70.0
Bachelor degree 89 18.2 18.3 88.3
Masters or higher degree 57 11.7 11.7 100.0
Total 487 99.6 100.0
Missing System 2 .4
Total 489 100.0
Occupation status
Frequency Percent Valid Percent
Cumulative
Percent
Valid Full-time student 19 3.9 3.9 3.9
Unemployed 27 5.5 5.5 9.4
Employed 379 77.5 77.5 86.9
Retired 44 9.0 9.0 95.9
Other 20 4.1 4.1 100.0
Total 489 100.0 100.0
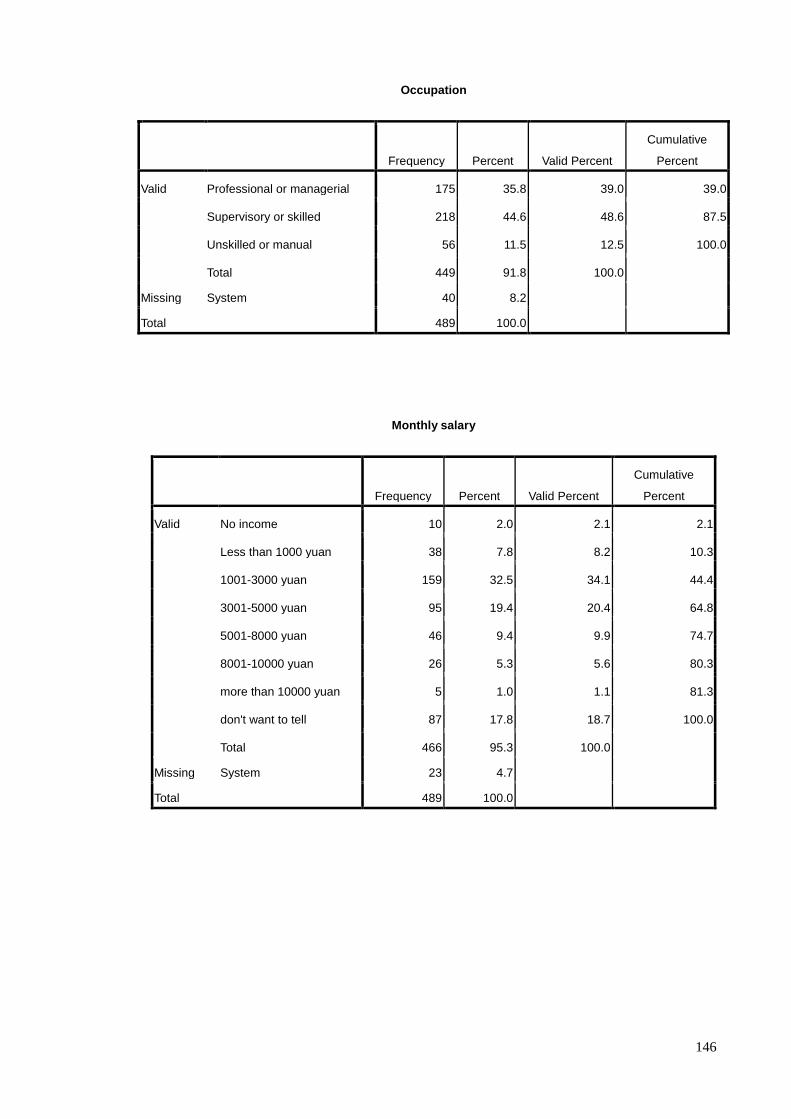
146
Occupation
Frequency Percent Valid Percent
Cumulative
Percent
Valid Professional or managerial 175 35.8 39.0 39.0
Supervisory or skilled 218 44.6 48.6 87.5
Unskilled or manual 56 11.5 12.5 100.0
Total 449 91.8 100.0
Missing System 40 8.2
Total 489 100.0
Monthly salary
Frequency Percent Valid Percent
Cumulative
Percent
Valid No income 10 2.0 2.1 2.1
Less than 1000 yuan 38 7.8 8.2 10.3
1001-3000 yuan 159 32.5 34.1 44.4
3001-5000 yuan 95 19.4 20.4 64.8
5001-8000 yuan 46 9.4 9.9 74.7
8001-10000 yuan 26 5.3 5.6 80.3
more than 10000 yuan 5 1.0 1.1 81.3
don't want to tell 87 17.8 18.7 100.0
Total 466 95.3 100.0
Missing System 23 4.7
Total 489 100.0

147
Appendix 4 Restaurant Visiting Behaviour
Statistics
Frequency of
visiting type of
restaurant
Frequency of
visiting specific
restaurant Method of travel Dining group Expenditure
N Valid 489 489 489 489 489
Missing 0 0 0 0 0
Mean 3.30 3.19 2.44 3.03 2.93
Median 3.00 3.00 3.00 3.00 3.00
Mode 3 3 3 4 3
Frequency of visiting type of restaurant
Frequency Percent Valid Percent
Cumulative
Percent
Valid This is the first time 42 8.6 8.6 8.6
Less than once per month 76 15.5 15.5 24.1
Once per month 148 30.3 30.3 54.4
Two to three times per month 141 28.8 28.8 83.2
Once per week or more 82 16.8 16.8 100.0
Total 489 100.0 100.0
Frequency of visiting specific restaurant
Frequency Percent Valid Percent
Cumulative
Percent
Valid This is the first time 44 9.0 9.0 9.0
Less than once per month 84 17.2 17.2 26.2
Once per month 159 32.5 32.5 58.7
Two to three times per month 138 28.2 28.2 86.9
Once per week or more 64 13.1 13.1 100.0
Total 489 100.0 100.0

148
Method of travel
Frequency Percent Valid Percent
Cumulative
Percent
Valid On foot 74 15.1 15.1 15.1
Public transport 160 32.7 32.7 47.9
Own transport 219 44.8 44.8 92.6
Company transport 36 7.4 7.4 100.0
Total 489 100.0 100.0
Dining group
Frequency Percent Valid Percent
Cumulative
Percent
Valid By yourself 27 5.5 5.5 5.5
With friends 139 28.4 28.4 33.9
With family 133 27.2 27.2 61.1
With work colleagues 174 35.6 35.6 96.7
Other 16 3.3 3.3 100.0
Total 489 100.0 100.0
Expenditure
Frequency Percent Valid Percent
Cumulative
Percent
Valid Up to 100 yuan 35 7.2 7.2 7.2
100-300 yuan 147 30.1 30.1 37.2
301-500 yuan 172 35.2 35.2 72.4
501-800 yuan 99 20.2 20.2 92.6
more than 800 yuan 23 4.7 4.7 97.3
don't know 13 2.7 2.7 100.0
Total 489 100.0 100.0
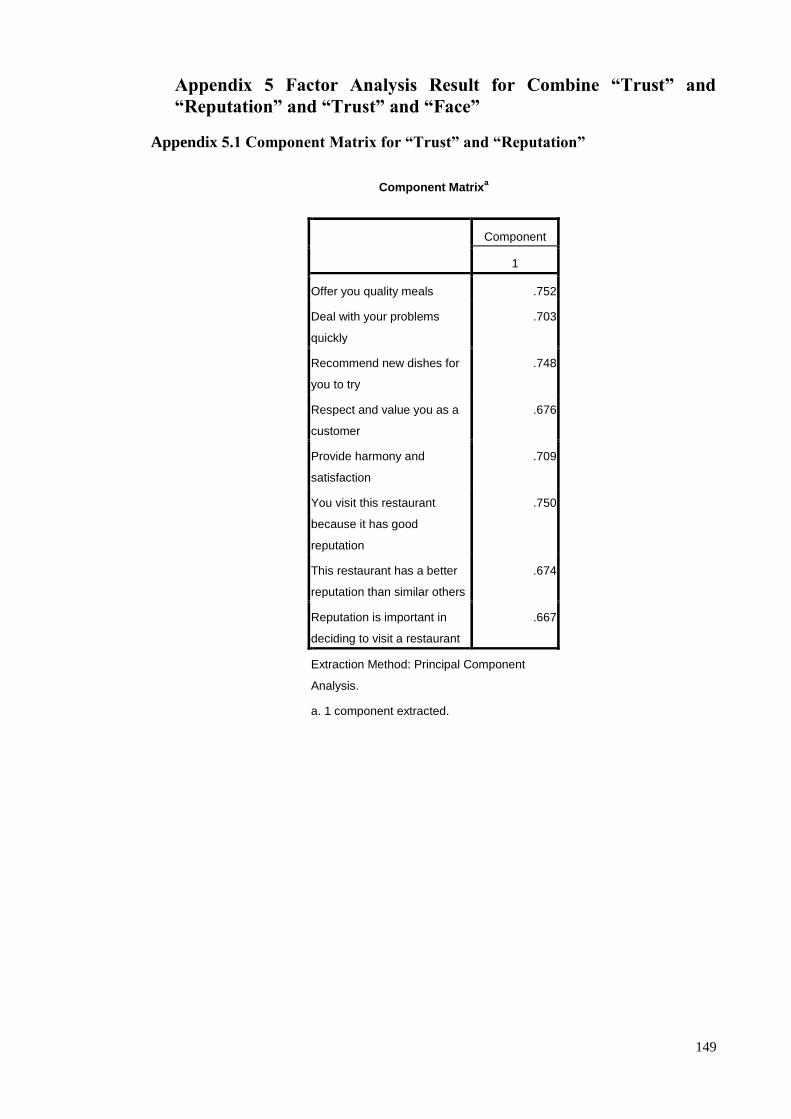
149
Appendix 5 Factor Analysis Result for Combine “Trust” and
“Reputation” and “Trust” and “Face”
Appendix 5.1 Component Matrix for “Trust” and “Reputation”
Component Matrixa
Component
1
Offer you quality meals .752
Deal with your problems
quickly
.703
Recommend new dishes for
you to try
.748
Respect and value you as a
customer
.676
Provide harmony and
satisfaction
.709
You visit this restaurant
because it has good
reputation
.750
This restaurant has a better
reputation than similar others
.674
Reputation is important in
deciding to visit a restaurant
.667
Extraction Method: Principal Component
Analysis.
a. 1 component extracted.

150
Appendix 5.2 Component Matrix for “Trust” and “Face”
Component Matrixa
Component
1
Offer you quality meals .715
Deal with your problems
quickly
.685
Recommend new dishes for
you to try
.720
Respect and value you as a
customer
.691
Provide harmony and
satisfaction
.746
Restaurant service personnel
should save customers’ face
.729
It is important for the host of
the dining party to gain face
.735
I expect personnel to treat me
with respect in front of
companions
.706
Restaurant personnel should
treat all customers with
sensitivity
.711
Extraction Method: Principal Component
Analysis.
a. 1 component extracted.

151