a structural analysis of sales patterns of music cdsmyamada/m. yamada mktsc 2002 u of albert… ·...
TRANSCRIPT

(C) Yamada & Kato 1
A Structural Analysis ofSales Patterns of Music CDs
Marketing Science Conference 2002, University of Alberta, Edmonton Canada,June 28, 4:00-5:30 p.m., Diffusion Models [4], Friday D4 Room:1-10
Masataka YamadaKyoto Sangyo University
Hiroshi KatoIihara Management Institute

(C) Yamada & Kato 2
• 1. Introduction: motivation and objectives ofthis study
• 2. Questionnaires– 2.1. Skip the first half questions– 2.2. Questions by Individual Artist/Group
• 3. Sales Forecast by a Structurally SynthesizedModel
• 4. Artist/Group Decomposed Lifecycle• 5. Summary, Limitations and Future Studies
Order of Presentation
(C) Yamada & Kato 3
1. Introduction: motivation and objectivesof this study
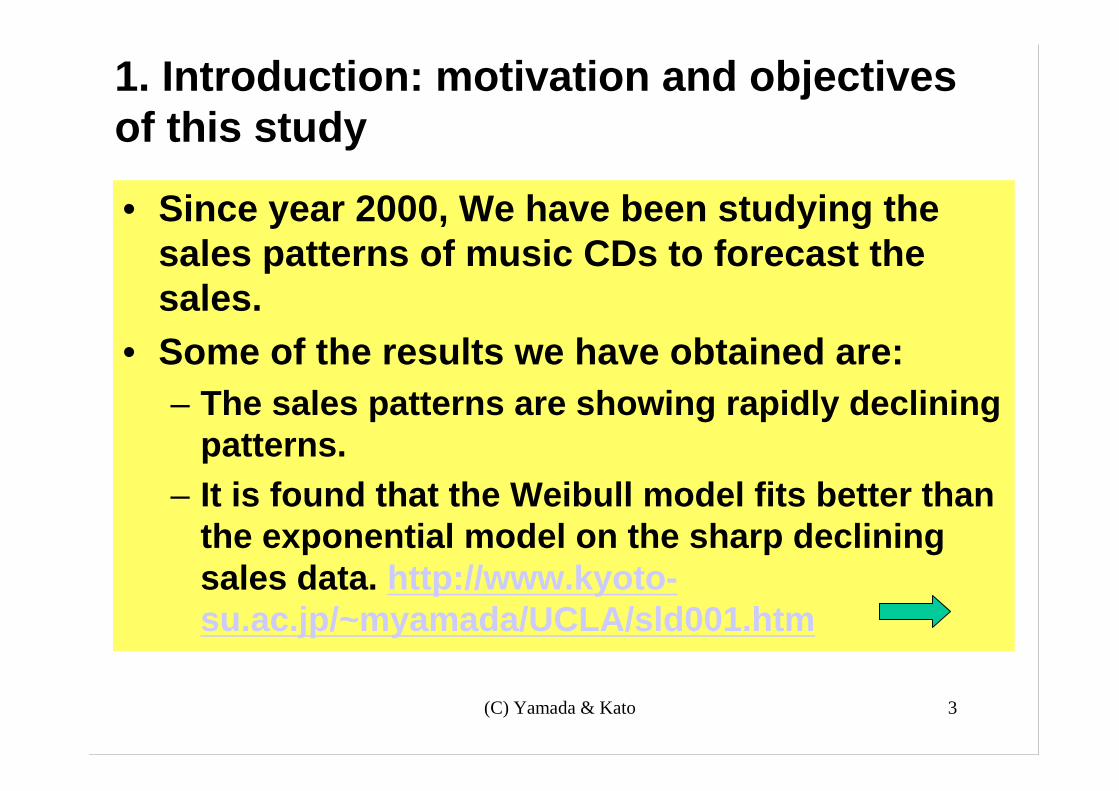
• Since year 2000, We have been studying thesales patterns of music CDs to forecast thesales.
• Some of the results we have obtained are:– The sales patterns are showing rapidly declining
patterns.– It is found that the Weibull model fits better than
the exponential model on the sharp decliningsales data. http://www.kyoto-su.ac.jp/~myamada/UCLA/sld001.htm
(C) Yamada & Kato 4
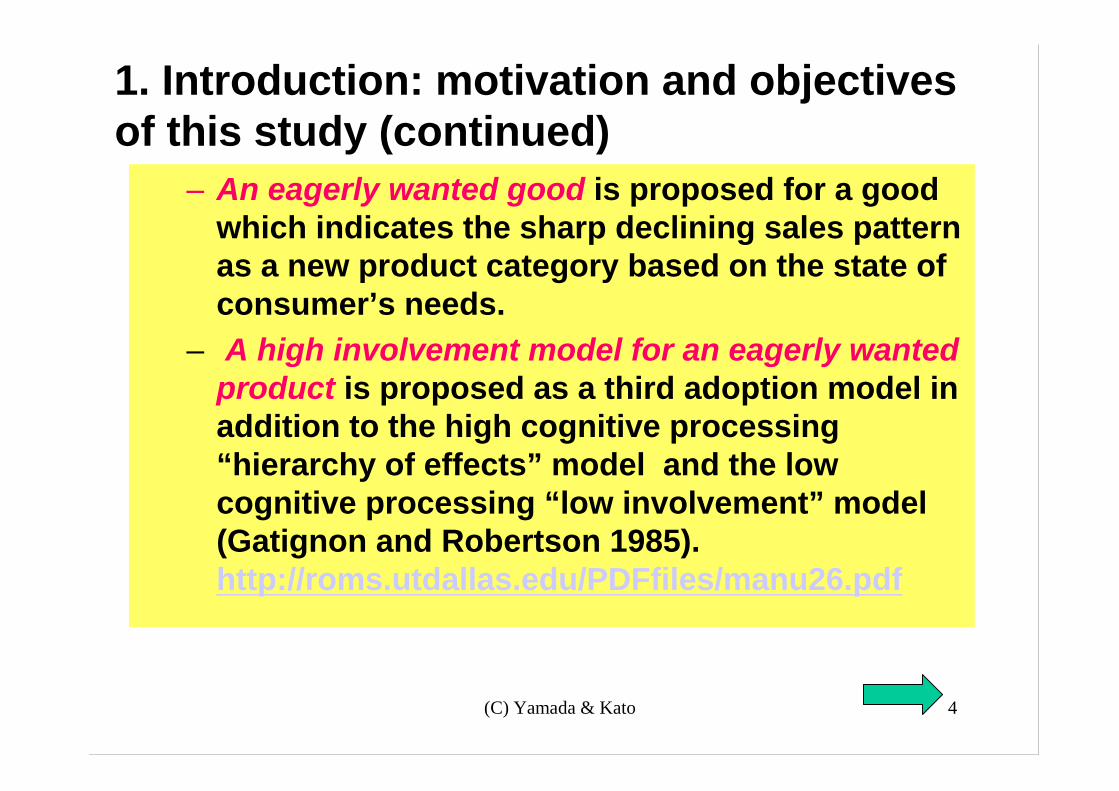
– An eagerly wanted good is proposed for a goodwhich indicates the sharp declining sales patternas a new product category based on the state ofconsumer’s needs.
– A high involvement model for an eagerly wantedproduct is proposed as a third adoption model inaddition to the high cognitive processing“hierarchy of effects” model and the lowcognitive processing “low involvement” model(Gatignon and Robertson 1985).http://roms.utdallas.edu/PDFfiles/manu26.pdf
1. Introduction: motivation and objectivesof this study (continued)
(C) Yamada & Kato 5
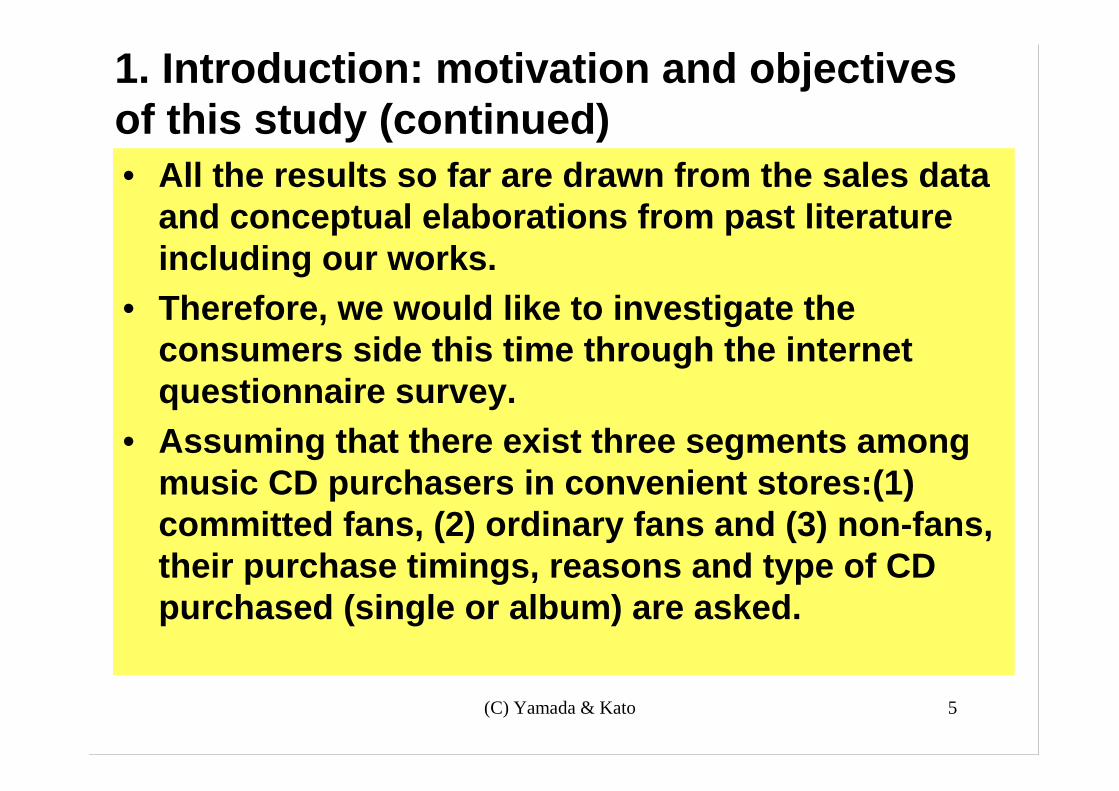
• All the results so far are drawn from the sales dataand conceptual elaborations from past literatureincluding our works.
• Therefore, we would like to investigate theconsumers side this time through the internetquestionnaire survey.
• Assuming that there exist three segments amongmusic CD purchasers in convenient stores:(1)committed fans, (2) ordinary fans and (3) non-fans,their purchase timings, reasons and type of CDpurchased (single or album) are asked.
1. Introduction: motivation and objectivesof this study (continued)

(C) Yamada & Kato 6
2. Questionnaires
Some Details about the Questionnaire Survey
Dates surveyed 9/26/02 - 10/10/02Subjects Person who bought one or more music CDs for a year
Number of people received a request mail 14,414Number of respondents 4,112
Rate of response 28.50%Male/Female response rates Male 37.9% Female 62.1%
19 years old or less: 14.9%20 - 24 years old: 17.3%25 - 29 years old: 23.2%30 - 34 years old: 20.4%35 - 39 years old: 13.0%
40 years old or more: 11.2%Married/Unmarried response rates Married 1480 (40.8%)/Unmarried 2144 (59.2%)Married 1480 (40.8%)/Unmarried 2144 (59.2%)Married 1480 (40.8%)/Unmarried 2144 (59.2%)Married 1480 (40.8%)/Unmarried 2144 (59.2%)
Age distribution of respondents
(C) Yamada & Kato 7
2.1. Skip the first half questionsCommon questions,
questions to consumers who bought music CDs atconvenience stores and
questions to consumers who have never boughtmusic CDs at convenience stores
are skipped for the time limitation.

(C) Yamada & Kato 8
Respondents are asked to answer thequestions on their latest three favoriteartist/group’s CDs purchased:
•Name of artist/group•Title of New CD•Types of CD: single, album•Purchase Timings:
1. Reserved before the release day,2. one day before the release,3. on the day of release,4. from the second day to one week,5. after one week
withinoneweek
2.2. Questions by Individual Artist/Group
(C) Yamada & Kato 9
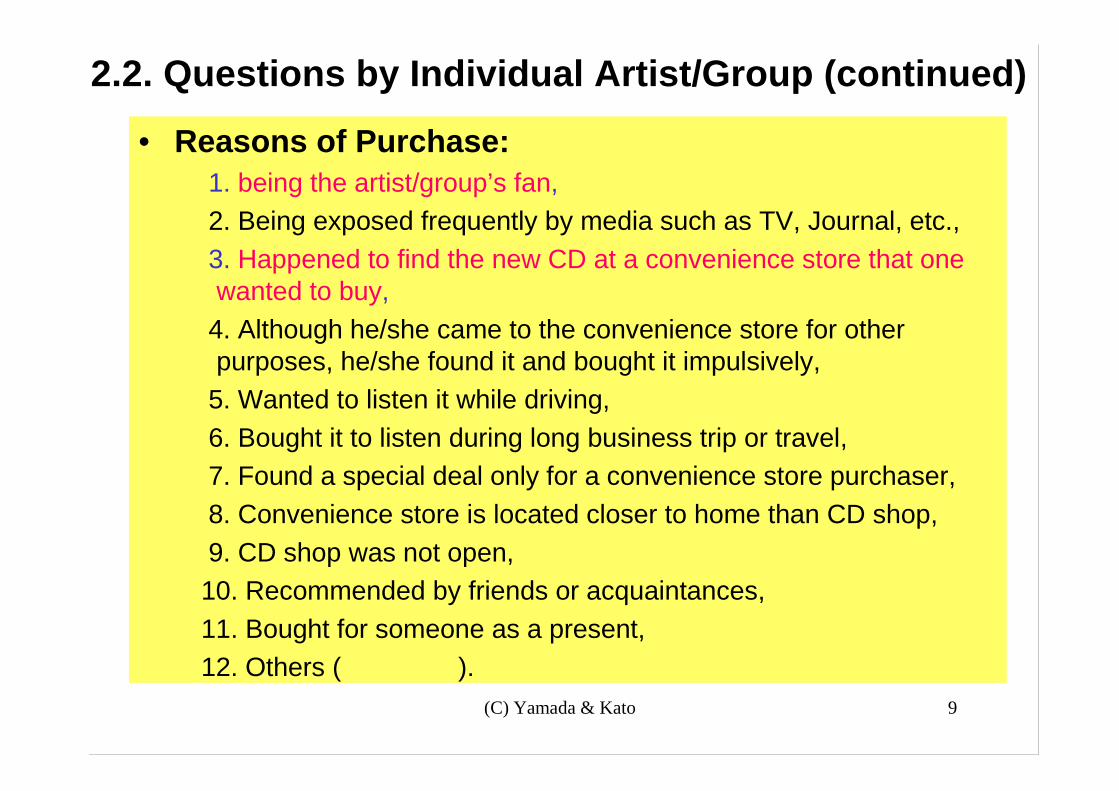
• Reasons of Purchase: 1. being the artist/group’s fan, 2. Being exposed frequently by media such as TV, Journal, etc., 3. Happened to find the new CD at a convenience store that one
wanted to buy, 4. Although he/she came to the convenience store for other
purposes, he/she found it and bought it impulsively, 5. Wanted to listen it while driving, 6. Bought it to listen during long business trip or travel, 7. Found a special deal only for a convenience store purchaser, 8. Convenience store is located closer to home than CD shop, 9. CD shop was not open, 10. Recommended by friends or acquaintances, 11. Bought for someone as a present, 12. Others ( ).
2.2. Questions by Individual Artist/Group (continued)
(C) Yamada & Kato 10
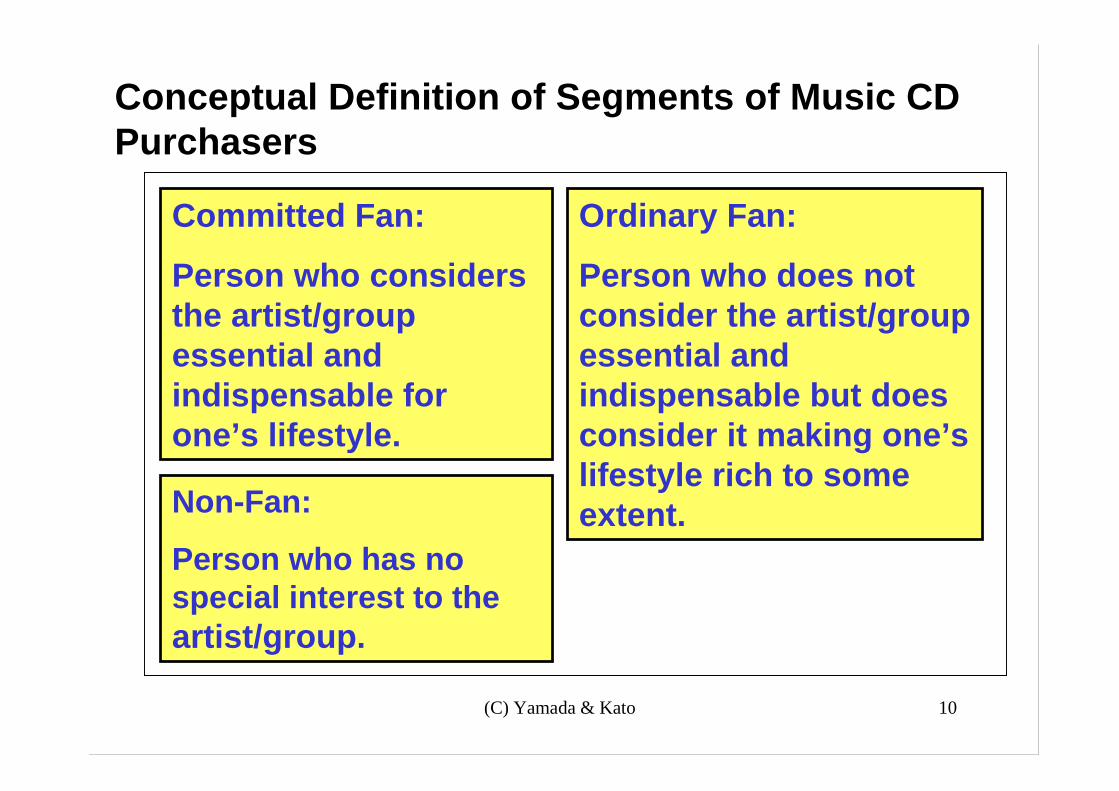
Conceptual Definition of Segments of Music CDPurchasers
Committed Fan:
Person who considersthe artist/groupessential andindispensable forone’s lifestyle.
Ordinary Fan:
Person who does notconsider the artist/groupessential andindispensable but doesconsider it making one’slifestyle rich to someextent.Non-Fan:
Person who has nospecial interest to theartist/group.

(C) Yamada & Kato 11
Operational Definition of Segments of Music CDPurchasers
Committed Fan:
Person who always buys theartist’s new CD regardless ofits type (single or album).
Person who always buys theartist’s new single CD (album,not always).
Person who always buys theartist’s new album CD (single,not always).
Ordinary Fan:
Person whosometimes buys theartist’s new singleor album CD.
Non-Fan:
Person who neverbuys the artist’snew single or albumCD for oneself butbuys for someone.

(C) Yamada & Kato 12
Expected Timings and Reasons for Each Segment
Timing of Purchase Reason of Purchase1. being the artist/group’s fan3. Happened to find the new CD at a convenience store that one wanted to buy
Ordinary Fan any time the rest
Non-Fan any time 11. Bought for a present
within one weekCommitted Fan
SegmentSegmentSegmentSegment
(C) Yamada & Kato 13
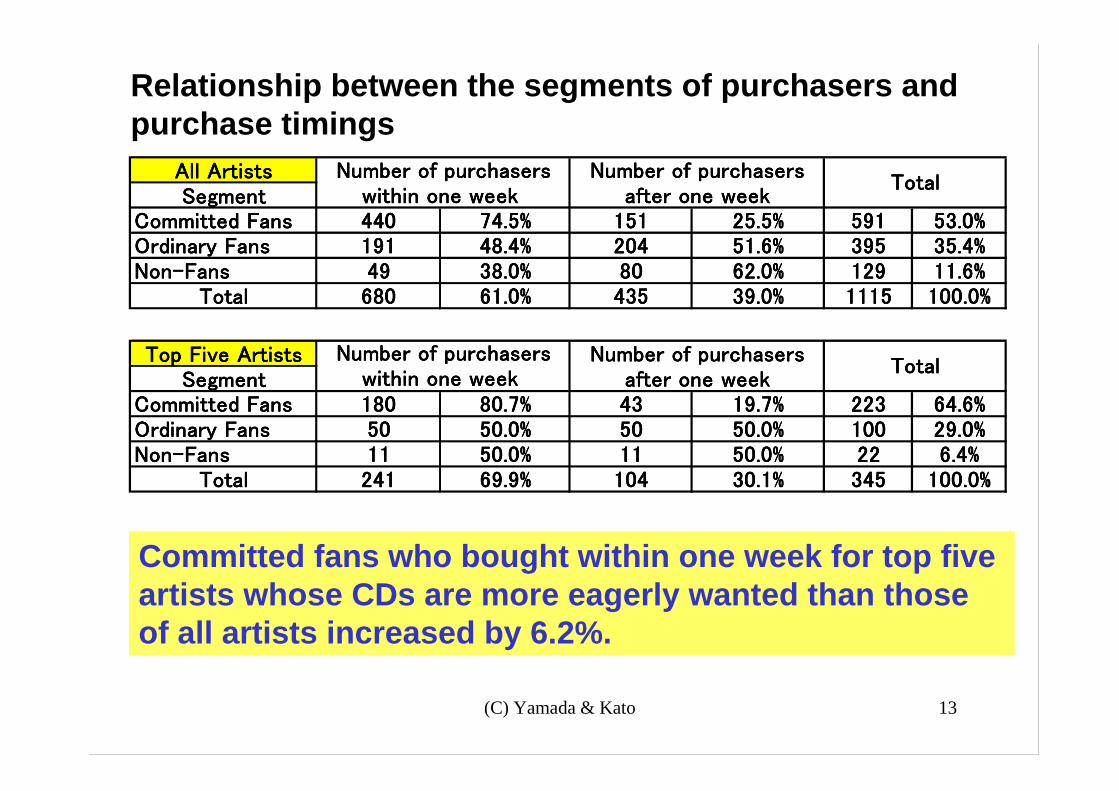
Relationship between the segments of purchasers andpurchase timings
All ArtistsAll ArtistsAll ArtistsAll ArtistsSegmentSegmentSegmentSegment
Committed FansCommitted FansCommitted FansCommitted Fans 440440440440 74.5%74.5%74.5%74.5% 151151151151 25.5%25.5%25.5%25.5% 591591591591 53.0%53.0%53.0%53.0%Ordinary FansOrdinary FansOrdinary FansOrdinary Fans 191191191191 48.4%48.4%48.4%48.4% 204204204204 51.6%51.6%51.6%51.6% 395395395395 35.4%35.4%35.4%35.4%Non-FansNon-FansNon-FansNon-Fans 49494949 38.0%38.0%38.0%38.0% 80808080 62.0%62.0%62.0%62.0% 129129129129 11.6%11.6%11.6%11.6%
TotalTotalTotalTotal 680680680680 61.0%61.0%61.0%61.0% 435435435435 39.0%39.0%39.0%39.0% 1115111511151115 100.0%100.0%100.0%100.0%
TotalTotalTotalTotalNumber of purchasersNumber of purchasersNumber of purchasersNumber of purchasers
within one week within one week within one week within one week Number of purchasersNumber of purchasersNumber of purchasersNumber of purchasers
after one weekafter one weekafter one weekafter one week
Top Five ArtistsTop Five ArtistsTop Five ArtistsTop Five ArtistsSegmentSegmentSegmentSegment
Committed FansCommitted FansCommitted FansCommitted Fans 180180180180 80.7%80.7%80.7%80.7% 43434343 19.7%19.7%19.7%19.7% 223223223223 64.6%64.6%64.6%64.6%Ordinary FansOrdinary FansOrdinary FansOrdinary Fans 50505050 50.0%50.0%50.0%50.0% 50505050 50.0%50.0%50.0%50.0% 100100100100 29.0%29.0%29.0%29.0%Non-FansNon-FansNon-FansNon-Fans 11111111 50.0%50.0%50.0%50.0% 11111111 50.0%50.0%50.0%50.0% 22222222 6.4%6.4%6.4%6.4%
TotalTotalTotalTotal 241241241241 69.9%69.9%69.9%69.9% 104104104104 30.1%30.1%30.1%30.1% 345345345345 100.0%100.0%100.0%100.0%
Number of purchasersNumber of purchasersNumber of purchasersNumber of purchasers Number of purchasersNumber of purchasersNumber of purchasersNumber of purchasersTotalTotalTotalTotal
within one week within one week within one week within one week after one weekafter one weekafter one weekafter one week
Committed fans who bought within one week for top fiveartists whose CDs are more eagerly wanted than thoseof all artists increased by 6.2%.

(C) Yamada & Kato 14
Chi-square Test
dfdfdfdf p-valuep-valuep-valuep-value
All ArtistsAll ArtistsAll ArtistsAll Artists 2222 100.20283100.20283100.20283100.20283 1.74274E-221.74274E-221.74274E-221.74274E-22 Reject HReject HReject HReject H0000
Top Five ArtistsTop Five ArtistsTop Five ArtistsTop Five Artists 2222 35.3349835.3349835.3349835.33498 2.12377E-082.12377E-082.12377E-082.12377E-08 Reject HReject HReject HReject H0000
2χ
H0: The segments of purchasers and purchase timingsare independent.
HA: The segments of purchasers and purchase timingsare dependent.
(C) Yamada & Kato 15
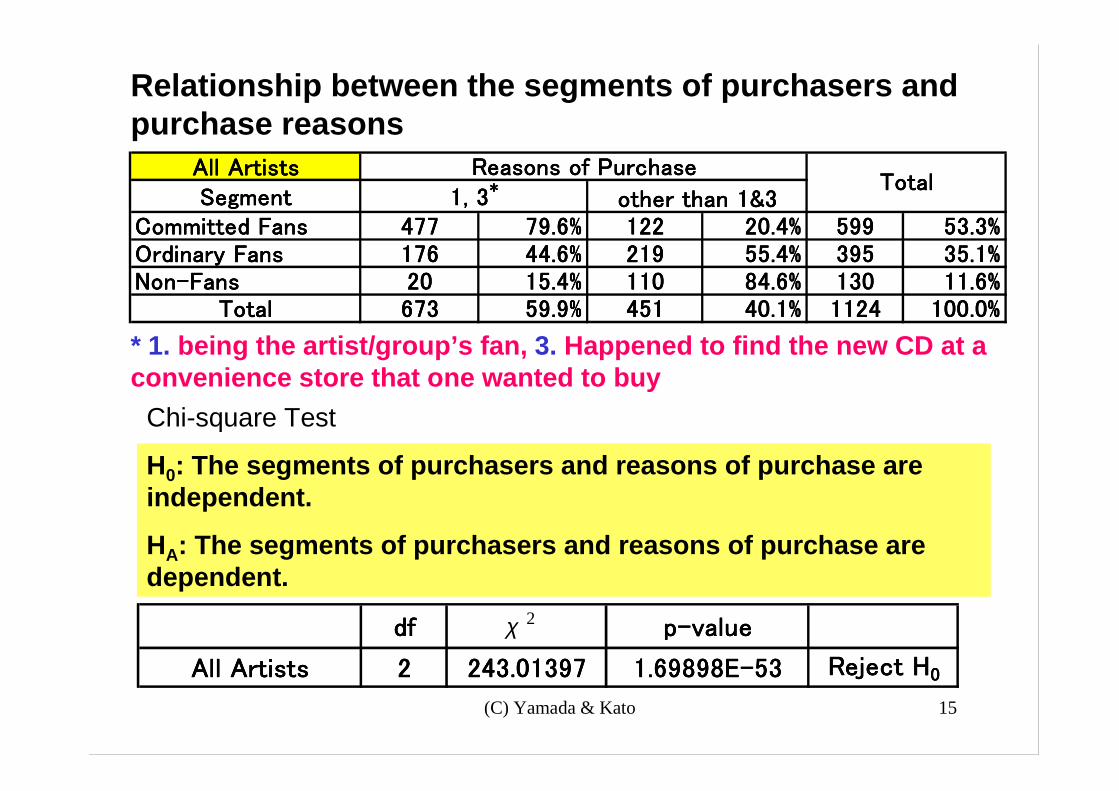
Relationship between the segments of purchasers andpurchase reasons
* 1. being the artist/group’s fan, 3. Happened to find the new CD at aconvenience store that one wanted to buy
All ArtistsAll ArtistsAll ArtistsAll ArtistsSegmentSegmentSegmentSegment
Committed FansCommitted FansCommitted FansCommitted Fans 477477477477 79.6%79.6%79.6%79.6% 122122122122 20.4%20.4%20.4%20.4% 599599599599 53.3%53.3%53.3%53.3%Ordinary FansOrdinary FansOrdinary FansOrdinary Fans 176176176176 44.6%44.6%44.6%44.6% 219219219219 55.4%55.4%55.4%55.4% 395395395395 35.1%35.1%35.1%35.1%Non-FansNon-FansNon-FansNon-Fans 20202020 15.4%15.4%15.4%15.4% 110110110110 84.6%84.6%84.6%84.6% 130130130130 11.6%11.6%11.6%11.6%
TotalTotalTotalTotal 673673673673 59.9%59.9%59.9%59.9% 451451451451 40.1%40.1%40.1%40.1% 1124112411241124 100.0%100.0%100.0%100.0%
TotalTotalTotalTotal1, 31, 31, 31, 3****
other than 1&3other than 1&3other than 1&3other than 1&3
Reasons of PurchaseReasons of PurchaseReasons of PurchaseReasons of Purchase
Chi-square Test
H0: The segments of purchasers and reasons of purchase areindependent.
HA: The segments of purchasers and reasons of purchase aredependent.
dfdfdfdf p-valuep-valuep-valuep-value
All ArtistsAll ArtistsAll ArtistsAll Artists 2222 243.01397243.01397243.01397243.01397 1.69898E-531.69898E-531.69898E-531.69898E-53 Reject HReject HReject HReject H0000
2χ
(C) Yamada & Kato 16
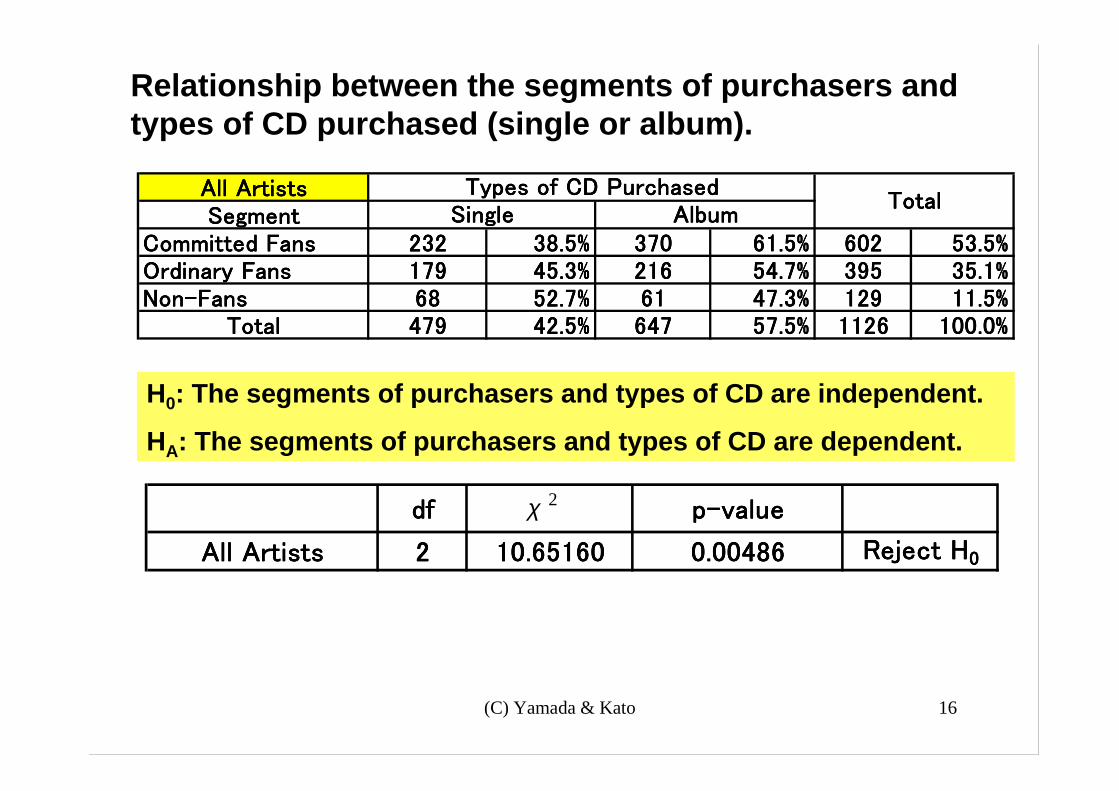
Relationship between the segments of purchasers andtypes of CD purchased (single or album).
H0: The segments of purchasers and types of CD are independent.
HA: The segments of purchasers and types of CD are dependent.
All ArtistsAll ArtistsAll ArtistsAll ArtistsSegmentSegmentSegmentSegment
Committed FansCommitted FansCommitted FansCommitted Fans 232232232232 38.5%38.5%38.5%38.5% 370370370370 61.5%61.5%61.5%61.5% 602602602602 53.5%53.5%53.5%53.5%Ordinary FansOrdinary FansOrdinary FansOrdinary Fans 179179179179 45.3%45.3%45.3%45.3% 216216216216 54.7%54.7%54.7%54.7% 395395395395 35.1%35.1%35.1%35.1%Non-FansNon-FansNon-FansNon-Fans 68686868 52.7%52.7%52.7%52.7% 61616161 47.3%47.3%47.3%47.3% 129129129129 11.5%11.5%11.5%11.5%
TotalTotalTotalTotal 479479479479 42.5%42.5%42.5%42.5% 647647647647 57.5%57.5%57.5%57.5% 1126112611261126 100.0%100.0%100.0%100.0%
Types of CD PurchasedTypes of CD PurchasedTypes of CD PurchasedTypes of CD PurchasedSingleSingleSingleSingle AlbumAlbumAlbumAlbum
TotalTotalTotalTotal
dfdfdfdf p-valuep-valuep-valuep-value
All ArtistsAll ArtistsAll ArtistsAll Artists 2222 10.6516010.6516010.6516010.65160 0.004860.004860.004860.00486 Reject HReject HReject HReject H0000
2χ

(C) Yamada & Kato 17
( ) ( ) tpt
bwt eememYct
+−+
−= −− 11 α
3. Sales Forecast by a Structurally Synthesized Model
Cumulativeunit sales
Committed fans Ordinary fans
Errorsincludingnon-fans
Eagerly-wantedgoods
Non eagerly-wanted goods
Exponential (Bass)model
Weibull model
mw: Potential market size of committed fans
mb: Potential market size of ordinary fans
Assumedto beconstant.
(C) Yamada & Kato 18
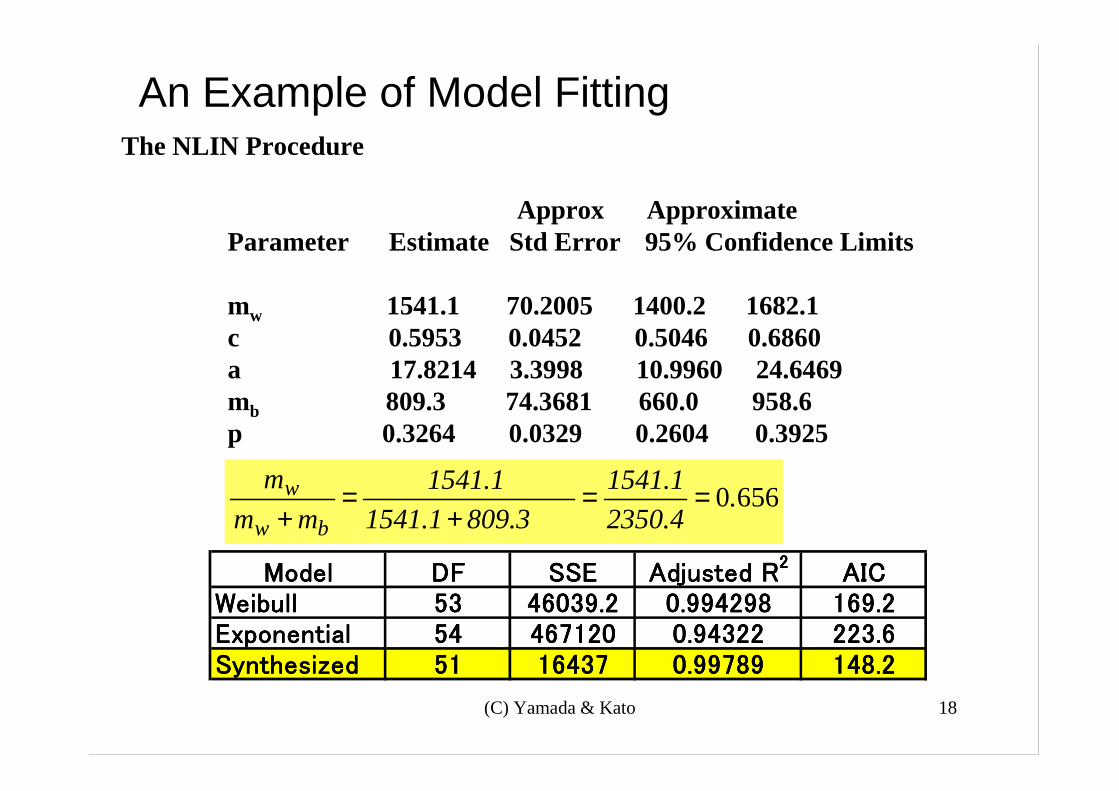
The NLIN Procedure
Approx Approximate Parameter Estimate Std Error 95% Confidence Limits
mw 1541.1 70.2005 1400.2 1682.1 c 0.5953 0.0452 0.5046 0.6860 a 17.8214 3.3998 10.9960 24.6469 mb 809.3 74.3681 660.0 958.6 p 0.3264 0.0329 0.2604 0.3925
6560.2350.41541.1
809.3 1541.1 1541.1
mmm
bw
w ==+
=+
An Example of Model Fitting
ModelModelModelModel DFDFDFDF SSESSESSESSE Adjusted RAdjusted RAdjusted RAdjusted R2222 AICAICAICAIC
WeibullWeibullWeibullWeibull 53535353 46039.246039.246039.246039.2 0.9942980.9942980.9942980.994298 169.2169.2169.2169.2ExponentialExponentialExponentialExponential 54545454 467120467120467120467120 0.943220.943220.943220.94322 223.6223.6223.6223.6SynthesizedSynthesizedSynthesizedSynthesized 51515151 16437164371643716437 0.997890.997890.997890.99789 148.2148.2148.2148.2
(C) Yamada & Kato 19
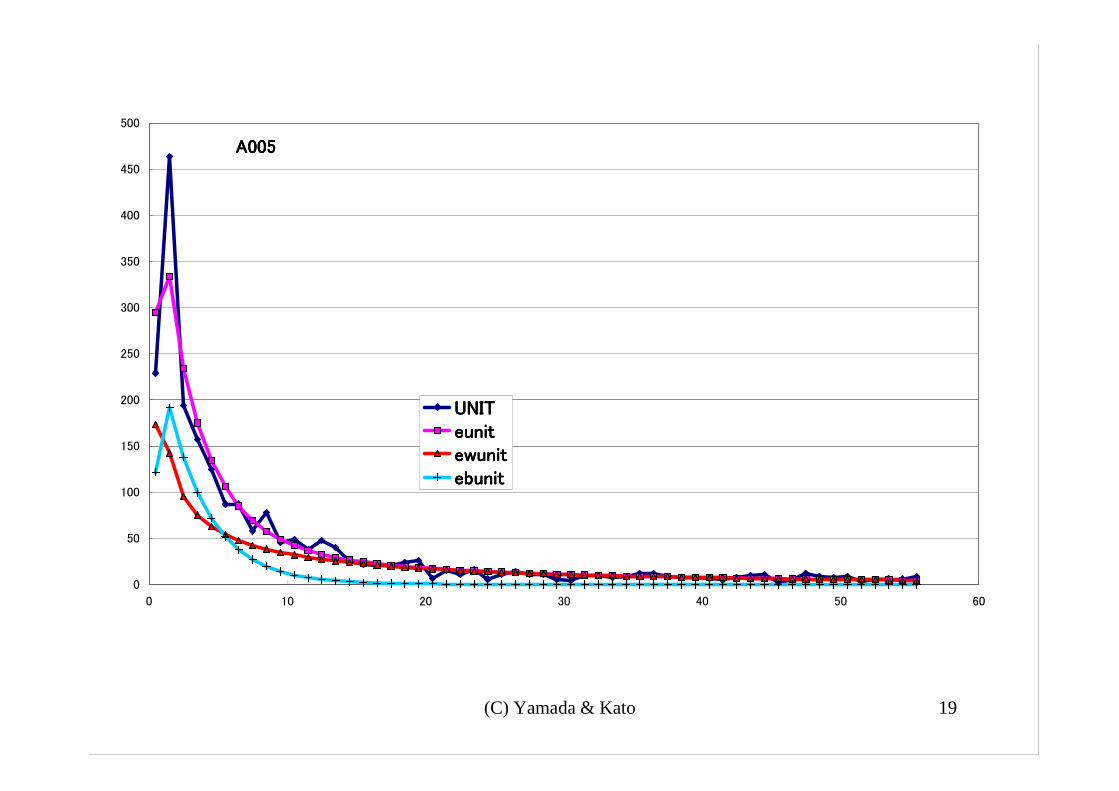
0
50
100
150
200
250
300
350
400
450
500
0 10 20 30 40 50 60
UNITUNITUNITUNITeuniteuniteuniteunitewunitewunitewunitewunitebunitebunitebunitebunit
A005A005A005A005

(C) Yamada & Kato 20
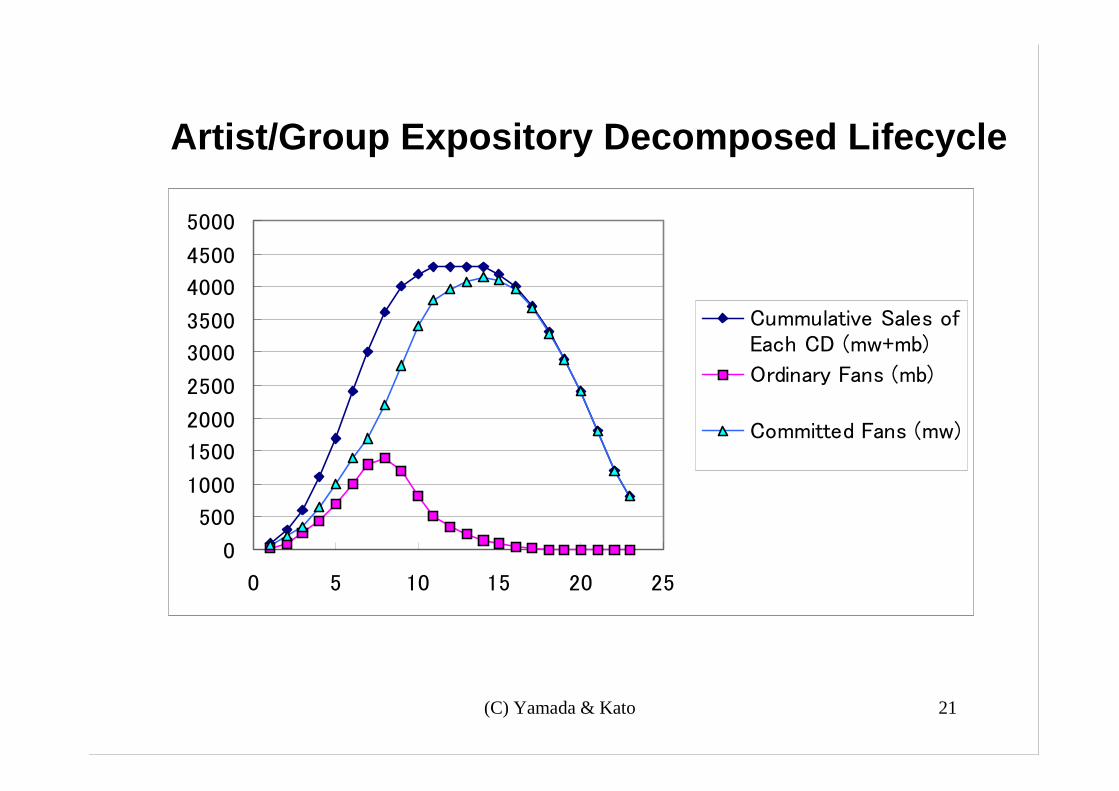
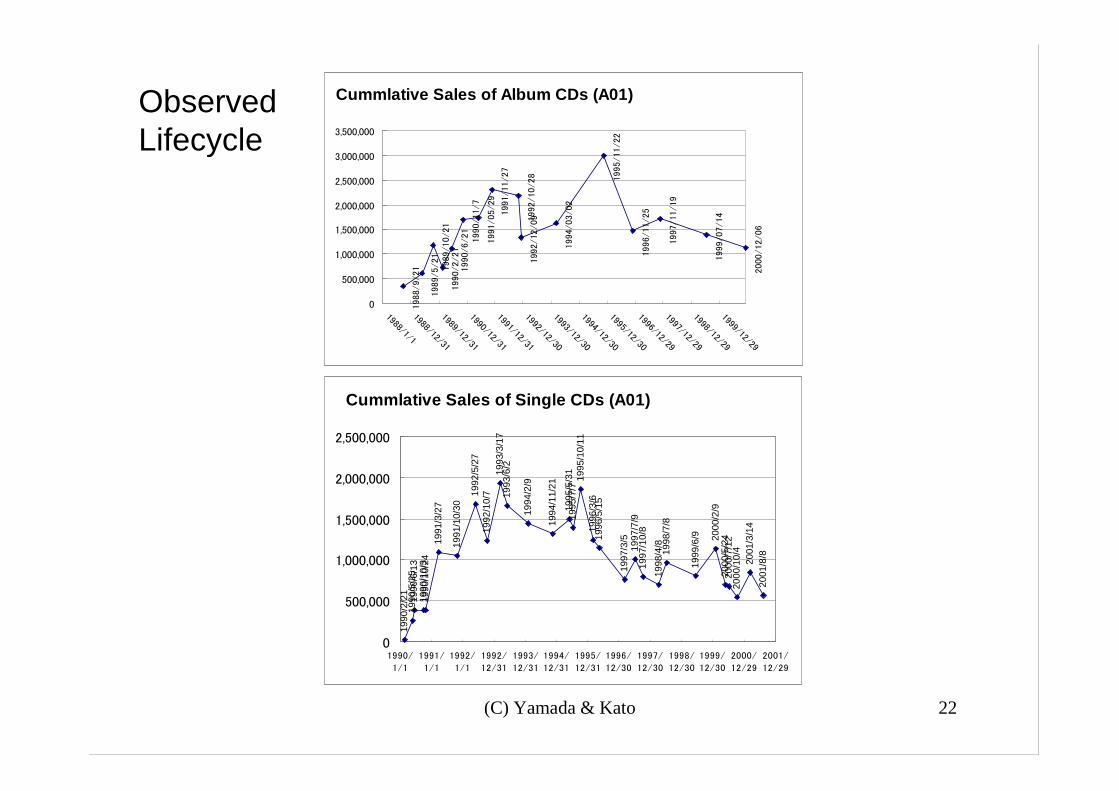
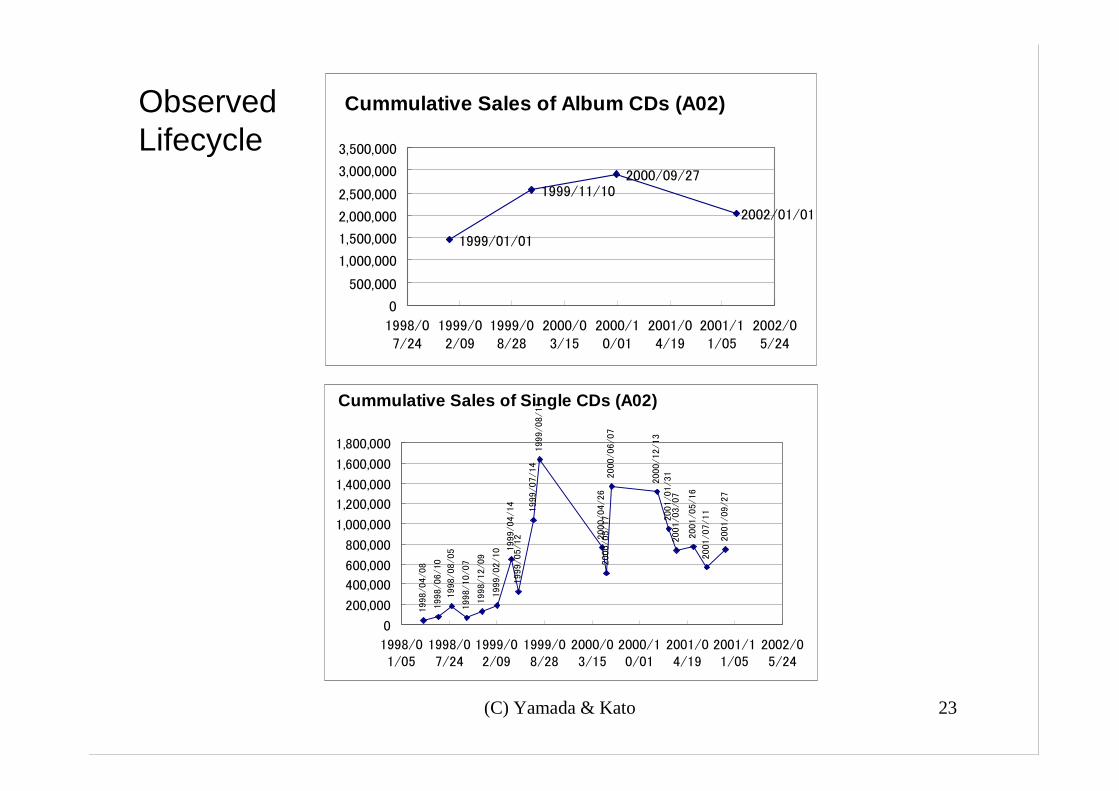
• Now, we can estimate the potential market sizes(mw, mb) of committed fans and ordinary fansevery time when a new music CD is released.
• Therefore, we can obtain a decomposed lifecyclealong with an artist/group’s growth like thetechnology generation (Bass and Bass 2001).
• As an example, if we assume that ordinary fansdiffuse like a normal curve within a shorterperiod of time than committed fans, then we canhave following expository decomposed lifecycle.
4. Artist/Group’s Lifecycle
(C) Yamada & Kato 21
Artist/Group Expository Decomposed Lifecycle
0
500
1000
1500
2000
2500
3000
3500
4000
4500
5000
0 5 10 15 20 25
Cummulative Sales ofEach CD (mw+mb)
Ordinary Fans (mb)
Committed Fans (mw)
(C) Yamada & Kato 22
1988/9/21
1989/5/21
1989/10/21
1990/2/21
1990/6/21
1990/11/7
1991/05/29
1991/11/27
1992/10/28
1992/12/09
1994/03/02
1995/11/22
1996/11/25
1997/11/19
1999/07/14
2000/12/06
0
500,000
1,000,000
1,500,000
2,000,000
2,500,000
3,000,000
3,500,000
1988/1/11988/12/311989/12/311990/12/311991/12/311992/12/301993/12/301994/12/301995/12/301996/12/291997/12/291998/12/291999/12/29
Cummlative Sales of Album CDs (A01)
1990
/2/2
119
90/5
/25
1990
/6/1
319
90/1
0/3
1990
/10/
2419
91/3
/27
1991
/10/
30
1992
/5/2
719
92/1
0/7
1993
/3/1
719
93/6
/2
1994
/2/9
1994
/11/
21
1995
/5/3
119
95/7
/719
95/1
0/11
1996
/3/6
1996
/5/1
5
1997
/3/5
1997
/7/9
1997
/10/
819
98/4
/819
98/7
/8
1999
/6/9 20
00/2
/920
00/5
/24
2000
/7/1
220
00/1
0/4
2001
/3/1
420
01/8
/8
0
500,000
1,000,000
1,500,000
2,000,000
2,500,000
1990/
1/1
1991/
1/1
1992/
1/1
1992/
12/31
1993/
12/31
1994/
12/31
1995/
12/31
1996/
12/30
1997/
12/30
1998/
12/30
1999/
12/30
2000/
12/29
2001/
12/29
Cummlative Sales of Single CDs (A01)
ObservedLifecycle
(C) Yamada & Kato 23
1999/01/01
1999/11/102000/09/27
2002/01/01
0
500,000
1,000,000
1,500,000
2,000,000
2,500,000
3,000,000
3,500,000
1998/07/24
1999/02/09
1999/08/28
2000/03/15
2000/10/01
2001/04/19
2001/11/05
2002/05/24
Cummulative Sales of Album CDs (A02)
1998/04/08
1998/06/10
1998/08/05
1998/10/07
1998/12/09
1999/02/10 1
999/04/14
1999/05/12
1999/07/14
1999/08/11
2000/04/26
2000/05/17
2000/06/07
2000/12/13
2001/01/31
2001/03/07
2001/05/16
2001/07/11
2001/09/27
0
200,000
400,000
600,000
800,000
1,000,000
1,200,000
1,400,000
1,600,000
1,800,000
1998/01/05
1998/07/24
1999/02/09
1999/08/28
2000/03/15
2000/10/01
2001/04/19
2001/11/05
2002/05/24
Cummulative Sales of Single CDs (A02)
ObservedLifecycle
(C) Yamada & Kato 24
Managerial Implications
• The artist/group decomposed lifecycle givesthe manager the trend and current informationwith regard to the respective potential marketsize in absolute/ratio form so that the managercan design his/her marketing strategiesintelligently.
(C) Yamada & Kato 25
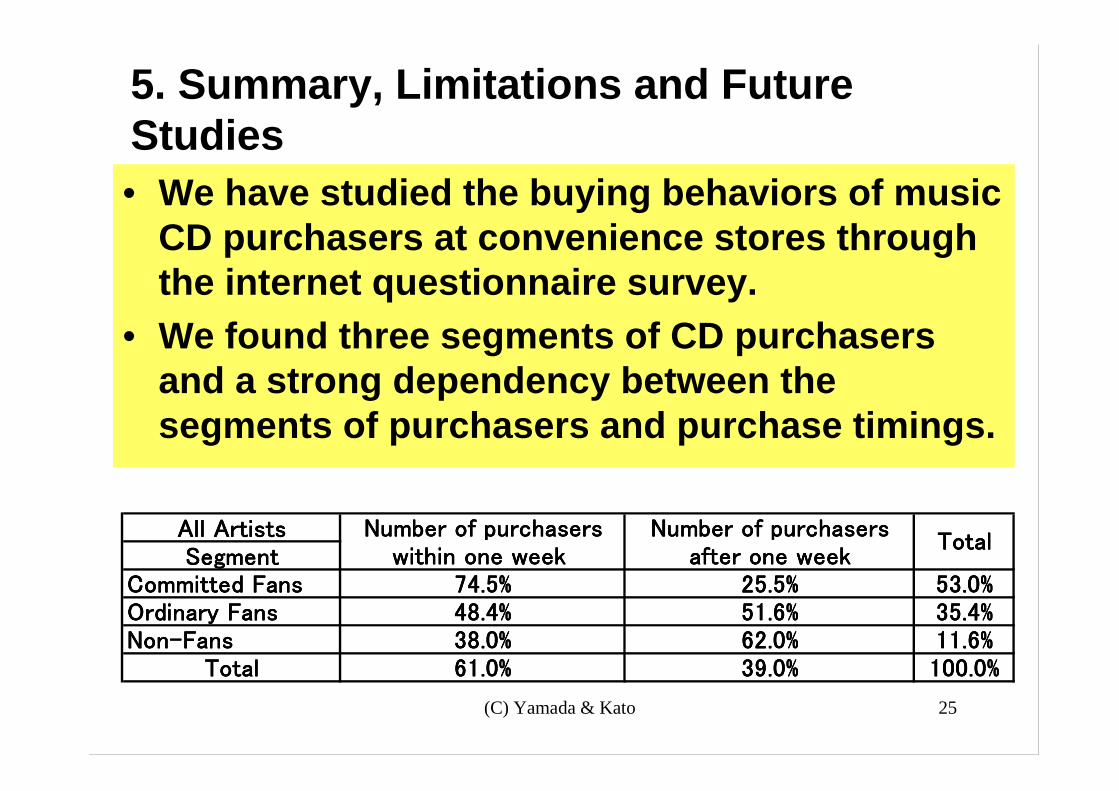
5. Summary, Limitations and FutureStudies• We have studied the buying behaviors of music
CD purchasers at convenience stores throughthe internet questionnaire survey.
• We found three segments of CD purchasersand a strong dependency between thesegments of purchasers and purchase timings.
All ArtistsAll ArtistsAll ArtistsAll Artists Number of purchasersNumber of purchasersNumber of purchasersNumber of purchasers Number of purchasersNumber of purchasersNumber of purchasersNumber of purchasersSegmentSegmentSegmentSegment within one week within one week within one week within one week after one weekafter one weekafter one weekafter one week
Committed FansCommitted FansCommitted FansCommitted Fans 74.5%74.5%74.5%74.5% 25.5%25.5%25.5%25.5% 53.0%53.0%53.0%53.0%Ordinary FansOrdinary FansOrdinary FansOrdinary Fans 48.4%48.4%48.4%48.4% 51.6%51.6%51.6%51.6% 35.4%35.4%35.4%35.4%Non-FansNon-FansNon-FansNon-Fans 38.0%38.0%38.0%38.0% 62.0%62.0%62.0%62.0% 11.6%11.6%11.6%11.6%
TotalTotalTotalTotal 61.0%61.0%61.0%61.0% 39.0%39.0%39.0%39.0% 100.0%100.0%100.0%100.0%
TotalTotalTotalTotal
(C) Yamada & Kato 26
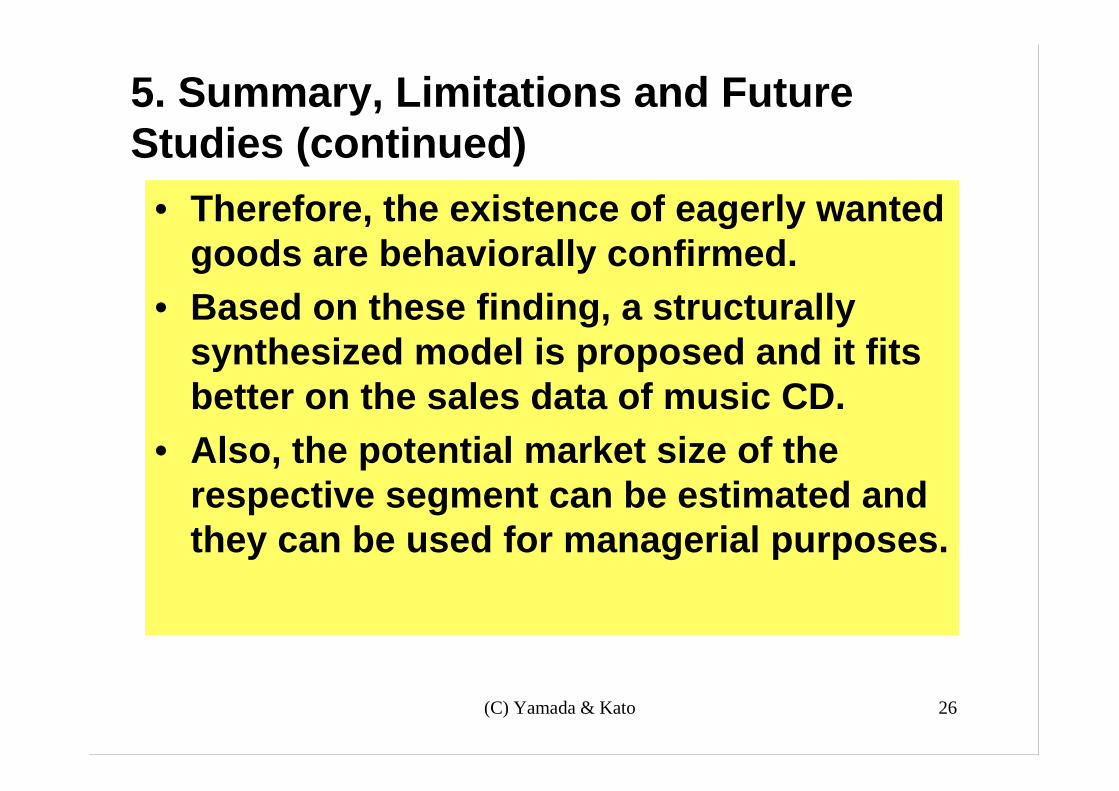
• Therefore, the existence of eagerly wantedgoods are behaviorally confirmed.
• Based on these finding, a structurallysynthesized model is proposed and it fitsbetter on the sales data of music CD.
• Also, the potential market size of therespective segment can be estimated andthey can be used for managerial purposes.
5. Summary, Limitations and FutureStudies (continued)
(C) Yamada & Kato 27
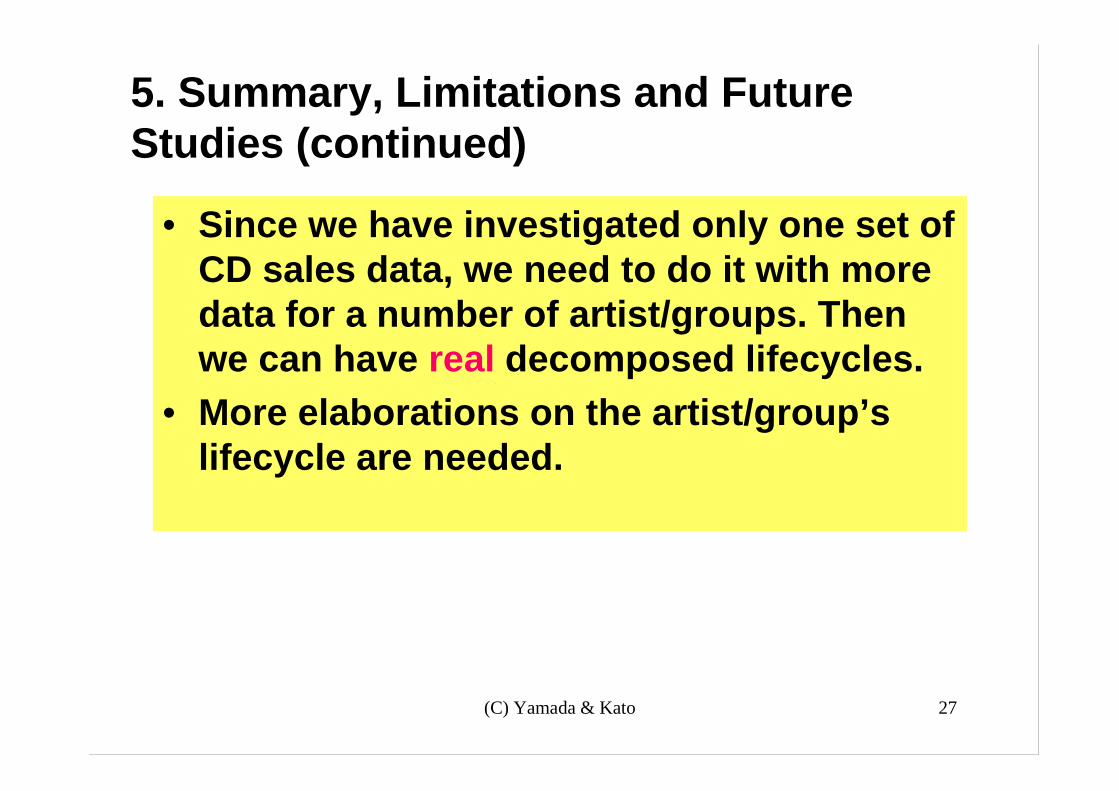
• Since we have investigated only one set ofCD sales data, we need to do it with moredata for a number of artist/groups. Thenwe can have real decomposed lifecycles.
• More elaborations on the artist/group’slifecycle are needed.
5. Summary, Limitations and FutureStudies (continued)
(C) Yamada & Kato 28
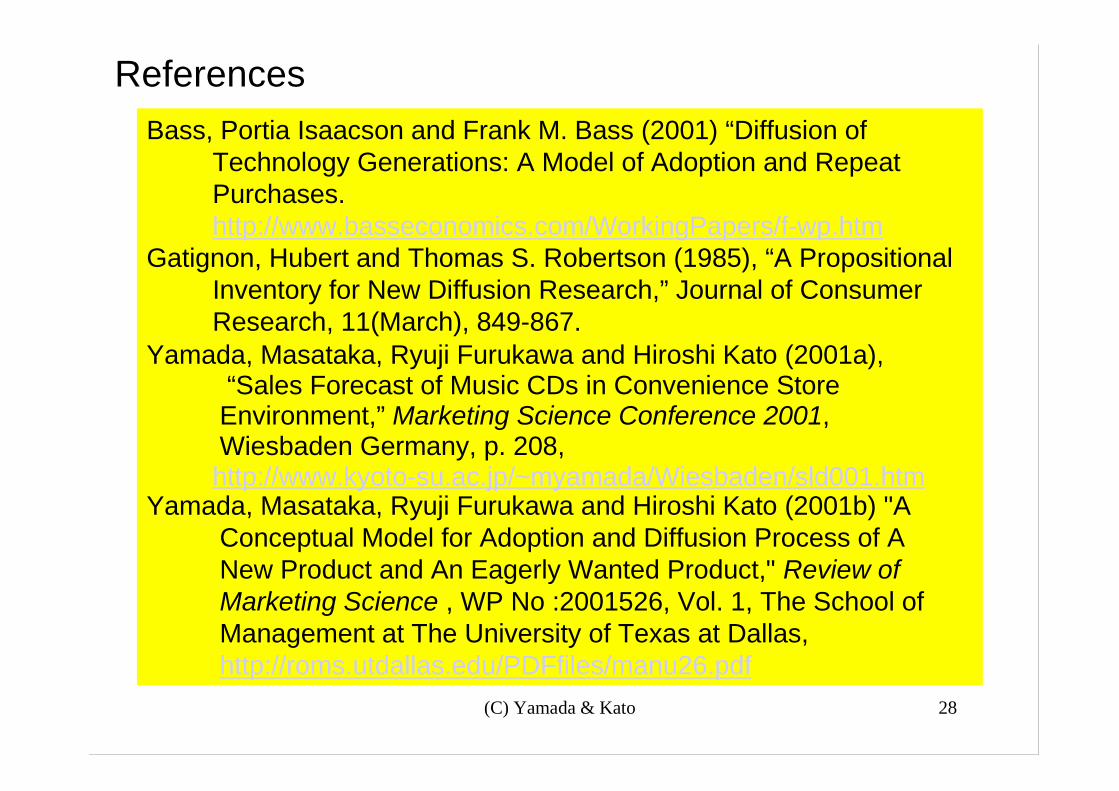
ReferencesBass, Portia Isaacson and Frank M. Bass (2001) “Diffusion of Technology Generations: A Model of Adoption and Repeat Purchases. http://www.basseconomics.com/WorkingPapers/f-wp.htmGatignon, Hubert and Thomas S. Robertson (1985), “A Propositional Inventory for New Diffusion Research,” Journal of Consumer Research, 11(March), 849-867.Yamada, Masataka, Ryuji Furukawa and Hiroshi Kato (2001a), “Sales Forecast of Music CDs in Convenience Store Environment,” Marketing Science Conference 2001, Wiesbaden Germany, p. 208, http://www.kyoto-su.ac.jp/~myamada/Wiesbaden/sld001.htmYamada, Masataka, Ryuji Furukawa and Hiroshi Kato (2001b) "A Conceptual Model for Adoption and Diffusion Process of A New Product and An Eagerly Wanted Product," Review of Marketing Science , WP No :2001526, Vol. 1, The School of Management at The University of Texas at Dallas, http://roms.utdallas.edu/PDFfiles/manu26.pdf
(C) Yamada & Kato 29
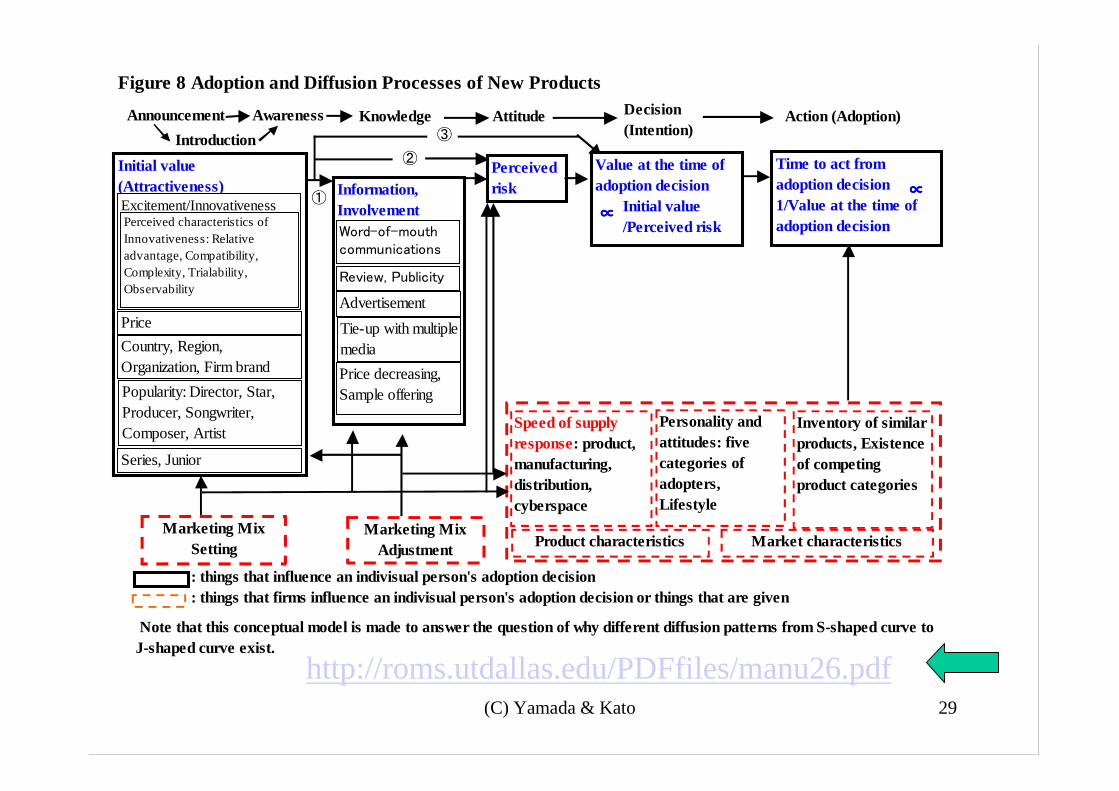
Figure 8 Adoption and Diffusion Processes of New Products
Announcement AwarenessIntroduction
Knowledge Attitude Action (Adoption)
Marketing MixSetting
Note that this conceptual model is made to answer the question of why different diffusion patterns from S-shaped curve toJ-shaped curve exist.
: things that influence an indivisual person's adoption decision: things that firms influence an indivisual person's adoption decision or things that are given
Marketing MixAdjustment
Time to act fromadoption decision1/Value at the time ofadoption decision
∝∝∝∝
Value at the time ofadoption decision Initial value /Perceived risk∝∝∝∝
PerceivedriskInformation,
InvolvementWord-of-mouthcommunications
Review, Publicity
AdvertisementTie-up with multiplemediaPrice decreasing,Sample offering
Decision(Intention)
Initial value(Attractiveness)Excitement/InnovativenessPerceived characteristics ofInnovativeness: Relativeadvantage, Compatibility,Complexity, Trialability,Observability
PriceCountry, Region,Organization, Firm brandPopularity: Director, Star,Producer, Songwriter,Composer, Artist
Series, Junior
Speed of supplyresponse: product,manufacturing,distribution,cyberspace
Personality andattitudes: fivecategories ofadopters,Lifestyle
Inventory of similarproducts, Existenceof competingproduct categories
Product characteristics Market characteristics
②
③
①
http://roms.utdallas.edu/PDFfiles/manu26.pdf
(C) Yamada & Kato 30
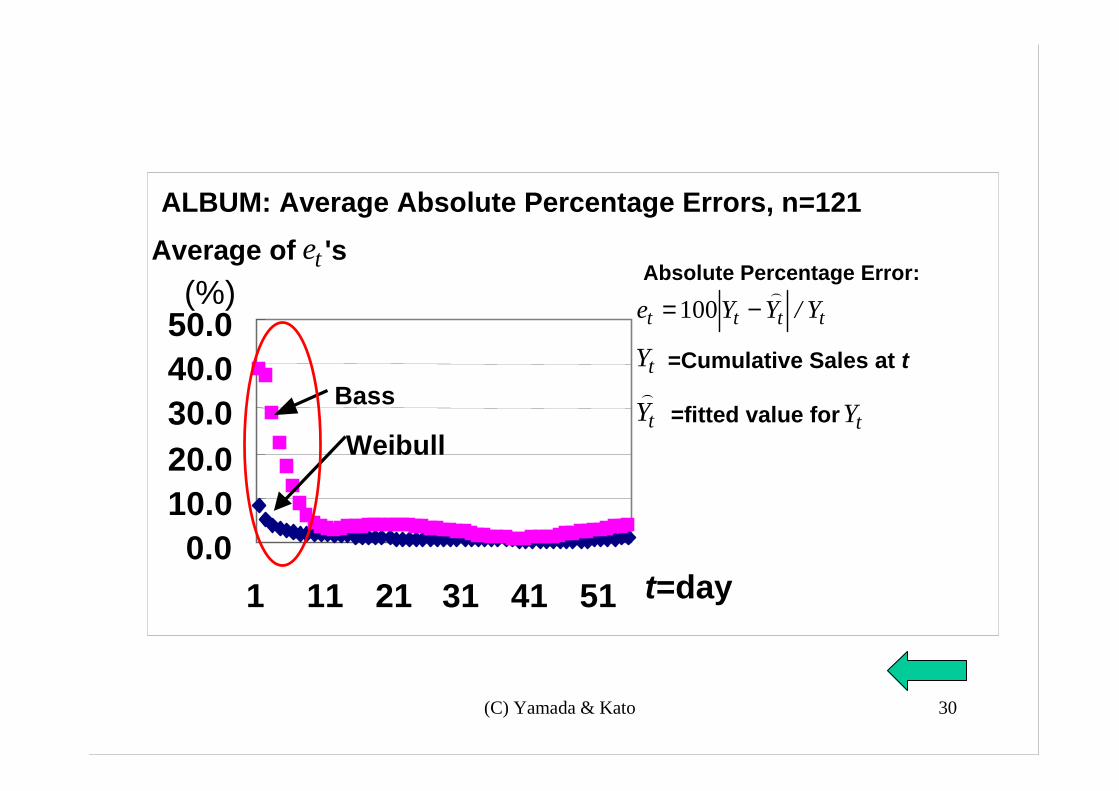
0.010.020.030.040.050.0
1 11 21 31 41 51
ALBUM: Average Absolute Percentage Errors, n=121
t=day
Average of 's(%)
Bass
Weibull
=Cumulative Sales at t
=fitted value for
Absolute Percentage Error:
tttt Y/YYe)
−=100
tY)
tY
te
tY