a strategy for assessing potential drug-drug interactions of a...
TRANSCRIPT

1521-009X/42/9/1456–1465$25.00 http://dx.doi.org/10.1124/dmd.114.058305DRUG METABOLISM AND DISPOSITION Drug Metab Dispos 42:1456–1465, September 2014Copyright ª 2014 by The American Society for Pharmacology and Experimental Therapeutics
A Strategy for Assessing Potential Drug-Drug Interactions ofa Concomitant Agent against a Drug Absorbed via an Intestinal
Transporter in Humans
Akiko Mizuno-Yasuhira, Yasuhiro Nakai, Emi Gunji, Saeko Uchida, Teisuke Takahashi,Kohnosuke Kinoshita, Shigeji Jingu, Soichi Sakai, Yoshishige Samukawa, and
Jun-ichi Yamaguchi
Departments of Drug Safety and Pharmacokinetics Laboratories, Saitama, Japan (A.M.-Y., K.K., S.J., J.Y.) and Molecular Functionand Pharmacology Laboratories (E.G., S.U., T.T.), Taisho Pharmaceutical Co., Ltd., Saitama, Japan; Departments of Development
Headquarters, (Y.N., Y.S.); and Clinical Research (S.S.), Taisho Pharmaceutical Co. Ltd., Tokyo, Japan (S.S.)
Received April 1, 2014; accepted July 8, 2014
ABSTRACT
A strategy for assessing potential drug-drug interactions (DDIs) basedon a simulated intestinal concentration is described. The proposedpredictionmethodwas applied to the DDI assessment of luseogliflozin,a novel antidiabetic drug, against miglitol absorbed via the intestinalsodium-glucose cotransporter 1 (SGLT1). The method involves foursteps: collection of physicochemical and pharmacokinetic parametersof luseogliflozin for use in a computer simulation; evaluation of thevalidity of these parameters by verifying the goodness of fit betweensimulated and observed plasma profiles; simulation of the intestinalluseogliflozin concentration-time profile using the Advanced Compart-ment Absorption and Transit (ACAT) model in a computer program andestimation of the time spent above a value 10-fold higher than the IC50
value (TAIC) for SGLT1; and evaluation of the DDI potential of
luseogliflozin by considering the percentage of TAIC against the miglitolTmax (time for Cmax) value (TAIC/Tmax). An initial attempt to prove thevalidity of this method was performed in rats. The resulting TAIC/Tmax inrats was 32%, suggesting a low DDI potential of luseogliflozin againstmiglitol absorption. The validity was then confirmed using an in vivointeraction study in rats. In humans, luseogliflozin was expected tohave no DDI potential against miglitol absorption, since the TAIC/Tmax
in humans was lower than that in rats. This prediction was proven, asexpected, in a clinical interaction study. In conclusion, the presentstrategy based on a simulation of the intestinal concentration-timeprofile using dynamic modeling would be useful for assessing theclinical DDI potential of a concomitant agent against drugs absorbedvia an intestinal transporter.
Introduction
Drug-drug interactions (DDIs), which involve the inhibition/induction of drug-metabolizing enzymes or transporters, may result inadverse drug reactions and a possible loss of efficacy. For these reasons,understanding DDIs that might occur during the process of absorption,metabolism, or excretion is a key component of clinical drug de-velopment to ensure patient safety and drug efficacy, and is an integralpart of the regulatory review process that must be undertaken prior tomarket approval. Since clinical interaction studies are expensive andtime consuming, an alternative strategy for predicting the DDI potentialin humans is needed. New approaches based on the latest scientificknowledge and tools can help to reduce both the cost and time requiredto develop and evaluate new drugs. For example, the extensive use ofcomputer-based modeling and simulation could be a valuable tool. The
prediction of DDI potential using modeling and simulation has alsobeen mentioned in regulatory guidances published by both the U.S.Food and Drug Administration (FDA) (www.fda.gov/downloads/Drugs/GuidanceComplianceRegulatoryInformation/Guidances/ucm292362.pdf)and the European Medicines Agency (www.ema.europa.eu/docs/en_GB/document_library/Scientific_guideline/2012/07/WC500129606.pdf), inwhich the assessment of DDIs using static and dynamic models, in-cluding physiologically based pharmacokinetics models, is recommended.Indeed, various prediction methods using static and dynamic models formetabolism-based DDIs have been reported, and a dynamic modelingapproach appears to allow a more accurate prediction of the DDIpotential than a static modeling approach (Kato et al., 2008; Fahmiet al., 2009). On the other hand, prediction methods using dynamicmodels for transporter-based DDI potentials during intestinal absorptionhave not yet been reported, with the exception of reports describingP-glycoprotein–mediated efflux (Neuhoff et al., 2013; Reyner et al.,2013). Furthermore, no methods using dynamic modeling to predict thedx.doi.org/10.1124/dmd.114.058305.
ABBREVIATIONS: ACAT, Advanced Compartment Absorption and Transit; AIC, Akaike information criterion; AUC0-t, area under the curve fromzero to time t; CI, confidence interval; CL, total clearance; DDI, drug-drug interaction; FDA, U.S. Food and Drug Administration; Fg, intestinalavailability; Fh, hepatic availability; FPE, first-pass effect; hSGLT, human sodium-glucose cotransporter; [I2], concentration of inhibitor in thegastrointestinal tract arising from the highest approved clinical dose dissolved in 250 ml of water; IS, internal standard; iv, intravenous; k12, rateconstant for compartment 1 to 2; k21, rate constant for compartment 2 to 1; Ka, absorption rate constant; LC-MS/MS, liquid chromatography–tandem mass spectrometry; a-MG, methyl-a-D-glucopyranoside; Peff, effective permeability; PK, pharmacokinetics; rSGLT, rat sodium-glucosecotransporter; SGLT, sodium-glucose cotransporter; TAIC, time spent above a value 10-fold higher than the IC50 value; Tmax, time for Cmax;Vc, volume of distribution.
1456
at ASPE
T Journals on A
pril 17, 2020dm
d.aspetjournals.orgD
ownloaded from
DDI potential against drugs absorbed via an intestinal transporter havebeen reported to date.Although membrane transporters are not as well recognized as
metabolizing enzymes, they can have important effects on pharma-cokinetics (PK) and drug exposure (Shugarts and Benet, 2009).Therefore, a suitable approach for predicting the human DDI potentialof a concomitant agent against drugs absorbed via intestinal transportersis needed.Sodium-glucose cotransporters (SGLTs) participate in the process
of glucose absorption and include SGLT1, which is largely found insmall intestinal cells, as well as SGLT2, which is mainly located in theproximal tubule in the kidneys (Hediger and Rhoads, 1994; Chenet al., 2010; Hummel et al., 2011). In the current study, miglitol andluseogliflozin were adopted as model compounds for a SGLT1substrate (Kuboyama et al., 2006; Pharmaceuticals and Medical De-vices Agency, Japan, http://www.info.pmda.go.jp/shinyaku/P200500031/index.html) and a concomitant drug, respectively. These compoundsare used in combination during clinical treatment. Miglitol, ana-glucosidase inhibitor, is absorbed via SGLT1 and is a widelyprescribed drug for the treatment of type 2 diabetes mellitus; miglitolacts by influencing carbohydrate digestion to blunt the postprandialblood glucose increase (Sels et al., 1999). Luseogliflozin is a noveland potent selective SGLT2 inhibitor (Kakinuma et al., 2010; Suzukiet al., 2012; Washburn and Poucher, 2013) that is used orally for thetreatment of type 2 diabetes. Selective SGLT2 inhibitors for type 2diabetes are now receiving special attention because of their noveland safe mechanisms of action. SGLT2 is responsible for 90% ofglucose reabsorption (Hediger and Rhoads, 1994; Pérez López et al.,2010), and the inhibition of SGLT2 leads to a decrease in bloodglucose through an increase in the renal excretion of excess glucose.Almost all selective SGLT2 inhibitors have a common basicstructure similar to that of phlorizin, a natural nonselective SGLTinhibitor that has long been known to increase glucose excretion intothe urine and to reduce the blood glucose level in diabetic animals(Khan and Efendic, 1995; Krook et al., 1997). These compounds alsohave the potential to inhibit SGLT1 slightly. Although luseogliflozinhas a relatively high selectivity for SGLT2 compared with similarkinds of drugs (Suzuki et al., 2012), the value of [I2], which representsthe concentration of inhibitor in the gastrointestinal tract arising from thehighest approved clinical dose (5 mg) dissolved in 250 ml of water,was much higher than the 50% inhibitory concentration (IC50) valuefor SGLT1 (SGLT IC50). The value of [I2]/SGLT1 IC50 was higherthan 10, which is the value used as a decision criterion for performinga clinical DDI study as mentioned in the current FDA DDI draftguidance.The objective of this study was to propose a strategy for assessing
the clinical DDI potential of a concomitant agent against a drug that isabsorbed via an intestinal transporter by performing a DDI assessmentof luseogliflozin against miglitol.
Materials and Methods
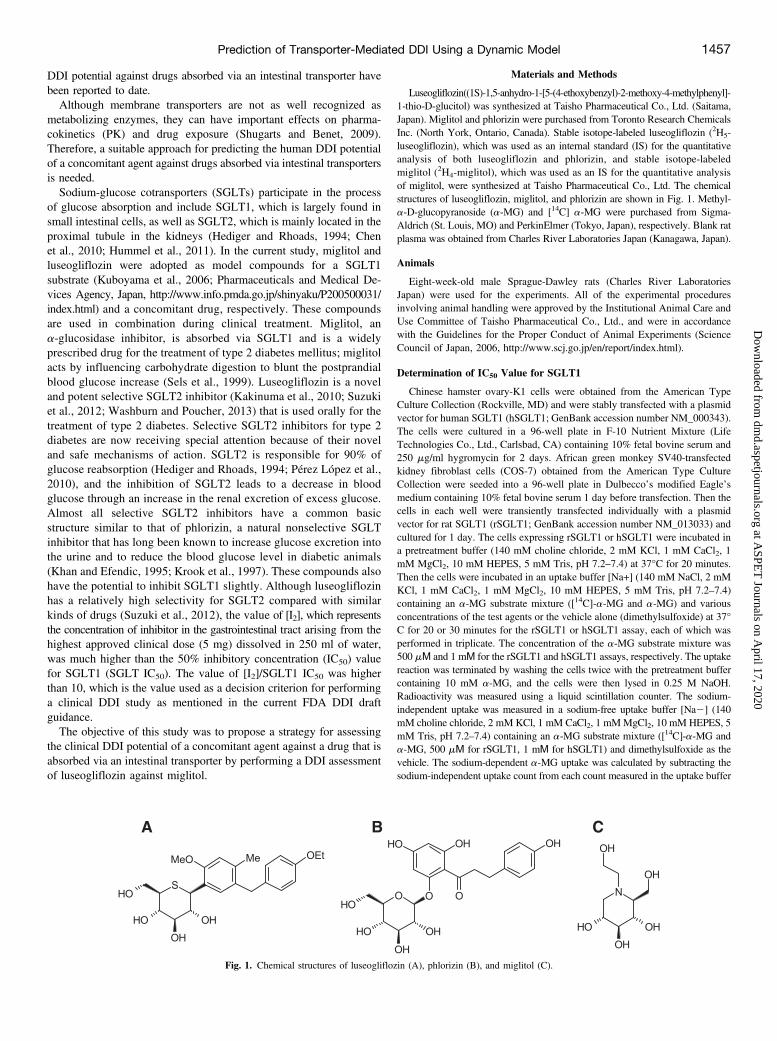
Luseogliflozin((1S)-1,5-anhydro-1-[5-(4-ethoxybenzyl)-2-methoxy-4-methylphenyl]-1-thio-D-glucitol) was synthesized at Taisho Pharmaceutical Co., Ltd. (Saitama,Japan). Miglitol and phlorizin were purchased from Toronto Research ChemicalsInc. (North York, Ontario, Canada). Stable isotope-labeled luseogliflozin (2H5-luseogliflozin), which was used as an internal standard (IS) for the quantitativeanalysis of both luseogliflozin and phlorizin, and stable isotope-labeledmiglitol (2H4-miglitol), which was used as an IS for the quantitative analysisof miglitol, were synthesized at Taisho Pharmaceutical Co., Ltd. The chemicalstructures of luseogliflozin, miglitol, and phlorizin are shown in Fig. 1. Methyl-a-D-glucopyranoside (a-MG) and [14C] a-MG were purchased from Sigma-Aldrich (St. Louis, MO) and PerkinElmer (Tokyo, Japan), respectively. Blank ratplasma was obtained from Charles River Laboratories Japan (Kanagawa, Japan).
Animals
Eight-week-old male Sprague-Dawley rats (Charles River LaboratoriesJapan) were used for the experiments. All of the experimental proceduresinvolving animal handling were approved by the Institutional Animal Care andUse Committee of Taisho Pharmaceutical Co., Ltd., and were in accordancewith the Guidelines for the Proper Conduct of Animal Experiments (ScienceCouncil of Japan, 2006, http://www.scj.go.jp/en/report/index.html).
Determination of IC50 Value for SGLT1
Chinese hamster ovary-K1 cells were obtained from the American TypeCulture Collection (Rockville, MD) and were stably transfected with a plasmidvector for human SGLT1 (hSGLT1; GenBank accession number NM_000343).The cells were cultured in a 96-well plate in F-10 Nutrient Mixture (LifeTechnologies Co., Ltd., Carlsbad, CA) containing 10% fetal bovine serum and250 mg/ml hygromycin for 2 days. African green monkey SV40-transfectedkidney fibroblast cells (COS-7) obtained from the American Type CultureCollection were seeded into a 96-well plate in Dulbecco’s modified Eagle’smedium containing 10% fetal bovine serum 1 day before transfection. Then thecells in each well were transiently transfected individually with a plasmidvector for rat SGLT1 (rSGLT1; GenBank accession number NM_013033) andcultured for 1 day. The cells expressing rSGLT1 or hSGLT1 were incubated ina pretreatment buffer (140 mM choline chloride, 2 mM KCl, 1 mM CaCl2, 1mM MgCl2, 10 mM HEPES, 5 mM Tris, pH 7.2–7.4) at 37°C for 20 minutes.Then the cells were incubated in an uptake buffer [Na+] (140 mM NaCl, 2 mMKCl, 1 mM CaCl2, 1 mM MgCl2, 10 mM HEPES, 5 mM Tris, pH 7.2–7.4)containing an a-MG substrate mixture ([14C]-a-MG and a-MG) and variousconcentrations of the test agents or the vehicle alone (dimethylsulfoxide) at 37°C for 20 or 30 minutes for the rSGLT1 or hSGLT1 assay, each of which wasperformed in triplicate. The concentration of the a-MG substrate mixture was500 mΜ and 1 mΜ for the rSGLT1 and hSGLT1 assays, respectively. The uptakereaction was terminated by washing the cells twice with the pretreatment buffercontaining 10 mM a-MG, and the cells were then lysed in 0.25 M NaOH.Radioactivity was measured using a liquid scintillation counter. The sodium-independent uptake was measured in a sodium-free uptake buffer [Na2] (140mM choline chloride, 2 mM KCl, 1 mM CaCl2, 1 mMMgCl2, 10 mM HEPES, 5mM Tris, pH 7.2–7.4) containing an a-MG substrate mixture ([14C]-a-MG anda-MG, 500 mΜ for rSGLT1, 1 mΜ for hSGLT1) and dimethylsulfoxide as thevehicle. The sodium-dependent a-MG uptake was calculated by subtracting thesodium-independent uptake count from each count measured in the uptake buffer
Fig. 1. Chemical structures of luseogliflozin (A), phlorizin (B), and miglitol (C).
Prediction of Transporter-Mediated DDI Using a Dynamic Model 1457
at ASPE
T Journals on A
pril 17, 2020dm
d.aspetjournals.orgD
ownloaded from

TABLE1
InputparametersforGastroP
lusthat
wereused
tosimulatetheluminal
concentrations
Property
Luseogliflozinin
Rats
Phlorizin
inRats
Luseogliflozinin
Hum
ans
InputData
Reference/Rem
arks
InputData
Reference/Rem
arks
InputData
Reference/Rem
arks
Physicochem
ical
parameters
Molecular
form
ula
C23H30O6S
—C21H24O10
—C23H30O6S
—
Molecular
weight(g/m
ol)
434.55
—436.42
—434.55
—
Reference
logP
(pH)
2.2(-1)
In-house
data
0.25
(-1)
Estim
ated
byADMETPredictor
2.2(-1)
In-house
data
Dosageform
IR:solutio
n—
IR:suspension
—IR:tablet
—
Initial
dose
(mg)
0.03
—12
—5
—
Dosevolume(m
l)2
—2
—250
—
Solubility
(mg/mlat
pH=6.57)
0.0771
In-house
data
9.27
(mg/mlat
pH=4.49)
Estim
ated
byADMETPredictor
0.0771
In-house
data
Diff.coeff.(cm
2/s�
105)
0.60
Estim
ated
byADMET
Predictor
0.64
Estim
ated
byADMETPredictor
0.60
Estim
ated
byADMET
Predictor
Meanparticle
radius
(mm)
3.03
In-house
data
25.0
Defaultvalue
1.22
In-house
data
Peff(cm/s�
104)
6.23
Estim
ated
from
Ka
0.558
Estim
ated
from
Ka
27.5
Estim
ated
from
Ka
Gut
physiology
Physiology
Rat-fasted
The
stom
achtransittim
ewas
changedto
0.1h.
Rat-fasted
The
stom
achtransittim
ewas
changedto
0.1h.
Hum
an-fasted
—
ASFmodel
Opt
logD
model
SA/V6.1
—Opt
logD
model
SA/V6.1
—Opt
logD
model
SA/V6.1
—
Pharm
acokinetic
parameters
Bodyweight(kg)
0.30
—0.30
—60
—
FPEintestinal
45.7
Estim
ated
98.8
Estim
ated
0—
FPEliv
er73.3
Estim
ated
65.4
Estim
ated
0—
Blood/plasm
aconcentrationratio
0.536
In-house
data
0.930
Estim
ated
byADMETPredictor
0.599
In-house
data
Fup
(%)
5.40
In-house
data
6.71
Estim
ated
byADMETPredictor
4.00
In-house
data
Renal
clearance(l/h/kg)
0—
0—
0—
Model
2-compartment
—2-compartment
—2-compartment
—
CL(l/h)
0.495
Fitted
from
0.1mg/kg
ivdata
0.766
Fitted
from
4mg/kg
ivdata
CL/F
(l/h)
Fitted
from
5mg/individual
podata
2.83
Vc(l/kg)
1.21
0.877
Vc/F(l/kg)
0.358
k 12(1/h)
0.384
0.0352
0.433
k 21(1/h)
0.271
0.535
0.583
ASF,absorptio
nscalingfactor;Diff.coeff.,diffusioncoefficient;Fup,plasmaunboundfractio
n;IR,im
mediate
release;
po,oral.
1458 Mizuno-Yasuhira et al.
at ASPE
T Journals on A
pril 17, 2020dm
d.aspetjournals.orgD
ownloaded from

[Na+]. The IC50 values were determined using SAS 8.2 (SAS Institute Inc., Cary,NC).
Estimation of the Time Spent above a Value 10-Fold Higher than the IC50
Value in the Intestine Using GastroPlus
The concentrations of luseogliflozin and phlorizin (positive control) in theplasma and intestine were simulated using GastroPlus version 8.0 (Simulation PlusInc., Lancaster, CA). This simulator is an advanced-technology computer programthat simulates gastrointestinal absorption, distribution, and the PK of agents dosedvia an oral route in humans and animals. The underlying model in GastroPlus isthe Advanced Compartment Absorption and Transit (ACAT) (Agoram et al.,2001). The physiologically based ACAT model consists of nine compartmentscorresponding to different segments of the digestive tract, and is based on theoriginal compartmental absorption and transit model described by Yu et al. (1996).
The time spent above a value 10-fold higher than the IC50 value (TAIC) inthe intestine was estimated for both luseogliflozin and phlorizin using theprocedure described in the following sections. The parameters for the computersimulation are shown in Table 1.
Estimation of Effective Permeability Values. The plasma concentration-time profiles of luseogliflozin after oral administration in rats and humans wereanalyzed based on a two-compartment model using the PKPlus module inGastroPlus to estimate each absorption rate constant (Ka) value. The Ka valueof phlorizin in rats was estimated in the same way.
The effective permeability (Peff) values were estimated using the followingequation (Amidon et al., 1995):
Peff ¼ Ka� VS¼ Ka� r
2ð1Þ
where V, S, and r are the luminal volume, surface area, and luminal radius,respectively.
The values for r were 0.18 cm for rats (Komiya et al., 1980) and 1.75 cm forhumans (Fagerholm et al., 1996)
Estimation of Fraction Absorbed Value and PK Parameters. Thefraction absorbed value was predicted by importing the compound structure andinputting the related parameters (dosage form, dose, solubility, diffusioncoefficient, particle radius, and permeability) using GastroPlus. The transit timefor the stomach was set as 0.1 hour based on the recommended value, since thedosage form was not a tablet, but a solution or suspension. The PK parameters[total clearance (CL), volume of distribution (Vc), rate constant for com-partment 1 to 2 (k12) and compartment 2 to 1 (k21)] of luseogliflozin andphlorizin in rats were obtained by fitting the iv plasma concentration-time datausing the PKPlus module, and the parameters (CL/bioavailability (F), Vc/F, k12,k21) of luseogliflozin in humans were obtained by fitting the plasmaconcentration-time data after oral administration using the PKPlus module.During this fitting process, the best compartment model was selected accordingto the Akaike information criterion (AIC), which indicated that the minimumAIC value was the best representation of the model (Yamaoka et al., 1978).
Estimation of Hepatic and Intestinal First-Pass Effect. The hepatic andintestinal first-pass effects (FPEs) were estimated as follows:
FPE liver (%): (12Fh) � 100 andFPE intestinal (%): (12Fg) � 100
where Fh is the hepatic availability and Fg is the intestinal availability. Thehepatic clearance was assumed to be equal to the CL, with a negligiblecontribution from renal clearance. The Fh and Fg values for luseogliflozin andphlorizin in rats were estimated based on the following equations:
Fh ¼ 12Qh
ðCL=RbÞ ð2Þ
Fg ¼ FðFa� FhÞ ð3Þ
where a hepatic blood flow (Qh) value of 4.2 l/h/kg (Hosea et al., 2009) was used. TheFPE values of luseogliflozin in humans were set at zero, because the PK parameters(CL/F and Vc/F) of luseogliflozin in humans involved these related parameters.
Estimation of TAIC in Intestine. The validity of the estimated parametersshown in Table 1 was confirmed by verifying the goodness-of-fit between thesimulated and observed plasma profiles. Then a simulation was performed to assessthe DDI potential. In rats, the concentrations in the duodenum were simulated, sinceSGLT1 is mainly expressed in the small intestine (Lee et al., 1994) and miglitol isalmost completely absorbed via the duodenum (Pharmaceuticals and MedicalDevices Agency, Japan, http://www.info.pmda.go.jp/shinyaku/P200500031/index.html). The TAIC value of luseogliflozin and phlorizin were then estimated. Inhumans, the concentrations in the duodenum, jejunum1, jejunum2, ileum1, ileum2,and ileum3 were simulated, since SGLT1 is known to be mainly expressed in thesmall intestine (Hediger and Rhoads, 1994), but no further data were available.
PK and Interaction Study in Rats
The dose regimens and formulations are summarized in Table 2. The oraldosing concentrations of miglitol and luseogliflozin for male rats were set based oneach clinical dose regimen, whereas that of phlorizin (positive control) was set atan excessive concentration that was expected to inhibit SGLT1 in the intestinecompletely. Animals were housed in a cage on the day preceding and afteradministration. The compounds were administered intravenously to the jugularvein while anesthesia was maintained with 3% isoflurane (Mylan Inc.,Canonsburg, PA) and a total O2 flow rate of 0.5–1 l/min using an RC2 RodentAnesthesia System (VetEquip, Inc., Pleasanton, CA). Alternatively, the compoundswere administered orally using a gastric tube. Blood samples were collected fromthe caudal vein at 5, 15, and 30 minutes and at 1, 2, 4, 8, and 24 hours after dosing.The plasma samples were obtained from the blood by centrifugation and werestored at 280°C until sample preparation for the liquid chromatography–tandemmass spectrometry (LC-MS/MS) analysis.
Clinical PK and Interaction Study
In the clinical PK study, miglitol (50-mg tablet) or luseogliflozin (5-mg tablet)was orally administered immediately before breakfast on the day of drugadministration in 12 subjects (healthy Japanese adult males), and the PK parameterswere then obtained. Clinical interaction studies were conducted to determine the PKof a single oral dose of miglitol when administered in combination with
TABLE 2
Dose regimens and formulations used in the pharmacokinetic and interaction studies in rats
Study Compound Route N Dose (mg/kg) Conc. (mg/ml) Vehicle Formulation
Pharmacokinetics Luseogliflozin iv 3 0.1 0.1 10% HP-b-CD SolutionPhlorizin iv 3 4 4 PEG400/saline (4:6,v/v) SolutionLuseogliflozin po 6 0.1 0.015a 0.5% CMC-Na SolutionPhlorizin po 6 40 6 0.5% CMC-Na Suspension
Interaction Miglitol aloneb po 6 1.5 0.225a 0.5% CMC-Na SolutionCombination Miglitol po 6 1.5 0.225a 0.5% CMC-Na Solution
Luseogliflozin 0.1 0.015a
Combination Miglitol po 6 1.5 0.225a 0.5% CMC-Na SuspensionPhlorizin 40 6
CMC-Na, carboxy methyl cellulose sodium; Conc., concentration; 10% HP-b-CD, 10% hydroxy propyl b cyclodextrin; N, number of animals; PEG400,polyethlene glycol 400; po, oral.
aThe concentration values were set based on the clinical dose regimens.bReferred from Mizuno-Yasuhira et al., 2014.
Prediction of Transporter-Mediated DDI Using a Dynamic Model 1459
at ASPE
T Journals on A
pril 17, 2020dm
d.aspetjournals.orgD
ownloaded from

luseogliflozin. Blood samples obtained during both studies were collectedpreadministration and at 0.25, 0.5, 1, 1.5, 2, 3, 4, 6, 8, 12, and 24 hours afteradministration. The plasma samples were obtained from the blood by centrifugationand were stored at 280°C until sample preparation for the LC-MS/MS analysis.
Estimation of the TAIC/Tmax
The percentage of luseogliflozin or phlorizin TAIC in the intestine versus themiglitol time for Cmax (Tmax) value (TAIC/Tmax), which was regarded as the DDIpotential index in the present study, was estimated using the following equation:
TAIC=Tmax ¼ TAICTmax
� 100ð%Þ ð4Þ:
Sample Preparation for LC-MS/MS Analysis
Miglitol in Rat Plasma. Twenty microliters of IS solution (25 ng/ml) and200 ml of acetonitrile/28% ammonium solution (98:2, v/v) were added to 50 ml
of rat plasma sample, and the samples were vortexed and centrifuged. Thesupernatant was then collected and applied to a solid phase extraction cartridge(Mono Spin C18-CX; GL Science, Tokyo, Japan). Miglitol and the IS wereeluted by centrifugation at preset values: 10,600 � g, 4°C, 1 minute. A 5-mlaliquot of the eluate was then injected into the LC-MS/MS system (Mizuno-Yasuhira et al., 2014).
Luseogliflozin and Phlorizin in Rat Plasma. Twenty-five microliters of ISsolution (100 ng/ml) and 500 ml of 10 mM ammonium acetate solution wereadded to 50 ml of rat plasma sample, and the samples were vortexed. Thesamples were then loaded into OASIS HLB cartridges (30 mg/1 cc; Waters,Milford, MA), washed, and then eluted with 1 ml of methanol/acetic acid (100:0.1, v/v) by centrifugation (preset values: 200 � g, 4°C, 1 minute). The eluatewas evaporated to dryness and dissolved in 100 ml of acetonitrile/10 mMammonium acetate solution (20:80, v/v). A 15-ml aliquot of the filtrate was theninjected into the LC-MS/MS system.
Miglitol in Human Plasma. Thirty microliters of IS solution (500 ng/ml)and 500 ml of acetonitrile/distilled water (80:20, v/v) were added to 50 ml of
Fig. 2. Plasma concentration-time profiles for luseogliflozinand phlorizin in rats. (A-1 and B-1) Two-compartmentmodel-fitted profiles in rats after the single intravenousadministration of luseogliflozin (0.1 mg/kg) (A-1) andphlorizin (4 mg/kg) (B-1). The closed circles represent themean observed data +S.D. (n = 3). The solid lines werefitted using a nonlinear least-squares regression analysis.The PK parameters (CL, Vc, k12, k21) in rats for simulatingluminal concentrations were obtained by this fitting to theobserved data. (A-2 and B-2) Simulated concentration-timeprofiles in rats after the single oral administration ofluseogliflozin (0.1 mg/kg) (A-2) and phlorizin (40 mg/kg)(B-2). The closed circles represent the mean observed data +S.D. (n = 6). The solid lines represent the model-simulatedprofiles, which were obtained using the ACAT model inGastroPlus.
Fig. 3. Simulated luminal concentration-time profilesin rat duodenum (red line) and TAIC after the singleoral administration of luseogliflozin (0.1 mg/kg) (A)and phlorizin (40 mg/kg) (B). The dashed linesrepresent a value 10-fold higher than the IC50 valuefor SGLT1. The TAIC of luseogliflozin in rats (9minutes) was shorter than the Tmax of miglitol in rats(28 minutes). On the other hand, the TAIC of phlorizinin rats (75 minutes) was longer.
1460 Mizuno-Yasuhira et al.
at ASPE
T Journals on A
pril 17, 2020dm
d.aspetjournals.orgD
ownloaded from

human plasma sample, and the samples were vortexed and centrifuged. Afterthe supernatant was collected, 810 ml of distilled water and 2 ml of chloroformwere added. The mixture was shaken (approximately 230 rpm, 5 minutes) andcentrifuged (preset values: 400 � g, 4°C, 5 minutes). Nine hundred microlitersof acetonitrile was then added to 100 ml of the supernatant, and the sample wasvortexed. A 10-ml aliquot of the mixture was then injected into the LC-MS/MSsystem.
LC-MS/MS Conditions
Miglitol, Luseogliflozin, and Phlorizin in Rat Plasma. The LC-MS/MSsystem consisted of a Shimadzu LC-20AD (Shimadzu, Tokyo, Japan) andTripleQuad5500 mass spectrometer (AB SCIEX, Foster City, CA). The datawere collected and processed using Analyst 1.6 software (AB SCIEX, FosterCity, CA). Miglitol was analyzed using an XBridge Amide column (4.6 mm i.d.� 50 mm, 3.5-mm particle size; Waters) with 10 mM ammonium acetate andacetonitrile/methanol (90:10, v/v) as the mobile phase under a gradient condition.Luseogliflozin and phlorizin were analyzed using an Inertsil ODS-3 column (2.1mm i.d. � 50 mm, 5-mm particle size; GL Science) with 1 mM ammoniumacetate and acetonitrile as the mobile phase under a gradient condition. Theselected reaction monitoring transitions were as follows: miglitol, m/z 208→ m/z146; luseogliflozin, m/z 433 → m/z 104; and phlorizin, m/z 435 → m/z 273.
Miglitol in Human Plasma. The LC-MS/MS system consisted of an Alliance2795 separation module (Waters) and API4000 mass spectrometer (AB SCIEX).The data were collected and processed using Analyst 1.4.2 software. Miglitol inhuman plasma was analyzed under the same conditions as those used for ratplasma, as described earlier.
Statistical Analysis
The PK parameters were analyzed using Phoenix WinNonlin software,version 6.1 (Pharsight Co., Mountain View, CA), using a noncompartmentalanalysis. The effects of luseogliflozin and phlorizin on the PK of miglitol wereassessed by analyzing the two-sided 90% confidence intervals (CIs) for theratios of the geometric means for the PK parameters [Cmax and area under thecurve from zero to time t (AUC0-t)] between miglitol alone and the combinationgroups. The ratio of the geometric mean and its 90% CI was estimated using ananalysis of variance model with treatment as a fixed effect and with the subjectas a random effect using a SAS mixed procedure (version 9.2; SAS Institute,Inc.). Bioequivalence was concluded if the 90% CIs of the ratio (combination/miglitol alone) were entirely contained within 0.8–1.25.
Results
Determination of IC50 Value for SGLT1 in Rats and Humans.The inhibitory effects of luseogliflozin and phlorizin on SGLT1 activitywere evaluated by measuring the sodium-dependent uptake of a-MGinto cells expressing rSGLT1 or hSGLT1. Luseogliflozin inhibitedsodium-dependent a-MG uptake in cells expressing rSGLT1 with anIC50 of 895 nM, but was less potent for hSGLT1 (IC50 value: 2900 nM).Phlorizin also inhibited sodium-dependent a-MG uptake with an IC50 of631 nM in cells expressing rSGLT1.Estimation of the TAIC Using GastroPlus after the Oral Admin-
istration of Luseogliflozin or Phlorizin in Rats. The physicochemicaland PK parameters of luseogliflozin and phlorizin in rats that were used in
the GastroPlus computer simulation are summarized in Table 1. The Peffvalues of luseogliflozin and phlorizin in rats estimated from each Kavalue were 6.23 cm/s � 104 and 0.558 cm/s � 104, respectively. Thevalues of the other physicochemical parameters were estimated usingADMET Predictor (Simulation Plus Inc., Lancaster, CA) or wereobserved. The PK parameters (CL, Vc, k12, k21) in rats were estimatedby fitting the observed data after intravenous administration to thecompartment model using the PKPlus module in GastroPlus. For bothcompounds, as shown in Fig. 2 (A-1 and B-1), the two-compartmentPK model provided the best fit for the data as assessed using the AIC.Based on these estimated physicochemical and PK parameters listed inTable 1, the plasma concentration-time profiles after the oral admin-istration of luseogliflozin (0.1 mg/kg) and phlorizin (40 mg/kg) weresimulated using the ACAT model in GastroPlus. As a result, as shownin Fig. 2 (A-2 and B-2), the simulated plasma concentration-timeprofiles of luseogliflozin and phlorizin were confirmed to be substantiallysuperimposed on each of the observed concentrations, since the percentprediction of the error values (simulated/observed) of each Cmax andAUC0-t were within 620%. Incidentally, from the results of these in-travenous and oral studies, the bioavailabilities (F) of luseogliflozin andphlorizin were estimated to be 14.5% and 0.4%, respectively.As mentioned earlier, the plasma concentration profiles of luseogliflozin
and phlorizin in rats were confirmed to be well reproduced using theACAT model. Then the TAIC of luseogliflozin or phlorizin was estimatedfrom each luminal concentration-time profile predicted using the ACATmodel and the value that was 10-fold higher than the IC50 value forSGLT1, as shown in Fig. 3. The estimated TAIC values of luseogliflozinand phlorizin in rats were 9 and 75 minutes, respectively.Prediction of the DDI Potential in Rats by Considering the
Percentage of TAIC against the Miglitol Tmax Value (TAIC/Tmax).The Tmax of miglitol after oral administration to rats was 28 minutes,
TABLE 3
Related parameters for the prediction of drug-drug interaction potential
Luseogliflozin in Rats Phlorizin in Rats Luseogliflozin in Humans
10-fold of SGLT1 IC50 (mg/ml) 3.89 2.75 12.6Dose 0.1 mg/kg 40 mg/kg 5 mg/individualTmax of miglitol (min) 28a 28a 83TAIC (min)b 9 75 14TAIC/Tmax (%)b 32 268 17
aReferenced from Mizuno-Yasuhira et al., 2014.bAlso shown in Figs. 3 and 6.
Fig. 4. Plasma levels of miglitol in rats following the oral administration of miglitolalone (1.5 mg/kg, red line) or in combination with concomitant agents. (A)Combination with luseogliflozin (0.1 mg/kg, blue line). (B) Combination withphlorizin (40 mg/kg, green line). The closed circles and triangles represent theobserved mean data 6 S.D. (n = 6). The data for miglitol alone was referenced fromMizuno-Yasuhira et al. (2014).
Prediction of Transporter-Mediated DDI Using a Dynamic Model 1461
at ASPE
T Journals on A
pril 17, 2020dm
d.aspetjournals.orgD
ownloaded from

as determined in our previous report (Mizuno-Yasuhira et al., 2014).The TAIC/Tmax of luseogliflozin against miglitol absorption in ratswas 32%, suggesting a low DDI potential of luseogliflozin againstmiglitol absorption. On the other hand, the TAIC/Tmax of phlorizin(positive control) was greater than 100% (268%), suggesting a highDDI potential (Table 3).Interaction Study in Rats for Verification. Figure 4 shows the
results of the interaction study for miglitol (1.5 mg/kg) in combinationwith luseogliflozin (0.1 mg/kg) or phlorizin (40 mg/kg) in rats. Themean plasma concentration-time profiles of miglitol after the oraladministration of miglitol alone (Mizuno-Yasuhira et al., 2014) or incombination with luseogliflozin were virtually superimposable (Fig. 4A).Luseogliflozin had no effect on the miglitol PK parameters (Cmax,AUC0-t), with the 90% CIs for the ratios of the PK parameters fallingwithin the bioequivalence range of 0.8–1.25 (Table 4). On the otherhand, the mean plasma concentration-time profiles of miglitol after theadministration of miglitol alone or in combination with phlorizin werenot superimposable: the concentrations of miglitol until 1 hour after thecoadministration of miglitol and phlorizin were lower than after theadministration of miglitol alone (Fig. 4B). The 90% CI for the ratios ofthe Cmax (combination of miglitol and phlorizin/miglitol alone) was from0.23 to 0.72, which fell outside the lower limit of the range of 0.8–1.25.Those for the AUC0-t ranged from 0.38 to 1.02 (Table 4). Thus, phlorizinaffected the miglitol PK profile after combined oral administration.Estimation of TAIC Using GastroPlus after the Oral Administra-
tion of Luseogliflozin in Humans. The TAIC of luseogliflozin inhumans was estimated in a manner similar to that used for rats. Theparameters for computer simulation are summarized in Table 1. The Peffvalue of luseogliflozin in humans was 27.5 cm/s � 104. The PKparameters (CL/F, Vc/F, k12, k21) in humans were estimated by fitting theobserved data after oral administration to a two-compartment model (Fig.5A-1), which produced the best fit for the data as assessed using the AIC.Then the plasma concentration-time profile of luseogliflozin (5 mg/individual) was simulated using the ACAT model in GastroPlus. As inthe case for rats, as shown in Fig. 5A-2, the plasma concentration profileof luseogliflozin in humans was found to be well reproduced using theACAT model. Then the TAIC of luseogliflozin was estimated from theluminal concentration-time profiles predicted using the ACAT model anda value 10-fold higher than the IC50 value for SGLT1, as shown in Fig. 6.The estimated TAIC of luseogliflozin in humans was 14 minutes.Prediction of the DDI Potential in Humans by Considering the
Percentage of TAIC against the Miglitol Tmax Value (TAIC/Tmax).The Tmax of miglitol after oral administration in humans was 83 minutes(Fig. 7). The TAIC/Tmax of luseogliflozin against miglitol absorption inhumans was 17%. The TAIC/Tmax value in humans was lower than thatin rats, suggesting that luseogliflozin has no DDI potential againstmiglitol absorption in humans (Table 3).Clinical Interaction Study for Verification. Figure 7 shows the
results of an interaction study for miglitol (50 mg/individual) in
combination with luseogliflozin (5 mg/individual) in humans. Themean plasma concentration-time profiles of miglitol after a single oraladministration of miglitol alone or in combination with luseogliflozinwere virtually superimposable. Luseogliflozin had no effect on themiglitol PK parameters.
TABLE 4
Summary of statistical analysis of miglitol pharmacokinetic parameters in rats
Combination Parameter
Ratio of Geometric Mean
Point Estimate90% CI (Combination/Miglitol Alone)
Lower Upper
Miglitol and luseogliflozin Cmax 0.97 0.85 1.09AUC0-t 1.12 1.04 1.20
Miglitol and phlorizin Cmax 0.41* 0.23* 0.72*AUC0-t 0.63* 0.38* 1.02
*The 90% CIs of the ratio (combination/miglitol alone) was outside the range of 0.8–1.25.
Fig. 5. Plasma concentration-time profiles for luseogliflozin in humans. The closedcircles represent the mean observed data +S.D. (n = 12). (A-1) Two-compartmentmodel-fitted profiles in humans after the single intravenous administration ofluseogliflozin (5 mg/individual). The solid line was fitted using a nonlinear least-squares regression analysis. The PK parameters (CL/F, Vc/F, k12, k21) in humans forsimulating luminal concentrations were obtained by this fitting to the observeddata. (A-2) Simulated concentration-time profiles in humans after the single oraladministration of luseogliflozin (5 mg/individual). The solid lines represent themodel-simulated profiles, which were obtained using the ACAT model inGastroPlus.
1462 Mizuno-Yasuhira et al.
at ASPE
T Journals on A
pril 17, 2020dm
d.aspetjournals.orgD
ownloaded from

Discussion
It is important to understand the nature and magnitude of DDIsbecause an unexpected PK profile arising from a DDI often causes aninsufficient efficacy or unfavorable side effects. In the present study,a novel prediction method using a dynamic model to examine the DDIpotential of a concomitant agent against a drug absorbed via an intestinaltransporter was proposed. Notably, the proportion of the inhibitionduration of a concomitant agent against the absorption duration ofa drug, identified as TAIC/Tmax, was considered to be important foraccurate assessments. The Tmax is easy to monitor and was set as theabsorption duration of a drug, whereas the TAIC was set as the durationof the submaximal inhibition of the concomitant agent. In this study, theproposed prediction method was applied to predict the DDI potential ofluseogliflozin, a novel antidiabetic drug, against miglitol, which isabsorbed via intestinal SGLT1.The proposed prediction method can be summarized in four steps:
step 1: the collection of physicochemical and PK parameters ofluseogliflozin for use in a computer simulation, step 2: the evaluation ofthe validity of these parameters by verifying the goodness of fit betweensimulated and observed plasma profiles, step 3: the simulation of theintestinal luseogliflozin concentration-time profile using the ACATmodel in GastroPlus and estimation of the TAIC, and step 4: theevaluation of the DDI potential by considering the TAIC/Tmax. The
validity of this evaluation was verified by matching the results withthose of an in vivo interaction study. The key points of the present studycan be summarized as follows. First, the computer simulation wasconducted using a dynamic model, which allowed a more accurateassessment of the DDI potential in the intestine than a static model. Astatic model was thought to be problematic because of the potential forfalse-positive results (Kato et al., 2008) arising from the assumption thatthe maximum concentration of luseogliflozin in the intestine ispersistent. Second, the simulated luminal concentration in the intestinewas considered to be equal to the concentration of luseogliflozin at thebinding site of SGLT1, since SGLT1 is expressed in the brush-bordermembrane (Hediger and Rhoads, 1994). And third, the dosingconcentration of luseogliflozin in rats was set based on the clinicaldose regimen (5 mg/250 ml) for the subsequent accurate prediction ofthe DDI potential in humans.In addition, the following important points regarding the process
used to develop the prediction method should be noted. The simulatedconcentration-time profiles using GastroPlus did not fit the observeddata at step 2 when the simulation was conducted using the Peff valuepredicted by the built-in ADMET Predictor at step 1. The absorptionvelocity of the simulated concentration-time profiles seemed to belower than the observed concentration as a results of the low Peff value.The observed Tmax values of luseogliflozin and phlorizin were 0.25hour each, but the simulated Tmax values were 0.64 and 1.27 hours,respectively. Furthermore, the simulated Cmax value of phlorizin alsodeviated from that of the observed data. Therefore, referring to a reportby Amidon et al. (1995), the Peff values in rats were estimated based oneach experimental Ka value using eq. 1. Using these Peff values, thesimulated concentration-time profiles and the observed values were wellmatched, and the Tmax values of luseogliflozin and phlorizin improvedto 0.37 and 0.51 hour, respectively (Fig. 2, A-2 and B-2). Under theseconditions, the PK of luseogliflozin and of phlorizin in rats wasconfirmed to be well reproduced using the ACAT model. In addition,the sensitivity analyses were performed using GastroPlus to confirm theeffective parameters for the Tmax of luseogliflozin and the Tmax andCmax of phlorizin, and only the Peff value was found to be effective (Fig.8). In situations where the Tmax and Cmax values simulated using insilico-predicted parameters do not match the actual observed values, asin the case described earlier, our proposal for estimating the Peff valuebased on the experimental Ka value might be useful.The TAIC/Tmax of luseogliflozin in rats was 32%, suggesting a low
risk of a DDI of luseogliflozin against miglitol absorption. In contrast,phlorizin as a positive control inhibited the absorption of miglitol,since the TAIC/Tmax was more than 100%. To verify the validity of theprediction described earlier, an in vivo interaction study in rats wasconducted. Although the plasma concentrations of miglitol until 15minutes after coadministration of luseogliflozin and miglitol wereslightly lower than those after the administration of miglitol alone, nodifferences in the Cmax and AUC0-t values were observed; thus,luseogliflozin did not inhibit the absorption of miglitol significantly (Fig.4A). In contrast, phlorizin as a positive control inhibited the absorptionof miglitol, reducing the Cmax and AUC0-t of miglitol (Fig. 4B). Asdescribed earlier, the validity of the proposed method for predicting DDIrisk was proven because the prediction results corresponded to the resultsof the in vivo interaction study. In addition, the absorption of miglitolwas not completely inhibited even in the presence of an excessiveconcentration of phlorizin. Regarding miglitol absorption, no reportshave presented any information other than the fact that miglitol acts asa substrate for SGLT1, so the reason for the result is unclear; however,passive diffusion might contribute to the absorption.Since the validity of the proposed method was verified in rats, the
assessment was subsequently conducted in humans (Figs. 5 and 6). As
Fig. 6. Simulated luminal concentration-time profiles in human duodenum (redline), upper jejunum (green line), and TAIC after the single oral administration ofluseogliflozin (5 mg/individual). The dashed line represents a value 10-fold higherthan the IC50 value for SGLT1. The TAIC of luseogliflozin in humans (14 minutes)was shorter than the Tmax of miglitol in humans (83 minutes).
Fig. 7. Plasma levels of miglitol in humans following the oral administration ofmiglitol alone (50 mg/individual, red line) or in combination with luseogliflozin(5 mg/individual, blue line). The closed circles and triangles represent the observedmean data 6 S.D. (n = 12).
Prediction of Transporter-Mediated DDI Using a Dynamic Model 1463
at ASPE
T Journals on A
pril 17, 2020dm
d.aspetjournals.orgD
ownloaded from

a result, luseogliflozin was expected to have no DDI potential againstmiglitol absorption in humans, since the TAIC/Tmax (17%) was lowerthan the value in rats. This expectation was proven in an actual clinicalinteraction study (Fig. 7).A DDI study examining ipragliflozin, a novel SGLT2 inhibitor (100
mg/individual, orally), and miglitol (75 mg/individual, orally) hasdemonstrated that the geometric mean ratios of the Cmax and areaunder the curve from zero to infinity (AUCinf) of miglitol for thecombination therapy versus monotherapy were 0.761 (90% CI: 0.672–0.861) and 0.796 (90% CI: 0.719–0.881), respectively (http://www.info.pmda.go.jp/downfiles/ph/PDF/800126_3969018F1022_1_01.pdf).Based on this information, we evaluated the DDI potential betweenipragliflozin and miglitol retrospectively according to our proposedapproach using the published IC50 value (1876 nM) for hSGLT1(Tahara et al., 2012) and human PK data for ipragliflozin (Zhang et al.,2013). The resulting TAIC/Tmax was estimated to be 116%, predictingthat ipragliflozin may interact with miglitol absorption in humans.The decision criterion for performing a clinical DDI study is an [I2]/
IC50 $ 10 according to the FDA draft guidance for DDIs, under anassumption based on the static model that the highest concentration ofthe inhibitor will persist. Furthermore, a refined criterion of [I2]/IC50 $5 under the same assumption has been proposed by Cook et al. (2010).However, in our research, luseogliflozin did not inhibit miglitolabsorption at all, even though the [I2]/IC50 value of luseogliflozinexceeded the cutoff value of 10. This false-positive result was caused byan overestimation as a result of the assumption involved in using a staticmodel. On the other hand, we considered that the evaluation of theactual time-concentration profile of luseogliflozin in the intestine wasimportant to construct an accurate method for predicting the DDIpotential. Consequently, the predictions obtained using our proposedmethod for DDI risk assessment using a dynamic model correspondedto the results of the in vivo interaction study.In conclusion, a strategy for predicting the DDI potential of a
concomitant agent against a drug absorbed via an intestinal transporterwas proposed, and luseogliflozin was clearly shown not to cause a DDIagainst miglitol absorption in humans through a verification of thevalidity of the proposed prediction method.The use of this proposed strategy based on the simulation of
intestinal concentration-time profiles using dynamic modeling may beof great help in evaluating the clinical DDI potentials of concomitantagents against drugs absorbed via an intestinal transporter without theneed to conduct an interaction study.
Acknowledgments
The authors thank Yoko Mano for her contributions to the GastroPlussimulations and Yasunori Kawakita for his bioanalytic support of the studies.
Authorship ContributionsParticipated in research design: Mizuno-Yasuhira, Nakai, Uchida, Takaha-
shi, Kinoshita, Jingu, Sakai, Samukawa, Yamaguchi.Conducted experiments: Mizuno-Yasuhira, Gunji.Contributed new reagents or analytic tools: Mizuno-Yasuhira.Performed data analysis: Mizuno-Yasuhira, Nakai, Gunji, Kinoshita, Jingu,
Yamaguchi.Wrote or contributed to the writing of the manuscript: Mizuno-Yasuhira,
Nakai, Takahashi, Kinoshita, Yamaguchi.
References
Agoram B, Woltosz WS, and Bolger MB (2001) Predicting the impact of physiological andbiochemical processes on oral drug bioavailability. Adv Drug Deliv Rev 50 (Suppl 1):S41–S67.
Amidon GL, Lennernäs H, Shah VP, and Crison JR (1995) A theoretical basis for a bio-pharmaceutic drug classification: the correlation of in vitro drug product dissolution and in vivobioavailability. Pharm Res 12:413–420.
Chen J, Williams S, Ho S, Loraine H, Hagan D, Whaley JM, and Feder JN (2010) QuantitativePCR tissue expression profiling of the human SGLT2 gene and related family members.Diabetes Ther 1:57–92.
Cook JA, Feng B, Fenner KS, Kempshall S, Liu R, Rotter C, Smith DA, Troutman MD, Ullah M,and Lee CA (2010) Refining the in vitro and in vivo critical parameters for P-glycoprotein, [I]/IC50 and [I2]/IC50, that allow for the exclusion of drug candidates from clinical digoxin in-teraction studies. Mol Pharm 7:398–411.
Fagerholm U, Johansson M, and Lennernäs H (1996) Comparison between permeability coef-ficients in rat and human jejunum. Pharm Res 13:1336–1342.
Fahmi OA, Hurst S, Plowchalk D, Cook J, Guo F, Youdim K, Dickins M, Phipps A, Darekar A,and Hyland R, et al. (2009) Comparison of different algorithms for predicting clinical drug-drug interactions, based on the use of CYP3A4 in vitro data: predictions of compounds asprecipitants of interaction. Drug Metab Dispos 37:1658–1666.
Hediger MA and Rhoads DB (1994) Molecular physiology of sodium-glucose cotransporters.Physiol Rev 74:993–1026.
Hosea NA, Collard WT, Cole S, Maurer TS, Fang RX, Jones H, Kakar SM, Nakai Y, Smith BJ,and Webster R, et al. (2009) Prediction of human pharmacokinetics from preclinical information:comparative accuracy of quantitative prediction approaches. J Clin Pharmacol 49:513–533.
Hummel CS, Lu C, Loo DD, Hirayama BA, Voss AA, and Wright EM (2011) Glucose transportby human renal Na+/D-glucose cotransporters SGLT1 and SGLT2. Am J Physiol Cell Physiol300:C14–C21.
Kakinuma H, Oi T, Hashimoto-Tsuchiya Y, Arai M, Kawakita Y, Fukasawa Y, Iida I, Hagima N,Takeuchi H, and Chino Y, et al. (2010) (1S)-1,5-anhydro-1-[5-(4-ethoxybenzyl)-2-methoxy-4-methylphenyl]-1-thio-D-glucitol (TS-071) is a potent, selective sodium-dependent glucosecotransporter 2 (SGLT2) inhibitor for type 2 diabetes treatment. J Med Chem 53:3247–3261.
Kato M, Shitara Y, Sato H, Yoshisue K, Hirano M, Ikeda T, and Sugiyama Y (2008) Thequantitative prediction of CYP-mediated drug interaction by physiologically based pharma-cokinetic modeling. Pharm Res 25:1891–1901.
Khan A and Efendic S (1995) Evidence that increased glucose cycling in islets of diabetic ob/obmice is a primary feature of the disease. Am J Physiol 269:E623–E626.
Komiya I, Park JY, Kamani A, Ho NFH, and Higuchi WI (1980) Quantitative mechanistic studiesin simultaneous fluid flow and intestinal absorption using steroids as model solutes. Int JPharm 4:249–262.
Krook A, Kawano Y, Song XM, Efendi�c S, Roth RA, Wallberg-Henriksson H, and Zierath JR(1997) Improved glucose tolerance restores insulin-stimulated Akt kinase activity and glucosetransport in skeletal muscle from diabetic Goto-Kakizaki rats. Diabetes 46:2110–2114.
Kuboyama N, Hayashi I, and Yamaguchi T (2006) [Pharmacokinetic, pharmacological, and clinicalprofile of miglitol (SEIBULE), a novel alpha-glucosidase inhibitor]. Nippon Yakurigaku Zasshi127:223–232.
Lee WS, Kanai Y, Wells RG, and Hediger MA (1994) The high affinity Na+/glucose cotrans-porter. Re-evaluation of function and distribution of expression. J Biol Chem 269:12032–12039.
Mizuno-Yasuhira A, Kinoshita K, Jingu S, and Yamaguchi JI (2014) A sensitive and selectivemethod for the quantitative analysis of miglitol in rat plasma using unique solid-phase ex-traction coupled with liquid chromatography-tandem mass spectrometry. Biomed ChromatogrDOI: 10.1002/bmc.3185 [published ahead of print].
Fig. 8. Potential influence of Peff value on the Tmax
and Cmax values. The Tmax of luseogliflozin and theTmax and Cmax of phlorizin were simulated usingdifferent values for Peff with other parameters fixed atthe same values, as shown in Table 1.
1464 Mizuno-Yasuhira et al.
at ASPE
T Journals on A
pril 17, 2020dm
d.aspetjournals.orgD
ownloaded from

Neuhoff S, Yeo KR, Barter Z, Jamei M, Turner DB, and Rostami-Hodjegan A (2013) Applicationof permeability-limited physiologically-based pharmacokinetic models: part II - prediction ofP-glycoprotein mediated drug-drug interactions with digoxin. J Pharm Sci 102:3161–3173.
Pérez López G, González Albarrán O, and Cano Megías M (2010) [Sodium-glucose cotransportertype 2 inhibitors (SGLT2): from familial renal glucosuria to the treatment of type 2 diabetesmellitus]. (in Spanish) Nefrologia 30:618–625.
Reyner EL, Sevidal S, West MA, Clouser-Roche A, Freiwald S, Fenner K, Ullah M, Lee CA,and Smith BJ (2013) In vitro characterization of axitinib interactions with human efflux andhepatic uptake transporters: implications for disposition and drug interactions. Drug MetabDispos 41:1575–1583.
Sels JPJE, Huijberts MSP, and Wolffenbuttel BHR (1999) Miglitol, a new a-glucosidase in-hibitor. Expert Opin Pharmacother 1:149–156.
Shugarts S and Benet LZ (2009) The role of transporters in the pharmacokinetics of orallyadministered drugs. Pharm Res 26:2039–2054.
Suzuki M, Honda K, Fukazawa M, Ozawa K, Hagita H, Kawai T, Takeda M, Yata T, Kawai M,and Fukuzawa T, et al. (2012) Tofogliflozin, a potent and highly specific sodium/glucosecotransporter 2 inhibitor, improves glycemic control in diabetic rats and mice. J Pharmacol ExpTher 341:692–701.
Tahara A, Kurosaki E, Yokono M, Yamajuku D, Kihara R, Hayashizaki Y, Takasu T, ImamuraM, Qun L, and Tomiyama H, et al. (2012) Pharmacological profile of ipragliflozin (ASP1941),
a novel selective SGLT2 inhibitor, in vitro and in vivo. Naunyn Schmiedebergs Arch Phar-macol 385:423–436.
Washburn WN and Poucher SM (2013) Differentiating sodium-glucose co-transporter-2 inhib-itors in development for the treatment of type 2 diabetes mellitus. Expert Opin Investig Drugs22:463–486.
Yamaoka K, Nakagawa T, and Uno T (1978) Application of Akaike’s information criterion (AIC)in the evaluation of linear pharmacokinetic equations. J Pharmacokinet Biopharm 6:165–175.
Yu LX, Lipka E, Crison JR, and Amidon GL (1996) Transport approaches to the bio-pharmaceutical design of oral drug delivery systems: prediction of intestinal absorption. AdvDrug Deliv Rev 19:359–376.
Zhang W, Krauwinkel WJJ, Keirns J, Townsend RW, Lasseter KC, Plumb L, Kadokura T,Ushigome F, and Smulders R (2013) The effect of moderate hepatic impairment on thepharmacokinetics of ipragliflozin, a novel sodium glucose co-transporter 2 (SGLT2) inhibitor.Clin Drug Investig 33:489–496.
Address correspondence to: Akiko Mizuno-Yasuhira, 1-403, Yoshino-cho, Kita-ku,Saitama-shi, Saitama 331-9530, Japan. E-mail: [email protected]
Prediction of Transporter-Mediated DDI Using a Dynamic Model 1465
at ASPE
T Journals on A
pril 17, 2020dm
d.aspetjournals.orgD
ownloaded from