a sted microscope designed for routine biomedical...
TRANSCRIPT
Progress In Electromagnetics Research, Vol. 147, 57–68, 2014
A STED Microscope Designed for Routine Biomedical Applications
Frederik Gorlitz1, Patrick Hoyer1, Henning J. Falk1,Lars Kastrup2, Johann Engelhardt1, and Stefan W. Hell1, 2, *
(Invited Paper)
Abstract—We present a multi-color STED fluorescence microscope providing far-field optical resolutiondown to 20 nm for biomedical research. The optical design comprises fiber lasers, beam scanners, anda set of active and passive polarizing elements that cooperatively yield an optically robust system forroutinely imaging samples at subdiffraction length scales.
1. INTRODUCTION
Far-field optical microscopy is the most widely employed microscopy modality in the basic life sciences.Relying on freely propagating light, it gives largely non-destructive access to the interior of livingcells and sub-surface tissue layers and, in combination with fluorescence tagging, it also providesunsurpassed molecular specificity and sensitivity. However, the spatial resolution of traditionalfluorescence microscopy is limited by diffraction to 200–350 nm, which is why most subcellular featurescannot be discerned with this widely used approach.
The development of stimulated emission depletion (STED) fluorescence microscopy [1–3], that tookplace at the turn of this century, demonstrated that the limiting role of diffraction can be overcomeand nanosized features discerned with freely propagating light and conventional lenses. The decisivedifference between STED and the traditional microscopy approaches is that the traditional ones discernthe tiny features in the sample by the phenomenon of focusing. In simple terms, adjacent featuresare discerned by sharply focusing the light that comes from, or falls on the features to be separated.Separation by focusing is clearly limited by diffraction due to the minimal spot size that can be createdby a lens. In contrast, STED microscopy discerns neighboring features by ensuring that the moleculesdefining these features occupy different molecular states when scrutinized for optical detection, e.g.,illuminated by the same diffraction pattern of excitation light. Discerning by states is clearly not limitedby diffraction. Selecting two distinguishable states and a suitable transition is enough to literally makethe decisive difference (between the features) and eliminate the limiting role of diffraction [4].
In STED microscopy, the molecular states employed for separation are the excited fluorescent stateof the fluorophore and its ground state. The pertinent state transition is that of stimulated emission,i.e., the optically induced transition from the excited to the ground state. To get the fluorophoresof adjacent features sequentially into these different states, STED microscopy employs the so-calledSTED beam, whose wavelength and intensity are chosen such that stimulated emission is ensured.Concretely, the wavelength λ is centered in the long-wavelength part of the emission spectrum of thefluorophore, whereas the intensity is large enough to make the transition from the fluorescent state downto the ground state nearly certain at the given molecular cross-section of interaction. The STED beamthus prevents the occupation of the fluorescent state, even when the molecules are illuminated withexcitation light. Additionally, the STED beam is designed to feature one or more intensity minima in
Received 27 April 2014, Accepted 28 May 2014, Scheduled 15 June 2014* Corresponding author: Stefan W. Hell ([email protected]).1 German Cancer Research Center (DKFZ), BioQuant (INF 267), Im Neuenheimer Feld 280, Heidelberg 69120, Germany.2 Department of NanoBiophotonics, Max Planck Institute for Biophysical Chemistry, Am Fassberg 11, Gottingen 37077, Germany.
58 Gorlitz et al.
the focal plane, so that all molecules are effectively kept in the ground state, except those that happento be located at the minimum and its immediate proximity ∆r ¿ λ/2 of subdiffraction extent. Thus,stimulated emission creates a highly localized and well defined state difference in the sample, providingmolecular separation. When the STED beam is co-aligned with the excitation beam and translatedacross the object, molecules that are just slightly further apart from each other than ∆r cannot residein the same state at the same time; they are forced to occupy the fluorescent state consecutively. As aresult, they can be distinguished.
In good approximation, the resolution of the STED imaging modality is given by
∆r ≈ Cλ
/(2NA
√(1 + I/Is)
)(1)
NA is the numerical aperture of the lens, I the peak intensity bordering the minimum, and Is afluorophore-characteristic measure of the minimal intensity that is required to make the state transitionprobable enough for discerning the molecules by states; it can be arbitrarily chosen within a range.Oftentimes it is chosen as the value at which the transition probability is 50%. For completeness, wenote that the parameter C is co-determined by the actual choice of Is, and for small values I/Is, theparameter C also depends on the excitation wavelength.
Although stimulated emission and the involved states are very basic, making STED microscopywidely applicable, there are also other molecular state pairs and transitions that can be harnessed formaking molecules discernible. Examples comprise transferring the molecules to a transient dark state [5],optical transfers between two distinguishable fluorophore isomers (e.g., ‘photoswitching’ fluorophores),and others [6]. Separating features by states rather than by waves, and more specifically, preventing themolecules of neighboring features to occupy their fluorescent state at the same time, is also the basis ofthe stochastic nanoscopy approaches that detect and localize individual molecules (PALM/STORM) [7–9]. The same applies to methods that evaluate higher order emission correlations of simultaneouslyemitting fluorophores (SOFI) [10], and in fact, to all current fluorescence ‘superresolution’ approachesof practical relevance. If one removed the physical element of making adjacent features transientlydistinct by a molecular state transition, none of these concepts would work [11]. This element is alsoresponsible for the important fact that conceptually, all these approaches can reach resolution down tothe size of a molecule.
STED microscopy has so far been mostly implemented in confocalized single-beam scanning setupsusing a conventionally focused excitation beam that is co-aligned with a doughnut-shaped beam forSTED. Scanning the co-aligned beams across the sample automatically produces the state transitionsrequired for feature separation and signaling, rendering the subdiffraction image as a result. Theresolution can be adjusted by tuning the intensity I at the doughnut crest, as indicated in the aboveequation. Both pulsed and continuous wave (CW) STED lasers can be used. Whereas CW lasers areavailable in many wavelengths and do not necessitate synchronization between the processes of excitationand STED, they require higher average power to reach the same resolution value, as compared tostandard 80 MHz pulsed lasers [12]. Therefore, although CW lasers are in common use — most notablyin commercial STED microscopes — pulsed laser sources are preferable for attaining high resolution.Since they minimize timing jitter, spurious multi-photon excitation, and photobleaching, STED pulsedurations of 0.3–1 ns have proven particularly advantageous.
However, since initial versions of pulsed STED microscopy were realized with mode-lockedTi:Sapphire lasers that are followed by complex optical units for pulse stretching, wavelength andwavefront modification, the realization of pulsed-mode STED microscopy has occasionally beenconsidered demanding. Additionally, co-aligning the beams, controlling the pulse timing, and producingthe doughnut-shaped beam called for optical subunits that added complexity to the system. Doughnutproduction and the scanning of the beams also called for dedicated optical planes that are conjugateto the entrance pupil of the objective lens and accessible, making the system bulky. Multiple colordetection also required a set of exchangeable dichroic mirrors.
Although a number of isolated optical solutions have been proposed to address these issues, thequestion still remained whether a design can be evolved that meets all these demands at a high level ofperformance. Here we describe an optical STED microscopy design that synergistically combines theseindividual solutions, yielding a virtually alignment-free and affordable STED fluorescence ‘nanoscope’
Progress In Electromagnetics Research, Vol. 147, 2014 59
that allows the detection of multiple markers in routine biomedical applications with a resolution downto 20 nm.
2. EXPERIMENTAL SETUP
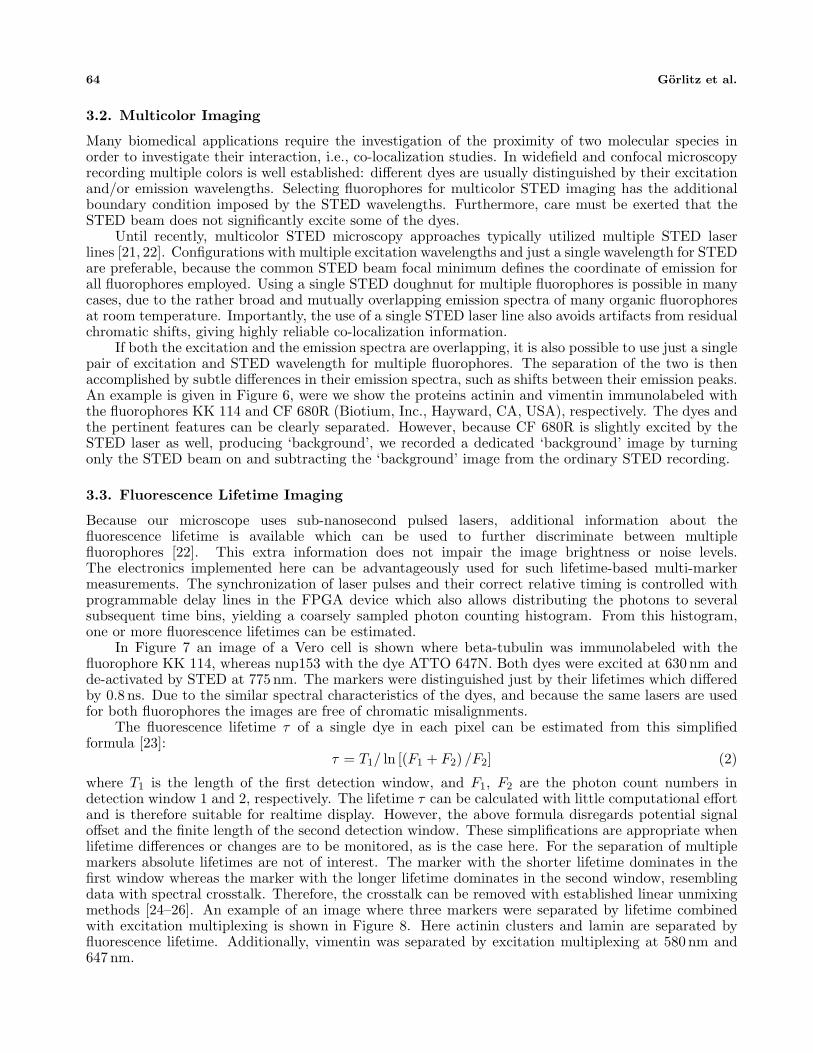
Our STED system uses a low power pulsed supercontinuum laser source (WhiteLase SC450-PP-HE,Fianium, Southampton, UK) for excitation at virtually any optical wavelength. After removal of the IRpart of the supercontinuum spectrum using a 760 nm short pass filter, the desired excitation wavelengthis selected using an acousto-optical tunable filter (AOTF, PCAOM-VIS, Crystal Technologies, Palo Alto,USA). The beam passes the AOTF three times in order to suppress the undesired wavelength range ofthe supercontinuum spectrum; the triple pass suppresses 1000 times better than a regular single pass(see Figure A1) [13]. The STED laser is a frequency-doubled pulsed fiber laser (PFL1-1000-775, MPBCommunications, Montreal, Canada) providing 1 ns pulses of up to 30 nJ pulse energy at a wavelength of775 nm. The STED laser can be triggered electronically over a wide frequency range (25–40 MHz) whichgreatly simplifies the synchronization of the excitation and STED pulses. In our case, the STED laser istriggered by the pulsed supercontinuum laser operating at 38 MHz. STED beams at 775 nm wavelengthare quite efficient for STED of fluorophores having peak emissions between 600 nm and 700 nm, a factwhich can be used for multicolor recordings using a single-wavelength STED beam [14]. A notableadvantage of a single STED beam approach is that the region in which the different fluorophores canassume the signaling state is defined by the very same doughnut. Mislocalizations due to chromaticaberrations are thus excluded.
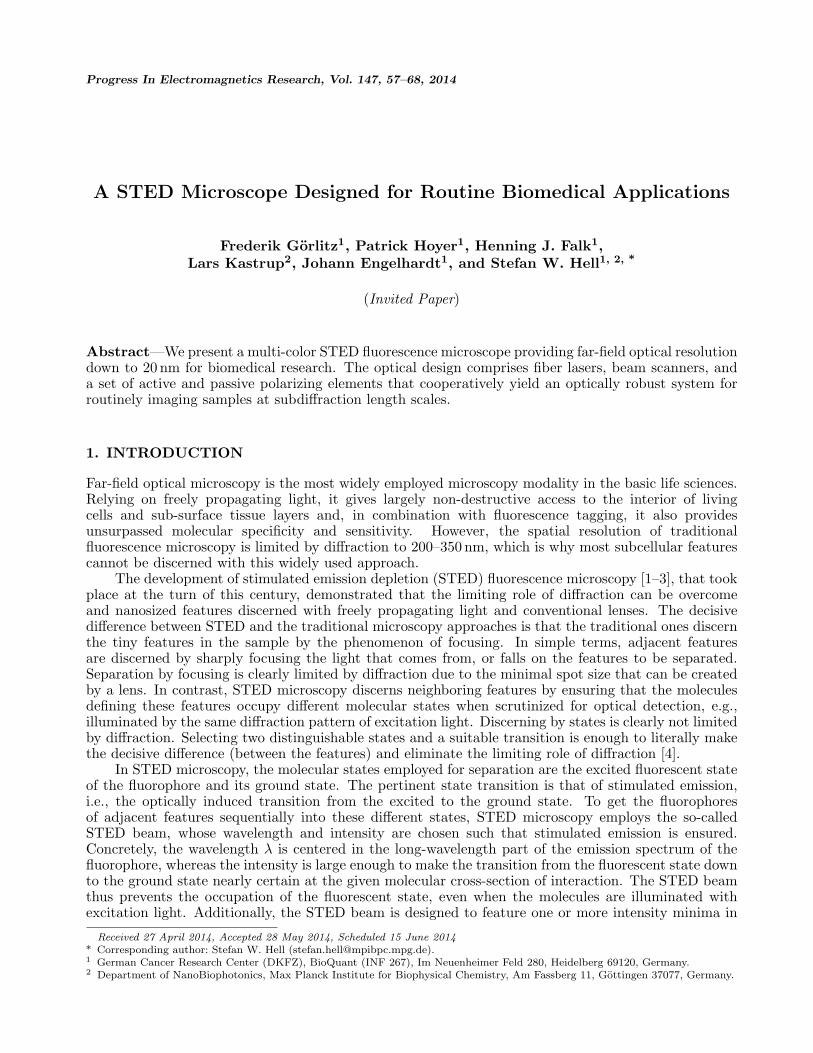
The optical design of our setup is sketched in Figure 1. Both laser beams are combined andjointly coupled into a polarization maintaining (PM) optical fiber. After collimation, a directional beamsplitter (DBS) as described in Subsection 2.3 directs the laser light to the microscope. Beam scanning isimplemented with a Quadscanner (see Subsection 2.2) mounted on the side port of the microscope body(DMI6000 CS, Leica, Wetzlar, Germany). An easySTED waveplate (WP, see Subsection 2.1) mounted
Figure 1. Schematic design of the STED microscope. Abbreviations: objective lens (OBJ), easySTEDwaveplate (WP), tube lens (TL), dichroic beamsplitter (DC), band pass filter (BP), avalanche photodiodes (APD1, APD2), acousto-optic modulator (AOM), acousto-optic tunable filter (AOTF), computerwith FPGA based electronics board (PC w/FPGA).

60 Gorlitz et al.
between the tube lens (TL) and the objective lens (OBJ) transforms the STED beam into a doughnutat the sample, while leaving the other beams focused. The fluorescence light emerging from the sampleis collected by the same objective lens, descanned, and directed towards the detection system by theDBS. The detection system contains a confocal pinhole, after which the fluorescence is split by a dichroicbeam splitter (DC) into two wavelength bands and detected with two avalanche photodiodes (APD1,APD2, SPCM-AQRH-13, Excelitas Technologies Corp., Waltham, MA, USA). Bandpass filters (BP) infront of the detectors suppress residual laser light.
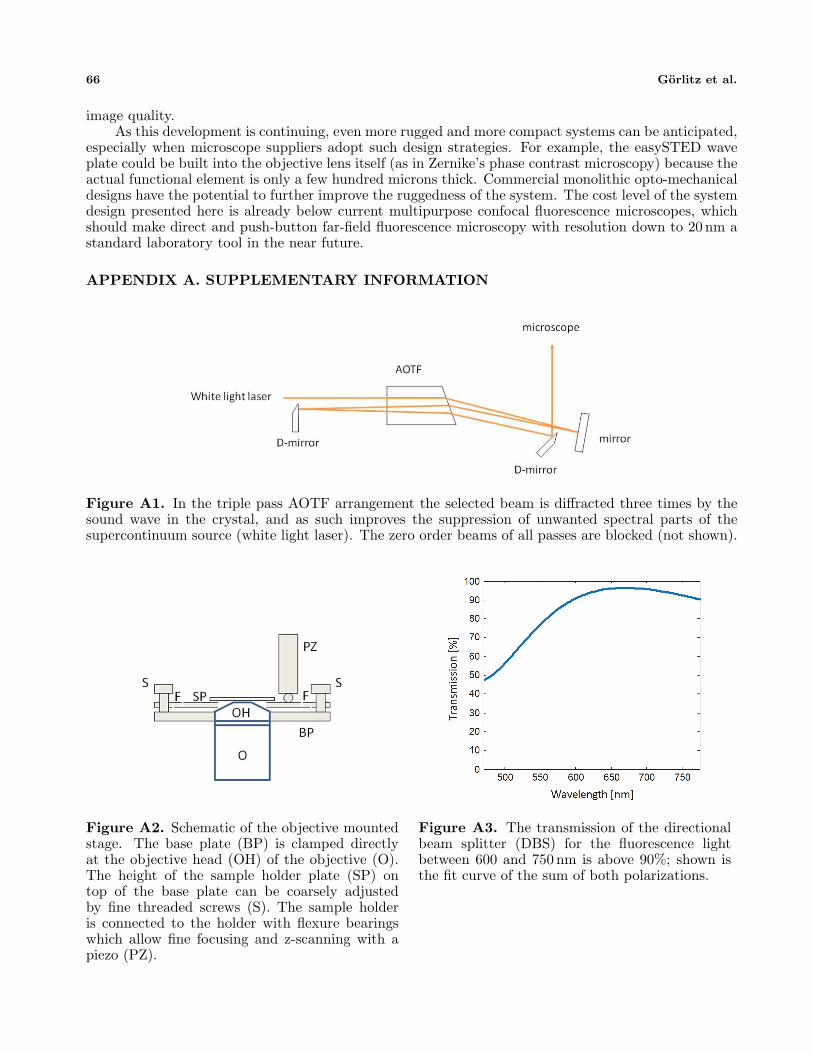
To minimize the thermal drift of the sample (which in common research-grade microscopes amountsto ∼ 100 nm per few minutes), a low weight sample stage was designed and mounted directly onto theobjective lens (Figure A2). Our design reduces the overall mechanical path between the sample and theobjective lens, and due to its low inertia, is largely immune against external vibrations. We found thatthe sample drift measured during a 3.5 min interval is reduced to < 13.5 nm in the x, y-direction and140 nm in the z-direction when the environmental temperature variation is < 2◦C.
All functions of the STED microscope are controlled by a field-programmable gate array (FPGA)based PC board (PCIe-7852R, National Instruments, Austin, TX, USA) which is operated with a customprogram and a graphical user interface implemented in LabVIEW (National Instruments). Besidescontrolling the galvanometer scanners and the piezo stage for focus control, the FPGA adjusts thetiming between the excitation and the STED laser pulses, and comprises a photon counting schemewith temporally gated detection [15, 16]. For these purposes, programmable delay lines inside theVirtex V type FPGA chip are used which provide a time resolution of 80 ps. In the following sections,we shall describe the key elements of our setup in detail.
2.1. EasySTED Phase Plate
The wavefront modifying easySTED phase plate [17, 18] reduces the demands for optical alignmentsignificantly. Because it is placed in the common excitation and STED beam path, both laser beams canbe coupled into a microscope through a single optical fiber. The easySTED wave plate is a birefringentphase retarding element consisting of four segments of different orientation (Figure 2) to the effect thatit leaves the polarization of the excitation light mostly unchanged, while the polarization of the STEDbeam is modified such that it renders a focal doughnut [17, 18] (see Figure 2). The chromatic dependenceof the wave plate makes the excitation intensity spot somewhat larger and triangularly shaped atwavelengths > 50 nm away from the design wavelength. This may slightly increase photobleachingbecause fluorophores located at the periphery of the excitation spot are unnecessarily excited. On the
(a) (b)
Figure 2. (a) Photograph and schematic (inset) of the easySTED wave plate. The arrows indicate theorientation of the fast axes in the segmented wave plate. (b) Wavelength dependence of the wave plate:at 654 nm (the excitation wavelength), the retardation is 3λ and a perfect diffraction limited spot isformed whereas, at 775 nm (the STED wavelength), the retardation is 2.5λ and a doughnut shape isformed. The spot shape is largely conserved between 595 nm and 720 nm. Scale bar: 500 nm.

Progress In Electromagnetics Research, Vol. 147, 2014 61
other hand, since the coordinates of fluorescence emission are dictated by the position of the doughnut,the triangular shape of the excitation spot does not become manifested in the images.
The wavelength dependence of the easySTED phase plate means that STED lasers with spectralbandwidth of a few nanometers or larger, such as a Titanium:Sapphire laser, are not compatible withthe easySTED approach, because the doughnut minimum is filled up quickly. Since it has a < 1 nmlinewidth, our 775 nm pulsed fiber laser harmonizes perfectly well with the easySTED phase plate. Atthe same time, this laser is less expensive and provides the right pulse duration (1 ns). Moreover, it canbe triggered, which greatly simplifies synchronization with pulsed excitation lasers. Thus, alignment isreduced to a simple coupling of multiple laser lines into a singlemode fiber. Note that the easySTEDphase plate can be adjusted to the desired wavelength by changing the thickness of its material or therefractive index.
2.2. The Quadscanner
In contrast to conventional scanning arrangements, the Quadscanner (Figure 3) is placed in anintermediate image plane of the microscope, rather than in a plane that is conjugate to the entrancepupil of the objective lens [19]. In this design, the collimated laser beam remains stationary all theway to the side port of the microscope stand making large and complex scan lenses obsolete. Anachromatic lens is sufficient for the collimated millimeter-sized beam. For each scan direction, a pairof galvanometers translates the focus in the intermediate image plane. The lateral as well as the axialposition of the pivot points of the beam can be controlled by adjusting the ratio of the scan angles ofeach galvanometer pair. In this design, neither the scanning mirrors nor the easySTED waveplate needto be placed in planes that are conjugate to the entrance pupil, making optical relays redundant andthe system virtually alignment-free.
Figure 3. Schematic of the Quadscanner. In contrast to conventional scanners which are placed in apupil plane of the beam path, the Quadscanner is placed in an intermediate image plane. Scanning isperformed by translating the laser beam rather than tilting it.
The maximum field of view rendered by the Quadscanner is defined by the mirror sizes of thegalvanometers; it amounts to 80 × 80 µm in the current design using a 100x objective. The electronicresolution (16 bit) used here allows addressing a raster of nominally 1.5 nm in the object plane. Thisprecision is appropriate for the current design, as we measure an overall scanning jitter of 4 nm (rms).If larger image fields are required, a lower magnification objective lens or galvanometers with largermirrors can be employed.

62 Gorlitz et al.
The axial field curvature caused by the Quadscanner design is negligible because it is de-magnifiedwith the square of the magnification factor. In our configuration, the field curvature amounts to about25 nm across the whole image field. The chromatic magnification error at the image boundary is about40 nm (633 nm vs. 775 nm) which is also negligible. If larger field sizes or a wider spectral rangeis desired, a correction may be necessary, which can be accomplished, e.g., by placing an additionalf = −1000mm silica lens between the objective lens and the tube lens.
2.3. Directional Beam Splitter (DBS)
The majority of biomedical investigations require the simultaneous imaging of multiple molecularspecies. The most straightforward way to address this demand is to use markers with different spectra.In STED microscopy, it is most desirable to use a single STED beam to inhibit multiple dyes together,which ensures that the co-localization errors are minimal. Therefore, all laser beams must be co-alignedand directed to the microscope while the emanating fluorescence must be separated and efficientlyguided to the detectors. This becomes challenging when variable excitation wavelengths, e.g., from asupercontinuum, are used for excitation.
Excitation and fluorescence light are commonly separated with exchangeable dichroic beam splittersor with multiband beam splitters. However, mechanical exchange of beam splitters is susceptible tomisalignment, and multiband beam splitters may sacrifice fluorescence. Additionally, filters with fixedspectral signatures severely limit the flexibility of fluorophore excitation provided by the supercontinuumlaser source. Acousto-optical beam splitters are more versatile, because several wavelengths can beprogrammed, but their line width is limited to < 1 nm, which is why they lose efficiency when laserswith larger linewidths are used. They also introduce angular dispersion into the deflected beam. Whilethis is negligible in confocal imaging, in STED microscopy it may compromise the doughnut minimum.
For these reasons we implemented a directional beam splitter (DBS) which separates beams bytheir propagation direction rather than by their wavelength [20]. Our DBS uses a Faraday rotator toseparate the back-traveling fluorescence from the excitation and STED light propagating towards thesample. In essence, after having passed the polarizing beam splitter, the polarization of the excitationand the STED beams are rotated by the half-wave plate by 45◦ and subsequently rotated back by −45◦so that they can pass the second polarizing beam splitter (Figure 4). The fluorescence part with thesame polarization as the two laser beams travels back along the same path, but is finally deflected bythe polarizing beam splitter facing the lasers; this is because the Faraday rotator and the halfwave plate
Figure 4. Schematic of the directional beam splitter (DBS). A Terbium Gallium Granate Faradayrotator is implemented to create a direction-dependent beam splitter. While light from the laseressentially passes the device unchanged, light traveling backwards to the laser (green) with thepolarization direction of the laser becomes rotated by 90◦ and is coupled out by the polarizing beamsplitter (PBS) at the laser port. The orthogonal polarization component of the (usually unpolarized)fluorescent light (orange) is coupled out at the polarization beam splitter close to the microscope. Thehalf wave retarder is not essential, but it allows keeping the beam path in a single plane. The twopolarized detection beams may be recombined or detected by separate detectors as indicated in theschematic.
Progress In Electromagnetics Research, Vol. 147, 2014 63
jointly rotate the field by a total of 90◦. The polarization component of the fluorescence light that isorthogonal to the laser fields needs no rotation, since it can be readily coupled out before it reachesthe Faraday rotator (see Figure 4). The two components may either be recombined or detected withseparate detectors. We opted for the latter configuration, because it also offers measuring the anisotropyof the fluorescence emission.
The DBS exhibits a low spectral dependence caused by the dispersion of the Faraday rotator andthe retarder plate. The transmission at the STED wavelength (775 nm) is > 80%. The reflectionefficiency for the fluorescence light (500–700 nm) towards the detectors is > 90% which is comparableto conventional dichroic beamsplitters (see Figure A3). Wider achromatic designs are conceivable withmaterial mixes other than the off-the-shelf device used here. Residual reflections of the lasers whichare also directed into the detection beam path by the DBS are sufficiently suppressed by the band passfilters in front of the detectors.
3. RESULTS
3.1. Resolution
The performance of the presented STED system was first tested using fluorescent beads with a nominalsize of 20 nm excited at 630 nm. Crimson beads (Life Technologies) were immobilized on a coverslipusing Poly-L-Lysine (SERVA Electrophoresis GmbH, Heidelberg, Germany). To determine the width ofthe fluorescence spot-like image rendered by a bead, a 2D-Gaussian model function was fitted to eachbead image. On average, a full-width-half-maximum (FWHM) of 23 nm was found (see Figure A4).By deconvolution with the physical size of the beads (20 nm), the imaging resolution, in terms of theFWHM of the effective point-spread-function of the imaging modality was estimated as 19.5 nm.
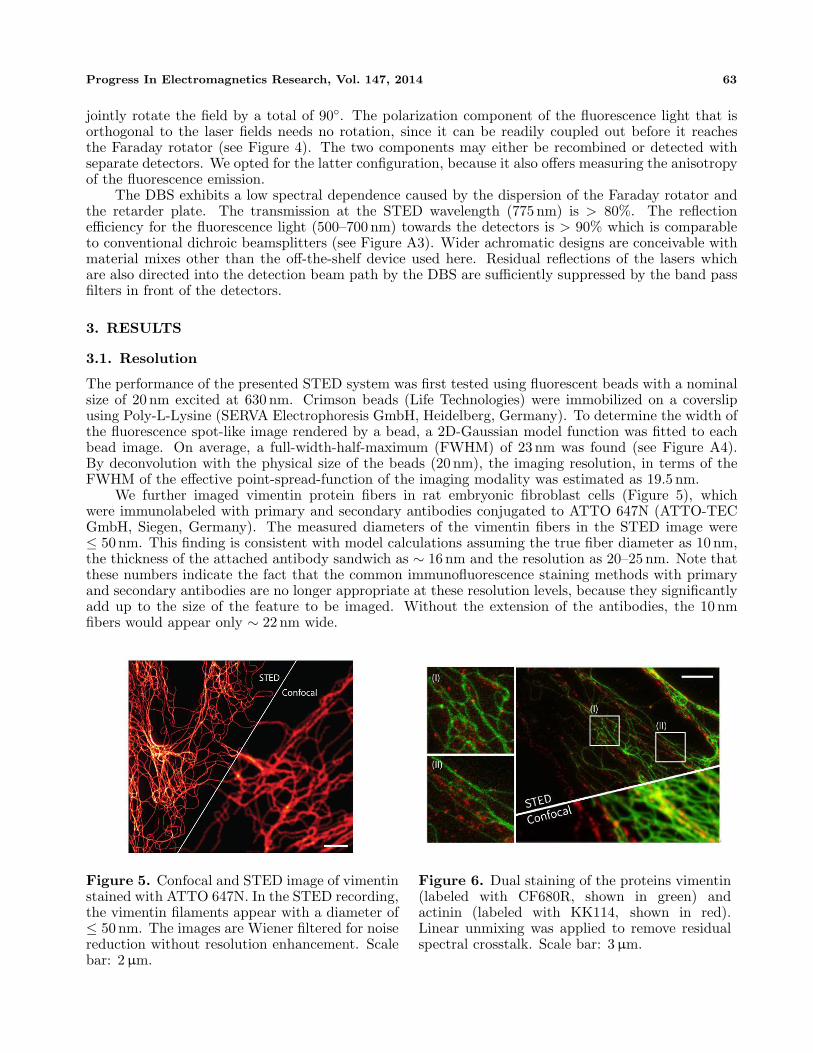
We further imaged vimentin protein fibers in rat embryonic fibroblast cells (Figure 5), whichwere immunolabeled with primary and secondary antibodies conjugated to ATTO 647N (ATTO-TECGmbH, Siegen, Germany). The measured diameters of the vimentin fibers in the STED image were≤ 50 nm. This finding is consistent with model calculations assuming the true fiber diameter as 10 nm,the thickness of the attached antibody sandwich as ∼ 16 nm and the resolution as 20–25 nm. Note thatthese numbers indicate the fact that the common immunofluorescence staining methods with primaryand secondary antibodies are no longer appropriate at these resolution levels, because they significantlyadd up to the size of the feature to be imaged. Without the extension of the antibodies, the 10 nmfibers would appear only ∼ 22 nm wide.
Figure 5. Confocal and STED image of vimentinstained with ATTO 647N. In the STED recording,the vimentin filaments appear with a diameter of≤ 50 nm. The images are Wiener filtered for noisereduction without resolution enhancement. Scalebar: 2 µm.
Figure 6. Dual staining of the proteins vimentin(labeled with CF680R, shown in green) andactinin (labeled with KK114, shown in red).Linear unmixing was applied to remove residualspectral crosstalk. Scale bar: 3µm.
64 Gorlitz et al.
3.2. Multicolor Imaging
Many biomedical applications require the investigation of the proximity of two molecular species inorder to investigate their interaction, i.e., co-localization studies. In widefield and confocal microscopyrecording multiple colors is well established: different dyes are usually distinguished by their excitationand/or emission wavelengths. Selecting fluorophores for multicolor STED imaging has the additionalboundary condition imposed by the STED wavelengths. Furthermore, care must be exerted that theSTED beam does not significantly excite some of the dyes.
Until recently, multicolor STED microscopy approaches typically utilized multiple STED laserlines [21, 22]. Configurations with multiple excitation wavelengths and just a single wavelength for STEDare preferable, because the common STED beam focal minimum defines the coordinate of emission forall fluorophores employed. Using a single STED doughnut for multiple fluorophores is possible in manycases, due to the rather broad and mutually overlapping emission spectra of many organic fluorophoresat room temperature. Importantly, the use of a single STED laser line also avoids artifacts from residualchromatic shifts, giving highly reliable co-localization information.
If both the excitation and the emission spectra are overlapping, it is also possible to use just a singlepair of excitation and STED wavelength for multiple fluorophores. The separation of the two is thenaccomplished by subtle differences in their emission spectra, such as shifts between their emission peaks.An example is given in Figure 6, were we show the proteins actinin and vimentin immunolabeled withthe fluorophores KK 114 and CF 680R (Biotium, Inc., Hayward, CA, USA), respectively. The dyes andthe pertinent features can be clearly separated. However, because CF 680R is slightly excited by theSTED laser as well, producing ‘background’, we recorded a dedicated ‘background’ image by turningonly the STED beam on and subtracting the ‘background’ image from the ordinary STED recording.
3.3. Fluorescence Lifetime Imaging
Because our microscope uses sub-nanosecond pulsed lasers, additional information about thefluorescence lifetime is available which can be used to further discriminate between multiplefluorophores [22]. This extra information does not impair the image brightness or noise levels.The electronics implemented here can be advantageously used for such lifetime-based multi-markermeasurements. The synchronization of laser pulses and their correct relative timing is controlled withprogrammable delay lines in the FPGA device which also allows distributing the photons to severalsubsequent time bins, yielding a coarsely sampled photon counting histogram. From this histogram,one or more fluorescence lifetimes can be estimated.
In Figure 7 an image of a Vero cell is shown where beta-tubulin was immunolabeled with thefluorophore KK 114, whereas nup153 with the dye ATTO 647N. Both dyes were excited at 630 nm andde-activated by STED at 775 nm. The markers were distinguished just by their lifetimes which differedby 0.8 ns. Due to the similar spectral characteristics of the dyes, and because the same lasers are usedfor both fluorophores the images are free of chromatic misalignments.
The fluorescence lifetime τ of a single dye in each pixel can be estimated from this simplifiedformula [23]:
τ = T1/ ln [(F1 + F2) /F2] (2)
where T1 is the length of the first detection window, and F1, F2 are the photon count numbers indetection window 1 and 2, respectively. The lifetime τ can be calculated with little computational effortand is therefore suitable for realtime display. However, the above formula disregards potential signaloffset and the finite length of the second detection window. These simplifications are appropriate whenlifetime differences or changes are to be monitored, as is the case here. For the separation of multiplemarkers absolute lifetimes are not of interest. The marker with the shorter lifetime dominates in thefirst window whereas the marker with the longer lifetime dominates in the second window, resemblingdata with spectral crosstalk. Therefore, the crosstalk can be removed with established linear unmixingmethods [24–26]. An example of an image where three markers were separated by lifetime combinedwith excitation multiplexing is shown in Figure 8. Here actinin clusters and lamin are separated byfluorescence lifetime. Additionally, vimentin was separated by excitation multiplexing at 580 nm and647 nm.

Progress In Electromagnetics Research, Vol. 147, 2014 65
Figure 7. Fluorescence lifetime based channelseparation using dual-gated detection. STEDand confocal images of β-tubulin (immunolabeledwith the fluorophore KK114, shown in red) andthe nuclear pore complex (nup153 immunolabeledwith ATTO 647N, shown in green) in amammalian (vero) cell. The fluorescence lifetimeof ATTO 647N is shorter by about 0.8 nscompared to KK114. The images were linearlyunmixed and smoothed with a Wiener filter. Scalebars: 3 µm.
Figure 8. Three-color single-beam STEDimaging with lifetime separation and excitationmultiplexing (580 nm/647 nm). Cells were stainedfor vimentin (ATTO 590, shown in red), α-actinin(KK114, shown in green) and lamin (ATTO 647N,shown in blue). The images are smoothed with aWiener filter. Scale bar: 2µm.
4. DISCUSSION AND CONCLUSION
We have described an integral optical design rendering a technically simple and inexpensive STEDmicroscopy system. Fiber lasers, a novel achromatic beam splitting unit based on Faraday rotation,a birefringent wavefront modification unit, and an unconventional laser scanning scheme cooperativelyreduce system complexity and alignment demands. Furthermore, by integrating most of the devicecontrol into a single reprogrammable FPGA board little additional electronics is required. All time-critical tasks such as laser pulse synchronization and time-gated photon detection can be performed onthis board. Group velocity dispersion in the optical fiber of the supercontinuum laser, which may causevariable delays for different excitation wavelengths is also compensated in the FPGA program. Newfunctionality can be easily added in the software.
In polymer nanoparticle samples, this rugged arrangement displayed a resolution of ∼ 20 nmwhereas in biological samples the resolution was ∼ 30 nm. Note that the attained resolution is primarilya function of the fluorophores employed, which is, of course, inherent to a concept separating featuresvia molecular states. The maximum resolution attainable with a particular fluorophore and STEDwavelength depends on the characteristic intensity Is and the maximum applicable doughnut intensityI. The demonstration of a specific resolution value (here 20 nm) with polymer nanoparticles proves thatthe setup meets the optical conditions for attaining this value.
True co-localization of different target structures was achieved by lifetime separation of fluorescentlabels that were spectrally similar. Because the same excitation and STED wavelengths were usedfor two dyes and the channels were recorded simultaneously, the co-localization is free of chromaticaberrations or drift. Time-gated detection is useful in many regards. Early photons, i.e., those emittedwithin the first few 100 ps after the excitation pulse, carry little or no superresolution informationbecause, at this instant, the STED pulse has not efficiently deactivated the fluorophores located at thefocal periphery. Discarding these early photons by time-gating therefore results in a much improved
66 Gorlitz et al.
image quality.As this development is continuing, even more rugged and more compact systems can be anticipated,
especially when microscope suppliers adopt such design strategies. For example, the easySTED waveplate could be built into the objective lens itself (as in Zernike’s phase contrast microscopy) because theactual functional element is only a few hundred microns thick. Commercial monolithic opto-mechanicaldesigns have the potential to further improve the ruggedness of the system. The cost level of the systemdesign presented here is already below current multipurpose confocal fluorescence microscopes, whichshould make direct and push-button far-field fluorescence microscopy with resolution down to 20 nm astandard laboratory tool in the near future.
APPENDIX A. SUPPLEMENTARY INFORMATION
Figure A1. In the triple pass AOTF arrangement the selected beam is diffracted three times by thesound wave in the crystal, and as such improves the suppression of unwanted spectral parts of thesupercontinuum source (white light laser). The zero order beams of all passes are blocked (not shown).
Figure A2. Schematic of the objective mountedstage. The base plate (BP) is clamped directlyat the objective head (OH) of the objective (O).The height of the sample holder plate (SP) ontop of the base plate can be coarsely adjustedby fine threaded screws (S). The sample holderis connected to the holder with flexure bearingswhich allow fine focusing and z-scanning with apiezo (PZ).
Figure A3. The transmission of the directionalbeam splitter (DBS) for the fluorescence lightbetween 600 and 750 nm is above 90%; shown isthe fit curve of the sum of both polarizations.

Progress In Electromagnetics Research, Vol. 147, 2014 67
Figure A4. Resolution measurement with 20 nm sized fluorescent beads. Beads are image at a sizeof 23.1 nm + / − 5.5 nm (N = 10). The size was measured by fitting a Gaussian model intensitydistribution to the spots. The inset shows an example bead with the corresponding fitted intensity.Image size: 5.8 µm×5.8µm, pixel size: 5 nm×5 nm, dwell time: 100µs, excitation pulse: 31.2 pJ/pulse,λ = 630 nm, pulse length: 100 ps, STED pulse: 6.91 nJ/pulse, λ = 775 nm, pulse length: 1.2 ns,repetition rate: 38.6 MHz, STED pulse delay: 0.7 ns, detection gate: 2–12 ns (after excitation pulse).Scale bar: 500 nm.
ACKNOWLEDGMENT
We acknowledge the Federal Ministry of Education and Research (BMBF) for funding this work withinthe project STEDlight (FKZ: 13N11173).
REFERENCES
1. Hell, S. W. and J. Wichmann, “Breaking the diffraction resolution limit by stimulated-emission —Stimulated-emission-depletion fluorescence microscopy,” Optics Letters, Vol. 19, No. 11, 780–782,1994.
2. Klar, T. A., et al., “Fluorescence microscopy with diffraction resolution barrier broken by stimulatedemission,” Proceedings of the National Academy of Sciences of the United States of America, Vol. 97,No. 15, 8206–8210, 2000.
3. Westphal, V. and S. W. Hell, “Nanoscale resolution in the focal plane of an optical microscope,”Physical Review Letters, Vol. 94, 143903, 2005.
4. Hell, S. W., “Toward fluorescence nanoscopy,” Nature Biotechnology, Vol. 21, No. 11, 1347–1355,2003.
5. Hell, S. W. and M. Kroug, “Ground-state depletion fluorescence microscopy, a concept for breakingthe diffraction resolution limit,” Applied Physics B: Lasers and Optics, Vol. 60, 495–497, 1995.
6. Hell, S. W., S. Jakobs, and L. Kastrup, “Imaging and writing at the nanoscale with focused visiblelight through saturable optical transitions,” Applied Physics A: Materials Science & Processing,Vol. 77, 859–860, 2003.
7. Rust, M. J., M. Bates, and X. W. Zhuang, “Sub-diffraction-limit imaging by stochastic opticalreconstruction microscopy (STORM),” Nature Methods, Vol. 3, 793–795, 2006.
8. Betzig, E., et al., “Imaging intracellular fluorescent proteins at nanometer resolution,” Science,Vol. 313, 5793, 1642–1645, 2006.
9. Hess, S. T., T. P. K. Girirajan, and M. D. Mason, “Ultra-high resolution imaging by fluorescencephotoactivation localization microscopy,” Biophysical Journal, Vol. 91, No. 11, 4258–4272, 2006.
10. Dertinger, T., et al., “Two-focus fluorescence correlation spectroscopy: A new tool for accurateand absolute diffusion measurements,” Chem. Phys. Chem., Vol. 8, No. 3, 433–443, 2007.

68 Gorlitz et al.
11. Hell, S. W., “Far-field optical nanoscopy,” Science, Vol. 316, No. 5828, 1153–1158, 2007.12. Willig, K. I., et al., “STED microscopy with continuous wave beams,” Nature Methods, Vol. 4,
No. 11, 915–918, 2007.13. Voloshinov, V. B., L. N. Magdich, and G. A. Knyazev, “Tunable acousto-optic filters with the
multiple interaction of light and sound,” Quantum Electronics, Vol. 35, No. 11, 1057–1063, 2005.14. Gottfert, F., et al., “Coaligned dual-channel STED nanoscopy and molecular diffusion analysis at
20 nm resolution,” Biophysical Journal, Vol. 105, No. 1, L01–L03, 2013.15. Moffitt, J. R., C. Osseforth, and J. Michaelis, “Time-gating improves the spatial resolution of
STED microscopy,” Optics Express, Vol. 19, No. 5, 4242–4254, 2011.16. Vicidomini, G., et al., “STED nanoscopy with time-gated detection: theoretical and experimental
aspects,” PLoS One, Vol. 8, No. 1, e54421 (1–12), 2013.17. Wildanger, D., et al., “A STED microscope aligned by design,” Optics Express, Vol. 17, No. 18,
16100–16110, 2009.18. Reuss, M., J. Engelhardt, and S. W. Hell, “Birefringent device converts a standard scanning
microscope into a STED microscope that also maps molecular orientation,” Optics Express, Vol. 18,No. 2, 1049–1058, 2010.
19. Bingen, P., et al., “Parallelized STED fluorescence nanoscopy,” Optics Express, Vol. 19, No. 24,23716–23726, 2011.
20. Schreiber, F., Device and Method for Distributing Illumination Light and Detection Light in aMicroscope, 2013.
21. Donnert, G., et al., “Two-color far-field fluorescence nanoscopy,” Biophysical Journal, Vol. 92,No. 8, L67–L69, 2007.
22. Buckers, J., et al., “Simultaneous multi-lifetime multi-color STED imaging for colocalizationanalyses,” Optics Express, Vol. 19, No. 4, 3130–3143, 2011.
23. Salthouse, C. D., R. Weissleder, and U. Mahmood, “Development of a time domain fluorimeter forfluorescent lifetime multiplexing analysis,” IEEE Transactions on Biomedical Circuits and Systems,Vol. 2, No. 3, 204–211, 2008.
24. Demandolx, D. and J. Davoust, “Multicolour analysis and local image correlation in confocalmicroscopy,” Journal of Microscopy-Oxford, Vol. 185, 21–36, 1997.
25. Dickinson, M. E., et al., “Multi-spectral imaging and linear unmixing add a whole new dimensionto laser scanning fluorescence microscopy,” Biotechniques, Vol. 31, No. 6, 1272, 2001.
26. Neher, R. A., et al., “Blind source separation techniques for the decomposition of multiply labeledfluorescence images,” Biophys. J., Vol. 96, No. 9, 3791–3800, 2009.