a state policy blueprint - homepage | … ta ueprint for a more inclusive path to prosperity a state...
TRANSCRIPT

1
A STATE POLICY BLUEPRINT FOR A MORE INCLUSIVE PATH TO PROSPERITY 2017
Racial Wealth Divide Policy Design and Advocacy: A Primer
A STATE POLICY BLUEPRINT FOR A MORE INCLUSIVE PATH TO PROSPERITY
prosperitynow.org
2
A STATE POLICY BLUEPRINT FOR A MORE INCLUSIVE PATH TO PROSPERITY
ABOUT PROSPERITY NOW
Prosperity Now (formerly CFED) believes that everyone deserves a chance to prosper. Since 1979, we have helped make it possible for millions of people, especially people of color and those of limited incomes, to achieve financial security, stability and, ultimately, prosperity. We offer a unique combination of scalable practical solutions, in-depth research and proven policy solutions,
all aimed at building wealth for those who need it most.
This report was made possible thanks to the contributions of Solana Rice, Kamolika Das, Holden Weisman, Dedrick Asante-Muhammad, Jeremie Greer, Sean Luechtefeld, Roberto Arjona, and Doug Ryan.
3
A STATE POLICY BLUEPRINT FOR A MORE INCLUSIVE PATH TO PROSPERITY
A STATE POLICY BLUEPRINT FOR A MORE INCLUSIVE PATH TO PROSPERITY
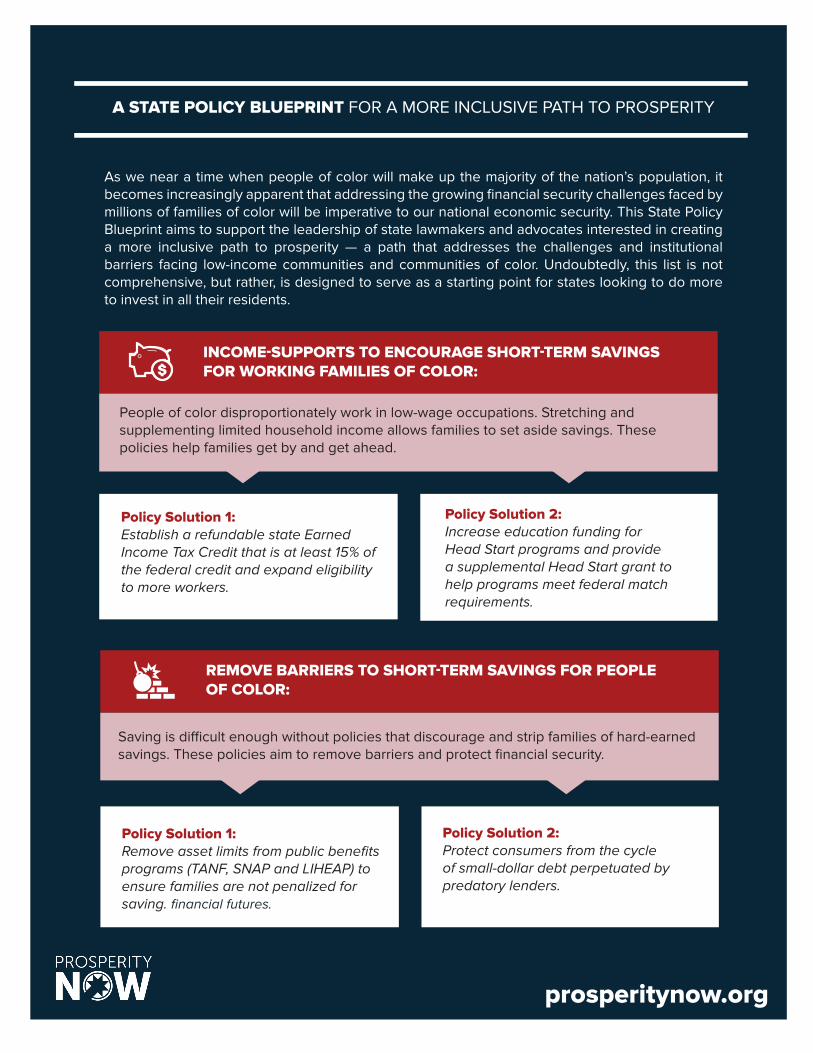
As we near a time when people of color will make up the majority of the nation’s population, it becomes increasingly apparent that addressing the growing financial security challenges faced by millions of families of color will be imperative to our national economic security. This State Policy Blueprint aims to support the leadership of state lawmakers and advocates interested in creating a more inclusive path to prosperity — a path that addresses the challenges and institutional barriers facing low-income communities and communities of color. Undoubtedly, this list is not comprehensive, but rather, is designed to serve as a starting point for states looking to do more to invest in all their residents.
INCOME-SUPPORTS TO ENCOURAGE SHORT-TERM SAVINGS FOR WORKING FAMILIES OF COLOR:
People of color disproportionately work in low-wage occupations. Stretching and supplementing limited household income allows families to set aside savings. These policies help families get by and get ahead.
Policy Solution 1: Establish a refundable state Earned
Income Tax Credit that is at least 15% of the federal credit and expand eligibility to more workers.
Policy Solution 2: Increase education funding for
Head Start programs and provide a supplemental Head Start grant to help programs meet federal match requirements.
REMOVE BARRIERS TO SHORT-TERM SAVINGS FOR PEOPLE OF COLOR:
Saving is difficult enough without policies that discourage and strip families of hard-earned savings. These policies aim to remove barriers and protect financial security.
Policy Solution 1: Remove asset limits from public benefits
programs (TANF, SNAP and LIHEAP) to ensure families are not penalized for saving. financial futures.
Policy Solution 2: Protect consumers from the cycle
of small-dollar debt perpetuated by predatory lenders.
prosperitynow.org

4
A STATE POLICY BLUEPRINT FOR A MORE INCLUSIVE PATH TO PROSPERITY
EMPOWERING COMMUNITIES OF COLOR TO SAVE FOR LONG-TERM GOALS:
Saving for long-term assets like education, homeownership and retirement are fundamental to prosperity and economic mobility over generations. These policies can promote access for historically marginalized groups.
Policy Solution 1: Encourage matched savings programs like Individual Development Accounts.
Policy Solution 2:
Encourage saving for college through Children’s Savings Account programs and lower tuition costs for undocumented students.
Policy Solution 3: Promote access to
retirement savings programs for workers without employer-sponsored plans and strengthen accompanying financial education.
AFFORDABLE HOUSING & HOMEOWNERSHIP AS THE FOUNDATION OF BLACK & LATINO WEALTH:
Despite deep setbacks during the recession, affordable housing and homeownership remains critical to long-term wealth and prosperity. These policies help create opportunities for families to rent and own safely and sustainably.
Policy Solution 1:
Provide a range of supports for first-time homebuyers.
Policy Solution 2: Pass legislation explicitly
barring “source of income” discrimination to increase fair housing options.
Policy Solution 3: Enact state-level
property tax credit programs.
A STATE POLICY BLUEPRINT FOR A MORE INCLUSIVE PATH TO PROSPERITY
prosperitynow.org
For more information on how we can support your state financial security policy agenda contact:
Solana Rice State & Local Policy Director at Prosperity Now

5
A STATE POLICY BLUEPRINT FOR A MORE INCLUSIVE PATH TO PROSPERITY
Public policies in general—and state policies in particular—have always been important. However, the results of the 2016 presidential and congressional elections have deepened the need for states to take the lead in the work of shoring up household financial security, especially for communities of color. Our current political reality at the federal level is showing signs that the coming years will bring tremendous threats to programs that serve and protect
low-income individuals and families, especially historically disadvantaged communities.
In the absence of our federal government’s willingness and readiness to invest in the well-being of these vulnerable communities, we offer this State Policy Blueprint to help state lawmakers identify meaningful ways to fill the void left by Congress and the Trump Administration. This Blueprint features policy considerations and policy solutions from the Prosperity Now Scorecard that can serve as the building blocks for improving the financial security of low-income communities and communities of color. Undoubtedly, this list is not comprehensive, but rather, is designed to serve as a starting point for states looking to do more to invest in their residents.
FINANCIAL INSECURITY BY THE NUMBERS
Despite a low national unemployment rate, the situation facing those without work is far from rosy. Workers who are unemployed search for a job for an average of 24 weeks—nearly half a year.1 Meanwhile, although the number of households with bank accounts is increasing, 37% of households lack enough savings to withstand a three-month disruption of income (e.g., due to a job loss or medical emergency) and stay out of poverty. Furthermore, over half of renters and 30% of homeowners are spending more than a third of their incomes on housing. For those living on the edge, the opportunity to build financial stability, wealth and prosperity hangs in the balance.
These harsh economic realities can wreak havoc on any family, but we must acknowledge that they pave a much harder road for people of color who work daily to overcome barriers to their financial health erected by generations of racialized policies and practices. At Prosperity Now, we recognize that a whole range of factors contribute to household financial security, and at every turn, we see major racial disparities in these factors. Black and Latino household incomes at the median continue to lag behind median White household income, with gaps of about $20,000 and $13,000, respectively.2
Paired with inequities in homeownership rates, uneven access to safe and affordable financial products, and a host of other issues, these disparities in income pale in comparison to markedly disparate levels of asset ownership and net worth between races. For example, for every dollar of White household net worth, Black households have a median net worth of seven cents, while Latino households have about 10 cents on average. Thirty percent of Black households and 24% of Latino households have zero or negative net worth, meaning they have more debt than assets. Such vast levels of wealth inequality account for differences of more than just a few dollars—these disparities determine, quite literally, which families get to rebound from financial hardships with relative ease and which ones are left reeling for years to come.
Against this backdrop, the pages that follow focus on state policies that can help remove barriers to prosperity and improve financial security for communities of color. Some of these policies have years of evidence proving their effectiveness, while others are still emerging but showing much promise. In both cases, the recommended policies are ones that policymakers, administrators and advocates should consider while keeping in mind their potential to have an outsized positive impact on households of color. We start with an exploration of policies that increase income and enable it to stretch further. We
A STATE POLICY BLUEPRINT FOR A MORE INCLUSIVE PATH TO PROSPERITY

6
A STATE POLICY BLUEPRINT FOR A MORE INCLUSIVE PATH TO PROSPERITY
then turn to policies that encourage short-term savings to help families build their financial resilience, as well as long-term savings to purchase assets that build wealth over a lifetime and across generations. We conclude with a set of policy recommendations that address affordable housing and homeownership in particular, as homeownership is the asset that contributes perhaps most significantly to the financial security of households of color.
We include policies in our recommendations only if they meet each of three criteria. In order to be included in this Blueprint, the policy had to be:
Meaningful, in that it can have a significant positive impact on financial security, wealth and prosperity for communities of color.3
Moveable, in that it can garner political will and attract bipartisan support.
Manageable, in that it is not overly complex or expensive.
This guide is intended to complement Prosperity Now’s Federal Policy Blueprint to Close the Ever-Growing Wealth Gap and The Road to Zero Wealth: How the Racial Wealth Divide is Hollowing Out the American Middle Class. Both of these resources were designed to help advocates identify opportunities for federal action. You’ll find practical advice on policy design considerations and references to research and helpful materials throughout. We hope that this Blueprint sparks conversations about the roles states can play in building strong foundations for financial security and prosperity, and we welcome you to share your experiences about how these policies play out in your state.
INCOME SUPPORTS TO ENCOURAGE SHORT-TERM SAVINGS FOR WORKING
FAMILIES OF COLOR
A quarter of jobs in the US are in low-wage occupations that pay less than $24,250 annually to support a family of four. The majority of these low-wage jobs do not offer employer-sponsored benefits like health insurance, paid sick leave, retirement plans and flexible work schedules. Meanwhile, the costs of supporting a family continue to increase, and basic needs now command a much larger share of a family’s budget than they did just a few years ago. Having enough to cover routine expenses and to set aside savings to weather income volatility or plan for the future is only possible when workers earn adequate income, but more and more families find themselves choosing between today’s expenses and tomorrow’s possibilities.
Fortunately, voters in many states have demonstrated that they are eager to clear a path to wealth building and prosperity. In 2016, several state propositions and ballot measures ushered in minimum wage increases in places like Arizona and Maine.4 To boost the take-home pay working families can use to get by and get ahead, states should build on these successes and blaze new trails by adopting the policies that follow.

7
A STATE POLICY BLUEPRINT FOR A MORE INCLUSIVE PATH TO PROSPERITY
Policy Solution #1: Establish a refundable state Earned Income Tax Credit that is at least 15% of the federal credit and expand eligibility to more workers.
The federal Earned Income Tax Credit (EITC) lifted about 6.5 million people out of poverty in 2015 by boosting household income and making it possible for working families to save.5 Twenty-nine states and DC have established a state EITC. A recent study in California estimated that two out of three workers eligible for the state’s EITC are people of color, while an even greater share (four out of five) of children who benefit from the EITC are children of color.6
Of course, not all EITC policies are created equal, and the way the policy is designed has important implications for the reach and scope of the EITC. Of those 29 states and DC that have a state EITC, only 24 of them have a refundable credit, which is critical for reaching low-income filers and people of color who may owe very little in taxes.7
Besides establishing a refundable EITC that is 15% of the federal credit, in designing a strong EITC policy, advocates and policymakers should consider:
n Expanding eligibility to childless workers. Studies show that raising the credit for childless workers could have a significant impact on Black and Latino men, who are disproportionately likely to work in low-wage jobs and to pay disproportionate amounts of income taxes that could be offset by the EITC. Further, expanding eligibility can help men who have children but who are not custodial parents. Unfortunately, with the exception of DC, states follow the same eligibility criteria of the federal credit, including the fact that workers without dependent children receive minimal benefit. States should follow DC’s example by expanding EITC eligibility.
n Conducting targeted outreach and marketing campaigns. Direct funding should be allocated toward campaigns that inform communities of color about the existence of the EITC, its value and the safe options where taxpayers can go to claim the credit, such as Volunteer Income Tax Assistance (VITA) sites.
n Dedicating resources for high-need areas. States should provide dedicated funding and sup-port for VITA programs that offer services in low-income areas with large communities of color.8
n Innovating EITC through VITA. States should introduce targeted innovations like Rainy Day EITC or other savings tools focused on using tax time to help filers save portions of their refund.
n Holding paid tax preparers accountable for the returns they prepare. States should regulate tax preparers who charge for their services. Paid tax preparers can easily exploit low-income filers by charging exorbitant preparation fees. Furthermore, studies show that unscrupulous tax preparers plant storefronts in communities with a high population of low-income earners.9 Four states (California, Oregon, New York and Maryland) regulate paid tax preparers through a combination of registration requirements, continuing education training and competency stan-dards.10

8
A STATE POLICY BLUEPRINT FOR A MORE INCLUSIVE PATH TO PROSPERITY
Policy Solution #2: Increase education funding for Head Start programs and more specifically, provide a supplemental Head Start grant to help programs meet the 20% match required by the federal government.
Head Start allows families to save significant amounts of money on their childcare expenses. One estimate found that the average cost of full-time day care is $10,000 per year, ranging from $5,000 in Mississippi to $22,000 in Washington, DC. Nationwide, the average full-time minimum-wage worker earns only $15,080 a year, making it downright impossible for families to afford decent childcare.11 Parents who work in low-wage jobs are forced to make difficult decisions, such as placing their children in substandard, unregulated child care facilities or spending most or all of their wages to ensure their ability to work.
Programs such as Head Start can help both children and parents by improving children’s cognitive and social development while strengthening parents’ ability to go to work and increase their long-term earning potential.12 In the short term, Head Start defrays childcare costs, which in turn increases a family’s discretionary income and allows them to save for routine and unexpected life events. At least 90% of children served by child care centers funded by Head Start matching grants must be below the federal poverty line. Therefore, the families that participate in Head Start often need the most support. In addition to childcare savings, research indicates that Head Start families enrolled in supplementary health literacy programs can save significant amounts of money in medical expenses.13
States can support Head Start by helping community-based programs meet the 20% match required by the federal government to ensure Head Start reaches low-income communities of color. Without this match, state programs struggle to qualify for federal Head Start funds. The racial and ethnic composition of Head Start participants varies significantly by state and program type, but nationwide, a higher proportion of income-eligible American Indian/Alaska Native and Black children are enrolled than Asian or White children.14 Further, studies have shown that Black children enrolled in Head Start programs experienced more favorable impacts between kindergarten and third grade compared to their non-Head Start peers. Thus, increasing support for Head Start programs and ensuring that centers utilize community needs assessments can disproportionately benefit children of color. States can utilize their own preschool grant programs, local taxes and public school funding to strengthen Head Start.
In expanding education funding for Head Start, advocates and policymakers should integrate financial capability services into Head Start programs. Doing so would help parents develop financial resilience, open and maintain emergency savings accounts, and manage family finances. For example, the Head Start Parent Ambassador Individual Development Account Project in Washington State guided parents to plan for short- and long-term financial goals, save for asset purchases and prepare for unexpected emergencies. At the end of the project, parents reported that they continued to save and have a better understanding of financial topics, such as improving credit and avoiding predatory financial services.15

9
A STATE POLICY BLUEPRINT FOR A MORE INCLUSIVE PATH TO PROSPERITY
REMOVE BARRIERS TO SHORT-TERM SAVINGS FOR PEOPLE OF COLOR
Building a personal safety net or setting something aside for a rainy day can put individuals and families in the driver’s seat when it comes to their own financial futures and provide much-needed protection from financial shocks. Nearly half of all households in the US lack even the most basic savings to cover their expenses in the wake of a financial crisis like the loss of a job or a medical emergency. Households of color consistently find themselves in an even more precarious position—they are more than twice as likely to live below the federal poverty line and nearly twice as likely to lack liquid savings.16
With so many families teetering on the edge of financial disaster, access to safe and affordable financial products like savings accounts, loans and lines of credit are critical to weathering income volatility and managing unexpected expenses. According to FDIC’s 2015 National Survey of Unbanked and Underbanked Households, 18% of Black households and 16% of Hispanic households are unbanked, compared to only three percent of White households.17 The following policies focus on reducing barriers to savings and protecting consumers from predatory practices.
Policy Solution #1: Remove asset limits from public benefits programs, especially TANF, SNAP and LIHEAP, to ensure families are not penalized for saving for their own financial futures.
Social welfare programs are critical to helping families meet their basic needs and mitigate financial hardships.18 At least one study shows that the U.S. poverty rate would be twice as high without the federal safety net.19 States have considerable discretion in deciding how they implement federal programs, who will benefit and whether basic assets like a family car will count against families in determining eligibility. However, in designing their own programs, a number of states have strict so-called asset limits in place—restrictions on eligibility for public benefits based on an applicant or recipient household’s assets, including homes, automobiles, savings or other investments. These asset limits have consistently been shown to discourage household savings among low-income families.20 In turn, these policies prevent families from building the means to manage their finances without relying on public benefits for longer than is necessary.
The best option is for states to eliminate all asset limits for TANF (Temporary Assistance for Needy Families), SNAP (Supplemental Nutrition Assistance Program, formerly Food Stamps) and LIHEAP (Low-Income Housing Energy Assistance Program). Although asset limits hurt all program applicants and participants, they are more harmful for communities of color. A recent analysis of TANF programs has shown that states with
LIHEAP
SNAP
TANF
39 + DC
34 + DC
8 + DC
Number of States That Have Eliminated Asset Limits
10
A STATE POLICY BLUEPRINT FOR A MORE INCLUSIVE PATH TO PROSPERITY
larger African American populations have more restrictive eligibility requirements and less generous benefits relative to states with fewer African Americans.21 Lifting asset limits increases the likelihood that a household living below 200% of the federal poverty level will be banked because families would no longer be tempted to “hide” their assets.22 Lifting asset limits would also increase the likelihood that a family would have at least $500 in savings.23 Given the racial gaps in the unbanked rates—18.2% of Black households were unbanked in 2015, compared to only 3.1% of White households—removing asset tests from public benefits programs would eliminate one of many barriers facing families looking to save even modest amounts to prepare for a rainy day and build a personal financial safety net.24
Indeed, removing asset limits is a win-win for both states and families. States that increased or removed asset limits not only continued the trend of decreasing caseloads, but also saw significant reductions in administrative costs because administrators spent less time repeatedly verifying families’ income and assets as they gained and lost eligibility.25 Even so, only eight states have eliminated asset limits from their TANF programs, 34 states and DC have eliminated their SNAP asset limits, and 39 states and DC have eliminated their LIHEAP asset limits.26
In removing asset limits from public benefits programs, advocates and policymakers should consider:
n Taking intermediate steps to ease the burden on participating households until states can eliminate asset limits entirely. At the very least, states can index asset limits to inflation, allow-ing families to save at a steady pace without being penalized. States can also follow the lead of seven states—Alabama, South Carolina, Florida, Georgia, Mississippi, Washington and Pennsyl-vania—by extending certification periods, waiving re-certification interviews and/or using elec-tronic data to reduce verification paperwork for families.27
n Revisiting other aspects of benefits administration. Because states have so much discretion in how they implement their public benefits programs, it is important to acknowledge that asset limits are only one problematic aspect of administration among many. Advocates should exam-ine all program requirements, like work requirements, enforcement practices for noncompliance and duration of benefits. Each of these programmatic decisions can increase costs for states and have disproportionately adverse impacts on households of color.28
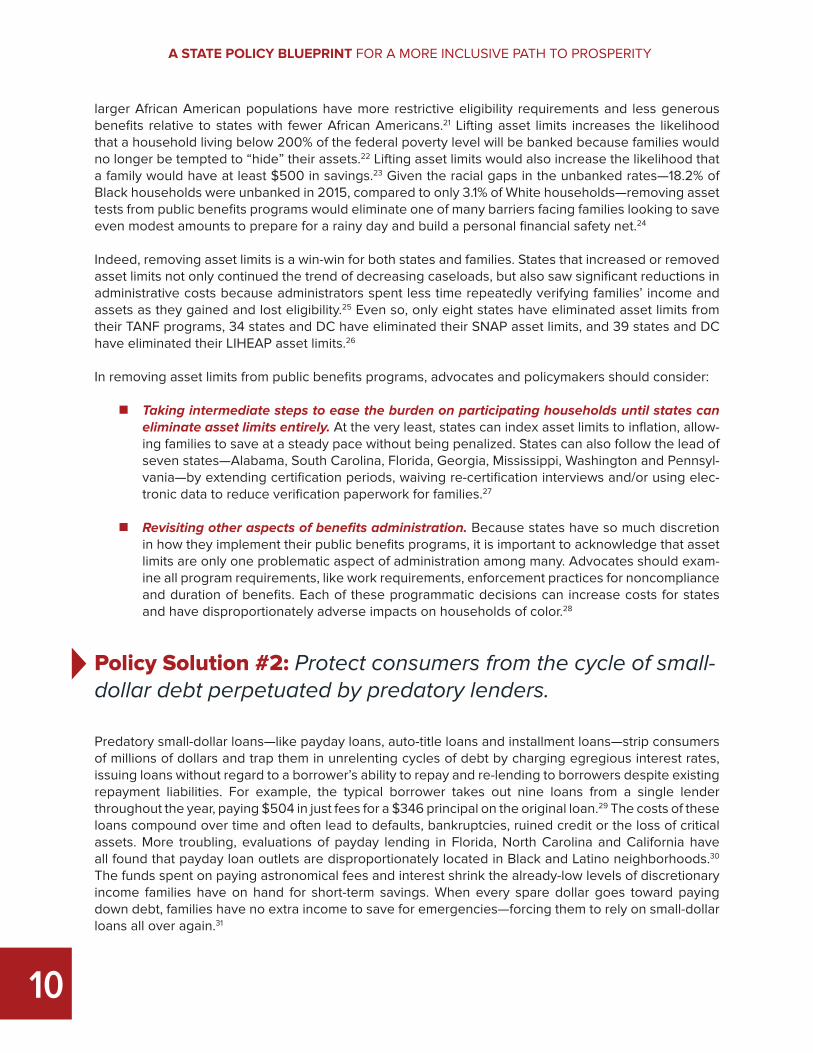
Policy Solution #2: Protect consumers from the cycle of small-dollar debt perpetuated by predatory lenders.
Predatory small-dollar loans—like payday loans, auto-title loans and installment loans—strip consumers of millions of dollars and trap them in unrelenting cycles of debt by charging egregious interest rates, issuing loans without regard to a borrower’s ability to repay and re-lending to borrowers despite existing repayment liabilities. For example, the typical borrower takes out nine loans from a single lender throughout the year, paying $504 in just fees for a $346 principal on the original loan.29 The costs of these loans compound over time and often lead to defaults, bankruptcies, ruined credit or the loss of critical assets. More troubling, evaluations of payday lending in Florida, North Carolina and California have all found that payday loan outlets are disproportionately located in Black and Latino neighborhoods.30 The funds spent on paying astronomical fees and interest shrink the already-low levels of discretionary income families have on hand for short-term savings. When every spare dollar goes toward paying down debt, families have no extra income to save for emergencies—forcing them to rely on small-dollar loans all over again.31

11
A STATE POLICY BLUEPRINT FOR A MORE INCLUSIVE PATH TO PROSPERITY
In working to protect consumers from predatory lenders, advocates and policymakers should consider implementing their own regulations on unscrupulous financial service providers. Although the Consumer Financial Protection Bureau is set to finalize new regulations for payday lenders, these regulations will most certainly be under attack in Congress. Moreover, states’ regulations can buttress the important steps the Bureau is taking to regulate this industry. To do so, states should cap interest rates at 36% APR or lower since the Bureau’s regulations do not affect interest rates.32 Connecticut, New Jersey, North Carolina, New York and Pennsylvania have all implemented similar restrictions on payday, installment and auto-title loans.33
EMPOWERING COMMUNITIES OF COLOR TO SAVE FOR LONG-TERM GOALS
Savings for assets that can build intergenerational wealth, like homeownership, education and retirement, are a distant dream for many families. Thirty percent of Black households and 24% of Latino households have zero or negative net worth, meaning they have more debt than assets. The following are several policy options states should consider to support families as they build long-term savings that enable them to purchase assets that translate into lifelong financial well-being.
Policy Solution #1: Encourage matched savings programs like Individual Development Accounts.
Low-income people can and do save, and efforts to provide seed dollars and small matches for milestones can help families build longer-term assets. Traditionally, the most effective way to help low- and moderate-income households save has been through Individual Development Accounts, or IDAs. IDAs provide an opportunity to save for targeted goals—most commonly postsecondary education, homeownership or business ownership—by matching their savings at rates ranging from 2:1 to 8:1. A significant number of households of color have taken advantage of these accounts over the last 15 years, with African American and Hispanic savers comprising 40% and 17%, respectively, of those accountholders.34 Homeownership IDAs have been particularly critical in helping vulnerable families get ahead; hundreds of families have purchased homes and, in some cases, weathered foreclosure with the help of IDAs, as these programs also provide access to housing counseling and safe mortgage products.35 Because the federal government is no longer funding IDA programs, states have an opportunity to design and fund matched savings programs that strengthen business ownership prospects, homeownership and educational pursuits by meeting the short- and long-term needs of low-income savers.
Oregon has taken the lead in providing state funding for IDAs, committing $10.7 million annually through 2022, an investment that helps more than 3,500 Oregonians build their assets through homeownership, education and entrepreneurship each year.36 An additional 12 states and the District of Columbia provided funding for IDA programs in 2016, with 10 states overall maintaining stable levels of funding over the past three years.37

12
A STATE POLICY BLUEPRINT FOR A MORE INCLUSIVE PATH TO PROSPERITY
In encouraging matched savings programs, advocates and policymakers should consider:
n Supporting research focused on demonstrating the impact of IDAs. Any state establishment or expansion of funding for IDAs should dedicate funding for research on the impact of IDA pro-grams on communities of color.
n Targeting their funding allocations. States should dedicate a portion of state funding for IDAs to organizations that serve high-need communities of color. In places where this is not possible, identifying places with high concentrations of persistent poverty or high rates of asset poverty can help reach a higher volume of households of color.
Policy Solution #2: Encourage saving for college through Children’s Savings Account programs and lower tuition costs for undocumented students.
States can encourage families to save for college by adopting Children’s Savings Account (CSA) programs, and states can make college more affordable for undocumented students by allowing them to claim in-state tuition. CSAs are long-term savings or investment accounts that provide incentives like savings matches to help children and their families build dedicated savings that are typically restricted for the purposes of postsecondary education.
Research indicates that having dedicated college savings increases both parental expectations for children’s futures and increased expectations among students themselves.38 Because the amounts families save are typically small, CSAs will rarely decrease the amount of student debt amassed by graduates. Rather, CSA programs make it easier for students to fund extra costs of college that are not covered by scholarships, such as transportation and accommodations when dorms are closed for holidays. That potential, coupled with the fact that CSAs make college a regular part of conversations between parents and their kids, means that more students develop a college-bound identity earlier in life. Currently, two states have universal CSA programs, and ten additional states provide some sort of match for college savings.
In expanding access to higher education for students without full citizenship and students of color, advocates and policymakers should consider CSA programs that are automatic (i.e., students must opt out rather than opting in) and financially progressive in their funding structure (i.e., greater initial deposits and incentive matches are given to families that come from economically disadvantaged backgrounds).
In addition to helping families save for college, advocates and lawmakers can also extend the benefits of a college education by offering in-state tuition to high school graduates that have been admitted to a state college or university regardless of their citizenship status. Because students without full citizenship are not eligible for federal financial aid, postsecondary education is often out of reach for these students. Currently, 19 states have tuition equity policies and, contrary to popular belief, these policies do not contribute to revenue loss. According to experts in states that have already passed this legislation, the tuition paid by these students tends to increase school revenues because it accounts for income that would otherwise not exist. In the long-term, it also raises the caliber of the local workforce and strengthens the local economy, since many young immigrants are able to maintain professional jobs, pay taxes, and attract other well-educated workers to the state.39

13
A STATE POLICY BLUEPRINT FOR A MORE INCLUSIVE PATH TO PROSPERITY
Policy Solution #3: Promote access to retirement savings programs for workers without employer-sponsored plans and strengthen financial education to put long-term savings and investments within reach.
As the responsibility for retirement savings has increasingly shifted over the past 30 years from employers to employees, the number of workers with access to an employer-sponsored retirement savings plan has remained flat, failing to capture employees who no longer have access to a defined benefit pension.40 Although retirement savings remains a primary driver in decreasing poverty among elderly populations and increasing the likelihood of intergenerational wealth transfers, workers of color are more likely to lack access to safe, employer-sponsored retirement savings plans. The most recent data on the percentage of Black workers with access to an employer-sponsored retirement plan was nine percent lower than the rate for White workers. More importantly, among those with access, participation rates for Black workers were nearly 17% lower than participation rates for White workers.41 Such disparities in access and participation have contributed to widening disparities when it comes to levels of net worth, with the median net worth of Black households being $9,250 and $12,550 for Hispanic households compared to $127,200 for White households.42
An analysis of the U.S. Department of the Treasury’s now-defunct myRA program—shuttered by the Trump Administration in the summer of 2017—estimated that the program narrowed the racial wealth divide, even despite modest participation rates and moderate contributions by savers.43 This evidence suggests that increasing even basic access to retirement savings vehicles could have lasting impacts on workers’ financial health later in life.
Especially in the absence of myRA, states have the ability to do significantly more. Several states have begun rapidly and dramatically expanding access to retirement savings to workers largely left out of the long-term savings pool, namely lower-income workers and workers of color, by enacting statewide, automatic-enrollment individual retirement account programs known as AutoIRA. AutoIRA programs currently being implemented create safe, long-term savings options that make it easy to make deposits into the accounts, including default savings levels and automatically escalating contribution amounts, helping new savers contribute at maximum levels into portable accounts. These plans will do much to narrow the divide in retirement savings access and participation, especially as the portability of these accounts can boost plan participation rates above 90%.44 Several states are now well into the process of establishing their AutoIRA programs, including California, Connecticut, Illinois, Maryland and Oregon.
In expanding access to and participation in retirement savings plans, advocates and policymakers should consider:
n Following the steps outlined in our advocacy guide: An Advocacy Roadmap for Enacting Statewide Policies to Encourage Retirement Savings.45 This outlines what states seeking to pursue an AutoIRA program will need to follow in order to enact authorizing legislation prior to mandating the program.
n Developing education, marketing and outreach strategies in the earliest stages of planning. Especially given that many participants will be first-time investors who lack some financial ex-periences and knowledge needed to save and invest successfully, educating potential savers and conducting thorough outreach will be critical. Tailoring these strategies to communities of color by identifying community distribution channels, language translation resources and cul-

14
A STATE POLICY BLUEPRINT FOR A MORE INCLUSIVE PATH TO PROSPERITY
turally competent staffing can ensure that participants understand their rights and are ready to save. Research has demonstrated that the most significant positive effects on savings are seen among those with the least wealth when programs are paired with targeted education.46 Oregon took the lead in the pursuit of AutoIRAs by including a mandate in the authorizing legislation for its OregonSaves retirement program to provide recommendations to improve financial educa-tion in the state through collaborations between public, private and nonprofit organizations.
AFFORDABLE HOUSING & HOMEOWNERSHIP AS THE FOUNDATION OF BLACK & LATINO
WEALTH
Shelter is considered to be a fundamental basic need for all individuals and families, but the disappearance of low-cost housing nationwide, and specifically in metro areas with strong job markets, leaves too many households on the financial edge. The lack of affordable housing options impacts homeowners and renters alike, but renters are more likely to be burdened by their housing costs. When families struggle to pay the rent, the dream of homeownership can seem simply unattainable.
Approximately half of all U.S. renters are cost-burdened, meaning that they spend over 30% of their household income on rent and utilities. The statistics are even more troubling when broken down by race—58% of Black renting households and 57% of Hispanic renting households are cost-burdened, compared to 47% of White renting households. A recent study from the National Low-Income Housing Coalition found that there is no state or city where a minimum-wage worker can afford to rent a modest two-bedroom apartment.47 Without affordable rental options, families cannot free up funds for food, transportation, health care or other essential expenses.
For families who own their homes, home equity comprises the largest portion of their wealth. In fact, homeownership accounts for 34% of White household wealth and approximately 56% of Black and Latino household wealth. Because homeownership is the cornerstone of prosperity for low- and moderate-income households, it is not surprising that homeownership is also a major driver of the racial wealth divide.48 Owning a home is closely linked to a household’s ability to amass wealth for a number of reasons: mortgages provide a vehicle for regular savings because making on-time mortgage payments builds equity owned by the homeowner, most home values appreciate over time, federal tax benefits target homeowners, and homeownership offers protection against inflation in the rental market.49 Rates of homeownership are considerably higher for White households than for Black or Latino households. The Urban Institute estimates that by 2030, the Black homeownership rate will be about 40%, much lower than the 46% rate Black households saw in 2000. While the Hispanic homeownership rate is expected to rise—from 46% now to 48% in 2030—it is nevertheless projected to be 22 percentage points lower than the projected White homeownership rate of 70%.50
However, the benefits of homeownership are not equitably distributed across communities. As described in Prosperity Now’s 2017 report, A Downpayment on the Divide, historical and current housing and homeownership policies have resulted in lower homeownership rates, lower returns on homeownership investments and higher-cost mortgages for people of color. For example, the U.S. Department of Justice has more active redlining investigations underway in cities across the nation today than at any time in the past seven years.51 Research from 2015 shows that Black and Latino mortgage applicants were more likely to be denied a mortgage than White applicants, even when Black applicants had identical financial qualifications compared to their White counterparts.52

15
A STATE POLICY BLUEPRINT FOR A MORE INCLUSIVE PATH TO PROSPERITY
Unfortunately, increasing homeownership rates among communities of color will not in and of itself reduce racial wealth inequality. States should enact meaningful interventions that (1) support new homebuyers with downpayment assistance and equitable access to affordable mortgages, (2) increase the availability of affordable rental housing stock and home purchases that appreciate over time, and (3) reduce the risk of foreclosure and financial instability for existing homeowners. This is a three-legged stool of affordability, availability, and protection.
Policy Solution #1: Provide a range of supports for first-time homebuyers
Although housing plays a significant role in household wealth across the board, the reliance on housing for financial security is far more pronounced in communities of color. While 34% of White wealth is generated through homeownership, approximately 56% of Black and Latino wealth comes from owning a home.53 Furthermore, White families are five times more likely to receive large gifts and inheritances to be used for downpayments compared to non-White families, further adding to the advantages they enjoy on the path to homeownership.54 Therefore, any serious attempt to remedy the racial wealth divide must include strategies for increasing access to downpayment assistance and affordable sources of credit.
States can support first-time homebuyers by offering grants and “soft second” mortgages (subsidized and/or forgivable loans that help boost a borrower’s equity) directly to borrowers. States can also fund homeownership education and counseling for prospective homebuyers and current homeowners. When states offer mortgages directly to buyers, they have the authority to lower downpayment requirements. While that may raise red flags, mortgages are much safer now than before the Great Recession, especially given new mortgage underwriting and servicing rules.55 As a result, mortgages with lower downpayments are safer than those offered prior to these reforms. Such policies would disproportionately benefit Black and Latino mortgage applicants because they are less likely to have the savings needed to meet higher downpayment requirements. In fact, in one study of 700 borrowers, more than 40% of Black applicants reported applying for mortgages with downpayment requirements of five percent or less.56
In targeting homeownership support to first-time buyers, advocates and policymakers should consider how to make safe mortgage products more accessible. First-time homebuyer assistance policies must not only help households of color secure the funds needed for a downpayment, but also help families access mortgage products with lower costs and better terms and conditions. Comprehensive policies that truly support first-time homebuyers likely will also need to include reforms to outdated credit scoring and lending standards, as these have traditionally shut homebuyers of color out of the housing market.
Policy Solution #2: Pass legislation explicitly barring “source of income” discrimination to increase fair housing options.
Immigrants and racial and ethnic minorities are disproportionately concentrated in poor residential areas that are marked by substandard housing conditions, fewer employment opportunities, under-resourced schools and higher exposure to crime.57 The Housing Choice Voucher (HCV) program, the
16
A STATE POLICY BLUEPRINT FOR A MORE INCLUSIVE PATH TO PROSPERITY
federal government’s major program for assisting very low-income families, the elderly, and individuals with disabilities to afford decent housing in the private market, was partially designed to eliminate concentrations of poverty and racial segregation in housing. However, voucher holders often face significant obstacles to moving into neighborhoods that offer more opportunity—especially because most state and local laws do not require landlords to accept HCVs. As a result, voucher recipients’ success in finding housing before the vouchers expire varies widely from region to region.
States should add source of income as a protected class in their antidiscrimination laws, so that landlords cannot refuse tenants based on the fact they are using a voucher as payment. Doing so could increase options for voucher holders and potentially help desegregate neighborhoods. Currently, nine states and the District of Columbia explicitly prohibit discrimination based on source of income, including the receipt of housing assistance. An additional three states—California, Oklahoma and Wisconsin—prohibit source-of-income discrimination, but the laws are ambiguous about whether or not HCVs fall within the scope of the protection. Further, Indiana and Texas have laws that explicitly bar local governments from adopting ordinances that would protect HCV recipients from discrimination.58
In protecting homebuyers of color against source-of-income discrimination, advocates and policymakers should consider granting greater flexibility to public housing authorities. Allowing public housing authorities to extend the timeframes in which vouchers must be used can increase the likelihood that voucher holders will find a neighborhood that affords them more opportunity before the vouchers expire. Doing so would enable public housing authorities to work proactively with families that find the housing market to be too constrained for them to utilize their housing assistance.
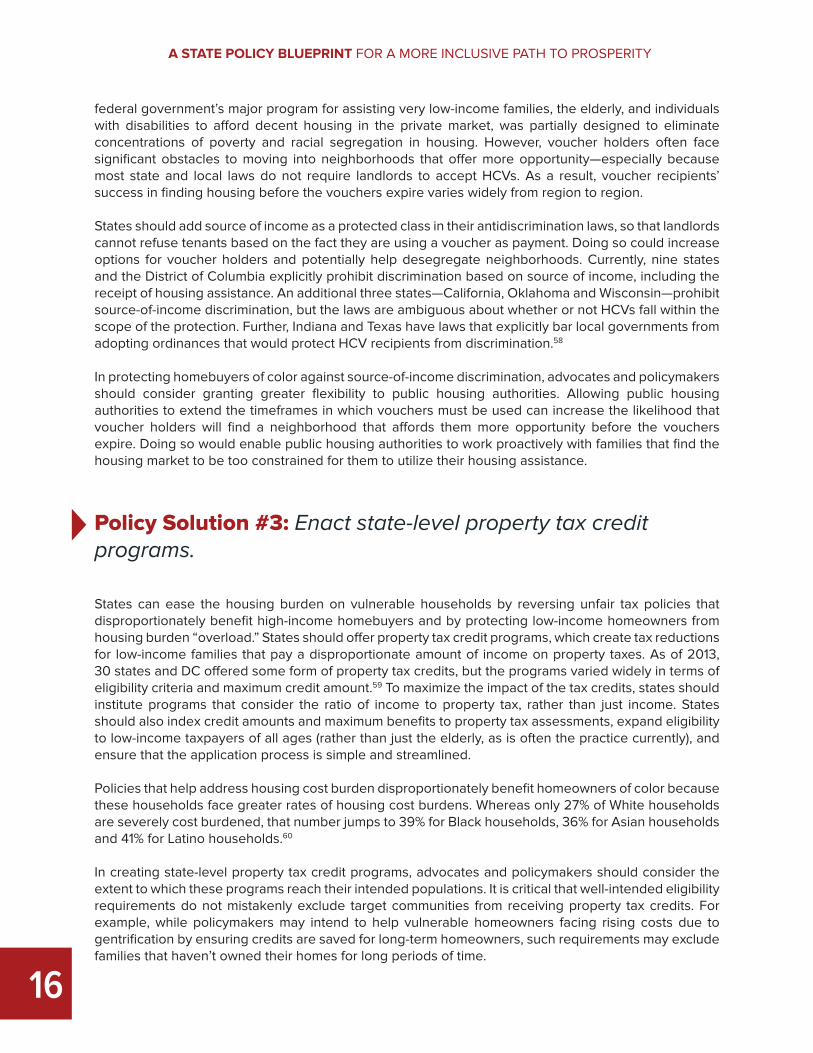
Policy Solution #3: Enact state-level property tax credit programs.
States can ease the housing burden on vulnerable households by reversing unfair tax policies that disproportionately benefit high-income homebuyers and by protecting low-income homeowners from housing burden “overload.” States should offer property tax credit programs, which create tax reductions for low-income families that pay a disproportionate amount of income on property taxes. As of 2013, 30 states and DC offered some form of property tax credits, but the programs varied widely in terms of eligibility criteria and maximum credit amount.59 To maximize the impact of the tax credits, states should institute programs that consider the ratio of income to property tax, rather than just income. States should also index credit amounts and maximum benefits to property tax assessments, expand eligibility to low-income taxpayers of all ages (rather than just the elderly, as is often the practice currently), and ensure that the application process is simple and streamlined.
Policies that help address housing cost burden disproportionately benefit homeowners of color because these households face greater rates of housing cost burdens. Whereas only 27% of White households are severely cost burdened, that number jumps to 39% for Black households, 36% for Asian households and 41% for Latino households.60
In creating state-level property tax credit programs, advocates and policymakers should consider the extent to which these programs reach their intended populations. It is critical that well-intended eligibility requirements do not mistakenly exclude target communities from receiving property tax credits. For example, while policymakers may intend to help vulnerable homeowners facing rising costs due to gentrification by ensuring credits are saved for long-term homeowners, such requirements may exclude families that haven’t owned their homes for long periods of time.
17
A STATE POLICY BLUEPRINT FOR A MORE INCLUSIVE PATH TO PROSPERITY
CONCLUSION: DESIGNING POLICIES THAT PROPEL INDIVIDUALS & FAMILIES OF COLOR
States have many tools and resources at their disposal to boost income, enable the purchase of long-term assets and protect households’ assets and earnings, especially for individuals and families of color. Leveraging these tools and resources will be critical both to ensuring residents start out on a path to lasting financial health, and to closing the ever-accelerating racial wealth divide.
It is important to note that fundamental to all of these policies is the need to consult communities of color in the design of programs, to consistently target programs to communities of color through marketing and outreach, and to track outcomes in a way that disaggregates data by race. Each of these steps will ensure that the policies, when adopted, reach the communities of color that have faced centuries of discrimination that has kept them off the ladder of opportunity.
More specifically, advocates and policymakers should:
n Collect data to continually assess and improve policies. State-level programs typically lack the data needed to estimate how a policy might affect particular communities. Designing policies requires navigating many tradeoffs, but without sufficient data about the target beneficiaries, policymakers will not be able to critically assess those tradeoffs.
n Identify effective methods to market and raise awareness about policies. Regardless of how strong a policy might be on paper, it may have little tangible impact if the intended audience is unaware of it. For example, a generous state EITC program for which many workers are eligi-ble will be unhelpful if those who are eligible do not realize they qualify. Policymakers should expend the same level of energy in understanding how to best reach the target audience—through surveys, interviews, focus groups or other methods—as they expend developing and passing the policy itself.
n Ensure that those most impacted by a policy are engaged in the process of bringing the policy to fruition. Policies are stronger when marginalized or underrepresented groups are ac-tively involved in the process of developing an advocacy strategy and designing its specific elements. In facilitating this process, expect and plan for a diversity of perspectives from stake-holders, even those who seemingly represent the same groups. A diversity of coalition partners with a range of skills, perspectives and strengths can help navigate the policy design process in a way that addresses interconnected issues and accounts for the cascading impacts a particular policy will have.
For additional equity recommendations, see the Racial Equity Policy Design and Advocacy Primer61. The policies in this Blueprint are just a few of the meaningful, manageable and moveable opportunities that lawmakers and advocates can seize to help communities of color start on the long journey toward financial security, wealth and prosperity.
prosperitynow.org
18
A STATE POLICY BLUEPRINT FOR A MORE INCLUSIVE PATH TO PROSPERITY
ENDNOTES1 “Unemployed Persons by Duration of Unemployment,” U.S. Bureau of Labor Statistics, 2016, https://www.bls.gov/news.release/empsit.t12.htm.
2 Laura Sullivan, Tatjana Meschede, Lars Dietrich, Thomas Shapiro, Amy Traub, Catherine Ruetschlin and Tamara Draut, The Racial Wealth Gap: Why Policy Matters (New York: Demos, 2015), 24.
3 Growing evidence shows that certain policies can widen the racial wealth gap, even if those policies are designed to close the gap or help communities of color. All of the policies included in this guide have not been analyzed for the extent to which they close the racial wealth divide, but we know that many of these policies have disproportionately positive impacts on communities of color. Data on the impact of policies on the racial wealth divide are included when available. Much of the case-making data and research connected with the listed recommendations compare White and Black households, as well as White and Latino households.
4 For a listing of select state ballot measures that support financial security, see “Bright Spots for Financial Security in the Election Results,” Prosperity Now, 2017, https://prosperitynow.org/blog/bright-spots-financial-security-election-results.
5 57585b http://www.cbpp.org/research/federal-tax/policy-basics-the-earned-income-tax-credit.
6 “CalEITC Particularly Benefits Children of Color and Women,” California Budget & Policy Center, 2017, http://calbudget-center.org/blog/caleitc-particularly-benefits-children-color-women/.
7 Lewis Brown Jr. and Heather McCulloch, Building an Equitable Tax Code: A Primer for Advocates (Oakland, CA: Poli-cyLink, 2014).
8 For more information about these types of innovations, see VITA Can Be Vital: How States Can Support Taxpayers Through Volunteer Income Tax Assistance (Washington, DC: Prosperity Now, 2017).
9 “Tax Prep Chains Target Low-Income Workers,” The Progressive Policy Institute, 2016, http://www.progressivepolicy.org/issues/economy/press-release-ppi-report-tax-prep-chains-target-low-income-workers/.
10 For more information about how states can hold tax preparers accountable, see With the Stroke of a Pen: Policy Rec-ommendations for Holding Paid Tax Preparers Accountable (Washington, DC: Prosperity Now, 2017).
11 “Is Head Start Worth the Price?” The Hill, 2016, http://thehill.com/blogs/pundits-blog/education/279319-is-head-start-worth-the-price.
12 Claire Montialoux, Revisiting the Impact of Head Start (Berkeley, CA: Institute for Research on Labor and Employment, 2016).
13 “UCLA Research Shows Dramatic Savings for Medicaid When Head Start Parents Learn to Care for Kids,” UCLA/Johnson & Johnson Health Care Institute, 2007, https://www.eurekalert.org/pub_releases/2007-11/uoc--urs110707.php.
14 “Head Start Access and Participation,” Institute for Child, Youth and Family Policy, 2017, http://www.diversitydatakids.org/files/Policy/Head%20Start/Capacity/Participation%20POIs/Head%20Start%20Access%20and%20Participation.pdf.
15 Head Start Parent Ambassador Individual Development Account (IDA) Project Evaluation Report – Final Project Re-port (Seattle, WA: The Prosperity Agenda, 2014).
16 “Liquid Asset Poverty Rate,” 2017 Prosperity Now Scorecard (Washington, DC: Prosperity Now, 2017).
17 “Economic Inclusion,” Federal Deposit Insurance Corporation, 2015, https://www.economicinclusion.gov/custom-da-ta/.
18 In FY2013, 51% of all TANF cash assistance families had one child. Of all TANF assistance child recipients, 36.3% were Hispanic, 29.9% were African American, and 25.8% were non-Hispanic White (CRS). Also in FY2013, of all SNAP partici-pants, 10.3% were Hispanic, 25.7% were African American, and 40.2% were non-Hispanic White (USDA).

19
A STATE POLICY BLUEPRINT FOR A MORE INCLUSIVE PATH TO PROSPERITY
19 “Asset Limits Are a Barrier to Economic Security and Mobility,” Center for American Progress, 2014, https://www.ameri-canprogress.org/issues/poverty/reports/2014/09/10/96754/asset-limits-are-a-barrier-to-economic-security-and-mobility/.
20 Leah Hamilton, Ben Alexander-Eitzman, and Whitney Royal, Shelter From the Storm: TANF, Assets, and the Great Recession (Boone, NC: Appalachian State University, 2015), 1-4.Annamaria Lusardi, Daniel Schneider, and Peter Tufano, Financially Fragile Households: Evidence and Implications (Washington, DC: Brookings Institute, 2011), 85.
21 Heather Hahn, Laudan Aron, Cary Lou, Eleanor Pratt, and Adaeze Okoli, Why Does Cash Welfare Depend on Where You Live? (Washington, DC: Urban Institute, 2017). This study actually found a weak positive relationship between states with higher concentrations African American people and likelihood they would have a higher asset limit, allowing for more savings.
22 “Asset Limits Are a Barrier to Economic Security and Mobility,” Center for American Progress, 2014.
23 Caroline Ratcliffe, Signe-Mary McKernan, Laura Wheaton, Emma Kalish, Catherine Ruggles, Sara Armstrong, and Christina Oberlin. Asset Limits, SNAP Participation, and Financial Stability (Washington, DC: Urban Institute, 2016).
24 “FDIC National Survey of Unbanked and Underbanked Households,” Federal Deposit Insurance Corporation, 2016, 16.
25 “Do Limits on Family Assets Affect Participation in, Costs of TANF?” Pew Charitable Trusts, 2016, http://www.pewtrusts.org/en/research-and-analysis/issue-briefs/2016/07/do-limits-on-family-assets-affect-participation-in-costs-of-tanf; Car-oline Ratcliffe, Signe-Mary McKernan, Laura Wheaton, Emma Cancian Kalish, Catherine Ruggles, Sara Armstrong and Christina Oberlin, Asset Limits, SNAP Participation and Financial Stability (Washington, DC: Urban Institute, 2016).
26 “Asset Limits in Public Benefit Programs,” 2017 Prosperity Now Scorecard (Washington, DC: Prosperity Now, 2017).
27 Sarah L. Szanton et al. Food Assistance is Associated with Decreased Nursing Home Admissions for Maryland’s Du-ally Eligible Older Adults. BMC Geriatrics, 17:162, 6.
28 Heather Hahn, Laudan Aron, Cary Lou, Eleanor Pratt, and Adaeze Okoli. Why Does Cash Welfare Depend on Where You Live? (Washington, DC: Urban Institute, 2017). This study actually found a weak positive relationship between states with higher concentrations African American people and likelihood they would have a higher asset limit, allowing for more savings.
29 Susanna Montezemolo, Payday Lending Abuses and Predatory Practices: The State of Lending in America & its Im-pact on U.S. Households (Durham, NC: Center for Responsible Lending, 2013, 4).
30 Brandon Coleman and Delvin Davis. Perfect Storm: Payday Lenders Harm Florida Consumers Despite State Law (Durham, NC: Center for Responsible Lending, 2016). Uriah King, Wei Li, Delvin Davis, and Keith Ernst. Race Matters: The Concentration of Payday Lenders in African-American Neighborhoods in North Carolina. (Durham, NC: Center for Responsible Lending, 2005). “State Research Shows That Payday Lending Stores Are Heavily Concentrated In African American and Latino Com-munities Across California,” Center for Responsible Lending, 2016, http://www.responsiblelending.org/media/state-re-search-shows-payday-lending-stores-are-heavily-concentrated-african-american-and.
31 For state-specific information about efforts to protect borrowers from predatory lending, see Carolyn Carter, Lauren Saunders and Margot Saunders, Predatory Installment Lending in 2017: States Battle to Restrain High Cost Loans (Wash-ington, DC: National Consumer Law Center, 2017).
32 “Predatory Small Dollar Lending Protections,” 2017 Prosperity Now Scorecard (Washington, DC: Prosperity Now, 2017).
33 For the full text of the Bureau’s rule, visit https://www.regulations.gov/document?D=CFPB-2016-0025-0001. For Prosperity Now’s comments on the rule, visit https://prosperitynow.org/files/PDFs/CFED-PDL_Comment_Letter_FI-NAL_10-2016.pdf.
34 Report to Congress: Assets for Independence Program, U.S. Department of Health and Human Services, 2014, https://www.acf.hhs.gov/sites/default/files/ocs/fy2014_15th_afi_report_to_congress_final_8_5_16b.pdf.

20
A STATE POLICY BLUEPRINT FOR A MORE INCLUSIVE PATH TO PROSPERITY
35 Ida Rademacher, Kasey Wiedrich, Signe-Mary McKernan, Caroline Ratcliffe and Megan Gallagher. Weathering the Storm: Have IDAs Helped Low-Income Homeowners Avoid Foreclosure? (Washington, DC: The Urban Institute and CFED, 2010).
36 “2014/15 Annual Report,” Neighborhood Partnerships, 2016, http://neighborhoodpartnerships.org/wp-content/up-loads/2009/05/201415AnnualReport_FINAL2.pdf.
37 “Individual Development Accounts,” 2017 Prosperity Now Scorecard (Washington, DC: Prosperity Now, 2017).
38 Sondra Beverly, Margaret Clancy and Michael Sherraden, Universal Accounts at Birth: Results from SEED for Oklaho-ma Kids (St. Louis, MO: Center for Social Development, Washington University in St. Louis, 2016).
39 “Basic Facts About In-State Tuition for Undocumented Immigrant Students,” National Immigration Law Center, 2014, https://www.nilc.org/issues/education/basic-facts-instate/.
40 Craig Copeland, Employment Based Retirement Plan Participation: Geographic Differences and Trends, 2013 (Wash-ington, DC: Employee Benefit Research Institute, 2014), 27.
41 Ibid., 10.
42 “Median Net Worth of Households,” 2017 Prosperity Now Scorecard (Washington, DC: Prosperity Now, 2017).
43 “Investing in Tomorrow: Helping Families Build Savings and Assets,” The Annie E. Casey Foundation, 2016, http://www.aecf.org/resources/investing-in-tomorrow-helping-families-build-savings-and-assets/.
44 William Gale, Mark Iwry and Peter Orszag, The Automatic 401(k): A Simple Way to Strengthen Retirement Saving (Washington, DC: Tax Policy Center, 2005).
45 “An Advocacy Roadmap for Enacting Statewide Policies to Encourage Retirement Savings,” Prosperity Now, 2016, https://prosperitynow.org/files/resources/09-2016_Stroke-of-a-Pen_Retirement_Savings_Advocacy.pdf.
46 Annamaria Lusardi, Saving and the Effectiveness of Financial Education, (Philadelphia, PA: Pension Research Council, 2004).
47 “Out of Reach 2017,” National Low Income Housing Coalition, 2017, http://nlihc.org/oor.
48 Thomas Shapiro, Tatjana Meschede, and Sam Osoro, The Roots of the Widening Racial Wealth Gap: Explaining the Black-White Economic Divide, (Boston, MA: Institute for Assets and Social Policy, 2013).
49 Herbert, Christopher E., Daniel T. McCue, and Rocio Sanchez-Moyano. Is Homeownership Still an Effective Means of Building Wealth for Low-income and Minority Households? (Was it Ever?), (Cambridge, MA: Joint Center for Housing Studies, Harvard University, 2013).
50 Laurie Goodman, Rolf Pendall, and Jun Zhu, “A Lower Homeownership Rate is the New Normal”. (Washington, D.C.: Urban Institute, 2015).
51 “Biased Lending Evolves, and Blacks Face Trouble Getting Mortgages,” New York Times, 2015, https://www.nytimes.com/2015/10/31/nyregion/hudson-city-bank-settlement.html?_r=2&mtrref=cfed.org.
52 “Fact File: Unequal Treatment Keeps People of Color from Building Wealth,” Prosperity Now, 2017, https://prosperi-tynow.org/resources/fact-file-unequal-treatment-keeps-people-color-building-wealth.
53 William R. Emmons, “What We’ve Learned About Household Financial Stability,” Federal Reserve Bank of St. Louis, November 2015, https://www.stlouisfed.org/~/media/Education/Presentations/What-Weve-Learned-Emmons.pdf.
54 Signe-Mary McKernan, Caroline Ratcliffe, Margaret Simms, and Sisi Zhang, Do Financial Support and Inheritance Contribute to the Racial Wealth Gap? (Washington, D.C.: Urban Institute, 2012).

21
A STATE POLICY BLUEPRINT FOR A MORE INCLUSIVE PATH TO PROSPERITY
55 Marc H. Morial, “The Homebuyers’ Bill of Rights 2.0.” (New York, NY: National Urban League, 2016).
56 A House Divided: How Race Colors the Path to Homeownership. (Seattle, WA: Zillow, Inc., 2014) 22.
57 Megan Haberle and Jorge Soto, Discrimination and Segregation in Housing: Continuing Lack of Progress in United States Compliance with the International Convention on the Elimination of All Forms of Racial Discrimination. (Washing-ton, DC: Report to the U.N. Committee on the Elimination of Racial Discrimination, 2014, 3).
58 J. Rosie Tighe, Megan E. Hatch, and Joseph Mead, Source of Income Discrimination and Fair Housing Policy (Cleve-land, OH: Journal of Planning Literature, 2016).
59 “State Tax Codes As Poverty Fighting Tools,” Institute on Taxation and Economic Policy, 2013, http://www.itep.org/pdf/Poverty2013Report.pdf.
60 2015 American Community Survey. Washington, DC: U.S. Department of Commerce, Census Bureau, 2016. Data cal-culated by Prosperity Now using Public Use Microdata Sample files.
61 Racial Equity Policy Design and Advocacy Primer, (Washington, DC: Prosperity Now, 2017).

22
A STATE POLICY BLUEPRINT FOR A MORE INCLUSIVE PATH TO PROSPERITY
prosperitynow.org
ABOUT STATE & LOCAL POLICY AT PROSPERITY NOW: The policies in the Scorecard are gathered and analyzed by the State & Local Policy team at Prosperity Now. The team partners with advocates, policymakers and researchers across the nation to advance state policies through case making, direct advocacy, and supporting stakeholder and constituent engagement. Contact us for more information on how we can support your state financial security policy agenda.
Solana Rice State & Local Policy Director
Holden Weisman State & Local Policy Manager [email protected]
Kamolika Das
State & Local Policy Manager [email protected]
23
A STATE POLICY BLUEPRINT FOR A MORE INCLUSIVE PATH TO PROSPERITY
ABOUT THE PROSPERITY NOW SCORECARD
The policies in this report are from the Prosperity Now Scorecard — a comprehensive resource featuring data on family financial health and policies to help put all U.S. households on a path to prosperity. The Scorecard equips advocates, policymakers and practitioners with national, state, county and city data to jump-start a conversation about solutions and policies that put households on stronger financial footing across five issue areas: Financial Assets & Income, Businesses & Jobs, Homeownership & Housing, Health Care and Education. To create custom reports with data by city, county, metro area
and state along with additional policies, visit scorecard.prosperitynow.org.

24
A STATE POLICY BLUEPRINT FOR A MORE INCLUSIVE PATH TO PROSPERITY
A STATE POLICY BLUEPRINT FOR A MORE INCLUSIVE PATH TO PROSPERITY