a spatial dashboard for the dementias in new south wales
TRANSCRIPT
A Spatial Dashboard for Alzheimer's Disease in New South Wales
PresenterHamish Robertson

Contents
• Introduction
• Scenario Builder for dementias over time and by location
• Key issues and local profiles
• Mapping distribution and service relationships - Maptitude
• Dashboarding Ageing Demography and Dementia - Tableau
• Dashboarding Aged Care Service Providers
• Mapping Formal Care Costs Scenarios
• Discussion
• Conclusion
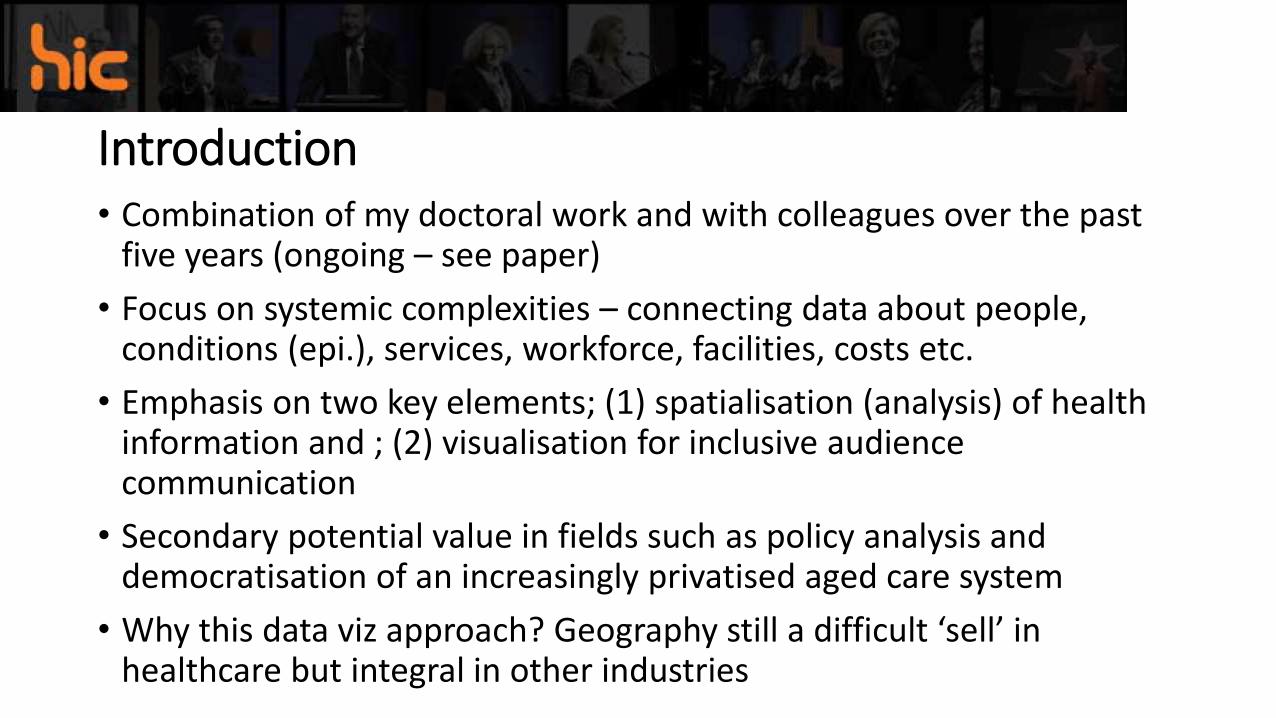
Introduction• Combination of my doctoral work and with colleagues over the past
five years (ongoing – see paper)
• Focus on systemic complexities – connecting data about people, conditions (epi.), services, workforce, facilities, costs etc.
• Emphasis on two key elements; (1) spatialisation (analysis) of health information and ; (2) visualisation for inclusive audience communication
• Secondary potential value in fields such as policy analysis and democratisation of an increasingly privatised aged care system
• Why this data viz approach? Geography still a difficult ‘sell’ in healthcare but integral in other industries

Scenario Builder in Excel – Linking Inputs and Outputs
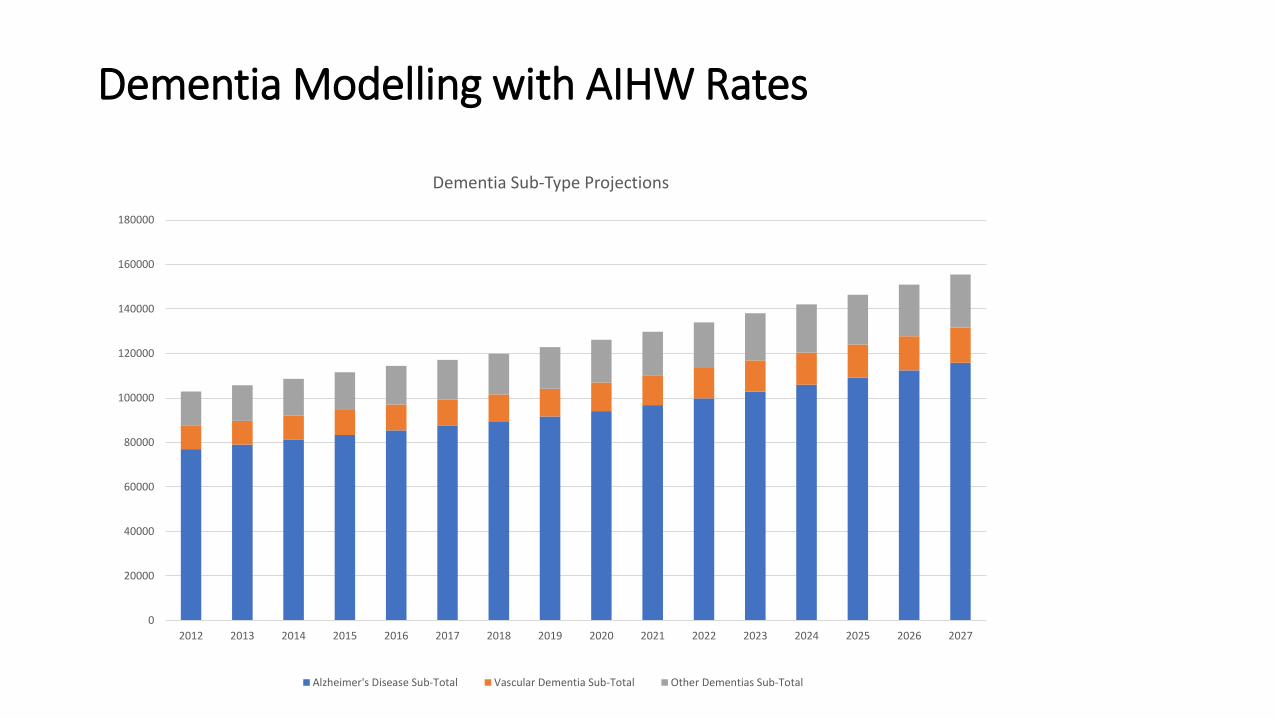
Dementia Modelling with AIHW Rates
0
20000
40000
60000
80000
100000
120000
140000
160000
180000
2012 2013 2014 2015 2016 2017 2018 2019 2020 2021 2022 2023 2024 2025 2026 2027
Dementia Sub-Type Projections
Alzheimer's Disease Sub-Total Vascular Dementia Sub-Total Other Dementias Sub-Total

Outputs for Every SA2 in NSW: Local Profiles
0
100
200
300
400
500
600
700
800
900
2012 2013 2014 2015 2016 2017 2018 2019 2020 2021 2022 2023 2024 2025 2026 2027
Alzheimer's in Tweed Heads2012-2027

Health Services and Projected Scenarios: NSW Ambulance Stations (current) x Scenario 1 in 2027

NSW Ambulance Stations (current) x Scenario 1 in 2027 –Sydney Metro

Service Providers Types Included in Modelling
• Public hospitals
• ACATs
• Ambulance stations
• GPs
• Pharmacists
• Residential care facilities
• Meals on Wheels (HACC provider example)
• Entirely extensible and updateable – manual or dynamic data feeds,

Tableau Dashboarding Ageing Demography and Dementias
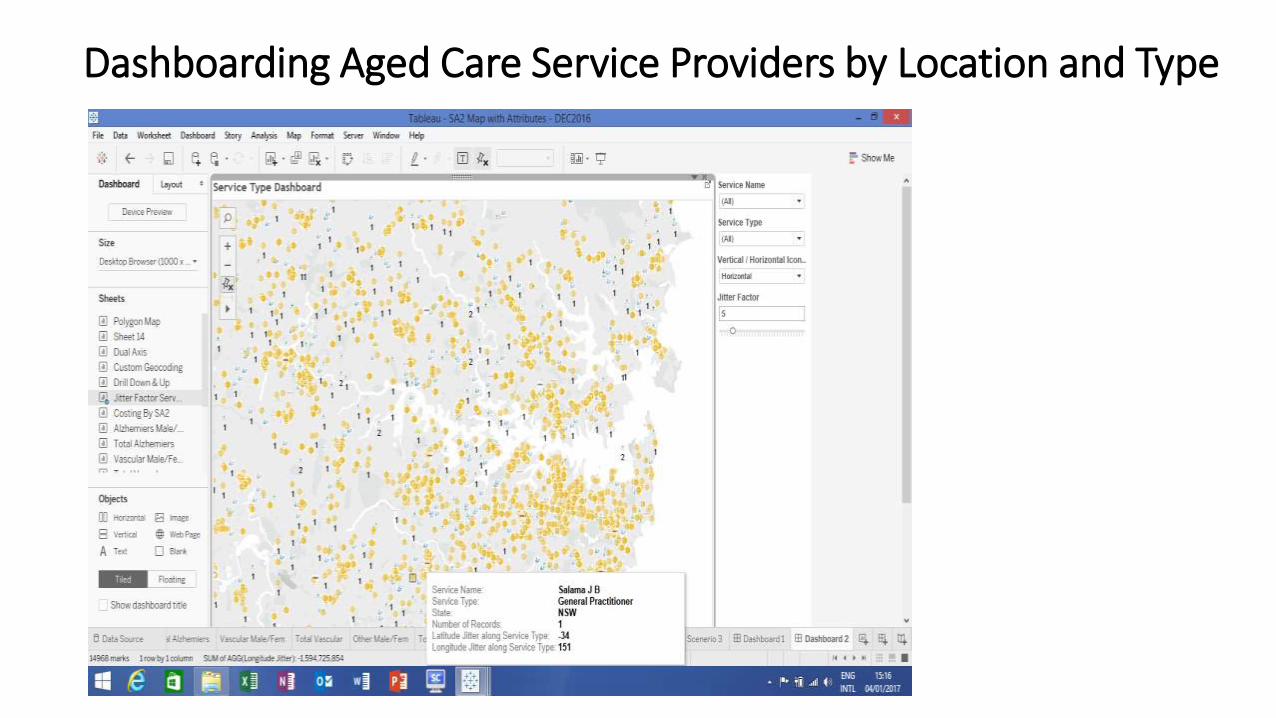
Dashboarding Aged Care Service Providers by Location and Type

Mapping of Three Projected Formal Care Costs Scenarios by SA2

Heat Mapping Option

Discussion
• Complexities of ageing require new, innovative approaches• Support multiple audiences with varying data/informatics literacy needs• Spatial dimension increasingly popular in data viz packages and more data
than ever is georeferenced (RFID, GPS, LiDAR etc.)• GIS software moving to visually engaging and dynamic dashboard
environments (e.g. ESRI)• Same data accessible in different formats to engage different audiences• Geographic approach central to all aspects of the ageing equation and yet
still peripheral • Limitations – population-level studies and dynamic demography, Tableau
map analysis capability vs Maptitude dashboard capability• Updating and refining to reflect 2016 census outputs and emerging research

Conclusion
• A fast-moving and developmental technological area – multi-industry
• Population ageing is becoming geographically complex and dynamic –global to local variations
• Population ageing will continue to diversify – still far too monolithic a construct
• Epidemiology of ageing is already diversifying – acute, chronic disease, disability conditions, intersectionalities etc.
• Big data concept gaining ground in healthcare (bit mixed and variable)
• Space and place foundational to environmental and societal complexities
• Spatial data viz supports engagement with real-life locational complexities