a spatial analysis of common property deforestation-jennifer alix
TRANSCRIPT

8/3/2019 A Spatial Analysis of Common Property Deforestation-jennifer Alix
http://slidepdf.com/reader/full/a-spatial-analysis-of-common-property-deforestation-jennifer-alix 1/17
Journal of Environmental Economics and Management 53 (2007) 141–157
A spatial analysis of common property deforestation$
Jennifer Alix-Garcia
Department of Economics, University of Montana, 407 Liberal Arts, Missoula, MT 59812, USA
Received 19 July 2005
Available online 6 February 2007
Abstract
This paper develops and tests a theory of common property deforestation over space. The model examines both the
spatial distribution of forest loss and the total amount of deforestation within a given community, showing how these
outcomes are jointly determined. The model equations are estimated in a four-step process using data from 318 Mexican
common properties. In contrast to previous deforestation theories, this paper shows that the allocation of deforestation
across space is dependent upon both the absolute and relative quality and location of each hectare of land in the same
community and on the overall deforestation decision of the community. Simultaneously, total deforestation depends upon
the value of deforested land, which is determined by its physical attributes, as well as the characteristics of the community
that affect its collective choice problem. Smaller group size, higher secondary education, and greater inequality correspond
to lower deforestation.
r 2007 Elsevier Inc. All rights reserved.
Keywords: Deforestation; Common property resources; Spatial analysis; Inequality
1. Introduction
The depletion of forests in developing countries, particularly tropical forests, has been of increasing concern
to policymakers over the past 25 years. This focus has largely been due to the fear of species and carbon
sequestration loss, in addition to local negative externalities such as decreased water quality and increased soil
erosion. Pinpointing the location of forests at risk of deforestation provides a crucial piece of information for
developing effective forest protection policy. Vulnerability to forest loss, combined with knowledge of the
value of each piece of forest, tells policymakers exactly which forests to prioritize for interventions [1,36,18].
Mexico finds itself at the heart of the deforestation debate as it considers new policy options to regulate itshigh rate of forest loss, which at 1.3% per year is similar to that of Brazil [41]. According to the Mexican
National Forestry Commission (CNF), 80% of the country’s forests are located in ejidos, communities
ARTICLE IN PRESS
www.elsevier.com/locate/jeem
0095-0696/$- see front matterr 2007 Elsevier Inc. All rights reserved.
doi:10.1016/j.jeem.2006.09.004
$This research was supported with funding from the Social Science Research Council, the Tinker Foundation, and the Center for
Sustainable Resource Development at the University of California, Berkeley. It would not have been possible without the help of the
Instituto Nacional de Ecologı ´a, the Universidad Iberoamericana, the Centro de Investigaciones y Docencias Econo ´ micas in Mexico, and
the World Bank. I am also indebted to Alain de Janvry, Elisabeth Sadoulet, and David Zilberman for their outstanding guidance, and very
grateful for helpful comments from referees for this journal, Alexander Pfaff, and participants in the development workshop of the
Department of Agricultural and Resource Economics, University of California, Berkeley.
E-mail address: [email protected].
8/3/2019 A Spatial Analysis of Common Property Deforestation-jennifer Alix
http://slidepdf.com/reader/full/a-spatial-analysis-of-common-property-deforestation-jennifer-alix 2/17
resulting from the postrevolution land reform which hold their forest lands as commons. Their large forest
holdings make them the fundamental place to address the deforestation problem. The common property
nature of Mexico’s deforestation dilemma is far from unique. Though an exact measure of the total amount of
world forest in common property is not available, two recent reports by Forest Trends estimate that 370
million ha (compared to the 470 million ha worldwide in preserves) qualify as ‘‘community-managed’’1 [27,47].
These forests are not limited to developing countries, though they are more abundant there, and can be foundin the US and Europe as well.
Deforestation studies have preoccupied social scientists for some time. Much early research focused on
cross-country determinants of deforestation. Cropper and Griffiths [19] estimate the effect of population and
economic growth on deforestation in tropical countries, finding a positive effect for the former, though only in
Africa, and a small but positive effect of the latter. Further evidence of the positive effect of population growth
on deforestation can be found in Allen and Barnes [3] and Rudel [40]. Deacon [21] illustrates the importance of
political instability and population growth in determining deforestation rates in the 1980s, and presents a
convincing case for the importance of ownership security in Deacon [22]. Vincent has written extensively on
trade, forest management, and deforestation, pointing out both situations where government policies distort
market signals [45,46] and where they can be applied to increase efficiency [10,11]. A useful review of this
literature is given in Barbier [7].
The empirical microlevel literature on deforestation using satellite imagery is relatively recent. Panayotouand Sungsuwan [33] conducted one of the earlier studies, linking satellite images of Thailand with population,
price, and infrastructure data, and finding population density to be the most important determinant of
deforestation. Nelson and Hellerstein [30] provide another early example of the use of geographical data to
analyze land use decisions. A particularly influential paper was Chomitz and Gray [14]. The model they
present, that of a profit-maximizing farmer who chooses to put a given piece of land into its most profitable
activity has, with minor modifications, been the basis of many subsequent papers. Analysis at the municipal or
pixel level (where a pixel is the smallest possible unit of geographical analysis determined by the resolution of
the available data) has been used to operationalize this approach. Papers with pixel-level analysis include Puri
and Griffiths [38], Monroe et al. [28], Godoy and Contreras [24], and Vance and Geoghegan [43], while
Deininger and Minten [23] and Pfaff [35] are municipal level studies, and Chomitz and Thomas [15] use census
tract level data. The empirical strategy in this case generally takes the form of a probit (or tobit) of deforestation on absolute physical attributes of a pixel, such as slope, altitude, and distance to a road or city
center. In addition, municipal or household characteristics are sometimes included to control for their effect
on demand for forest conversion. While most empirical papers consider each piece of land in isolation, one
important exception is Stavins and Jaffe [42], who take considerable effort to show how heterogeneity in land
quality affects conversion of individual wetland areas. More recently, Robalino and Pfaff [39] look at
interactions between neighboring hectares of forest and find that, using the attributes of neighboring parcels as
an instrument, actions taken on adjacent pieces of land influence the deforestation decision of a given piece of
forest.
This paper’s strategy differs in two ways from the established literature. First, the unit of analysis is chosen
to be the de jure unit of decision-making, in this case the community. Second, I construct a structural model
that allows us to explore the questions of both where within community boundaries and how much
deforestation occurs in total in a given ejido. These decisions are jointly determined within the community.
I will show that the first innovation implies that in addition to the absolute physical attributes of individual
hectares of land, the relative attributes of the land within the decision-making community are key
determinants of the location of deforestation. The model indicates that the probability of deforestation for
2 ha of forest with equivalent characteristics located in different communities may differ for two reasons.
First, each hectare may be located in a different place within the community’s land distribution. Second, the
solution to the collective demand for forest conversion may be different in the two communities, which
changes the probability of deforestation for every parcel within ejido boundaries. Simultaneously, this
overall deforestation decision varies both with the quality of the best hectares of land and with variables,
ARTICLE IN PRESS
1This category includes both government owned forested lands allocated for use to local communities and those owned directly by
‘‘local community groups’’ [47, p. 5–6].
J. Alix-Garcia / Journal of Environmental Economics and Management 53 (2007) 141–157 142

8/3/2019 A Spatial Analysis of Common Property Deforestation-jennifer Alix
http://slidepdf.com/reader/full/a-spatial-analysis-of-common-property-deforestation-jennifer-alix 3/17
like group size and inequality, that affect the community collective choice problem, which can range from
non-cooperative to socially optimal.
The theory suggests a system of equations which are estimated using data from 318 ejidos surveyed in 2002
to explain the probability of deforestation of a given hectare of land and total deforestation in the community,
where these two relationships are interdependent. A four step strategy is used to estimate the system with
bootstrapped standard errors to account for the inclusion of predicted values. I also examine some of theimplications of spatial dependence for this estimation technique.
The results corroborate the predictions of the theory. In brief, they show that given an aggregate
deforestation level, it is the characteristics of a piece of land relative to all of the other hectares considered
jointly within the decision-making community that drive the deforestation decision across space. Increases in
the demand for new pasture land result in the conversion of increasingly less profitable hectares of forested
land. On an aggregate level, forest conversion decreases with the average distance, slope, altitude, and the
variance of the slope of the relatively more profitable parcels. The effect of group size on deforestation is
positive, consistent with Olson’s [32] finding that cooperation is hindered by larger groups, while that of
secondary education is negative. Finally, in contrast to Cardenas [12] and Dayton-Johnson [20], the estimates
show that inequality is associated with a significant and substantial decrease in overall deforestation.
The paper is organized as follows: it begins by describing the data and some key characteristics that
motivate the design of the model. Section 3 presents a simple spatial/common property deforestation model,Section 4 the empirical strategy, and Section 5 results of the estimations. The final section concludes.
2. Data description and background on ejidos
Ejidos are composed of both private and commons land. By law, the forest must be in the commons. The
size and distribution of the private parcels are features determined at the founding of each ejido, the date of
which varies from community to community. Rights to a parcel and use of the commons are passed on to only
one family member per ejidatario, so membership has been constant over time. There is one caveat to this
statement. A 1992 land reform law allowed for the integration of new members and the allocation of land to
them. In order to circumvent the possible endogeneity of this group expansion or land redistribution, I use the
pre-reform membership size and land distribution characteristics in this study.All ejidos have the same basic institutional structure: every 2 years they elect a community council whose
minimal composition includes a president, treasurer, secretary, and ‘comite ´ de vigilancia’, which is a
combination of ombudsman and policeman. A person cannot serve on the council for two consecutive terms
although he can be re-elected after a one-term hiatus. Communities make decisions in general assemblies
which occur on a monthly or bimonthly basis, where decisions are taken by majority rule or, in some cases, by
unanimity.
The ejido data come from a survey of 450 forest-holding ejidos conducted throughout Mexico in 2002.
These communities were selected at random from all the ejidos in the country with forest holdings greater than
100 ha in 1994. A map of the sample is shown in Fig. 1. The survey consisted of two sections, a community
questionnaire and a household questionnaire. Respondents were three to four members of the community
council. The community questionnaire collected basic characteristics of the community, including information
on forest exploitation and governance. The household questionnaire, applied to 50 randomly chosen
ejidatarios (members of the ejido), was an indirect survey where information was collected from one key
informant. The relevant individual level data for this study is household size, age of household head, land and
cattle holdings, and use of the commons. Out of the entire sample, I use only the 324 communities that do not
have forestry projects. Communities that undertake active wood exploitation are very likely subject to a
different deforestation dynamic than those that do not (this dichotomy is detailed in [2]).
Mexico’s National Ecology Institute (INE) provided the National Forestry Inventories for 1994 and 2000
which are used to calculate forest loss. The inventories are based upon maps of scale 1:250,000 and 1:125,000,
respectively. Though initially not comparable, the maps have been reinterpreted for comparability by the
Institute of Geography at the Autonomous University of Mexico. The details of this process are described in
Velasquez et al. [44]. A grid of 1 ha squares over the forested area serves as the primary spatial unit of analysis.
These units are referred to as ‘hectares of land’ or ‘hectares’ in the text that follows. Slopes and altitudes have
ARTICLE IN PRESS
J. Alix-Garcia / Journal of Environmental Economics and Management 53 (2007) 141–157 143

8/3/2019 A Spatial Analysis of Common Property Deforestation-jennifer Alix
http://slidepdf.com/reader/full/a-spatial-analysis-of-common-property-deforestation-jennifer-alix 4/17
been calculated using digital elevation models of scale 1:250,000. Municipal data for 1990 and 2000 come from
the National Institute of Statistics and Geography (INEGI), and state-level agricultural prices from
CIMMYT’s online data base [16].
Table 1 shows summary statistics on deforestation. Although there were 324 ejidos not practicing forestry in
the sample, in order to focus on the majority rather than the outliers, 3 observations (1% of the sample) were
cut from each tail of the distribution overall deforestation, leaving us with 318 communities. The rejected
observations include communities with over 8000 ha of forest loss over the period and those with over 2500 ha
of forest increase.2 Overall increase in pasture land per community between 1994 and 2000 is 234 ha, with a
wide variance, and a substantial portion of the communities (41%) do not deforest at all, or have increased in
their forest cover over the period. The total forest coverage in the sample in 1994 is 919,959 ha, 73,848 (8%) of
which are lost in the period between 1994 and 2000. According to the 2000 Forest Inventory, around 50% of the Mexican territory is covered with forest. The overall deforestation rate in Mexico between 1994 and 2000 is
1.3% [41], which is similar to the 1.4% per ejido per year found in the sample.
In order to guide the analysis of the forces driving deforestation, survey participants were asked to report up
to two reasons why a given area of the ejido was deforested and who made the decision. Although there is
missing information in some of the ejidos with deforestation, the results are instructive. The responses clearly
show that the expansion of agriculture and pasture land are equally important as sources of forest conversion.
The felling of forest for these uses dominates the other two possibilities. Fifty percent of respondents gave
ARTICLE IN PRESS
Fig. 1. Map of survey sample.
Table 1
Summary statistics on deforestation, 1994–2000
Characteristic Mean SD
Number of ejidos 318
Increase in pasture/agricultural land, 1994–2000 (ha) 234 562
Area in pasture, 1994 (ha) 998 1701
Total ejido area (ha) 3888 5956
Percentage of ejidos with deforestation (%) 59
2The 2% trimming was tested against trimming off 5% of the total observations. Both produced coefficients within the same confidence
intervals.
J. Alix-Garcia / Journal of Environmental Economics and Management 53 (2007) 141–157 144

8/3/2019 A Spatial Analysis of Common Property Deforestation-jennifer Alix
http://slidepdf.com/reader/full/a-spatial-analysis-of-common-property-deforestation-jennifer-alix 5/17
expansion of agriculture and 51% pasture as their main reasons for conversion. Forest fires came in a distant
third with 9%, and deforestation for wood extraction is practically non-existent (4%).
Respondents also reported who made the decisions regarding forest conversion. The results are summarized
in Table 2. In the case of both agricultural and pasture expansion, the majority of respondents said that
conversion ‘‘just happened,’’ suggesting a community choice not to explicitly regulate forest management. In
the communities where expansion of the agricultural frontier ‘‘just happened,’’ there is often some sort of
formal regulation—either a limit on the allowable heads of cattle or a permission that must be granted by thecouncil president. The last row of Table 2 shows the percentage of communities where deforestation ‘‘just
happened’’ that have some explicit existing rules governing agricultural or pasture expansion—20% in the case
of former and 44% for the latter. In addition, a sizable number of communities, 32% in the case of pasture
and 48% for agriculture, also responded that permission was given by the community assembly, which implies
that it was decided by a formal vote. For those that had expansion due to both factors, 89% of the time the
same decision rule was used in both cases.
Table 2 shows a range of cooperation more complicated than the traditional prisoner’s dilemma dichotomy.
In a sizable number of cases, communities make a concerted decision to approve deforestation activities. This
process could be characterized as a high level of cooperation. Those communities where deforestation ‘‘just
happens’’ and there are no existing rules have chosen not to regulate conversion and leave this decision up to
individual farmers. In this case there is zero cooperation. In the middle, between full cooperation and noregulation, there are communities where deforestation ‘‘just happened’’ and rules have been implemented.
These facts suggest that there is a continuum of community control over activities in the commons which
ranges from a centralized planning approach to a nearly complete lack of regulation. One model that explains
this kind of partial cooperation continuum in common property deforestation can be found in Alix-Garcia
et al. [2]. McCarthy et al. [26] develop an alternative model of partial cooperation in ejido pastures. A similar
phenomenon was observed by Newbery [31] in the context of acid rain in Europe. Newbery’s insight inspired a
large literature on partial cooperation in global environmental agreements [8,9,13,34], with the basic result
being that subcoalitions of cooperators can exist even in the presence of non-cooperators. The ejidos, small
communities where social pressures can be powerful, can often have quite effective mechanisms for enforcing
cooperative agreements (see [5] for examples of these types of mechanisms in other countries). The model and
estimation strategy proposed here reflect the fact that the choice of cooperation level may be continuous,
rather than one of distinct regimes.
3. Model
The standard deforestation model is appropriate for the case where there is one landowner making a
decision over one plot. In the situation where a group of people must decide what to do over a large,
well-defined space composed of many plots, the model must be extended. The intuition for the model
discussed in this paper is as follows. It contains two jointly determined components, total deforestation level
and the spatial allocation of this decision. The decision of which hectares to deforest depends both upon their
value in agriculture/pasture (heretofore abbreviated as pasture) relative to the value of other hectares of land
in the community as well as upon the aggregate demand for pasture in the ejido. This overall demand is
determined both by the quality of the most profitable hectares of forested land and the community variables
ARTICLE IN PRESS
Table 2
Positive responses to the question: ‘‘Who decided to expand the pasture/agricultural land?’’
Decision-maker Pasture expansion (%) Agricultural expansion (%)
Community assembly 31.5 40.7
Committee decision 2.2 4.6
Just happened 65.2 54.6
Just happened and have rules 20.0 44.7
Observations 88 86
J. Alix-Garcia / Journal of Environmental Economics and Management 53 (2007) 141–157 145
8/3/2019 A Spatial Analysis of Common Property Deforestation-jennifer Alix
http://slidepdf.com/reader/full/a-spatial-analysis-of-common-property-deforestation-jennifer-alix 6/17
which affect members’ demand for new agricultural land (like secondary education and distance from
markets) and, since this paper considers common property, features that impact collective action (group size
and inequality). These relationships give a system of equations describing equilibrium deforestation for each
community.
The main insights of the model are as follows: 2 ha with exactly the same physical characteristics may have
different probabilities of deforestation for two reasons. First, their relative standing amongst all the otherforested hectares in a community is different. For example, a hectare that is 3 km away from houses may have
a very high probability of deforestation if it is the closest forested hectare available, and a very low one if there
are many hectares of land that are less than this distance from the same houses. Second, even if both hectares
have the same relative physical characteristics, one may have a higher probability of deforestation because the
overall demand for pasture in that community is higher. Similarly, two communities’ overall deforestation
demand may differ for two reasons. The characteristics of their individual members and their aggregate
community characteristics may differ, thus changing their collective choice problem, or one may have a higher
productivity in agricultural activities. Even in two communities with equivalent social characteristics,
however, the total deforestation decision may be different because the physical characteristics of their
available land are distinct.
Formally, each ejido is concerned with maximizing the revenue from converting forest land to pasture.
Revenues from deforestation depend upon the amount of land deforested, C , the amount of land in forest andin pasture in the base period, T f and T p, the prices of goods produced in the forest or pasture, pf and pp, and
assets useful in the production of forest products, X f , and pasture products, X p. Since the forested area is
common property, revenue generation is also dependent upon community characteristics, Z , which make
cooperation more difficult, such as group size or income inequality. Finally, the revenues depend upon the
relative value of the land for pasture or forest production. This is expressed as a net gain in pasture quality,
pp À pf , where pp and pf are the average quality of the land in pasture and forest production. Given this
notation, the revenue function can be written as
RðC ; T p; T f ; pp
; pf ; X p; X f
; Z ;pp À pf Þ.
Each hectare of forested land is characterized by quality q and distance d to the population center
(transactions costs). Let gðq; d Þ be the joint distribution of these two traits over the forested land. In a given
community, q ranges from qL to 1 and d from 0 to D. Quality and distance of the forested land determine an
index of quality in pasture or agricultural production ppðq; d Þ and in forest production pf ðq; d Þ. The pasture
index is more sensitive to both land quality and distance, because of the frequent travel required to oversee
animals or crops. The assumptions are: qpp
qq4
qpf
qq40 and qpp
qd o
qpf
qd o0 for all values of q and d . Let dðq; d Þ be the
proportion of a hectare of land with qualities q; d converted to pasture from the standing forest. This allows us
to write the average quality of deforested land in pasture as
pp ¼
Z d
0
Z 1
qL
dðq; d Þppðq; d Þgðq; d Þ dqdd .
A similar expression denotes the productive quality of this same land were it to have remained in forest:
pf ¼
Z d
0
Z 1
qL
dðq; d Þpf ðq; d Þgðq; d Þ dqdd .
The problem for the ejido is therefore to maximize total revenue by choosing the amount of forest to
convert into pasture, C , the proportion of each parcel of land to convert, dðq; d Þ, pp, and pf :
max RðC ; T p; T f ; pp
; pf ; X p; X f
; Z ;pp À pf Þ ð1Þ
s.t.
pp ¼ Z d
0Z
1
qL
dðq; d Þppðq; d Þgðq; d Þ dqdd , ð2Þ
ARTICLE IN PRESS
J. Alix-Garcia / Journal of Environmental Economics and Management 53 (2007) 141–157 146

8/3/2019 A Spatial Analysis of Common Property Deforestation-jennifer Alix
http://slidepdf.com/reader/full/a-spatial-analysis-of-common-property-deforestation-jennifer-alix 7/17
pf ¼
Z d
0
Z 1
qL
dðq; d Þpf ðq; d Þgðq; d Þ dqdd , ð3Þ
C
T f ¼
Z d
0
Z 1
qL
dðq; d Þgðq; d Þ dqdd ð4Þ
and
0pdðq; d Þp1. (5)
Eq. (4) simply indicates that the sum of the deforested hectares must equal the total deforestation in the
ejido. The Lagrangian of the problem is written as
L ¼ RðC ; T p; T f ; pp
; pf ; X p; X f
; Z ;pp À pf Þ þ mp
Z d
0
Z 1
qL
dðq; d Þppðq; d Þgðq; d Þ dqdd À pp
!
þ mf
Z d
0
Z 1
qL
dðq; d Þppðq; d Þgðq; d Þ dqdd À pf
!þ l
Z d
0
Z 1
qL
dðq; d Þgðq; d Þ dqdd ÀC
T f
!.
Note that L is linear in dðq; d Þ, which implies that the solutions are corner solutions: dðq; d Þ ¼ 0 or 1.Assuming interior solutions for C , pp, and pf , the first order conditions are as follows:
mpppðq; d Þ þ mf pf ðq; d Þ þ lX0 3 dðq; d Þ ¼ 1, (6)
RC ðC ; T p; T f ; pp
; pf ; X p; X f
; Z ;pp À pf Þ Àl
T f ¼ 0, (7)
RpðC ; T p; T f ; pp
; pf ; X p; X f
; Z ; pp À pf Þ ¼ mp ¼ Àmf , (8)
where Rp is the derivative of R with respect to pp À pf .
Since mp, mf , and l are all ejido level variables, the hectare by hectare choice of where to deforest (6) shows
that deforestation will proceed from the plots with the highest indicator function ppðq; d Þ À pf ðq; d Þ until the
optimal value C is reached. Hence, forested hectares are ranked by decreasing value of the differentialpotential for pasture and forest, and land with the highest relative potential for pasture will be the first to be
converted into pasture.
ppðq; d Þ À pf ðq; d ÞXÀl
mp¼ lÃ3 dðq; d Þ ¼ 1, (9)
where là is defined by: C T f ¼
R d
0
R 1qLdðq; d Þgðq; d Þ dqdd . This decision can be rewritten as
dðq; d Þ ¼ 1 3 rankðppðq; d Þ À pf ðq; d ÞÞpC
T f .
In other words, whether a hectare is deforested or not depends upon its rank in terms of relative quality for
pasture and forest, and on the optimal amount to be converted relative to the total area in forest. As the totaldemand for new pasture rises, the frontier moves towards more remote areas, possibly of lower quality. This
implies that the probability of deforestation for a given parcel depends upon its position in the distribution of
all the forested parcels in the ejido. This result is similar to Stavins and Jaffe’s [42] insight into wetland
conversion across counties in the United States. In fact, one could imagine applying a slightly modified version
of the model presented here in order to accommodate individual landholders with heterogeneous areas of
land. The prediction would still be that relatively more valuable hectares within the individual’s land area
would be cleared first.
Given this allocation decision rule, and the derived average pp, pf (from (2) and (3)), the optimal area
converted from forest to pasture, C , is given by
RC ðC ; T p; T f ; pp
; pf ; X p; X f
; Z ;pp À pf Þ
RpðC ; T p; T f ; pp; pf ; X p; X f ; Z ;pp À pf Þ
¼ lÃ. (10)
ARTICLE IN PRESS
J. Alix-Garcia / Journal of Environmental Economics and Management 53 (2007) 141–157 147

8/3/2019 A Spatial Analysis of Common Property Deforestation-jennifer Alix
http://slidepdf.com/reader/full/a-spatial-analysis-of-common-property-deforestation-jennifer-alix 8/17
Total forest conversion is thus a function of the area of land in forest and pasture, the net gain in quality of
the deforested land, community assets, prices, and community characteristics affecting the collective decision
problem. The choice of how much forest to convert to pasture depends upon the profitability of the land that
could be converted relative to its profitability in forest, where both are increasing functions of land quality and
prices, and decreasing functions of distance. Decreasing marginal returns to pasture land imply that
conversion is decreasing with the amount of already established pasture. Characteristics which increasecooperation increase the value of standing (common property) forest to the ejido, and therefore decrease forest
conversion. The effect of total forest area on overall deforestation is ambiguous and depends upon returns to
scale in the production of forest products.
This model does not allow for interactions between hectare decisions, which might occur if as clearing
increased, marginal revenues decreased due to the effect on local output markets, or, alternatively, marginal
costs increased through changes in labor or other input costs on local markets. There is no way of testing for
these effects empirically, however, the ‘‘small player’’ assumption for the ejidos seems reasonable when one
considers their size relative to the municipalities in which they reside. For example, the ratio of the average
ejido membership to the working age population (ages 15–64) in their municipality is 0.019 (SD 0.06), and the
ratio of the average deforested area between 1994 and 2000 to the total municipal area is 0.003 (SD 0.02). In
the latter case one would like to use the ratio of the deforested area to arable land in the municipality, but this
number is not available. It is certainly true that, for the ejidos in our sample that reported the number,agricultural productivity in the deforested areas is considerably lower than the averages available through the
Ministry of Agriculture (SAGARPA) in Mexico. All of these facts together suggest that the likelihood of costs
increasing due to the influence on local goods markets of the deforestation activities of particular ejido is quite
low.
Eqs. (9) and (10) illustrate the simultaneous nature of the decision of how much and where to convert forest
land into pasture. These two equations are the heart of the empirical strategy presented in the next section.
4. Empirical strategy
The equations to be estimated come directly from the model derived above. A linear specification of system
(9)–(10) can be written as follows:
dà ¼ f ðrankðpp À pf Þ; C ; T f Þ ¼ QbQ À C bC þ T f bf þ and d ¼ 1 ðdÃX0Þ, (11)
C ¼ f ðT p; T f ;pp À pf
; X p; X f ; pp
; pf ; Z ; lÃÞ ¼ ~QaQ þ T aT þ X aX þ pap þ Z aZ þ m, (12)
where Q are variables representing the rank of a given plot in terms of relative quality for pasture and forest
among forested plots, ~Q includes variables that characterize the distribution of relative quality of the land
among converted plots, p represents the vector ð pp; pf Þ, and X the vector ðX p; X f Þ.
Note that Eqs. (11) and (12) constitute a system in d and C . In (11), C is identified through any of the
variables that affect deforestation with the exception of quality— X p; X f ; pp
; pf ; Z . The hectare-level
probability of deforestation, d, determines pp À pf , which is replaced by ~Q. The exclusion variables here are
therefore those which proxy for quality—distance, slope, and altitude. We can thus proceed to the estimationof the deforestation equation (11) as one would in the general context of two-stage least squares, although in
our case (11) is a set of probits for each ejido:
1. Estimate a reduced form probit for the individual hectare conversion. This is done by substituting (12) for
C in (11) which gives the reduced form equation for hectare-level deforestation:
dà ¼ QgQ þ T gT þ X gX þ pgp þ Z gZ þ Z and d ¼ 1 ðdÃX0Þ. (13)
2. Use predicted probabilities of deforestation to compute predicted values for ~Q (in this case, substituting the
average and standard deviation of the quality variables among plots that are expected to be deforested).
3. Estimate total converted land (12).
4. Eq. (11) can then be estimated using predicted converted land.
ARTICLE IN PRESS
J. Alix-Garcia / Journal of Environmental Economics and Management 53 (2007) 141–157 148
8/3/2019 A Spatial Analysis of Common Property Deforestation-jennifer Alix
http://slidepdf.com/reader/full/a-spatial-analysis-of-common-property-deforestation-jennifer-alix 9/17
Steps 1, 3, and 4, with adjustment of the standard errors, are an efficient way of estimating a probit with a
continuous endogenous variable [25,48]. The entire process is bootstrapped to account for the inclusion of
predicted values into the main equations. In estimations of this type, it is quite reasonable to worry about
spatial correlation of the error terms between neighboring hectares of forest. In a standard regression model,
this correlation does not bias the coefficient estimates but does create inefficiency. The standard solution to
this problem involves a weighting matrix whose entries reflect some estimate of the covariance betweenneighbors (see [17] for a good example of this). In a probit model spatial correlation does bias the point
estimates of the coefficients in much the same way as heteroskedasticity does [4]. Although currently searching
for a way to correct the potential bias introduced by this autocorrelation, existing techniques have not proved
readily implementable in a data set the size of the one used in this study (for a discussion of spatial
autocorrelation in the probit, tests, and estimation strategies, see [37]). In order to assess the severity of this
problem, I present results from some diagnostic tests on the residuals from the model, and compare a linear
probability model’s coefficient estimates to that of the marginal effects of the probit.
5. Results
The traditional deforestation model suggests that slope, altitude, and distance from housing affect the
probability of deforestation in the same way regardless of the slope, distance, and quality of neighboringhectares. The model presented here points out that the value of these features relative to the qualities of other
potentially deforestable parcels is also important, holding constant overall demand for deforestation, which
depends upon the average values of available parcels in the ejido.
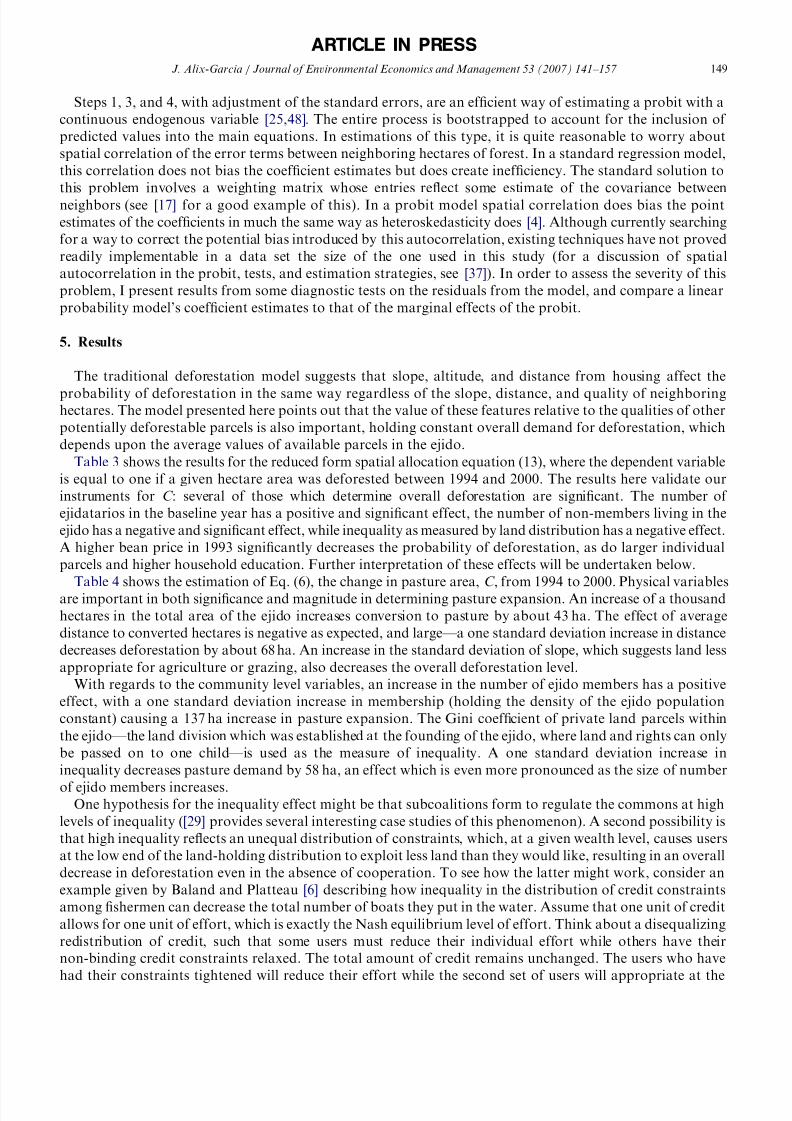
Table 3 shows the results for the reduced form spatial allocation equation (13), where the dependent variable
is equal to one if a given hectare area was deforested between 1994 and 2000. The results here validate our
instruments for C : several of those which determine overall deforestation are significant. The number of
ejidatarios in the baseline year has a positive and significant effect, the number of non-members living in the
ejido has a negative and significant effect, while inequality as measured by land distribution has a negative effect.
A higher bean price in 1993 significantly decreases the probability of deforestation, as do larger individual
parcels and higher household education. Further interpretation of these effects will be undertaken below.
Table 4 shows the estimation of Eq. (6), the change in pasture area, C , from 1994 to 2000. Physical variablesare important in both significance and magnitude in determining pasture expansion. An increase of a thousand
hectares in the total area of the ejido increases conversion to pasture by about 43 ha. The effect of average
distance to converted hectares is negative as expected, and large—a one standard deviation increase in distance
decreases deforestation by about 68 ha. An increase in the standard deviation of slope, which suggests land less
appropriate for agriculture or grazing, also decreases the overall deforestation level.
With regards to the community level variables, an increase in the number of ejido members has a positive
effect, with a one standard deviation increase in membership (holding the density of the ejido population
constant) causing a 137 ha increase in pasture expansion. The Gini coefficient of private land parcels within
the ejido—the land division which was established at the founding of the ejido, where land and rights can only
be passed on to one child—is used as the measure of inequality. A one standard deviation increase in
inequality decreases pasture demand by 58 ha, an effect which is even more pronounced as the size of number
of ejido members increases.
One hypothesis for the inequality effect might be that subcoalitions form to regulate the commons at high
levels of inequality ([29] provides several interesting case studies of this phenomenon). A second possibility is
that high inequality reflects an unequal distribution of constraints, which, at a given wealth level, causes users
at the low end of the land-holding distribution to exploit less land than they would like, resulting in an overall
decrease in deforestation even in the absence of cooperation. To see how the latter might work, consider an
example given by Baland and Platteau [6] describing how inequality in the distribution of credit constraints
among fishermen can decrease the total number of boats they put in the water. Assume that one unit of credit
allows for one unit of effort, which is exactly the Nash equilibrium level of effort. Think about a disequalizing
redistribution of credit, such that some users must reduce their individual effort while others have their
non-binding credit constraints relaxed. The total amount of credit remains unchanged. The users who have
had their constraints tightened will reduce their effort while the second set of users will appropriate at the
ARTICLE IN PRESS
J. Alix-Garcia / Journal of Environmental Economics and Management 53 (2007) 141–157 149

8/3/2019 A Spatial Analysis of Common Property Deforestation-jennifer Alix
http://slidepdf.com/reader/full/a-spatial-analysis-of-common-property-deforestation-jennifer-alix 10/17
same Nash equilibrium level. The total amount of exploitation thus decreases, even in the absence of
cooperation. Since ejido land cannot be collateralized, the constraint in our case is not credit. The dynamic
may operate through the fact that those with smaller private parcels have lower income, which results in less
investment in cattle.
ARTICLE IN PRESS
Table 3
Reduced form of spatial deforestation decision
Characteristic Variable Marginal effect
Pixel distance rank (/10,000) d À0.03
(0.02)
Pixel slope rank (/10,000) q À0.06
ðÀ0:02ÞÃÃÃ
Pixel altitude rank (/10,000) À0.04
(0.03)
Distance à slope rank (/1,000,000) 0.0004
ð0:0001ÞÃÃÃ
Distance à altitude rank (/1,000,000) 0.0001
(0.0001)
Parcels with lower slope and distance (/10,000) À0.01
ð0:03ÞÃÃÃ
Total ejido area (1000sha) T À0.002
(0.001)
Agricultural/pasture land, 1994 T p À0.003
(0.02)Average private parcel X À0.0006
ð0:0003ÞÃÃ
Proportion of households with secondary education À0.06
ð0:03ÞÃÃ
Number of ejidatarios, 1990 Z 0.00005
ð0:00003ÞÃ
Number of non-members, 1990 À0.00002
ð8:0 Â 10À6ÞÃÃ
Gini coefficient of private parcels À0.09
ð0:04ÞÃÃÃ
Municipal marginality index, 1990 À0.001
(0.008)
Chile price, 1993 (1000s) pp À0.001
(0.001)Bean price, 1993 (1000s) À0.04
ð0:02ÞÃÃ
Growth in bean prices, 1993–2000 À0.02
(0.08)
Southern region 0.07
ð0:04ÞÃÃ
Gulf region 0.11
ð0:08ÞÃ
Pacific region 0.09
ð0:06ÞÃ
Observations 931,812
Pseudo R-squared 0.14
Log-likelihood À292,636
Dependent variable ¼ 1 if pixel deforested between 1994 and 2000.
This regression also includes the proportion of overall forest in secondary vegetation, hours to nearest town, number of ejidatarios per
ejido hectare, marginality index growth, 1990–2000, municipal population growth, the number of ejidatarios  Gini, dummy variables for
the Yucatan, Northwest, and Northeast regions, none of which were significant. The comparison region is Central Mexico. Also included
are the average distance to forested area, average slope of forested area, and average altitude of forested area. Ã;ÃÃ
;ÃÃÃ represent significance
at the 10%, 5% and 1% levels.
J. Alix-Garcia / Journal of Environmental Economics and Management 53 (2007) 141–157 150

8/3/2019 A Spatial Analysis of Common Property Deforestation-jennifer Alix
http://slidepdf.com/reader/full/a-spatial-analysis-of-common-property-deforestation-jennifer-alix 11/17
It is important to note that the effect of inequality on deforestation is significant even holding constant the
distribution of the initial level of poverty across municipalities (represented by the 1990 marginality index) as
well as economic growth (represented by the change in the index from 1990 to 2000). A higher initial poverty
level is associated with lower deforestation, an outcome which might result from the fact that poorer
communities have more constraints to converting forest land to pasture. A final community variable of
interest is the proportion of households with secondary education, which has a negative and significant effect.
This negative sign is the opposite of what one might expect if education increased productivity in agricultural
ARTICLE IN PRESS
Table 4
OLS Estimation of Eq. (12)—overall pasture demand
Characteristic Variable Coefficient Mean
Total ejido area T 42.9 3.9
ð11; 75ÞÃÃ (5.9)
Total agricultural/pasture land, 1994 (1000s ha) T p À71.9 1.0
ðÀ16:3; À1:2ÞÃà (1.7)
Mean distance to pixels with predicted deforestation hcðÁÞ; gcðÁÞ À17.9 8.3
ðÀ28:7; À3:4ÞÃà (3.8)
Mean slope of pixels with predicted deforestation À7.6 9.3
ðÀ21; 11Þ (6.4)
Mean altitude of pixels with predicted deforestation 57.9 0.75
ðÀ32; 146Þ (0.85)
Standard deviation of distance 17.4 1.3
ðÀ23; 61Þ
Standard deviation of slope À27.6 5.9
ðÀ60; À7ÞÃÃ
Standard deviation of altitude À180.2 0.09
ðÀ1125; 608ÞHours to pueblo by bus X À1.13 1.1
ðÀ72; 7Þ (1.0)
Average private parcel size À1.42 12.6
ðÀ3:4; 2:7Þ (23.3)
Proportion of households with secondary education À189.4 0.53
ðÀ326; À27ÞÃà (0.26)
Marginality index, 1990 À62.9 À0.13
ðÀ114; À5ÞÃà (0.93)
Number of ejidatarios, 1990 Z 0.50 153
ð0:08; 90ÞÃÃ (275)
Gini coefficient of parcels À323.2 0.25
ðÀ535; À72ÞÃà (0.18)
Ejidatarios à Gini À0.92 41.8
ðÀ2:3; À0:02ÞÃà (101.3)Number of non-members, 1990 À0.07 143.5
ðÀ0:13; 0:03Þ (633)
State-level bean prices, 1993 pp À0 .18 2476
ðÀ0:29; À0:06ÞÃà (541.5)
Yucatan region 557.5 0.10
ð103; 885ÞÃÃ
Southern region 224.3 0.29
ð58; 348ÞÃÃ
Observations 318
Adjusted R-squared 0.23
Dependent variable ¼ hectares in ejido deforested between 1994 and 2000.
Confidence intervals are computed by bootstrapping 1000 times. ÃÃ indicates significance at the 5% level. These are partial results. The
estimation also includes the interaction of slope and distance, the interaction of altitude and distance, the proportion of forested land in
secondary forest in 1994, ejido hectares per ejidatario, municipal level population growth, change in the municipal marginality index, chile
prices (1993), the growth in bean prices (1993–2000), and a constant, none of which are significant. There are also six regional dummy
variables of which the two significant ones are shown.
J. Alix-Garcia / Journal of Environmental Economics and Management 53 (2007) 141–157 151

8/3/2019 A Spatial Analysis of Common Property Deforestation-jennifer Alix
http://slidepdf.com/reader/full/a-spatial-analysis-of-common-property-deforestation-jennifer-alix 12/17
activities; however, it is likely the case that this measure of average education in the community reflects a
decrease in the need for deforestation as a result of outside working opportunities. Although these community
effects are not nearly as large in magnitude as the effects of the physical variables, compared to the mean
deforestation level of 234 ha, their impact is substantial.
Two of the regional dummy variables, the Yucatan Peninsula and Southern Mexico, showed positive and
significant effects on overall deforestation. These positive effects may come from a variety of sources,including variation in the quality of state and regional forestry offices and the illegal extraction of expensive
tropical hardwoods from the Southern ecosystems. The positive coefficient for Southern Mexico might also
reflect some of the insecurity in land tenure in the states of Chiapas and Oaxaca, where land conflicts are quite
common. This would be similar to the findings of Deacon [22], although the same argument cannot be made
for the Yucatan, where land tenure is generally well defined.
Finally, one might wonder, given the different categories of decision-makers detailed in Table 2, if all these
communities truly belong to the same estimation. In particular, those communities who claimed no regulation
of activities in the commons (i.e., those without rules and for whom deforestation ‘‘just happened’’) might
reasonably be thought to be operating under a different decision-making regime. Therefore, I estimated the
system of equations without these observations; the results are shown in Table 5. Though the point estimates
vary slightly, none of them is significantly different from those in Table 4.
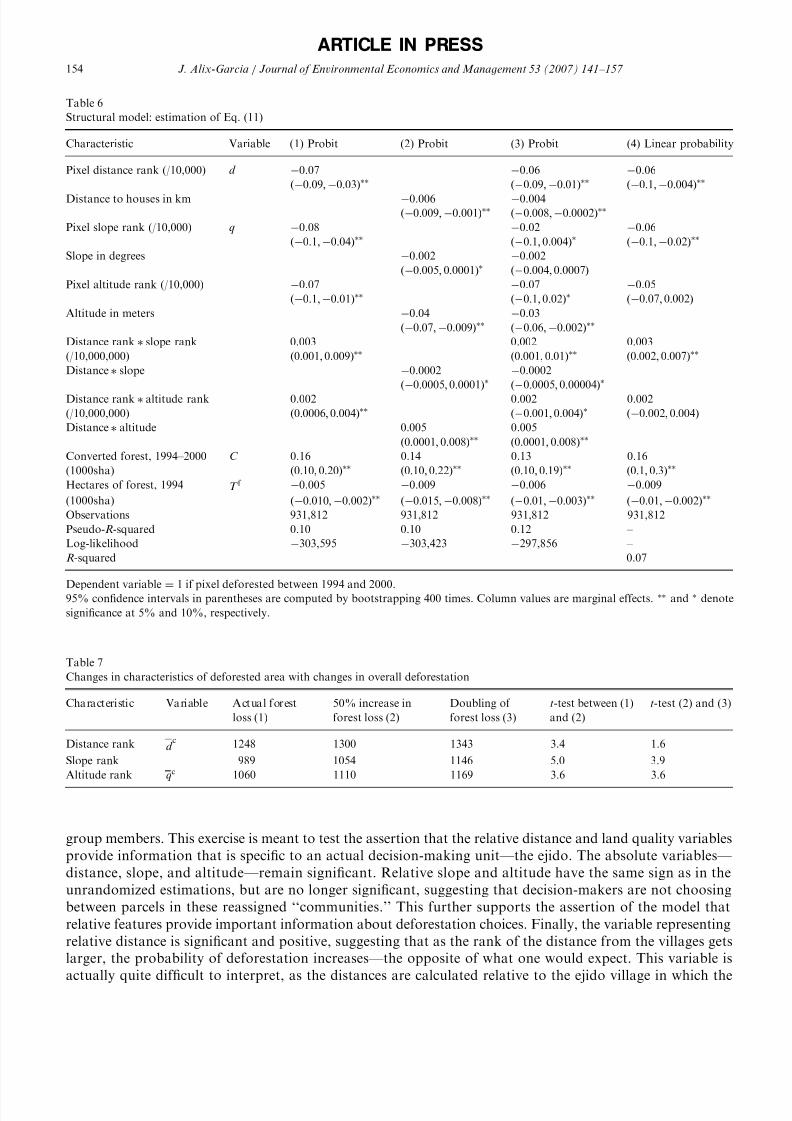
Table 6 gives the results from the structural equation (11). The first column shows the marginal effects fromthe structural probit, the second column results from using the traditional deforestation regressors, and the
third column combines both the relative measures of slope, distance, and altitude with their absolute values.
Column (4) shows the OLS linear probability model estimates for the equation in column (1). The purpose of
this final column is to assess the degree of bias introduced to the probit by the spatial autocorrelation of the
error terms. Under the standard OLS assumptions, spatial autocorrelation in the error results in unbiased, but
inefficient coefficient estimates [4]. A Lagrange multiplier test against a spatial error model gives a value of
368, and an associated p-value of essentially zero, which clearly indicates spatial correlation of the error terms.
Comparing the point estimates from Eqs. (1) and (4) gives us some sense of the size of the bias introduced into
the probit equation. All coefficient estimates are very similar, suggesting that bias should not be a concern in
this case.
The coefficients have the expected signs—the probability of deforestation decreases in the rank (column (1))and the absolute value (column (2)) of distance, slope, and altitude. The effects are small even for large
changes, with a one standard deviation increase in rank of distance decreasing the probability of deforestation
by 0.04 and similar change in the slope rank decreasing the probability by 0.06. We also see that holding
constant the total forest area, demand for conversion C increases the probability that any one forested hectare
will be converted. A one standard deviation increase in C corresponds to an increase in the probability of
deforestation of 0.11, which is nearly twice the impact of the changes in hectare-level characteristics.
Eqs. (1) and (2) have similar explanatory power—the pseudo-R-squared values are identical and the
log-likelihood measures very similar, which begs the question of whether or not the rank of the values
measures anything distinct from the absolute values. Column (3) answers this question in the affirmative.
Including both the relative and the absolute values in the estimation increases the explanatory power
significantly—the pseudo-R-squared goes up by 20%. In addition, the point estimates of the relative regressors
remain unchanged—with the exception of relative slope which decreases. In the presence of the variable
measure relative distance, the measure of distance to the village loses significance. The slope rank becomes less
significant and slightly smaller, while slope becomes insignificant, probably reflecting the high correlation
between the two variables (Pearson’s correlation coefficient ¼ 0:45). The altitude measures and the interaction
terms, both relative and absolute, remain significant and of the same magnitude. All this evidence together
support the hypothesis that the decision across space does indeed depend upon the characteristics of a hectare
of land relative to the characteristics of other pieces of land amongst which decision-makers are choosing.
Table 7 shows how increases in the predicted amount of deforestation changes the rank characteristics of
the area deforested. Column (1) reports the average distance, slope, and altitude rank of the deforested pixels
given the initial level of deforestation. The following two columns show average ranks given simulated
increases in overall forest loss of 50% and 100%. The differences here are large and significant, indicating that
as deforestation increases it progresses to more remote areas of higher slope and altitude.
ARTICLE IN PRESS
J. Alix-Garcia / Journal of Environmental Economics and Management 53 (2007) 141–157 152

8/3/2019 A Spatial Analysis of Common Property Deforestation-jennifer Alix
http://slidepdf.com/reader/full/a-spatial-analysis-of-common-property-deforestation-jennifer-alix 13/17
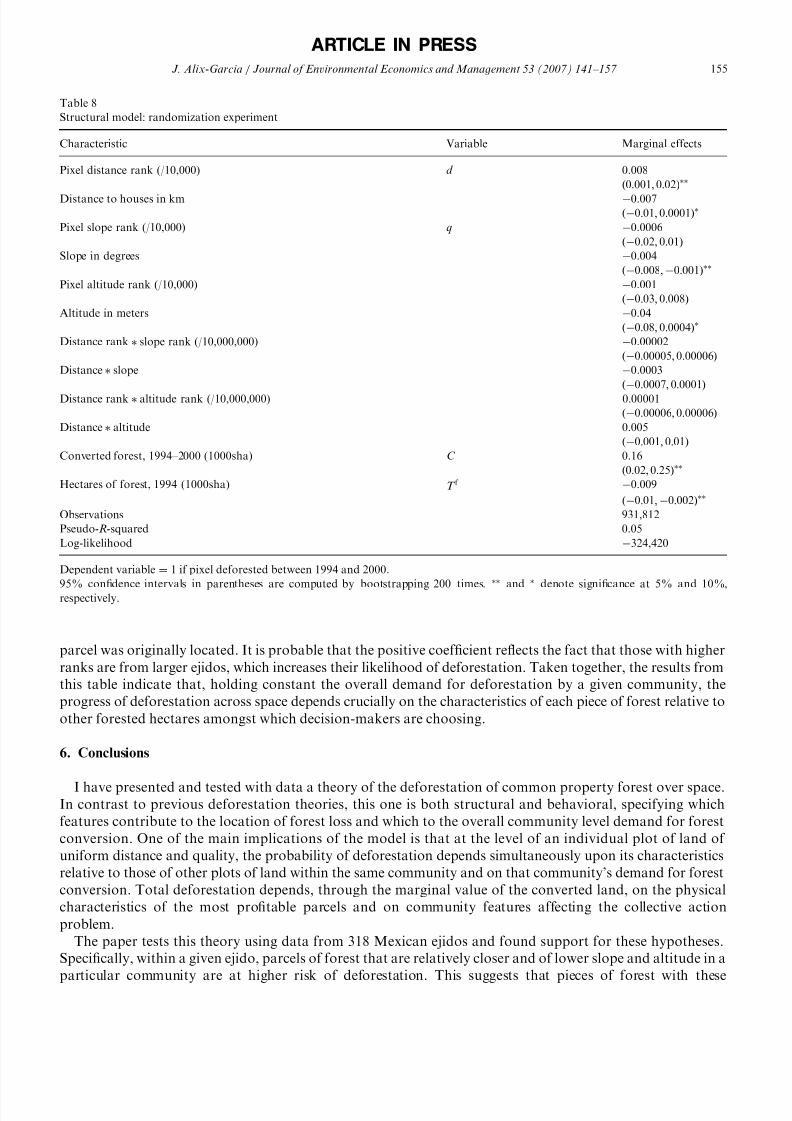
Final evidence of the additional explanatory power of relative characteristics is given in Table 8, which
presents an experiment.3 In this experiment individual hectares of land are randomly assigned to new groups,
which changes the values of the rank variables but not the measured values of slope, distance, and altitude of
each hectare. Within these new groups, each parcel receives the average values of C and T f across the new
ARTICLE IN PRESS
Table 5
OLS Estimation of Eq. (12)—overall pasture demand, restricted samplea
Characteristic Variable Coefficient Mean
Total ejido area T 52.1 3.7
ð12:3; 81:2ÞÃÃ (5.8)
Total agricultural/pasture land, 1994 (1000s ha) T p À91.3 1.0
ðÀ181:5; À20:4ÞÃà (1.7)
Mean distance to pixels with predicted deforestation hcðÁÞ; gcðÁÞ À18.7 8.1
ðÀ30:3; À3:1ÞÃà (3.9)
Mean slope of pixels with predicted deforestation À7.5 7.8
ðÀ24; 10Þ (5.0)
Mean altitude of pixels with predicted deforestation 50.7 0.76
ðÀ52:2; 145:5Þ (0.86)
Standard deviation of distance 9.8 1.3
ðÀ35:9; 57:6Þ
Standard deviation of slope À31.3 5.9
ðÀ59:0; À11:3ÞÃÃ
Standard deviation of altitude À42.1 0.10
ðÀ1117:7; 186:0ÞHours to pueblo by bus X À33.6 1.0
ðÀ75:5; 9:8Þ (1.1)
Average private parcel size À1.9 12.2
ðÀ4:4; 3:8Þ (23.5)
Proportion of households with secondary education À223.7 0.54
ðÀ374:5; À48:0ÞÃà (0.26)
Marginality index, 1990 À70.3 À0.11
ðÀ134:0; À9:3ÞÃà (0.92)
Number of ejidatarios, 1990 Z 0.43 157
ð0:02; 0:80ÞÃÃ (283)
Gini coefficient of parcels À342.0 0.25
ðÀ583:7; À16:8ÞÃà (0.18)
Ejidatarios à Gini À0.86 42.5
ðÀ2:3; 0:25Þà (104.2)Number of non-members, 1990 À0.07 149.2
ðÀ0:13; 0:04Þ (652)
State-level bean prices, 1993 pp À0.16 2465
ðÀ0:29; À0:02ÞÃà (534.5)
Yucatan region 561.0 0.09
ð6:1; 903:6ÞÃÃ
Southern region 227.9 0.29
ð52:1; 361:1ÞÃÃ
Observations 293
Adjusted R-squared 0.24
Dependent variable ¼ hectares in ejido deforested between 1994 and 2000.aRemoved from the sample are those communities that responded that deforestation ‘‘just happens’’ and have no rules governing use of
the commons. Confidence intervals are computed by bootstrapping 800 times. ÃÃ indicates significance at the 5% level, Ã at the 10% level.
These are partial results. The estimation also includes the interaction of slope and distance, the interaction of altitude and distance, the
proportion of forested land in secondary forest in 1994, ejido hectares per ejidatario, municipal level population growth, change in the
municipal marginality index, chile prices (1993), the growth in bean prices (1993–2000), and a constant, none of which are significant.
There are also six regional dummy variables of which the two significant ones are shown.
3I would like to thank Alexander Pfaff for suggesting this experiment.
J. Alix-Garcia / Journal of Environmental Economics and Management 53 (2007) 141–157 153
8/3/2019 A Spatial Analysis of Common Property Deforestation-jennifer Alix
http://slidepdf.com/reader/full/a-spatial-analysis-of-common-property-deforestation-jennifer-alix 14/17
group members. This exercise is meant to test the assertion that the relative distance and land quality variables
provide information that is specific to an actual decision-making unit—the ejido. The absolute variables—
distance, slope, and altitude—remain significant. Relative slope and altitude have the same sign as in the
unrandomized estimations, but are no longer significant, suggesting that decision-makers are not choosing
between parcels in these reassigned ‘‘communities.’’ This further supports the assertion of the model that
relative features provide important information about deforestation choices. Finally, the variable representing
relative distance is significant and positive, suggesting that as the rank of the distance from the villages gets
larger, the probability of deforestation increases—the opposite of what one would expect. This variable is
actually quite difficult to interpret, as the distances are calculated relative to the ejido village in which the
ARTICLE IN PRESS
Table 7
Changes in characteristics of deforested area with changes in overall deforestation
Characteristic Variable Actual forest
loss (1)
50% increase in
forest loss (2)
Doubling of
forest loss (3)
t-test between (1)
and (2)
t-test (2) and (3)
Distance rank d c 1248 1300 1343 3.4 1.6
Slope rank 989 1054 1146 5.0 3.9
Altitude rank qc
1060 1110 1169 3.6 3.6
Table 6
Structural model: estimation of Eq. (11)
Characteristic Variable (1) Probit (2) Probit (3) Probit (4) Linear probability
Pixel distance rank (/10,000) d À0.07 À0.06 À0.06
ðÀ0:09; À0:03ÞÃà ðÀ0:09; À0:01ÞÃà ðÀ0:1; À0:004ÞÃÃ
Distance to houses in km À0.006 À0.004
ðÀ0:009; À0:001ÞÃà ðÀ0:008; À0:0002ÞÃÃ
Pixel slope rank (/10,000) q À0.08 À0.02 À0.06
ðÀ0:1; À0:04ÞÃà ðÀ0:1; 0:004Þà ðÀ0:1; À0:02ÞÃÃ
Slope in degrees À0.002 À0.002
ðÀ0:005; 0:0001Þà ðÀ0:004; 0:0007Þ
Pixel altitude rank (/10,000) À0.07 À0.07 À0.05
ðÀ0:1; À0:01ÞÃà ðÀ0:1; 0:02Þà ðÀ0:07; 0:002Þ
Altitude in meters À0.04 À0.03
ðÀ0:07; À0:009ÞÃà ðÀ0:06; À0:002ÞÃÃ
Distance rank à slope rank 0.003 0.002 0.003
(/10,000,000) ð0:001; 0:009ÞÃÃ ð0:001; 0:01ÞÃÃ ð0:002; 0:007ÞÃÃ
Distance à slope À0.0002 À0.0002
ðÀ0:0005; 0:0001Þ
Ã
ðÀ0:0005; 0:00004Þ
Ã
Distance rank à altitude rank 0.002 0.002 0.002
(/10,000,000) ð0:0006; 0:004ÞÃà ðÀ0:001; 0:004Þà ðÀ0:002; 0:004Þ
Distance à altitude 0.005 0.005
ð0:0001; 0:008ÞÃÃ ð0:0001; 0:008ÞÃÃ
Converted forest, 1994–2000 C 0.16 0.14 0.13 0.16
(1000sha) ð0:10; 0:20ÞÃÃ ð0:10; 0:22ÞÃÃ ð0:10; 0:19ÞÃÃ ð0:1; 0:3ÞÃÃ
Hectares of forest, 1994 T f À0.005 À0.009 À0.006 À0.009
(1000sha) ðÀ0:010; À0:002ÞÃà ðÀ0:015; À0:008ÞÃà ðÀ0:01; À0:003ÞÃà ðÀ0:01; À0:002ÞÃÃ
Observations 931,812 931,812 931,812 931,812
Pseudo-R-squared 0.10 0.10 0.12 –
Log-likelihood À303,595 À303,423 À297,856 –
R-squared 0.07
Dependent variable ¼ 1 if pixel deforested between 1994 and 2000.95% confidence intervals in parentheses are computed by bootstrapping 400 times. Column values are marginal effects. Ãà and à denote
significance at 5% and 10%, respectively.
J. Alix-Garcia / Journal of Environmental Economics and Management 53 (2007) 141–157 154
8/3/2019 A Spatial Analysis of Common Property Deforestation-jennifer Alix
http://slidepdf.com/reader/full/a-spatial-analysis-of-common-property-deforestation-jennifer-alix 15/17
parcel was originally located. It is probable that the positive coefficient reflects the fact that those with higher
ranks are from larger ejidos, which increases their likelihood of deforestation. Taken together, the results from
this table indicate that, holding constant the overall demand for deforestation by a given community, the
progress of deforestation across space depends crucially on the characteristics of each piece of forest relative to
other forested hectares amongst which decision-makers are choosing.
6. Conclusions
I have presented and tested with data a theory of the deforestation of common property forest over space.
In contrast to previous deforestation theories, this one is both structural and behavioral, specifying which
features contribute to the location of forest loss and which to the overall community level demand for forest
conversion. One of the main implications of the model is that at the level of an individual plot of land of
uniform distance and quality, the probability of deforestation depends simultaneously upon its characteristics
relative to those of other plots of land within the same community and on that community’s demand for forest
conversion. Total deforestation depends, through the marginal value of the converted land, on the physical
characteristics of the most profitable parcels and on community features affecting the collective action
problem.
The paper tests this theory using data from 318 Mexican ejidos and found support for these hypotheses.
Specifically, within a given ejido, parcels of forest that are relatively closer and of lower slope and altitude in a
particular community are at higher risk of deforestation. This suggests that pieces of forest with these
ARTICLE IN PRESS
Table 8
Structural model: randomization experiment
Characteristic Variable Marginal effects
Pixel distance rank (/10,000) d 0.008
ð0:001; 0:02ÞÃÃ
Distance to houses in km À0.007
ðÀ0:01; 0:0001ÞÃ
Pixel slope rank (/10,000) q À0.0006
ðÀ0:02; 0:01Þ
Slope in degrees À0.004
ðÀ0:008; À0:001ÞÃÃ
Pixel altitude rank (/10,000) À0.001
ðÀ0:03; 0:008Þ
Altitude in meters À0.04
ðÀ0:08; 0:0004ÞÃ
Distance rank à slope rank (/10,000,000) À0.00002
ðÀ0:00005; 0:00006Þ
Distance à slope À0.0003
ðÀ0:0007; 0:0001ÞDistance rank à altitude rank (/10,000,000) 0.00001
ðÀ0:00006; 0:00006Þ
Distance à altitude 0.005
ðÀ0:001; 0:01Þ
Converted forest, 1994–2000 (1000sha) C 0.16
ð0:02; 0:25ÞÃÃ
Hectares of forest, 1994 (1000sha) T f À0.009
ðÀ0:01; À0:002ÞÃÃ
Observations 931,812
Pseudo-R-squared 0.05
Log-likelihood À324,420
Dependent variable ¼ 1 if pixel deforested between 1994 and 2000.
95% confidence intervals in parentheses are computed by bootstrapping 200 times. Ãà and à denote significance at 5% and 10%,respectively.
J. Alix-Garcia / Journal of Environmental Economics and Management 53 (2007) 141–157 155
8/3/2019 A Spatial Analysis of Common Property Deforestation-jennifer Alix
http://slidepdf.com/reader/full/a-spatial-analysis-of-common-property-deforestation-jennifer-alix 16/17
characteristics should be targeted within ejidos by conservation projects. Similarly, at an aggregate level, ejidos
with forest of lower average slope and closer to villages should also be targeted.
With regards to community variables, the data provides the encouraging result that more secondary education
has a negative effect on overall forest conversion, providing further justification for the types of educational
subsidy programs already in place in Mexico. A larger member population is associated with higher
deforestation, which is consistent with the idea that cooperation is more difficult in larger groups. Inequality, asmeasured by the distribution of private parcels that are given to members at the founding of the ejido, also has
an important negative effect on overall increases in pasture area. The results also show that this effect is even
stronger when the membership of the ejido is larger. The policy implications of these final results provide further
guidance for targeting. However, understanding the dynamics behind the group size and inequality effects
constitutes a topic for future research, as it is likely to result in additional important policy insights.
References
[1] J. Alix-Garcia, A. de Janvry, E. Sadoulet, Payments for environmental services: to whom, for what, and how much?, Working Paper,
Department of Agricultural and Resource Economics, University of California, Berkeley, 2004.
[2] J. Alix-Garcia, A. de Janvry, E. Sadoulet, A tale of two communities: explaining deforestation in Mexico, World Devel. 33 (2) (2005)
219–235.[3] J.C. Allen, D.F. Barnes, The causes of deforestation in developing countries, Ann. Assoc. Amer. Geographers 75 (1985) 163–184.
[4] L. Anselin, Spatial econometrics, Working Paper, Bruton Center, School of Social Sciences, University of Texas at Dallas, 1999.
[5] J.-M. Baland, J.-P. Platteau, Halting Degradation of Natural Resources: Is There a Role for Rural Communities?, Oxford University
Press, Oxford, 1996.
[6] J.-M. Baland, J.-P. Platteau, Wealth inequality and efficiency in the commons. Part I: the unregulated case, Oxford Econ. Pap. 49 (4)
(1997) 451–482.
[7] E. Barbier, The economics of tropical deforestation and land use: an introduction to the special issue, Land Econ. 77 (2) (2001)
155–171.
[8] S. Barrett, On the nature and significance of international environmental agreements, Mimeo, London Business School, 1989.
[9] S. Barrett, Self-enforcing international environmental agreements, in: A. Batabyal (Ed.), The Economics of International
Environmental Agreements, Ashgate Press, Aldershot, 2000.
[10] M. Boscolo, J.R. Vincent, Promoting better logging practices in tropical forests, The World Bank, Policy Research Working Paper
Series: 1971, 1998.
[11] M. Boscolo, J.R. Vincent, Promoting better logging practices in tropical forests: a simulation analysis of alternative regulations, Land
Econ. 76 (2000).
[12] J.-C. Cardenas, Real wealth and experimental cooperation: experiments in the field lab, J. Devel. Econ. 70 (2003) 263–289.
[13] C. Carraro, D. Siniscalco, Strategies for the international protection of the environment, in: A. Batabyal (Ed.), The Economics of
International Environmental Agreements, Ashgate Press, Aldershot, 2000.
[14] K. Chomitz, D. Gray, Roads, land use and deforestation: a spatial model applied to Belize, World Bank Econ. Rev. 10 (1996)
487–512.
[15] K. Chomitz, T. Thomas, Determinants of land use in Amazonia: a fine scale spatial analysis, Amer. J. Agr. Econ. 85 (4) (2003)
1016–1028.
[16] CIMMYT, Centro Internacional de Mejoramiento de Maiz y Trigo, State level database, 2005. hhttp://economics.cimmyt.org/
StateLevel/index.htmi.
[17] T. Conley, GMM estimation with cross sectional dependence, J. Econometrics 92 (1999) 1–45.
[18] C. Costello, S. Polasky, Dynamic reserve site selection, Resource Energy Econ. 26 (2004).
[19] M. Cropper, C. Griffiths, The interaction of population growth and environmental quality, Amer. Econ. Rev. 84 (1994) 250–254.[20] J. Dayton-Johnson, Determinants of collective action on the local commons: a model with evidence from Mexico, J. Devel. Econ. 62
(2000) 181–208.
[21] R. Deacon, Deforestation and the rule of law in a cross-section of countries, Land Econ. 70 (1994).
[22] R. Deacon, Deforestation and ownership: evidence from historical accounts and contemporary data, Land Econ. 75 (1999).
[23] K. Deininger, B. Minten, Poverty, policies, and deforestation: the case of Mexico, Econ. Devel. Cult. Change 47 (2) (1999) 313–325.
[24] R. Godoy, M. Contreras, A comparative study of education and tropical deforestation among lowland Bolivian Amerindians: forest
values, environmental externality, and school subsidies, Econ. Devel. Cult. Change 49 (3) (2001) 555–574.
[25] G. Maddala, Limited-Dependent and Qualitative Variables in Econometrics, Econometric Society Monographs, Cambridge
University Press, Cambridge, 1983.
[26] N. McCarthy, A. de Janvry, E. Sadoulet, Common pool resource appropriation under costly cooperation, J. Environ. Econ. Manage.
42 (3) (2001) 297–309.
[27] A. Molnar, S. Scherr, A. Khare, Who Conserves the World’s Forests?, Forest Trends, 2004.
[28] D. Monroe, J. Southworth, C. Tucker, The dynamics of land-cover change in Western Honduras: exploring spatial and temporal
complexity, Agr. Econ. 27 (2002) 355–369.
ARTICLE IN PRESS
J. Alix-Garcia / Journal of Environmental Economics and Management 53 (2007) 141–157 156
8/3/2019 A Spatial Analysis of Common Property Deforestation-jennifer Alix
http://slidepdf.com/reader/full/a-spatial-analysis-of-common-property-deforestation-jennifer-alix 17/17
[29] C. Munoz-Pina, Structural reforms and the individual appropriation of the commons in the Mexican ejido, Ph.D. Dissertation,
Department of Agricultural and Resource Economics, University of California, Berkeley, 2001.
[30] G.C. Nelson, D. Hellerstein, Do roads cause deforestation? Using satellite images in econometric analysis of land use, Amer. J. Agr.
Econ. 79 (1997) 80–88.
[31] D. Newbery, Acid Rain, Econ. Pol. (1990) 297–346.
[32] M. Olson, The Logic of Collective Action: Public Goods and the Theory of Groups, Harvard University Press, Cambridge,
MA, 1965.[33] T. Panayotou, S. Sungsuwan, An econometric analysis of the causes of tropical deforestation: the case of Northeast Thailand, in:
K. Brown, D. Pearce (Eds.), The Causes of Tropical Deforestation, UBC Press, Vancouver, 1994, pp. 192–216.
[34] E. Petrakis, A. Xepapadeas, Environmental consciousness and moral hazard in international agreements to protect the environment,
in: A. Batabyal (Ed.), The Economics of International Environmental Agreements, Ashgate Press, Aldershot, 2000.
[35] A. Pfaff, What drives deforestation in the Brazilian Amazon?, J. Environ. Econ. Manage. 37 (1999) 26–43.
[36] A. Pfaff, A. Sanchez-Azofeifa, Deforestation pressure and biological reserve planning: a conceptual approach and an illustrative
application for Costa Rica, Resource Energy Econ. 26 (2004) 237–254.
[37] J. Pinkse, M. Slade, Contracting in space: an application of spatial statistics to discrete choice models, J. Econometrics 85 (1998)
125–154.
[38] M.C.J. Puri, C. Griffiths, Predicting the location of deforestation: the role of roads and protected areas in North Thailand, Land
Econ. 77 (2) (2001) 172–186.
[39] J.A. Robalino, A. Pfaff, Spatial interaction in forest clearing: deforestation and fragmentation in Costa Rica, Working Paper, 2004.
[40] T. Rudel, Population, development and tropical deforestation: a cross-national study, in: K. Brown, D. Pearce (Eds.), The Causes of
Tropical Deforestation, UBC Press, Vancouver, 1994, pp. 96–105.[41] G. Segura, Mexico’s forest sector and policies: a general perspective, Presented at Constituting the Commons: Crafting Sustainable
Commons in the New Millennium, The Eighth Conference of the International Association for the Study of Common Property,
Bloomington, IN, USA, May 2000.
[42] R. Stavins, A. Jaffe, Unintended impacts of public investments on private decisions: the depletion of forested wetlands, Amer. Econ.
Rev. 80 (3) (1990) 337–351.
[43] C. Vance, J. Geoghegan, Temporal and spatial modeling of tropical deforestation: a survival analysis linking satellite and household
survey data, Agr. Econ. 27 (2002) 317–332.
[44] A. Velasquez, J.F. Mas, J.L. Palacio, Ana ´ lisis del Cambio de Uso del Suelo, Convenio INE-IGg (UNAM), 2002.
[45] J.R. Vincent, Rent capture and the feasibility of tropical forest management, Land Econ. 66 (1990) 212.
[46] J.R. Vincent, The tropical timber trade and sustainable development, in: K. Brown, D. Pearce (Eds.), The Causes of Tropical
Deforestation, UBC Press, Vancouver, 1994, pp. 298–308.
[47] A. White, A. Martin, Who Owns the World’s Forests? Forest Tenure and Public Forests in Transition, Forest Trends, 2002.
[48] J. Wooldridge, Econometric Analysis of Cross Section and Panel Data, MIT Press, Cambridge, MA, 2001.
ARTICLE IN PRESS
J. Alix-Garcia / Journal of Environmental Economics and Management 53 (2007) 141–157 157