a social-ecological systems perspective on w ater
TRANSCRIPT

A SOCIAL-ECOLOGICAL SYSTEMS PERSPECTIVE ON WATER MANAGEMENT IN SOUTH AFRICA
by
Erin L. Bohensky
Submitted in partial fulfilment of the requirements for the degree Doctor of Philosophy
(Environmental Ecology)
in the faculty of Natural and Agricultural Sciences
July 2006
UUnniivveerrssiittyy ooff PPrreettoorriiaa eettdd,, BBoohheennsskkyy EE LL ((22000066))

ii
A social-ecological systems perspective on water management in South Africa
Student: Erin L. Bohensky
Supervisors: Professor A. S. van Jaarsveld1 and Dr. Berndt Janse van Rensburg2
Departments: 1Centre for Invasion Biology, Department of Botany and Zoology,
Stellenbosch University, Private Bag X1, Stellenbosch 7602 South Africa
2Department of Zoology and Entomology, University of Pretoria, Pretoria,
0002
Degree: Doctor of Philosophy (Environmental Ecology)
Abstract
Conventional approaches to water management have traditionally treated social systems and
ecosystems as distinct, and to a large degree have failed to achieve outcomes that are
simultanously efficient, equitable, and sustainable. Perhaps nowhere has the need to reform
the way water is managed and even conceived been more apparent than in South Africa in the
last decade, where a tremendous opportunity for change has been created in the form of the
National Water Act of 1998. In this thesis I propose that water management in South Africa –
which encompasses its water resources, ecosystems and their services, people they support,
and institutions that govern them – is a social-ecological system: a coupled, inseparable
system of human beings and nature. Using a combination of approaches, I demonstrate that a
social-ecological systems perspective is needed to understand the true nature of these
challenges. First, drawing from the experience of the Southern African Millennium
Ecosystem Assessment (SAfMA), I construct and apply a framework for evaluating past
water management responses. Second, I review a scenario planning exercise as an approach
for identifying robust decisions amid high levels of uncertainty about future ecosystem
services. Third, I use an agent-based model to explore the evolution of decision-making and
learning by water managers under alternative paradigms. Lastly, I compare the ability of two
existing frameworks to increase understanding of resilience as it applies to South African
water management. Results of this work indicate that: congruence of impacts, awareness, and
power is key to achieving effective water management in South Africa; future water
management planning needs to take account of cross-scale trade-offs; decentralisation holds
most promise when supported by a national policy framework but which allows for local
learning; learning may be constrained by temporal variability, water stress, access to learning
UUnniivveerrssiittyy ooff PPrreettoorriiaa eettdd,, BBoohheennsskkyy EE LL ((22000066))

iii
networks, and use of inappropriate indicators; and the concept of resilience may provide a
mechanism for uniting social and ecological research on water management. As most past
water management failures have resulted from a misunderstanding of social-ecological system
dynamics, work of this kind can make a significant contribution at this pivotal point in South
Africa’s water management history.
UUnniivveerrssiittyy ooff PPrreettoorriiaa eettdd,, BBoohheennsskkyy EE LL ((22000066))

iv
Declaration
I, the undersigned, hereby declare that this thesis, submitted for the degree of Doctor of
Philosophy (Environmental Ecology), is my own and original work except where
acknowledged. This work has not been submitted for a degree at any other tertiary institution.
_________________
Erin L. Bohensky
UUnniivveerrssiittyy ooff PPrreettoorriiaa eettdd,, BBoohheennsskkyy EE LL ((22000066))

v
Disclaimer
This thesis consists of a series of chapters that have been published in, or prepared for
submission to, a range of scientific journals. As a result formatting styles differ and overlap
may occur to secure publishable entities.
UUnniivveerrssiittyy ooff PPrreettoorriiaa eettdd,, BBoohheennsskkyy EE LL ((22000066))

vi
Acknowledgements
Funding for this research was provided by a grant to the Southern African Millennium
Ecosystem Assessment from the Government of Norway and administered by the United
Nations Environment Programme. The University of Pretoria and Stellenbosch University
provided logistical and administrative support.
I am grateful to my supervisor, Professor Albert van Jaarsveld, for all of his support
and insight over the past years. Thanks also go to co-supervisor Dr. Berndt Janse van
Rensburg for useful advice along the way, and my ‘quasi-supervisor,’ travel companion, and
all-around good friend Belinda Reyers. Cheers to everyone in the lab in its various
incarnations from Pretoria to Stellenbosch, particularly Jen Jones and Aimee Ginsburg for
‘ lectures,’ and Marinda Dobson and Mari Sauerman for efficiently handling finances and
other logistics.
The opportunity to work on the Millennium Ecosystem Assessment while conducting
my research and to interact with the SAfMA team was a uniquely enriching, and at times,
highly entertaining experience. In addition to Albert and Belinda, thanks are due to Tim
Lynam, Christo Fabricius, Oonsie Biggs, Bob Scholes, Connie Musvoto, and honorary
SAfMA member Marcus Lee, and many others in the larger MA family.
I am indebted to John Murphy for a dynamic exchange of ideas and tireless
enthusiasm for helping me build the WaterScape model, and to Ann Kinzig for hosting my
visit to Tempe, Arizona in July(?!) 2004.
I am grateful to CIRAD for the opportunity to participate in a short course in agent-
based modelling at the University of Pretoria in 2003, and especially to the instructors,
Christopher Le Page, Pierre Bommel, and Louise Erasmus, and a lively group of participants.
I thank the South African Department of Water Affairs and Forestry for providing
access to the Water Situation Assessment Model, the organisers and instructors of a training
course on its use, and Anne Beater for subsequent support. Numerous individuals in the South
African water sector provided insight, information, and feedback on this work as it evolved.
UUnniivveerrssiittyy ooff PPrreettoorriiaa eettdd,, BBoohheennsskkyy EE LL ((22000066))

vii
I was fortunate to travel widely to present this work, and received excellent feedback
from audiences of presentations and seminars given at the following: International Young
Scientists’ Global Change Conference, Trieste, Italy (2003); “Bridging Scales and
Epistemologies: Linking Local Knowledge with Global Science in Multi-Scale Assessments,”
Alexandria, Egypt (2004); Society for Conservation Biology, New York (2004); South
African Society of Aquatic Sciences, Midrand, South Africa (2004), “Water Resource
Management for Local Development: Governance, Institutions, and Policies,” Loskop Dam,
South Africa (2004); the Programme for Land and Agrarian Studies at the University of the
Western Cape, South Africa (2005); and CSIRO’s Davies Laboratory, Townsville, Australia
(2006).
Several people kindly read drafts of chapters: Duan Biggs, Harry Biggs, Jen Jones,
John Murphy, Belinda Reyers, and Dirk Roux, in addition to several anonymous reviewers.
Of course, I owe a special thanks to my family: Anita Bohensky and Richard Pfeiffer,
Megan Bohensky, and Richard Bohensky for all of their love and encouragement across the
miles, and no less to my surrogate family in South Africa, Harry, Rina, Oonsie, and Rory
Biggs – and most of all, Duan, for his friendship, enthusiasm, support, and love during the
journey.
Lastly, credit is due to Marc Reisner for a fascinating and at times horrifying account
of water politics in the U.S. (Cadillac Desert: The American West and its Disappearing
Water), which provided early interest in the subject, and Hugh Holub for a humourous, but
still horrifying, summary (“Western Water Law: A Really Dry Subject” ), which provided
additional inspiration.
UUnniivveerrssiittyy ooff PPrreettoorriiaa eettdd,, BBoohheennsskkyy EE LL ((22000066))

viii
Table of Contents
Abstract………………………………………………………………………………………...ii
Declaration………………………………………………………………………………….…iv
Disclaimer…………………………………………………………………………….………..v
Acknowledgements……………………………………………………………………………vi
Contents……………………………………………………………………………………...viii
List of Figures………………………………………………………………………………….x
List of Tables………………………………………………………………………………...xiii
Chapter 1. Introduction…………………………………………………………………….….1
Chapter 2. Evaluating responses in complex adaptive systems: Insights on water
management from the Southern African Millennium Ecosystem Assessment (SAfMA)……15
Chapter 3. Future ecosystem services in a Southern African river basin: A scenario
planning approach to uncertainty…………………………………………………………..…45
Chapter 4. Decentralisation and its discontents: redefining winners and losers on the
South African ‘waterscape’…………………………………………………………………...68
Chapter 5. Learning dilemmas in a social-ecological system: an agent-based modelling
exploration…………………………………………………………………………………..101
UUnniivveerrssiittyy ooff PPrreettoorriiaa eettdd,, BBoohheennsskkyy EE LL ((22000066))
ix
Chapter 6. Discovering resilient pathways for water management: two frameworks and a
vision………………………………………………………………………………………...135
Chapter 7. Synthesis…………………………………………………………………………162
Appendix A. Background paper on Southern African Millennium Ecosystem Assessment
by van Jaarsveld et al. (2005).………………………………………………………………172
Appendix B. Class diagram depicting agent classes of the WaterScape model...…………..173
Appendix C. Description of attributes of entities in the WaterScape model………………..175
Appendix D. Translation of scenarios for use in WaterScape model……………………….180
UUnniivveerrssiittyy ooff PPrreettoorriiaa eettdd,, BBoohheennsskkyy EE LL ((22000066))

x
List of Figures
Figure 1.1. Map of South Africa, with major rivers, cities, urban and cultivated areas, and
mean annual precipitation.
Figure 2.1. The Southern African Millennium Ecosystem Assessment study area and its
nested, multiscale design.
Figure 2.2. (a) Near congruence of impact, awareness, and power scopes. (b) Incongruence of
impact, awareness, and power scopes.
Figure 2.3. Water supply augmentation, illustrated by cumulative storage dam capacity in
South Africa from pre-1900 until 1997.�
Figure 3.1. Change in production or condition of ecosystem services in the four regions of the
Gariep basin from 2000 to 2030 under (a) Policy Reform and Market Forces scenarios, and
under (b) Local Resources and Fortress World scenarios.
Figure 4.1. Spatial and social entities in the WaterScape model.
Figure 4.2. Ecological feedbacks in the WaterScape model.
Figure 4.3. Value added in Rands per m3 at initialisation and after 100 years under five
scenarios.
Figure 4.4. Mean dissatisfaction index value at initialisation and after 100 years under five
scenarios.
Figure 4.5. Proportion of catchments in WMA that are ecologically transformed at
initialisation and after 100 years under five scenarios.
Figure 4.6. Dominant scenario selected after 100 years under two learning algorithms.
Figure 5.1. (a) Map of South Africa depicting international boundaries and Water
Management Areas (WMAs). (b) Visual representation of WMAs in the CORMAS program.
UUnniivveerrssiittyy ooff PPrreettoorriiaa eettdd,, BBoohheennsskkyy EE LL ((22000066))

xi
Figure 5.2. Schematic of major relationships governing an actual and perceived environment
in a social-ecological system.
Figure 5.3. Ecological feedbacks in the WaterScape model.
Figure 5.4. The mechanics of learning as represented in the WaterScape model.
Figure 5.5. Sequence of indicator change.
Figure 5.6. Sequence of activities in the model.
Figure 5.7. Strategy selection when all agents use the efficiency indicator (Rand value per
cubic meter of water use).
Figure 5.8. Strategy selection when all agents use the equity indicator (human reserve deficit).
Figure 5.9. Strategy selection when all agents use the sustainability indicator (decline in
present ecological management class from initial value).
Figure 5.10. Strategy selection by agents when indicators are randomly assigned and fixed.
Figure 5.11. Strategy selection by agents when agents are allowed to change indicators.
Figure 5.12. Strategy change when agents use the three single indicators, randomly-assigned
fixed indicators, and changing indicators.
Figure 5.13. Indicator selection by agents with changing indicators.
Figure 5.14. Hydrological variability (mean hydrological index value), water stress (ratio of
demand to supply) and size (number of water units) of five water management areas.
UUnniivveerrssiittyy ooff PPrreettoorriiaa eettdd,, BBoohheennsskkyy EE LL ((22000066))

xii
Figure 5.15. Strategy selection by agents in: a) most variable and water-stressed (Lower
Vaal); b) least variable (Thukela); c) largest (Lower Orange); d) smallest (Berg); and e) least
water-stressed (Mzimvubu) WMAs using randomly-assigned fixed indicators.
Figure 5.16. Strategy selection by agents in: a) most variable and water-stressed (Lower
Vaal); b) least variable (Thukela); c) largest (Lower Orange); d) smallest (Berg); and e) least
water-stressed (Mzimvubu) WMAs using changing indicators.
Figure 5.17. Strategy change by agents in five WMAs using randomly-assigned fixed
indicators.
Figure 5.18. Strategy change by agents in five WMAs with changing indicators.
Figure 5.19. Selection of equity indicator by agents in five WMAs.
Figure 5.20. Selection of efficiency indicator by agents in five WMAs.
Figure 5.21. Selection of sustainability indicator by agents in five WMAs.
Figure 6.1. A possible pathway of water use, based on past, present and suggested future
ecological management classes.
Figure 6.2. Conceptual framework of the Millennium Ecosystem Assessment.
Figure 6.3. Adaptation of the MA conceptual framework to depict two iterations of South
African water management.
Figure 6.4. The panarchy model (Holling 2001) is comprised of four ecosystem phases (r, K, �
, and � ) and the flow of events between them.
Figure 6.5. The panarchy model of the adaptive cycle is used to depict the dynamics in South
African water management during the previous (iteration 1) and current (iteration 2) eras.
UUnniivveerrssiittyy ooff PPrreettoorriiaa eettdd,, BBoohheennsskkyy EE LL ((22000066))

xiii
List of Tables
Table 1.1. Thesis structure.
Table 2.1. Characteristics of the Gariep and Zambezi basins.
Table 3.1. Key bifurcations in drivers of change that distinguish four scenarios of future
ecosystem services and human well-being.
Table 4.1. Scenario assumptions and rules.
Table 4.2. Economic efficiency, equity, and sustainability of water use on WaterScape at
beginning and end of 100 years under five scenarios.
Table 4.3. Valued added (millions of Rands) by each sector at beginning and end of 100 years
under five scenarios.
Table 4.4. Gini coefficients for sectoral consumption at beginning and end of 100 years under
five scenarios.
Table 6.1. Water management in South Africa: a timeline of events.
UUnniivveerrssiittyy ooff PPrreettoorriiaa eettdd,, BBoohheennsskkyy EE LL ((22000066))

1. Introduction
1
Introduction The First Water Law of the West is the Law of Gravity. Water runs downhill. The initial uses of water in the West involved the use of gravity to tap r ivers and diver t their flows into canals for delivery to farms and mines. This is also known as Newton’s Law. The Second Water Law of the West is the or iginal law of Los Angeles…[and] states that ‘water runs uphill to money.’ The development of energy technologies to lift water against the pull of gravity is the basis for modern Western civilization. Los Angeles pioneered the effor t to defy gravity with money in the ear ly 1900s with its Owens Valley Aqueduct…Phoenix, San Francisco and Denver also utilize massive pumping and diversion systems to transpor t water from great distances in defiance of gravity to serve their growing urban populations.
—Hugh Holub, 1999
Societies throughout history have used laws to define, control, and sanction the use of
natural resources for their benefit – water being no exception, and perhaps all the more so
because of its absolute non-substitutability. Water, however, is a law-defying entity. As Holub’s
first two Water Laws of the West make clear, even Newton’s Law, long used to the advantage of
farmers, miners, and other water users, may be superceded when societal ambition and ingenuity
dictate necessary (Lebel et al. 2005). Today, we are beginning to realise the limits of our legal
measures to manage water. Holub’s laws were written with reference to the water saga that has
long endured in the American West (Reisner 1993), but apply with little modification to
numerous societies that have made similar valiant attempts to support livelihoods, economies,
and political regimes on arid landscapes, often with remarkable success, and as the historical
record indicates, equally often with phenomenal failure (Tainter 1998, Diamond 2005).
Perhaps nowhere has the need to reform the way water is managed and even conceived
been more apparent than in South Africa in the last decade. In a country where history has been
so prominently shaped by unevenly distributed natural resources (Figure 1.1), the nation’s leaders
seized an opportunity at the close of the apartheid era to overhaul the previous water law and
replace it with one of the most progressive pieces of water legislation in the world to date. The
enactment of National Water Act No. 36 of 1998 signaled not only the end of an era of resource
UUnniivveerrssiittyy ooff PPrreettoorriiaa eettdd,, BBoohheennsskkyy EE LL ((22000066))

1. Introduction
2
Figure 1.1. South Africa, with major rivers, cities, urban and cultivated areas, and mean annual
precipitation.
management but the beginning of a commitment to ecological and social sustainability,
abolishing all water rights except for two: the right of every citizen to an adequate, safe supply of
water for domestic needs and the right of ecosystems to the water required for their continued
functioning (DWAF 2004a). Together, these rights constitute the Reserve, the unconditional first
priority in water allocation. The Act also strives for efficiency, so that scarce water resources
beyond the Reserve are used for the collective benefit of the nation’s present and future
generations.
Four years after the Act was passed, the World Summit on Sustainable Development was
held in Johannesburg. To showcase South African water policy for the benefit of international
visitors, the Department of Water Affairs and Forestry took out a billboard ad in a prominent
location. The ad showed the image of a smiling African child standing at a tap, while beneath the
image ran the newly-adopted slogan of the department: “Some, for all, forever,” a reference to
the Water Act’s three core principles of efficiency, equity, and sustainability. Here was a very
appealing concept: the department’s new law would serve the ‘ triple bottom line’ of the people,
UUnniivveerrssiittyy ooff PPrreettoorriiaa eettdd,, BBoohheennsskkyy EE LL ((22000066))

1. Introduction
3
the economy, and the environment. It was a concept that everyone could buy into, and few could
argue against.
As of early 2006, major parts of the new water policy await implementation, and many
questions about how to do it remain unanswered. Moving from legislation to action on the ground
must extend beyond a paradigm shift in thinking to the establishment of new institutional
arrangements, demonstrable progress on the significant backlog in service delivery especially in
the rural population (DWAF 2004b), and an improved understanding of the complex
relationships between hydrology, ecology, and society. This amounts to an enormous task, and
while the new Water Act is a significant piece of legislation, concerns are expressed that an
enabling environment for implementation of the law does not yet exist, necessary partnerships
among and between institutions and communities are not being forged, and the Act’s vision is not
being effectively communicated (MacKay et al. 2003).
We now know that water cannot be governed by physics alone. Managing water
sustainably is a question of biological and physical processes, but it is every bit as much a
question of social ones (Pahl-Wostl 2002). In this thesis I propose that water management in
South Africa – which encompasses its water resources, ecosystems and their services (Daily et al.
1997), people they support, and institutions that govern them – is a social-ecological system: a
coupled, inseparable system of human beings and nature. However, social-ecological systems
theory, increasingly embraced by those working at the interface of social and natural science
problems, has not been fully brought to bear on the challenges that South African water
management faces now and may encounter in the future. I then argue that a social-ecological
systems perspective is needed to understand the true nature of these challenges. Below I elaborate
on this perspective before outlining the thesis structure and the approach adopted in each chapter
to support this argument.
A Social-Ecological Systems Perspective on Water Management
Science and broader society have traditionally treated social systems and ecosystems as
distinct, according to one of two general views (Westley et al. 2002). One is that ecosystems are
part of social systems – ‘natural’ patches within a human-dominated matrix. The other is that
social systems are part of ecosystems, with ecosystems comprising all life, among which the
UUnniivveerrssiittyy ooff PPrreettoorriiaa eettdd,, BBoohheennsskkyy EE LL ((22000066))

1. Introduction
4
human species has come to dominate. Each view tends to draw from a unique disciplinary
paradigm, and each may be used to support different approaches to conservation and
development problems (Norgaard 1994).
A growing volume of case studies and examples (e.g. Gunderson and Holling 2002,
Janssen 2002, Berkes et al. 2003) suggests that each of these views has limits when called upon
to provide sustainable solutions to such problems. The first view, that ecosystems are contained
within social systems, may arrive at an assumption that managers can control ecosystems. Much
management in industrialised nations has been based on a ‘command-and-control’ (Holling and
Meffe 1996) approach that supports the idea that humans can and should dominate, tame, or
triumph over nature. A counterargument is that all ecosystems, no matter how much humans
influence them, are partially but inherently beyond human control. This is because ecosystems
behave as complex adaptive systems (Walker et. al. 2002), which tend to be non-linear, uncertain,
unpredictable, and adaptive to change. Their complexity emerges from simple rules (Lee 1993),
the ability to self-organise (Holling 2001), and the interaction of slow variables – the governing
structures and processes that drive system behavior – with rapidly changing ones (Gunderson and
Holling 2002). Complex systems are able to shift between alternative states; state change is often
characterised by thresholds that are difficult to predict (Scheffer and Carpenter 2003). When a
critical threshold is passed, recovery to the previous system state is often extremely difficult
(Scheffer et al 2001). Such dynamics explain the severe resource collapse or degradation that has
been observed in large complex systems such as the Columbia River Basin (Lee 1993), the
Everglades (Light et al. 1995), and the Western Australia agricultural region (Allison and Hobbes
2004), all of which have been guided by command-and-control management approaches.
The second view, that social systems, as a construct of the human species, are contained
within ecosystems, may conclude that humans, though a remarkably successful species, are just
like any other (Pinker 1997), and therefore, human control over and custody for ecosystems can
be relinquished. The likeness of humans to other life forms is not debated here; the salient
argument against this view is that the human species, though only one of many, has made an
indelible and profound mark on global ecosystems and human well-being (MA 2005). Some
liken the current scale of human domination to a new geologic era, the ‘Anthropocene’ (Meybeck
2003), in which the modern human species – Homo economus (O’Neill and Kahn 2000) – has
appropriated primary production (Vitousek et al. 1997), freshwater (Vörösmarty and Sahagian
UUnniivveerrssiittyy ooff PPrreettoorriiaa eettdd,, BBoohheennsskkyy EE LL ((22000066))

1. Introduction
5
2000), and biodiversity (Pimm et al. 1995) as no other species has done before. The continuation
of these activities, and the unprecedented scale of their effects, does not bode well for future
human (or other) generations (MA 2005). Furthermore, some challenge the ‘ just another species’
view on the grounds that nature has intrinsic value and a right to exist beyond any human needs
or desires for it (Noss and Cooperrider 1994).
Where sustainability is concerned, a more meaningful position is likely to lie somewhere
between the two views – one that suggests a more complex relationship between humans and
ecosystems, appreciating that while humans are at least partially at the mercy of ecosystem
complexity, they have tremendous impact on natural systems, and recognising this, are capable of
better management. Such a relationship is not novel in human history; case studies show how
recognition of the fundamentally coupled nature of social-ecological systems has allowed some
societies to manage their resource bases sustainably, sometimes for centuries (Berkes et al. 2000,
Dietz et al. 2003). At present, however, such a position does not feature prominently in the
positivist tradition of Western science (Berkes et al. 1998) or conventional resource management
(Holling and Meffe 1996).
In South Africa, water management has been dominated largely by the first view (Rogers
et al. 2000), though elements of the second also persist. Undoubtedly, a more holistic perspective
is required to achieve the efficiency, equity, and sustainability principles of the Water Act. This is
a call echoed by water researchers and practitioners across the globe (Pahl-Wostl et al. 2002,
Folke 2003), but it is often guided by incomplete understanding on the ground. For example,
Integrated Water Resources Management, which focuses on coordinated management of water
resources to achieve social, economic, and sustainability goals, is often an attempt at such holism,
but at other times is a mere buzzword that obscures underlying perceptions about human-water
relationships (Chikozho 2005, Moench 2005).
Water is an especially challenging resource to manage because of its tight links to other
ecosystem components, land use, economies, culture, and fundamentally, ethics (Acreman 2001).
The South African Water Act clearly acknowledges these links and trade-offs in a ‘water and
society’ system context, but recent dialogue regarding the creation of new water institutions has
suggested that this context is not always being appreciated in practice (Rogers et al. 2000). In
academic and research circles, different aspects of social-ecological systems theory are reflected
in the current water management discourse and analysis. These focus on the role of adaptive
UUnniivveerrssiittyy ooff PPrreettoorriiaa eettdd,, BBoohheennsskkyy EE LL ((22000066))

1. Introduction
6
management (Rogers et al. 2000, MacKay et al. 2003), the incorporation of value systems in
monitoring programmes (Rogers and Biggs 1999), limits of biophysical research (van Wyk et al.
2001), and governance mismatches (Pollard and du Toit 2005). Despite this, the theory needs
continued development and application to the South African context, individual efforts need to be
synthesised, and greater investment made in communication with those responsible for
implementing water policies. This thesis is an attempt to respond to these needs by pushing
social-ecological systems thinking in several new directions in an arena where its application has
been limited thus far.
Thesis Structure: Hypothesis, Key Questions, and Approach
My hypothesis is that a social-ecological systems perspective makes a unique contribution
to our understanding of water management in South Africa, and particularly to the current
transition underway. To explore this, I identify five key questions that flow from this premise
(Table 1.1), and use a variety of approaches and methods to address them in the next five
chapters. Two chapters (2, 3) of this thesis draw on the experience of the Southern African
Millennium Ecosystem Assessment (Biggs et al. 2004, Bohensky et al. 2004, van Jaarsveld et al.
2005 – see Appendix A), part of a global initiative to provide information to decision-makers
about the relationships between ecosystem services and human well-being (MA 2003, MA 2005).
To a large degree, the scientific basis of the Millennium Assessment is rooted in social-ecological
systems theory, though in itself it was not a theoretical exercise intended to support or test this
theory, an issue I return to in a later chapter (6).
Two chapters (4, 5) use an agent-based modelling approach that was developed for this
thesis to explore the evolution of interactions between water resources and water users in a
spatio-temporal environment that represents South Africa. Agent-based modeling has its origins
in the arenas of artificial intelligence (Ferber 1999) and social science (Epstein and Axtell 1996)
but is becoming widely applied to natural resource management research that adopts a social-
ecological systems perspective (Bousquet and Le Page 2004).
UUnniivveerrssiittyy ooff PPrreettoorriiaa eettdd,, BBoohheennsskkyy EE LL ((22000066))

1. Introduction
7
Table 1.1. Thesis structure.
Chapter Key Question(s)
1 Introduction
How can a social-ecological systems perspective
contribute to our understanding of South African
water management?
2 Evaluating responses in complex adaptive
systems: insights for water management from
the Southern Afr ican Millennium Ecosystem
Assessment (SAfMA)
What factors characterise effective management
responses - those that maintain ecological and social
resilience - in complex systems?
3 Future ecosystem services in a southern
Afr ican r iver basin: a scenar io planning
approach to uncer tainty
How can scenarios of possible alternative futures
aid our ability to deal with uncertainty in complex
social-ecological systems?
4 Decentralisation and its discontents:
redefining winners and losers on the South
Afr ican ‘waterscape’
Does the decentralisation of water management in
South Africa lead to ‘better’ outcomes, or does it
simply redefine winners and losers?
5 Learning dilemmas in a social-ecological
system: an agent-based modelling exploration
How do certain social-ecological system conditions
enable or constrain learning? Does the Water Act
create optimal environments for learning?
6 Discover ing resilient pathways for water
management: two frameworks and a vision
Can existing social-ecological systems frameworks
help to discover resilient pathways for South
African water management and achieve the vision
of the Water Act?
7 Synthesis
How can a social-ecological systems perspective
contribute to our understanding of South African
water management?
UUnniivveerrssiittyy ooff PPrreettoorriiaa eettdd,, BBoohheennsskkyy EE LL ((22000066))

1. Introduction
8
In order to understand why certain systems of water management in southern Africa have
succeeded or failed in the past, and the likelihood of future successes and failures, water
management responses need to be viewed in a complex adaptive systems context. In Chapter 2, I
investigate whether certain factors characterise effective management responses – those that
maintain ecological and social resilience – in complex systems. Water management in South
Africa needs to be understood in light of the dominant paradigms of past and present that have
enabled or constrained people’s options for managing water. I present a conceptual framework of
responses in complex social-ecological systems to evaluate different interventions to manage
water. The framework consists of three interconnected scopes or spatial and temporal domains:
the scope of an impact, the scope of the awareness of the impact, and the scope of the power or
influence to respond. I suggest that these scopes must be at least mostly congruent for a response
to be effective. I then assess the validity of this suggestion by evaluating water management
responses in the Gariep and Zambezi River basins that formed part of the Southern African
Millennium Ecosystem Assessment. Fundamentally, this chapter seeks to gain a better
understanding of past water management responses, and is a logical basis for the questions
explored in the following chapters of the thesis which essentially focus on the future.
Many uncertainties influence the future of water management in South Africa, and are not
easily controlled by actors in the system. In such situations, scenarios, as plausible narratives
describing alternative futures, have shown great potential to stimulate thinking and debate. For
this reason, scenarios have been used widely in business and political contexts, where they have
frequently been instrumental in achieving major strategy changes and paradigm shifts. In
Chapter 3, I review a scenario planning exercise as an approach for identifying social-ecological
management decisions that are robust to high levels of uncertainty about future ecosystems and
their services. I then discuss the objectives, approaches, and findings of a scenario analysis in the
Gariep River basin in Southern Africa. I also look more closely at the key findings of this
analysis, why they emerged from the scenarios, as well as the shortcomings of this exercise and
how it could be improved for future use. Scenarios show greatest potential when designed to
address a focal policy issue, and could therefore play an important role for dealing with
uncertainty surrounding the South African water management transition.
The new water management paradigm in South Africa entails an unprecedented
decentralisation process for this country. Social-ecological systems theory suggests that
UUnniivveerrssiittyy ooff PPrreettoorriiaa eettdd,, BBoohheennsskkyy EE LL ((22000066))

1. Introduction
9
democratic decentralisation is an effective management response because it transfers decision-
making authority to local actors who presumably have the most relevant information about their
water resources, and it also minimises risk by promoting a diversity of water management
strategies. Yet in reality, few examples exist of successful decentralisation experiments for
natural resource management. In Chapter 4 I ask if decentralisation leads to ‘better’ outcomes in
social-ecological systems, or simply redefines winners and losers. I pursue this question with the
use of an agent-based model of decision-making in the South African water sector called the
WaterScape. I compare the outcomes of actors’ decisions for achieving the three Water Act
principles of efficiency, equity, and sustainability under three dominant water management
paradigms and under a decentralised system that allows collective learning. Given that water
management must occur at multiple scales, I explore to what extent decentralised decision-
making is appropriate.
Learning is important in a social-ecological system so that actors can capture information
and detect key patterns. Because social-ecological systems are dynamic, actors must be able to
learn and adapt. While in Chapter 4 I ask whether the Water Act principles are more likely to be
achieved when learning is allowed, in Chapter 5 I extend this line of questioning and ask what
causes agents to learn, and conversely, what prevents them from learning. I propose that water
management in South Africa, as a social-ecological system, is challenged by ‘ learning dilemmas,’
in which human perceptions combined with social-ecological conditions affect the capacity,
understanding, and willingness required to learn. In South Africa, learning how to manage water
has been affected by water’s high temporal variability, scarcity, and lack of access to ‘ learning
networks’ through which relevant, timely information can be obtained. Learning is also affected
by the indicators selected to measure the effectiveness of different management strategies. I use
the WaterScape model presented in Chapter 4 to investigate social-ecological conditions that
encourage or constrain learning by agents in the South African water sector. I explore how
variability, water stress, and spatial heterogeneity, together with indicator selection affect
learning ability. I then ask, given these conditions, what can be done to enhance learning, and
how can management ensure that optimal conditions for learning are maintained or created?
In Chapter 6 I investigate the concept of resilience in water management. Resilience –
defined as the amount of change or disturbance a system can withstand and still maintain its
essential structure, function, and identity (Rappaport 1968, Holling 1973, Levin 1999, Cumming
UUnniivveerrssiittyy ooff PPrreettoorriiaa eettdd,, BBoohheennsskkyy EE LL ((22000066))

1. Introduction
10
et al. 2005) – as it applies to water management is poorly understood, yet it is a critical issue to
the successful implementation of the South African Water Act over the long term. Because a
social-ecological system undergoes continuous change, the concept of resilience needs to be
viewed with respect to particular system configurations rather than to the system itself. It is
therefore useful to identify resilient “pathways” for the system that can guide future management
actions. A growing body of theory and associated frameworks exist to improve understanding of
resilience, but its relevance to management, and specifically for the example in this thesis, is
unclear. I evaluate the potential of two existing frameworks – the conceptual framework of the
Millennium Assessment and the “panarchy model” of Holling that has played a pivotal role in
current resilience theory – to help water managers discover resilient pathways that are likely to
align with a common vision for the South African water sector. I then identify features of the
framework that may require modification as well as gaps in the vision, with the practical example
of South African water management ultimately serving to strengthen social-ecological systems
understanding.
In Chapter 7, I revisit the hypothesis presented above: can a social-ecological systems
perspective contribute to our understanding of water management in South Africa? I attempt to
answer this in a synthesis of the arguments made in the five main thesis chapters. I then discuss
some of the expected implications of this work for water management and research in the future.
UUnniivveerrssiittyy ooff PPrreettoorriiaa eettdd,, BBoohheennsskkyy EE LL ((22000066))

1. Introduction
11
References
Acreman, M. 2001. Ethical aspects of water and ecosystems. Water Policy 3:257–265.
Allison, H. E. and R. J. Hobbs. 2004. Resilience, adaptive capacity, and the “Lock-in Trap” of the Western Australian agricultural region. Ecology and Society 9(1):3. [online] URL: http://www.ecologyandsociety.org/vol9/iss1/art3. Berkes, F., and C. Folke, editors. 1998. Linking social and ecological systems: management practices and social mechanisms for building resilience. Cambridge University Press, Cambridge. Berkes, F., J. Colding, and C. Folke. 2000. Rediscovery of traditional ecological knowledge as Adaptive Management. Ecological Applications 10:1251-1262. Berkes, F., J. Colding, and C. Folke, editors. 2003. Navigating social-ecological systems: building resilience for complexity and change. Cambridge, Cambridge University Press. Biggs, R., E. Bohensky, C. Fabr icius, T. Lynam, A. Misselhorn, C. Musvoto, M. Mutale, B. Reyers, R. J. Scholes, S. Shikongo, and A.S. van Jaarsveld. 2004. Nature supporting people: The Southern African Millennium Ecosystem Assessment. CSIR, Pretoria, South Africa. Available at http://www.millenniumassessment.org/en/subglobal.safma.aspx. Bohensky, E., B. Reyers, A. S. van Jaarsveld, and C. Fabr icius, editors. 2004. Ecosystem Services in the Gariep Basin: A component of the Southern African Millennium Ecosystem Assessment (SAfMA). Sun Media, Stellenbosch, South Africa. Available at http://www.sun-e-shop.co.za and http://www.millenniumassessment.org/en/subglobal.safma.aspx. Bousquet, F. and C. Le Page. 2004. Multi-agent simulations and ecosystem management: a review. Ecological Modelling 176: 313–332. Chikozho, C. 2005. Policy and institutional dimensions of integrated river basin management: Broadening stakeholder participatory processes in the Inkomati River Basin of South Africa and the Pangani River Basin of Tanzania. Commons southern Africa occasional paper series No. 12. Centre for Applied Social Sciences/Programme for Land and Agrarian Studies, Harare and Cape Town. Available online at http://www.cassplaas.org/. Cumming, G. S., G. Barnes, S. Perz, M. Schmink, K. E. Sieving, J. Southworth, M. Binford, R. D. Holt, C. Stickler , and T. Van Holt. 2005. An exploratory framework for the empirical measurement of resilience. Ecosystems 8: 975–987. Daily, G. C., editor. 1997. Nature's services: societal dependence on natural systems. Island Press, Washington, DC. Diamond, J. 2005. Collapse: how societies choose to fail or survive. Penguin Books, London.
UUnniivveerrssiittyy ooff PPrreettoorriiaa eettdd,, BBoohheennsskkyy EE LL ((22000066))

1. Introduction
12
Dietz, T., E. Ostrom, and P.C. Stern. 2003. The struggle to govern the commons. Science 302:1907-1912. DWAF (Depar tment of Water Affairs and Forestry). 2004a. First edition of the National Water Resources Strategy, DWAF, Pretoria, South Africa. Available online at http://www.dwaf.gov.za/. DWAF (Depar tment of Water Affairs and Forestry). 2004b. A decade of delivery. DWAF, Pretoria, South Africa. Available online at: http://www.dwaf.gov.za/Communications/Articles/Kasrils/2004/TEN%20YEARS%20OF%20DELIVER%20ARTICLE.doc. Epstein, J. and R. Axtell. 1996. Growing artificial societies: social science from the bottom-up. Brookings Inst. Press/MIT Press, Washington, D.C. Ferber , J. 1999. Multi-agent systems: An introduction to distributed artificial intelligence. Addison-Wesley, Reading, MA. Folke, C. 2003 Freshwater for resilience: a shift in thinking. Philosophical Transactions of the Royal Society of London B 358, 2027–2036. Gunderson, L .H. and C.S. Holling, editors. 2002. Panarchy: understanding transformations in human and natural systems. Island Press, Washington, D.C., USA. Holling, C.S. 1973. Resilience and stability of ecological systems. Annual Review of Ecology and Systematics 4:1-23. Holling, C.S. 2001. Understanding the complexity of economic, ecological, and social systems. Ecosystems 4: 390-405. Holling, C.S. and G. K. Meffe. 1996. Command and control and the pathology of natural resource management. Conservation Biology 10: 328-337. Holub, H. 1999. “Ten Water Laws of the West.” Available online at http://www.bandersnatch.com/water.htm). Janssen, M. A., editor. 2002. Complexity and ecosystem management: The theory and practice of multi-agent systems. Cheltenham, Edward Elgar/International Society of Ecological Economics. Lebel, L ., P. Garden, and M. Imamura. 2005. The politics of scale, position, and place in the governance of water resources in the Mekong region. Ecology and Society 10(2): 18. [online] URL: http://www.ecologyandsociety.org/vol10/iss2/art18/ Lee. K. N., editor. 1993. Compass and gyroscope: integrating science and politics for the environment. Island Press, Washington, D.C.
UUnniivveerrssiittyy ooff PPrreettoorriiaa eettdd,, BBoohheennsskkyy EE LL ((22000066))

1. Introduction
13
Levin, S. A. 1999. Fragile dominion: complexity and the commons. Perseus Books, Reading, Massachusetts, USA. Light, S.S., L .H.Gunderson, and C.S. Holling. 1995. The Everglades: evolution of management in a turbulent ecosystem. Pages 103-168 in Gunderson C.S. Holling, and S.S. Light, editors. Barriers and bridges to the renewal of ecosystems and institutions. Columbia University Press, New York. MacKay, H.M., K.H. Rogers and D.J. Roux. 2003. Implementing the South African water policy: holding the vision while exploring an uncharted mountain. Water SA 29: 353-358. MA (Millennium Ecosystem Assessment). 2003. Ecosystems and human well-being: a framework for assessment. Island Press, Washington, D.C. MA (Millennium Ecosystem Assessment). 2005. Ecosystems and human well-being: synthesis. Island Press, Washington, D.C. Meybeck, M. 2003. Global analysis of river systems: from Earth system controls to Anthropocene syndromes. Philosophical Transactions of the Royal Society of London Series B: Biological Sciences 358: 1935–1955. Moench, M. 2005. Water, climatic variability and livelihood Resilience: Concepts, field insights and policy implications. Policy Paper II by “The Resilience and Freshwater Initiative” , Swedish Water House, Stockholm. Norgaard, R. B. 1994. Development betrayed: the end of progress and a coevolutionary revisioning of the future. Routledge, London and New York. Noss, R.F., Cooperr ider, A.Y., editors. 1994. Saving nature’s legacy: protecting and restoring biodiversity. Island Press, Washington, D.C. Pahl-Wostl, C., H. Hoff, M. Meybeck and S. Sorooshian. 2002. The role of global change research for aquatic sciences. Aquatic Sciences 64: iv-vi. Pimm, S. I ., G. J. Russell, J. L . Gittelman and T. M. Brooks. 1995. The future of biodiversity. Science 269: 5222. Pinker , S. 1997. How the mind works. W.W. Norton, New York. Pollard, S. and D. du Toit. 2005. Achieving Integrated Water Resource Management: the mismatch in boundaries between water resources management and water supply. Paper presented at International workshop on ‘African Water Laws: Plural Legislative Frameworks for Rural Water Management in Africa’ , 26-28 January 2005, Johannesburg, South Africa Rappapor t, R. A. 1968. Pigs for the ancestors: ritual in the ecology of a New Guinea people. Yale University Press, New Haven, Connecticut, USA.
UUnniivveerrssiittyy ooff PPrreettoorriiaa eettdd,, BBoohheennsskkyy EE LL ((22000066))

1. Introduction
14
Reisner , M. 1993. Cadillac desert: the American west and its disappearing water. Penguin, New York. Rogers, K. and H.C. Biggs. 1999. Integrating indicators, endpoints and value systems in strategic management of the rivers of the Kruger National Park South Africa. Freshwater Biology 41:439-452. Rogers, K., D. Roux and H. Biggs. 2000. Challenges for catchment management agencies: lessons from bureaucracies, business and resource management. Water SA 26:505-511. Scheffer , M., S. Carpenter , J.A. Foley, C. Folke and B. Walker . 2001. Catastrophic shifts in ecosystems. Nature 413:591-6.
Scheffer , M., and S. R. Carpenter. 2003. Catastrophic regime shifts in ecosystems: linking theory to observation. Trends in Ecology and Evolution 18(12): 648–656.
Tainter, J. 1998. The collapse of complex societies. Cambridge University Press, Cambridge. van Jaarsveld, A. S., R. Biggs, R. J. Scholes, E. Bohensky, B Reyers, T. Lynam, C. Musvuto and C. Fabr icius. 2005. Measuring conditions and trends in ecosystem services at multiple scales: the Southern African Millennium Ecosystem Assessment (SAfMA) experience. Philosophical Transactions of the Royal Society of London Series B: Biological Sciences. 360: 425- 441. van Wyk, E., B. W. van Wilgen and D. J. Roux. 2001. How well has biophysical research served the needs of water resource management? Lessons from the Sabie-Sand. South African Journal of Science 97:349-356. Vitousek, P. M., H. A. Mooney, J. Lubchenco, J. and J. M. Mellilo. 1997 Human domination of Earth’s ecosystems. Science 277:494–499. Vörösmarty, C. J. and D. Sahagian. 2000 Anthropogenic disturbance of the terrestrial water cycle. Bioscience 50:753–765. Walker, B., S. Carpenter , J. Ander ies, N. Abel, G. Cumming, M. Janssen, L . Lebel, J. Norberg, G. D. Peterson, and R. Pr itchard. 2002. Resilience management in social-ecological systems: a working hypothesis for a participatory approach. Conservation Ecology 6(1):14. [online] URL: http://www.consecol.org/vol6/iss1/art14. Westley, F., S. R. Carpenter, W. A. Brock, C. S. Holling, and L. H. Gunderson. 2002. Why systems of people and nature are not just social and ecological systems. Pages 103-119 in L. Gunderson and C.S. Holling, editors. Panarchy: understanding transformations in human and natural systems. Island Press, Washington D.C.
UUnniivveerrssiittyy ooff PPrreettoorriiaa eettdd,, BBoohheennsskkyy EE LL ((22000066))

Evaluating responses in complex adaptive systems: Insights on water management from
the Southern Afr ican Millennium Ecosystem Assessment (SAfMA)
E.L. Bohensky1* and T. Lynam2
1Centre for Environmental Studies, University of Pretoria, Pretoria, 0002 South Africa
2 Institute of Environmental Studies, University of Zimbabwe, P.O. Box MP167
Mount Pleasant, Harare, Zimbabwe
Keywords: responses, complex adaptive systems, ecosystem services, southern Africa, water
management, impact, awareness, power
*To whom correspondence should be addressed, [email protected]
Published in: Ecology and Society: 10(1): 11. [online] URL: http://www.ecologyandsociety.org/vol10/iss1/art11/�
UUnniivveerrssiittyy ooff PPrreettoorriiaa eettdd,, BBoohheennsskkyy EE LL ((22000066))

2. Evaluating responses in complex systems
16
Abstract
Ecosystem services are embedded in complex adaptive systems. These systems are
riddled with non-linearities, uncertainties, and surprises, made increasingly complex by the
many human responses to problems or changes arising within them. In this paper we ask
whether certain factors characterize effective responses in complex systems. We construct a
framework for response evaluation with three interconnected scopes – or spatial and temporal
domains: the scope of an impact, the scope of the awareness of the impact, and the scope of
the power or influence to respond. Drawing from the experience of the Southern African
Millennium Ecosystem Assessment (SAfMA), we explore the applicability of this framework
to the example of water management in southern Africa, where an ongoing paradigm shift in
some areas has enabled a transition from supply-side to demand-side responses and the
creation of new institutions to manage water across scales. We suggest that the most effective
responses exhibit congruence between impact, awareness, and power scopes, distribute
impacts across space and time, expand response options, enhance social memory, and depend
on power-distributing mechanisms. We conclude by stressing the need for sufficient
flexibility to adapt responses to the specific, ever-evolving contexts in which they are
implemented. While our discussion focuses on water in southern Africa, we believe the
framework has broad applicability to a range of complex systems and places.
UUnniivveerrssiittyy ooff PPrreettoorriiaa eettdd,, BBoohheennsskkyy EE LL ((22000066))
2. Evaluating responses in complex systems
17
INTRODUCTION
Ecosystems, the services they provide, and the people who use and manage them
comprise complex adaptive systems. Complex systems are inherently non-linear, variable,
and uncertain, and are hence seldom predictable; if anything, surprise is the norm (Costanza et
al. 1993, Gunderson and Holling 2002). Part of their complexity lies in the fact that human
responses to different situations are constantly occurring across different scales and levels of
organization, playing out in multiple, uncoordinated, improvisational theatres in which actors
are never quite sure what will happen next. Due to the great uncertainties in complex systems,
we cannot predict the full range of a response’s implications. All responses are, therefore,
experiments.
This does not mean that the way complex systems work is beyond human
comprehension. Complexity often emerges from simple rules (Lee 1993). Within the complex
couplings of people and nature, experimentation, adaptation, and co-evolution have taken
place for as long as humans have existed. A wealth of information exists from the long history
of human experience with ecosystem change that can contribute to current understanding and
ultimately foster sustainability.
In this paper we seek an answer to the following question: What factors characterize
effective responses in complex adaptive systems? “Responses” are behavioral, institutional, or
technical adaptations that people make to deal with (or in anticipation of) problems or
changes in complex systems. Although ecosystems also respond to change, we limit our
discussion to human responses.
The definition of an “effective” response in a complex adaptive system also needs
some clarification. It is naïve to suggest that effectiveness means achieving objectives. Dams,
in many cases, have been effective in stabilizing river flows and providing hydropower but
have severely undermined downstream ecosystem service delivery and human livelihood
systems (WCD 2000a). In essence, these responses have yielded benefits to some components
of the system at a significant cost to other components. In the context of this paper we use the
term “effective” to mean responses that maintain a system’s social and ecological resilience.
Resilience is used here to refer to the amount of change a system can withstand while
retaining its structure and the variables and processes that control its behavior (Holling and
Gunderson 2002). Resilient systems tend to be self-organizing (as opposed to controlled by
external forces), and can build the capacity to learn and adapt (Carpenter et al. 2001).
UUnniivveerrssiittyy ooff PPrreettoorriiaa eettdd,, BBoohheennsskkyy EE LL ((22000066))

2. Evaluating responses in complex systems
18
We present a simple framework for evaluating responses, and explore it using the
experiences and information generated by SAfMA, the southern African component of the
Millennium Ecosystem Assessment. We focus our evaluation on responses for managing
water in southern Africa, where recent change in the water sector makes it a particularly
compelling case, though we believe the framework can be applied to other problems that
involve complex systems of people and nature.
RESPONSES IN THE MILLENNIUM ECOSYSTEM ASSESSMENT
The Millennium Ecosystem Assessment (MA) is a four-year international process to provide
decision-makers with scientific information about the relationships between ecosystems and
human well-being. The MA marks a departure from other global assessments in several ways:
it is multi-scale (in space and time), integrated (involving ecologists, social scientists, and
economists), and user-driven (serving a range of information needs, from those of local
communities to international environmental conventions). Central to the MA design is a
common conceptual framework (MA 2003) that describes the relationships between
ecosystems and their services, human well-being and poverty reduction, and direct and
indirect drivers of ecosystem change. Within the framework there are opportunities for
responses: strategies and interventions that can halt, reverse, or otherwise change these
relationships. A critical aspect of the MA’s work is to identify features of responses that cause
them to succeed or fail and to ultimately give guidance to decision-makers for choosing
among response options.
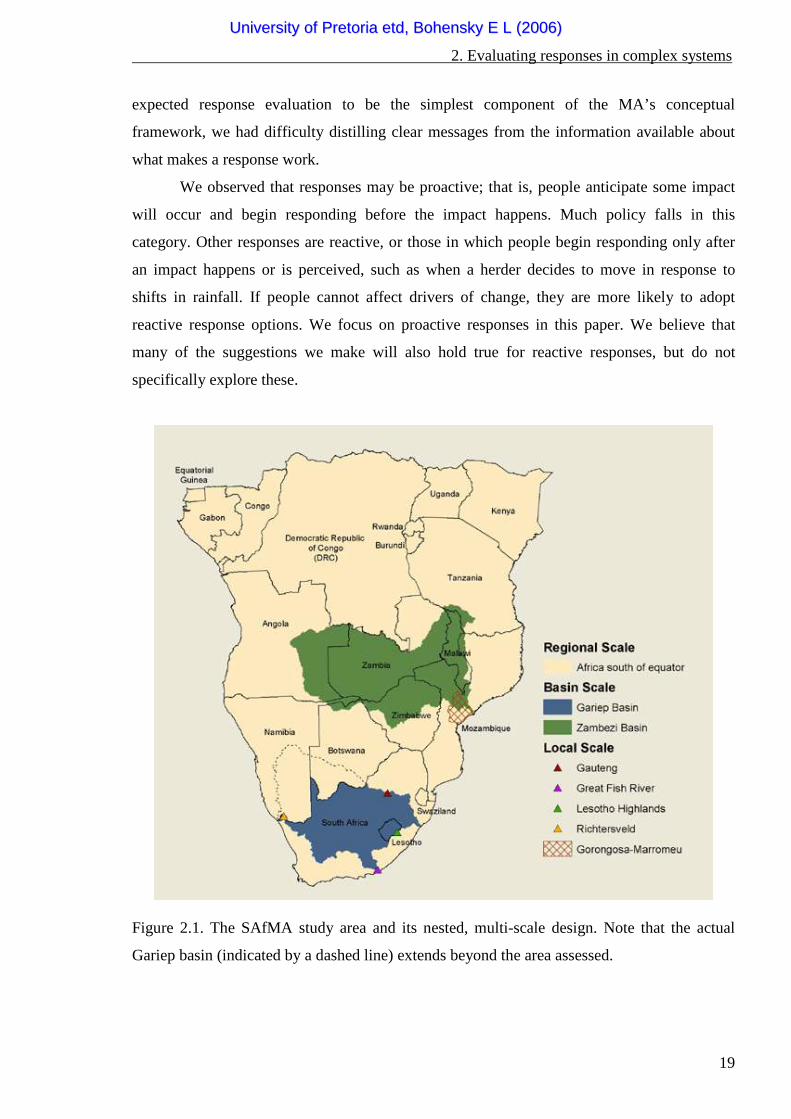
The Southern African Millennium Ecosystem Assessment (SAfMA) is one of
approximately 30 sub-global assessments linked to the MA. Using the MA framework,
SAfMA evaluated southern African ecosystems and the ways in which they support human
societies. SAfMA consists of the following partially-nested assessment components: a
regional assessment of nineteen countries of mainland Africa south of the equator; two river
basins, the Gariep and Zambezi; four local assessments located within the Gariep basin; and a
local assessment of the Gorongosa-Marromeu, Mozambique region in the Zambezi basin
(Figure 2.1).
The SAfMA teams generally used two approaches to assess responses: at coarser
scales (regional and river basin) we reviewed past and present responses, and at local scales
we used interactive processes with stakeholders to elicit information about responses used or
likely to be used in alternative future worlds depicted by scenarios. Although many of us had
UUnniivveerrssiittyy ooff PPrreettoorriiaa eettdd,, BBoohheennsskkyy EE LL ((22000066))
2. Evaluating responses in complex systems
19
expected response evaluation to be the simplest component of the MA’s conceptual
framework, we had difficulty distilling clear messages from the information available about
what makes a response work.
We observed that responses may be proactive; that is, people anticipate some impact
will occur and begin responding before the impact happens. Much policy falls in this
category. Other responses are reactive, or those in which people begin responding only after
an impact happens or is perceived, such as when a herder decides to move in response to
shifts in rainfall. If people cannot affect drivers of change, they are more likely to adopt
reactive response options. We focus on proactive responses in this paper. We believe that
many of the suggestions we make will also hold true for reactive responses, but do not
specifically explore these.
Figure 2.1. The SAfMA study area and its nested, multi-scale design. Note that the actual
Gariep basin (indicated by a dashed line) extends beyond the area assessed.
UUnniivveerrssiittyy ooff PPrreettoorriiaa eettdd,, BBoohheennsskkyy EE LL ((22000066))

2. Evaluating responses in complex systems
20
We found it helpful to develop our own simple framework to address the focal
question of what makes a response effective, which we then applied to the real-world example
of water management based on the SAfMA experience. Below we describe the framework,
demonstrate its utility by evaluating responses used to manage water in two southern African
river basins, and then suggest simple guidelines for designing effective responses.
A FRAMEWORK FOR RESPONSE EVALUATION
We construct our framework for response evaluation with three inter-connected
components, which we call scopes of impact, awareness, and power. The impact scope is the
spatial and temporal domain in which an impact occurs - who or what is impacted, where,
when, and for how long. The same impact situation can affect different groups or locations
differently, either in space, in time, or both. Climate change, for example, is expected to make
some areas of southern Africa better suited to grain production and other areas worse (Jones
and Thornton 2003).
The second component of our framework for response evaluation is awareness. People
respond to actual or perceived changes in some matter of consequence to them. They will not
deliberately respond to a change unless they are aware of it. It must first register on their
conscious or unconscious minds. We differentiate between two major elements of awareness.
The first is awareness of the consequences or impacts of a change. This often encompasses
awareness of a state, such as the amount of water in a stream, or trend, such as a decrease in
this amount over time. The second element is an awareness of the direct and indirect drivers
of the observed or expected change. Unless people are aware that increased anthropogenic
CO2 emissions cause changes in the global temperature, and that changes in temperature can
change ecosystems that they depend on, they cannot understand why certain preventative
actions are required to curtail these emissions. In both instances, we use the term awareness to
reflect a reasonably true state of knowledge, characterized by useful degrees of accuracy and
of precision. Inaccurate or imprecise awareness by this definition has little utility and is
therefore at least as bad as being unaware, and possibly worse. Awareness in a complex
system implies learning. As the system changes, new drivers and conditions emerge.
Awareness must be sufficiently flexible to incorporate these changes through learning.
People will often seek to capture the benefits of a response while transferring the costs
or disservices elsewhere in time or space. For example, a government’s decision to construct a
dam to capture the benefits of cheap hydroelectric power transfers ecosystem disservices,
UUnniivveerrssiittyy ooff PPrreettoorriiaa eettdd,, BBoohheennsskkyy EE LL ((22000066))
2. Evaluating responses in complex systems
21
such as reduced fisheries production or reduced alluvial deposition for riverbank agriculture,
and consequent disruption of livelihood systems, to people living downstream or to future
generations. Awareness is therefore a broader concept than we have initially portrayed it. For
responses to be effective, there must also be an awareness of cross-sectoral and cross-scale
(spatial and temporal) trade-offs. This requires a great deal of knowledge about, and
sensitivity to, a response’s implications for all sectors of society.
The third component of our framework is power. People may be aware of an impact,
such as reduced streamflow, and be aware of its direct cause (a decrease in rainfall) and
indirect cause (anthropogenic climate change). They may not be able to alter these factors,
however. For example, responses identified by rural villagers in central Mozambique to two
scenarios of the future were all reactive (Lynam et al. 2004). This is a key observation. Poor
people perceive themselves to be largely powerless to influence the major processes that
govern their livelihoods, and indeed they often are. Powerlessness is not unique to the poor,
however; affluent people may be able to do little more than rural villagers to affect climatic
processes. The resilience of livelihoods is enhanced by having a wide set of response options,
both reactive and proactive. Choice counts and power expands choice.
Power, like impacts and awareness, is seldom symmetrically distributed in time or
space or among actors. Power tends to accumulate upwards through hierarchical structures;
hence, people can often only indirectly influence large-scale causal processes through
cumulative expressions of individual wishes through political or economic mechanisms, such
as elections or markets. These mechanisms can be slow or dominated by individuals and
societies elsewhere with different problems and needs. Responses are often lagged, such that
their effects are only felt long after the causal factors have been alleviated. This can result in
system over- or undershoots as lagged responses try to correct historical deviations from
desirable states. The asymmetry of power has an important implication: there will always be
trade-offs between the different needs or desires of different social groups. Mechanisms that
influence power distribute benefits and costs and hence define winners and losers. Future
generations are often the losers (and sometimes the winners) by default, as they have virtually
no control over current responses.
We suggest that when impacted people are fully aware of the consequences and causes
of a change and they have the power to alter the processes driving these changes, they have a
good chance of selecting and implementing effective responses. We refer to this situation as
congruence, or overlap, among the impact, awareness, and power scopes (Figure 2.2a). When
UUnniivveerrssiittyy ooff PPrreettoorriiaa eettdd,, BBoohheennsskkyy EE LL ((22000066))

2. Evaluating responses in complex systems
22
these components are incongruent or non-overlapping (Figure 2.2b), we suggest that the
chances of effective responses being identified and implemented are reduced.
Identifying an effective response to a problem in complex adaptive systems can be
difficult because impacts, awareness, and power are dynamic. Impacts are not uniformly and
simultaneously experienced everywhere by everyone, and responses will emerge at different
scales in space and time. A flood wave that inundates the Zambezi Valley is first experienced
in the upper reaches, then the lower, and then is felt indirectly by the adjacent communities
Figure 2.2. a) Impact, awareness and power scopes are nearly congruent. b) Impact,
awareness and power scopes are highly incongruent.
who absorb the refugees, and perhaps finally by the national government when budget lines
are shifted to relief efforts. Local people alter their behaviour immediately by moving from
the flood zone. District, provincial, national, and international administrators and relief
agencies mobilize resources to support the affected people.
Over time the impact continues, but becomes more like a ripple from a stone dropped
in a pond. Once the immediate needs are addressed with reactive responses, policy makers
begin to develop proactive responses, such as the design of new monitoring systems and
agencies. Downstream, people seek assistance to rebuild houses and livelihood systems
destroyed by the flood. New plans are formulated to improve the dam management so that the
flood cannot happen again, new flood early warning systems are installed, and regional
UUnniivveerrssiittyy ooff PPrreettoorriiaa eettdd,, BBoohheennsskkyy EE LL ((22000066))

2. Evaluating responses in complex systems
23
cooperative linkages are improved to better coordinate flood releases. There is new learning,
both social and ecological (new channels are gouged from the river bed), resulting in new
awareness, which institutions quickly try to capture. Then slowly the impact and its memories
begin to fade as other priorities and concerns take center stage. Just as the impact ebbs and
flows spatially and temporally in the wake of the flood event, so too do awareness and power.
Power generally shifts much more slowly, if at all. As new agencies for cooperation are
formed, new powers are created or old ones transformed. With each response, a new
configuration of impacts, awareness, and power takes shape. The stage is set for another
performance.
In what follows we apply the framework in an exploration of historical and current
responses to manage water in the Gariep and Zambezi River basins, and seek lessons from
this framework in understanding responses in complex adaptive systems.
WATER MANAGEMENT IN SOUTHERN AFRICA: RESPONSE THEATRE IN
PROGRESS
Southern Africa is characterized by high climatic variability, an uneven spatial and temporal
distribution of runoff, and a history of attempts, with varying success, to compensate for an
unpredictable water supply. Water issues in this region are now being cast in a new light,
illuminating the essential challenge to balance the preservation of ecological integrity and the
achievement of social and economic development objectives. Several countries are reforming
their water law, and are increasingly decentralizing management or forming new institutions,
often across national boundaries. This shift has not been universal, however, and water-
related problems are expected to persist in some areas, especially where competition for water
is fierce and institutions are weak. The result is a temporal and spatial mosaic of water
management systems that presents a unique case for evaluating responses across various
temporal and spatial scales and socio-economic conditions.
The two river basins that SAfMA assessed are different pieces of this mosaic (Table
2.1). The Gariep is water-stressed (Falkenmark and Widstrand 1992), with the small
mountainous region of Lesotho and South African Drakensberg highlands contributing
significantly to the basin’s runoff through a series of ambitious diversions of water to the
major South African demand centers. The Zambezi, by contrast, is endowed with a relative
abundance of water. The Gariep basin contains one of the greatest concentrations of wealth
UUnniivveerrssiittyy ooff PPrreettoorriiaa eettdd,, BBoohheennsskkyy EE LL ((22000066))

2. Evaluating responses in complex systems
24
Table 2.1. Characteristics of the Gariep and Zambezi basins.
on the African continent, Gauteng Province (which includes the Johannesburg and Pretoria
metropolitan areas), while the eight nations that share the Zambezi are among the poorest in
the world. Human well-being as reflected by the human development index (UNDP 2003) is
on average higher in the Gariep than the Zambezi. These characteristics are indicative of the
enabling conditions and binding constraints for possible responses - the realities on the
ground at a given moment that either allow or prohibit people from adopting responses that
are sustainable.
Each societal response to the problem of water availability can generally be described
as falling into one of three categories: supply augmentation, conservation, and allocation
(Molle 2003). Supplies are augmented, for example, by constructing storage dams and
reservoirs or diverting water from within or across basin boundaries. Conservation strives for
increased efficiency of use of existing water resources. Allocation refers to the redistribution
of water from one user or sector to another to alleviate some of the total pressure on water
resources. As a consequence of the actual or perceived decreasing abundance of water
resources over time, initial responses to water management are typically supply-side strategies
Area
(square
kilometers)
Shared by: Mean
Annual
Runoff
(millions of
cubic meters
per annum)
Per Capita Water
Availability
(cubic meters per
person per
annum)
Human
Development
Index
Gariep 1,039,266 Botswana,
Lesotho, Namibia,
South Africa
15,957 1,125 All medium-
development
nations (rank 111th
to 137th).
Zambezi 1,234,000 Angola, Botswana,
Malawi,
Mozambique,
Namibia, Tanzania,
Zambia, Zimbabwe
110,000 >10,000 All low-
development
nations except
Botswana, Namibia,
Zimbabwe (rank
124th to 170th).
Source: Watson, pers. comm. (Gariep); Snaddon et al. 2000 (Zambezi area, mean annual runoff); Revenga
et al. 1998 (Zambezi per capita water availability).
UUnniivveerrssiittyy ooff PPrreettoorriiaa eettdd,, BBoohheennsskkyy EE LL ((22000066))

2. Evaluating responses in complex systems
25
(augmentation), followed, if possible, by a shift to demand-side strategies (conservation and
allocation).
The development of water resources in the Gariep basin exemplifies the typical
progression from supply-side to demand-side responses. By contrast, the Zambezi basin,
which has more water and less demand for it, has not undergone the same progression, but
still may. Whether a river basin progresses through this trajectory – essentially, how water-
related problems are dealt with - depends on what Ohlsson and Turton (2000) call a “ turning
of the screw” between a first-order scarcity of water and a second-order scarcity of the social
resources required to successfully adapt to the first-order scarcity. Within the Gariep basin,
first-order scarcity is high, but second-order scarcity is relatively low, due to the management
capacity that exists in South Africa, in which most of the basin lies. In the Zambezi, first-
order scarcity is low but second-order scarcity is fairly high due to the limited social resources
and therefore capacity to employ a range of responses to address water-related problems.
Despite these differences between the Gariep and Zambezi, the responses selected to
manage water in these two basins were initially similar, and have only begun to diverge more
recently.
The “ get more water” era
Until the mid-1900s, the focus of water management in most southern African countries, apart
from securing the relatively small amounts needed for municipal and domestic use, was on
increasing or stabilizing supplies for irrigation. South Africa’s shift in the middle of the last
century from an irrigation-centered water policy to one based on a more diversified economy
is reflected in its passage of its 1956 Water Act, which repealed its Irrigation and
Conservation Act of 1912. While irrigation continues to consume the majority of total
available runoff (currently more than 60% in the Gariep basin), in South Africa the
contribution of agriculture to GNP is small (less than 5%) relative to the mining,
manufacturing, and services sectors.
For the purposes of this paper we unite these two phases into a single era in which
“getting more water” (Dent 2000) was of prime concern and was addressed through supply-
side responses that tended to favor the agricultural and, later, industrial sectors. In South
Africa, this was achieved through a centralized system of management, informed by science
that resided largely in state departments, and with laws that put water-related decision-making
in the hands of the state and private landowners. Throughout the region, variable and
UUnniivveerrssiittyy ooff PPrreettoorriiaa eettdd,, BBoohheennsskkyy EE LL ((22000066))

2. Evaluating responses in complex systems
26
unpredictable river flows were dealt with largely through technical responses, leaving a
legacy of imposing structures across the landscape as physical evidence of the prevailing
mindset of the time.
In the Gariep basin, the Orange River Development Project (ORDP) commenced in
1962 and included South Africa’s two largest dams and a major inter-basin transfer scheme.
Built primarily to secure water supplies for the commercial agricultural sector, the power base
of South Africa’s then-ruling National Party, the ORDP was also intended to strengthen the
party’s apartheid regime as it faced increasing internal and international resistance. The
Lesotho Highlands Water Project (LHWP), a joint undertaking by South Africa and Lesotho
to supply water to the former and electricity to the latter, is the most recent of the region’s
major dam projects. Envisioned when initiated in 1986 to have five dams (second in size only
to China’s Three Gorges), the LHWP was eventually scaled down considerably at least in part
due to the realization that initial water demand forecasts were too high and supplies too low
(Klasen 2002). In the Zambezi, the World Bank-backed Kariba dam was completed in 1959
on the border between Zambia (then Northern Rhodesia) and Zimbabwe (then Southern
Rhodesia) to supply power to the region’s growing copper mines and manufacturing
industries after World War II. Construction on the Cahora Bassa dam began in the 1960s;
when completed in 1975 it enabled the Portuguese colonial government in Mozambique to
produce hydropower for sale to South Africa.
This focus on augmenting water supplies or services such as hydropower succeeded in
improving human well-being for some members of society. Improvements in the Gariep
included significant economic and social benefits in the form of increased water supply,
agricultural production, flood protection, hydropower, and employment (WCD 2000b). In the
Zambezi, the Kariba dam encouraged tourism to the lake and a significant kapenta fishery,
both providing employment. Reliance on coal-fired electricity was alleviated, and the cost of
electricity in the area served by the Kariba and Kafue dams decreased by about 30% in the
period 1961–1977, even as the average price for other commodities and services rose by more
than 75% during the same time (Soils Incorporated 2000).
However, these responses also had several serious negative consequences. These
include the social impacts such responses had on communities (especially but not exclusively
poor ones), particularly the tens of thousands of individuals who were displaced or resettled to
more marginal lands without consultation, and with little or no compensation (Isaacman and
Sneddon 2000, Soils Incorporated 2000, Thabane 2000, WCD 2000b). This was particularly
acute in projects executed under colonial or apartheid regimes due to the social and political
UUnniivveerrssiittyy ooff PPrreettoorriiaa eettdd,, BBoohheennsskkyy EE LL ((22000066))

2. Evaluating responses in complex systems
27
acceptability of relocating people as the state saw necessary to achieve project objectives. As
such practices had become internationally unpopular by the time the LHWP was built,
affected people were compensated for losses, in a process that has begun to bring the realities
of some of the social and environmental impacts, typically externalized, of large dam projects
to bear on their overall economic viability. Despite these major investments in water
resources, the distribution of benefits has remained highly skewed, accruing more to
commercial farmers, distant cities and tourists than to the residents in the vicinities of these
projects (Soils Incorporated 2000). Where rural people have lacked access to formal water
services, they have relied on direct withdrawals from rivers for domestic use and livestock
watering, putting undue pressure on rivers and riparian zones (Motteux 2002).
An additional problem with responses aimed at augmenting water supplies in the
southern African region, as elsewhere, is that their potential effects on ecosystems were
ignored in the planning and implementation processes. This resulted some time later in
ecosystem degradation and transformation that reached disastrous proportions in some places.
Along the lower Gariep River, a pest blackfly (Simulium chutteri) infestation erupted after the
flow regime was changed by the ORDP (Chutter et al. 1996), costing the agriculture sector an
annual R88 million (equivalent to 14.7 million 1998 US dollars) in livestock productivity
losses and another R2 million (330,000 1998 US dollars) in annual control costs (WCD
2000b). The potential impacts of the project on water quality were overlooked at the onset
despite warnings, causing an unexpected surprise when salinity levels suddenly increased
after water began traveling through the Orange-Fish tunnel (Herold 1992). In the Zambezi,
the Kariba and Cahora Bassa dams have had deleterious effects on downstream ecosystem
services. These include morphological changes in the river and floodplain, disrupted sediment
and nutrient flows, widespread encroachment of woody savanna onto the herbaceous
floodplain in the Marromeu wetland complex, a 40% loss of mangroves and coastal erosion.
Wetlands have been disconnected from the main channel of the Zambezi, disturbing bird and
fish habitat, with a 60% reduction in prawn catch rates attributed to the decline in runoff
between 1978 and 1995 (Davies et al. 2000).
The planning of large dams during this era was often flawed because of inadequate
public participation and inappropriate project timelines. The political expediency of the
ORDP’s authorization made detailed planning impossible and even cursory impact
assessments implausible; yet in fact, the project experienced unanticipated delays and cost
three times more than its initial budget – rising from a projected US $571.3 million (in 1998
US dollars) in 1962/3 to US $2313.7 million when completed (WCD 2000b). In some
UUnniivveerrssiittyy ooff PPrreettoorriiaa eettdd,, BBoohheennsskkyy EE LL ((22000066))

2. Evaluating responses in complex systems
28
projects, the laws and procedures in existence at a project’s inception had changed, sometimes
radically, by the time of its completion. In the LHWP, an environmental impact assessment
for downstream effects was only conducted retroactively after the first dam was in operation
(LHDA 2002).
Lastly, the focus on supply augmentation created an illusion of abundant water
resources, and obscured the signs that the natural limits of the water supply were being
rapidly approached, even as droughts devastated parts of southern Africa during the 1980s
and 1990s. In 1995, such a drought led water managers in Gauteng Province to restrict water
use unless major rain events occurred during the following summer. The rains came, and
restrictions were lifted. By implementing a very localized, short-sighted response, a potential
signal to curb water losses was ignored and an opportunity to better manage water demand
was lost (Snaddon et al. 1998).
Cumulative storage dam capacity in South Africa increased steadily from 1900 to
1975 and then increased sharply between 1975 and 1990 (Figure 2.3), appropriating an ever
larger share of the total freshwater supply. Only in the 1990s did growth slow significantly as
a result of the saturation of available dam sites, along with the increasing acceptance by water
managers that there was little water left to allocate, and that the actual cost-benefit ratios of
large dam projects were rarely as low as originally projected.
The “get more water” era was characterized by high-cost, technical responses to
problems of water scarcity in the Gariep and the supply of cheap energy in the Zambezi, and
had similar effects despite the different characteristics of these river basins. These responses
emerged in the age of “control thinking:” everything could be effectively controlled to
achieve clearly defined objectives. The world was seen to be a linear, reducible system that
could be fully understood, but in fact, awareness was highly limited in that the impacts of
these responses on livelihoods and ecosystems were underestimated or simply ignored.
Certain individuals recognized these problems, of course, but were unable to motivate the
majority to act. Impact, awareness, and power were seldom, if ever, congruent. The result was
that the water management responses of the time often created new problems by attempting to
solve old ones without contemplating their possible effects across space and time.
UUnniivveerrssiittyy ooff PPrreettoorriiaa eettdd,, BBoohheennsskkyy EE LL ((22000066))

2. Evaluating responses in complex systems
29
Figure 2.3. Water supply augmentation, illustrated by cumulative storage dam capacity in
South Africa from pre-1900 until 1997 (ALCOM 1999).
We should not expect, in a complex system, to fully understand system functioning or
to be able to predict system behavior with meaningful certainty. Responses need to be
designed that are cognizant of this recognition. We can never have enough data (Johannes
1998), but awareness needs to be distributed across all scales and sectors of the system. In
South Africa, the state’s control of water-related research effectively obliterated the potential
contributions to the collective knowledge base of local communities - often the first to detect
a problem because they are closest to it. Communities in the Great Fish River valley of South
Africa, for example, have been tacitly monitoring water quality during the past four decades
as part of their daily use to determine whether silt levels in runoff from cattle dips are within
acceptable limits (Shackleton et al. 2004). With no effective means for transmission of this
information upward, however, local knowledge remains in the community and is unable to
influence the causal processes operating at higher levels.
The “ some, for all, forever” era
In the late 1980s and early 1990s, data became available from South African monitoring
programs that revealed the long-term trend of deterioration of water resources and aquatic
ecosystems (MacKay 2003). As the limits of the supply augmentation responses of the past
UUnniivveerrssiittyy ooff PPrreettoorriiaa eettdd,, BBoohheennsskkyy EE LL ((22000066))

2. Evaluating responses in complex systems
30
were increasingly exposed, the need for a new approach to water allocation became urgent. In
1994, apartheid and minority rule ended in South Africa. The country’s transition to
democracy presented a unique opportunity to reform its 1956 water policy in order to better
reconcile its resources with the needs of its people, environment, and economy. This marked
the onset of a new paradigm in the water sector, in which the emphasis of water provision
quite rapidly broadened to encompass the needs of society in its entirety and ecosystems.
Financing for water management was to be achieved by full cost-recovery from users rather
than from government subsidization. Decision-making moved from a technocratic to
participatory arena where pertinent issues could be collectively addressed.
The paradigm shift that occurred as a result of democratic elections and the increased
awareness of changes in water quality and quantity was marked by a realignment of the
impact, awareness, and power scopes. The power and awareness scopes were brought into
greater congruence with the impact scope, providing opportunities for developing effective
responses.
The transition from the supply augmentation to the allocation phase has been most
apparent in South Africa. Its 1998 Water Act, among the world’s most progressive, is founded
on the principles of equity, sustainability and efficiency – its overarching goal to provide
“some, for all, forever” (MacKay 2003). Noting the needs to redress the inequality of access
to water created by past discrimination as well as to provide for future generations, the law
promotes equity by its definition of water as a basic human right and guarantees provision of
25 liters per day of safe water within 200 meters of the home to all South Africans. It
promotes sustainability by protecting aquatic ecosystems through ecological reserve
requirements, or environmental flows, and resource protection measures. Efficiency is
promoted through licensing and pricing strategies designed to allow water to be allocated to
the uses of highest value (DWAF 2002). The water designated for basic human needs and
environmental needs define a legally recognized “Reserve” which has the highest allocation
priority. Since its passage, equity has clearly improved: in 1998, 12 million people were
without any access to formal water services and 21 million lacked sanitation (King and Louw
1998). Currently, these numbers have decreased to about five million and 16 million,
respectively, and are steadily dropping (DWAF 2004).
The equity and sustainability issues highlighted in the South African legislation have
also surfaced in the Zambezi, where several of the nations that share this basin are currently
reforming their water policies or institutions to incorporate principles of environmental and
social sustainability (Scholes and Biggs 2004). The deteriorating state of the Zambezi delta
UUnniivveerrssiittyy ooff PPrreettoorriiaa eettdd,, BBoohheennsskkyy EE LL ((22000066))

2. Evaluating responses in complex systems
31
and its wetland ecosystems as a result of the changed flood regime from the two major dams
and their implications for the livelihoods of delta inhabitants have led Mozambican and
international scientists to negotiate for rehabilitation measures (Beilfuss and Davies 1998).
The recent declaration of the delta’s Marromeu complex as a Ramsar Site (a Wetland of
International Importance as defined by the Ramsar Convention on Wetlands) may facilitate
the process, though to a large degree the many governments managing this basin lack the
institutional mechanisms at present to implement the necessary measures.
New institutions for water management
As water management moved into the allocation phase in South Africa, it became clear that
the existing Department of Water Affairs and Forestry (DWAF) and its policies did not
support public participation in decision-making. Rather, the new thinking about water
management embraces the idea that natural resources are most effectively managed when
responsibility is shared with democratic local institutions, which presumably have detailed
and key information about the resources and are more easily held accountable to local
populations (Ribot 2002).
The South African Water Act of 1998 mandates the establishment of nineteen
statutory bodies called catchment management agencies (CMAs) to govern water resources in
conjunction with locally-elected boards that represent a wide range of stakeholders (DWAF
2002). Each CMA is responsible for a water management area that corresponds with major
catchment boundaries, for which it can license water users and establish charges for different
uses of water, the revenues from which will fund the CMA’s management activities. The
CMA will also be responsible for implementing the appropriate resource protection measures
in order to meet the requirements of the ecological reserve. This decentralizes decision-
making in the water sector, and while the national agency, DWAF, remains the custodian of
South Africa’s water resources and oversees its national strategy, the authority to execute the
strategy will increasingly lie with the CMAs and local institutions within the catchment.
It is uncertain at this time if the CMAs, which are to be fully functioning in the next
five to ten years, will be able to successfully implement the new policies. Few areas within
the Gariep basin are expected to have the capacity to carry out their functions in the near term.
Of concern is that they are being charged with both the allocation of water and protection of
the resource in their catchment, two not necessarily compatible tasks that were never before
administered by a single authority (Rogers et al. 2000). In such a situation, more powerful
UUnniivveerrssiittyy ooff PPrreettoorriiaa eettdd,, BBoohheennsskkyy EE LL ((22000066))
2. Evaluating responses in complex systems
32
interests within the CMA may be able to bring the impact and power scopes out of
congruence, or, by manipulating information, may constrain the awareness of those in the
impact scope.
Whether the CMAs will provide a successful mechanism within South Africa’s
broader legal environment for contesting water use is also unknown. An independent Water
Tribunal can hear and adjudicate appeals against certain decisions concerning water
allocation, and further appeals can be made to the High Court, although the Reserve and some
resource protection measures cannot be contested once established (MacKay 2003). The
Water Act is designed so that in principle, a CMA cannot negatively impact the water
resources of another, thus securing the needs of downstream catchments. However, the Water
Act only gives CMAs the authority to manage surface and ground water, while activities that
occur on land are the jurisdiction of other agencies (MacKay 2003). This may leave room for
loopholes in the application of the law, and introduces a further source of incongruence
between the impact and power scopes. What may be more likely is that power will revert to
the centralized model if the CMAs are unable to carry out their functions successfully.
Regional cooperation
While some functions of water management are being devolved to a finer scale, others are
evolving to address problems that pervade large river basins spanning international
boundaries. These issues are frequently rooted in the complexities of hydropolitics (Turton
2002), and thus the co-management of international river basins usually requires the
establishment of bi- or multi-lateral institutions. Previously, the water security of one nation
was often assured by compromising that of another (usually downstream or institutionally
weaker) nation. Today, regional river basin management institutions, or river basin
organizations (RBO) are increasingly being established on the premise that water insecurity
threatens the development capacity and hence political stability of the greater region. Turton
(2003) observes that one function of an RBO is to create convergence of ideas around a
common security and reduced uncertainty for all member states. This is largely achieved
through the sharing of data, a common set of rules, and a formal agreement for conflict
resolution - a broadening and sharing of awareness and power to collectively manage
common impacts.
Several legal and institutional frameworks support regional cooperation. The SADC
Protocol on Shared Water Course Systems, last revised in 2003 and ratified by all of the
UUnniivveerrssiittyy ooff PPrreettoorriiaa eettdd,, BBoohheennsskkyy EE LL ((22000066))

2. Evaluating responses in complex systems
33
Gariep and Zambezi states except Angola, is a legal instrument for achieving the development
goals of the water sector. While the protocol requires that joint management mechanisms be
established, it does not explicitly suggest how this should be done. Thus, a range of RBOs
exists in southern Africa, with each operating under a unique set of rules. In the Gariep basin,
the Orange-Senqu River Commission (ORASECOM) established in 2000 by South Africa,
Lesotho, Botswana, and Namibia, is intended to provide a forum to discuss technical matters
related to the mutually-shared resources of the basin states. It does not, however, take
precedence over the national legislation of each country or existing bilateral protocols, and is
not yet recognized as an established international water management body by the South
African Water Act (DWAF 2002).
The Action Plan for the Environmental Management of the Common Zambezi River
System (ZACPLAN) was initiated in 1987 with the support of donor governments, but was
stalled when it was taken over in 1995 by SADC’s new water sector, after which time
confusion regarding ownership of the process delayed project preparation. A new plan,
ZACPRO, has since been launched with the aim of achieving development objectives based
on secure water supplies, but fundamentally needs to first establish an enabling environment
and build capacity to execute the plan (Granit 2000), which is apt to further delay any real
action. Despite years of discussion and meetings, the emphasis on cooperation of agencies
managing the Zambezi River has had little apparent effect, even as many warnings of the
ecological and social consequences of dam construction that were ignored over the past
decades have now come to fruition (Davies et al. 2000).
The barriers faced by RBOs are in some ways similar to those the CMAs may
confront. First, power among stakeholders is likely to be asymmetrical, due to the great
diversity of socioeconomic characteristics and management systems among basin states.
States with weak economies and limited capacities to manage water usually have less
bargaining power. In addition, there is no guarantee of adherence to principles of SADC
treaties that are not embedded in national laws (SARDC 2001). The latter are likely to differ,
sometimes irreconcilably, between members. In these cases a mechanism for the impact scope
to influence the power scope is absent and the power of the regional institutions is
constrained.
The degree to which regional cooperation succeeds may depend on the extent to which
a paradigm shift similar to that witnessed in South Africa emerges in the larger southern
African region. The negative impacts of Kariba and Cahora Bassa dams on the delivery of
ecosystem services predicted decades ago may eventually motivate a management change in
UUnniivveerrssiittyy ooff PPrreettoorriiaa eettdd,, BBoohheennsskkyy EE LL ((22000066))

2. Evaluating responses in complex systems
34
the Zambezi basin that encompasses multiple objectives and stakeholders. What seems clear
is that a sustainable course of water management in southern Africa will need to evolve
against a backdrop of increasing regional integration. Water resources could potentially serve
as an integrating link, through concepts such as “virtual water.” In this model, water-intensive
commodities such as grain (approximately 1000 cubic meters of water are required to produce
one ton of grain) are produced by countries with low water stress, such as Zambia or Angola,
for export to a water-scarce country such as South Africa or Namibia, freeing it to allocate its
water resources to higher-efficiency uses. Virtual water trade has significant economic
benefits for the importer, as seen in other areas of the world where it occurs (Allan 2002).
This model is not yet viable for southern Africa as a region, however, due to many countries’
current lack of technical capacity and political stability and their reluctance to relinquish self-
sufficiency and national security to a regional body. The idea of regional cooperation should
be to foster a collective security while simultaneously giving each member state sufficient
flexibility in determining its goals and how to achieve them, thus preserving the variability,
and hence resilience, of the regional water mosaic. This highlights the need for certain
elements of regional management to be agreed upon at a regional scale but others to be
tailored to unique conditions at as local a scale as appropriate and possible.
As lessons learned from other systems reveal, crises in social-ecological systems often
occur at the intersection of large-scale processes and changing local variability, as local
problems cascade up to higher levels (Gunderson et al. 2002). This is why institutions at
different scales such as those we describe here need to communicate and exchange
information with one another, especially as southern African people and institutions find
themselves responding increasingly to novel regional changes in climate, global markets, and
political initiatives, but which affect them locally. Information needs to flow not only from
the top to the bottom, but also in the reverse direction. The monitoring routinely done by
communities can provide important early-warning data, but the exchange of information
between local and higher-level institutions cannot happen if they operate independently as
they have traditionally done. The institutional arrangements that are apt to produce the most
effective responses may entail multi-subsidiarity, whereby local organizations, CMAs, RBOs,
and national ministries collectively work towards a common end.
UUnniivveerrssiittyy ooff PPrreettoorriiaa eettdd,, BBoohheennsskkyy EE LL ((22000066))

2. Evaluating responses in complex systems
35
Integrated responses
Increasingly, the sectoral approach to natural resources management of the past is being
replaced by the adoption of responses that are integrated across ecosystem service sectors.
Integrated Water Resources Management (IWRM) is an internationally recognized framework
in which policies and practices address the linkages between water, land, and environmental
resources though the hydrological cycle (DWAF 2002).
One of the most notable integrated responses in the region is the Working for Water
Programme in South Africa, a multi-agency intervention to combat the spread of invasive
alien plants, which consume approximately 3300 million cubic meters (seven percent) of the
country’s total mean annual runoff and are expected to become an increasing threat in the
future (Le Maitre et al. 2000). By hiring previously unemployed individuals to clear and
eradicate invasive alien plants, Working for Water addresses the multiple objectives of water
conservation, ecosystem rehabilitation, and poverty relief through job creation and the
development of secondary industries from products made from the cleared alien species.
Through its high visibility and public campaigns, the program has raised awareness about
alien plants and water conservation among its employees, their communities, and a broad
spectrum of society, and has stimulated research on invasive alien plants in the scientific and
engineering communities (Görgens and van Wilgen 2004).
The Working for Water program had an initial budget of R25 million in 1995/6, which
increased to R442 million in 2003/4 due to the program’s success over the years (Marais et al.
2004). It is currently funded through special poverty relief funds, but eventually these costs
are to be recovered from the water resources management charges imposed on users as
specified by the Water Act. By the end of 2003, the clearing of almost 1.2 million hectares of
alien vegetation by the 24,000 people employed by the program was estimated to yield water
benefits of between 50-130 million cubic meters a year (Görgens and van Wilgen 2004).
Several cost-benefit analyses in South Africa suggest that clearing is a cost-effective approach
to eradicating invasive alien plants in terms of water resources (Görgens and van Wilgen
2004), though costs tend to be overestimated and benefits underestimated and highly
discounted because they often emerge only in the long term (Turpie 2004).
The Working for Water program is probably the best example of an effective response
according to our framework: it empowers and increases the awareness of the impacted
population. It also fits our original definition of “effective” : the program’s mechanisms for
maintaining social and ecological resilience are mutually reinforcing, because a synergy is
UUnniivveerrssiittyy ooff PPrreettoorriiaa eettdd,, BBoohheennsskkyy EE LL ((22000066))

2. Evaluating responses in complex systems
36
created between social development (job creation/poverty relief) and preservation of
ecological integrity (alien eradication, restoration of hydrological flows, and improved
production potential of land). By freeing water resources for other uses, the initiative also has
the potential to yield significant economic benefits over the longer term.
DISCUSSION
The congruence of impacts, awareness, and power is at the heart of the “some, for all,
forever” concept. This concept is realized through an awareness based on widely-distributed
(cross-sectoral and cross-scale) information, power decentralization and cooperation through
the development of new institutions, and effective mechanisms for influencing power at
different scales. While our framework suggests that this is indeed the situation most
conducive to developing effective responses, our application of the framework to water
management in southern Africa reveals several caveats.
First, ecological, economic, and even social processes (which relate to impact) rarely
conform to administrative structures or scales (which relate to power). Some southern African
experiments in distributing power, such as Community Based Natural Resource Management
(CBNRM), have failed when power is maintained at specific scales (Fabricius et al. 2001).
Cross-scale and cross-sectoral institutional interactions come with high transaction costs –
line ministries and managers are accountable to their ministers and agencies first; cooperation
is an afterthought. We have noted that the new water management institutions may encounter
similar problems.
Second, in some instances, responses of previous eras severely constrain the response
options available for the current era. The hydrological flow regime created by the Cahora
Bassa dam over the past few decades has been one of controlled and constant low-level flows.
Gone are the huge floods of the past. One consequence of this has been that people have
moved into areas of the Zambezi Delta floodplain that formerly would have only been safe for
temporary house construction or limited agricultural development. Recent attempts to restore
a more natural flood regime for the Zambezi (Beilfuss and Davies 1998) are constrained by
the developments on the floodplain which would require expensive movements of people and
infrastructure and could even result in loss of life. In the Gariep basin, operating costs of
infrastructure built by previous governments deplete funds that could have been invested in
demand-side initiatives and basic service provision. The list of foregone opportunities is long.
UUnniivveerrssiittyy ooff PPrreettoorriiaa eettdd,, BBoohheennsskkyy EE LL ((22000066))

2. Evaluating responses in complex systems
37
Third, a distribution of power does not necessarily mean a distribution of awareness,
although we suspect the latter would follow from the former. Awareness, in a multi-scaled
system created through power devolution, means a distributed capacity to learn as well as
mechanisms to transfer lessons, knowledge, or information across scales. The development of
these mechanisms is likely to lag significantly behind power transfers, which tend to follow
political time scales. Consequently, responses made in the initial period after a redistribution
of power may yield a great range of results, from the great successes to the abysmal failures.
What is most worrying about this is the high turnover in human expertise that now
characterizes southern African management agencies. A continued loss of expertise from
these agencies, which are a major repository of social memory, could mean long periods of
ineffective responses and possibly considerable pressure to revert to centralized controls as a
consequence – in a decentralization backlash (Ribot 2002).
We thus note a limitation in the application of our framework to complex systems in
the real world: it can be extremely difficult to achieve congruence between impact, awareness,
and power, because it goes against the grain of social-ecological system design. The scales at
which impact, awareness, and power operate are mismatched in space and time. Bearing this
in mind, however, the framework points to several features of responses that are likely to
increase their effectiveness if incorporated into their design.
Designing effective responses
Our analysis suggests that effective responses in complex adaptive systems are characterized
by the following factors:
1. Congruence between scopes of impacts, awareness, and power. We acknowledge that this
may be difficult and is beyond people’s control in many situations. In cases where people
cannot affect the indirect drivers of an impact, they may still be able to adopt proactive
response options. For example, local livelihood diversification is a coping strategy to deal
with uncertainty (Shackleton et al. 2004). At national scales, governments often cannot affect
drivers of global processes like climate change; however, they can be proactive by preparing
for uncertainty and managing ecosystem services with the possible range of extreme
conditions in mind. Often, a response is both a consequence of responses that came before
and a driver of responses that will come after. When and where congruence already exists, it
UUnniivveerrssiittyy ooff PPrreettoorriiaa eettdd,, BBoohheennsskkyy EE LL ((22000066))

2. Evaluating responses in complex systems
38
needs to be maintained through the continued implementation of effective responses. New
responses must try to establish the best conditions for future responses to take shape.
2. Distribution of impacts, awareness, and power across locations in space and time that are
most resilient to negative change, or most in need of positive change. Different social groups
or ecological groups or locations are differentially vulnerable to change. The most effective
responses will be those that differentiate between these groups, or where this cannot be done,
provide different response options for them. Suggested flow regime changes for the Zambezi
River downstream of Cahora Bassa dam, for example, seek to do this with releases from the
dam geared to continued hydro-electricity generation as well as the maintenance of
downstream ecosystem services on which local livelihoods are dependent. Awareness, too,
needs to be effectively distributed, by feeding cross-sectoral and cross-scale information and
knowledge into decision-making processes.
3. Expansion of response options at and across all scales. The ability to respond meaningfully
to change is greatly enhanced if we have a large set of responses to choose from. Effective
responses may be generated more successfully by expanding people’s response options rather
than direct interventions. If we accept that we can never know enough about any complex
system to fully control it, then the wisest course of action may be to let the impacted
themselves make choices from the widest possible set of options. The process of involving a
wide range of stakeholders in the ecological reserve determinations as suggested by the South
African Water Act is an example of how this can be done.
4. Enhanced or stabilized social memory. One of the gravest problems of management and
policy in southern Africa is the constant loss of human capital from the agencies most
intimately involved in implementing responses. Long-term experts are lost to the private
sector, to international non-governmental organisations, and to distant continents. Local
ecological knowledge is lost as rural people move to cities and become disconnected from the
cultures in which the knowledge is embedded. Moving with many of these people are their
experiences in response experimentation; key bits of social memory. There does not seem to
be a simple solution to this problem other than to create stronger incentives for them to stay.
Orderly documentation of their experiences does not always seem to work. Loss of documents
and records or the inability to accept recommendations because of a lack of experience means
that important lessons that should have been learnt are sometimes not. This may be an area
UUnniivveerrssiittyy ooff PPrreettoorriiaa eettdd,, BBoohheennsskkyy EE LL ((22000066))

2. Evaluating responses in complex systems
39
that requires special research attention: how do we maintain social memory in the face of very
fluid human capital?
CONCLUSIONS
What factors characterize effective responses in complex adaptive systems? We have defined
“effective” responses as those that maintain a complex system’s social and ecological
resilience, or its ability to withstand change. Drawing on the experience of SAfMA, we
crafted a simple framework to evaluate responses consisting of three components: impact,
awareness, and power. We have suggested that effective responses are those in which the
scopes of impact, awareness, and power are congruent; impact, awareness and power are
distributed across the system; broad response options are available; and social memory is
preserved. In applying this framework to a range of responses for managing water in southern
Africa, we observed that it may be extremely difficult to achieve or maintain congruence.
Responses are adaptive reflections of prevailing social, economic, political, and
ecological conditions. This explains in part the SAfMA team’s difficulty in assessing and
extracting meaningful lessons from the responses of the past. Responses are constructed and
implemented in specific contexts. When these contexts change, as they invariably do, we
should expect responses to change, too, possibly rendering the responses that are effective
now useless in the future. No two situations are ever the same and we should therefore be
surprised if they elicit the same responses. A government’s response to the construction of a
major dam when it approaches an election may be entirely different than it would be when it
has a major drought on its hands. Not only are responses and their contexts dynamic; the
particular lens through which we view and evaluate the world is dynamic because of changing
social objectives. Responses in the era of “get more water” were consistent with a defined set
of social objectives. This set has now been swept offstage and replaced with an updated
version.
By examining the two different trajectories of the Gariep and Zambezi with our
framework, we can apply our learning about responses from one to the other, though with an
understanding that water management is operating within a different context now than it was
during the early development phases of these basins. Water is increasingly being seen in
southern Africa as a regional resource, presenting opportunities for a redefinition of impact,
awareness, and power scopes. As the region becomes more interconnected through its water
resources, opportunities for learning are expanded.
UUnniivveerrssiittyy ooff PPrreettoorriiaa eettdd,, BBoohheennsskkyy EE LL ((22000066))

2. Evaluating responses in complex systems
40
Responses to changing relationships between ecosystem services and human well-
being require constant adjustment and adaptation. We adapt our responses to the prevailing
circumstances and add the experience to our memory. We learn. Responses to changes in
complex adaptive systems are complex adaptive systems themselves. Given that we cannot
predict what a complex system will do, we are unlikely to be able to design responses that
will steer the system to where we want it to be. At best, effective responses should provide
incentives for a complex system to remain within desirable configurations.
The framework provides a useful tool for exploring the problem of responding in
complex systems and could be used in other applications beyond those discussed here. While
we looked “backward” in this paper by evaluating the historical trajectory of water
management responses in southern Africa, our evaluation would be likely to benefit from
further development in conjunction with scenario analysis. Scenarios provide a wind tunnel
for envisioning alternative future worlds, and can help people to identify the response options
that are most likely to be robust (i.e. enhance resilience) in different futures that may unfold.
Acknowledgements
We thank the Gariep Basin and Gorongosa-Marromeu User Advisory Groups for providing
data and insights for the assessments. Members of SAfMA, particularly R. Biggs, contributed
ideas for this paper, an early version of which was presented at “Bridging Scales and
Epistemologies: Linking Local Knowledge with Global Science in Multi-Scale Assessments,”
in Alexandria, Egypt in March 2004. D. Biggs and J. Jones read the manuscript and made
helpful suggestions. Funding for SAfMA was provided by the Millennium Ecosystem
Assessment through a grant from the government of Norway, administered by United Nations
Environment Programme.
UUnniivveerrssiittyy ooff PPrreettoorriiaa eettdd,, BBoohheennsskkyy EE LL ((22000066))

2. Evaluating responses in complex systems
41
References
Allan, T. 2002. Water resources in semi-arid regions: Real deficits and economically invisible and politically silent solutions. Pages 23-36 in A.R. Turton and R. Henwood, editors. Hydropolitics in the developing world: a southern African perspective. African Water Issues Research Unit, Pretoria, South Africa. Aquatic Resource Management for Local Communities (ALCOM). 1999. Database of South African water bodies, source, content and data structure. ALCOM Working Paper 18. ALCOM, Lusaka, Zambia. Beilfuss, R. and B. R. Davies. 1998. Prescribed flooding and the rehabilitation of the Zambezi Delta. In W. J. Streever, editor. International perspectives on wetland rehabilitation. Kluwer, Dordrecht, The Netherlands. Carpenter , S., B. Walker , J. M. Ander ies, and N. Abel. 2001. From metaphor to Measurement: resilience of what to what? Ecosystems 4: 765–781. Chutter , F. M., R. W. Palmer, and J. J. Walmsley. 1996. Environmental overview of the Orange River. Orange River Development Project Replanning Study. DWAF report PD 00/00/5295, Department of Water Affairs and Forestry, Pretoria, South Africa. Costanza, R., L . Wainger , C. Folke, K.-G. and Mäler . 1993. Modeling complex ecological economic systems: toward an evolutionary, dynamic understanding of people and nature. BioScience 43(8): 545-555. Davies, B. R., R. D. Beilfuss, and M. C. Thoms. 2000. Cahora Bassa retrospective, 1974–1997: effects of flow regulation on the Lower Zambezi River. Limnology in the developing world 27:1-9. Dent, M. C. 2000. Strategic issues in modelling for integrated water resource management in southern Africa. Water SA 26(4): 513-519. Department of Water Affairs and Forestry (DWAF). 2002. Proposed First Edition of the National Water Resources Strategy. Department of Water Affairs and Forestry, Pretoria, South Africa. [online] http://www.dwaf.gov.za/Documents/Policies/NWRS/main.htm. Department of Water Affairs and Forestry (DWAF). 2004. A Decade of Delivery. DWAF, Pretoria, South Africa. [online] http://www.dwaf.gov.za/Communications/Articles/Kasrils/2004/TEN%20YEARS%20OF%20DELIVER%20ARTICLE.doc. Fabr icius, C., E. Koch, and H. Magome. 2001. Community wildlife management in southern Africa: challenging the assumptions of Eden. Evaluating Eden Series No.6. International Institute for Environment and Development, London, UK. Falkenmark, M. and C. Widstrand. 1992. Population and Water Resources: A Delicate Balance. Population Bulletin. Population Reference Bureau, Washington, D.C., USA.
UUnniivveerrssiittyy ooff PPrreettoorriiaa eettdd,, BBoohheennsskkyy EE LL ((22000066))

2. Evaluating responses in complex systems
42
Görgens, A.H.M. and B.W. van Wilgen. 2004. Invasive alien plants and water resources in South Africa: current understanding, predictive ability and research challenges. South African Journal of Science 100: 27-33. Granit, J. 2000. Management of shared water resources in Southern Africa and the role of external assistance. First WARFSA/WaterNet Symposium: Sustainable Use of Water Resources. Maputo, Mozambique, 1-2 November 2000. [online] http://www.iwsd.co.zw/Papers%5CGranit.pdf. Gunderson, L . H., C. S. Holling, and G. D. Peterson. 2002. Surprises and sustainability: cycles of renewal in the everglades. Pages 315-332 in L. H. Gunderson and C. S. Holling, editors. Panarchy: understanding transformations in human and natural systems. Island Press, Washington, D.C., USA. Gunderson, L .H. and C.S. Holling, editors. 2002. Panarchy: understanding transformations in human and natural systems. Island Press, Washington, D.C., USA. Herold, C.E. 1992. Increasing awareness of water quality imperatives. Report for Stewart Scott Incorporated, Sandton, South Africa. Holling, C. S., and L . H. Gunderson. 2002. Resilience and adaptive cycles. Pages 25-62 in L. H. Gunderson and C. S. Holling, editors. Panarchy: understanding transformations in human and natural systems. Island Press, Washington, D.C., USA. Isaacman, A. and C. Sneddon. 2000. Toward a social and environmental history of the building of Cahora Bassa dam. Journal of Southern African Studies 26(4): 597-632. Jones, P.G. and P. K. Thornton. 2003. The potential impacts of climate change on maize production in Africa and Latin America in 2055. Global Environmental Change 13(1): 51-59. Johannes, R. E. 1998. The case for data-less marine resource management: examples from tropical nearshore fisheries. Trends in Ecology and Evolution 13: 243-246. King, J. and D. Louw. 1998. Instream flow assessments for regulated rivers in South Africa using the Building Block Methodology. Aquatic Ecosystem Health and Management 1: 109-124. Klasen, S. 2002. The costs and benefits of changing in-stream flow requirements (IFR) below the Phase 1 structures of the Lesotho Highlands Water Project. Lesotho Highlands Development Authority, Maseru, Lesotho. [online] http://www.sametsi.com/LHWP/ifr.htm. Le Maitre, D.C, D.B. Versveld, and R.A. Chapman. 2000. The impact of invading alien plants on surface water resources in South Africa: a preliminary assessment. Water SA 26(3): 397-408. Lee, K. N., editor. 1993. Compass and gyroscope: integrating science and politics for the environment. Island Press, Washington, D.C., USA. Lesotho Highlands Development Author ity (LHDA). 2002. Lesotho Highlands Water Project Phase I IFR Policy. LHDA, Maseru, Lesotho. [online]
UUnniivveerrssiittyy ooff PPrreettoorriiaa eettdd,, BBoohheennsskkyy EE LL ((22000066))

2. Evaluating responses in complex systems
43
http://www.lhwp.org.ls/downloads/policies/APPROVED%20IFR%20POLICY%2013-12-02.htm. Lynam, T., B. Reichelt, R. Owen, A. Sitoe, R. Cunliffe and R. Zolho. 2004. Human well-being and ecosystem services: an assessment of their linkages in the Gorongosa – Marromeu region of Sofala Province, Mozambique to 2015. Institute of Environmental Studies, University of Zimbabwe, Harare. MacKay, H. M. 2003. Water policies and practices. Pages 49-83 in D. Reed and M. de Wit, editors. Towards a just South Africa: the political economy of natural resource wealth. WWF Macroeconomics Programme Office, Washington D.C., USA and CSIR, Pretoria, South Africa. Marais, C., B.W. van Wilgen, and D. Stevens. 2004. The clearing of invasive alien plants in South Africa: a preliminary assessment of costs and progress. South African Journal of Science 100: 97-103. Millennium Ecosystem Assessment (MA). 2003. Ecosystems and human well-being: a framework for assessment. Island Press, Washington, D.C., USA. Molle, F. 2003. Development trajectories of river basins: a conceptual framework. Research Report 72. International Water Management Institute, Colombo, Sri Lanka. Motteux, N. M. G. 2002. Evaluating people-environment relationships: developing appropriate research methodologies for sustainable management and rehabilitation of riverine areas by communities in the Kat River Valley, Eastern Cape Province, South Africa. Ph.D. thesis, Rhodes University, Grahamstown, South Africa. Ohlsson, L . and A. R. Tur ton. 2000. The turning of a screw: Social resource scarcity as a bottle-neck in adaptation to water scarcity. Stockholm Water Front 1:10-11 Revenga, C., S. Murray, J. Abramovitz, and A. Hammond. 1998. Watersheds of the world: an assessment of the ecological value and vulnerability of the world's watersheds. World Resources Institute, Washington D.C., USA. Ribot, J. C. 2002. Democratic decentralization of natural resources: institutionalizing popular participation. World Resources Institute, Washington D.C., USA. Rogers, K., D. Roux, and H. Biggs. 2000. Challenges for catchment management agencies: lessons from bureaucracies, business and resource management. Water SA 26(4): 505-511. Scholes, R.J. and R. Biggs. 2004. Ecosystem services in southern Africa: a regional assessment. CSIR, Pretoria, South Africa. Shackleton, C., C. Fabr icius, A. Ainslie, G. Cundill, H. Hendr icks, S. Matela, and N. Mhlanga. 2004. Southern African Millennium Assessment: Gariep Basin Local Scale Assessments. Grahamstown, South Africa.
UUnniivveerrssiittyy ooff PPrreettoorriiaa eettdd,, BBoohheennsskkyy EE LL ((22000066))

2. Evaluating responses in complex systems
44
Snaddon, C. D., M. J. Wishar t, and B. R. Davies. 1998. Some implications of inter-basin water transfers for river ecosystem functioning and water resources management in southern Africa. Journal of Aquatic Ecosystem Health and Management 1:159-162. Soils Incorporated (Pty) L td and Chalo Environmental and Sustainable Development Consultants, 2000. Kariba Dam Case Study, prepared as an input to the World Commission on Dams, Cape Town, South Africa. [online] http://www.dams.org. Southern Afr ican Research and Documentation Centre (SARDC). 2001. Development in southern Africa: a sectoral review of regional integration in SADC. The Regional Economic Development and Integration Programme of the Southern African Research and Documentation Centre, Harare, Zimbabwe. Thabane, M. 2000. Shifts from old to new social and ecological environments in the Lesotho highlands water scheme; relocating residents of the Mohale dam area. Journal of Southern African Studies 26(4): 633-654. Turpie, J. 2004. The role of resource economics in the control of invasive alien plants in South Africa. South African Journal of Science 100: 87-93. Turton, A. R. 2002. Hydropolitics: The concept and its limitations. Pages 13-22 in A.R. Turton and R. Henwood, editors. Hydropolitics in the developing world: a southern African perspective. African Water Issues Research Unit, Pretoria, South Africa. Turton, A. R. 2003. The hydropolitical dynamics of cooperation in southern Africa: A strategic perspective on institutional development in international river basins. African Water Issues Research Unit, Pretoria, South Africa. United Nations Development Programme (UNDP). 2003. Human Development Report 2003. United Nations Development Programme, New York, USA. Watson, M., Personal Communication, 6 December 2002, Water Situation Assessment Model (WSAM) version 3, base data set. Department of Water Affairs and Forestry, Pretoria, South Africa. World Commission on Dams (WCD), 2000a. Dams and Development: A New Framework for Decision-Making. World Commission on Dams. Earthscan Publications Ltd, London, UK and Sterling, VA, USA. [online] http://www.dams.org. World Commission on Dams (WCD), 2000b. Orange River Development Project, South Africa Case Study, prepared as an input to the World Commission on Dams, Cape Town, South Africa [online] http://www.dams.org.
�
UUnniivveerrssiittyy ooff PPrreettoorriiaa eettdd,, BBoohheennsskkyy EE LL ((22000066))

Future ecosystem services in a Southern African river basin: A scenario planning
approach to uncertainty
Erin L. Bohensky1*, Belinda Reyers2, and A.S. Van Jaarsveld3
1Centre for Environmental Studies, University of Pretoria, Pretoria, 0002 South Africa
2The Council for Scientific and Industrial Research (CSIR), Environmentek, PO Box 320
Stellenbosch 7599 South Africa
3Centre for Invasion Biology, Department of Botany and Zoology, Stellenbosch University
Private Bag X1, Stellenbosch 7602 South Africa
*To whom correspondence should be addressed
Tel: +27-21-8082604
Fax: +27-21-8082405
Keywords: conservation decision making, ecological processes, ecosystem services, Millennium Ecosystem Assessment, possible futures, social processes
In press: Conservation Biology
UUnniivveerrssiittyy ooff PPrreettoorriiaa eettdd,, BBoohheennsskkyy EE LL ((22000066))

3. Future Ecosystem Services
46
Abstract
Scenario planning is a promising tool for dealing with uncertainty surrounding the future but
has been underutilized in ecology and conservation. The use of scenarios to explore
ecological dynamics of alternative futures has been given a major boost by the recently
completed Millennium Ecosystem Assessment, a 4-year initiative to investigate relationships
between ecosystem services and human well-being at multiple scales. Scenarios, as
descriptive narratives of pathways to the future, are a mechanism for improving the
understanding and management of ecological and social processes by scientists and decision
makers with greater flexibility than conventional techniques afford. We used scenarios in one
of the Millennium Ecosystem Assessment’s subglobal components to explore four possible
futures in a Southern African river basin. Because of its ability to capture spatial and temporal
dynamics, the scenario exercise revealed key trade-offs in ecosystem services in space and
time, and the importance of a multiple-scale scenario design. At subglobal scales, scenarios
are a powerful vehicle for communication and engagement of decision makers, especially
when designed to identify responses to specific problems. Scenario planning has the potential
to be a critical ingredient in conservation, as calls are increasingly made for the field to help
define and achieve sustainable visions of the future.
UUnniivveerrssiittyy ooff PPrreettoorriiaa eettdd,, BBoohheennsskkyy EE LL ((22000066))

3. Future Ecosystem Services
47
Introduction
The future is inherently laden with uncertainty and surprise. In many cases, science and
technology have reduced fundamental uncertainties about how the world works, vastly
improving our ability to anticipate change, but the elusiveness and unpredictability of
numerous aspects of the future remain. This makes the practice of conservation a challenging
prospect, and despite our best efforts, all the data, information, and technology we have are
unlikely to save us from some unpleasant surprises (McDaniel et al. 2003). There is a need to
better embrace the future’s uncertainty and to develop mechanisms to elucidate aspects that
are difficult to contemplate. This uncertainty is also likely to require a different approach to
conservation, taking it beyond its roots in crisis and an “atmosphere of loss and blame”
(Redford & Sanjayan 2003) to an expanded view of humans and nature as coupled, coevolved
components of social-ecological systems (Westley et al. 2002). Ultimately, we must recognize
that we will never know “all” and must therefore design approaches to conservation that are
robust under a wide range of possible outcomes.
Fortunately, the focus of scientific assessment is beginning to expand beyond the gathering,
analyzing, and synthesizing of information to helping decision makers deal with and respond
to uncertainty (Salzman 2005). This shift does not obviate the need for further specific
scientific knowledge, rather it recognizes that stocktaking efforts need to ask both scientists
and decision makers to identify key system processes, drivers, and interactions that are most
likely to result in surprise. It is in this spirit that scenarios, as narratives that describe
alternative pathways to the future, offer a promising collaborative approach for building
resilience to the future’s unpredictability. The recently completed Millennium Ecosystem
Assessment (MA 2003) provided an unprecedented opportunity to develop scenarios of future
ecosystem services and their relationships to human well-being at global, regional, and local
scales. In this paper we discuss the experience, findings, and lessons learned from a scenario
analysis of a multi-national river basin that formed part of the subglobal Southern African
Millennium Ecosystem Assessment (Biggs et al. 2004). We suggest that scenarios deserve
more prominence in scientific efforts to understand and manage uncertainty in ecological and
conservation decision making.
UUnniivveerrssiittyy ooff PPrreettoorriiaa eettdd,, BBoohheennsskkyy EE LL ((22000066))

3. Future Ecosystem Services
48
Scenarios in the Millennium Ecosystem Assessment
The Millennium Ecosystem Assessment was a 4-year program launched in 2001 to meet the
needs of decision makers for scientific information about the relationships between ecosystem
change and human well-being (MA 2003). In addition to a global analysis, it included 33
subglobal assessments, ranging in size from village to sub-continent, to provide a more
detailed picture of ecosystem services and human well-being, build capacity to conduct
ecosystem assessments, and strengthen user involvement across the globe. Guided by a user-
driven process, it sought to engage ecosystem users and managers and to incorporate their
knowledge and perceptions into the assessment. The global assessment served three
international environmental conventions, national governments, and the private sector,
whereas subglobal assessments addressed the concerns of specific user advisory groups.
Scenarios formed a major component of the Millennium Assessment’s work. We define
scenarios as a set of plausible narratives that depict alternative pathways to the future.
Scenario planning is the creation and use of such scenarios in a structured way to stimulate
thinking and evaluate assumptions about future events or trends, and to make uncertainties
about these explicit. It is important to make a distinction between scenarios in this sense and
projections, forecasts, and predictions, all of which relate more to the probability than
possibility of future outcomes (Peterson et al. 2003). Projections and forecasts – which
typically place an estimate on the likelihood of an event’s occurrence – work best for short-
term forecasting in well-understood systems (Bennett et al. 2003). This is an appropriate way
to deal with uncertainty when the objective is risk management, which requires at least an
intuitive probability to be placed on the occurrence of a rare event, such as a space shuttle
accident (Seife 2003). Ecosystem services and human well-being, on the other hand, are part
of social-ecological systems, in which unexpected outcomes are common (Gunderson &
Holling 2002).
Scenario planning is most useful for dealing with uncertainty when we lack sufficient
information about the probabilities that different events will occur. In the business world,
scenarios helped Royal Dutch/Shell to navigate unpredictable market shocks in the 1970s and
1980s by envisioning and preparing for a future that no one thought would happen (Wack
1985a; 1985b). Scenario planning also offers a platform for engaging stakeholders with
divergent viewpoints and competing objectives, and has succeeded in smoothing potentially
UUnniivveerrssiittyy ooff PPrreettoorriiaa eettdd,, BBoohheennsskkyy EE LL ((22000066))

3. Future Ecosystem Services
49
contentious situations, such as South Africa’s transition to democracy in the early 1990s
(Kahane 1992). Although the virtues of scenario planning have long been appreciated in
business and other fields, it has not been used widely in ecology or conservation (Peterson et
al. 2003). Scenarios with an environmental dimension exist, but these generally have several
limitations. Most tend to focus on the impacts of drivers on the environment (European
Commission 1999; UNEP 2002) or biodiversity (Sala et al. 2000; Bombard et al. 2005), and
do not incorporate ecological feedbacks or human responses. In addition, existing
environmental scenarios have usually ignored cross-scale processes – interactions between
global climate, national policies, and local population dynamics, for example. Major
ecological problems in recent times have resulted from misunderstanding how these processes
work (Wilson et al. 1999; Gunderson et al. 2002), making a third common shortcoming of
scenario exercises especially pertinent: they often exclude regional and local decision makers,
despite recent advances in participatory scenario planning methodology (Wollenberg et al.
2000; Waltner-Toews & Kay 2005).
The Millennium Assessment took scenario planning to a new level. A Scenarios Working
Group, comprised of ecologists, economists, and social scientists representing academia,
research institutes, non-governmental organizations, businesses, and indigenous groups from
around the world developed participatory, policy-relevant global scenarios to describe the
evolution of ecosystem services, human well-being, and their interactions over the next
century. In a departure from previous efforts, they focused specifically on the ways in which
decisions may drive future ecosystem change, ecosystem change may constrain future
decisions, and ecological feedbacks may lead to surprise (MA 2005). A second defining
feature was the multiple-scale nature of the effort, with subglobal scenarios developed
concurrently by regional and local assessment teams.
The global scenario analysis entailed a review of existing scenarios, interviews of decision-
makers, visionaries, and other leaders about their key concerns and hopes for the future, and
identification of the major ecological management dilemmas that the scenarios could address
(Bennett et al. 2005). The Scenarios Working Group ultimately chose to develop new
scenarios that would be consistent with assumptions about ecosystem resilience, unlike most
existing scenarios (Cumming et al. 2005). Four scenarios, focused on uncertainties related to
the extent of globalization or regionalism, and a proactive or reactive approach to
environmental problems, evolved from this process. Global Orchestration depicts a globalized
UUnniivveerrssiittyy ooff PPrreettoorriiaa eettdd,, BBoohheennsskkyy EE LL ((22000066))

3. Future Ecosystem Services
50
and reactive world, driven by a desire to bring the world’s poor out of poverty as quickly as
possible. In Order from Strength, the world is regionalized, reactive, and driven by a desire
for security. Adapting Mosaic is characterized by a regionalized but proactive society, and
increasingly relies on local institutions and learning to improve ecosystem management.
TechnoGarden describes a globalized, proactive world, driven by a pursuit of eco-
technologies (MA 2005).
At the subglobal scale, each assessment team was free to develop any number of scenarios
thought to be plausible in the medium term. This resulted in multiple scenario sets for the
subglobal assessments, some related to the global scenarios and some completely different
(Lebel et al. 2005). Typically created in a participatory fashion, subglobal scenarios were
driven by specific assessment issues, world views, and the role of the user group in the
assessment process. A distinguishing feature of some subglobal scenario exercises was their
use of creative forms of expression such as dramatic performance, often more effective than
conventional methods for conveying complex issues to stakeholders (Burt & Copteros 2004).
Building Southern African Scenarios: the Gariep Basin Experience
The Gariep River basin
The Gariep River basin (665,000 km2), which we define as the area of South Africa and
Lesotho drained by the Senqu-Gariep-Vaal river system, contains one of the greatest
concentrations of wealth on the African continent, Gauteng Province (the Johannesburg-
Pretoria metropolitan area). The basin is a region in transition, owing in large part to South
Africa’s shift to democratic governance in 1994. This political change was a catalyst for
accelerating economic growth, redressing inequitable access to resources under the former
Apartheid regime, promoting human well-being, and passing progressive legislation on
biodiversity, the environment, and water. Current policy trends in the region such as
decentralization, multinational resource management, and the establishment of pan-African
initiatives such as the New Partnership for Africa’s Development all have far-reaching
implications for ecosystem services.
The Gariep is the most modified river basin in Southern Africa, with massive undertakings
such as the Lesotho Highlands Water Project, the largest transfer scheme in African history,
UUnniivveerrssiittyy ooff PPrreettoorriiaa eettdd,, BBoohheennsskkyy EE LL ((22000066))

3. Future Ecosystem Services
51
impounding and diverting water to serve the Gariep River’s competing uses: irrigation of its
agricultural heartland, urban and industrial demands, and people and ecosystems. The basin
encompasses South Africa’s major cereal production area, the bulk of its mining and coal
industries, and two international biodiversity hotspots (Succulent Karoo and Maputaland-
Pondoland-Albany). The Gariep basin is home to nearly 40% of the South African population
and all of Lesotho’s, who range from destitute rural communities that are tightly bound to
ecosystem services to highly developed industrialized societies.
The Gariep basin assessment was conducted by a team of scientists with guidance from a user
advisory group, consisting of policy makers from agriculture, water, tourism, and
conservation departments of national and provincial government, and researchers working on
environmental or conservation policy issues. The team and group met five times over two
years, initially to discuss the assessment objectives, design, and expected outcomes, and
proceeding to tackle increasingly complex issues of trade-offs, scenarios, and interventions.
Between workshops, the assessment team undertook more extensive analysis of the focal
issues identified with the group, with whom it communicated regularly.
The initial assessment task was to identify major ecosystem services in the Gariep basin and
threats to their continued delivery. The group identified food production, water, and energy
from various sources as provisioning services - products obtained from ecosystems - and
biodiversity as an essential source of many other services (MA 2003). In a departure from the
global Millennium Assessment, the user group argued for the inclusion of mineral services
due to their importance as a natural resource in the economy and livelihoods of the Gariep
basin. The group cited land-use practices – notably urbanization, industrial and mining
developments, agriculture, and forestry – and abstraction and diversion of water resources as
the major threats to ecosystem services in the basin (Bohensky et al. 2004). Paradoxically,
most of these threatening practices have intended to secure ecosystem services and human
well-being, but within the context of a narrow, sectoral approach to natural resource
management. Group members cited numerous cases of ecological surprise; for example,
massive dams built in the 1960s and 70s to stabilize the Gariep River’s flow regime enabled a
pest blackfly (Simulium chutteri) to proliferate and affect livestock operations along the river,
imposing severe costs on the precise industry intended to benefit from the dams (Myburgh &
Nevill 2003).
UUnniivveerrssiittyy ooff PPrreettoorriiaa eettdd,, BBoohheennsskkyy EE LL ((22000066))

3. Future Ecosystem Services
52
Scenarios were intended to explore possible futures for ecosystem services and human well-
being in the basin during the years 2000 to 2030. The user advisory group indicated that the
major uncertainties associated with the future of the basin’s ecosystems and human well-
being are the strength of national governance and civil society. Because these uncertainties
resemble those of four well-known global scenario archetypes (Gallopín et al. 1997), we
decided to test the applicability of these archetypes to the Gariep basin, retaining some
elements while adapting others to the finer scale of analysis. The initial scenarios were
developed by the assessment team and refined in follow-up workshops with the group. To
better understand regional dynamics, we also interacted with a team developing two scenarios
for the broader Southern African region (Scholes & Biggs 2004).
The four global scenarios are based on clusters of driving forces such as economic and
geopolitical forces and social issues: Market Forces and Policy Reform both see a
continuation of current trends, but the former is driven by economic growth and the latter by
social and environmental sustainability. Fortress World and Breakdown (also called Local
Resources) describe a world driven by a global economy, but in the former there is an
increasing preoccupation with national security and in the latter a reliance on local
institutions. In our interpretation for the Gariep basin, Market Forces becomes a situation
where national governance and the economy are strong, but civil society plays a minor role.
Fortress World is a scenario about a collapse of national governance structures, a faltering
economy, and a fragmented civil society. In Local Resources, a strong, self-reliant civil
society emerges at local levels in the absence of strong national governance. Policy Reform
describes a strong, globally-linked economy within a sound governance framework, balanced
by an active civil society (Bohensky et al. 2004). Adapting these global scenario archetypes to
the circumstances in the basin had two major advantages: it increased the validity of the
scenarios in the eyes of the users, and enabled a comparison of similarities and differences
between scenarios at the two scales.
In addition to the two main uncertainties, we identified bifurcations of drivers that we
believed would distinguish the four scenarios in the Gariep basin (Table 3.1): (1) national
economic growth, (2) wealth distribution, (3) national social and environmental (including
climate) policy, (4) management of HIV/AIDS, (5) birth rate, (6) mortality rate, and (7)
urbanization. The user group acknowledged the significance of HIV/AIDS and climate
change in future ecosystem services and human well-being in the Gariep basin. To keep the
UUnniivveerrssiittyy ooff PPrreettoorriiaa eettdd,, BBoohheennsskkyy EE LL ((22000066))

3. Future Ecosystem Services
53
number of uncertainties manageable, however, we chose to focus only on differences in the
management of these issues under the different scenarios and did not consider different
HIV/AIDS and climate projections. We assumed for all scenarios that the current high
HIV/AIDS prevalence rate in South Africa, among the highest in the world (UNAIDS/WHO
2004), will continue to decrease human capital, divert government resources, and increase
dependency burdens (Goldblatt et al. 2002). We assumed for all scenarios that between 1990
and 2050, climate change will raise temperatures by as much as 2°C (IPCC 2001), and will
decrease runoff in South Africa by up to 10%, moving progressively from west to east
(DWAF 2004). This is likely to threaten water availability, food production, and biodiversity
in the more arid parts of the basin, although certain crops and species may thrive in other parts
(van Jaarsveld & Chown 2001).
Table 3.1. Key bifurcations in drivers of change that distinguish four scenarios of future
ecosystem services and human well-being (adapted from Bohensky et al. 2004).
Driver Market
Forcesa
Policy
Reform
Fortress
World
Local
Resources
Political, economic,
and social environment
National governance
Structures
+
++
-
-
Civil society - + - +
National economic growth ++ + - -
Distribution of wealth - + - -
National social and
environmental policy
HIV Management
-
+
+
++
-
-
-
-
Demographic trends
Birth rate Medium Low High High
Mortality rate Medium Low High High
Urbanization Increasing Increasing Increasing Constant
1Symbols: ++, Exceptionally strong; +, Strong; -, Weak or non-existent
UUnniivveerrssiittyy ooff PPrreettoorriiaa eettdd,, BBoohheennsskkyy EE LL ((22000066))

3. Future Ecosystem Services
54
We expected the scenarios to manifest differently within the basin, and therefore defined four
zones based on biophysical and socioeconomic characteristics: (1) urban areas, notably
Gauteng Province, which depend to a large degree on ecosystem services from other regions;
(2) the “Grain Basket,” the agriculturally productive grasslands and water-rich highlands; (3)
the densely populated, largely rural, and poor Great Fish River; and (4) the “Arid West,” a
low-rainfall, sparsely populated, mostly rural expanse of land where many mining operations
are concentrated.
We experimented with several approaches to describe the implications of the scenario
bifurcations for ecosystem services. We first used an integrated dynamic systems model
(Erasmus & van Jaarsveld 2002) to generate results, but the user group felt the model – which
they had no part in creating - was too complex to elucidate important relationships. We then
tried an interactive approach, and asked users to draw arrows to indicate direction and
magnitude of change in ecosystem services and human well-being under each scenario
relative to current condition. Users struggled to reach agreement, arguing that in attempting to
summarize change we were oversimplifying it. Users appreciated the division of the basin
into zones, but noted important fine-scale differences within zones – for example, food
production in South Africa’s Grain Basket is significantly more commercialized than in
Lesotho’s. Essentially, the users’ dissatisfaction lay in the inability of these methods and
categorizations to tell the whole story. Users were much more accepting of short narratives of
change which had greater flexibility to capture important differences. Later, we used spider
diagrams to illustrate trends in these narratives.
Below we summarize the scenario storylines that resulted from our initial translation of the
global scenarios, the scenario workshops, and subsequent consultation with members of the
user advisory group. For each scenario, key drivers are identified, followed by a description of
their consequences for five ecosystem service categories: biodiversity, energy, food,
freshwater, and mineral services (Bohensky et al. 2004). We explore these dynamics in the
four regions of the basin defined above, and consider how they may differ in Lesotho. We
also describe conservation attitudes, opportunities, and constrains in these alternative futures.
Market Forces
UUnniivveerrssiittyy ooff PPrreettoorriiaa eettdd,, BBoohheennsskkyy EE LL ((22000066))

3. Future Ecosystem Services
55
Gauteng continues to expand as the commercial and industrial heartland of the basin. Average
income rises, but so do income disparities between rich and poor. The urban poor benefit
marginally from the trickle-down effects of a growing economy. As rural living conditions
deteriorate, the rural poor flock to the rapidly expanding periurban areas to find employment.
Mining activities expand wherever possible, and agricultural land in Gauteng is rapidly
converted to urban or industrial use. Unregulated coal power generation and increased
industrial effluent cause water and air pollution and lead to a higher prevalence of water-
borne diseases in poor urban populations. South Africa’s entry into free trade agreements
pushes agricultural production toward exports, such as grapes and citrus along the Gariep
River. While food production increases in some regions, the lack of a clear policy framework
for climate change decreases household food security for subsistence farmers and the rural
poor. Farming on increasingly marginal lands promotes soil erosion. Water is increasingly
impounded and diverted for use by cities, industry, and commercial irrigation.
Societal values largely favor development over conservation, and poor enforcement of
environmental legislation negatively affects biodiversity, though conservation does benefit in
some places from private investment. In Lesotho, siltation that results from the large dams
ignites conflict between farmers who are affected and industries that champion economic
growth. Those with an interest in preserving the region’s threatened species form an
unexpected alliance with the affected farmers to demand compensation for lost ecosystem
services.
Policy Reform
Amid socially and environmentally sound governance and regional peace and security, the
region sustains high foreign investment. A fair trade environment promotes its global
competitiveness, and a vibrant technology sector supports improvements in infrastructure,
health, education, and service delivery.
However, some of the new policies have mixed consequences for ecosystem services.
Increased trade encourages intensified agricultural practices and the rapid adoption of
genetically modified organisms, pesticides, irrigation technology, and fertilizers, but also
creates access to organic farming markets. Increased wealth drives the agricultural sector
UUnniivveerrssiittyy ooff PPrreettoorriiaa eettdd,, BBoohheennsskkyy EE LL ((22000066))

3. Future Ecosystem Services
56
towards intensive livestock production, with a positive conservation spin-off: game farming
operations expand in the basin, and are far more compatible with protected areas than the
livestock farms they replace. Reduced pressure for land means a favorable outlook for
conservation in general. Biodiversity conservation and environmental education are high on
the agenda of policy makers. People recognize that climate change is causing more frequent
droughts and floods that affect a range of ecosystem services that they value. Water
withdrawals and treatment costs increase with economic growth, but the establishment of
catchment management agencies and market instruments ensure accountability for water use.
Policies on environmental flows and freshwater biodiversity become models for other regions
to follow. Coal still dominates the energy sector, but a growing proportion of the basin’s
urban and wealthy populations power their households with renewable sources – solar power
projects flourish in the Arid West.
Lesotho becomes an attractive ecotourism destination, owing in part to a successful marketing
campaign for the Drakensberg-Maloti Transfrontier Conservation Area and the rise of prolific
community-run lodges. Yet the rapid influx of tourists challenges the capacity of park
managers, while some local residents feel that they do not benefit from these initiatives.
Fortress World
The Gariep basin becomes visibly divided: The wealthy live in security enclaves and rely on
imports, while the poor become increasingly impoverished. Lack of access to water, land, and
mining rights ignites local tension and conflict across the basin, allowing corporations and the
political elite to take advantage of the unregulated and chaotic environment.
The ability of the rural poor to survive in a variable and arid climate is compromised, and
many seek employment in cities, where competition for limited jobs is fierce. Others resort to
poaching and harvesting of resources in reserves, where cash-strapped conservation
departments are unable to enforce legislation, and the region’s tourism appeal rapidly
plummets. Reduced industrial activity and pollution retards degradation of ecosystem services
somewhat, but most gains are offset by government failures to extend electricity and water
services to people forcing them to exploit the limited biofuels and water supplies within their
reach.
UUnniivveerrssiittyy ooff PPrreettoorriiaa eettdd,, BBoohheennsskkyy EE LL ((22000066))

3. Future Ecosystem Services
57
South Africa defaults on its royalty payments for the Lesotho Highlands Water Project,
eroding the financial and energy benefits once provided to Lesotho. Water supplies in
Gauteng and beyond become highly stressed. Reductions of water and sediment inflow to the
Orange River Mouth Wetland, a Ramsar Site and Important Bird Area, cause declines in its
migratory bird populations, raising concerns among conservationists and hinting at other
ecological changes that have not been monitored. This seems to draw little attention from
politicians, however, who seem to believe that environmental problems will somehow
dissipate on their own.
Local Resources
Despite ineffective national governance, corruption, and economic mismanagement, strong
civil society networks form across the basin and encourage local infrastructure development,
with community-driven service provision. The rural population, growing steadily and faced
with a declining resource base for subsistence farming, becomes increasingly self-reliant.
The remnants of commercial agricultural are sufficient to feed the urban markets but are
expanded onto increasingly marginal lands, exacerbating soil erosion. Agricultural diversity
provides some resistance to pest outbreaks though crop failures are common, as droughts
occur more frequently due to climate change. Local conservation initiatives spring up in
places, and garner the support of international NGOs. With a few exceptions, most local
authorities are unable to make the promises of the free basic water and electricity programs a
reality. Rainwater harvesting becomes common in many areas, new wells are dug, and
community woodlots supply household energy needs. However, national environmental
standards are poorly enforced, allowing waste products to be dumped on poor communities
across the basin. Water quality deteriorates, sewage is untreated, and mortalities from water-
borne disease rise.
Lesotho, in an effort to decrease its economic dependence on South Africa, secures
international assistance to increase its agricultural productivity. In a botanical reserve created
as part of the Lesotho water project, a local team of biologists discovers an endemic plant
with high pharmaceutical value. Residents lobby for more formal conservation of this biome,
as well as stronger legislation to protect intellectual property rights.
UUnniivveerrssiittyy ooff PPrreettoorriiaa eettdd,, BBoohheennsskkyy EE LL ((22000066))

3. Future Ecosystem Services
58
Key Findings
The expected direction and magnitude of change in ecosystem services in each scenario and
region are depicted with spider diagrams (Fig. 1a-b). Change is described as a sharp increase
(+2), a slight increase (+1), no change (0), a slight decrease (-1), or a sharp decrease (-2) in
the availability of ecosystem services. We make a distinction between provisioning services,
such as food, in which an increase signifies higher levels of service production, and regulating
and supporting services, such as biodiversity, in which an increase means an improvement in
the condition of the service. Freshwater provides both types of services, but we focused on its
regulating services in line with the expanded definition of water resources under the South
African Water Act of 1998 (Mackay 2003).
The scenario analysis highlighted several key findings of significance to the assessment,
which we discuss below. One is that trade-offs of several types are ubiquitous in all scenarios
and regions. A second is that some, but not all, findings converge with those of the global
scenarios, underscoring the importance of a multiple-scale design.
Trade-offs�
Trade-offs, as well as synergies, between ecosystem services and biodiversity are a major
conservation concern. The maintenance of some services, such as nature-based tourism,
medicinal plants, and crop pollination, has a clear link to biodiversity, and provides a strong
economic argument for conservation (Ricketts 2004). Biodiversity also has fundamental link
to human well-being in that it enables people, especially the rural poor, to maintain diverse
livelihoods based on ecosystem services (Tengö & Belfrage 2004). However, the relationship
between biodiversity and many services is often an uneasy one, and poorly understood. Our
difficulty in deciphering these relationships under the scenarios made this clear, and stressed
the need for better information on thresholds.
Under most scenarios, a common trade-off is the increase in provisioning services at the
expense of regulating and supporting services and biodiversity. This is essentially a trade-off
between current and future generations: people can derive benefits from provisioning services
now, but this choice may eventually result in a loss of services. This is especially prominent
UUnniivveerrssiittyy ooff PPrreettoorriiaa eettdd,, BBoohheennsskkyy EE LL ((22000066))

3. Future Ecosystem Services
59
Figure 3.1. Change in production or condition of ecosystem services in the four regions of the
Gariep basin from 2000 to 2030 under (a) Policy Reform and Market Forces scenarios, and
under (b) Local Resources and Fortress World scenarios. The amount of change in each
service is described as a sharp increase (+2), slight increase (+1), no change (0), slight
decrease (-1), or sharp decrease (–2).
UUnniivveerrssiittyy ooff PPrreettoorriiaa eettdd,, BBoohheennsskkyy EE LL ((22000066))

3. Future Ecosystem Services
60
in Market Forces, while in Policy Reform, provisioning services increase but synergistic
management across the basin strives to balance the use of these services with the maintenance
of regulating and supporting services. Yet Policy Reform is not a panacea. Policies to
intensify agriculture, for example, may embody a command-and-control mentality aimed at
maximizing returns rather than maintaining a variety of ecosystem services, and possibly
reducing critical system variability over the longer term (Rogers et al. 2000).
Trade-offs may occur between services in space. Freshwater flows and transfers create
important interdependencies between regions, and only under Policy Reform, where water use
is effectively regulated by national policy, does it improve throughout the basin. In addition,
supply and demand of each ecosystem service have a unique spatial distribution. Trade-offs
may occur in areas that have multiple competing services (Grain Basket); in areas which
produce services (Grain Basket) which are consumed elsewhere (Gauteng); or where
ecosystem service use outstrips the capacity of the region to produce it (Arid West).
We also observed trade-offs in the ways that societies deal with ecosystem service
deficiencies. Affluent and urban populations tend to buffer themselves from shocks and
disturbances by using manufactured capital or technology, or consuming ecosystem services
from distant places (Lambin et al. 2001). However, over time, a society’s dependence on such
buffers can increase its vulnerability to change if the buffer is removed (Gunderson et al.
1995). By contrast, poor populations often must be adaptive, adopting coping strategies that
enable survival in difficult times, which may help to build their resilience (Berkes et al. 2000).
An example is temporary migration between urban and rural areas with the ebb and flow of
economic opportunities. Yet as urban densities increase, urban quality of life for the poor may
decline, eventually drawing people back to their rural homes (Potts & Mutambirwa 1998).
This creates an important spatiotemporal dynamic in the demand for ecosystem services that
many analyses do not capture.
These different types of trade-offs tend to transfer costs from one individual or society to
another. This may be easy when the transferring party is not accountable, such as when the
affected party is far away or powerless to intervene – future generations are therefore
common victims (Bohensky & Lynam 2005). Yet sometimes the effects of trade-offs are felt
closer and sooner than expected, such as the “surprise” blackfly outbreak noted above. For
UUnniivveerrssiittyy ooff PPrreettoorriiaa eettdd,, BBoohheennsskkyy EE LL ((22000066))

3. Future Ecosystem Services
61
this reason, scenarios can be effective for illustrating how such surprises might happen and
eliciting users’ reactions.
Cross-scale convergence
While there was little true cross-scale integration or nesting of the Millennium Assessment
scenarios, some findings of the global and basin scenarios agree; the trade-off between
provisioning services and other services is endemic in all scenarios at both scales, for
example. Another similarity between the global and basin scenarios is the finding that a high-
level governing authority is not always needed to manage all ecosystem services, but the
ability to solve problems without it depends critically on the scale of the ecosystem process in
question. Local Resources contradicts the “ tragedy of the commons,” suggesting that in the
absence of strong central government control, some ecosystem degradation can be avoided
through self-governing local institutions (Dietz et al. 2003). However, we see in this scenario
that basin-scale measures are needed to protect downstream water resources from upstream
impacts, and in Adapting Mosaic that global interventions are required to govern the global
commons (MA 2005). Policy Reform, like TechnoGarden, works in part because people
begin to understand the links at all scales between ecosystem services, biodiversity, and
human well-being, and coordination between institutions at multiple scales reflects this
understanding.
The global and basin scenarios diverge where concepts do not translate meaningfully from
one scale to another because of differences in objectives and values. The most significant
differences emerge because the Gariep is largely a developing-world basin, where much
debate abounds about where environment and conservation fit on an agenda to promote
economic growth and improve social services. While a Policy Reform scenario may be
possible in parts of Southern Africa, a TechnoGarden type of scenario may be premature, as
the user group conveyed early in the process. Such “ground truthing” with stakeholders needs
to be done to ensure that scenarios are realistic and consistent (Peterson et al. 2003).
Reflections on a Learning Experience
While our assessment of current conditions and trends in ecosystem services and human well-
being in the Gariep basin drew on information from past studies, the scenario analysis
UUnniivveerrssiittyy ooff PPrreettoorriiaa eettdd,, BBoohheennsskkyy EE LL ((22000066))

3. Future Ecosystem Services
62
ventured into more unknown terrain – yet many of the assessment’s key findings emerged
precisely from peering into the future. This may be because the scenario analysis was the only
aspect of the assessment in which space and time were fundamentally integrated. Space and
time clearly matter: dynamic issues such as proximity to resources, connectedness to markets,
position in the basin, buffer effects, and migration trends all shape these different futures.
Tellingly, the uncertainty surrounding the future provoked the most reaction in our user
advisory group workshops. Users were usually in agreement about the condition and trends of
ecosystem services and current response options, but there was considerably more divergence
in their opinions on the “big unknowns” of the future. This lack of consensus challenged us to
rethink some assumptions of the assessment and its preliminary findings.
We sensed a limitation of the exercise in that it was not intended to inform a focal policy issue
or decision. Scenarios are likely to be most beneficial to conservation if developed with the
intent of identifying or solving specific problems (Wollenberg et al. 2000). There are
numerous examples of issues in the Gariep basin that would benefit from scenarios. One is the
ecological reserve, or environmental flows, determination under South Africa’s National
Water Act. This process entails a stakeholder-defined classification of water resources in each
catchment according to ecosystem services that they consider to be of value (Mackay 2003).
The use of scenarios would allow stakeholders to explore consequences of managing water
along alternative pathways to the future. The Gariep scenarios approach is also being explored
to better understand and manage invasive alien species in the region, an issue in critical need
of a more integrated spatial and temporal frame (Duke & Mooney 1999; Chapman et al.
2001).
Despite its shortcomings, the scenario exercise exposed a range of individuals and
organizations in the region to a new approach to problem solving, and several indicated
interest in using the results or approach in their own conservation and environmental
initiatives. For the longer term, it has contributed to the knowledge base for scenario planning
in an ecological context in the Southern African region. We note that even though scenarios
provoked debate among the user advisory group, some participants stated they were the most
exciting and informative part of the assessment because they imparted a sense of ownership,
rather than mere spectatorship, of a process that might influence the future (GBN 1998).
Scenarios also encouraged them to mentally transcend the boundaries that typically constrain
decision making to a narrow range of expectations. Finally, scenarios have a tremendous
UUnniivveerrssiittyy ooff PPrreettoorriiaa eettdd,, BBoohheennsskkyy EE LL ((22000066))

3. Future Ecosystem Services
63
ability to illustrate and communicate important messages that scientists sometimes take for
granted to a decision-making audience, which is often not accustomed to dealing with
uncertainty over long time horizons.
Conclusion: Preparing for a Range of Futures
Based on the Gariep basin scenario experience, we believe that scenarios are a powerful tool
for ecology and conservation, but cannot understate the need for future scenario exercises to
place added emphasis on engagement of and communication with decision makers, and at
appropriate scales for addressing the problems in question (Reid & Mace 2003). At subglobal
scales, we recommend that scenario planners strive to involve and excite people through
creative methods, and suggest that qualitative storylines may be more accessible than
quantitative models and graphics.
Calls are increasingly made for the science and practice of conservation biology to help define
and achieve sustainable visions of the future. Although scenarios offer a promising
mechanism, we need to continue to hone our tools for the task. Uncertainty frequently results
in crises, but mostly because - inherent though it may be - we are ill-prepared to respond.
Through scenarios, scientists and decision makers can collectively embrace uncertainty,
prepare for a range of potential futures, and turn would-be crises into opportunities for
positive change.
Acknowledgements
We thank the Gariep Basin User Advisory Group for its contributions to the scenario analysis
and J. Jones and two anonymous reviewers for helpful comments on the manuscript. SAfMA
was funded by the Millennium Ecosystem Assessment through a grant from the government
of Norway, administered by the United Nations Environment Programme.
UUnniivveerrssiittyy ooff PPrreettoorriiaa eettdd,, BBoohheennsskkyy EE LL ((22000066))

3. Future Ecosystem Services
64
Literature Cited
Bennett, E. M., S. R. Carpenter, G. D. Peterson, G. S. Cumming, M. Zurek, and P. Pingali. 2003. Why global scenarios need ecology. Frontiers in Ecology and Environment 1:322-329. Bennett, E. M., G. D. Peterson, and E. Levitt. 2005. Looking to the future of ecosystem services: introduction to the Special Feature on scenarios. Ecosystems 8:125-132. Berkes, F., Colding, J. and Folke, C. 2000. Rediscovery of traditional ecological knowledge as adaptive management. Ecological Applications 10:1251-1262. Biggs, R., et al. 2004. Nature supporting people: the Southern African Millennium Ecosystem Assessment. Council for Scientific and Industrial Research, Pretoria. Bohensky, E., B. Reyers, A. S. van Jaarsveld, and C. Fabricius, editors. 2004. Ecosystem services in the Gariep Basin: a component of the Southern African Millennium Ecosystem Assessment. African Sun Media, Stellenbosch, South Africa. (Also available from http://www.millenniumassessment.org/en/subglobal.safma.aspx.) Bohensky, E., and T. Lynam. 2005. Evaluating responses in complex adaptive systems: insights on water management from the Southern African Millennium Ecosystem Assessment (SAfMA). Ecology and Society 10(1):11. http://www.ecologyandsociety.org/vol10/iss1/art11/. Bombard, B., Richardson D. M., Donaldson J. S., et al. 2005. Potential impacts of future land use and climate change on the Red List status of the Proteaceae in the Cape Floristic Region, South Africa. Global Change Biology 11:1452-1468. Burt, J. and A. Copteros. 2004. Dramatic futures: a pilot project of theatre for transformation and future scenarios. Environmental Education Department, Rhodes University, Grahamstown, South Africa. Chapman, R. A., Le Maitre, D. C. and Richardson, D. M. 2001. Scenario planning: understanding and managing biological invasions. Pages 195-208 in J.A. McNeely, editor. The great reshuffling: human dimensions of invasive alien species. IUCN, Gland and Cambridge. Cumming, G.S., J. Alcamo, O. Sala, R. Swart, E. M. Bennett, and M. Zurek. 2005. Are existing global scenarios consistent with ecological feedbacks? Ecosystems 8:143-152. Dietz, T., E. Ostrom, and P.C. Stern. 2003. The struggle to govern the commons. Science 302:1907-1912. Duke, J.S. and H.A. Mooney, 1999. Does global change increase the success of biological invaders? Trends in Ecology & Evolution 14:135-139. DWAF (Department of Water Affairs and Forestry), 2004. National water resources strategy. 1st edition. DWAF, Pretoria.
UUnniivveerrssiittyy ooff PPrreettoorriiaa eettdd,, BBoohheennsskkyy EE LL ((22000066))

3. Future Ecosystem Services
65
Erasmus, L. and A.S. van Jaarsveld. 2002. Exploring policy interventions for sustainable development in South Africa: a modelling approach. South African Journal of Science 98:3-8. European Commission. 1999. Scenarios Europe 2010: five possible futures for Europe. European Commission, Brussels. (Also available from http://europa.eu.int/comm/cdp/index_en.htm.) Gallopín, G., A. Hammond, P. Raskin, and R. Swart. 1997. Branch points: global scenarios and human choice. Stockholm Environment Institute, Stockholm. GBN (Global Business Network), 1998. Destino Colombia: a scenario-planning process for the new millennium. Deeper News 9(1) http://www.gbn.org/. Goldblatt, M., S. Gelb, and G. Davies. 2002. Macroeconomics and sustainable development in Southern Africa: synthesis report of South African study. Development Bank of South Africa, Midrand. Gunderson, L. H., C. S. Holling, and S. S. Light, editors. 1995. Barriers and bridges to the renewal of ecosystems and institutions. Columbia University Press, New York. Gunderson, L. H., and C. S. Holling, editors. 2002. Panarchy: understanding transformations in human and natural systems. Island Press, Washington, D.C. Gunderson, L. H., C. S. Holling, and G. D. Peterson. 2002. Surprises and sustainability: cycles of renewal in the everglades. Pages 315-332 in L. H. Gunderson and C. S. Holling, editors. Panarchy: understanding transformations in human and natural systems. Island Press, Washington, D.C. IPCC (Intergovernmental Panel on Climate Change). 2001. Climate change 2001: impacts, adaptation and vulnerability, contribution of working group II to the third assessment report of the Intergovernmental Panel on Climate Change. Cambridge University Press, Cambridge, United Kingdom. (Also available from http://www.ipcc.ch.) Kahane, A. 1992. The Mont Fleur scenarios. Deeper News 7(1) http://www.gbn.org/. Lambin, E. F. et al. 2001. The causes of land-use and land-cover change: moving beyond the myths. Global Environmental Change 11:261–269. Lebel, L., P. Thongbai, K. Kok, J. B. R. Agard, E. M. Bennett, R. Biggs, M. Ferreira, C. Filer, Y. Gokhale, W. Mala, C. Rumsey, S. J. Velarde, M. Zurek, H. Blanco, T. Lynam, and Y. Tianxiang. 2005. Sub-global scenarios. In D. Capistrano, M. Lee, C. Raudsepp-Hearne, and C. Samper, editors. Ecosystems and Human Well-being: Multi-scale assessments. Volume 4. Findings of the Sub-global Assessments Working Group of the Millennium Ecosystem Assessment. Island Press, Washington, D.C. [online] URL: http://www.maweb.org/en/Products.Global.Multiscale.aspx. MA (Millennium Ecosystem Assessment). 2003. Ecosystems and human well-being: a framework for assessment. Island Press, Washington, D.C.
UUnniivveerrssiittyy ooff PPrreettoorriiaa eettdd,, BBoohheennsskkyy EE LL ((22000066))

3. Future Ecosystem Services
66
MA (Millennium Ecosystem Assessment). 2005. Ecosystems and Human Well-being: Scenarios. Volume 2, Findings of the Scenarios Working Group of the Millennium Ecosystem Assessment. S.R. Carpenter, P.L. Pingali, E.M. Bennett, and M.B. Zurek, editors. Island Press, Washington, D.C. [online] URL: http://www.maweb.org/en/Products.Global.Scenarios.aspx. Mackay, H. 2003. Water policies and practices. Pages 49-83 in D. Reed and M. de Wit, editors. Towards a just South Africa: the political economy of natural resource wealth. WWF Macroeconomics Programme Office and Council for Scientific and Industrial Research, Washington D.C. and Pretoria. McDaniel, R. R., M. E. Jordan, and B. F. Fleeman. 2003. Surprise, surprise, surprise! A complexity science view of the unexpected. Health Care Management Review 28:266-278. Myburgh, E. and E. M. Nevill. 2003. Review of blackfly (Diptera: Simuliidae) control in South Africa. Onderstepoort Journal of Veterinary Research 70:307-317. Peterson, G. D., G. S. Cumming, and S. R. Carpenter. 2003. Scenario planning: a tool for conservation in an uncertain world. Conservation Biology 17:358-366. Potts, D., and Mutambirwa, C. 1998. Basics are now a luxury: perceptions of structural adjustment’s impact on rural and urban areas in Zimbabwe. Environment and Urbanization 10:55–75. Redford, K., and M.A. Sanjayan. 2003. Retiring Cassandra. Conservation Biology 17: 1473-1474. Reid, W. V., and G. M. Mace. 2003. Taking Conservation Biology to New Levels in Environmental Decision-Making. Conservation Biology 17: 943-945. Ricketts, T. H. 2004. Tropical forest fragments enhance pollinator activity in nearby coffee crops. Conservation Biology 18: 1262–1271. Rogers, K., D. Roux and H. Biggs, 2000. Challenges for catchment management agencies: lessons from bureaucracies, business and resource management. Water SA 26:505-511. Sala, O. E, et al. 2000. Biodiversity: global biodiversity scenarios for the year 2100. Science 287:1770–1774. Salzman, J. 2005. A “must-read” on ecosystem services. Conservation Biology 19:582-583. Scholes, R. J. and R. Biggs, editors. 2004. Ecosystem services in southern Africa: a regional assessment. Council for Scientific and Industrial Research, Pretoria. Seife, C. 2003. Columbia disaster underscores the risky business of risk analysis. Science 299:1002. Tengö, M. and K. Belfrage. 2004. Local management practices for dealing with change and uncertainty: a cross-scale comparison of cases in Sweden and Tanzania. Ecology and Society 9(3):4. http://www.ecologyandsociety.org/vol9/iss3/art4.
UUnniivveerrssiittyy ooff PPrreettoorriiaa eettdd,, BBoohheennsskkyy EE LL ((22000066))
3. Future Ecosystem Services
67
UNAIDS/WHO. 2004. AIDS epidemic update. Joint United Nations Programme on HIV/AIDS (UNAIDS) and World Health Organization (WHO), Geneva. UNEP (United Nations Environment Programme) 2002. GEO: Global Environment Outlook 3. UNEP, Nairobi. (Also available from http://www.unep.org/geo.) van Jaarsveld, A. S, and S. L. Chown. 2001. Climate change and its impacts in South Africa. Trends in Ecology & Evolution 16:13-14. Wack, P. 1985a. Scenarios: uncharted waters ahead. Harvard Business Review 63:72–89. Wack, P. 1985b. Scenarios: shooting the rapids. Harvard Business Review 63:139–150. Waltner-Toews, D., and J. Kay. 2005. The evolution of an ecosystem approach: the diamond schematic and an adaptive methodology for ecosystem sustainability and health. Ecology and Society 10(1):38. http://www.ecologyandsociety.org/vol10/iss1/art38/. Westley, F., S. R. Carpenter, W. A. Brock, C. S. Holling, and L. H. Gunderson, 2002. Why systems of people and nature are not just social and ecological systems. Pages 103-119 in L. Gunderson and C.S. Holling, editors. Panarchy: understanding transformations in human and natural systems. Island Press, Washington D.C. Wilson, J. A., B. Low, R. Costanza, and E. Ostrom. 1999. Scale misperceptions and the spatial dynamics of a social–ecological system. Ecological Economics 31:243–257. Wollenberg, E., Edmunds, D. and L. Buck. 2000. Using scenarios to make decisions about the future: anticipatory learning for the adaptive co-management of community forests. Landscape and Urban Planning 47:65-77.
UUnniivveerrssiittyy ooff PPrreettoorriiaa eettdd,, BBoohheennsskkyy EE LL ((22000066))

Decentralisation and its discontents: redefining winners and losers on the South Afr ican
‘waterscape’
Erin L. Bohensky
Centre for Environmental Studies, University of Pretoria, Pretoria, 0002 South Africa
Tel: +27-21-8082604
Fax: +27-21-8082405
In review: South African Journal of Science
UUnniivveerrssiittyy ooff PPrreettoorriiaa eettdd,, BBoohheennsskkyy EE LL ((22000066))

4. Decentralisation and its discontents
69
Abstract
The decentralisation of natural resource management is an increasingly common trend across
the globe, but many of the social and ecological consequences of these decentralisation
processes remain uncertain. Decentralisation is intended to distribute power broadly among
local, accountable actors and increase management efficiency, equity, and sustainability. Yet
effective decentralisation can be difficult to achieve for numerous reasons, in part because
natural resources and people comprise social-ecological systems that are characterised by
non-linearity, variability, and unpredictability. Such challenges are anticipated in the South
African water sector, which is embarking on a decentralisation process in the wake of a major
paradigm shift and drafting of new legislation. In this paper I explore this process in a social-
ecological systems context: will decentralised decision-making produce better overall
outcomes, or simply redefine winners and losers? I use an agent-based model to simulate the
behavior of water users across the South African ‘waterscape’ under alternative scenarios of
centralised and decentralised management and examine the role of learning from collective
experiences. The model reveals that 1) no scenario is likely to achieve improvements in the
legislation’s three central principles at the national scale, though some come closer than
others; 2) patterns of winners and losers change at a finer management scale and sectoral
level; 3) learning tends to achieve more middle-of-the-road outcomes which are slightly better
than average because water use is diversified. These results suggest that although
decentralisation will always create winners and losers, it promotes diversity and allows local
experimentation, which tends to enhance resilience. Because individual agents often sacrifice
sustainability to achieve social and economic goals, however, decentralised decision-making
is likely to yield the greatest benefits if embedded within a broader policy framework to
ensure sustainability.
UUnniivveerrssiittyy ooff PPrreettoorriiaa eettdd,, BBoohheennsskkyy EE LL ((22000066))

4. Decentralisation and its discontents
70
Introduction
The decentralisation of natural resource management has become increasingly popular
in many developing nations in the quest for improved efficiency, equity, and sustainability.
Since the mid-1980s, many such decentralisation processes have been initiated (Larson and
Ribot 2004). Decentralisation is defined as the formal transfer of power from a central
government to actors and institutions at lower levels in a political-administrative and
territorial hierarchy (Ribot 2002a). The rationale for decentralisation is that, when done
correctly, it bestows decision-making powers on local and accountable actors who have the
most relevant information about natural resources (Pritchard and Sanderson 2002, Ribot
2002b) and appropriate incentives to manage them (Wilson 2002).
The concept of democratic decentralisation and the empowerment of local actors is
consistent with the notion advanced by social-ecological systems theory that resilience is
more likely to be maintained in situations where actors are fully aware of and capable of
controlling the impacts that affect them (Gallopín 2002, Bohensky and Lynam 2005). I define
a social-ecological system (SES) as a coupled system of people and nature and their
interactions across multiple scales of time and space (Walker et al. 2002), in a distinct
departure from the view that ‘ecosystems’ and ‘social systems’ are separate entities (Westley
et al. 2002). SES are complex, variable, non-linear and unpredictable, but are often governed
by simple rules (Lee 1993) and self-organizing feedbacks (Holling 2001). Decentralisation,
ideally, is one way of maintaining these rules and feedbacks for the benefit of both society
and the environment.
The appropriateness of decentralisation, among other forms of management, for
governing natural resources is the subject of a growing literature, much of which suggests an
important relationship between institutional success or failure and social-ecological system
dynamics (Pahl-Wostl 2002, Dietz et al. 2003, Anderies et al. 2004). Fisheries in New
England (Wilson 2002) and Brazil (Kalikoski et al. 2002) provide classic examples of
management failures that result from a lack of information about or understanding of what are
fundamentally social-ecological system dynamics – in these cases, the interactions between
fish population structure and fisher behavior. From these misunderstandings, inappropriate
rules emerge, usually conceived by ‘outsiders’ such as central governments and large
commissions. Conversely, successful institutions tend to appreciate spatial and temporal
scale, uncertainty, variability, non-linearity, and feedbacks, and encourage learning by
allowing actors to respond using local information and experience. Dietz et al. (2003)
UUnniivveerrssiittyy ooff PPrreettoorriiaa eettdd,, BBoohheennsskkyy EE LL ((22000066))

4. Decentralisation and its discontents
71
distinguish the outcomes in two Maine fisheries that were managed by different sets of rules:
one subjected to a top-down approach crashed, while one governed by local rules survived.
The authors explain the difference in part by the ability of the latter to be guided by a
knowledge base of recorded successes and failures over a long temporal scale. Ultimately,
institutions may fail when they are informed by science and management philosophies that
prevent the detection of important signals in the system. The potential advantage of
decentralised resource management is that, by promoting diversity in the system, it may
minimise the risk of missing some key signals and adopting maladaptive practices (Wilson
2002). On the other hand, devolving too much decision-making power to the local level can
result in ‘signal-missing’ at the other end of the spectrum, where large- (or cross-) scale
problems may emerge (Gunderson et al. 2002, Diamond 2005).
While social-ecological systems theory offers some of the most convincing arguments
for decentralisation, it also explains some of its greatest obstacles. Apart from the difficulty of
aligning scales of ecosystem processes and institutions (Pritchard and Sanderson 2002),
perhaps the most contentious challenge of decentralisation stems from its inherent shifting of
the balance of power in a social-ecological system. This makes decentralisation a
fundamentally political process, replete with struggles for control (Galvin and Habib 2003).
The creation of winners and losers is inevitable, but its potential to undermine
decentralisation’s intended objectives is not a trivial concern. Any assessment of the
decentralisation experiments in the natural resource management field to date is likely to be
inconclusive, as most processes remain in their infancy, or have been largely superficial
(Larson and Ribot 2004). Little attention has been given to the consequences of
decentralisation for social and ecological resilience, or system ability to recover from shocks
and disturbances (Holling and Gunderson 2002): what is the capacity of the system to absorb
the loss inherent in a redistribution of power?
These challenges are now of great relevance to the South African water sector, where
a decentralisation process is beginning. This process entails the radical overhaul of past water
legislation and a redesign of the decision-making structures for the allocation and
conservation of the country’s scarce water resources. The proposed institutional arrangements
are anticipated with great hope, but also caution, by water users, managers, and scientists
(MacKay et al. 2003). In this paper I use an agent-based model to explore water management
in South Africa in a social-ecological systems context: does decentralisation lead to better
outcomes for society and ecosystems, or does it simply redefine winners and losers? The
model simulates actor behavior on the South African ‘waterscape’ and contrasts the outcomes
UUnniivveerrssiittyy ooff PPrreettoorriiaa eettdd,, BBoohheennsskkyy EE LL ((22000066))

4. Decentralisation and its discontents
72
under alternative scenarios of centralised and decentralised systems of water management.
The latter allows agents to choose between strategies based on learning from collective
experience. By illuminating some of the emergent dynamics in space and time, the model
stimulates thought about the degree of decentralisation most appropriate for South African
water management.
South Afr ican water management in transition
The decentralisation of water management in South African is part of a major
transition away from the past command-and-control approach of water management by
bureaucracy and technology, highly inequitable policies, and frequent disregard for the
substantial hydrological, ecological, and social variability in the system (Rogers et al. 2000).
Where previous water management favored farms and industries and required increasingly
complex and costly technical interventions, the end of minority rule under the apartheid
regime created an opportunity to reform water legislation and introduce a dramatically
different vision in line with the new democratic system of governance. The Water Act of 1998
– among the most progressive water policies in the world (MacKay et al. 2003) – is founded
on three fundamental principles of economic efficiency, social equity, and ecological
sustainability. While the environment and poor communities were frequently ‘ losers’ under
the previous regime, the Act guarantees fundamental minimum levels of water for basic
domestic and ecological needs before authorization may be made for any other purpose. All
other water use must ensure efficiency and economy of operations. This combination of
social, ecological, and economic priorities, viewed by some as serving the ‘ triple-bottom-
line,’ has some potentially negative repercussions, however, particularly for the notoriously
inefficient agricultural water sector, which consumes some 65% of the country’s water and
contributes less than 5% to the GDP (DWAF 2004a), but has played an important role in the
national economy, livelihoods, and drive for self-sufficiency (WCD 2000).
The institutional arrangements by which the Water Act’s principles are to be achieved
involve numerous actors, including the national ministry, the Department of Water Affairs
and Forestry (DWAF), and nineteen new statutory bodies called Catchment Management
Agencies (CMAs), each of which corresponds to a Water Management Area (WMA), roughly
defined by large catchment boundaries. Once operational, CMAs, working with local
stakeholder organisations, will assume some of the decision-making powers formerly held by
DWAF, an arrangement that will allow stakeholders within each catchment to decide the
UUnniivveerrssiittyy ooff PPrreettoorriiaa eettdd,, BBoohheennsskkyy EE LL ((22000066))

4. Decentralisation and its discontents
73
desired balance between protection and utilisation of water resources and to establish a course
of action to achieve it, within the limits of the national legislation. Concerns are expressed
among water managers and scientists about the capacity of the CMAs to carry out and oversee
these potentially momentous tasks (MacKay et al. 2003). By some accounts, the new
decentralised institutions are in danger of becoming simply the regional extensions of the
national water ministry (Rogers et al. 2000, Dent 2005) rather than autonomous, participatory
entities. In addition, whether the decentralisation of decision-making will lead actors to
manage water in a way that is consistent with the Water Act principles remains unknown.
Any prognosis for the future of water management in South Africa is necessarily
speculative. The Water Act of 1998 and subsequent strategies mark a major transition in the
relationship between people and water in South Africa, yet the transition creates some novel
conditions, the outcomes of which are difficult to predict. Agent-based modelling is a
particularly well-suited tool for elucidating situations of high uncertainty, and for comparing
alternative future visions, options, and trajectories. In the following I describe how an agent-
based model is used to simulate and compare some of the consequences of top-down
(centralised) and bottom-up (decentralised) decision-making for meeting the goals of the
South African Water Act.
The WaterScape: An agent-based water management model
Agent-based models investigate dynamics that emerge in complex systems from the
interaction of agents, an environment, and rules. Agent-based modeling has been used to
explore emergent system dynamics that emanate from decisions made by individual actors
(Epstein and Axtell 1996, Goldstone and Janssen 2005), issues of control, communication,
and coordination in ecosystem management (Bousquet and Le Page 2004), and sustainability
and resilience over the broad scales of time and space at which social-ecological dynamics
occur (Janssen and Carpenter 1999, Erasmus et al. 2002, Carpenter and Brock 2004). Several
agent-based models have been used to explore aspects of water management (Lansing and
Kremer 1993, Barreteau et al. 2003, Becu et al. 2003), including the new policy environment
in South Africa and trade-offs between socio-economic options in particular catchments
(Farolfi et al. 2004). The model described in this paper differs from previous efforts in the
region in its broader spatial and temporal extent, which I suggest is fundamental to
understanding the decentralisation process. Furthermore, this model adopts a unique social-
UUnniivveerrssiittyy ooff PPrreettoorriiaa eettdd,, BBoohheennsskkyy EE LL ((22000066))

4. Decentralisation and its discontents
74
ecological perspective on the South African water management transition that incorporates
alternative management paradigms and the role of learning.
I used the CORMAS (Common-pool Resources and Multiagent Systems) simulation
platform (Bousquet et al. 1998) to develop the WaterScape, an agent-based model of human
responses for managing water in a simulated environment that approximates the hydrological
landscape of South Africa (A class diagram and description of the model entities are included
in Appendix B and C; the full model code is available upon request from the author at
[email protected]). Alternative scenarios define distinct agent world views about the use of
water and strategies that correspond to these world views. Collectively, agents must fulfill
both short-term needs for water, such as daily domestic use, livelihoods, and economic
growth, and long-term needs, such as the continued delivery of ecosystem services. They
must also balance fine-scale and broad-scale water interests, within the constraints of the
environment and overarching rules that govern agent behavior, described below.
Eco-hydrological environment
The WaterScape is a simplistic representation of the social-ecological system of South
African water resources and the people that they support. This system has several key
characteristics. First, water resources in South Africa are unevenly distributed in both space
and time. This variability has to some degree been averaged out by the construction of dams
and water transfer schemes (Basson et al. 1997). Secondly, as the country’s many large
engineering works testify, great effort has been expended to harness and stabilise the
variability of nature, with the skewed sectoral distribution of water use reflecting the
historical control of resources.
The collective surface water resources of South Africa, Lesotho and Swaziland, a
volume of approximately 49,000 million m³/a, constitute the WaterScape environment; the
latter two countries are included because of their contributions to South Africa’s runoff (4 800
million m³/a and 700 million m³/a, respectively). The total area (1268 km2) is divided into
1946 quaternary catchments. The WaterScape is made up of quarter-degree-square (50 km2)
grid cells, each of which is approximately equal to an average-sized quaternary catchment.
Each quaternary catchment that falls entirely or partially within South Africa belongs to one
of nineteen contiguous Water Management Areas (WMA).
The model operates at a temporal resolution of a year, which corresponds to DWAF’s
National Water Resources Strategy and the principal hydrologic model of the region, the
UUnniivveerrssiittyy ooff PPrreettoorriiaa eettdd,, BBoohheennsskkyy EE LL ((22000066))

4. Decentralisation and its discontents
75
Water Situation Assessment Model (WSAM) version 3.0 used to support broad national water
resources planning (Watson, pers. comm.). Initial runoff values are obtained from this model.
Each year, runoff in a catchment is replenished at a rate that reflects inter-annual variation,
based on a normally-distributed random function and the catchment’s hydrological index
value, a measure of flow variability (Hughes and Hannart 2003). Runoff is also affected by
climate change, which is likely to lead to pronounced decreases in runoff that will move
progressively from west to east. In the model I assume a 10% decrease in runoff by 2015 in
the western part of the country and a 10% decrease in runoff by 2060 in the eastern part of the
country, with increases in some catchments along the eastern seaboard, in the northeast, and
isolated areas in the west during the same period (Schulze 2005). Water that is not withdrawn
for consumption flows to downstream catchments. Water may also be transferred from
WMAs with a surplus of water to WMAs with a deficit, according to scenario-specific rules
described below. In the WaterScape model, water transferred into a catchment is always
immediately allocated according to the scenario currently in operation in that catchment.
Additional factors that may potentially alter the future water balance, but that are
thought to have minimal impact or are not well understood, were not incorporated into the
analysis. These include the effects of return flows (i.e. industrial effluent) to rivers, which
may significantly augment the current water supply but often require treatment (DWAF
2004a), the reduction of streamflow by invasive alien plant species (Görgens and van Wilgen
2004), and the contribution of groundwater to total yield. While groundwater is an
increasingly important component of the water balance in some parts of the country, its
utilisation is limited at present and reliable groundwater data for the region are scarce (Haupt
2001).
Agents
Each type of agent operates at a specified spatial scale (Figure 4.1). DWAF, the
national water ministry, sets the ‘ rules of the game’ according to the prevailing water
management paradigm, described below. The Catchment Management Agency (CMA) is
responsible for the reconciliation of demand and supply in the WMA over which it presides.
Sectoral agents represent a category of water use in a quaternary catchment. Five sectors are
distinguished: commercial agriculture, commercial afforestation, mines and industry, rural
(including domestic use and livestock watering), and urban (including domestic and
municipal use), based roughly on the definitions of the National Water Resource Strategy
UUnniivveerrssiittyy ooff PPrreettoorriiaa eettdd,, BBoohheennsskkyy EE LL ((22000066))

4. Decentralisation and its discontents
76
(DWAF 2004a). Each sector has a distinctive pattern of water use, based on various
biophysical (e.g. land-cover, geology, climate) and socioeconomic (e.g. demographics,
infrastructure) factors. Initial demand values for the model are obtained from the WSAM.
These amounts change from year to year based on two water usage projections of high (4%
annual GDP increase) and low (1.5%) growth (DWAF 2004a) and in accordance with
scenario assumptions, described below. I assume that an increase in a sector’s demand may
only occur in catchments where the sector already consumes water. The advantage of this
restriction is that it prevents agricultural growth from occurring in areas that are not viable for
agriculture; the disadvantage is that it also prevents some potentially realistic growth, such as
urban development in presently rural areas. However, in order to keep model complexity
manageable it was decided not to explore land use changes, which to a large extent (i.e.
agriculture, forestry) have stabilised for the foreseeable future in South Africa (Biggs and
Scholes 2002).
Figure 4.1. Spatial and social entities in the WaterScape model. The national ministry,
DWAF, presides over decision-making at the national scale. Each Catchment Management
Agency (CMA) is responsible for decision-making in its corresponding Water Management
Area. In each quaternary catchment, five agents representing water use sectors make decisions
about water management at the finest scale.
��������� ���� �����
� � ��� �� � �
� ���� � � �� ���� � �
� �� �������� �� ���� � ����� �
� � � ��� �� �� � � � �
UUnniivveerrssiittyy ooff PPrreettoorriiaa eettdd,, BBoohheennsskkyy EE LL ((22000066))

4. Decentralisation and its discontents
77
The productivity of water use (i.e. contribution to GDP per unit of water consumed)
by these sectors varies greatly, with industry generating more than 50 times the GDP of
agriculture for a given quantity of water (DBSA 2000). The following sectoral multipliers
were used to derive value generated in South African Rands per cubic meter, based on
estimates of DBSA 2000: 1.4 for agriculture, 73.6 for forestry and mining and industrial, 30
for urban and 10 for rural. As these multipliers are averages for the country, they do not
reflect the variation within sectors or between regions. For example, some areas support the
production of very high-value agricultural crops such as citrus and grapes, where the
multiplier would be much higher than the average value. The productivity of industrial water
use is also highly varied (Hassan 2003).
With the passage of the 1998 Water Act, the allocation of water to meet sectoral
demands must take into account a legally-defined Reserve, which has two components. The
human reserve is a mandated minimum of 25 litres per person per day from a source within
200 meters of the home (DWAF 2004a). The ecological reserve refers to the quantity, quality,
pattern, timing, water level, and assurance of water that must remain in a natural body of
water in order to ensure its ecological functioning (DWAF 2002). The ecological reserve
requirement is to be set by DWAF for each quaternary catchment based on a desired
ecological management class, in turn based on objectives for the water resources (Palmer et
al. 2004). Class values range from A for a pristine water resource to F for a critically modified
one. Where conservation and ecotourism are viewed as important objectives for the water
resource, for example, the desired class would be designated as an A and a higher ecological
reserve requirement would be set, while the desired class would be designated as a C or D and
the reserve requirement would be lower if the primary objective of the resource was to
provide water for waste disposal. Desktop estimates of the present ecological management
class for each quaternary catchment (Kleynhans 2000) are used in the model.
Environment-agent feedbacks
Numerous types of feedbacks influence dynamics between water resources, their
users, and ecosystems. The model focuses on one in particular between water withdrawal in a
catchment and the ecological management class, which in turn may affect future water
availability (Figure 4.2). This feedback is a function of the ratio of water withdrawal to
availability, whereby a value of 0.4 or higher indicates severe water stress (Alcamo et al. 2000
and 2003, Cosgrove and Rijsberman 2000, Vörösmarty et al. 2000). I assume that when this
UUnniivveerrssiittyy ooff PPrreettoorriiaa eettdd,, BBoohheennsskkyy EE LL ((22000066))

4. Decentralisation and its discontents
78
ratio is exceeded, a reclassification is required such that the catchment is assigned to a lower
(i.e. more modified) ecological management class. The reclassification depends on the extent
the ratio is exceeded and the sensitivity of the catchment to water withdrawal, and is
calculated by multiplying the withdrawal-to-availability ratio and the catchment’s importance
and sensitivity category (DWAF 1999, Kleynhans 2000). An impact on the ecological
management class value in a given catchment similarly affects all downstream catchments in
which the withdrawal-to-availability threshold is exceeded. It is assumed that an ecological
management class value of D or worse (i.e. D-F) denotes a transformed catchment (Nel et al.
2004), for which actions to improve the ecological management class will not normally be
undertaken. In transformed catchments, the amount of water available for withdrawal is
likewise impacted, on the basis that fitness for use of the water resource is compromised. The
decline in available water due to transformation is also a function of the ecological
importance and sensitivity category. Admittedly, the modelled relationships between the
importance and sensitivity category, the ecological management class, and runoff available
for withdrawal represent a best guess about generally poorly understood relationships between
hydrology and ecological integrity (Hughes and Hannart 2003).
Scenarios: Water management paradigms
Water management at a given point of time is driven by a prevailing discourse that
shapes a paradigm regarding the relationship between society and water resources (Turton and
Meissner 2002). Given the high uncertainty associated with the new era of water management
in South Africa, scenarios that represent alternative paradigms are a useful mechanism for
exploring possible future pathways and their implications. The scenarios used in this model
are based on those developed for the Gariep Basin Millennium Ecosystem Assessment
(Bohensky et al. 2004, Bohensky et al. in press), in turn based on the archetypes of Gallopín
et al. (1997), but with a focus on water (Appendix D).
Under the Efficiency First scenario, water management is driven by the Water Act’s
efficiency principle and DWAF’s view of water as an economic resource that can be managed
through markets, price signals, and consumer preferences. Priority in allocation is given to
sectors that are able to generate the highest economic returns; this is typically the urban,
mining and industrial, and commercial forestry sectors. The agriculture and rural sectors,
which generate relatively low returns per unit of water, are not irrelevant in the Efficiency
UUnniivveerrssiittyy ooff PPrreettoorriiaa eettdd,, BBoohheennsskkyy EE LL ((22000066))

4. Decentralisation and its discontents
79
Figure 4.2. Ecological feedbacks in the WaterScape model. Ecological condition, indicated by
the present ecological management class value, deteriorates when water stress, determined by
the withdrawal-to-availability ratio, exceeds a threshold value of 0.4. The extent of
deterioration depends on both the ecological importance and sensitivity category of the
catchment and the extent of water stress. A present ecological management class value of ‘D’
or worse, indicating a transformed catchment, impacts the amount of available water that may
be withdrawn from runoff.
First scenario, as they have strong links to the more efficient sectors and create employment,
but spatially optimal water use in all sectors is strongly encouraged. Management is guided by
a ‘ trickle down’ philosophy, which assumes that economic growth and prosperity will create
incentives for the fulfillment of basic human and ecological needs.
Under the Hydraulic Mission (Turton and Meissner 2002) scenario, DWAF pursues a
command-and-control approach to maintain a constant supply of provisioning freshwater
services – the tangible goods provided by water – but often at the cost of maintaining a wider
array of regulating, supporting, and cultural freshwater services (MA 2003). Management is
top-down, driven by government-controlled science, and emphasises the efficiency of
operations in order to preserve the status quo. Little attention is given to monitoring, so
institutions are reactive rather than proactive. Change is resisted until a crisis occurs that
usually yields a call for tighter control instead of a critical, holistic analysis of the actions that
precipitated the crisis (Holling and Meffe 1996). Hydraulic Mission essentially describes the
UUnniivveerrssiittyy ooff PPrreettoorriiaa eettdd,, BBoohheennsskkyy EE LL ((22000066))
4. Decentralisation and its discontents
80
past era of water management in South Africa. While the new Water Act reflects a significant
departure from this paradigm, it has been suggested that management may revert to its
previous style, either inadvertently, for example, if the focus of decentralisation is on form
rather than function (Rogers et al. 2000), or deliberately if the pursuit of the Water Act
principles lead to unsustainable water use (Turton and Meissner 2002).
Under the Some, for All, Forever scenario, DWAF explicitly embraces the Water
Act’s efficiency, equity, sustainability principles. At the core of this scenario is a belief that a
vision of the desired state of the country’s water resources must be defined, which determines
the allocation for the human and ecological reserve, before any allocation proceeds. All
remaining water is allocated as economically efficiently as possible, as under the Efficiency
First rule. The vision, vis-à-vis ecological management classes, guides decisions about which
management actions to introduce. However, there is a particular tension in this scenario
between the Water Act’s equity and sustainability objectives, which are not always seen as
compatible (Turton and Meissner 2002).
Rules of the Game
The game as perceived by agents is to satisfy demand in accordance with scenario-
specific rules. Of interest is whether the way agents play the game enables the three Water
Act principles of efficiency, equity, and sustainability to be met. Efficiency of water use for
the WaterScape and the WMAs is measured in Rand value generated per cubic meter of water
use. Equity has multiple dimensions, and numerous indicators have been devised to measure
equity in water allocation and access, such as the Water Poverty Index (Sullivan 2002).
However, such measures are most easily applied within small areas and where socio-
economic data related to water usage at household level are available. The WaterScape model
does not operate at a resolution finer than the sectoral divisions of a quaternary catchment,
requiring the use of an alternative equity measure. For this purpose, an index of relative
dissatisfaction was developed, which measures the difference between the largest and smallest
ratios of water allocated to water demanded in a catchment, on the assumption that large
differences in satisfaction levels within a catchment are indicative of inequity. Index values
range from 1 to 10; a value of 1 represents a difference in allocation-demand ratios of less
than 0.1, and a value of 10 represents a difference greater than 0.9. Sustainability is measured
UUnniivveerrssiittyy ooff PPrreettoorriiaa eettdd,, BBoohheennsskkyy EE LL ((22000066))

4. Decentralisation and its discontents
81
by the extent of ecological transformation, defined as a present ecological management class
value of ‘D’ or worse.
A different set of indicators was required to evaluate the five sectors because they do
not correspond to spatially explicit areas; thus, the total value that the sector adds to the
economy in millions of Rands was calculated. In addition, a Gini coefficient (Taylor 1977)
was calculated to measure dissimilarity between the amounts of water allocated to the five
sectors in a catchment. However, this cannot be considered a true measure of equity between
sectors because opportunities for consumption differ greatly among sectors and catchments
(i.e. forestry is only viable where climatic conditions allow for it).
As the central decision-making agent, DWAF sets the rules under each scenario which
the CMAs and water users must adhere to. Within the constraints of these rules, water is
distributed among the sectoral agents in their catchment each year, and management
interventions are introduced by the CMAs to reconcile demand and supply (Table 4.1). In
addition, each scenario includes assumptions about changes in sectoral demand in each
WMA, based on a high and base growth projection to 2025 of the National Water Resources
Strategy (DWAF 2004a), which I assume hold for the 100-year period of the simulations.
In Efficiency First, if available water equals or exceeds the total demand of all agents
in the catchment, all agents get as much water as they need. If there is not sufficient water,
water is allocated in preferential order to the mines and industry, forestry, urban, rural, and
agricultural sectors respectively, until either all water is allocated or all demands are fulfilled.
Spatial reallocation is also used to achieve greater efficiency; for example, in catchments that
still have a deficit, water users may ‘offload’ their demand by relocating their businesses and
residences to catchments in the WMA who have surplus water, or by trading water use
licenses within their sector, serving to shift water use to water-rich areas. In WMAs where a
deficit remains, water may be transferred from the catchment with the largest surplus to the
catchment with the largest demand, on two conditions: water must travel over the shortest
distance possible, and only an amount equal to or less than the amount of the recipient’s
deficit may be transferred (i.e. the recipient gets only what it needs).
In Hydraulic Mission, the same rule used in Efficiency First applies if there is
sufficient water to meet all agents’ needs. If available water is less than the total demand, each
sector receives an amount proportional to its demand, serving to preserve the current sectoral
UUnniivveerrssiittyy ooff PPrreettoorriiaa eettdd,, BBoohheennsskkyy EE LL ((22000066))

4. Decentralisation and its discontents
82
Table 4.1. Scenario assumptions and rules. Scenario Efficiency First Hydraulic Mission Some, for All, Forever Allocation Strategy
Prioritises high-value sectors, then the Reserve
Allocates proportionally based on demand
Prioritises the Reserve, then high-value sectors
Interventions
Spatial redistribution of demand (i.e. relocation, license trading); high efficiency transfers with preference given to high-value sectors
Maximum volume transfers to largest consumers
Enforces demand management for large consumers; increase the ecological Reserve; restores untransformed catchments; high-efficiency transfers to areas in greatest need
Growth in sectoral demand
According to high projectionsa for urban, mining and industry, forestry; base projection for rural; no growth for agriculture
According to high projectionsa for agriculture, mining and industry, forestry, rural; base projection for urban
According to base projectionsa for urban, mining and industry, forestry, rural; no growth for agriculture
a National Water Resources Strategy projections to 2025 (DWAF 2004a). High projections
are based on an annual GDP growth rate of 4%, and low projections on a growth rate of 1.5%.
ratios of water use. If a WMA has a deficit, water may be transferred from the catchment with
the largest surplus to the catchment with the largest demand, serving to give preference to
catchments with high levels of consumption. The conditions specified above do not apply
under this scenario; thus a recipient can receive all of a donor’s available water, from any
location on the WaterScape.
In Some, for All, Forever, CMAs are required by the Water Act to satisfy the human
and ecological components of the Reserve, respectively. Remaining water is then allocated
according to the strategy used in Efficiency First. Water can then be transferred between
WMAs under the same conditions that apply to Efficiency First, but in this case priority is
given to the catchment with the largest deficit, irrespective of its demand. Under this scenario,
CMAs take several active measures in the catchments that they manage to improve
sustainability and equity. First, restoration efforts are undertaken as long as the level of
transformation and the withdrawal-to-availability ratio in the catchment are below the
threshold values. Second, if the difference between the allocation-demand ratios of the most
UUnniivveerrssiittyy ooff PPrreettoorriiaa eettdd,, BBoohheennsskkyy EE LL ((22000066))

4. Decentralisation and its discontents
83
and least satisfied users in the catchment exceeds 0.5 for five consecutive years (i.e. the most
satisfied user’s ratio is more than 50% greater than the least satisfied user’s), a CMA can
require the largest consumer in the catchment to reduce its demand by five percent; this could
be done, for example, through demand management practices that allow current productivity
to be maintained with less water. The CMA can also intervene if the ecological management
class deteriorates by five percent or more within a period of five years. When this happens, a
CMA may increase the ecological reserve requirement for the catchment by five percent,
provided that the requirement can currently be met.
The three scenarios above represent different forms of centralised decision-making for
the management of water, where sectoral agents have little autonomy. In reality, a
combination of these scenario-specific approaches for reconciling demand and supply is likely
to be adopted. To explore this, I introduce a learning scenario, which grants agents the ability
to choose between the three scenarios above based on collective experience. I assume that a
decentralised water management system selects elements of these three scenarios, depending
on whether control and continuity of water provision (Hydraulic Mission), market incentives
(Efficiency First), or social and environmental regulation (Some, for All, Forever) best meet
agent objectives.
In the model, learning is necessarily simplistic. The water management strategy of one
of the three scenarios is initially assigned at random to each catchment. In each subsequent
year, the catchment’s agents evaluate their collective success, as defined below, in the
previous year. If the agents unanimously consider themselves successful, they continue with
their previous strategy; if not, they evaluate the success of other catchments in their WMA
and adopt the strategy that they deem most successful, on the assumption that catchments
within a WMA are relatively similar and imitation is therefore rational behaviour (Jager et al.
2002). They are unable to make decisions beyond the confines of the three scenarios.
Two variants of learning are explored which represent alternative decision-making
approaches, one based on maximising returns, and one on minimising risk. In the first variant,
‘Learning by Maximum Allocation,’ agents strive to maximise the total allocation of water to
their catchment. If a catchment’s total allocation is less than 75% of the total demand of all
agents in the catchment, the agents consider this a failure and adopt the strategy used by the
catchment that received the largest allocation of water in the previous year. In the second
variant, ‘Learning by Proportion Satisfied,’ agents opt for the strategy that has the best chance
of being successful for the average catchment. If less than 75% of a catchment’s demand is
UUnniivveerrssiittyy ooff PPrreettoorriiaa eettdd,, BBoohheennsskkyy EE LL ((22000066))
4. Decentralisation and its discontents
84
able to be satisfied, agents in the catchment choose the strategy that satisfied (i.e. met 75% or
more of demand) the highest proportion of catchments in the WMA in the previous year.
Simulation Results
Each simulation was run for 100 years to allow a sufficiently long time interval for a
range of social-ecological system dynamics to emerge on the WaterScape, and was run 20
times to account for stochasticity; mean values are reported in all results below. The
achievement of the three Water Act principles is compared under each of the scenarios.
Results for quaternary catchments are aggregated at three levels: the whole WaterScape, the
WMAs, and the five sectors.
WaterScape
For the WaterScape as a whole, the prospect of achieving all three principles under
any single scenario appears unlikely (Table 4.2). Of the three paradigm scenarios, Efficiency
First is indeed the most efficient, achieving the highest value added to the economy per cubic
meter of water use at the end of the simulation. Hydraulic Mission is the most equitable based
on its mean dissatisfaction index value, while Some, for All, Forever is the most sustainable in
terms of ecological transformation. Both learning scenarios perform relatively well in terms of
efficiency and equity, and outperform all other scenarios for sustainability, with the second-
highest level of efficiency achieved under Learning by Proportion Satisfied and second-
highest level of equity occuring under Learning by Maximum Allocation, also the most
sustainable scenario.
Water Management Areas
When the WaterScape results are aggregated to the finer WMA scale, more complex
dynamics are observed. Similarly to the WaterScape as a whole, relatively high efficiency can
be attained in the WMAs without substantial increases in inequity, such as in the Crocodile
West and Marico and Upper Vaal WMAs under Efficiency First (Figures 4.3 and 4.4). Yet
high efficiency can come at significant cost to sustainability, as it does in the Upper Vaal,
Olifants, Mvoti to Umzimkulu, and Berg WMAs under the same scenario (Figure 4.5). On the
UUnniivveerrssiittyy ooff PPrreettoorriiaa eettdd,, BBoohheennsskkyy EE LL ((22000066))

4. Decentralisation and its discontents
85
Table 4.2. Efficiency, equity, and sustainability of water use on WaterScape at beginning and
end of 100 years under five scenarios, expressed respectively as value added, mean
satisfaction index value, and proportion of transformation. All figures are mean values from
20 simulations. EF = Efficiency First, HM = Hydraulic Mission, SFAF = Some, for all,
Forever, LMA = Learning by Maximum Allocation, LPS = Learning by Proportion Satisfied.
Numbers in bold indicate the maximum values for efficiency, equity, and sustainability
achieved after 100 years.
EF HM SFAF LMA LPS Value added (Rands/m3) Year 1 Year 100
17.96 31.25
15.19 12.80
16.66 17.81
16.65 22.65
16.61 24.85
Mean satisfaction index value Year 1 Year 100
3.16 2.28
1.85 1.85
3.34 2.45
2.81 1.99
2.82 2.01
Proportion of WaterScape transformed Year 1 Year 100
0.22 0.50
0.22 0.48
0.19 0.33
0.22 0.29
0.22 0.31
other hand, compared to the WaterScape as a whole, some of the trade-offs between the three
principles in some WMAs are much more modest. Examples can be found under each
scenario: in the Usutu to Mhlatuze WMA under Efficiency First, and the Mzimvubu to
Keiskamma under Hydraulic Mission and Some, for All, Forever. It is thus possible to strike a
balance between all three principles under all of these scenarios, but it should be noted that
these WMAs benefit from their location in the well-watered eastern part of the country with
relatively low water stress. However, the Lower Orange WMA, though the most water-
stressed in the country, remains at roughly constant levels of efficiency, equity, and
sustainability under Some, for All, Forever.
Some WMAs show little sensitivity to scenario selection. The Lower Orange and
Olifants/Doring WMAs (as well as Swaziland and Lesotho) achieve about the same low levels
of efficiency under all five scenarios, for example (Figure 4.3). A likely explanation is that
water use by the Lower Orange and Olifants/Doring WMAs is largely for agricultural
purposes, and as runoff in these WMAs is relatively low, their efficiency cannot easily rise
above 0-10 Rands/m3. The level of transformation of the Usutu to Mhlatuze WMA is likewise
insensitive to scenario selection, and remains relatively low under all situations (Figure 4.5).
UUnniivveerrssiittyy ooff PPrreettoorriiaa eettdd,, BBoohheennsskkyy EE LL ((22000066))

4. Decentralisation and its discontents
86
(a) (b)
(c) (d)
(e) (f)
Figure 4.3. Value added in Rands per m3 (a) at initialisation, and after 100 years under five
scenarios: (b) Efficiency First (c) Hydraulic Mission (d) Some, for all, Forever (e) Learning
by Maximum Allocation and (f) Learning by Proportion Satisfied. Values shown are means of
20 simulations.
UUnniivveerrssiittyy ooff PPrreettoorriiaa eettdd,, BBoohheennsskkyy EE LL ((22000066))

4. Decentralisation and its discontents
87
(a) (b)
(c) (d)
(e) (f)
Figure 4.4. Mean dissatisfaction index value (a) at initialisation, and after 100 years under five
scenarios: (b) Efficiency First (c) Hydraulic Mission (d) Some, for all, Forever (e) Learning
by Maximum Allocation and (f) Learning by Proportion Satisfied. Values shown are means of
20 simulations.
UUnniivveerrssiittyy ooff PPrreettoorriiaa eettdd,, BBoohheennsskkyy EE LL ((22000066))

4. Decentralisation and its discontents
88
(a) (b)
(c) (d)
(e) (f)
Figure 4.5. Proportion of catchments in WMA that are ecologically transformed (a) at
initialisation, and after 100 years under five scenarios: (b) Efficiency First (c) Hydraulic
Mission (d) Some, for all, Forever (e) Learning by Maximum Allocation and (f) Learning by
Proportion Satisfied. Values shown are means of 20 simulations.
UUnniivveerrssiittyy ooff PPrreettoorriiaa eettdd,, BBoohheennsskkyy EE LL ((22000066))

4. Decentralisation and its discontents
89
Conversely, WMAs with more diversified water use or higher water stress appear to be more
sensitive to the nature of decision-making.
Role of Learning
The ability to learn enables agents to search for a water management approach that
satisfies their demands for water given their particular environmental constraints. Under both
learning algorithms, scenario selection is patchily distributed, but Hydraulic Mission is clearly
dominant at the end of the simulation under Learning by Maximum Allocation, while the
majority of WMAs select Efficiency First at the end of the 100-year period (Figure 4.6).
Comparing these maps to those of the achievement of the three Water Act principles, it
becomes clear why water use is more sustainable under Learning by Maximum Allocation
than under any other scenario. Consider that CMAs can intervene in the water supply under
Hydraulic Mission by negotiating water transfers from surplus to deficit WMAs, and moving
all of the donor catchments’ available water between any two points on the WaterScape. As
water becomes increasingly scarce, this is probably the most aggressive way to access more,
and more available water relative to demand decreases the withdrawal-to-availability ratio and
hence transformation (despite the numerous risks associated with water transfers, which the
model ignores). Meanwhile, the success threshold (satisfaction of 75% or more of demand)
becomes increasingly difficult to meet, and agents who are unable to reap the merits of
Hydraulic Mission switch scenarios with increasing frequency as they search for the most
.
(a) (b)
Figure 4.6. Dominant scenario selected after 100 years under (a) Learning by Maximum
Allocation; (b) Learning by Proportion Satisfied. Values shown are means of 20 simulations.
UUnniivveerrssiittyy ooff PPrreettoorriiaa eettdd,, BBoohheennsskkyy EE LL ((22000066))
4. Decentralisation and its discontents
90
successful one. The effect is to maintain a diversity of strategies over the WaterScape and
thereby avoid dominance by a single strategy that becomes too successful at achieving one
principle at the expense of others In several WMAs the principles are achieved to a greater
degree under the learning algorithms than they are under any of the three scenarios, even
though these algorithms merely represent different ways of selecting from the three scenarios.
For example, the Lower Orange WMA achieves its highest efficiency under Learning by
Proportion Satisfied. Figure 4.6b shows that Efficiency First is indeed the dominant scenario
selected by the Lower Orange WMA at the end of the simulation. However, when Efficiency
First is used exclusively across the WaterScape, withdrawals by upstream WMAs do not
leave enough water for downstream WMAs to achieve their maximum efficiency. Similarly,
the Lower Vaal and Olifants/Doring WMAs, as well as Swaziland, all achieve their highest
levels of sustainability under Learning by Maximum Allocation and Learning by Proportion
Satisfied rather than under Some, for All, Forever, again possibly due to dynamics between
upstream and downstream water use.
Sectoral Outlook
Among the five sectors, who wins and loses? Are there trade-offs between maximising
value and minimising inequity? On the WaterScape as a whole, agriculture is the most notable
loser in terms of total value generated, which declines under all scenarios as water availability
decreases, but least so under Hydraulic Mission because of the status-quo rule (Table 4.3),
whereas priorities shift to higher-value water uses under all other scenarios. The forestry,
mining and industry, and urban sectors do best economically under Efficiency First. The rural
sector becomes increasingly important to the economy under Hydraulic Mission and also
under Learning by Proportion Satisfied; in the latter case, this reflects the emphasis on
satisfying the maximum number of water users, which benefits the rural sector because of the
broad spatial distribution of rural water use (i.e. rural use occurs in most catchments). The
most pronounced differences in value between scenarios are evident in the urban sector; high
urban growth is unique to the Efficiency First scenario, while it is drastically reduced under
all others.
Gini coefficients illustrate the dissimilarity in water consumption between the five
sectors (Table 4.4). Learning by Proportion Satisfied has the most even distribution, while
Hydraulic Mission has the least. Of note is that sectoral dissimilarity decreases during the
100-year period under all scenarios except Hydraulic Mission.
UUnniivveerrssiittyy ooff PPrreettoorriiaa eettdd,, BBoohheennsskkyy EE LL ((22000066))

4. Decentralisation and its discontents
91
Table 4.3. Valued added (millions of Rands) by each sector at beginning and end of 100 years
under five scenarios. Each value is the mean from 20 simulations; numbers in bold indicate
the maximum values achieved.
Scenario Year 1
EF HM SFAF LMA LPS
Agriculture 7677 7920 7258 7621 7670 Forestry 19504 19482 19480 19481 19485 Mines & Industry 76710 58258 65151 62738 66906 Rural 8963 6702 8089 7909 7916 Urban 62921 40048 42800 47519 48667 Total
175774 132410 142779 149768 150644
Year 100 Agriculture 2268 6944 3138 2493 2370 Forestry 38879 24205 19770 27704 24286 Mines & Industry 80446 39545 25063 32225 47081 Rural 7405 8821 5879 6690 8678 Urban 109153 10825 18131 20552 36862 Total 238152 90341 71981 89665 119277
Table 4.4. Gini coefficients for sectoral consumption at beginning and end of 100 years under
five scenarios. Each value is the mean from 20 simulations. Numbers in bold indicate the
minimum dissimilarity between sectors.
Year 1 Year 100
EF 0.37 0.29
HM 0.45 0.50
SFAF 0.40 0.35
LMA 0.41 0.25
LPS 0.40 0.21
Discussion
With the model results, I revisit two questions: first, which scenario(s) best achieve
the Water Act principles? Second, does decentralisation of decision-making and the ability to
learn indeed select for these principles, or are these best achieved through a centralised, top-
down planning approach? The model results suggest some answers to these questions. I then
discuss some implications of these findings for management, model limitations, and
suggested directions for further work.
UUnniivveerrssiittyy ooff PPrreettoorriiaa eettdd,, BBoohheennsskkyy EE LL ((22000066))

4. Decentralisation and its discontents
92
On the whole WaterScape, Efficiency First is most efficient, Hydraulic Mission is
most equitable based on the dissatisfaction index, Learning by Proportion Satisfied is the
most equitable based on sectoral consumption, and Some, for All, Forever is best poised for
sustainability. The difference in the outcome of these scenarios represents the fundamental
tension between fulfilling societal needs for water and achieving economic growth and
sharing its benefits on the one hand, and sustaining resources in order to benefit future
societies and ecosystems on the other. Because water consumption at Efficiency First levels is
not likely to be sustainable, the high level of efficiency and possibly the moderate level of
equity attained at the end of the 100-year period are also unlikely to be sustained. However,
the Efficiency First scenario may win popular support in the short term, particularly in light of
the severe backlog in access to adequate water services for a large fraction of the population
(DWAF 2004b). By contrast, the Some, for All, Forever scenario is likely to bring about only
modest improvements in equity and efficiency compared to current levels. Thus the relatively
small gains it forecasts for sustainability over the next century may not provide a sufficiently
convincing argument for worrying about ‘ forever’ now. What seems clear is that Hydraulic
Mission, despite its success in some WMAs, is unlikely to meaningfully achieve any of the
Water Act principles at the national level. The inconsistency between the mean dissatisfaction
index value and sectoral Gini coefficients under this scenario is noteworthy. While the index
value remains constant, sectoral dissimilarity increases, which is likely due to the agricultural
sector’s sustained high growth rate, enabling it to access increasingly larger volumes of water
even though its proportional share remains the same.
Does decentralisation of decision-making and the ability to learn help to achieve the
Water Act goals? Simulations where learning is allowed tend to achieve a more middle-of-
the-road position and strike a better balance between the three principles than simulations
where a single scenario prevails. Furthermore, decentralisation allows diversification of
strategy use in space or time, which tends to increase sustainability (Capenter and Brock
2004, Tengö and Belfrage 2004). This explains why the riskier maximum allocation scenario,
by forcing a higher proportion of users to change strategies, is the most sustainable for the
WaterScape and for some WMAs, though not the explicit goal of this scenario. Where
learning is allowed, variability within the system is maintained and provides insurance in
times of crisis (Holling and Meffe 1996); the system’s heterogeneity is its emergency support
system. Variability also enables the identification of more successful practices. The learning
scenarios can essentially be seen as adaptive management, which promote a heterogeneous,
‘patchy’ waterscape (Palmer and van Wyk, unpublished).
UUnniivveerrssiittyy ooff PPrreettoorriiaa eettdd,, BBoohheennsskkyy EE LL ((22000066))

4. Decentralisation and its discontents
93
While decentralisation seems to achieve somewhat better outcomes for the system as a
whole than the three centralised water management paradigms, does it create more
‘discontents’ at the WMA or catchment level? The model suggests that in some cases it does,
evident in the ability of many WMAs to achieve one or more of the Water Act principles best
under the paradigm scenarios. However, because it appears impossible for all WMAs to
simultaneously achieve all three principles under a single scenario, decentralisation provides
the opportunity for agents to experiment and learn rather than sink into any one particular
‘basin of attraction,’ that may be maladaptive and difficult to escape (Redman and Kinzig
2003).
The WaterScape’s sectoral water users are designed to be fundamentally self-
interested agents with a single purpose: to secure water for themselves. While this
representation may be partially accurate, to suggest that all agents are driven purely by the
same narrow, short-term goals is an admitted oversimplification. As the Water Act, the result
of an extensive participatory process, makes clear, a growing awareness of the importance of
sustainability is shared by many individual, communal, private, and other water users in South
Africa. At the same time, the increasing competition for water suggested by the model
simulations and elsewhere (Hirji et al. 2002, Kabat et al. 2002) may make longer-term
thinking and planning in water management incredibly difficult for many water users to
achieve, possibly even if sustainability is the first priority, and almost certainly if efficiency or
equity is.
Given the above, what are the implications for management? Any management
response in a complex social-ecological system will involve trade-offs, but the consequences
of decentralising South African water management for overall system resilience depend on
whether detrimental impacts occur where the system is able to absorb them (Bohensky and
Lynam 2005). While the WaterScape model does not indicate precisely what this absorption
capacity is, it does offer some practical insights. The inefficient agricultural sector is an
obvious place to direct negative impacts, for example, but this may not be socially acceptable.
The best solution for achieving the principles is likely to be embedded in a Some, for All,
Forever framework, but which adapts Efficiency First elements to allow incentives for the
agriculture sector to improve irrigation efficiency (DWAF 2004a), switch to other forms of
land-use e.g. ecotourism, or engage in virtual water trade which encourages a shift toward
higher-value crop production through import of lower-value water-intensive crops like cereals
(Allan 2002).
UUnniivveerrssiittyy ooff PPrreettoorriiaa eettdd,, BBoohheennsskkyy EE LL ((22000066))

4. Decentralisation and its discontents
94
Because the situation on the WaterScape is not always mirrored at the WMA scale or
sectoral level, and the definition of winners and losers may differ in space and time, a policy
framework that recognises social-ecological system diversity is likely to enhance resilience
more than a ‘one-size-fits-all’ one (Carpenter and Brock 2004). The unexpected sustainability
of the Learning by Maximum Allocation scenario as a result of frequently changing water
management strategies illustrates this point. The outcome is essentially the collective product
of individual agent decisions in response to their changing environment. Understanding how
these individual actions lead to emergent system properties is key for anticipating the future
of water management at the broader scale. In this respect, coupled learning by DWAF, the
CMAs, and local actors is essential (Palmer and van Wyk, unpublished). Thus the framework
suggested above also must accommodate and provide incentives for local (WMA or finer-
scale) diversification and experimentation to adjust to specific conditions. Some decisions,
such as those related to the long-term planning horizon and the Reserve requirement, need to
be made at the higher level of the national ministry, but the decentralisation of other decision-
making within the national framework offers a system of checks and balances for ensuring a
sustainable future.
The model has some clear limitations. As this is a broad-scale model of potential
water resource situations in South Africa, it is necessarily lacking in certain details, reflecting
a common trade-off in agent-based modeling (Goldstone and Janssen 2005). The primary
focus of this paper is on spatial rather than temporal dynamics, which are given closer
attention elsewhere (Bohensky, in prep.). In addition, learning in the model is quite simple:
agents use arbitrary, fixed thresholds in their determination of success, lack the ability to fully
evaluate cause and effect, and do not consider trends or remember events that happened long
ago. More realistic, complex learning, more intelligent agents, and the introduction of
economic behaviour would make for a richer model.
Conclusion
While the South African water sector has a tremendous opportunity for positive
innovation and change, this analysis reveals possible challenges related to decentralisation
and achievement of the Water Act principles from a social-ecological systems perspective.
Much of the current dialogue surrounding the implementation of the CMAs focuses on form
and nature of participation and contestation of water (Chikozho 2005) without considering
some of the fundamental social-ecological dynamics that will determine to what extent they
UUnniivveerrssiittyy ooff PPrreettoorriiaa eettdd,, BBoohheennsskkyy EE LL ((22000066))

4. Decentralisation and its discontents
95
will succeed or fail. A counterpoint to this dialogue is that CMAs, together with their
constituents, can be thought of and designed as learning organisations (MacKay et al. 2003)
that capture and put into practice lessons from past experience. Where information is
widespread and shared among all actors, the boundaries that define winners and losers may
become less distinct.
Learning has a paramount role in effective management of social-ecological systems
(Fazey et al. 2005) and should not be underestimated. The WaterScape model is an initial step
in what will hopefully become a broader investigation of the social-ecological dynamics that
are so tightly linked to the water management transition in South Africa. Further research
should address how water users learn, what motivates or inhibits their learning, and what
enables the translation from learning to action.
UUnniivveerrssiittyy ooff PPrreettoorriiaa eettdd,, BBoohheennsskkyy EE LL ((22000066))

4. Decentralisation and its discontents
96
Literature Cited
Alcamo, J., P. Döll, T. Henr ichs, F. Kaspar, B. Lehner, T. Rösch, and S. Sieber t. 2003. Global estimation of water withdrawals and availability under current and ‘ ‘business as usual’ ’ conditions. Hydrological Sciences 48: 339–348 Alcamo, J., T. Henr ichs, T. Rösch. 2000. World Water in 2025:Global Modeling Scenarios for the World Commission on Water for the Twenty-first Century. World Water Series Report 2, Center for Environmental Systems Research, University of Kassel, Germany. Allan, T. 2002. Water resources in semi-arid regions: real deficits and economically invisible and politically silent solutions. Pages 23-36 in A. R. Turton and R. Henwood, editors. Hydropolitics in the developing world: a southern African perspective. African Water Issues Research Unit, Pretoria, South Africa. Ander ies, J. M., M. A. Janssen, and E. Ostrom. 2004. A framework to analyze the robustness of social-ecological systems from an institutional perspective. Ecology and Society 9(1):18. [online] URL: http://www.ecologyandsociety.org/vol9/iss1/art18 Barreteau, O. P. Gar in, A. Dumontier , G. Abrami and F. Cernesson. 2003. Agent-Based Facilitation of Water Allocation: Case Study in the Drome River Valley. Group Decision and Negotiation. 12:441–461. Basson, M.S., P.H. van Niekerk and J.A. van Rooyen. 1997. Overview of water resources and utilisation in South Africa. DWAF report P RSA/00/0197, 72pp. Becu, N. P. Perez, A. Walker , O. Barreteau and C. Le Page. 2003. Agent based simulation of a small catchment water management in northern Thailand: Description of the CATCHSCAPE model. Ecological Modelling. 170:319–331. Biggs, R. and R.J. Scholes. 2002. Land-cover changes in South Africa 1911-1993. South African Journal of Science 98:420-424. Bohensky, E., B. Reyers, A. S. van Jaarsveld, and C. Fabr icius, editors. 2004. Ecosystem services in the Gariep Basin: a component of the Southern African Millennium Ecosystem Assessment. African Sun Media, Stellenbosch, South Africa. (Available online at http://www.millenniumassessment.org/en/subglobal.safma.aspx.) Bohensky, E., and T. Lynam. 2005. Evaluating responses in complex adaptive systems: insights on water management from the Southern African Millennium Ecosystem Assessment (SAfMA). Ecology and Society 10(1):11. [online] URL: http://www.ecologyandsociety.org/vol10/iss1/art11/. Bohensky, E., B. Reyers, and A.S. van Jaarsveld. 2006. Future ecosystem services in a southern African river basin: a scenario planning approach to uncertainty. Conservation Biology, in press. Bousquet, F., I . Bakam, H. Proton, and C. Le Page. 1998. Cormas: common-pool resources and multi-agent systems. Lecture Notes in Artificial Intelligence 1416:826-838.
UUnniivveerrssiittyy ooff PPrreettoorriiaa eettdd,, BBoohheennsskkyy EE LL ((22000066))
4. Decentralisation and its discontents
97
Bousquet, F. and C. Le Page. 2004. Multi-agent simulations and ecosystem management: a review. Ecological Modelling 176:313–332. Carpenter , S. R. and W. A. Brock. 2004. Spatial complexity, resilience and policy diversity: fishing on lake-rich landscapes. Ecology and Society 9(1): 8. [online] URL: http://www.ecologyandsociety.org/vol9/iss1/art8. Chikozho, C. 2005. Policy and institutional dimensions of integrated river basin management: Broadening stakeholder participatory processes in the Inkomati River Basin of South Africa and the Pangani River Basin of Tanzania. Commons southern Africa occasional paper series No 12. Centre for Applied Social Sciences/Programme for Land and Agrarian Studies, Harare and Cape Town. Available online at http://www.cassplaas.org/. Cosgrove, W. and F. Rijsberman. 2000. World Water Vision: Making Water Everybody’s Business. World Water Council. Earthscan Publications, London. Dent, M. C. 2005. CMA Leadership Letter 37: Capacity, Skills, Empowerment and Delivery. Available from [email protected]. Diamond, J. 2005. Collapse: how societies choose to fail or survive. Penguin Books, London. Dietz, T., E. Ostrom, and P.C. Stern. 2003. The struggle to govern the commons. Science 302:1907-1912. DWAF (Depar tment of Water Affairs and Forestry). 1999. Resource Directed Measures for Protection of Water Resources. Volume 3: River Ecosystems Version 1.0, Pretoria. DWAF (Department of Water Affairs and Forestry). 2004a. First edition of the National Water Resources Strategy, DWAF, Pretoria, South Africa. Available online at http://www.dwaf.gov.za/. DWAF (Depar tment of Water Affairs and Forestry). 2004b. A decade of delivery. DWAF, Pretoria, South Africa. Available online at: http://www.dwaf.gov.za/Communications/Articles/Kasrils/2004/TEN%20YEARS%20OF%20DELIVER%20ARTICLE.doc. Epstein, J. and R. Axtell. 1996. Growing artificial societies: social science from the bottom-up. Brookings Inst. Press/MIT Press, Washington, D.C. Erasmus, L ., A. S. van Jaarsveld and P.O. Bommel. 2002. A spatially explicit modelling approach to socio-economic development in South Africa. Pages 91-96 in A.E. Rizzoli and A.J. Jakeman, editors. Proceedings of the First Biennial meeting of the International Environmental Modelling and Software Society. International Environmental Modelling and Software Society, Manno, Switzerland. Farolfi, S. R. Hassan, S. Per ret and H. MacKay. 2004. A role-playing game to support multi-stakeholder negotiations related to water allocation in South Africa: first applications and potential developments. Paper presented at Conference on Water Resources as
UUnniivveerrssiittyy ooff PPrreettoorriiaa eettdd,, BBoohheennsskkyy EE LL ((22000066))

4. Decentralisation and its discontents
98
Ecosystems: Scientists, Government, and Society at the Crossroads. Midrand, South Africa, 5-7 July 2004. Fazey, I ., J. A. Fazey, and D. M. A. Fazey. 2005. Learning more effectively from experience. Ecology and Society 10(2):4. [online] URL: http://www.ecologyandsociety.org/volXX/issYY/artZZ/ Gallopín, G., A. Hammond, P. Raskin, and R. Swart. 1997. Branch points: global scenarios and human choice. Stockholm Environment Institute, Stockholm. Galvin, M. and A. Habib. 2003. The politics of decentralisation and donor funding in South Africa’s rural water sector. Journal of Southern African Studies 29: 865-884. Goldstone, R. L . and M. A. Janssen. 2005. Computational models of collective behavior. Trends in Cognitive Sciences 9: 424-430. Görgens, A. H. M., and B. W. van Wilgen. 2004. Invasive alien plants and water resources in South Africa: current understanding, predictive ability and research challenges. South African Journal of Science 100:27-33. Gunderson, L . H., and C. S. Holling, editors. 2002. Panarchy: understanding transformations in human and natural systems. Island Press, Washington, D.C. Gunderson, L . H., C. S. Holling, and G. D. Peterson. 2002. Surprises and sustainability: cycles of renewal in the everglades. Pages 315-332 in L. H. Gunderson and C. S. Holling, editors. Panarchy: understanding transformations in human and natural systems. Island Press, Washington, D.C. Hassan, R. M. 2003. Economy-wide benefits from water-intensive industries in South Africa: quasi-input–output analysis of the contribution of irrigation agriculture and cultivated plantations in the Crocodile River catchment. Development Southern Africa. 20(2): 171-195. Haupt, C. J. 2001. Water resources situation assessment: Groundwater resources of South Africa. Department of Water Affairs and Forestry, Pretoria, South Africa. Holling, C.S. and G. K. Meffe. 1996. Command and control and the pathology of natural resource management. Conservation Biology 10: 328-337. Holling, C. S., and L . H. Gunderson. 2002. Resilience and adaptive cycles. Pages 25-62 in L. H. Gunderson and C. S. Holling, editors. Panarchy: understanding transformations in human and natural systems. Island Press, Washington, D.C., USA. Hir j i, R., P. Johnson, P. Maro, P. Matiza and T. Chiuta, editors 2002. Defining and Mainstreaming Environmental Sustainability in Water Resources Management in Southern Africa. SADC, IUCN, SARDC, World Bank, Maseru/Harare/Washington. Hughes, D.A. and P. Hannart. 2003. A desktop model used to provide an initial estimate of the ecological instream flow requirements of rivers in South Africa. Journal of Hydrology 270:167-181.
UUnniivveerrssiittyy ooff PPrreettoorriiaa eettdd,, BBoohheennsskkyy EE LL ((22000066))

4. Decentralisation and its discontents
99
Jager, W., M. A. Janssen and C. A. J. Vlek. 2002. How uncertainty stimulates over-harvesting in a resource dilemma: three process explanations. Journal of Environmental Psychology. 22:247-263. Janssen, M. A. and S. R. Carpenter . 1999. Managing the Resilience of Lakes: A multi-agent modeling approach. Conservation Ecology 3(2): 15. [online] URL: http://www.consecol.org/vol3/iss2/art15 Kabat, P., R.E. Schulze, M. E. Hellmuth and J. A. Veraar t, editors. 2002. Coping with impacts of climate variability and climate change in water management: a scoping paper. DWC-Report no. DWCSSO-01(2002), International Secretariat of the Dialogue on Water and Climate, Wageningen. Kalikoski, D. C., M. Vasconcellos, and L . Lavkulich. 2002. Fitting institutions to ecosystems: the case of artisanal fisheries management in the estuary of Patos Lagoon. Marine Policy 26:179–196. Kleynhans, C.J. 2000. Desktop estimates of the ecological importance and sensitivity categories (EISC), default ecological management classes (DEMC), present ecological status categories (PESC), present attainable ecological management classes (present AEMC), and best attainable ecological management class (best AEMC) for quaternary catchments in South Africa. DWAF report. Institute for Water Quality Studies, Pretoria, South Africa. Lansing, J. S. and J. N. Kremer. 1993. Emergent properties of Balinese water temple networks: coadaptation on a ruggedness landscape. American Anthropologist 95:97-114. Larson, A.M. and J.C. Ribot. 2004. Democratic decentralisation through a natural resource lens: an introduction. European Journal of Development Research 16:1–25. Lee. K. N., editor. 1993. Compass and gyroscope: integrating science and politics for the environment. Island Press, Washington, D.C. MacKay, H.M., K.H. Rogers and D.J. Roux. 2003. Implementing the South African water policy: holding the vision while exploring an uncharted mountain. Water SA 29: 353-358. MA (Millennium Ecosystem Assessment). 2003. Ecosystems and human well-being: a framework for assessment. Island Press, Washington, D.C. Nel, J., G. Maree, D. Roux, J. Moolman, N. K leynhans, M. Silberbauer and A. Dr iver . 2004. South African National Spatial Biodiversity Assessment 2004: Technical Report. Volume 2: River Component. CSIR Report Number ENV-S-I-2004-063. Council for Scientific and Industrial Research, Stellenbosch, South Africa. Pahl-Wostl, C. 2002. Towards sustainability in the water sector – The importance of human actors and processes of social learning. Aquatic Sciences 64: 394–411. Palmer, C. and E. van Wyk. “Patch dynamics for people and ecosystems: a synthesis of the ‘People and Ecosystems’ sessions.” In Building constructive engagement between scientists, government and society in managing water Resources as ecosystems: notes on a workshop following the SASAqS 2004 conference. Midrand, South Africa.
UUnniivveerrssiittyy ooff PPrreettoorriiaa eettdd,, BBoohheennsskkyy EE LL ((22000066))

4. Decentralisation and its discontents
100
Palmer C.G., R.S. Berold and W.J. Muller . 2004. Environmental water quality in water resources management. WRC Report No TT 217/04, Water Research Commission, Pretoria, South Africa. Pritchard, L . and S.E. Sanderson. 2002. The dynamics of political discourse in seeking sustainability. Pages 147-169 in L. H. Gunderson and C. S. Holling, editors. Panarchy: understanding transformations in human and natural systems. Island Press, Washington, D.C. Redman, C. L . and A. P. Kinzig. 2003. Resilience of past landscapes: resilience theory, society, and the longue durée. Conservation Ecology 7(1):14. [online] URL: http://www.consecol.org/vol7/iss1/art14. Ribot, J. C. 2002a. Democratic decentralization of natural resources: institutionalizing popular participation. World Resources Institute, Washington D.C., USA. Ribot, J. C. 2002b. African decentralisation: Local actors, powers, and accountability. Democracy, Governance, and Human Rights working paper no. 8, United Nations Research Institute for Social Development and the International Development Research Centre, Geneva. Rogers, K., D. Roux and H. Biggs. 2000. Challenges for catchment management agencies: lessons from bureaucracies, business and resource management. Water SA 26:505-511. Schulze, R. E. 2005. Climate change and water resources in Southern Africa. WRC Report Number 1430/1/05. Water Research Commission, Pretoria, South Africa. Sullivan, C. 2002. Calculating a Water Poverty Index. World Development. 30:1195-1210. Taylor 1977. Quantitative methods in geography. Houghton-Mifflin, Boston. Tengö, M. and K. Belfrage. 2004. Local management practices for dealing with change and uncertainty: a cross-scale comparison of cases in Sweden and Tanzania. Ecology and Society 9(3):4. http://www.ecologyandsociety.org/vol9/iss3/art4. Turton, A.R. and R. Meissner . 2002. The hydrosocial contract and its manifestation in society: A South African case study. Pages 37-60 in A. R. Turton and R. Henwood, editors. Hydropolitics in the developing world: a southern African perspective. African Water Issues Research Unit, Pretoria, South Africa. Vörösmar ty, C. J., P. Green, J. Salisbury, and R. B. Lammers. 2000. Global water resources: vulnerability from climate change and population growth. Science 289:284–288. Watson, M., Senior Specialist Engineer, Sub-Directorate: Water Resource Planning Systems, Directorate: Systems Analysis, Department of Water Affairs and Forestry. Personal Communication. Wilson, J. 2002. Scientific uncertainty, complex systems, and the design of common-pool institutions. Pages 327-360 in E. Ostrom, T. Dietz, N. Dols ak, P.C. Stern, S. Stovich, and
UUnniivveerrssiittyy ooff PPrreettoorriiaa eettdd,, BBoohheennsskkyy EE LL ((22000066))

4. Decentralisation and its discontents
101
E.U. Weber, editors. The Drama of the Commons. Committee on the Human Dimensions of Global Change, National Research Council, National Academy Press, Washington, DC. WCD (Wor ld Commission on Dams). 2000. Orange River Development Project, South Africa case study, prepared as an input to the World Commission on Dams, Cape Town, South Africa. Available online at: http://www.dams.org.
UUnniivveerrssiittyy ooff PPrreettoorriiaa eettdd,, BBoohheennsskkyy EE LL ((22000066))

Learning dilemmas in a social-ecological system: an agent-based modelling exploration
Erin L. Bohensky
Centre for Environmental Studies, University of Pretoria, Pretoria, 0002 South Africa
Tel: +27-21-8082604
Fax: +27-21-8082405
For submission to: Ecological Modelling
UUnniivveerrssiittyy ooff PPrreettoorriiaa eettdd,, BBoohheennsskkyy EE LL ((22000066))

5. Learning dilemmas
102
Abstract
The process of learning in social-ecological systems is an emerging area of research, but little
attention has been given to how social and ecological interactions motivate or inhibit learning.
This is of great relevance to the South African water sector, where a major policy transition is
occurring that will give local water users and managers new opportunities to engage in
adaptive learning about how to balance human and ecological needs for water. In this paper,
an agent-based model is used to explore South African water management’s potential
‘ learning dilemmas,’ or barriers to learning, whereby human perceptions combined with
social-ecological conditions affect the capacity, understanding, and willingness required to
learn. Agents manage water according to one of three management strategies and use various
indicators to evaluate their success. The model shows that in areas with highly variable
hydrological regimes, agents may be less able to learn because conditions change too rapidly
for them to benefit from past experience. Because of this rapid change, however, agents are
more likely to try new water management strategies, promoting a greater diversity of
experience in the system for agents to learn from in the future. Similarly, in water-stressed
areas, where agents tend to have greater difficulty fulfilling demand for water than in areas
with abundant water supplies, they are more apt to try new strategies. When learning is
restricted to small areas, agents may learn more quickly but based on a more narrow range of
experience than in larger or more heterogeneous areas. These results suggest a need for
specific monitoring to enhance learning that take into account the impacts of interacting
hydrological, ecological, and social dynamics on learning. Although this is only a preliminary
exploration of the challenges to learning, more analysis of this kind can eventually help to
reverse the past trend of poor understanding of social-ecological dynamics as they relate to
water management.
UUnniivveerrssiittyy ooff PPrreettoorriiaa eettdd,, BBoohheennsskkyy EE LL ((22000066))

5. Learning dilemmas
103
1. Introduction
Sustainable management of complex social-ecological systems is based on an
understanding and maintenance of system function and structure, amid situations of change
and uncertainty (Walker et al. 2002). In particular, the ability of decision makers to capture
system information so that important patterns can be detected is essential to achieving
sustainability (Wilson 2002). Social-ecological systems, however, are inherently dynamic,
requiring decision makers to not only detect patterns, but also to constantly ‘keep up’ with
change in these patterns through reflection and adaptive learning. More often than not,
however, institutions are disadvantageously positioned, first to capture and process
appropriate information, and secondly to use it to guide management, serving to explain
numerous resource management failures (Carpenter et al. 2002).
Historically, both types of barriers - to learning and integrating learning into
management - have plagued South African water management, the example discussed in this
paper. I do not explicitly address the challenge of incorporating learning into management,
which is addressed elsewhere (Rogers and Biggs 1999, Lynam and Stafford Smith 2004,
Fazey et al. 2005). Improving learning has been recognized as a high priority for the
individuals and organizations responsible for implementing the South African Water Act of
1998 (Rogers et al. 2000, van Wyk et al. 2001, MacKay et al. 2003) and its accompanying set
of institutional reforms. This will require management of water resources at a catchment
scale, marking a significant transition in information and power flows (Dent 2001) and an
opportunity for further learning by actors across all scales. However, numerous barriers to
learning will need to be overcome. Many of these arise from human perceptions of water
resources that have been based on, and further contribute to, a flawed understanding (MacKay
2003). Meanwhile, these perceptions are confounded by social-ecological dynamics such as
water stress, water variability, and ability of actors to access relevant information through
learning networks. In this paper an agent-based modelling approach is used to investigate
some of the major barriers to learning, which I call ‘ learning dilemmas,’ confronting South
African water management. This is followed by an examination of the implications of these
outcomes for future water management and monitoring.
1.1. Learning how to learn
UUnniivveerrssiittyy ooff PPrreettoorriiaa eettdd,, BBoohheennsskkyy EE LL ((22000066))

5. Learning dilemmas
104
The problem of ‘ learning how to learn’ is garnering increasing attention from
researchers in the natural and social sciences, as well as natural resource managers and
practitioners (Gunderson et al. 1995, Pahl-Wostl 2002, Berkes and Folke 2003, Fazey et al.
2005). Learning in social-ecological systems is important for several reasons. This is a time of
dynamic change: we are inundated – if not overwhelmed – by information, data, and
computational power, exert tremendous pressure on resources, and have forged greater
interconnectedness among disparate parts of global systems than possibly ever before in the
history of the human enterprise (Holling et al. 2002). While most modern societies seem to
embrace and indeed invest in this complexity (Tainter 2000), it can be difficult to filter crucial
signals from noise.
As change and complexity increase, so does awareness of the limits of scientific
knowledge and understanding for solving integrated problems in the real world (Holling et al.
2002). Active adaptive management, which integrates research and action (Salafsky et al.
2001, Fazey et al. 2005), is commonly advocated as an approach based on this awareness.
Learning becomes especially pertinent in the modern era of natural resource management, in
which involvement of local resource users through participatory processes and management
guided by alternative epistemologies (i.e. cosmologies, taboos) that depart from Western
positivist science is becoming commonplace (Berkes and Folke 1998, Berkes et al. 2000,
Wollenberg et al. 2000). In this paper, the definition of learning is not restricted to the
expansion of a formal body of knowledge about the natural environment, but includes varied
individual and societal perceptions of this environment (Adams et al. 2003) as well as needs
and aspirations in relation to it (Sen 1999). Learning is also understood to be a dynamic
process, in which the interpretation of feedbacks is a key element. This includes the ability to
read cues from the environment as well as to respond to them appropriately (Berkes and Folke
1998, Tengö and Belfrage 2004).
1.2. ‘Learning dilemmas’
Gallopín (2002) suggests that decision-making for sustainable development rests on
three ‘pillars’ : capacity, understanding, and willingness. This metaphor is extended to the
analysis of learning in the South African water sector. ‘Learning dilemmas’ – akin to cracks
in the pillars – form when human perceptions combined with social-ecological conditions
produce a deficiency of capacity, understanding, or willingness to learn. Understanding in
learning terms means perceiving a problem in relation to learning; knowing what and how to
UUnniivveerrssiittyy ooff PPrreettoorriiaa eettdd,, BBoohheennsskkyy EE LL ((22000066))

5. Learning dilemmas
105
learn. Willingness to learn depends on confidence in learning; belief that learning will help
solve problems, as well as the acceptance of some level of risk, or tolerance of change. The
ability to learn depends on reliable access to a ‘ learning network’ from which information can
be obtained. This may include other actors, media, or experimentation that allows for
recording and evaluation of past experiences. Naturally, capacity, understanding, and
willingness are all related, so may sometimes function as a ‘package’ as well as individual
pillars.
In resource management, such dilemmas are common. Human and natural systems are
linked social-ecological systems (Berkes et al. 2003); thus, an impact on one system
component invariably affects the other. Human societies have a long history of learning how
to manage these systems sustainably (Berkes et al. 2000), but the very nature of social-
ecological systems can cause challenges to learning. For example, natural environmental
variability may obscure signals and make it difficult to relate cause and effect (Fazey et al.
2005). Anthropogenic changes to the environment can also convolute understanding of
natural processes. Ironically, it has been common practice to reduce natural ecosystem
variability to increase productivity of a resource, although this may compromise learning
ability and decrease adaptability over the longer term (Holling and Meffe 1996). For example,
when dams reduce natural variability by stabilizing river flows (Hughes et al. 2005), people
become accustomed to distortions in the hydrological system, and respond in ways that would
be unlikely in the absence of such interventions, such as using water-consumptive devices in
the home. Learning may be stalled by differences in opinion about what learning priorities are
and how they should be achieved; although managers and leaders may want to encourage
learning, they may diverge on priorities or the way to achieve them. In other cases, leaders
may limit public acquisition of new information because it is perceived as a threat to their
power (Pritchard and Sanderson 2002).
Learning in the South African water sector, while affected by most of these problems,
has been particularly influenced by three significant characteristics of South African water
resources: high temporal variability, spatial heterogeneity (Basson 1997), and water stress that
is expected to intensify during the next 20 years (Seckler 1998). These conditions are likely to
have even more impact in the future, due to the effects of climate change (Schulze 2005) and
increasing demand for limited resources. Although these three characteristics are not the only
ones that contribute to learning dilemmas, they are among the most important and are the
focus of this paper.
UUnniivveerrssiittyy ooff PPrreettoorriiaa eettdd,, BBoohheennsskkyy EE LL ((22000066))

5. Learning dilemmas
106
2. Change in the South Afr ican water sector
In the South African water sector, understanding of social-ecological dynamics has
been poor and information has not historically been collected with such understanding in
mind. South Africa shares the water management trajectory of many nations, where an initial
focus on supply-side solutions is giving way to more integrated demand-side management as
water stress increases (van Wyk et al. 2001). During the 20th century, learning was based on
science and knowledge that was generated and controlled by the state (Dent 2001). This top-
down style of water resources isolated itself from much of the knowledge that existed on the
ground and had been amassed through observations and research by communities and civil
society organizations.
The value of learning was also obscured by the prevailing worldview of the
relationship between water and society. Water resources – and all of nature for that matter –
were seen as guided by linear processes with predictable, controllable outcomes, though in
fact, water resource dynamics throughout southern Africa are highly variable and non-linear.
In the previous era, it was believed that most problems that arose could be solved through
already proven technical means (Turton and Meissner 2002) – water shortages could be
averted by building large storage dams, for example. The need to monitor was rarely
recognised, because it was believed all of the necessary information already existed and any
problems that arose could be dealt with in the same way as before. Within this environment,
resistance to change grew. Because change was not encouraged, it was very costly to attempt
to deviate from the ‘sanctioned discourse’ of water management (Turton and Meissner 2002).
Trying new approaches was synonymous with abandoning accepted views and long-held
traditions, admitting flaws in current practices, and jeopardizing one’s job or career, and as
such, little investment was made in the construction of a broad knowledge base (Dent 2001).
Locally, access to information was hampered by poor infrastructure, low levels of education
and literacy, livelihood demands, poverty, and limited opportunities for interaction with a
broad range of actors (Motteux 2002).
The situation of the past is in stark contrast to the vision outlined in the country’s
current legislation, the Water Act of 1998, and its basis on three principles: efficiency, equity,
and sustainability. By this law, some of the powers formerly held by the state will be
devolved to large catchment-scale institutions called catchment management agencies
(CMAs), which together with their constituents will each prepare a catchment management
strategy for the water management area (WMA) over which it presides. Currently, the biggest
UUnniivveerrssiittyy ooff PPrreettoorriiaa eettdd,, BBoohheennsskkyy EE LL ((22000066))

5. Learning dilemmas
107
learning challenge faced in this arena revolves around implementation of the Act, which
represents a major cognitive and institutional shift from the previous system of water
management. Meeting its three principles is expected to require an adaptive approach (Rogers
et al. 2000, MacKay et al. 2003), because a uniform management regime cannot
accommodate the vast range of variation and unpredictability in the country’s water resources
and water use.
3. An agent-based model of learning
To better understand how people learn how to manage social-ecological systems over
large scales, models have been used to investigate social and environmental conditions that
motivate or inhibit learning in ecosystem management. Many of these efforts have used an
agent-based modelling approach, which allows the observation of dynamics that emerge from
individual decisions over large scales of space and time (Epstein and Axtell 1996, Bousquet
and Le Page 2004). These models have explored, for example, learning under alternative
institutional regimes for managing rangelands (Janssen et al. 2000), perceptions of actors in a
Swiss water supply system (Pahl-Wostl 2002), the effect of uncertainty on overharvesting
(Jager et al. 2003), learning trajectories of lake managers when confronted with surprise
(Peterson et al. 2003), and the prevalence of ‘sunk cost effects’ that lead to irrational decision
making in groups of rational agents (Janssen and Scheffer 2004).
Much of the modelling of South Africa’s water resources to date has not included
social processes (Dent 2000). An agent-based model, called the WaterScape, is used in this
paper to ask whether agents in a simplified version of the situation described above exhibit
unique patterns of learning. Developed with CORMAS (Common-pool Resources and
Multiagent Systems), an object-oriented programming platform (Bousquet et al. 1998), the
WaterScape has been used in related work to explore the ability of water users to meet the
South African Water Act principles by adopting different strategies and using different
methods of learning (Bohensky, submitted). Here, a series of learning experiments is
conducted to explore two aspects of learning dilemmas: 1) how different social-ecological
conditions and 2) agents’ selection of different indicators to evaluate their actions affect
capacity to learn, willingness to learn, and understanding of how and what to learn.
UUnniivveerrssiittyy ooff PPrreettoorriiaa eettdd,, BBoohheennsskkyy EE LL ((22000066))

5. Learning dilemmas
108
3.1. Spatial environment
The learning ‘game’ is played on a spatial environment representing the collective
surface water resources of South Africa, and upstream neighbours Lesotho and Swaziland
(Figure 5.1). Namibia, which lies partially downstream of South Africa, is not included in the
(a)
(b)
Figure 5.1. (a) Map of South Africa depicting international boundaries and Water
Management Areas (WMAs). (b) Visual representation of WMAs in the CORMAS program.
modelled environment consists of quarter-degree-square (50 km2) grid cells, each of which
represents approximately one quaternary catchment. Each quaternary catchment that falls
entirely or partially within South Africa belongs to one of nineteen contiguous Water
Management Areas (WMA).
UUnniivveerrssiittyy ooff PPrreettoorriiaa eettdd,, BBoohheennsskkyy EE LL ((22000066))

5. Learning dilemmas
109
model, although the Water Act makes provision for water-sharing with neighbouring
countries. The total area (1268 km2) is divided into 1946 quaternary catchments. The Initial
runoff values are obtained from a hydrologic model of the region, the Water Situation
Assessment Model (WSAM) version 3.0 (Watson, personal communication). At each time
step, equivalent to one year, runoff in a catchment is replenished at a rate that reflects inter-
annual variation, based on a normally-distributed random function and the catchment’s
hydrological index value, a measure of flow variability (Hughes and Hannart 2003). Runoff is
also affected by climate change, which is likely to lead to pronounced decreases in runoff that
will move progressively from west to east. In the model I assume a 10% decrease in runoff by
2015 in the western part of the country and a 10% decrease in runoff by 2060 in the eastern
part of the country, with increases in some catchments along the eastern seaboard, in the
northeast, and isolated areas in the west during the same period (Schulze 2005). Water that is
not withdrawn for consumption flows to downstream catchments.
3. 2. Agent decision-making
Water management decisions are based on information about the environment that is
socially-constructed, and tend to be framed by a prevailing discourse on the relationship
between water resources and society (Turton and Meissner 2002). However, this discourse is
mediated by individual agent worldviews regarding the ‘ real’ world (Janssen and de Vries
1998). These social and individual perceptions of the WaterScape environment manifest in the
selection of measures or indicators used by agents to make decisions (Figure 5.2). The
effectiveness of a water management strategy may be judged very differently when it is based
on an indicator of economic value that can be obtained from a catchment and an indicator of
ecological transformation in the catchment.
3.2.1. Agents
In this model there are two types of agents, each of which represents a level of
decision-making. The first type represents a water use sector, of which there are five:
agriculture, forestry, mining and industry, rural and urban. The CMA is the second type of
agent in the model, whose purpose is to enforce rules to balance demand and supply in its
Water Management Area (WMA). The sectoral agents’ objective is to meet their demand with
UUnniivveerrssiittyy ooff PPrreettoorriiaa eettdd,, BBoohheennsskkyy EE LL ((22000066))

5. Learning dilemmas
110
Figure 5.2. Schematic of major relationships governing an actual and perceived environment
in a social-ecological system. Indicators are a link between management paradigms and the
‘ real’ world. The selection of indicators may be refined with changes in the paradigm or
observations of the real world; the paradigm may change with information from the indicator
or real world experience. The real world can likewise be changed through actions driven by
the paradigm. Changes in the real world can influence both the information provided by the
indicator and the choice of management paradigm.
existing supplies in their quaternary catchment. Each sector has a distinctive pattern of water
use, based on various biophysical (e.g. land-cover, geology, climate) and socioeconomic (e.g.
demographics, infrastructure) factors. Initial demand values for the model are obtained from
the WSAM, as above. These amounts change from year to year in accordance with
assumptions of each paradigm, and are estimated from a high or base growth projection for
each sector and each WMA (DWAF 2004).
3.2.2. Demand projections
Growth in sectoral demand is constrained to catchments in which the sector already
consumes water; this constraint prevents agricultural growth, for example, from occurring in
areas that are not viable for agriculture, but also prevents some potentially realistic growth,
such as urban development in a presently rural area. To a large degree, areas that are suitable
and available for agriculture and forestry in South Africa are already in use, and thus little
Social-ecological system management
paradigm: belief about how system should be
managed
Real wor ld: only par tially
known/ understood by human agents
Indicators: reveal how well a
paradigm is working to manage
the real wor ld
UUnniivveerrssiittyy ooff PPrreettoorriiaa eettdd,, BBoohheennsskkyy EE LL ((22000066))

5. Learning dilemmas
111
further expansion is expected (Biggs and Scholes 2002). Urbanisation, while expected to have
prolific implications for water resources in South Africa (DWAF 2004), were not explored in
order to keep model complexity manageable.
3.2.4. Water productivity
The productivity of water use (i.e. contribution to GDP per unit of water consumed)
by these sectors varies greatly, with industry generating more than 50 times the GDP of
agriculture for a given quantity of water (DBSA 2000). I use the following sectoral
multipliers to derive value generated in South African Rands per cubic meter, based on
estimates of DBSA (2000): 1.4 for agriculture, 73.6 for forestry and mining and industrial, 30
for urban and 10 for rural water use. As more detailed data on water productivity is limited,
these average multipliers for the country only provide a rough indication of the relative value
of water use by different sectors. These multipliers do not reflect variation within sectors or
between regions, nor possible change over the 100-year period, all of which may be
significant.
3.2.5. Human and Ecological Reserve
Under the 1998 Water Act, the allocation of water to meet sectoral demands must take
into account a legally-defined Reserve, which has two components (DWAF 2004). The
human reserve is a mandated minimum of 25 litres per person per day from a source within
200 meters of the home. The ecological reserve refers to the quantity, quality, pattern, timing,
water level, and assurance of water that must remain in a river in order to ensure its ecological
functioning. The ecological reserve requirement is to be set by DWAF for each quaternary
catchment based on a desired ecological management class, in turn based on objectives for the
water resources (Palmer et al. 2004). Class values range from A for a pristine water resource
to F for a critically modified one. Where conservation and ecotourism are viewed as important
objectives for the water resource, for example, the desired class would be designated as an A
and a higher ecological reserve requirement would be set, while the desired class would be
designated as a C or D and the reserve requirement would be lower if the primary objective of
the resource was to provide water for waste disposal. Desktop estimates of the present
ecological management class for each quaternary catchment (Kleynhans 2000) are used in the
model, where each class corresponds to a range of numerical values, which increase with
increasing modification.
UUnniivveerrssiittyy ooff PPrreettoorriiaa eettdd,, BBoohheennsskkyy EE LL ((22000066))
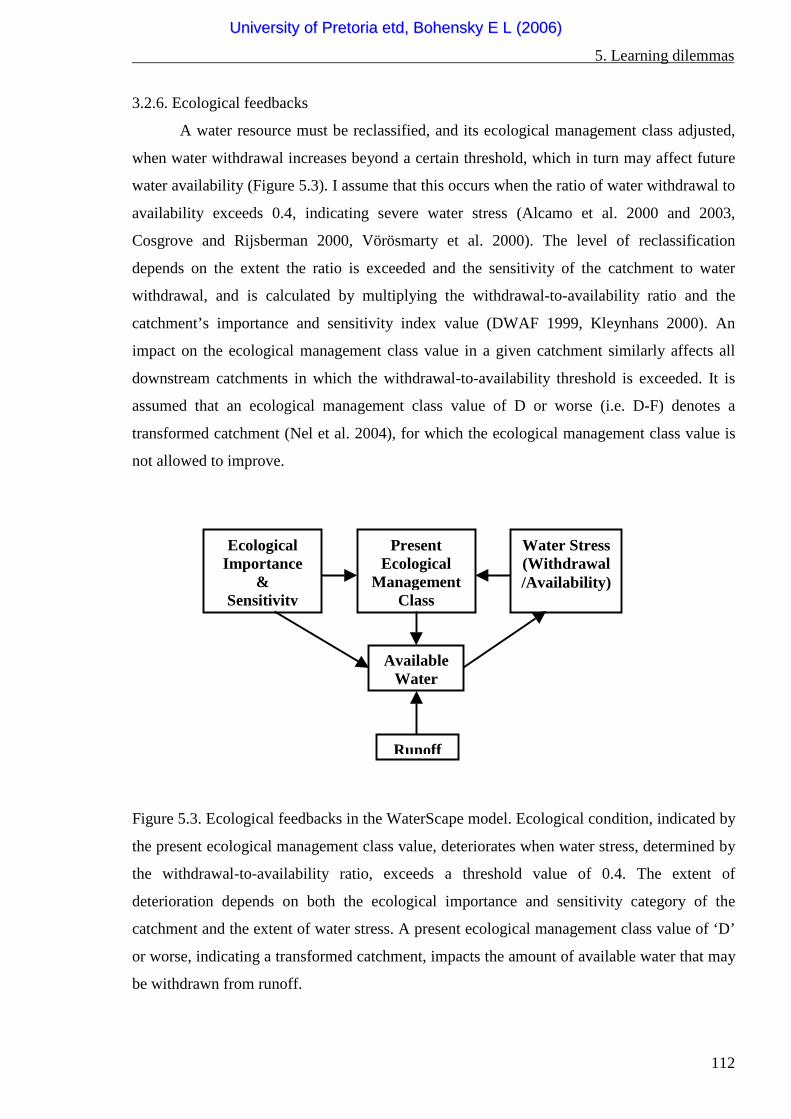
5. Learning dilemmas
112
3.2.6. Ecological feedbacks
A water resource must be reclassified, and its ecological management class adjusted,
when water withdrawal increases beyond a certain threshold, which in turn may affect future
water availability (Figure 5.3). I assume that this occurs when the ratio of water withdrawal to
availability exceeds 0.4, indicating severe water stress (Alcamo et al. 2000 and 2003,
Cosgrove and Rijsberman 2000, Vörösmarty et al. 2000). The level of reclassification
depends on the extent the ratio is exceeded and the sensitivity of the catchment to water
withdrawal, and is calculated by multiplying the withdrawal-to-availability ratio and the
catchment’s importance and sensitivity index value (DWAF 1999, Kleynhans 2000). An
impact on the ecological management class value in a given catchment similarly affects all
downstream catchments in which the withdrawal-to-availability threshold is exceeded. It is
assumed that an ecological management class value of D or worse (i.e. D-F) denotes a
transformed catchment (Nel et al. 2004), for which the ecological management class value is
not allowed to improve.
Figure 5.3. Ecological feedbacks in the WaterScape model. Ecological condition, indicated by
the present ecological management class value, deteriorates when water stress, determined by
the withdrawal-to-availability ratio, exceeds a threshold value of 0.4. The extent of
deterioration depends on both the ecological importance and sensitivity category of the
catchment and the extent of water stress. A present ecological management class value of ‘D’
or worse, indicating a transformed catchment, impacts the amount of available water that may
be withdrawn from runoff.
Ecological Impor tance
& Sensitivity
Present Ecological
Management Class
Water Stress (Withdrawal/Availability)
Available Water
Runoff
UUnniivveerrssiittyy ooff PPrreettoorriiaa eettdd,, BBoohheennsskkyy EE LL ((22000066))

5. Learning dilemmas
113
In transformed catchments, the amount of water available for withdrawal is likewise
impacted by an increase in the ecological management class value, on the basis that fitness for
use of the water resource is compromised. The decline in available water is also a function of
the ecological importance and sensitivity index value. The modelled relationships between the
importance and sensitivity index, the ecological management class, and runoff available for
withdrawal are necessarily somewhat arbitrary, as the precise relationships between
hydrology and ecological integrity are not well known (Hughes and Hannart 2003).
3. 3. Water management paradigms
I assume, for the sake of minimising model uncertainty, that water use is influenced by
three broad water management paradigms (see Appendix D): one based on maximising
efficiency (Efficiency First), one rooted in a command-and-control approach (Hydraulic
Mission), and one that strives for a balance of the three Water Act principles of efficiency,
equity, and sustainability (Some, for All, Forever). Agents’ decision-making is limited to
choosing among these. These paradigms define the rules by which water is distributed among
the sectoral agents in their catchment each year, management interventions that the CMAs can
use to reconcile demand and supply, and different rates of growth for the five sectors.
3.3.1. Efficiency First
Under this scenario, if available water equals or exceeds the total demand of all agents
in the catchment, all agents get as much water as they need. If there is not sufficient water,
water is allocated preferentially, based on a sector’s economic efficiency (Rand value
generated per m3 of water use) in each catchment. Water is allocated in this way until either
all water is allocated or all demands are fulfilled. In catchments that still have a deficit,
demand can be ‘offloaded’ from deficit catchments in the WMA to catchments that have
surplus water. The mechanism for such a shift might be the relocation of businesses and
residences, or trading of water use licenses within a sector, for example. Once this process is
complete, any existing water shortages in a WMA can be alleviated through water transfers
between WMAs. Under this scenario, water may be transferred from the catchment with the
maximum surplus to the catchment with the maximum demand, on two conditions: water
must travel over the shortest distance possible, and the amount transferred cannot exceed the
recipient’s deficit. Transferred water is immediately allocated according to the preferential
rule described above.
UUnniivveerrssiittyy ooff PPrreettoorriiaa eettdd,, BBoohheennsskkyy EE LL ((22000066))

5. Learning dilemmas
114
3.3.2. Hydraulic Mission
Here, the same rule used in Efficiency First applies if there is sufficient water to meet
all agents’ needs. If available water is less than the total demanded, each sector receives an
amount proportional to its demand, serving to preserve the current sectoral ratios of water use.
If a WMA has a deficit, water may be transferred from a surplus WMA. Transfers are made
from catchments with the maximum available surplus to catchments with the maximum
demand, which favours the agricultural and mining and industrial sectors. There are no limits
in the model on the distance over which water can be transferred. Transferred water is
immediately allocated according to the proportional rule described above.
3.3.3. Some, for All, Forever
Under this scenario, CMAs are required by the Water Act to first satisfy the human
and ecological components of the Reserve, respectively. Remaining water is then allocated
according to the strategy used in Efficiency First. Water can then be transferred between
WMAs under the same conditions that apply to Efficiency First, but in this case priority is
given to the catchment with the largest deficit, irrespective of its demand. Under this scenario,
CMAs take several active measures to improve sustainability and equity. First, restoration
efforts are undertaken to improve the ecological management class so long as the level of
ecological transformation and the withdrawal-to-availability ratio in the catchment are below
the threshold values given above. Second, if the ecological management class deteriorates by
five percent or more from initial conditions within a period of five years, a CMA may
increase the ecological reserve requirement for the catchment by five percent, so long as the
Reserve is currently met. Third, to improve equity, a CMA may intervene in catchments
where the difference between the largest and smallest ratios of water allocated to water
demanded exceeds 0.5 for five consecutive years (i.e. the most satisfied user’s ratio is more
than 50% greater than the least satisfied user’s). Here, CMAs enforce water demand
management practices for the largest consumer in the catchment such that a five percent
reduction in demand is achieved – in other words, the consumer is able to maintain current
productivity with five percent less water and the ‘ freed up’ water can be allocated to other
sectors.
3.4. Indicators
As an important area of learning on the WaterScape concerns the meeting of the three
Water Act principles, agents use indicators that relate to these principles to guide their
UUnniivveerrssiittyy ooff PPrreettoorriiaa eettdd,, BBoohheennsskkyy EE LL ((22000066))

5. Learning dilemmas
115
decision-making. Agents can change their water use strategy when the value of their indicator
exceeds a certain threshold. For simplicity, I assume in the model that each agent uses only
one indicator at any given point in time. The first indicator is the economic value generated
per cubic meter of water use, a measure of efficiency. Agents change strategies when this
value falls below 10 South African Rands/m3, equivalent to one-half the average water use
value across all sectors (DBSA 2000). The second indicator is the ability to fulfil the human
reserve requirement with available water; agents change strategies when there is a human
reserve deficit. This indicator provides a broad measure of equity, in that the inability of the
human reserve requirement to be met implies that either 1) the distribution of water within a
catchment is skewed or 2) the distribution of water between different catchments is skewed
(or both). A third indicator is the extent of change in the present ecological management class
value, a measure of sustainability; agents may change strategies when the ecological
management class declines from its initial value by five percent or more.
The learning process is modeled as follows (Figure 5.4): Each year, agents use their
indicator to evaluate whether their strategy in the previous year was successful. As agents
assume conditions in the coming year will be similar to those in the previous year, a
successful agent will continue using its previous strategy. An unsuccessful agent will imitate
the most successful water user in its water management area, on the assumption that agents in
relatively close proximity face reasonably similar conditions and should thus achieve similar
results. An agent considers experience in the previous year only, believing memory and older
information to be outdated or too costly to obtain. Learning occurs when the outcome of an
agent’s decision to change or persist with its strategy matches its expectation of success.
In an initial experiment, agents cannot change their indicator during the simulation. A
second experiment is then conducted, in which agents may change their indicator after five
successive years of failing to meet their success threshold. After five years there is a
reasonable chance that an unsuccessful agent has tried all three water management strategies
and may thus wish to revisit its paradigm and subsequently, the indicator by which
it measures success. Indicator change follows a prescribed sequence (Figure 5.5). First, agents
who use the efficiency indicator and fail to meet the success threshold are likely to be situated
in catchments dominated by low-efficiency water use (i.e. agriculture and rural). Although in
reality measures may exist to improve efficiency in these catchments, this is not possible in
the model. These agents believe that the onus is on other catchments to improve efficiency,
while the best they can do is to ensure that all water users get a reasonable share of the
resource; thus they switch to the equity indicator. Second, agents who use the sustainability
UUnniivveerrssiittyy ooff PPrreettoorriiaa eettdd,, BBoohheennsskkyy EE LL ((22000066))

5. Learning dilemmas
116
Figure 5.4. The mechanics of learning as represented in the WaterScape model.
Figure 5.5. Sequence of indicator change. Agents who are unable to succeed using the
efficiency indicator switch to more equitable water use; those who are unable to achieve
equitable water use switch to sustainability; those who are unable to succeed using the
sustainability indicator switch to efficiency.
indicator and fail switch to the efficiency indicator, believing that higher efficiency will
reduce water consumption and thus slow the decline in ecological condition. Third, agents
who use the equity indicator and fail are likely to be witnessing a water supply crisis: equity
Efficiency Rand value generated per m3 water consumed < 10
Sustainability Decrease in ecological
management class of >= 5% from initial
value
Equity Human reserve
deficit > 0
Strategy selection by
agent
Indicator : measures
outcome of strategy
“ failure” “ success”
Use strategy of most success-ful agent
Evaluation:
I f strategy fails 5 times, change
indicator
OR
UUnniivveerrssiittyy ooff PPrreettoorriiaa eettdd,, BBoohheennsskkyy EE LL ((22000066))

5. Learning dilemmas
117
cannot be improved simply by increasing the amount allocated to each user. This drives these
agents to adopt a more conservation-oriented approach and switch to the sustainability
indicator.
The sequence of model activities is illustrated in Figure 5.6 (see also Appendix B and
C for a description of model entities and attributes; the full model code is available upon
request from the author at [email protected]).
4. Results of learning exper iments
Each model experiment was run for 100 time steps to observe medium- to long-term
learning dynamics, and was run 20 times to account for random variation between
simulations.
4.1. Use of indicators
If all agents share a perception of the WaterScape, how do they choose to manage it?
When the total population of agents uses the efficiency indicator, the vast majority (80%)
select the Efficiency First strategy at the end of the 100-year period (Figure 5.7). When the
equity indicator is used by all agents, strategy selection is more erratic, but Efficiency First is
the slightly preferred strategy for most of the simulation (Figure 5.8). When all agents use the
sustainability indicator, more than 40% select Some, for All, Forever, with an approximately
equal preference for the other two (Figure 5.9). When the three indicators are randomly
distributed among agents, but are fixed, agents increasingly select the Efficiency First
strategy, while the selection of the other two strategies declines over time (Figure 5.10), a
trend that is mirrored when agents are allowed to change indicators (Figure 5.11).
Figure 5.12 shows the proportions of agents who change strategies. Agents change
strategies when they fail to meet their success threshold; thus an increase in this measure
signifies either increasing difficulty for agents to meet the threshold, decreasing ability to
learn from other agents in the water management area, or both. About 80% of the efficiency
indicator users change strategies (i.e. adopt the most successful strategy in their water
management area), while about 40% of the equity and sustainability indicator users do at the
end of the simulation. When the three indicators are used together, but are fixed, the
proportion of strategy changers drops to about 30%, and to less than 20% when agents can
UUnniivveerrssiittyy ooff PPrreettoorriiaa eettdd,, BBoohheennsskkyy EE LL ((22000066))

5. Learning dilemmas
118
Time Step WaterUnit
WaterUser
CMA (Efficiency First)
CMA (Hydraulic Mission)
CMA (Some, for All, Forever)
Reset variables for next step Replenish runoff, as follows: 1) Adjust runoff for climate change; 2) Replenish runoff by a normally-distributed random function; 3) Adjust runoff for change in ecological management class
For all CMA’s WaterUnits: 1) Allocate water using randomly-selected strategy; 2) Randomly assign indicator
‘Offload’ demand to other water users in sector (EF only)
Transfer water from surplus to deficit WMAs, according to rule
Restore degraded catchments
Adjust ecological management class for degradation
1
Release unallocated water to downstream cells
Evaluate indicator 2 For all CMA’s WaterUnits:
1) Calculate or adjust for Reserve; 2) Adjust demand; 3) Allocate water based on success in previous timestep
5 Change indicator if failure occurs for 5 consecutive timesteps
Reduce demand of largest consumer by 5% if equity threshold is exceeded for 5 consecutive timesteps; increase Reserve if sustainability threshold is exceeded for 5 consecutive timesteps
Figure 5.6. Sequence of activities in the model. All activities are repeated each timestep
unless noted otherwise.
UUnniivveerrssiittyy ooff PPrreettoorriiaa eettdd,, BBoohheennsskkyy EE LL ((22000066))
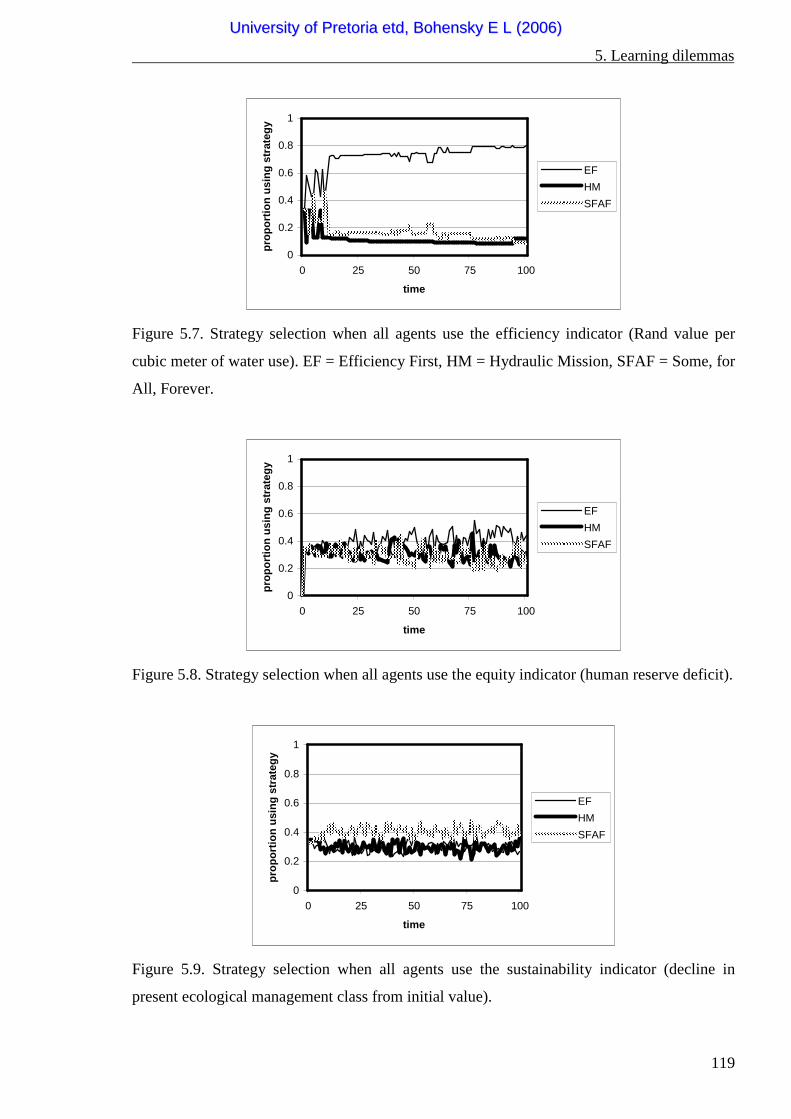
5. Learning dilemmas
119
0
0.2
0.4
0.6
0.8
1
0 25 50 75 100
time
pro
po
rtio
n u
sin
g s
trat
egy
EF
HM
SFAF
Figure 5.7. Strategy selection when all agents use the efficiency indicator (Rand value per
cubic meter of water use). EF = Efficiency First, HM = Hydraulic Mission, SFAF = Some, for
All, Forever.
0
0.2
0.4
0.6
0.8
1
0 25 50 75 100
time
pro
po
rtio
n u
sin
g s
trat
egy
EF
HM
SFAF
Figure 5.8. Strategy selection when all agents use the equity indicator (human reserve deficit).
0
0.2
0.4
0.6
0.8
1
0 25 50 75 100
time
pro
po
rtio
n u
sin
g s
trat
egy
EF
HM
SFAF
Figure 5.9. Strategy selection when all agents use the sustainability indicator (decline in
present ecological management class from initial value).
UUnniivveerrssiittyy ooff PPrreettoorriiaa eettdd,, BBoohheennsskkyy EE LL ((22000066))

5. Learning dilemmas
120
0
0.2
0.4
0.6
0.8
1
0 25 50 75 100
timep
rop
ort
ion
usi
ng
str
ateg
y
EF
HM
SFAF
Figure 5.10. Strategy selection by agents when indicators are randomly assigned and fixed.
0
0.2
0.4
0.6
0.8
1
0 25 50 75 100
time
pro
po
rtio
n u
sin
g s
trat
egy
EF
HM
SFAF
Figure 5.11. Strategy selection by agents when agents are allowed to change indicators.
0
0.2
0.4
0.6
0.8
1
0 25 50 75 100
time
pro
po
rtio
n c
han
gin
g s
trat
egy
Equity
Efficiency
Sustainability
Fixed
Changing
Figure 5.12. Strategy change when agents use the three single indicators, randomly-assigned
fixed indicators, and changing indicators.
UUnniivveerrssiittyy ooff PPrreettoorriiaa eettdd,, BBoohheennsskkyy EE LL ((22000066))

5. Learning dilemmas
121
change indicators. In all cases, the proportion of agents that change strategies increases during
the 100 years.
Given a choice of indicators, nearly half of the agents use the sustainability indicator,
nearly 40% use the equity indicator, and less than 20% use the efficiency indicator by the end
of the 100 years (Figure 5.13). The proportions of agents using the sustainability and
efficiency indicator decline over time, however, while the proportion using the equity
indicator increases.
0
0.2
0.4
0.6
0.8
1
0 25 50 75 100
time
pro
po
rtio
n u
sin
g in
dic
ato
r
equity
efficiency
sustainability
Figure 5.13. Indicator selection by agents with changing indicators.
4.2. Water Management Area (WMA) comparison
Perceptions of the WaterScape are not influenced only by agents’ water management
paradigms, but by the environmental conditions they experience or observe. Because many
future water management decisions in South Africa will be made at the WMA level, results
are compared in five WMAs which differ in hydrological variability, water stress, and size
(Figure 5.14).
UUnniivveerrssiittyy ooff PPrreettoorriiaa eettdd,, BBoohheennsskkyy EE LL ((22000066))
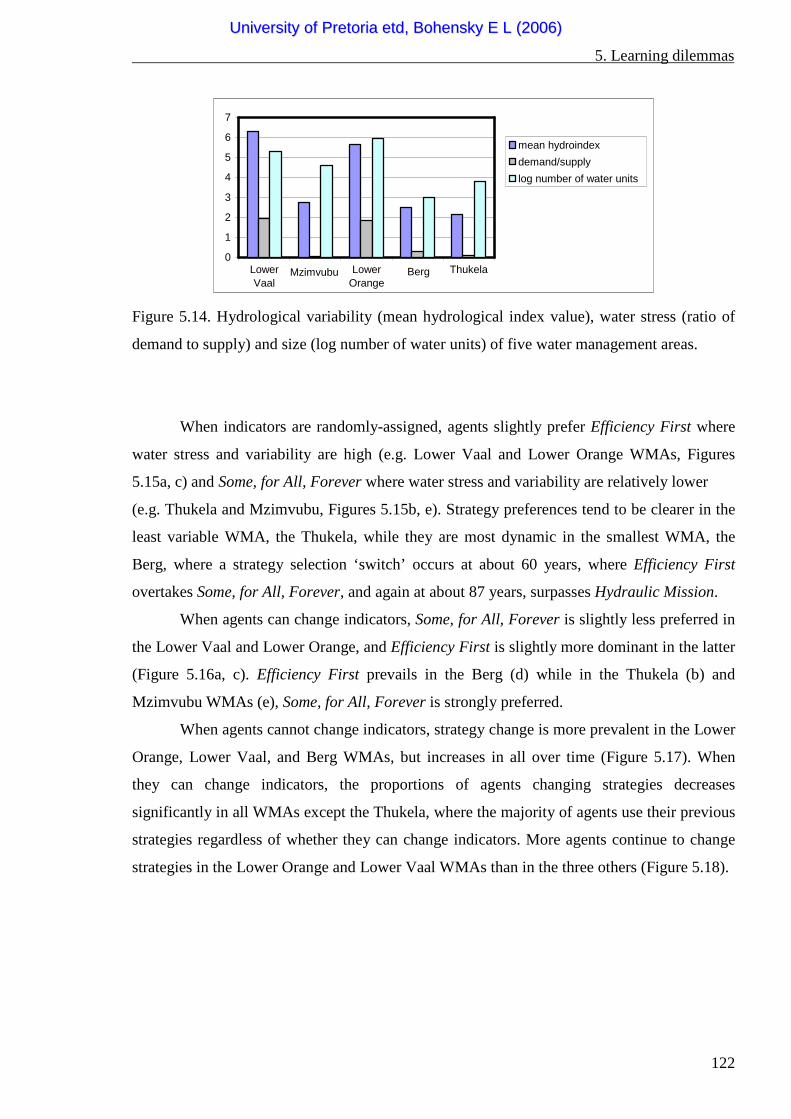
5. Learning dilemmas
122
BergMzimvubu0
1
2
3
4
5
6
7
LowerVaal
LowerOrange
Thukela
mean hydroindex
demand/supply
log number of water units
Figure 5.14. Hydrological variability (mean hydrological index value), water stress (ratio of
demand to supply) and size (log number of water units) of five water management areas.
When indicators are randomly-assigned, agents slightly prefer Efficiency First where
water stress and variability are high (e.g. Lower Vaal and Lower Orange WMAs, Figures
5.15a, c) and Some, for All, Forever where water stress and variability are relatively lower
(e.g. Thukela and Mzimvubu, Figures 5.15b, e). Strategy preferences tend to be clearer in the
least variable WMA, the Thukela, while they are most dynamic in the smallest WMA, the
Berg, where a strategy selection ‘switch’ occurs at about 60 years, where Efficiency First
overtakes Some, for All, Forever, and again at about 87 years, surpasses Hydraulic Mission.
When agents can change indicators, Some, for All, Forever is slightly less preferred in
the Lower Vaal and Lower Orange, and Efficiency First is slightly more dominant in the latter
(Figure 5.16a, c). Efficiency First prevails in the Berg (d) while in the Thukela (b) and
Mzimvubu WMAs (e), Some, for All, Forever is strongly preferred.
When agents cannot change indicators, strategy change is more prevalent in the Lower
Orange, Lower Vaal, and Berg WMAs, but increases in all over time (Figure 5.17). When
they can change indicators, the proportions of agents changing strategies decreases
significantly in all WMAs except the Thukela, where the majority of agents use their previous
strategies regardless of whether they can change indicators. More agents continue to change
strategies in the Lower Orange and Lower Vaal WMAs than in the three others (Figure 5.18).
UUnniivveerrssiittyy ooff PPrreettoorriiaa eettdd,, BBoohheennsskkyy EE LL ((22000066))

5. Learning dilemmas
123
0
0.2
0.4
0.6
0.8
1
0 25 50 75 100
time
pro
po
rtio
n u
sin
g s
trat
egy
EF
HM
SFAF
0
0.2
0.4
0.6
0.8
1
0 25 50 75 100
time
pro
po
rtio
n u
sin
g s
trat
egy
EF
HM
SFAF
0
0.2
0.4
0.6
0.8
1
0 25 50 75 100
time
pro
po
rtio
n u
sin
g s
trat
egy
EF
HM
SFAF
0
0.2
0.4
0.6
0.8
1
0 25 50 75 100
time
pro
po
rtio
n u
sin
g s
trat
egy
EF
HM
SFAF
0
0.2
0.4
0.6
0.8
1
0 25 50 75 100
time
pro
po
rtio
n u
sin
g s
trat
egy
EF
HM
SFAF
Figure 5.15. Strategy selection by agents in: a) most variable and water-stressed (Lower
Vaal); b) least variable (Thukela); c) largest (Lower Orange); d) smallest (Berg); and e) least
water-stressed (Mzimvubu) WMAs using randomly-assigned fixed indicators. EF =
Efficiency First, HM Hydraulic Mission, SFAF = Some, for All, Forever.
a b
d e
c
UUnniivveerrssiittyy ooff PPrreettoorriiaa eettdd,, BBoohheennsskkyy EE LL ((22000066))

5. Learning dilemmas
124
0
0.2
0.4
0.6
0.8
1
0 25 50 75 100
time
pro
po
rtio
n u
sin
g s
trat
egy
EF
HM
SFAF
0
0.2
0.4
0.6
0.8
1
0 25 50 75 100
time
pro
po
rtio
n u
sin
g s
trat
egy
EF
HM
SFAF
0
0.2
0.4
0.6
0.8
1
0 25 50 75 100
time
pro
po
rtio
n u
sin
g s
trat
egy
EF
HM
SFAF
0
0.2
0.4
0.6
0.8
1
0 25 50 75 100
time
pro
po
rtio
n u
sin
g s
trat
egy
EF
HM
SFAF
0
0.2
0.4
0.6
0.8
1
0 25 50 75 100
time
pro
po
rtio
n u
sin
g s
trat
egy
EF
HM
SFAF
Figure 5.16. Strategy selection by agents in: a) most variable and water-stressed (Lower
Vaal); b) least variable (Thukela); c) largest (Lower Orange); d) smallest (Berg); and e) least
water-stressed (Mzimvubu) WMAs using changing indicators. EF = Efficiency First, HM
Hydraulic Mission, SFAF = Some, for All, Forever.
a b
c
d e
UUnniivveerrssiittyy ooff PPrreettoorriiaa eettdd,, BBoohheennsskkyy EE LL ((22000066))

5. Learning dilemmas
125
The equity indicator is most strongly favoured by the Berg WMA, although at least
30% of agents use it in each WMA (Figure 5.19). The efficiency indicator is initially strongly
favoured by the Berg, but preference declines over time; use of this indicator increases
slightly in the Thukela (Figure 5.20). The sustainability indicator dominates most clearly in
the Lower Orange and Lower Vaal WMAs, while use decreases steadily in the Berg during
the first 50 years of the simulation (Figure 5.21).
0
0.2
0.4
0.6
0.8
1
0 25 50 75 100
time
pro
po
rtio
n c
han
gin
g s
trat
egy
Berg
Lower Orange
Lower Vaal
Mzimvubu
Thukela
Figure 5.17. Strategy change by agents in five WMAs using randomly-assigned fixed
indicators.
0
0.2
0.4
0.6
0.8
1
0 25 50 75 100
time
pro
po
rtio
n c
han
gin
g s
trat
egy
Berg
Lower Orange
Lower Vaal
Mzimvubu
Thukela
Figure 5.18. Strategy change by agents in five WMAs with changing indicators.
UUnniivveerrssiittyy ooff PPrreettoorriiaa eettdd,, BBoohheennsskkyy EE LL ((22000066))

5. Learning dilemmas
126
0
0.2
0.4
0.6
0.8
1
0 25 50 75 100
time
pro
po
rtio
n u
sin
g e
qu
ity
ind
icat
or
Berg
Lower Orange
Lower Vaal
Mzimvubu
Thukela
Figure 5.19. Selection of equity indicator by agents in five WMAs.
0
0.2
0.4
0.6
0.8
1
0 25 50 75 100
time
pro
po
rtio
n u
sin
g e
ffic
ien
cy
ind
icat
or
Berg
Lower Orange
Lower Vaal
Mzimvubu
Thukela
Figure 5.20. Selection of efficiency indicator by agents in five WMAs.
0
0.2
0.4
0.6
0.8
1
0 25 50 75 100
time
pro
po
rtio
n u
sin
g s
ust
ain
abili
ty
ind
icat
or
Berg
Lower Orange
Lower Vaal
Mzimvubu
Thukela
Figure 5.21. Selection of sustainability indicator by agents in five WMAs.
UUnniivveerrssiittyy ooff PPrreettoorriiaa eettdd,, BBoohheennsskkyy EE LL ((22000066))

5. Learning dilemmas
127
5. Discussion
These learning experiments investigated 1) how different social-ecological conditions
and 2) agents’ selection of different indicators to evaluate their actions affect capacity to
learn, willingness to learn, and understanding of how and what to learn.
5.1. Social-ecological conditions
By comparing agent decisions at the WaterScape level with those made in five
different WMAs, some of the ways in which conditions such as hydrological variability,
water stress, and size may affect learning in the model become evident. Among the clearest
preferences for a particular strategy are those shown when agents can change indicators in the
Thukela WMA, which has the lowest hydrological variability and where agent experience in a
given year thus has a greater change of being relevant in the following year. Agents in highly
variable environments, however, may be unable to benefit from their or others’ experience in
the previous year, because conditions change too rapidly for them to process and respond
appropriately to the change. In the Lower Vaal and Lower Orange WMAs, which have the
most variable runoff and highest water stress in the country, agents’ strategy choice is less
erratic when they can change their indicator than when they can only change their strategy
based on the success of other agents in the previous year, which may be irrelevant. In this
case, high variability may challenge agents’ ability to detect patterns, as observed elsewhere
in resource management systems (Wilson 2002). On the other hand, where agents have
difficulty achieving success, they may have more incentive to keep trying to learn from their
experimentation. Thus, variability may have mixed effects: it may negatively affect agent
capacity to learn or decrease confidence in learning, but may increase willingness to learn and
understanding of what learning is needed.
In WMAs with lower water stress, agents are better able to stick with their current
strategies, and have less ‘ incentive’ to learn. In areas affected by higher water stress, by
contrast, there is a greater need to try new strategies, a situation which may therefore increase
willingness to learn. In fact, agents in water-stressed areas have an advantage over those in
more water-rich ones who are simply required by the model algorithm to ‘pass the test’ in
order to continue using their existing strategies, though these may be sub-optimal. Water-
stressed agents, by failing the success test, must try new strategies, and are more likely to
locate optimal ones. However, high levels of variability and water stress tend to co-occur,
UUnniivveerrssiittyy ooff PPrreettoorriiaa eettdd,, BBoohheennsskkyy EE LL ((22000066))

5. Learning dilemmas
128
amplifying the opportunity to learn but also a dilemma: agents are more likely to fail to meet a
success threshold because of high stress but are also more likely to fail to learn because
variability makes learning difficult.
The role that size – and a related issue, the range of spatial variation in an area – plays
is not entirely clear. Divergence in strategy selection clearly occurs in the Berg WMA, with
about 60% of agents choosing Efficiency First when indicators can change. In addition to
being the smallest WMA in the country, the Berg is also among the most transformed and
urbanised. The high transformation discourages agents from using the sustainability indicator,
while the high level of urbanisation enables a majority of agents to first use the efficiency
indicator while water stress is lower and increasingly adopt the equity indicator, which the
Efficiency First strategy serves best. Yet the small size of the Berg WMA also suggests that
agents may have fewer options available for learning, so most options are identified quickly.
Thus, the learning process may be more efficient than in larger or more spatially
heterogeneous WMAs, but also draws on a more narrow range of experience.
It is apparent that there are ‘different strokes for different folks’ : a variety of indicator-
strategy combinations emerge. For variable, water-stressed WMAs, the sustainability
indicator is favoured, but together with a combination of strategies. This suggests that a
diversity of strategies is often most compatible with the objective of sustainability,
particularly where water is less abundant. At the opposite end of the variability and water
stress spectrum, a combination of the Some, for All, Forever strategy and the equity or
efficiency indicator prevails, but this changes over time, presumably a result of the decreasing
abundance of water relative to demand. The Berg WMA does not fit either profile: it begins
favouring efficiency, briefly pursues sustainability, and lastly adopts the efficiency indicator.
All three scenarios are roughly in equal use in the beginning of the simulation but Efficiency
First ultimately takes over.
5. 2. Indicator selection
The use of multiple indicators frees agents from using only collective learning to
identify the most successful strategy, and allows them to better evaluate individual success in
combination with the success of others. Furthermore, the ability to change indicators gives
agents greater power to act on their evaluations. Nevertheless, the indicators and their use in
the model are clearly simplistic. Naturally water users and managers employ numerous
indicators to monitor the environment and evaluate their actions. In the model, agents can use
UUnniivveerrssiittyy ooff PPrreettoorriiaa eettdd,, BBoohheennsskkyy EE LL ((22000066))

5. Learning dilemmas
129
three at most – and no agent can use all simultaneously. Furthermore, in reality, water users
and managers usually have access to other information that is not incorporated into indicators
but provides context for decision-making, over the longer term as well as from year to year. In
addition, success in achieving one’s goal must be measured in a way that is consistent with
the broader management goals for the system.
5. 3. Overcoming dilemmas
The results presented above suggest that the WaterScape agents may sometimes fall
afoul of the learning dilemmas of challenged capacity, willingness, or understanding. This
modelling exercise offers a few insights for overcoming these dilemmas to allow for more
effective learning in future monitoring and management. The major indication is this: to
ensure that the three pillars of learning are upheld, the focus of learning and use of indicators
sometimes needs to be tailored to specific environmental conditions. For example, in high-
variability areas, management may benefit in particular from a better understanding of long
term trends, and the extent to which maintaining a diversity of management options that can
be readily adopted as conditions change has been a successful practice in the past (Tengö and
Belfrage 2004). The focus of monitoring in these areas should be on slow variables that
operate in the background, such as changes in climate, that tend to occur over long time scales
and coarse spatial scales, and on interactions between fast and slow variables (Wilson 2002,
Lynam and Stafford-Smith 2004).
The model results suggest that agents in water-stressed WMAs may have a greater
drive to learn, and be more active in formulating water allocation, conservation, and demand
management strategies than water-rich WMAs. However, the new water legislation in South
Africa requires water resources to be managed as a national asset, and the burden of water
stress may shift to the more water-rich areas in the future as they absorb growing demands for
water (DWAF 2004). Where water stress is high, learning may need to focus on efficiency of
water use and demand management, as well as reallocation within and also between WMAs.
Here there will be especially numerous opportunities to learn about the sensitivity to water
stress of ecological parameters such as change in the ecological management class and the
ecological reserve.
The size and spatial heterogeneity of an agent’s ‘ learning network’ needs to be
considered: Do all agents have access to information that may help them to manage better?
Can experience be broadened and shared where needed? At the same time, a bigger network
UUnniivveerrssiittyy ooff PPrreettoorriiaa eettdd,, BBoohheennsskkyy EE LL ((22000066))

5. Learning dilemmas
130
may not always be better; there is a need to avoid information overload. Small or
homogeneous catchments are often well-suited to learning, where they enable a high level of
interaction between agents and quick building of trust (Dietz et al. 2003). Such learning
environments should be supported but learning should also be extended and broadened to
encompass larger-scale problems and cross-comparison where similar challenges are
experienced. Databases and information exchanges to capture and share information and
experiences between WMAs will be beneficial.
6. Conclusion
Learning processes in South African water management have much to gain from an
agent-based modelling approach. First, the approach treats water management in the
integrated social-ecological context that the subject demands, rather than treating human
behaviour and water resources as distinct components. Second, implementation of the new
water policy has barely begun, so there will be a much to learn and vast uncertainty that
cannot be explored in any way but through visions and models of the future. The great
advantage of agent-based models is that they do not intend to predict future outcomes but
stimulate thinking and initiate dialogue, critical to addressing the challenges that are faced in
this arena.
Only a few of the many learning dilemmas that can arise in social-ecological systems
are explored here, and many cannot be solved with modelling approaches alone but will
demand attention in multi-stakeholder fora. Yet such models may soon play a role in
informing water-related negotiations in South Africa; in fact, they already do at smaller scales
(Farolfi et al. 2004). The greatest contributions to the current era of South African water
management stand to be made from an improved understanding of precisely how and why
alternative water use decisions achieve efficient, equitable, and sustainable outcomes or not.
Greater illumination now needs to be cast on the question of whether, under the new
institutional arrangements, opportunities for learning in this dynamic environment.
UUnniivveerrssiittyy ooff PPrreettoorriiaa eettdd,, BBoohheennsskkyy EE LL ((22000066))

5. Learning dilemmas
131
References
Adams, W. M., D. Brockington, J. Dyson, and B.Vira. 2003. Managing Tragedies: Understanding Conflict over Common Pool Resources. Science 302: 1915-1916. Alcamo, J., P. Do¨ll, T. Henrichs, F. Kaspar, B. Lehner, T. Ro¨sch, and S. Siebert, 2003. Global estimation of water withdrawals and availability under current and “business as usual” conditions. Hydrological Sciences, 48(3), 339–348 Alcamo, J., T. Henrichs, T. Ro¨sch, 2000. World Water in 2025:Global Modelling Scenarios for the World Commission on Water for the Twenty-first Century. World Water Series Report 2, Center for Environmental Systems Research, University of Kassel, Germany. Berkes, F., and C. Folke. 1998. Linking Social and Ecological Systems: Management Practices and Social Mechanisms for Building Resilience. Cambridge University Press, Cambridge. Berkes, F., J. Colding, J. and C. Folke. 2000. Rediscovery of traditional ecological knowledge as adaptive management. Ecological Applications, 10(5): 1251-1262. Berkes, F., J. Colding, and C. Folke, editors. 2003. Navigating Social-Ecological Systems: Building Resilience For Complexity And Change. Cambridge University Press, Cambridge. Bohensky, E. L. Decentralisation and its discontents: redefining winners and losers on the South African ‘waterscape.’ Submitted to South African Journal of Science. Bousquet, F., I. Bakam, H. Proton, and C. Le Page. 1998. Cormas: common-pool resources and multi-agent systems. Lecture Notes in Artificial Intelligence (1416):826-838. Bousquet, F. and C. Le Page. 2004. Multi-agent simulations and ecosystem management: a review. Ecological Modelling 176: 313–332. Carpenter, S.C., W.A. Brock, and D. Ludwig. 2002. Collapse, Learning, and Renewal. In: L. H. Gunderson and C. S. Holling (Eds.), Panarchy: Understanding Transformations in Human and Natural Systems. Island Press, Washington, D.C., pp. 173-193. Cosgrove, W. and F. Rijsberman, 2000. World Water Vision: Making Water Everybody’s Business. World Water Council. Earthscan Publications, London. Dent, M.C. 2000. Strategic issues in modelling for integrated water resource management in Southern Africa. Water SA 26(4):513-519. Online at http://www.wrc.co.za Dent, M.C. 2001. Installed water resource modelling systems for catchment management agencies. Water SA 27(3):333-340. Online at http://www.wrc.co.za Dietz, T., E. Ostrom, and P.C. Stern. 2003. The struggle to govern the commons. Science 302:1907-1912.
UUnniivveerrssiittyy ooff PPrreettoorriiaa eettdd,, BBoohheennsskkyy EE LL ((22000066))

5. Learning dilemmas
132
DWAF (Department of Water Affairs and Forestry), 1999. Resource Directed Measures for Protection of Water Resources. Volume 3: River Ecosystems Version 1.0, Pretoria. DWAF (Department of Water Affairs and Forestry), 2004. First Edition of the National Water Resources Strategy, DWAF, Pretoria. Online at http://www.dwaf.gov.za/. Epstein, J. and R. Axtell. 1996. Growing Artificial Societies: Social Science from the Bottom-Up. Brookings Inst. Press, MIT Press, Washington, D.C. Farolfi, S. R. Hassan, S. Perret and H. MacKay. 2004. A role-playing game to support multi-stakeholder negotiations related to water allocation in South Africa: first applications and potential developments. Paper presented at Conference on Water Resources as Ecosystems: Scientists, Government, and Society at the Crossroads. Midrand, South Africa, 5-7 July 2004. Fazey, I., J. A. Fazey, and D. M. A. Fazey. 2005. Learning more effectively from experience. Ecology and Society 10(2):4. [online] URL: http://www.ecologyandsociety.org/volXX/issYY/artZZ/ Gallopín, G., C. 2002. Planning for resilience: scenarios, surprises and branch points. In: L. Gunderson and C. S. Holling (Eds.), Panarchy: Understanding Transformations in Human and Natural Systems, Island Press, Washington D.C., pp. 361-392. Gunderson, L. H., C. S. Holling, and S. S. Light, editors. 1995. Barriers and Bridges to the Renewal of Ecosystems and Institutions. Columbia University Press, New York. Holling, C.S. and Meffe, G.K. 1996. Command and control and the pathology of natural resource management. Conservation Biology 10: 328-337. Holling, C. S., and L. H. Gunderson, and D. Ludwig 2002. In quest of a theory of adaptive change. In: L. Gunderson and C. S. Holling (Eds.), Panarchy: Understanding Transformations in Human and Natural Systems, Island Press, Washington D.C., pp 3-22. Hughes, D.A. and P. Hannart, 2003. A desktop model used to provide an initial estimate of the ecological instream flow requirements of rivers in South Africa. Journal of Hydrology, 270, 167-181. Hughes, F. M. R., A. Colston, and J. Owen Mountford. 2005. Restoring riparian ecosystems: the challenge of accommodating variability and designing restoration trajectories. Ecology and Society 10(1): 12. [online] URL: http://www.ecologyandsociety.org/vol10/iss1/art12/ Jager, W., M. A. Janssen and C. A. J. Vlek, 2002. How uncertainty stimulates over-harvesting in a resource dilemma: three process explanations. Journal of Environmental Psychology. 22, 247-263. Janssen, M. A. and B. de Vries, 1998. The battle of perspectives: A multi-agent model with adaptive responses to climate change. Ecological Economics 26: 43–65. Janssen, M.A., B. H. Walker, J. Langridge, and N. Abel, 2000. An adaptive agent model for analysing co-evolution of management and policies in a complex rangeland system. Ecological Modelling 131: 249–268.
UUnniivveerrssiittyy ooff PPrreettoorriiaa eettdd,, BBoohheennsskkyy EE LL ((22000066))

5. Learning dilemmas
133
Janssen, M. A. and M. Scheffer, 2004. Overexploitation of renewable resources by ancient societies and the role of sunk-cost effects. Ecology and Society 9(1): 6. [online] URL: http://www.ecologyandsociety.org/vol9/iss1/art6. Kleynhans, C.J. 2000. Desktop estimates of the ecological importance and sensitivity categories (EISC), default ecological management classes (DEMC), present ecological status categories (PESC), present attainable ecological management classes (present AEMC), and best attainable ecological management class (best AEMC) for quaternary catchments in South Africa. DWAF report. Institute for Water Quality Studies, Pretoria. Lynam, T.J.P. and M. Stafford-Smith 2004. Monitoring in a complex world – seeking slow variables, a scaled focus, and speedier learning. African Journal of Range and Forage Science 2004, 21: 1–10. MacKay, H. 2003. Water policies and practices. Pages 49-83 in D. Reed and M. de Wit, editors. Towards a just South Africa: the political economy of natural resource wealth. WWF Macroeconomics Programme Office and Council for Scientific and Industrial Research, Washington D.C. and Pretoria. MacKay, H.M., K.H. Rogers and D.J. Roux. 2003. Implementing the South African water policy: holding the vision while exploring an uncharted mountain. Water SA 29(4): 353-358. Motteux, N. M. G. 2002. Evaluating people-environment relationships: developing appropriate research methodologies for sustainable management and rehabilitation of riverine areas by communities in the Kat River Valley, Eastern Cape Province, South Africa. Ph.D. thesis, Rhodes University, Grahamstown, South Africa. Nel, J., Maree, G., Roux, D., Moolman, J., Kleynhans, N., Silberbauer, M. and A. Driver. 2004. South African National Spatial Biodiversity Assessment 2004: Technical Report. Volume 2: River Component. CSIR Report Number ENV-S-I-2004-063. Council for Scientific and Industrial Research, Stellenbosch. Pahl-Wostl, C. 2002. Towards sustainability in the water sector – The importance of human actors and processes of social learning. Aquatic Sciences 64: 394–411. Palmer, C.G., R.S. Berold and W.J. Muller. 2004. Environmental water quality in water resources management. WRC Report No TT 217/04, Water Research Commission, Pretoria. Peterson, G. D., S. R. Carpenter, and W. A. Brock. 2003. Uncertainty and the management of multistate ecosystems: an apparently rational route to collapse. Ecology 84(6):1403–1411. Pritchard, L. and S.E. Sanderson 2002. The dynamics of political discourse in seeking sustainability. In: L. Gunderson and C. S. Holling (Eds.), Panarchy: Understanding Transformations in Human and Natural Systems, Island Press, Washington D.C., pp. 147-169. Rogers, K. and H.C. Biggs. 1999. Integrating indicators, endpoints and value systems in strategic management of the rivers of the Kruger National Park South Africa. Freshwater Biology 41:439-452.
UUnniivveerrssiittyy ooff PPrreettoorriiaa eettdd,, BBoohheennsskkyy EE LL ((22000066))

5. Learning dilemmas
134
Rogers, K., D. Roux and H. Biggs, 2000. Challenges for catchment management agencies: lessons from bureaucracies, business and resource management. Water SA 26:505-511.
Salafsky, N., H. Cauley, G. Balachander, B. Cordes, J. Parks, C. Margoluis, S. Bhatt, C. Encarnacion, D. Russell, and R. Margoluis. 2001. A systematic test of an enterprise strategy for community-based biodiversity conservation. Conservation Biology 15: 1585–1595. Schulze, R.E. 2005. Climate change and water resources in Southern Africa. WRC Report Number 1430/1/05. Water Research Commission, Pretoria. Seckler, D., U. Amarasinghe, D. Molden, R. de Silva, and R. Barker. 1998. World Water Demand and Supply, 1990 to 2025: Scenarios and Issues. Research Report No. 19, International Water Management Institute (IWMI), Colombo. Sen, A.K., 1999. Development as Freedom. Oxford University Press, Oxford. Tainter, J.A. 2000. Problem solving: Complexity, history, sustainability. Population and Environment 22, (1): 3-41. Tengö, M. and K. Belfrage. 2004. Local management practices for dealing with change and uncertainty: a cross-scale comparison of cases in Sweden and Tanzania. Ecology and Society 9(3):4. http://www.ecologyandsociety.org/vol9/iss3/art4. Turton, A.R. and R. Meissner 2002. The hydrosocial contract and its manifestation in society: A South African case study. In: A. R. Turton and R. Henwood, (Eds.), Hydropolitics in the Developing World: A Southern African Perspective. African Water Issues Research Unit, Pretoria, pp. 37-60. van Wyk, E., B. W. van Wilgen and D. J. Roux. 2001. How well has biophysical research served the needs of water resource management? Lessons from the Sabie-Sand. South African Journal of Science 97: 349-356. Vörösmarty, C.J., P. Green, J. Salisbury, and R.B. Lammers, 2000. Global water resources: vulnerability from climate change and population growth. Science, 289, 284–288. Walker, B., S. Carpenter, J. Anderies, N. Abel, G. Cumming, M. Janssen, L. Lebel, J. Norberg, G. D. Peterson, and R. Pritchard. 2002. Resilience management in social-ecological systems: a working hypothesis for a participatory approach. Conservation Ecology 6(1): 14. [online] URL: http://www.consecol.org/vol6/iss1/art14 Wilson, J. 2002. Scientific uncertainty, complex systems, and the design of common-pool institutions. pp. 327-360 in The Drama of the Commons. Committee on the Human Dimensions of Global Change, National Research Council, E. Ostrom, T. Dietz, N. Dols ak, P.C. Stern, S. Stovich, and E.U. Weber, Eds. National Academy Press, Washington, DC. Wollenberg, E., Edmunds, D. and L. Buck. 2000. Using scenarios to make decisions about the future: anticipatory learning for the adaptive co-management of community forests. Landscape and Urban Planning 47:65-77.
UUnniivveerrssiittyy ooff PPrreettoorriiaa eettdd,, BBoohheennsskkyy EE LL ((22000066))

Discover ing resilient pathways for water management: two frameworks and a vision
Erin L. Bohensky
Centre for Environmental Studies, University of Pretoria, Pretoria, 0002 South Africa
Tel: +27-21-8082604
Fax: +27-21-8082405
For submission to: Ecology and Society
UUnniivveerrssiittyy ooff PPrreettoorriiaa eettdd,, BBoohheennsskkyy EE LL ((22000066))

6. Discovering resilient pathways
136
Abstract
Resilience is the amount of change or disturbance a system can withstand and still
maintain its essential structure, function, and identity. Because social-ecological systems
(SES) undergo constant change, managers of SES must recognize and focus on resilient
‘pathways,’ in which learning about and maintaining resilience is a dynamic process; a
journey to a more desirable and achievable future based on a long-term perspective of the
system. Several compelling frameworks and models now exist to better understand resilience
from this perspective and to improve management of practical problems. In this paper, I
compare the ability of two frameworks to discover resilient pathways, using the case of water
management in South Africa as a focal example. These are: 1) the conceptual framework of
the Millennium Ecosystem Assessment and 2) the “panarchy” model of the adaptive cycle
described by Holling and elaborated by numerous others. Current South African water policy
is guided by an overarching vision to balance efficiency, equity, and sustainability, but as of
yet, the concept of resilience has not been fully incorporated into plans to achieve this vision.
While both frameworks yield insights in this arena, each has limitations that may reduce its
usefulness to managers, especially in regard to the representation of dynamics across space
and time, changes in perception, and trade-offs. Improving these or other frameworks so that
they are more useful to management should be a top priority, in order to more rigorously
incorporate the concept of resilience into the water management discourse in South Africa,
particularly at this critical time of change and opportunity.
UUnniivveerrssiittyy ooff PPrreettoorriiaa eettdd,, BBoohheennsskkyy EE LL ((22000066))
6. Discovering resilient pathways
137
Resilience in social-ecological systems: the temporal dimension
The view of humans and nature as coupled complex systems is gaining currency in
ecological and social science, and with it, theory is proliferating to understand how these
systems work and how management can consciously make them more robust (Walker et al
2002, Allison and Hobbes 2004). Increasingly, the ability to understand why management
regimes for social-ecological systems (Berkes et al. 2003) succeed or fail is seen to hinge on
the crucial property of resilience (Allison and Hobbes 2004, Ludwig and Stafford-Smith
2005). Resilience has multiple meanings, but is used here to refer to the ability of a system to
retain its essential structure and function in the face of disturbance or change (Rappaport
1968, Holling 1973, Levin 1999). This may be expressed in terms of identity, meaning the
system’s critical components, their relationships in space and time, and the innovation and/or
self-organization that maintain them (Cumming et al. 2005), or the ecosystem services the
system provides (Walker et al. 2002). Resilient systems tend to be flexible, self-organizing
(rather than controlled by external forces), and can build the capacity to learn and adapt
(Carpenter et al. 2001). Though seminal work on resilience has addressed mainly its
ecological dimensions (Holling 1973), there is an increasing recognition of the need to better
understand social aspects of resilience (Gunderson and Folke 2005), as well as relationships
between the two (Adger 2000, Cumming et al. 2005). This accompanies recent developments
in resilience theory that focus on fostering sustainability by embracing change and
transformation (Gunderson and Holling 2002, Walker et al. 2004).
Resilience has an important temporal dimension in that social-ecological systems tend
to shift over time (and correspondingly, space) between alternative configurations. It may
therefore be more useful to view resilience as a property of a particular configuration of a
system than of a system itself (Carpenter et al. 2001). These alternative system configurations
provide different combinations of ecosystem services; a lake in a eutrophic state may offer
nearby communities the service of waste disposal for agricultural runoff, while an
oligotrophic lake may offer the services of recreation and a domestic water supply that
requires little treatment (Carpenter et al. 2001). This is not to say that these services are tied
exclusively to these configurations; instead, the same services may be derived from
ecosystems under different management regimes and degrees of conversion (Balmford et al.
2002). However, disturbance and change can result in abrupt, non-linear shifts that move the
system past a threshold, beyond which services can no longer be provided as they were
previously (MA 2005). In this case, configuration x of a social-ecological system can be said
UUnniivveerrssiittyy ooff PPrreettoorriiaa eettdd,, BBoohheennsskkyy EE LL ((22000066))

6. Discovering resilient pathways
138
to lack resilience to disturbance y, and is forced to transform, or flip, into another
configuration – in what may appear to be the collapse of the system as it is presently known.
Such a collapse, however, does not usually affect the entire system, but rather a particular
configuration and associated ecosystem services. Numerous empirical studies exist that
demonstrate this in a range of ecosystems under different management regimes, such as the
lakes described above (see Scheffer et al. 2001 for a review).
Because such changes may be driven by slow variables (Carpenter and Turner 2001)
and are often not observable within the average human lifetime, studies of resilience that
appropriate a ‘deep time’ perspective that incorporates a system’s past, present, and future are
of interest in social-ecological systems research (van der Leeuw and Aschan-Leygonie 2000,
Redman and Kinzig 2003). Understanding of resilience has benefited in particular from the
study of ancient societies, from which rich social-ecological histories can be reconstructed
(Janssen et al. 2003, Redman and Kinzig 2003). In addition, a long-term perspective
encapsulates the changing social contexts for managing social-ecological systems (Bohensky
and Lynam 2005); definitions of what is socially desirable are always anchored to a temporal
reference point. The ecological contexts for management also change. As Scheffer et al.
(2001) observe on the challenge of ecosystem restoration: “ resilient approaches acknowledge
that recovery of systems from one regime to another must acknowledge that the path back is
likely to be very different from the one forward.”
Given the dynamic properties of resilience, the concept of “ resilient pathways”
(Walker et al. 2002) offers an appropriate frame for understanding resilience in social-
ecological systems and managing to enhance resilience. The identification of these pathways
can be seen as a process of discovery, a journey that involves learning from the past, along
with the recognition that the future may be quite different from anything experienced before,
and the acceptance of uncertainty (Redman and Kinzig 2003). Discovering resilient pathways
is about learning by doing – improving understanding through management, and vice versa
(Lee 1993).
Resilience is becoming an integral concept in water management worldwide
(Falkenmark 2003, Folke 2003, Moench 2005) and has particular relevance to South Africa,
where much change in its water sector is now occurring (Mackay et al. 2003). However, the
potential benefits of resilience theory sit precariously alongside the danger of overwhelming
policymakers with confusing, conflicting, or - because it is not arrived at through consensus -
mistrusted information (Dent 2000), leading to inappropriate or limited interpretation
(Cumming et al. 2005). Mechanisms are thus needed that allow stakeholders to develop a
UUnniivveerrssiittyy ooff PPrreettoorriiaa eettdd,, BBoohheennsskkyy EE LL ((22000066))

6. Discovering resilient pathways
139
shared understanding of past trajectories, and be able to link theory to practice so that they are
able to identify and navigate water management along more resilient pathways. A number of
frameworks exist, but their ability to contribute to the real-world problem of water
management in South Africa is not clear.
In this paper I evaluate the potential of two existing conceptual frameworks to assist
the discovery of resilient pathways for South African water management. The first is the
conceptual framework of the Millennium Ecosystem Assessment, an effort to provide
decision-makers with information about relationships between ecosystems and human well-
being (MA 2003). The second is the “panarchy model” of linked adaptive cycles described by
Holling (1986, 1987, 2001) and central to the work of the Resilience Alliance
(http://www.resalliance.org), which seeks to understand the source and role of transforming
change in social-ecological systems (Gunderson and Holling 2002). Both are to some extent
already informing water policy and policy-relevant research in South Africa (see Rogers and
Biggs 1999, Rogers et al. 2000, Turton and Henwood 2002, Nel et al. 2004, Turton et al.
2005), and both enable long-term perspectives on resilience or closely related concepts. Only
the panarchy model deals explicitly with resilience, but the Millennium Assessment
framework addresses it implicitly. Below I describe the evolution of water management in
South Africa to date, and the Water Act’s fundamental vision of an efficient, equitable, and
sustainable water management future. I then explore these frameworks and how they may
help to inform this vision.
Evolution of water management in South Afr ica
Water management in South Africa has historically been challenged by a semi-arid
climate and the distance of mineral deposits from large rivers, which encouraged settlement
far from major water sources (Basson et al. 1997). From the mid-19th century until the present
day, water management has become increasingly complex as the relationship between people
and water changed (Turton and Meissner 2003) and human populations and their aspirations
for water use grew (Table 6.1). For much of this period, the sector’s focus was on getting
water to farms and industries, with increasingly costly technical interventions such as dams
and diversions assuring supplies and subsidies for commercial agriculture that discouraged
sustainability (WCD 2000). Until 1994, which saw the end of minority rule under the
apartheid system, water management in South Africa was rooted in highly inequitable policies
that favored White individuals and the support base of the ruling political parties of the day.
UUnniivveerrssiittyy ooff PPrreettoorriiaa eettdd,, BBoohheennsskkyy EE LL ((22000066))

6. Discovering resilient pathways
140
Table 6.1. Water management in South Africa: a timeline of events Year(s) Event 1800s Korana people farm on Gariep (Orange) River banks; Europeans build irrigation scheme at Upington 1820-1870
A large influx of settlers from around the world introduces 11 of the 12 invasive species that now cause the greatest problems in fynbos biome
1872 First dam constructed in Gariep basin 1880 Gold discovered in Johannesburg; water demands rise throughout surrounding Witwatersrand region 1880s-1890s
Botanists begin to note the spread of nonnative plants over mountain slopes and losses of endemic species in fynbos vegetation, while foresters promote mountain plantations of non-native trees
1895 All major Witwatersrand aquifers tapped; Johannesburg experiences water shortages 1903 Rand Water Board established 1912 Passage of South Africa’s Irrigation and Conservation of Water Act lays foundation for future water
allocation, reserving surplus water for private property owners and establishing irrigation boards 1920s Controversy about effects of forest plantations on water supplies begins; demand for commercial
timber products will drive high rates of afforestation with non-native hardwoods for next 60 years 1928 Department of Irrigation conceives idea of Orange River Development Project, but considered too
costly 1937 Passage of the Weeds Act; poor enforcement due to lack of field staff and resources 1935 Salinity levels in Vaal Dam begin to increase due to increasing industrial activities 1943 Annual flow of Gariep River reaches 62-year high of 25,472 million cubic metres† 1949 Purification works built to clean or divert highly saline water in the Vaal catchment 1940s-1970s
Hydrological studies show that plantations have a negative effect on streamflow; efforts to control invasives are launched, but are uncoordinated, erratic, and hampered by limited follow-up clearing
1950s First survey of Basutoland (now Lesotho)’s water resources undertaken to assess viability of water exportation to South Africa
1956 South Africa passes Water Act no. 54 to accommodate needs of industrial expansion 1962-3 Political climate enables Orange River Development Project to win approval; poor planning results in
delays and a quadrupling of initial budget 1965 Marked acceleration of Vaal Dam salinity problem 1970s Blackfly (Simulium chutteri) acquires pest status along Vaal, Gariep and Great Fish Rivers after
completion of Bloemhof, Gariep, Van der Kloof Dams and Orange-Fish Tunnel. 1970 Mountain Catchment Act passed, giving responsibility for high-lying catchments to Department of
Forestry; alien plants are cleared from tens of thousands of hectares 1971 Gariep Dam completed; storage capacity (5341 million cubic metres) equal to roughly one-third of
Gariep basin’s total runoff 1971 Water Research Commission created to initiate and fund research projects related to water
management 1975 Orange-Fish Tunnel begins delivering water from Gariep River to Eastern Cape Province 1978 Vanderkloof Dam completed, the highest (108m) in South Africa 1986 Treaty signed to implement Lesotho Highlands Water Project (LHWP) after 8 years of negotiations Late-1980s
Mountain catchment management responsibility passed from Department of Forestry to provinces; lack of funding hampers integrated invasive plant control programs and plants re-invade cleared areas
1992 Annual flow of Gariep River reaches 62-year low of 818 million cubic metres† 1995 DWAF minister Kader Asmal founds Working for Water Programme, which hires 7,000 people and
clears 33,000 ha in its first 8 months 1995 Katse Dam – at 185 metres, the highest in Africa - completed in Lesotho’s Maloti Mountains 1998 South Africa’s Water Act no. 36 declares adequate water a basic human and environmental right 1998 LHWP completed; first LHWP water is released 2004 National Water Resources Strategy completed, paving the way for Water Act implementation; first
proposals to establish Catchment Management Agencies completed 2005 Olifants River stops flowing into lower reaches for first time in recorded history, threatening
biodiversity in downstream Kruger National Park
Sources: Herold et al. 1992; Chutter et al. 1996; World Commission on Dams 2000; WRI 2000; Thompson et al.
2001; Turton and Meissner 2002; DWAF 2003; Metsi Consultants 2002; Myburgh and Nevill 2003. †Based on annual flow records from 1935-1997; mean flow for period was 6980 million cubic metres.
UUnniivveerrssiittyy ooff PPrreettoorriiaa eettdd,, BBoohheennsskkyy EE LL ((22000066))

6. Discovering resilient pathways
141
Non-White individuals were restricted to certain areas, typically of higher aridity, lower
productivity, and lacking in formal water services (Turton and Meissner 2003).
In the years that followed South Africa’s democratic elections in 1994, the National
Water Act No. 36 of 1998 was penned to set the course for dramatic change in the
management of water. Founded on the principles of efficiency, equity, and sustainability, the
act defines water for basic human needs and for the maintenance of environmental
sustainability as a right, and promotes economic efficiency of water use through charges for
the financial costs of providing water to users (DWAF 2004a). The Act enforces a “Reserve”
that sets water aside for the purposes of meeting basic human and ecosystem needs. Critically,
the law devolves management of water to new institutions at the catchment level, called
Catchment Management Agencies (CMAs). While the CMAs are the pivotal institutional
entity in the new water management framework, they will work with local Catchment
Management Committees and stakeholder organizations, which will guide the process within
each catchment to decide the desired balance between protection and utilization of water
resources and to establish a course of action to achieve this. They will also be subordinate to
the national ministry, who will retain certain functions. Thus, there will be three tiers of water
management: operational (catchment), strategic (catchment or Water Management Area
(WMA)), and policy (national or regional) (MacKay et al. 2003), each operating on a different
spatial as well as temporal scale.
The discovery of resilient pathways takes on critical importance at this time of change.
Because of large-scale interventions in South Africa’s water supply and investments in
expensive water quality treatment schemes (Herold et al. 1992), the capacity of what are
actually highly transformed freshwater systems to deliver provisioning ecosystem services
(water for people, farms, and industry) may appear to be highly resilient particularly to the
many water users who are unaware of the great distances over which their water has travelled
to reach them (Snaddon et al. 1998). However, the generation of runoff is only one function of
these systems, and other ecosystem services have not fared as well. Water managers, like
other natural resource managers, have had a tendency to trade off ecosystem services in space
or time, often optimizing for a certain output and disregarding others (Gunderson 2000). In
South Africa as elsewhere, most past responses improved provisioning ecosystem services
and some regulating services (protection against drought and floods, and dilution of
pollutants), with benefits flowing to many, but certainly not the whole of society (WCD 2000,
MA 2005). These improvements have often come at the expense of supporting services (in-
stream flows for aquatic biota), and cultural services (recreation, nature-based tourism,
UUnniivveerrssiittyy ooff PPrreettoorriiaa eettdd,, BBoohheennsskkyy EE LL ((22000066))

6. Discovering resilient pathways
142
preservation of sacred sites, and cultural appreciation and use of water), and sometimes the
provisioning and regulating services that they were originally intended to secure. The building
of the Orange River Development Project in the 1960s, for example, improved water
availability for the commercial farming sector, but altered river flows so drastically that a
prolific pest blackfly (Simulium chutteri) invaded a large section of river used by livestock
farmers, and has required significant investments in mitigation ever since (Myburgh and
Nevill 2003).
At present, South African water management sits on the brink of a major
transformation. The new policies enable water users and managers to collectively decide how
to reap the multiple benefits of water, asking them to carefully define their objectives for the
systems in which they live and the pathways they will follow to get there. However, they are
faced with the formidable task of striking a balance between social equity and ecological
sustainability: How to derive benefits for all – including some 5 million South Africans who
still lack access to a safe and reliable water supply and another 16 million without sanitation
(DWAF 2004b) – without taxing the ecosystems that produce them? The pathway forward
depends to a large degree on the capacity of water users, managers, and institutions to plot a
sustainable course to govern resources in the coming years, based on a mutual vision of the
future (Rogers and Biggs 1999).
A vision for water management
A vision in terms of the South African Water Act refers to a universally-accepted
conceptualization of how water will be managed in the future and the ecosystem services that
will be maintained, so that the three Water Act principles of efficiency, equity, and
sustainability are upheld. Such a vision is expected to be achieved through the integration of
social values, scientific knowledge, and management experience in a multi-party system
(Rogers and Bestbier 1997, Rogers and Biggs 1999).
Defining a desired trajectory for water management requires a sound and shared
understanding of the biophysical processes that govern water resources and the array of
ecosystem services that they provide; it also demands an understanding of the human
(individual, social, and cultural) dependence and impacts on these services (MA 2003). To
date, more progress has probably made on the first aspect in South Africa (van Wyk et al.
2001). Initiatives such as the National Spatial Biodiversity Assessment (Driver et al. 2005),
which have analyzed the spatial distribution of freshwater biodiversity and the level of threat
UUnniivveerrssiittyy ooff PPrreettoorriiaa eettdd,, BBoohheennsskkyy EE LL ((22000066))

6. Discovering resilient pathways
143
imposed by current land use, water abstraction, and other human activities, provide a
reasonably good basis for understanding ecological integrity and vulnerability (Nel et al.
2004). Efforts to actually map the full range of ecosystem services provided by freshwater in
South Africa are only beginning (Bohensky et al. 2004, Reyers et al. 2005) and must currently
be inferred from an water resources classification system (Palmer et al. 2004) that indicate the
extent of modification of each water resource in the country. As the classification process is
still being refined, only desktop estimates are presently available (Kleynhans 2000) based on
data collected in 1998 and 1999 and regional expert knowledge, but allow for a rudimentary
comparison of present, suggested, and default ecological management classes, and the
plotting of various pathways of future water management. Figure 6.1 illustrates such a
pathway, revealing how past actions have increased the range of ecosystem services in some
areas but have reduced it in others. This also suggests one possible vision for the future, and
identifies areas to target for restoration.
Figure 6.1. A possible pathway of water use, based on past, present and suggested future
ecological management classes (Kleynhans 2000).
Past (default, prior to modification)
Future: possible attainable vision
Present
UUnniivveerrssiittyy ooff PPrreettoorriiaa eettdd,, BBoohheennsskkyy EE LL ((22000066))

6. Discovering resilient pathways
144
Little work has dealt with the other side of the equation – the extent to which these
services actually reach people, growing human demands for water, and trade-offs between
services and human well-being. In moving from the present to the future of water
management, sacrifices will be made: which ones will be considered acceptable, and where
will the power to make such decisions reside? Such questions are rooted in the social
dimension of resilience. One avenue of research related to social resilience in South African
water management is Ohlsson and Turton (2000)’s exploration of social adaptive capacity.
Social adaptive capacity is defined as the ability of society to manage water scarcity (what the
authors call “ first order scarcity” ), usually through economic (“second order scarcity” ) means.
More recent work by Turton et al. (2005) proposes a model of water governance, which unites
government, society, and science in an integrated view of the water scarcity concept. This
model shows promise as a mechanism for linking social aspects of water management to
those related to ecological resilience.
Two frameworks
Millennium Ecosystem Assessment
The Millennium Ecosystem Assessment (MA) was a four-year international work
program to bring scientific information about the relationships between ecosystems and
human well-being to decision-makers in government, institutions, communities, and private
industry (MA 2005). The program was designed around a conceptual framework that
identifies the relationships between indirect and direct drivers of ecosystem change,
ecosystem services, and human well-being (Figure 6.2). Indirect drivers include
demographics, economy, institutions, technology, and culture and religion which influence
human behaviour. These can affect human well-being directly or indirectly via direct drivers,
which include environmental processes such as climate change, land use change, hydrological
change, which in turn affect ecosystem services. Human well-being may have feedbacks on
indirect drivers. Within the framework there are opportunities for responses, or strategies and
interventions that can halt, reverse, or otherwise change a process in order to enhance human
well-being and conserve ecosystems. The interactions depicted by the framework occur at and
across various spatial and temporal scales. The Millennium Ecosystem Assessment did not
focus explicitly on resilience, but acknowledges both ecological and social aspects of
UUnniivveerrssiittyy ooff PPrreettoorriiaa eettdd,, BBoohheennsskkyy EE LL ((22000066))
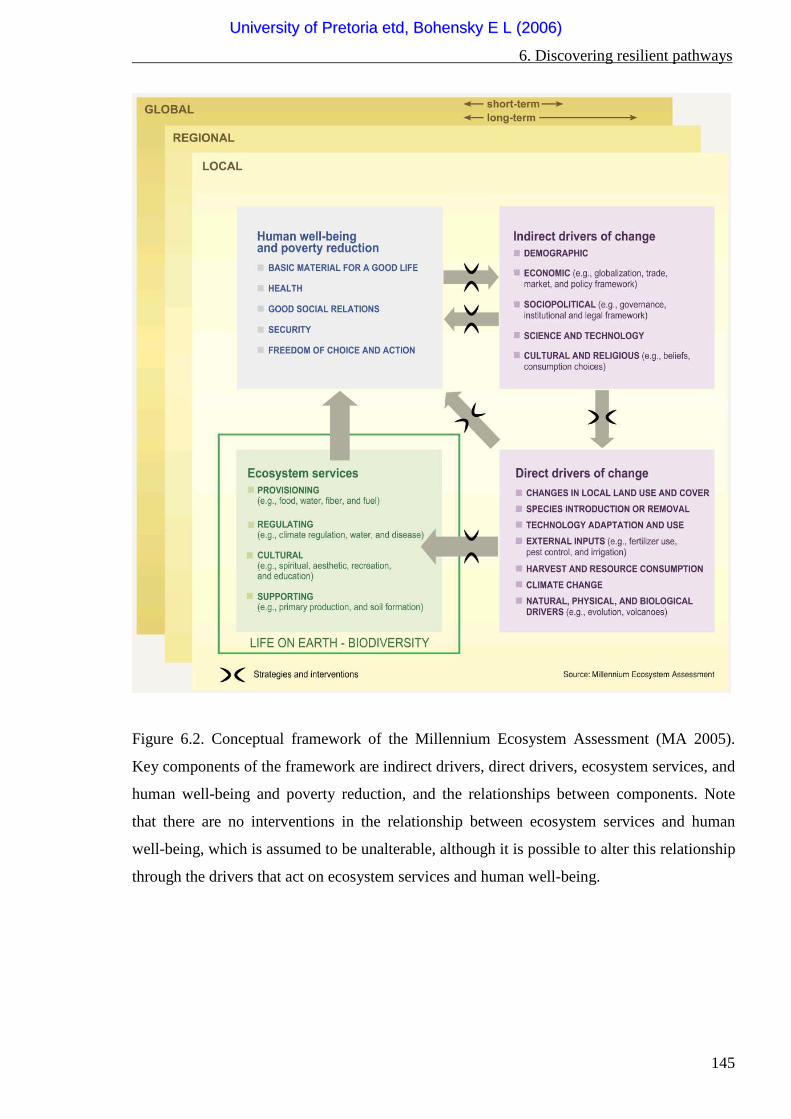
6. Discovering resilient pathways
145
Figure 6.2. Conceptual framework of the Millennium Ecosystem Assessment (MA 2005).
Key components of the framework are indirect drivers, direct drivers, ecosystem services, and
human well-being and poverty reduction, and the relationships between components. Note
that there are no interventions in the relationship between ecosystem services and human
well-being, which is assumed to be unalterable, although it is possible to alter this relationship
through the drivers that act on ecosystem services and human well-being.
UUnniivveerrssiittyy ooff PPrreettoorriiaa eettdd,, BBoohheennsskkyy EE LL ((22000066))

6. Discovering resilient pathways
146
Figure 6.3. Adaptation of the MA conceptual framework to depict two iterations of South
African water management. An asterisk (* ) denotes features that are both drivers and (direct
and indirect) responses for managing water.
��� � � � � �� � � � � ��
• ������������ ���� ����� ������ ���� ��������� ���������� ������������������
• � �� ������ ������������������������������� �� ��� ���� ���������� ��
� � � � � �� �� � �� � � � �� � � � � ��
• ! �������� ��������������" ������� ������# �$����� ���������� �� �������� ������������ • % ��������� ��# �� ���������������� � • & ���������� �� � ��� ���������! ���� ����� ���������������� �$���" ��������������
� � � �� � � � ���� � � ��� � �� �
� � � � � � � � � � �� �� � � �� �� � � � �� � � �' ��������� ���# ��( �) ������*� �' �������$ ����������$���� ��$�" ���������������� ������ ����$���� ����� �+ ��������������������� �� , ������� ������� ����� �����������$�
������������ ������� ��
� � � � � � � � � !� � �� �� �" � � � � � � �� � � � � � �� � �
�� ����������������� � ������ ��- �� �) ���������� ������� �� �������� � �������������������������������� ������� ���� � ���������� �" ���� ��� ��������� �. �������������� �������� ��" ���� �/ �����$�0���� ��������������������
� �� � � � �� � �� � � � � �� �������� ���$�! 1 ���� ������������ ���� �2 �� �+ ���������������������������������# ��������� �������������� �� ����������� 2 �� �' �" ��������� ��� $��������������� ����������� ������� ��# 2
�
�� � �� � � � �� � �� � � � � �' �" �������������� �� �� ���������2 � �3 ����������$�4 5 5 6 �������2 � �� �� �������������� ������� ����$������������������������2
� � � � � � � � � !� � �� �� �" � � � � � � �� � � � � � �� � � ����� �" ��� �� ���������$���������" �����$���������7�7���������� ���0��������� � �� , ����� ��$���0���# �$��������� ��- ��
���� ��� ����$�" ���� ��� ��������
�
� � � � � � � � � � �� �� � � �� �� � � � �� � � ����������������� ���� ���������� �� ��� �������������� ������ ���� ������� �������� �������������� �������������� ������ ������������� �+ ��� �� ������ ������������� ��������������
�� � �� � � � �� � �� � � � ���� � �� �� ������2� �� �� ������������ ����$������$ ��$$�� �# �� �������������������$��" ��2
� � � �� � � � ���� � � ��� � �# �
� �� � � � �� � �� � � � � �! � ������� ��$��������������� �# �$�����������������������2� ��������������������2 � �! ����������$$�������� �" �� � ��� ��������
� � �� �� � $ ��� �� % � � �& �' �� ( �) ��
�� � � ��� � �� �* ( �� � �
� ++ $ �� �� +�' � � � � �
$ � � ��� , ��� ��� � � ��� � �� �
UUnniivveerrssiittyy ooff PPrreettoorriiaa eettdd,, BBoohheennsskkyy EE LL ((22000066))

6. Discovering resilient pathways
147
resilience in line with the definition above (MA 2005).
In Figure 6.3, the generic components of the framework shown in Figure 6.2 are
populated with the South African water example. For the sake of simplicity and clarity, only
the dynamics that are thought to be most relevant to social-ecological system resilience are
included. Because water management today is significantly shaped by numerous events and
processes that have dominated the past century, two iterations of the framework are shown,
each of which depicts an era of water management. In addition, because water management at
the national scale is linked to processes at global, regional, and local scales, two boxes are
added to Figure 6.3. in which some of the main higher- and lower-level drivers are listed.
In the first iteration, the apartheid regime and its policies (indirect drivers of change)
encourage the building of large dams and other infrastructure in support of commercial
agriculture (direct drivers of change). These effect an ecological regime shift in the most
modified catchments of the country, whereby highly altered flow regimes cause large changes
in aquatic chemistry and biota (Chutter et al. 1996). There are adverse effects on human well-
being but also beneficial ones; the dam projects displace some communities but commercial
farms are a major source of employment (MacKay 2003). During this time, commercial
forestry plantations of non-native species in mountain catchments proliferate and reduce
streamflow (Görgens and van Wilgen 2004); they also facilitate the spread of non-commercial
invasive alien plant species (Le Maitre et al. 2004).
The transition from the first to second era comes about as part of the growing internal
and external resistance to apartheid and its economic, social, and environmental consequences
(MacKay 2003). In the second iteration, the nature of drivers shifts to some degree from
technical responses aimed at supporting commercial agriculture and industry to a broader,
integrative approach that makes legal provision for the satisfaction of basic human and
ecological needs. Since this era is still in progress, few of the effects of this new approach on
ecosystems and their services are observable at present, although efforts such as the Working
for Water Programme to restore ecosystems through invasive plant eradication have
demonstrated substantial benefits for water resources (Görgens and van Wilgen 2004). Human
well-being is expected to improve in time from the policy changes, particularly through
increased access to water supplies (DWAF 2004b) and participatory decision-making, but
there is limited evidence of improvement at present. Gains may also be offset by the past
erosion of ecological integrity and detrimental feedbacks on current and future human well-
being, though thus far not well documented or understood. Additionally, the new water
management policies eliminate subsidies for commercial agriculture with the aim of
UUnniivveerrssiittyy ooff PPrreettoorriiaa eettdd,, BBoohheennsskkyy EE LL ((22000066))

6. Discovering resilient pathways
148
internalizing some of the high costs of agriculture that were previously passed on to society
and ecosystems, but to some extent compromising the economic viability of this sector
(MacKay 2003).
To indicate the continuation of the cycle over time, the framework is amended with
the addition of an arrow from the human-well being box in the first iteration to the indirect
drivers box in the second iteration. While indirect drivers change from the first era to the
second, some of the direct drivers that operate in the first era, such as investment in
infrastructure to support supply-side water management, continue to operate in the present
and are expected to form part of the national water supply strategy for the foreseeable future
(DWAF 2004a). A second arrow is inserted to show the continued influence of the first-
iteration direct drivers in the second iteration. Arrows are also drawn from the “global and
regional drivers” and “ local drivers” boxes to the second iteration of the national-scale
dynamics, where these cross-scale links become apparent.
In populating the framework with this example, one observes that some elements can
be categorized as drivers and responses, depending on the reference point in space and time.
In fact, one can argue that all of the anthropogenic drivers of change in ecosystems and their
services are human responses in one form or another. Indeed, the categorization of such
elements may depend on the use of the framework: an assessment intended to identify or
improve policies may prefer to consider these as responses, whereas an assessment focused on
understanding processes may opt to label these as drivers. For the purposes of this paper, in
which the intent is closer to the latter, these elements are identified as drivers in Figure 6.3,
but are noted with an asterisk, while possible interventions in the relationships between
components are not shown.
Panarchy
The panarchy model is a theory of complex system dynamics, of which the adaptive
cycle is a central feature (Holling 1986, 1987, 2001, Holling and Gunderson 2002). The cycle
describes four phases or ecosystem functions: growth or exploitation, denoted by r, in which
recently disturbed areas are rapidly colonized; conservation (K), in which energy and material
are slowly accumulated and stored; release (�
), in which the tightly bound accumulation of
biomass becomes increasingly fragile until it is suddenly released by external agents; and
reorganization (� ), in which resources are reconfigured to take advantage of new
opportunities. While this description refers to ecosystems, it also applies to social or social-
UUnniivveerrssiittyy ooff PPrreettoorriiaa eettdd,, BBoohheennsskkyy EE LL ((22000066))

6. Discovering resilient pathways
149
ecological systems, which likewise progress through phases of growth, conservation, release,
and reorganization (Redman and Kinzig 2003).
The cycle can be illustrated as a heuristic model best represented as a “ figure of eight”
in two-dimensional space, with connectedness on the x axis and potential or capital on the y
axis (Holling and Gunderson 2002; Figure 6.4). Connectedness refers to the strength of
internal links or relationships that mediate external variability. A certain amount of
connectedness has advantages, but it is possible for a system to become overconnected, which
reduces external variability and increases system rigidity. Potential means the capability for
change through accumulated resources, whether ecological, social, or economic. The length of
the arrows between the phases indicates the speed of transition; the model suggests that the
system moves quickly from exploitation to conservation, and more slowly from conservation
to release and from release to reorganization. At this point, the system may exit from the cycle
and enter a second iteration as an alternatively configured system (Holling 1986). The cycle
then begins again. “Panarchy” refers to a series of linked and often nested cycles that evolve
through space and time (Holling et al. 2002).
Figure 6.4. The panarchy model (Holling 2001) is comprised of four ecosystem phases (r, K, �
, and � ) and the flow of events between them. Figure adapted from Moench (2005).
Connectedness
Potential
UUnniivveerrssiittyy ooff PPrreettoorriiaa eettdd,, BBoohheennsskkyy EE LL ((22000066))

6. Discovering resilient pathways
150
I teration 1. I teration 2.
Figure 6.5. The panarchy model of the adaptive cycle is used to depict the dynamics in South
African water management during the previous (iteration 1) and current (iteration 2) eras.
Potential
Connectedness
r
K
Potential
Connectedness
r
K
Paradigm shift with par tial state ‘ flip’ ; some aspects of previous era’s
legacy endure
Social and economic unsustainability of political system precipitates collapse; ecosystem degradation recognized
“Get more water” era: dam building, inter-basin transfers, exclusiveness of decision making
Increased management rigidity, reduced ecosystem variability, rising costs of treating water quality and invasive species, increasing modification of ecosystems
New South African government elected; move to pass new water legislation
“Some, for All, Forever” era: establishment of Catchment Management Agencies, participatory decision-making structures
Increasing connectedness within region and sharing of /competition for water; Emphasis on efficiency, equity, sustainability principles? CMAs dominated by powerful interest groups?
UUnniivveerrssiittyy ooff PPrreettoorriiaa eettdd,, BBoohheennsskkyy EE LL ((22000066))

6. Discovering resilient pathways
151
In Figure 6.5, the South African water management example is worked through the
panarchy model. As with the MA framework, two iterations are shown. The first depicts the
previous “get more water” era of management (Dent 2000), which has completed one full
phase of the adaptive cycle. During the exploitation phase, increasing investment is made in
large infrastructure as potential and connectedness both increase. This leads to greater
management rigidity, and through reduced ecosystem variability, increasing degradation,
though the ecosystem services of water and food production increase. Forces largely external
to the water management system, in the form of social discontent, economic decline, and
political pressure, eventually leads to the collapse of the apartheid government. As the system
reorganizes, old water laws are repealed and an extensive consultation process commences to
draft new laws.
The second iteration of the cycle begins. At this point in time, the overall system
undergoes a paradigm shift but only a partial change in configuration. The Water Act marks a
phase of reorganization, but the system is saddled with the legacy of the past era’s high-cost
responses that severely limit flexibility in achieving the Act’s efficiency, equity, and
sustainability principles: large dams, interbasin transfers, and treatment of invasive species
and pollution. The system has endured some partial crises and collapses, but none that have
overwhelmed it entirely because there has been sufficient ecological and social resilience
overall to buffer the effects of disturbance. This does not preclude the future occurrence of a
larger-scale crisis, however. Past actions have compromised many future options; freshwater
biodiversity is considered transformed in 26% of the country’s mainstem rivers to the point
that rehabilitation is no longer possible (Nel et al. 2004).
As water management moves into the second iteration, there is increasing
connectedness within the social-ecological system. The South African economy is highly
dependent on inter-basin transfers. In Gauteng Province, which generates the majority of
South Africa’s wealth, all economically-productive water is transferred from catchments
outside the province (Basson et al. 1997). South Africa is now highly reliant on the water
resources of Lesotho through a multi-billion dollar water project (Metsi Consultants 2002).
Water resources are shared with four additional neighboring countries, all with growing
demands.
Connectedness extends beyond links between surface water resources; there are
interactions between surface and ground water, for example, with groundwater becoming an
increasingly important resource in many areas, over-abstraction may deplete surface water
(Haupt 2001). There are also increasing water-atmosphere connections; in the Vaal
UUnniivveerrssiittyy ooff PPrreettoorriiaa eettdd,, BBoohheennsskkyy EE LL ((22000066))

6. Discovering resilient pathways
152
catchment, salinity, already a substantial problem, is believed to have increased due to
atmospheric deposition from the area’s power plants and other industries (Herold et al. 1992).
The effect of the new Catchment Management Agencies (CMA)s on this
connectedness is unclear; in theory; the devolution of water management functions to CMAs
provides insurance against over-connectedness, as each develops its own system and style of
governance in its Water Management Area. However, there is a danger that some CMAs may
be dominated by powerful interests (Chikozho 2005), lack capacity to carry out their
functions (Pollard and du Toit 2005), or revert to the old practices of the Department of Water
Affairs and Forestry – simply becoming regional extensions of the national department rather
than reasonably autonomous entities (Dent 2005).
Analysis of frameworks
A framework should be used to understand the past or guide the future; the resilient
pathways concept suggests that it needs to do both. Bearing this is mind, can these
frameworks help to clarify the vision of the South African Water Act and ultimately achieve
it?
It is possible to trace the past era of water management through a full cycle of the MA
framework and the panarchy model. The previous era appears to be traceable through the
direct drivers box in the MA framework; many of the effects of these drivers on ecosystem
services and human well-being remain uncertain at present. The current era of water
management is traceable through the very early exploitation and growth phase in the panarchy
model; some elements are more likely to remain in the reorganization phase, while other
elements have not actually exited from the previous iteration of the cycle. Beyond these
points, only inferences may be made and possible scenarios sketched about the future course
of events.
From this exercise, several findings emerge about water management dynamics and
the application of these frameworks. The first is that cross-scale connectedness has increased
over time. In the system’s first iteration, during the “get more water” era, there is little need to
include regional or local processes in either illustration of the example. During the second
iteration, increasing awareness of global and regional change (e.g. climate, trade), and
increasing involvement of local institutions and communities in decision making, create a
need to expand upon the illustration with links to these processes. This emphasizes a
particular limitation encountered in using the MA framework that arises from the static
UUnniivveerrssiittyy ooff PPrreettoorriiaa eettdd,, BBoohheennsskkyy EE LL ((22000066))

6. Discovering resilient pathways
153
relationship that the framework implies (Zermoglio et al. 2006). As noted above, the
distinction between drivers and responses can be somewhat ambiguous. In addition, issues of
temporal scale are difficult to capture with the generic framework. Links between scales may
change over time (Gunderson et al. 2002); in the example, they become more relevant in the
second iteration, where connectedness to global and regional processes increases in the post-
apartheid environment, while sensitivity to local processes increases with the decentralization
of decision-making.
These limitations, however, underscore an important finding about the changing
dynamics of water management: a fundamental change from the first to second iteration is
one in the managers’ understanding and acceptance of connectedness (Gunderson et al.
2002). Regional and local processes have always influenced water resource dynamics in
South Africa, but were previously ignored by managers who treated the system as closed
(Bohensky and Lynam 2005). While the MA framework does treat human behavior and
perception as an indirect driver, neither of these two frameworks seem to cater for a
distinction between “actual” and perceived dynamics, with the latter often being equally if not
more important than any physical system change.
Secondly, managers rarely have a clean slate to work upon at the beginning of a new
iteration because of the legacy effects of past management actions. Consequences of the past
still linger now, as remnants from management decisions taken today will linger in the future.
The adaptation of the panarchy model to the South African water situation suggests that some
options have been eliminated or constrained, and even as a new iteration of the cycle begins
after a partial release, the system may be too overconnected.
A third finding relates to trade-offs, which are inherent in social-ecological systems.
The MA framework suggests that improvements in ecosystem services and human well-being
are not always synergistic; more often there are trade-offs. One may be inclined to conclude -
though never implied by the framework - that ‘good’ drivers will lead to ‘better’ ecosystem
services and then to ‘better’ human well-being, but this is in fact a gross simplification.
Interestingly, the MA invested great efforts in assessing trade-offs (MA 2005), and that the
framework does not more explicitly accommodate their representation is somewhat
surprising. The panarchy model, by contrast, does capture an important trade-off of a different
nature, between connectedness and potential. This may manifest, for example, in the decision
to manage for productivity or to manage for sustainability (Walker et al. 2002). Note that a
system in the upper-right quadrant (high potential and connectedness) is unlikely to persist in
its current configuration.
UUnniivveerrssiittyy ooff PPrreettoorriiaa eettdd,, BBoohheennsskkyy EE LL ((22000066))

6. Discovering resilient pathways
154
The emphasis of current work on ecological aspects of the vision for South African
water management suggests that the social aspects of the vision need more development. Both
frameworks, and indeed the broader study of resilience, may contribute in this regard, in that
they begin to break down the barriers that have traditionally separated the study of human and
natural systems. They do this in quite different ways, however. The MA framework includes
the crucial feedback from human well-being to drivers of ecosystem change. This is an aspect
of natural resource management and decision-making that is typically ignored and generally
very poorly understood, though so often at the center of a debate on whether impoverished (in
all senses of the word) people cause more environmental destruction than their more well-off
counterparts (MA 2003). The panarchy model, on the other hand, does not use a
compartmentalization that distinguishes ecological and human components of the system, but
rather treats them as one. The MA framework, which treats ecosystem services and human
well-being as distinct boxes or arrows, describes the elements of the system - though this may
pose a challenge for elements which may not be neatly categorized, as noted above. The
panarchy model describes its processes, fluxes, and transitions – how the relationships
captured in the framework may change over time.
It is important to note the different intentions of these frameworks; the MA framework
was developed to assist decision-makers in understanding the relationships between
ecosystems and human well-being, while the panarchy effort sought to develop an integrative
theory of adaptive change that applies to some, if not all, social-ecological systems. The MA
framework may be more accessible as a tool for identifying management responses, whereas
the panarchy model is somewhat vague as a mechanism for guiding action. Alternatively, the
two could be used together, where researchers and managers use the MA framework to define
the elements and their relationships to one another at a particular scale of space and time, and
then use the panarchy model to see how these relationships may change or gain or lose
relevance as the system evolves.
Both frameworks run the risk of being too general, but this does not make them
useless where sufficient flexibility is allowed. The Millennium Assessment framework, for
example, was considered too abstract and inaccessible to a sub-global assessment team in
Peru who worked closely with local Quechua communities, so it was modified to better reflect
their cosmologies (Zermoglio et al. 2006). The adaptive cycle and panarchy concepts have
been replicated, elaborated upon, and adapted widely by contributors to Gunderson and
Holling’s edited volume Panarchy (2002) and the journal Ecology & Society (see Redman
and Kinzig 2003, Allison and Hobbes 2004, Cumming and Collier 2005), among others (e.g.
UUnniivveerrssiittyy ooff PPrreettoorriiaa eettdd,, BBoohheennsskkyy EE LL ((22000066))

6. Discovering resilient pathways
155
Peterson 2000). Such innovations are likely to strengthen both the framework and
understanding of the real-world examples studied.
Conclusion
The two frameworks explored in this paper appear able to help clarify the vision of the
South African Water Act and challenges faced in achieving it. This is an essential starting
point. Sizeable efforts are still needed to bring the understanding of resilience into sharper
focus and to unite disparate strands of resilience-related research in the South African water
sector. Thus far, most research appears to be limited to one or another part of the resilience
equation rather than the whole: resilience is discussed either in an ecological and ecosystem
services sense (MacKay 2000), or in a socio-political sense, though the word “ resilience” may
not actually be used (Ohlsson and Turton 2000, Pollard and du Toit 2005, Turton et al. 2005).
In isolation, neither approach may prove to be extremely useful for moving water
management forward, with convergence of the two required somewhere in the middle, as
some of these contributions appear to recognize.
South Africa’s water sector is currently in the midst of an unprecedented
transformation, with a unique history serving as an excellent opportunity to test and contribute
to resilience theory and application from a long-term perspective. The exploration of existing
frameworks can assist managers in the discovery of resilience and clarification of a vision,
though the process of discovering resilient pathways – the journey itself – may be as
important as the outcome. Further development of such frameworks could provide
stakeholders with diverse interests a forum in which to interact around often difficult and
contentious issues, where they may finally arrive at a desirable road map for the future.
UUnniivveerrssiittyy ooff PPrreettoorriiaa eettdd,, BBoohheennsskkyy EE LL ((22000066))

6. Discovering resilient pathways
156
References
Adger, W. N. 2000. Social and ecological resilience: are they related? Progress in Human Geography. 24(3): 347–364. Allison, H. E. and R. J. Hobbs. 2004. Resilience, adaptive capacity, and the “Lock-in Trap” of the Western Australian agricultural region. Ecology and Society 9(1): 3. [online] URL: http://www.ecologyandsociety.org/vol9/iss1/art3. Balmford, A. et al. 2002. Economic reasons for conserving wild nature. Science. 297: 950-953. Basson, M.S., P.H. van Niekerk and J.A. van Rooyen. 1997. Overview of water resources and utilization in South Africa. DWAF report P RSA/00/0197, 72pp. Berkes, F., J. Colding, and C. Folke, editors. 2003. Navigating social-ecological systems: Building resilience for complexity and change. Cambridge University Press, Cambridge. Bohensky, E., B. Reyers, A. S. van Jaarsveld, and C. Fabr icius, editors. 2004. Ecosystem services in the Gariep Basin: a component of the Southern African Millennium Ecosystem Assessment. African Sun Media, Stellenbosch, South Africa. (Also available from http://www.millenniumassessment.org/en/subglobal.safma.aspx.) Bohensky, E., and T. Lynam. 2005. Evaluating responses in complex adaptive systems: insights on water management from the Southern African Millennium Ecosystem Assessment (SAfMA). Ecology and Society 10(1): 11. [online] URL: http://www.ecologyandsociety.org/vol10/iss1/art11/ Carpenter , S. R., and M.G. Turner . 2001. Hares and Tortoises: Interactions of Fast and Slow Variables in Ecosystems. Ecosystems 3: 495–497. Carpenter , S. R., B. Walker , J. M. Ander ies, and N. Abel. 2001. From Metaphor to Measurement: Resilience of What to What? Ecosystems 4: 765–781. Chikozho, C. 2005. Policy and institutional dimensions of integrated river basin management: Broadening stakeholder participatory processes in the Inkomati River Basin of South Africa and the Pangani River Basin of Tanzania. Commons southern Africa occasional paper series No 12. Centre for Applied Social Sciences/Programme for Land and Agrarian Studies, Harare and Cape Town. Online at http://www.cassplaas.org/. Chutter , F.M., R.W. Palmer and J.J. Walmsley. 1996. Environmental Overview of the Orange River. Orange River Development Project Replanning Study. DWAF report PD 00/00/5295, 193 pp. Cumming, G. S., and J. Collier . 2005. Change and identity in complex systems. Ecology and Society 10(1): 29. [online] URL: http://www.ecologyandsociety.org/vol10/iss1/art29/.
UUnniivveerrssiittyy ooff PPrreettoorriiaa eettdd,, BBoohheennsskkyy EE LL ((22000066))

6. Discovering resilient pathways
157
Cumming, G. S., G. Barnes, S. Perz, M. Schmink, K. E. Sieving, J. Southworth, M. Binford, R. D. Holt, C. Stickler , and T. Van Holt. 2005. An exploratory framework for the empirical measurement of resilience. Ecosystems 8: 975–987 Dent, M. C. 2005. CMA Leadership Letter 37: Capacity, Skills, Empowerment and Delivery. Available from [email protected]. Dent, M. C. 2000. Strategic issues in modelling for integrated water resource management in southern Africa. Water SA 26(4):513-519. DWAF (Department of Water Affairs and Forestry). 2003. Hydrological Information System, Department of Water Affairs and Forestry, Pretoria South Africa [online] http://www.dwaf.gov.za/hydrology/cgi-bin/his/cgihis.exe/station. DWAF (Department of Water Affairs and Forestry). 2004a. National water resources strategy. First edition. DWAF, Pretoria. DWAF (Depar tment of Water Affairs and Forestry). 2004b. A decade of delivery. DWAF, Pretoria, South Africa. Available online at: http://www.dwaf.gov.za/Communications/Articles/Kasrils/2004/TEN%20YEARS%20OF%20DELIVER%20ARTICLE.doc. Falkenmark, M. 2003. Freshwater as shared between society and ecosystems: from divided approaches to integrated challenges Philosophical Transactions of the Royal Society of London Series B 358:2037-2049. Folke, C. 2003 Freshwater for resilience: a shift in thinking. Philosophical Transactions of the Royal Society of London Series B 358:2027–2036. Görgens, A.H.M. and B.W. van Wilgen. 2004. Invasive alien plants and water resources in South Africa: current understanding, predictive ability and research challenges. South African Journal of Science 100: 27-33. Gunderson, L .H. 2000. Ecological resilience—in theory and application. Annual Review of Ecology and Systematics 31: 425–39. Gunderson, L .H. and C.S. Holling, editors. 2002. Panarchy: Understanding transformations in human and natural systems. Island Press, Washington, D.C., USA. Gunderson, L . and C. Folke. 2005. Resilience—now more than ever. Ecology and Society 10(2): 22. [online] URL:http://www.ecologyandsociety.org/vol10/iss2/art22/. Haupt, C. J. 2001: Water resources situation assessment: Groundwater resources of South Africa. Department of Water Affairs and Forestry, Pretoria, South Africa. Herold, C. E., A. Görgens, and H. R. van Vliet. 1992. The influence of atmosphere deposition on the Vaal Dam. In: Proceedings of the Water Week Conference, Pretoria, South Africa.
UUnniivveerrssiittyy ooff PPrreettoorriiaa eettdd,, BBoohheennsskkyy EE LL ((22000066))

6. Discovering resilient pathways
158
Holling, C. S. 1973. Resilience and stability of ecological systems. Annual Review of Ecology and Systematics 4:1-23. Holling, C. S. 1986. The resilience of terrestrial ecosystems; local surprise and global change. Pages 292-317 in W. C. Clark and R. E. Munn, editors. Sustainable development of the biosphere. Cambridge University Press, Cambridge. Holling, C. S. 1987. Simplifying the complex: the paradigms of ecological function and structure. European Journal of Operational Research 30:139-146. Republished 1995 in Futures 26: 598-609. Holling, C. S. 2001. Understanding the complexity of economic, social and ecological systems. Ecosystems 4:390-405. Holling, C. S., and L . H. Gunderson. 2002. Resilience and adaptive cycles. Pages 25-62 in L. H. Gunderson and C. S. Holling, editors. Panarchy: understanding transformations in human and natural systems. Island Press, Washington, D.C., USA. Holling, C. S., and L . H. Gunderson and G. D. Peterson. 2002. Sustainability and panarchies. Pages 63-102 in L. H. Gunderson and C. S. Holling, editors. Panarchy: understanding transformations in human and natural systems. Island Press, Washington, D.C., USA. Janssen, M. A, T. A. Kohler , and M. Scheffer . 2003. Sunk-cost effects and vulnerability to collapse in ancient societies. Current Anthropology 44(5):722–728. Kleynhans, C. J. 2000. Desktop estimates of the ecological importance and sensitivity categories (EISC), default ecological management classes (DEMC), present ecological status categories (PESC), present attainable ecological management classes (present AEMC), and best attainable ecological management class (best AEMC) for quaternary catchments in South Africa. DWAF report. Institute for Water Quality Studies. Lee, K. N., editor. 1993. Compass and gyroscope: integrating science and politics for the environment. Island Press, Washington, D.C., USA. Levin, S. A. 1999. Fragile dominion: complexity and the commons. Perseus Books, Reading, Massachusetts, USA. Le Maitre, D., D. M. Richardson and R. A. Chapman. 2004. Alien plant invasions in South Africa: driving forces and the human dimension. South African Journal of Science 100: 103- 112. Ludwig, J. A., and M. D. Stafford Smith. 2005. Interpreting and correcting cross-scale mismatches in resilience analysis: a procedure and examples from Australia’s rangelands. Ecology and Society 10(2): 20. [online] URL:http://www.ecologyandsociety.org/vol10/iss2/art20/ MA (Millennium Ecosystem Assessment). 2003. Ecosystems and human well-being: a framework for assessment. Island Press, Washington, D.C., USA.
UUnniivveerrssiittyy ooff PPrreettoorriiaa eettdd,, BBoohheennsskkyy EE LL ((22000066))

6. Discovering resilient pathways
159
MA (Millennium Ecosystem Assessment). 2005. Ecosystems and human well-being: synthesis. Island Press, Washington, D.C. (Also available from http://www.millenniumassessment.org/.) MacKay, H. 2000. Moving towards sustainability: The ecological Reserve and its role in implementation of South Africa’s water policy. Proceedings of the World Bank Water Week Conference, Washington, April 2000. Available at http://www.thewaterpage.com/aq_eco_main.htm MacKay, H. M. 2003. Water policies and practices. Pages 49-83 in D. Reed and M. de Wit, editors. Towards a just South Africa: the political economy of natural resource wealth. WWF Macroeconomics Programme Office, Washington D.C., USA and CSIR, Pretoria, South Africa. MacKay, H.M., K.H. Rogers and D.J. Roux. 2003. Implementing the South African water policy: holding the vision while exploring an uncharted mountain. Water SA 29(4): 353-358. Metsi Consultants. 2002. Lesotho Highlands Water Project Final Report: Summary of Main Findings for Phase I. Development Report No. LHDA-678-F-001. 122 pp. Moench, M. 2005. Water, climatic variability and livelihood Resilience: Concepts, field insights and policy implications. Policy Paper II by “The Resilience and Freshwater Initiative” , Swedish Water House, Stockholm. Myburgh, E. and E. M. Nevill. 2003. Review of blackfly (Diptera: Simuliidae) control in South Africa. Onderstepoort Journal of Veterinary Research 70:307-317. Nel, J., Maree, G., Roux, D., Moolman, J., Kleynhans, N., Silberbauer, M. and A. Dr iver . 2004. South African National Spatial Biodiversity Assessment 2004: Technical Report. Volume 2: River Component. CSIR Report Number ENV-S-I-2004-063. Stellenbosch: Council for Scientific and Industrial Research. Ohlsson, L . and A.R. Tur ton. 2000. The turning of a screw: Social resource scarcity as a bottle-neck in adaptation to water scarcity. Stockholm Water Front 1:10-11. Palmer, C.G., R.S. Berold and W.J. Muller . 2004. Environmental water quality in water resources management. WRC Report No TT 217/04, Water Research Commission, Pretoria, South Africa. Peterson, G. D. 2000. Political ecology and ecological resilience: an integration of human and ecological dynamics. Ecological Economics 35: 323–336. Pollard, S. and D. du Toit. 2005. Achieving Integrated Water Resource Management: the mismatch in boundaries between water resources management and water supply. Paper presented at International workshop on ‘African Water Laws: Plural Legislative Frameworks for Rural Water Management in Africa’ , 26-28 January 2005, Johannesburg, South Africa. Rappaport, R. A. 1968. Pigs for the ancestors: ritual in the ecology of a New Guinea people. Yale University Press, New Haven, Connecticut, USA.
UUnniivveerrssiittyy ooff PPrreettoorriiaa eettdd,, BBoohheennsskkyy EE LL ((22000066))

6. Discovering resilient pathways
160
Redman, C. L . and A. P. Kinzig. 2003. Resilience of past landscapes: resilience theory, society, and the longue durée. Conservation Ecology 7(1):14. [online] URL: http://www.consecol.org/vol7/iss1/art14. Rogers, K. H. and Bestbier , R. 1997. Development of a Protocol for the Definition of the Desired State of Riverine Systems in South Africa. Department of Environmental Affairs and Tourism, Pretoria. Available at http://www.ccwr.ac.za/knprrp/index.html. Rogers, K. and H. C. Biggs. 1999. Integrating indicators, endpoints and value systems in strategic management of the rivers of the Kruger National Park South Africa. Freshwater Biology 41:439-452. Rogers, K., D. Roux, and H. Biggs. 2000. The value of visions and art of visionaries. Conservation Ecology 4(1): r1. [online] URL: http://www.consecol.org/vol4/iss1/resp1. Scheffer , M. S. Carpenter , J.A. Foley, C. Folke and B. Walker . 2001. Catastrophic shifts in ecosystems. Nature 413: 591-6. Snaddon, C. D., M. J. Wishar t, and B. R. Davies. 1998. Some implications of inter-basin water transfers for river ecosystem functioning and water resources management in southern Africa. Journal of Aquatic Ecosystem Health and Management 1:159-162. Thompson, H., C.M. Stimie, E. Richters and S. Per ret. 2001. Policies, legislation and organizations related to water in South Africa, with special reference to the Olifants River basin. Working Paper 18 (South Africa Working Paper No. 7). Columbo, Sri Lanka: International Water Management Institute. Turton, A. R. and R. Henwood, editors. 2002. Hydropolitics in the developing world: a southern African perspective. African Water Issues Research Unit, Pretoria, South Africa. Turton, A. R. and R. Meissner . 2002. The hydrosocial contract and its manifestation in society: A South African case study. Pages 37-60 in A. R. Turton and R. Henwood, editors. Hydropolitics in the developing world: a southern African perspective. African Water Issues Research Unit, Pretoria, South Africa. Turton, A. R., H. Hattingh, M. Claassen, D. Roux and P. Ashton. 2005. Towards A Model for Ecosystem Governance: An Integrated Water Resource Management Example. CSIR-Environmentek, Pretoria, South Africa. van der Leeuw and Aschan-Leygonie. 2000. A long-term perspective on resilience in socio-natural systems. Paper presented at the workshop on System shocks - system resilience, Abisko, Sweden, May 22-26, 2000. van Wyk, E., B. W. van Wilgen and D. J. Roux. 2001. How well has biophysical research served the needs of water resource management? Lessons from the Sabie-Sand. South African Journal of Science 97: 349-356. Walker , B., S. Carpenter , J. Ander ies, N. Abel, G. Cumming, M. Janssen, L . Lebel, J. Norberg, G. D. Peterson, and R. Pr itchard. 2002. Resilience management in social-
UUnniivveerrssiittyy ooff PPrreettoorriiaa eettdd,, BBoohheennsskkyy EE LL ((22000066))

6. Discovering resilient pathways
161
ecological systems: a working hypothesis for a participatory approach. Conservation Ecology 6(1): 14. [online] URL: http://www.consecol.org/vol6/iss1/art14 Walker , B., C. S. Holling, S. R. Carpenter , and A. Kinzig. 2004. Resilience, adaptability and transformability in social–ecological systems. Ecology and Society 9(2): 5. [online] URL: http://www.ecologyandsociety.org/vol9/iss2/art5. WCD (Wor ld Commission on Dams). 2000. Orange River Development Project, South Africa case study, prepared as an input to the World Commission on Dams, Cape Town, South Africa. Available online at: http://www.dams.org. WRI (Wor ld Resources Institute). 2000. World Resources 2000-2001: People and Ecosystems: The Fraying Web of Life. World Resources Institute, Washington, D.C.
Zermoglio, M. F., A. S., Van Jaarsveld, W. V. Reid, J. Romm, R. Biggs, Y. Tianxiang, and L . Vicente. 2006. The multiscale approach. In D. Capistrano, M. Lee, C. Raudsepp-Hearne, and C. Samper, editors. Ecosystems and Human Well-being: Multi-scale assessments. Volume 4. Findings of the Sub-global Assessments Working Group of the Millennium
UUnniivveerrssiittyy ooff PPrreettoorriiaa eettdd,, BBoohheennsskkyy EE LL ((22000066))

7. Synthesis
162
Synthesis
The Law of Vanishing Civilizations: The Tenth Water Law of the West should be called the Hohokam Law of Water and Gravity. Under this law, if there is no rain, there is no water to flow down hill. What went up—the buildings and the civilization—may crumble to dust if Mother Nature decides to hold a long drought. Lying beneath the streets of Phoenix are the ruins of the ancient Hohokam Indian metropolis that vanished pr ior to 1400 AD. Phoenix is the second city to be built on the same site in reliance on the er ratic flows of the Salt River . Californians prayed for rain for the last six years (apparently successfully) because they didn’ t have enough water to flush their toilets. Many Southern Californians had been heard to ask ‘What do you mean this used to be a deser t?’
—Hugh Holub, 1999
At the end of 2005 a southern African river, the Olifants, stopped flowing into its
downstream reaches for the first time in recorded history. Unlike the Salt River of Phoenix, the
downstream reaches of the Olifants do not support an urban metropolis, but a major reservoir of
biodiversity and an ecotourism flagship, the Kruger National Park. Park managers, tracking
rainfall and upstream withdrawals, foresaw this outcome months - even years - prior to its
occurrence, but believed the problem would be easily solved by the usual means whenever river
flows fell below a certain threshold of potential concern (Rogers and Biggs 1999): a negotiated
release from a dam upstream. This time, however, the dam manager refused the request, an
unexpected outcome (H. C. Biggs, pers. comm.). Because the South African Water Act is not yet
fully implemented, the park was without any clear legal recourse to persuade higher levels of
authority to intervene on its behalf in what had become a battle for water between multiple
government departments, each trying to fulfill its mandate (Macleod 2006). In the no-man’s-land
in which South African water law now finds itself, praying for rain may be as good an option as
any.
Why, when today’s scientific and technological capabilities are presumably advanced far
beyond the knowledge base on which the Hohokam civilisation relied, does modern society still
resort to myopic management responses – or no responses at all? This question, of much
philosophical interest to scholars across disciplines (Tainter 1998, Janssen et al. 2003, Redman
and Kinzig 2003, Diamond 2005), is closely linked to the central question explored in the
previous five chapters of this thesis: why is sound management so elusive, and how can social-
UUnniivveerrssiittyy ooff PPrreettoorriiaa eettdd,, BBoohheennsskkyy EE LL ((22000066))

7. Synthesis
163
ecological systems thinking improve management? Here I explore some potential answers to this
question, synthesising the findings of the five chapters and the considering the contribution each
makes to our current understanding of water from a social-ecological systems perspective.
Chapter 2 presents a framework for understanding why management responses in
complex systems may succeed or fail based on congruence of impact, awareness, and power
scopes. While congruence of impact, awareness, and power is more likely to accompany effective
responses, it can never be complete. Decentralisation and devolution of power to Catchment
Management Agencies (CMAs) will not achieve perfect congruence, for example, because CMAs
will inevitably be affected by processes operating at other scales. A concern emerging now is the
scale mismatch between broader water management by the CMAs, and the responsibility for
water supply, which is given to municipalities under the Water Services Act of 1997 (Pollard and
du Toit 2005). Water managers must recognise that institutional structures of any type may be
inadequate to deal with the full suite of social-ecological system dynamics in operation, many
beyond their control (Wilson 2006). They must instead be prepared to respond adaptively, to
improvise in the so-called theatre of water management. A further crucial aspect of management
is also highlighted: the changing context within which societal responses to problems arising in
complex adaptive systems must be developed. Maintaining flexibility – though this may
contradict elements of the historical command-and-control approach to water management – is
therefore the fundamental ‘effective’ response for water managers to adopt. Managers should also
consider where the negative impacts of responses can best be absorbed within the system, where
there is both awareness and power to respond effectively – in other words, where both ecological
and social resilience are highest. The absorption capacity of the lower Olifants River in the
Kruger Park, for example, needs to be weighed up against the resilience of mining interests
upstream and that of downstream communities in Mozambique.
One way to enhance congruence and enable more effective management responses is
through the use of scenarios, which allows stakeholders to develop a common understanding of a
problem that impacts them - often the first step required to influence power. In Chapter 3, the
utility of scenarios is demonstrated for dealing with situations of uncertainty encountered in
resource management and conservation. Scenario analysis for the Gariep basin illuminated
spatio-temporal trade-offs between ecosystem services and human well-being that were not so
apparent otherwise, demonstrating the importance of designing a scenario analysis so that it
UUnniivveerrssiittyy ooff PPrreettoorriiaa eettdd,, BBoohheennsskkyy EE LL ((22000066))

7. Synthesis
164
captures the cross-scale processes and links of interest to decision makers (Biggs et al. 2006).
While scenarios are often used in situations of uncontrollable uncertainty (Peterson et al. 2003),
the Gariep experience suggests that scenarios are apt to yield the greatest benefits to social-
ecological systems management when they are designed to inform a focal policy issue that
stakeholders have some power to change. The great virtue of scenarios lies in their ability to
impart a sense of ownership in stakeholders of the processes they believe will shape the future.
The scenario development process ultimately underscores the necessity of considering the future
in a social-ecological systems context, because it is in the complex interactions between people
and nature that uncertainty in ecology and conservation has its roots.
A major area of uncertainty in South African water management revolves around the
decentralisation of functions from the national department to CMAs. Chapter 4’s exploration of
the decentralisation of water management through an agent-based modeling approach shows that
decentralised decision-making almost always shifts the balance of winners and losers. Of the
three dominant ‘centralised’ water management paradigms that are explored in the model, none
does particularly well in balancing the Water Act principles at the national level or in all water
management areas. In both cases, trade-offs among efficiency, equity, and sustainability are made
except in areas where water resources are abundant. On the other hand, the ability of water users
to learn and employ a diversity of management systems tends to yield the most sustainable
outcomes. This finding is in agreement with other examples from the literature (Holling and
Meffe 1995), yet of particular interest is that ecological sustainability is best achieved in the
model when sectoral water users have difficulty fulfilling their demands, suggesting either that
restraints on use are needed to maintain ecosystems in good condition or that severe reallocation
measures need to be put in place. The most promising solution to ensure that sustainability is
prioritised appears to be a national-level Some, for All, Forever framework, within which
learning is able to take place. Rather than adopt a ‘one-size-fits-all’ policy, Catchment
Management Agencies and local organisations must approach their specific problems with unique
perspectives and fresh insight, appropriate for specific conditions in the Water Management Area
(WMA).
If learning is such an important prerequisite for a robust water management system, how
do agents learn, and what needs to be done to enhance learning? Extending the use of the model
used in the previous chapter, the subject of ‘ learning dilemmas’ - social-ecological system
UUnniivveerrssiittyy ooff PPrreettoorriiaa eettdd,, BBoohheennsskkyy EE LL ((22000066))

7. Synthesis
165
properties and human perceptions that challenge learning’s three pillars of capacity,
understanding, and willingness - is pursued in Chapter 5. What agents learn also depends on the
measures that they select to provide information about the real world, and their ability to update
or change these measures when conditions change. The model experiments show that mismatches
are commonplace between social-ecological system properties and human cognitive abilities to
process information about these properties. These social-ecological system properties need to be
kept in mind in efforts to increase learning. Where learning is difficult due to social-ecological
system conditions, monitoring systems must be designed so that they capture key patterns in
these conditions. This may also require a redesign of existing institutional structures (Wilson
2006).
In Chapter 6, the immense challenge of linking theory to action is addressed. Resilience
is identified as an intriguing theoretical concept for South African water management, but
existing frameworks to analyse resilience are not yet adequate for taking the South African Water
Act forward. The usefulness of two frameworks is examined for the implementation of the act
and its vision of a future in balance: the Millennium Ecosystem Assessment’s conceptual
framework and the adaptive cycle. While these frameworks both have limitations, their
exploration by South African water managers as part of a broader study of resilience could
provide a mechanism for breaking down the traditional social science-natural science divide in
water management. The two frameworks are in many ways complementary; managers that use
these frameworks, however, should be prepared to modify them as needed to handle specific
management challenges or questions (van Wyk et al. 2001). In this sense, the practical challenges
encountered in implementing the Water Act may help to put resilience theory to the test. The
Olifants River incident suggests nothing flawed about the Water Act itself, but points to a
weakness in the overarching South African water management system in which the Water Act is
only a single, albeit central, component. Its significance notwithstanding, additional checks and
balances need to be in place (MacKay 2003); unwavering dependence on the Water Act to do its
job, and the expectation that it will never fail, does not promote discovery of resilient pathways.
In short, the answer to the question raised at the beginning of this chapter is that the
problems experienced in the Salt and Olifants Rivers are essentially both management failures
rooted in a lack of understanding of linked social and ecological dynamics. Experience shows
UUnniivveerrssiittyy ooff PPrreettoorriiaa eettdd,, BBoohheennsskkyy EE LL ((22000066))

7. Synthesis
166
that some objectives have been served quite well by misinterpreting or disregarding these
dynamics (Wilson 2002, Allison and Hobbes 2004) – in a world where natural resources appear
limitless, impacts can be transferred elsewhere in space and time, and competition and conflict
are minimal, the consideration of the social and ecological implications of one’s actions is often
counterproductive for meeting one’s immediate goals. Water in South Africa has definite
physical limits; however, societies are not typically doomed by such a limitation alone, but rather
by perceptions of the limitation and options available for overcoming these limits (Tainter 1998,
Diamond 2005).
It is also arguable that in both examples, a lack of understanding was closely coupled with
a deeply-entrenched disconnect between science and management that hampered the emergence
of an adaptive learning environment. Even in simpler, traditional systems, such a disconnect –
typically between those with information and those with decision-making power – could have
profound implications for the long-term welfare of the society and its resource base (Redman and
Kinzig 2003). In present times, there is a call to move from “knowledge transfer,” which tends to
impart knowledge of scientists to managers in a unidirectional fashion, and is often contested or
ignored, to “knowledge interfacing and sharing,” whereby both parties take ownership of
knowledge and use it to pursue common objectives (Roux et al. 2006).
Recommendations for water management and future research
Human behaviour is a great obstacle to change, but also a positive mechanism for it. While
suggestions for modifying human behaviour are beyond the scope of this thesis, confronting it is
a critical first step for changing water management (Folke 2003). Several recommendations
follow from the analysis presented herein, which the South African water sector and researchers
can begin implementing immediately:
1) Foster information sharing and exchange - within WMAs, between WMAs, across
sectors, and internationally. There are numerous ways this may be done, which include
both physical and virtual fora (MacKay et al. 2003), and need not be limited to national
boundaries. There is a great deal to be learned from information sharing and exchange
with countries such as France, for example, that have devolved management to
UUnniivveerrssiittyy ooff PPrreettoorriiaa eettdd,, BBoohheennsskkyy EE LL ((22000066))

7. Synthesis
167
catchment-scale agencies (Buller 1996; Perret et al. in press) as well as other middle-
income countries such as Mexico that have begun similar decentralisation processes
(Wester et al. 2003). Certain challenges faced by South Africa in particular do need to be
considered, as the greater focus on participation requires that stakeholder views are
adequately captured in decision-making and research (van Wyk et al. 2001). As Chikozho
(2005) notes in describing the process of CMA establishment in the Inkomati WMA,
disadvantaged communities often have much less developed networks than the organised
commercial sectors, for example, and thus the difficulty of getting genuine and legitimate
representation from disadvantaged communities should not be understated. In addition,
‘participation fatigue’ may thwart progress on this front, and may be especially acute in
WMAs like the Inkomati, in which the process has been ongoing for more than seven
years. In such cases, participant turnover is likely to be high, which poses another
challenge to moving forward. Stakeholder engagement will need to be approached in
innovative, novel ways that are able to capture participants’ imaginations and retain their
active involvement in the process (scenarios, discussed below, are one such possibility).
2) Conduct participatory scenario planning exercises with water users at national, CMA, and
local levels. Because of the multi-tiered, nested structure of the new institutional
arrangements for the South African water sector, a simple, but multiple-scale scenario
analysis involving key representatives of the national ministry, one or two neighbouring
CMAs, and local catchment management committees and water user associations
representing all sectors would be a highly useful exercise (Biggs et al. 2006). The first
CMAs that are established should seize the opportunity to implement a scenario activity
that can serve as a ‘pilot’ for the whole country, which subsequently-established CMAs
can then learn from and refine.
3) Evaluation and redesign of monitoring systems. Monitoring must be spatially aligned with
major processes and institutions. Spatially, it should be undertaken collectively by the
Department of Water Affairs and Forestry (DWAF), CMAs, local institutions, as well as
regional and international institutions. Monitoring must also be temporally aligned with
these processes. A shift in emphasis is needed to slow variables or driving forces and
UUnniivveerrssiittyy ooff PPrreettoorriiaa eettdd,, BBoohheennsskkyy EE LL ((22000066))

7. Synthesis
168
governing structures that determine system outcomes (Carpenter and Turner 2001, Lynam
and Stafford-Smith 2004). While the River Health Programme is commended for its
contribution in the area of monitoring ecological integrity, the need to monitor social
aspects of water and drivers of change in water resources such as land use has been
identified as a gap (van Wyk et al. 2001). Indicator development, which has been aligned
with State of the Environment reporting initiatives in the past, also needs to shift to an
integrated catchment management framework that involves institutions across scales
(Walmsley et al. 2002).
4) Raise awareness of and train water managers and users in social-ecological systems and
resilience thinking and approaches. The ideas of social-ecological systems and resilience
theory are not always readily accessible to those with training in a traditional discipline or
the public at large, due to the relatively abstract concepts and the lack of a tangible icon to
represent these ideas. Thus, a creative infusion on how to approach this will be needed.
One possible insertion point for communicating ideas about social-ecological systems
may be the Working for Water Programme, whose public education efforts have begun to
make a positive impact on people’s awareness of invasive alien plants (Le Maitre et al.
2004). In simplest terms, water managers and users need to be envision the ‘big picture’
of water resources and not simply their small sub-area of the WMA (Chikozho 2005).
5) Encourage higher efficiency in the agricultural sector, the most consumptive water use
and relatively unproductive in economic terms. This is a frequently-heard
recommendation for achieving the Water Act principles, but until the problem of
agricultural inefficiency is addressed in a more holistic way little progress is likely to be
realised. The social implications of a reduction in agricultural water use (i.e. employment)
are not trivial (MacKay 2003) and do need to be dealt with in an integrated fashion. Job
creation will need to be supported in other sectors, such as tourism, and more funding
allocated for poverty reduction programs which also emphasise ecological sustainability,
like Working for Water (van Wilgen et al. 2005). Government agencies with overlapping,
and especially those with conflicting mandates, including the Department of
UUnniivveerrssiittyy ooff PPrreettoorriiaa eettdd,, BBoohheennsskkyy EE LL ((22000066))

7. Synthesis
169
Environmental Affairs and Tourism and Department of Agriculture, will need to work
together with DWAF to ensure synergy in this area.
6) Maintain legal flexibility. For all the merits of the South African Water Act, it is not
without flaws. Amendments may be needed as experience is gained, and the act should be
seen as a living document with limits. Furthermore, potential conflicts between the Water
Act and other laws, such as the Water Services Act (Pollard and du Toit 2005), and those
pertaining to land reform, may need to be reconciled. However, the creation of a Water
Tribunal to hear appeals is a promising step (MacKay 2003).
Conclusion
The view that the human and natural worlds are interdependent is clearly encapsulated by
the South African Water Act, but the implications of this are not always completely understood.
My attempt in this thesis has been to dig deeper into the social-ecological system ‘well’ of
thought to identify and explain how this perspective may assist the water sector during this
current transitional era in several specific ways. Certainly the ideas, approaches, and
recommendations discussed here also apply to other challenges in ecosystem management and
other parts of the world, and cross-comparison might prove fruitful.
“All the world’s cultures, past and present, are to some degree available to us,” Wilbur
(2000) observes. Modern society now has the advantage of instantaneous communication across
much of the globe. We also have hindsight, including a greater awareness of the past, and a good
deal of foresight, thanks to advances in technology and cognitive tools like scenarios and
modeling. The Hohokam, and even recent past generations of South Africans, have not had the
same fortune. Of course, hindsight has limits in a rapidly-changing world, but meticulously and
thoughtfully applied, stands to greatly enrich the knowledge base for current decision making.
Every society eventually succumbs to Holub’s Tenth Law in one way or another – it
collapses, disperses, or transforms (Tainter 1998). One day, future societies will read about South
Africa in the early 21st century and its pivotal water policy. Will they read a story of success or
failure, and what will it teach them about the future still to come?
UUnniivveerrssiittyy ooff PPrreettoorriiaa eettdd,, BBoohheennsskkyy EE LL ((22000066))

7. Synthesis
170
References
Allison, H. E. and R. J. Hobbs. 2004. Resilience, adaptive capacity, and the “Lock-in Trap” of the Western Australian agricultural region. Ecology and Society 9(1):3. [online] URL: http://www.ecologyandsociety.org/vol9/iss1/art3. Biggs, H. C. Personal communication. 7 January 2006. Biggs, R. C. Raudsepp-Hearne, C. Atkinson-Palombo, E. Bohensky, E. Boyd, G. Cundill, H. Fox, S. Ingram, K. Kok, D. Oswald, S. Spehar, M. Tengo, D. Timmer, M. Zurek. 2006. Linking futures across scales: a dialog on multi-scale scenarios. Ecology and Society, in press. Buller , H. 1996. Towards sustainable water management: catchment planning in France and Britain. Land Use Policy 13:289–302. Carpenter , S. C. and M. G. Turner . 2001. Hares and tortoises: interactions of fast and slow variables in ecosystems. Ecosystems 3:495–497. Chikozho, C. 2005. Policy and institutional dimensions of integrated river basin management: Broadening stakeholder participatory processes in the Inkomati River Basin of South Africa and the Pangani River Basin of Tanzania. Commons southern Africa occasional paper series No 12. Centre for Applied Social Sciences/Programme for Land and Agrarian Studies, Harare and Cape Town. Available online at http://www.cassplaas.org/. Diamond, J. 2005. Collapse: how societies choose to fail or survive. Penguin Books, London.
Folke, C. 2003 Freshwater for resilience: a shift in thinking. Philosophical Transactions of the Royal Society of London Series B 358: 2027–2036.
Holub, H. 1999. “Ten Water Laws of the West.” Available online at http://www.bandersnatch.com/water.htm).
Janssen, M. A, T. A. Kohler, and M. Scheffer . 2003. Sunk-cost effects and vulnerability to collapse in ancient societies. Current Anthropology 44:722–728. Mackay, H. 2003. Water policies and practices. Pages 49-83 in D. Reed and M. de Wit, editors. Towards a just South Africa: the political economy of natural resource wealth. WWF Macroeconomics Programme Office and Council for Scientific and Industrial Research, Washington D.C. and Pretoria, South Africa. MacKay, H.M., K.H. Rogers and D.J. Roux. 2003. Implementing the South African water policy: holding the vision while exploring an uncharted mountain. Water SA 29:353-358.
UUnniivveerrssiittyy ooff PPrreettoorriiaa eettdd,, BBoohheennsskkyy EE LL ((22000066))

7. Synthesis
171
Macleod, F. 2006. “Damned from the start.” Mail and Guardian, 3-9 February 2006, Johannesburg, South Africa. Perret, S., S. Farolfi and R. Hassan, editors. 2006. Water Governance for Sustainable Development: Approaches and Lessons from Developing and Transitional Countries. Earthscan/ James and James, London. Pollard, S. and D. du Toit. 2005. Achieving Integrated Water Resource Management: the mismatch in boundaries between water resources management and water supply. Paper presented at International workshop on ‘African Water Laws: Plural Legislative Frameworks for Rural Water Management in Africa’ , 26-28 January 2005, Johannesburg, South Africa. Redman, C.L . and A.P. Kinzig. 2003. Resilience of past landscapes: resilience theory, society, and the longue durée. Conservation Ecology 7(1):14. [online] URL: http://www.consecol.org/vol7/iss1/art14. Rogers, K. and H.C. Biggs. 1999. Integrating indicators, endpoints and value systems in strategic management of the rivers of the Kruger National Park South Africa. Freshwater Biology 41:439-452. Roux, D. J., K. H. Rogers, H. C. Biggs, P. J. Ashton and A. Sergeant. 2006. Bridging the science–management divide: moving from unidirectional knowledge transfer to knowledge interfacing and sharing. Ecology and Society 11(1): 4. [online] URL:http://www.ecologyandsociety.org/vol11/iss1/art4/ Tainter, J. 1998. The collapse of complex societies. Cambridge University Press, Cambridge. van Wyk, E., B. W. van Wilgen and D. J. Roux. 2001. How well has biophysical research served the needs of water resource management? Lessons from the Sabie-Sand. South African Journal of Science 97:349-356. Walmsley, J. 2002. Overview: Sustainability indicators for catchment management in South Africa. Water Resource Commission, Pretoria, South Africa. Wester , P., D. J. Merrey, M. De Lange. 2003. Boundaries of Consent: Stakeholder Representation in River Basin Management in Mexico and South Africa. World Development 31:797–812. Wilbur , K . 2000. A theory of everything. Shambhala Publications, Boston. Wilson, J. A. 2006. Matching social and ecological systems in complex ocean fisheries. Ecology and Society 11(1):9. [online] URL:http://www.ecologyandsociety.org/vol11/iss1/art9/. Wilson, J. 2002. Scientific uncertainty, complex systems, and the design of common-pool institutions. Pages 327-360 in E. Ostrom, T. Dietz, N. Dols ak, P.C. Stern, S. Stovich, and E.U. Weber, editors. The Drama of the Commons. Committee on the Human Dimensions of Global Change, National Research Council, National Academy Press, Washington, DC.
UUnniivveerrssiittyy ooff PPrreettoorriiaa eettdd,, BBoohheennsskkyy EE LL ((22000066))

172
Appendix A. van Jaarsveld, A. S., R. Biggs, R. J. Scholes, E. Bohensky, B Reyers, T. Lynam, C. Musvuto and C. Fabricius. 2005. Measuring conditions and trends in ecosystem services at multiple scales: the Southern African Millennium Ecosystem Assessment (SAfMA) experience. Philosophical Transactions of the Royal Society B: Biological Sciences. 360(1454): 425- 441.
UUnniivveerrssiittyy ooff PPrreettoorriiaa eettdd,, BBoohheennsskkyy EE LL ((22000066))

173
Appendix B. Class diagram depicting agent classes of the WaterScape model, with attributes in top box and methods in bottom box.
WaterUnit (Class SpatialEntityElement)
id pemc wma runoff origRunoff incomingWater agricultureDemand forestryDemand minesIndustryDemand ruralDemand urbanDemand ecoReserve ecoProp humanReserve ruralReserve urbanReserve waterAvailable strategy strategyType waterTransferedOut waterTransferedIn recipient1 (2,3,4) precipitation hydroIndex eisc efficiencyTime humanTime ecoTime origPemc timeStep indicator
allocateAllWaterPossibleToSector allocateMarketForces allocateToWaterUser allocateWaterToSector addDemand degrade evaluateIndicator flowIn flowOut getFlowRecipient moveWaterFromAvailableToEcoReserve removeWater restore replenishRunoffClimateChangeNormal resetWaterUnitForNextStep checkAndTransferTo amountToTransfer transferTo
WaterUser (Class AgentLocation)
demand sector waterAllocated waterConsumed timeStep demandExported demandImported getDemandRecipientAllWMA addDemandToWaterUser export exportDemand resetWaterUserForNextStep giveWater
WaterScape Message (Class Object)
amountTransfered origUnmetDemand transferRecipient updatedUnmetDemand wma
UUnniivveerrssiittyy ooff PPrreettoorriiaa eettdd,, BBoohheennsskkyy EE LL ((22000066))

174
CMA (Class AgentComm)
wma waterUnits allocationStrategy firstTimeStep timeStep status adjustDemandAgricultureBase adjustDemandForestryBase adjustDemandMinesIndustryBase adjustDemandRuralBase adjustDemandUrbanBase adjustDemandAgricultureHigh adjustDemandForestryHigh adjustDemandMinesIndustryHigh adjustDemandRuralHigh adjustDemandUrbanHigh allocateCollectiveLearningEfficiency allocateCollectiveLearningEfficiencyIndicator allocateCollectiveLearningEquity allocateCollectiveLearningEquityIndicator allocateCollectiveLearningSustainability allocateCollectiveLearningSustainabilityIndicator allocateCollectiveLearningIndicator allocateFortressWorld allocateMarketForces allocateToWaterUser allWaterUnitsGetFortressWorldAllocation allWaterUnitsGetMarketForcesAllocation allWaterUnitsUsePolicyReform waterUnitsGetRandomStrategy getTransferDonor getTransferDonorNearest getTransferRecipientMaxDemand getTransferRecipientMaxUnmetDemand resetCMAForNextStep applyStrategy fortressWorldStrategy getStrategy learningStrategy marketForcesStrategy policyReformStrategy deficitAlertFortressWorld deficitAlertMarketForces deficitAlertPolicyReform recipientsSendMessageFortressWorld recipientsSendMessageLearning recipientsSendMessageMarketForces recipientsSendMessagePolicyReform transferMaxAvailable transferToNearest transferToNearestMaxAvailable
UUnniivveerrssiittyy ooff PPrreettoorriiaa eettdd,, BBoohheennsskkyy EE LL ((22000066))

175
APPENDIX C. Description of attributes of entities in the WaterScape model. Entity Attribute Method Description WaterUnit id Unique value for each water unit pemc Present ecological management class wma Identification number of Water Management Area (WMA) runoff Natural mean annual runoff origRunoff Runoff value at initialisation incomingWater Water from upstream water units agricultureDemand Water requirement of agricultural sector forestryDemand Water requirement of forestry sector minesIndustryDem
and Water requirement of mining and industrial sector
ruralDemand Water requirement of rural sector urbanDemand Water requirement of urban sector ecoReserve Ecological reserve requirement ecoProp Proportion of total runoff designated for ecological reserve requirement humanReserve Human reserve requirement ruralReserve Human reserve requirement of rural population urbanReserve Human reserve requirement of urban population waterAvailable Component of runoff that is available for use strategy Water management strategy (i.e. scenario) strategyType Strategy type (i.e. previous or most successful strategy) waterTransferedO
ut Water transferred out of water unit
waterTransferedIn Water transferred into water unit recipient1 (2,3,4) Downstream water unit that receives water from this water unit precipitation Mean annual precipitation hydroIndex Hydrological index value eisc Ecological importance and sensitivity value efficiencyTime Consecutive number of times water unit exceeds efficiency indicator
threshold value humanTime Consecutive number of times water unit exceeds human indicator
threshold value ecoTime Consecutive number of times water unit exceeds ecological indicator
threshold value
UUnniivveerrssiittyy ooff PPrreettoorriiaa eettdd,, BBoohheennsskkyy EE LL ((22000066))

176
origPemc PEMC value at initialisation timeStep Number of time steps (years) since initialisation indicator Indicator by which success of strategy is measured allocateAllPossibleWaterToSector Gives all water needed to satisfy demand; if demand is more than water
available, gives all water available. allocateMarketForces Allocates water to each of the sectors in turn according to 'Market Forces'
rule (i.e. in order of average economic productivity). allocateToWaterUser Allocates an amount to water user proportional to its demand. allocateWaterToSector Gives water to the WaterUser of the specified sector; if not enough water
is available, gives all available. addDemand Increases demand of a WaterUser. degrade Adjusts ecological management class (PEMC) for degradation, based on
withdrawal-to-availability ratio and ecological importance and sensitivity index, for water unit and recipient (downstream) water units.
evaluateIndicator Evaluates success of indicator and changes if it fails for 5 successive timesteps.
flowIn Releases water into water unit from donor (upstream) water units.
flowOut Releases water out of this water unit into recipient water units. getFlowRecipient Finds recipient to which water flows downstream from this water unit. If
there is more than one, selects the nearest of these. moveWaterFromAvailableToEcoReser
ve Sets aside water for ecological reserve. If the amount required is greater than the actual water available, moves all available.
removeWater Takes an amount of water away from the available water pool. If the requested amount is more than the amount available, takes it all.
restore Adjusts ecological management class (PEMC) for restoration, based on withdrawal-to-availability ratio and ecological importance and sensitivity index, for water unit and recipient (downstream) water units.
replenishRunoffClimateChangeNormal Sets runoff equal to the greater of 0 and the change projected to occur due to climate change, multiplied by a random positive number drawn from a normal distribution around the mean.
resetWaterUnitForNextStep Resets variables at the beginning of the timestep. checkAndTransferTo Before water is transferred to water unit, checks unmet demand of
transfer recipient to see if it has changed since requesting transfer. Compares the updated unmet demand to the amount designated for transfer and transfers the lesser of the two.
transferTo Transfers requested amount of water to transfer recipient. WaterUser demand Water requirement of water user
UUnniivveerrssiittyy ooff PPrreettoorriiaa eettdd,, BBoohheennsskkyy EE LL ((22000066))

177
sector Water use sector waterAllocated Water allocated to water user timeStep Number of time steps (years) since initialisation demandExported Demand exported by water user demandImported Demand imported by water user waterConsumed Water consumed by water user getDemandRecipientAllWMA Finds recipient water unit within WMA to which water user can export
excess demand. addDemandToWaterUser Increases demand by amount that has been exported to this water user;
water user immediately consumes this amount of water from the WaterUnit.
export WaterUser with excess demand exports demand to WaterUnit with available water.
exportDemand Adds amount of exported demand to recipient's demand, and subtracts same amount from donor water user’s demand.
resetWaterUserForNextStep Resets variables at the beginning of the timestep. giveWater Adds amount of exported water to water user’s available water and water
consumed. WaterScapeMessage
amountTransfered
Amount of water transferred from donor to recipient
origUnmetDemand Unmet demand of recipient at time of transfer request transferRecipient Water unit that receives transfer updatedUnmetDe
mand Unmet demand of recipient at time of transfer
wma Identification number of water management area requesting transfer CMA wma Identification number of water management area waterUnits Water units within water management area of CMA’s jurisdiction firstTimeStep First time step (true or false) timeStep Number of time steps (years) since initialisation status Status of water availability (i.e. surplus or deficit) adjustDemandAgricultureBase Adjusts demand of agricultural sector in each of its WaterUnits according
to base growth projections. adjustDemandForestryBase Adjusts demand of forestry sector in each of its WaterUnits according to
base growth projections. adjustDemandMinesIndustryBase Adjusts demand of mining and industry sector in each of its WaterUnits
according to base growth projections. adjustDemandRuralBase Adjusts demand of rural sector in each of its WaterUnits according to
UUnniivveerrssiittyy ooff PPrreettoorriiaa eettdd,, BBoohheennsskkyy EE LL ((22000066))

178
base growth projections. adjustDemandUrbanBase Adjusts demand of urban sector in each of its WaterUnits according to
base growth projections. adjustDemandAgricultureHigh Adjusts demand of agricultural sector in each of its WaterUnits according
to high growth projections. adjustDemandForestryHigh Adjusts demand of forestry sector in each of its WaterUnits according to
base growth projections. adjustDemandMinesIndustryHigh Adjusts demand of mining and industrial sector in each of its WaterUnits
according to high growth projections. adjustDemandRuralHigh Adjusts demand of rural sector in each of its WaterUnits according to high
growth projections. adjustDemandUrbanHigh Adjusts demand of urban sector in each of its WaterUnits according to
high growth projections. allocateCollectiveLearningEfficiency Allocates water randomly, then allows agents to use efficiency indicator
to choose allocation strategy in subsequent timesteps. allocateCollectiveLearningEfficiencyInd
icator Allocates water randomly, then allows agents to use efficiency indicator to choose allocation strategy in subsequent timesteps (used when all three indicators are distributed among agents).
allocateCollectiveLearningEquity Allocates water randomly, then allows agents to use equity indicator to choose allocation strategy in subsequent timesteps.
allocateCollectiveLearningEquityIndicator
Allocates water randomly, then allows agents to use equity indicator to choose allocation strategy in subsequent timesteps (used when all three indicators are distributed among agents).
allocateCollectiveLearningSustainability
Allocates water randomly, then allows agents to use sustainability indicator to choose allocation strategy in subsequent timesteps.
allocateCollectiveLearningSustainabilityIndicator
Allocates water randomly, then allows agents to use sustainability indicator to choose allocation strategy in subsequent timesteps (used when all three indicators are distributed among agents).
allocateCollectiveLearningIndicator Allocates water randomly, then allows agents to use efficiency, equity, and sustainability indicators.
allocateFortressWorld Allocates water using Fortress World rule (proportional allocation). allocateMarketForces Allocates water using Market Forces rule (preferential allocation, then to
human and ecological Reserve). allWaterUnitsUsePolicyReform Allocates water using Policy Reform rule (allocation to human and
ecological Reserve, then preferential allocation). waterUnitsGetRandomStrategy Randomly assigns allocation strategies to water units. getTransferDonor Selects a surplus water unit from which to transfer water.
UUnniivveerrssiittyy ooff PPrreettoorriiaa eettdd,, BBoohheennsskkyy EE LL ((22000066))

179
getTransferDonorNearest Selects the surplus water unit from which to transfer water with sufficient water available to meet recipient's unmet demand and that is nearest to the recipient.
getTransferRecipientMaxDemand Selects the water unit with the greatest demand from which to transfer water.
getTransferRecipientMaxUnmetDemand
selects the water unit with the greatest unmet demand from which to transfer water.
resetCMAForNextStep Resets variables at the beginning of the timestep. deficitAlertFortressWorld Sends a message to all other CMAs containing wma number and
selected transfer recipient (water unit with maximum demand). The messages are delivered and processed asynchronously (as soon as received).
deficitAlertMarketForces Sends a message to all other CMAs containing wma number, selected transfer recipient (water unit with maximum demand), and amount requested (recipient’s unmet demand). The messages are delivered and processed synchronously (at end of timestep).
deficitAlertPolicyReform Sends a message to all other CMAs containing wma number, selected transfer recipient (water unit with maximum unmet demand), and amount requested (recipient’s unmet demand). The messages are delivered and processed synchronously (at end of timestep).
transferMaxAvailable Transfers all available water from the donor water unit, regardless of the requested amount, to selected recipient.
transferToNearest Transfers the lesser of the amount requested and the donor's available water to selected recipient.
transferToNearestMaxAvailable Transfers all available water from the donor water unit, regardless of the requested amount, to nearest of selected recipients.
UUnniivveerrssiittyy ooff PPrreettoorriiaa eettdd,, BBoohheennsskkyy EE LL ((22000066))

180
Appendix D. Translation of scenario archetypes of Gallopín et al. (1997) to the South African water management context. Adapted from Bohensky, E. and A.S. van Jaarsveld. “Water management and conservation in a southern African river basin: A scenario planning approach to uncertainty.” Poster presentation, Annual Meeting of the Society for Conservation Biology, New York, 30 July–2 August, 2004. Scenario archetype
WaterScape name Key elements
Market Forces
Efficiency First Strong economy facilitated by national governance framework; poor wealth distribution; weak local governance; weak social and environmental policies. Economic efficiency of water allocation is achieved, with urban and industrial users in Gauteng Province paying high prices for water. This impacts the ability to fulfill ecological reserve requirements downstream. Human reserve requirements are met where spin-offs occur from economic development, but not in some rural areas.
Policy Reform
Some, for All, Forever
Effective democratic governance; strong, globally-linked economy in a balanced trade regime; significant poverty reduction; substantial investments in health, education, and technology sectors. Ecological reserve requirements are met through strict enforcement of both resource protection measures and demand management. Human reserve requirements are met due to large investments in service delivery to rural areas. This comes at a cost to short-term economic efficiency in some areas where this results in decreased water availability for agricultural and industrial use.
Fortress World
Hydraulic Mission Weak and ineffective governance; economic collapse; weak civil society; increasing gap between wealthy and poor, who live, respectively, inside and outside the “fortress.”Water management reverts to the pre-1994 system; agriculture commandeers resources and government subsidies are re-introduced. None of the economic, social, or environmental goals is met; however, a decline in industrial activity means ecological conditions are better in catchments downstream from industries than they would be under Market Forces.
Local Learning
Learning variants (Chapter 4: Learning by Maximum Allocation, Learning by Proportion Satisfied; Chapter 5: Learning by use of indicators)
Weak national governance; weak economy; strong civil society; community-driven resource management; strong reliance on informal sector. Overall, the situation remains the same as at present, with improvement in conditions in some catchments and increased degradation in others. However, these “varied experiments” can teach water managers about what works and what does not, and function as an adaptive management strategy if the lessons learned from these experiments can be implemented.
UUnniivveerrssiittyy ooff PPrreettoorriiaa eettdd,, BBoohheennsskkyy EE LL ((22000066))