a soa-based monitoring approach: towards energy e cient ... · coolant pump stations ... 3.4.2....
TRANSCRIPT
Loughborough UniversityInstitutional Repository
A SoA-based monitoringapproach: towards energy
e�cient automation
This item was submitted to Loughborough University's Institutional Repositoryby the/an author.
Additional Information:
• A Doctoral Thesis. Submitted in partial ful�lment of the requirements forthe award of Doctor of Philosophy of Loughborough University. Chapter10 contains journal and conference papers and is closed access for copyrightreasons.
Metadata Record: https://dspace.lboro.ac.uk/2134/9842
Publisher: c© Daniel Cachapa Vieira
Please cite the published version.

This item was submitted to Loughborough University as a PhD thesis by the author and is made available in the Institutional Repository
(https://dspace.lboro.ac.uk/) under the following Creative Commons Licence conditions.
For the full text of this licence, please go to: http://creativecommons.org/licenses/by-nc-nd/2.5/
-
by
Daniel Cachapa Vieira
Doctoral Thesis
Submitted in partial fulfilment of the requirements for the award of
Doctor of Philosophy of Loughborough University
March 2012
© by Daniel Cachapa Vieira, 2012

Acknowledgements
i
Acknowledgements
A doctoral dissertation is typically described as a manuscript detailing the research
conducted by a single student, from the generation of the hypothesis, to the
presentation of the results before a jury of his peers. That description, however, sorely
ignores the support network which is necessary for the student to have any chance of
completing a successful research.
First and foremost, none of this would’ve been possible if it weren’t for the support
and dedication from my supervisors, Robert Harrison and Armando Walter Colombo.
Their seemingly unlimited knowledge and tolerance for my mistakes were a big part of
every achievement conquered in the last few years we worked together.
I would also like to thank my friends and colleagues at Schneider Electric in
Seligenstadt, Germany, who contributed greatly to the knowledge here recorded. My
gratitude is particularly extended to Marco Mendes for a fruitful partnership in many
of our shared projects.
Further thanks should go to the generous people at the Ford Motor Company in the
UK, who were incredibly helpful and patient as I invaded their workplaces with
questions and requests for data. In particular, Les Lee, who was my de-facto
supervisor at Ford, and Jim O’Shea who shared his knowledge not only on industrial
automation, but also on life, British customs and delicious bread pudding.
I would like to acknowledge my family for their permanent support, in particular my
mother, who never let me give up. I should also extend my gratitude to my friends all
over the world, in particular Rui Milagaia and Fernando Manhão whose
encouragement never faltered and even contributed their own knowledge to this
work. Finally, I want to thank Ramona Müller for her unending encouragement. She
gracefully bore the brunt of putting up with me throughout these years, and for that I
will be eternally indebted.
As Sir Isaac Newton once famously wrote: “If I have seen a little further it is by
standing on the shoulders of Giants.” Thank you for letting me stand briefly on yours.
Abstract
ii
Abstract
The field of industrial automation is ripe for modernization. With the advent of mass
customization and increasingly shorter product lifecycles, production lines have to be
more agile than ever. At the same time, the entire fabric of the Enterprise is changing
from a strong hierarchical framework towards flatter structures in order to facilitate
closer interactions between business strategy and operations. Moreover, energy costs
are rising at an unprecedented rate while environmental concerns cause emissions
regulations to be ever stricter.
This dissertation describes a body of research which has been done on applying the
concept of Service-oriented Architecture to industrial automation. In this work, a great
deal of concern is given to production simulation systems and how innovations using
SoA-based components can turn these tools from an aid during the production line
design phase, to an indispensible part of the complete production lifecycle. This
document explores how to build such innovations directly on top of existing tools, and
how the new interaction paradigms can be explored for the benefit of the production
engineer, by simulating production with multiple SoA-based devices, and then
exporting that same control logic to the real world, even connecting virtual devices to
real ones seamlessly.
Those same principles are then exploited to tackle the issue of energy efficiency in the
production line, using production simulation as a framework where different
production scenarios and energy-saving strategies can be tested out. These
experiments benefit greatly from the modular, SoA-based simulation environment,
which is flexible enough to quickly adapt to any number of scenario variables, and
extract relevant data. Using the tool, a number of strategies are developed and tested
with encouraging results. Those findings serve as a testament to the value of applying
modern state of the art research and technologies to the very competitive field of
production automation.
Table of Contents
iii
Table of Contents
Chapter 1. Introduction ................................................................................................ 1
1.1. Problem Definition and Research Motivation ................................................... 1
1.1.1. Industrial Energy Usage .............................................................................. 2
1.2. Research Focus ................................................................................................... 3
1.3. Research Methodology ...................................................................................... 5
1.4. Useful Definitions ............................................................................................... 7
1.4.1. Devices ........................................................................................................ 7
1.4.2. Productivity ................................................................................................. 7
1.4.3. Energy ......................................................................................................... 8
1.4.4. Web services ............................................................................................... 9
1.4.5. Simulation ................................................................................................. 10
1.4.6. Monitoring ................................................................................................ 12
1.4.7. Service-oriented Architecture .................................................................. 13
1.5. Organization of the Thesis ............................................................................... 14
Chapter 2. Industrial Requirements and Trends ........................................................ 16
2.1. Industrial production........................................................................................ 17
2.1.1. Industrial Automation ............................................................................... 18
2.2. Enterprise Architecture .................................................................................... 18
2.2.1. ISA ‘95 ....................................................................................................... 19
2.2.2. PERA .......................................................................................................... 21
2.2.3. SoA and Enterprise Architecture .............................................................. 24
2.3. State of the Manufacturing Industry ............................................................... 25
2.3.1. Production Monitoring ............................................................................. 26
2.3.2. Production Simulation .............................................................................. 33
2.3.3. Production Support Systems .................................................................... 40
2.3.4. Intelligent Supervisory Control ................................................................. 43
2.4. Previous Research at Ford® .............................................................................. 44
2.4.1. Production Machine’s Design ................................................................... 45
2.4.2. Electrical Installations ............................................................................... 45
2.4.3. Coolant Pump Stations ............................................................................. 46
2.4.4. Coolant Extraction System ........................................................................ 46
2.4.5. Engine Block Washer ................................................................................ 47
Table of Contents
iv
2.5. Related Academic Research Projects ............................................................... 47
2.5.1. SIRENA ....................................................................................................... 49
2.5.2. SOCRADES ................................................................................................. 50
2.5.3. SODA ......................................................................................................... 50
2.5.4. AESOP ........................................................................................................ 51
2.5.5. SIMTER ...................................................................................................... 52
2.5.6. E-Energy – Smart Grids Made In Germany ............................................... 52
2.5.7. klima:aktiv ................................................................................................. 53
2.5.8. Ambient Monitoring ................................................................................. 54
2.6. Research Direction ........................................................................................... 55
2.6.1. Communication Framework ..................................................................... 55
2.6.2. Production Simulation System .................................................................. 56
2.6.3. Production Monitoring System ................................................................. 56
2.6.4. Energy Management ................................................................................. 57
Chapter 3. SoA-based Flexible Production Systems ................................................... 58
3.1. SoA in Industrial Automation ........................................................................... 58
3.1.1. SOA for devices ......................................................................................... 61
3.2. Smart Devices ................................................................................................... 63
3.3. The Concept of Ports ........................................................................................ 64
3.3.1. Service Composition ................................................................................. 65
3.4. Service Composition and Orchestration .......................................................... 67
3.4.1. Orchestration-based Control Systems ...................................................... 67
3.4.2. Choreography-based Control Systems ..................................................... 68
Chapter 4. Enabling Technologies for SoA-based Production Systems ...................... 70
4.1. Software ........................................................................................................... 70
4.1.1. OPC ............................................................................................................ 70
4.1.2. gSOAP ........................................................................................................ 72
4.1.3. DPWS......................................................................................................... 72
4.1.4. Delmia Automation™ ................................................................................ 74
4.2. Hardware .......................................................................................................... 75
4.2.1. Industrial PLCs ........................................................................................... 75
4.2.2. Energy Meters ........................................................................................... 75
Chapter 5. SoA-based Production Systems Using Smart Devices .............................. 76
5.1. SoA-based Production Simulation ................................................................... 76
5.2. Implementing a Virtual Smart Device .............................................................. 77
Table of Contents
v
5.2.1. The Device Control Logic .......................................................................... 78
5.2.2. The Web Service Interface ........................................................................ 79
5.3. Simultaneous Simulation of Multiple Smart Devices ....................................... 84
5.3.1. Interacting with Multiple Smart Devices .................................................. 87
5.4. Interacting Between Real and Virtual Smart Devices ...................................... 88
5.5. Comment on Results ........................................................................................ 91
5.6. Building a SoA-Based Virtual Production Line ................................................. 91
5.7. The Flexlink™ Virtual Production Line .............................................................. 94
5.7.1. Smart Devices ........................................................................................... 94
5.7.2. Connecting the Smart Devices .................................................................. 95
5.7.3. Implementation of a Test Orchestrator .................................................... 96
5.7.4. Simulating the Production Line ................................................................. 98
5.8. Comments on Results ...................................................................................... 99
Chapter 6. Monitoring and Simulation of Production Energy Usage Using SoA ...... 100
6.1. Approach ........................................................................................................ 101
6.1.1. Feature-based Monitoring ...................................................................... 101
6.1.2. Model-based Monitoring ........................................................................ 102
6.1.3. Model and Feature-based Monitoring ................................................... 103
6.1.4. Formalization .......................................................................................... 103
6.2. Improving Energy Efficiency in the industry .................................................. 104
6.2.1. Optimization of energy usage ................................................................. 104
6.3. Industrial Requirements and Trends .............................................................. 107
6.3.1. Monitoring Systems ................................................................................ 107
6.3.2. Simulation Systems ................................................................................. 109
6.4. Developments ................................................................................................ 110
6.4.1. Strategies for Implementing SoA-based Technology in POSMon .......... 112
6.4.2. Development of an Energy-related, SoA-based Production System ...... 114
6.4.3. Building an Ecosystem of Energy-Aware Devices ................................... 116
6.5. Comments on Results .................................................................................... 118
Chapter 7. Energy Management Using SoA ............................................................. 120
7.1. SoA-based Energy Simulation ........................................................................ 120
7.1.1. Building a SoA-based Energy Simulation System ................................... 121
7.1.2. Discrete Event Simulation Systems With Smart Devices ........................ 123
7.1.3. Adding Energy Monitoring Indexes to the Simulation System ............... 124
7.2. Architecture of the SoA-based Discrete Event Simulation System ................ 124
Table of Contents
vi
7.3. Real Test Case................................................................................................. 126
7.3.1. Layout of the Test Cell ............................................................................ 126
7.3.2. SoA Architecture ..................................................................................... 128
7.4. Experimental Simulation ................................................................................ 130
7.4.1. Production Scheduler ............................................................................. 132
7.4.2. Test Scenario ........................................................................................... 133
7.4.3. Improving Energy Efficiency During Periods of Low Production ............ 135
7.4.4. Determining Ideal Prediction Timing ...................................................... 143
7.5. Reducing Installation Costs ............................................................................ 144
7.5.1. Using Energy Simulation to Evaluate New Installations ......................... 144
7.5.2. Lowering Peak Power Using Energy Management ................................. 146
7.6. Comments on Results .................................................................................... 147
Chapter 8. Conclusions and Future Work ................................................................. 149
8.1. Contributions to Knowledge .......................................................................... 150
8.1.1. SoA-based Production Automation ........................................................ 150
8.1.2. Energy Monitoring .................................................................................. 151
8.1.3. Research Goal ......................................................................................... 152
8.2. Going Forward ................................................................................................ 152
8.3. Dissemination ................................................................................................. 153
8.3.1. Journal Articles ........................................................................................ 153
8.3.2. Conference Papers .................................................................................. 154
8.3.3. Patent Applications ................................................................................. 155
Chapter 9. References .............................................................................................. 156
Chapter 10. Appendixes: Journal Articles and Latest Conference Publications ..... 170
List of Figures
vii
List of Figures
Figure 1: Flowchart of the design process for a production cell throughout its lifecycle 4
Figure 2: Overview of the research methodology ............................................................ 6
Figure 3: ISA '95 Control Hierarchy Levels ...................................................................... 20
Figure 4: Information Exchange between ISO '95 levels three and four ........................ 21
Figure 5: Enterprise phases in PERA ............................................................................... 22
Figure 6: Typical enterprise systems architecture according to PERA [42] .................... 23
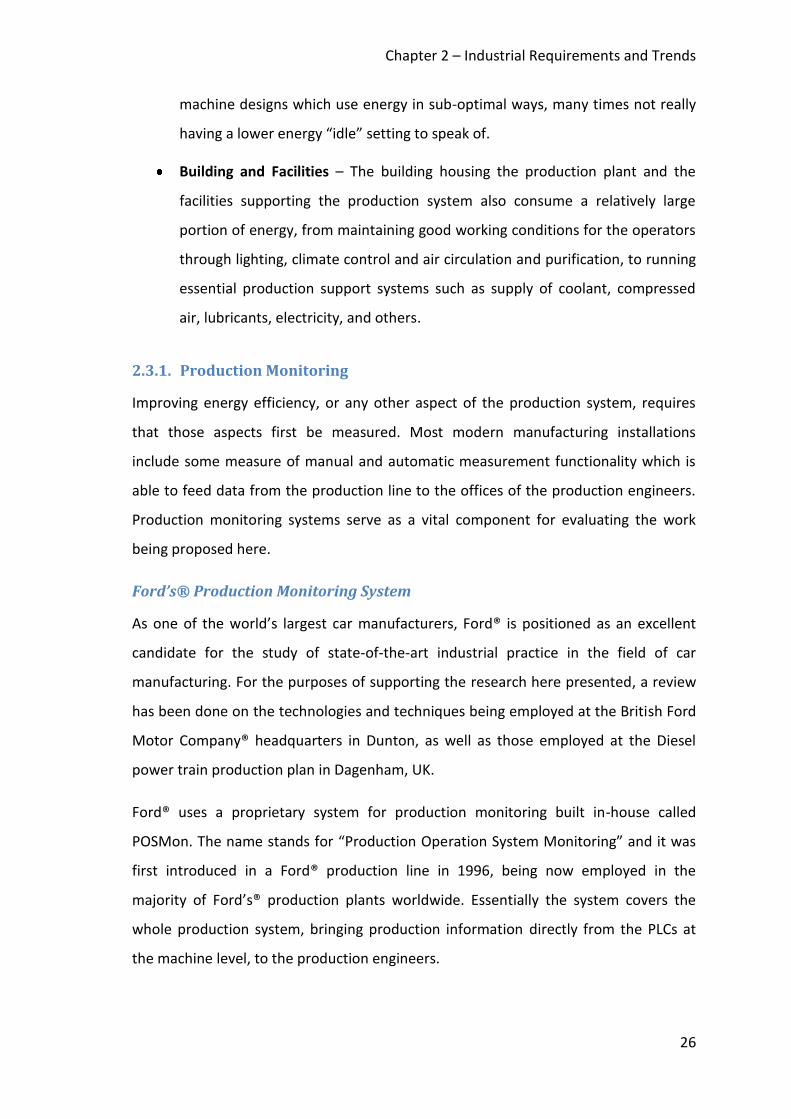
Figure 7: Network layout of Ford's® POSMon production monitoring system .............. 27
Figure 8: POSMon's control level .................................................................................... 29
Figure 9: Pseudo real-time communication in the POSMon system .............................. 30
Figure 10: POSMon's IT System ...................................................................................... 30
Figure 11: Example of an energy usage chart generated by POSMon ........................... 32
Figure 12: FAST system flowchart ................................................................................... 35
Figure 13: Cyclic FAST system flowchart......................................................................... 36
Figure 14: Typical output showing the results of various simulations with varying numbers of platters ........................................................................................................ 36
Figure 15: Areas of inclusion for the unified tool ........................................................... 38
Figure 16: 4-phase development plan for the integrated simulation tool (from 2009). 39
Figure 17: Architecture of the ION™ EEM system *54+ ................................................... 41
Figure 18: Business to Manufacturing Integration Through the Use of MII [55] ........... 42
Figure 19: Schneider Electric® Enterprise System Architecture “Transparent Ready” [57] .................................................................................................................................. 43
Figure 20: Results of an initial effort to improve energy efficiency using POSMon ....... 45
Figure 21: Mechatronics components as collaborative SoA-based services .................. 59
Figure 22: Device discovery – advertisement [31] ......................................................... 61
Figure 23: Device discovery – searching [31] ................................................................. 61
Figure 24: Device description [31] .................................................................................. 62
Figure 25: Device control [31] ......................................................................................... 62
Figure 26: Event subscription [31] .................................................................................. 62
Figure 27: Event notification [31] ................................................................................... 63
Figure 28: Presentation [31] ........................................................................................... 63
Figure 29: Components of a Smart Device ..................................................................... 64
Figure 30: Assigning static ports to MHS devices ........................................................... 65
Figure 31: Composition of a conveyor with a switch table ............................................ 66
List of Figures
viii
Figure 32: Composed devices can be created by integrating other previously composed devices ............................................................................................................................ 66
Figure 33: Different applications working with many OPC servers ................................ 70
Figure 34: Devices Profile for Web Services protocol stack ........................................... 73
Figure 35: Virtual smart clamp with an open gripper..................................................... 78
Figure 36: Connecting a Web Service interface to a virtual model ................................ 80
Figure 37: Demonstration of the DPWS eventing system using the smart clamp ......... 82
Figure 38: Typical interaction pattern between Smart Devices and clients ................... 84
Figure 39: Managing multiple Smart Devices through the use of the device ID ............ 85
Figure 40: Two smart clamps sharing the same virtual floor with unique IDs ............... 86
Figure 41: Using different plugins for devices with different functionality ................... 87
Figure 42: The SoA client performing discovery ............................................................. 87
Figure 43: Events generated during the CloseClamp operation .................................... 88
Figure 44: Using events to synchronize the clamps ....................................................... 88
Figure 45: The demonstration table with the DPWS client (left), the real clamp (centre), the PLC controlling the real clamp (back) and the virtual clamp (right) ........................ 89
Figure 46: Connecting the Web Service to the real clamp ............................................. 90
Figure 47: The demonstrator network topology ............................................................ 90
Figure 48: Levels of granularity in the virtual production line ....................................... 92
Figure 49: The different functions of the virtual production line in an Electronics Assembly Scenario, emphasising those which are implemented by the virtual production line ................................................................................................................ 93
Figure 50: Various devices participating in the SoA-based device network .................. 94
Figure 51: Synchronization steps for simulating the transfer of a pallet ....................... 96
Figure 52: Control pattern for transferring a pallet........................................................ 97
Figure 53: The movement of the pallet throughout the MHS ........................................ 98
Figure 54: Components of a smart sensor .................................................................... 101
Figure 55: Moving from a traditional production automation system to a SoA-based one through the implementation of a SoA communication layer................................ 111
Figure 56: A SoA-based production automation system broken down into SoA-based components .................................................................................................................. 111
Figure 57: Conceptual view of a SoA-based production system using a cross-system energy simulation model (highlighted) to adjust production parameters with regards to energy efficiency ...................................................................................................... 116
Figure 58: Sequence diagram representing the simulation manager’s execution cycle ...................................................................................................................................... 126
Figure 59: Layout of the cell ......................................................................................... 127
List of Figures
ix
Figure 60: Architecture of the test cell applied to the SoA-based discrete simulation system ........................................................................................................................... 128
Figure 61: Example timing diagram for the proposed architecture ............................. 129
Figure 62: Instantiation of the various simulation components .................................. 132
Figure 63: Energy usage during a 3-hour period .......................................................... 134
Figure 64: Energy usage with Timed Shutdown and Automatic Startup ..................... 136
Figure 65: Cell's energy usage with Timed Shutdown and Predicted Startup ............. 140
Figure 66: Cell's energy usage with Predicted Startup and Shutdown ........................ 142
Figure 67: Immediate and average power consumption by a machine during operation ...................................................................................................................................... 145
Figure 68: Compound power consumption from two machines during operation ..... 145
Figure 69: Power consumption with peak-limiting delays applied .............................. 146
List of Tables
x
List of Tables
Table 1: PERA Hierarchical level description .................................................................. 24
Table 2: Operations and events implemented by the Clamp Web Service .................... 79
Table 3: Operations and Events Implemented by the Transfer Service ......................... 95
Table 4: Service description for Energy Metering ........................................................ 117
Table 5: Service description for Energy Management ................................................. 118
Table 6: Comparisson of Energy Efficiency With No Shutdown and TS/AS.................. 137
Table 7: Comparisson of productivity Between No Shutdown and TS/AS during the third hour ...................................................................................................................... 137
Table 8: Comparison of Efficiency ratios No Shutdown and Predicted Startup ........... 141
Table 9: Comparison of energy Efficiency between No Shutdown, TS/PS and PS/PS .. 142

List of Equations
xi
List of Equations
Equation 1: Composition of Services ............................................................................ 102
Equation 2: Equation for the impedance of a pipeline ................................................. 102
Equation 3: Equivalencies for Electrical Energy and Power ......................................... 103
Equation 4: Algorithm for Predicted Startup of Multiple Parallel Machines ............... 139
Equation 5: Algorithm for Predicted Shutdown of multiple parallel machines ........... 141
Equation 6: Determining the Predicted Startup Time .................................................. 143
Equation 7: Determining the Predicted Shutdown Time ............................................. 143
Abbreviations
xii
Abbreviations
ASU Automatic Startup
CNC Computer Numerical Control
DA Delmia Automation™
DPWS Devices Profile for Web Services
DXD Data Exchange Device
EA Enterprise Architecture
EPP Energy per Part
ERP Enterprise Resource Planning
JPH Jobs per Hour
MES Manufacturing Execution System
MHS Material Handling System
MTBF Mean Time between Failures
MTTR Mean Time to Repair
OECD Organisation for Economic Co-operation and Development
OLE Object Linking and Embedding
OPC OLE for Process Control
PERA Purdue Enterprise Reference Architecture
PLC Programmable Logic Controller
PLM Product Lifecycle Management
PPH Parts per Hour

Abbreviations
xiii
PSD Predicted Shutdown
PSU Predicted Startup
RFID Radio-Frequency Identification
SoA Service-oriented Architecture
SOAP Simple Object Access Protocol
TEC The Embedded Component
TEM The Embedded Machines
TES The Embedded System
TSD Timed Shutdown
UDDI Universal Description, Discovery and Integration
UNFCCC United Nations Framework Convention on Climate Change
VSD Variable Speed Drive
WS Web Service
WSDL Web Service Definition Language
WS-I Web Services Interoperability Organization
XML Extensible Markup Language
Chapter 1 – Introduction
1
Chapter 1. Introduction
1.1. Problem Definition and Research Motivation
Modern industrial manufacturing is facing pressure from all directions: governments
want greener and safer products, while costumers demand quality, customization and
lower prices. In order to face these challenges in an age of technological boom,
companies are turning more and more to machines to accomplish the tasks previously
done by humans.
The field of factory automation has been a pioneer in this area and has evolved much
in the past few years as machines get ever more sophisticated and efficient.
Nevertheless, these changes have also raised the complexities involved in maintaining
and controlling them. Industrial production systems have traditionally been built in
either centralized or hierarchical topologies, featuring monolithic control structures
and rigid interaction patterns. In these systems, the production control logic is
normally executed on a limited number of computationally powerful computational
devices, normally, industrial programmable logic controllers (PLCs), which cyclically
exchange process data with actors and sensors over a Fieldbus, or other
communication systems.
Likewise, current production monitoring systems rely on centralized databases to
which all actors in the production line upload values, usually by means of proprietary
formats and protocols. Interested parties must then poll cyclically the same database
in order to extract relevant information to be used by the entire enterprise
architecture (EA). Moreover, each EA domain tends to use different, specific
combination of networking and communication protocols, each tailored to its own
needs. The need for ubiquitous information access throughout the complete EA chain
requires the use of gateways capable of transiting data between those networks at
their borders, adding a lot of complexity to the overall system.
This situation is incompatible with the shortening lifecycles of production runs and the
increasing need for flexibility and customisability in the products to meet the demands
Chapter 1 – Introduction
2
of today’s market [1] [2] [3]. However, modern technological advance may offer a
solution to these problems:
Increasing computational power, as well as Ethernet interfaces, are now readily
available on ever smaller, low cost embedded devices [4];
Service-oriented Architectures based on Web Service technology are being
increasingly adopted in the world of industrial automation and are already
used as a platform for communication and control [5] [6] [7];
There is a trend in the industry to consider the entire lifecycle of a product [8]
and the equipment at the planning phase [9] of the Product Lifecycle
Management. Tools exist for configuration of business processes [10],
performing updates to the product and maintenance throughout the
production phases, up to the after sales services;
Simulation and emulation tools are commonly available for centralised control
logic entities, even if they are much less common for distributed applications.
These advances should be integrated with new engineering solutions that will support
the research and implementation of new paradigms in the automation and control of
production systems [11], particularly in the context of a global value network [12].
1.1.1. Industrial Energy Usage
The problem of rising energy usage and the pressure for greener production methods
have made the subject of energy efficiency a hot topic in the manufacturing industry.
Though modern factories have mostly done away with the image of the massive
buildings spewing pollution which were typical during early industrialization, pollution
still remains a concern in today’s manufacturing facilities, not only due to the waste
generated as by-products of the production process, but also because of the energy
consumed there.
Although there is a trend in developed countries towards investment in low-pollution
and renewable power generation, energy production still accounts for and impressive
85% of the greenhouse gas emissions in the OECD countries [13]. More specifically in
the UK, 25% of the total energy usage is directly attributable to industrial use [14].
Chapter 1 – Introduction
3
Moreover, energy costs are rising, and are set to continue doing so for the next 20
years [15], contributing to an increasingly substantial impact in the overall production
costs.
Though these factors are placing enormous pressure on the industry, most modern
monitoring systems are still incapable of keeping track of energy usage inside the
production facilities, and those that are, do so with a low level of detail [16],
significantly hindering efforts to improve energy efficiency. Furthermore, production
simulation systems, an increasingly important part of the production line design
process, are still incapable of simulating energy usage, and due to their complex inner
workings, unlikely to become so in the near future [17].
1.2. Research Focus
The research here presented includes the development of a set of tools and
techniques which will support further insights into the implementation of the SoA
paradigm into industrial automation. These tools feature the provision of an
integrated service-oriented communication platform that allows interaction with
various industrial components and various levels of the enterprise architecture
without the need for customized solutions.
Moreover, in order to extract results, and benefit from the cross-platform and
decoupled nature of SoA-based components, the tools should allow for the creation of
a virtual representation of a real system, and even facilitate its interaction with the
real world through the use of a common network. Such a configuration should be able
to accurately recreate and simulate in a virtual model the desired characteristics of the
real components, which have to be considered as a conglomerate of the following
elements:
Mechatronic components composed of mechanical and electrical parts, whose
visual and physical properties are modelled sufficiently in the virtual model
(e.g. graphical shapes, moving parts etc.);
Control components that have the required computational power and
capabilities for realizing their functionally without external dependencies. Such
Chapter 1 – Introduction
4
components can be of various granularities, e.g. sensors and actuators, to
machines, to soft components such as controllers [18]. This means that the tool
can be used for small mechatronical components as well as for aggregated
components such as those in Holonic or Agent-oriented Manufacturing
Systems [19], e.g., those described in the ADACOR collaborative manufacturing
control architecture [20]. Processes which are not relevant for the application
logic, for instance, moving machine parts, can be represented in a virtual model
through separate logic, which can be used to replicate the functional
requirements and limits present in the real component;
Communication components that expose the device functionality described by
the control components exclusively through Web Service technology to other
networking nodes as service interfaces. Hence, the utilization of the device’s
functionality in a higher context, such as that of factory control, or production
management, has to be done over the exposed service interfaces.
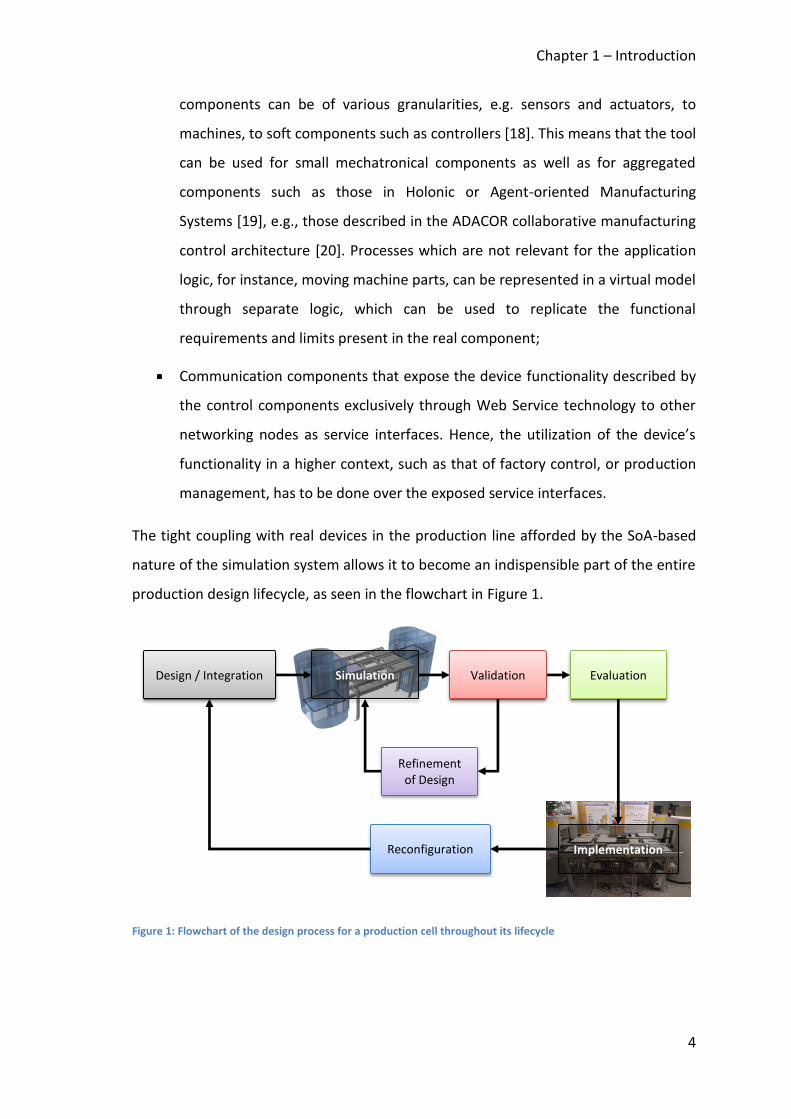
The tight coupling with real devices in the production line afforded by the SoA-based
nature of the simulation system allows it to become an indispensible part of the entire
production design lifecycle, as seen in the flowchart in Figure 1.
Figure 1: Flowchart of the design process for a production cell throughout its lifecycle
Design / Integration Simulation Validation Evaluation
Refinement of Design
Implementation Reconfiguration
Chapter 1 – Introduction
5
Moreover, the autonomous nature of SoA-based components facilitates the addition
of new simulation parameters, such as energy indexes without having to make
fundamental alterations to the system’s core.
This work is focused on bringing the SoA paradigm into a virtual production, in order
to research the viability of engineering tools which support the emerging trends in the
control and automation fields [21]. Furthermore, the tools are exploited for testing the
necessary interaction patterns used for control and monitoring, specifically towards
the goal of improving industrial energy efficiency.
1.3. Research Goals
The objectives of the study presented here can be thus summed up:
Applying SoA principles to industrial production systems
Studying the implementation of those systems in real-life scenarios
Confirming the benefits of the system, specifically in regards to industrial
energy efficiency
1.4. Research Methodology
The overall research methodology can be visualized graphically in Figure 2.
Chapter 1 – Introduction
6
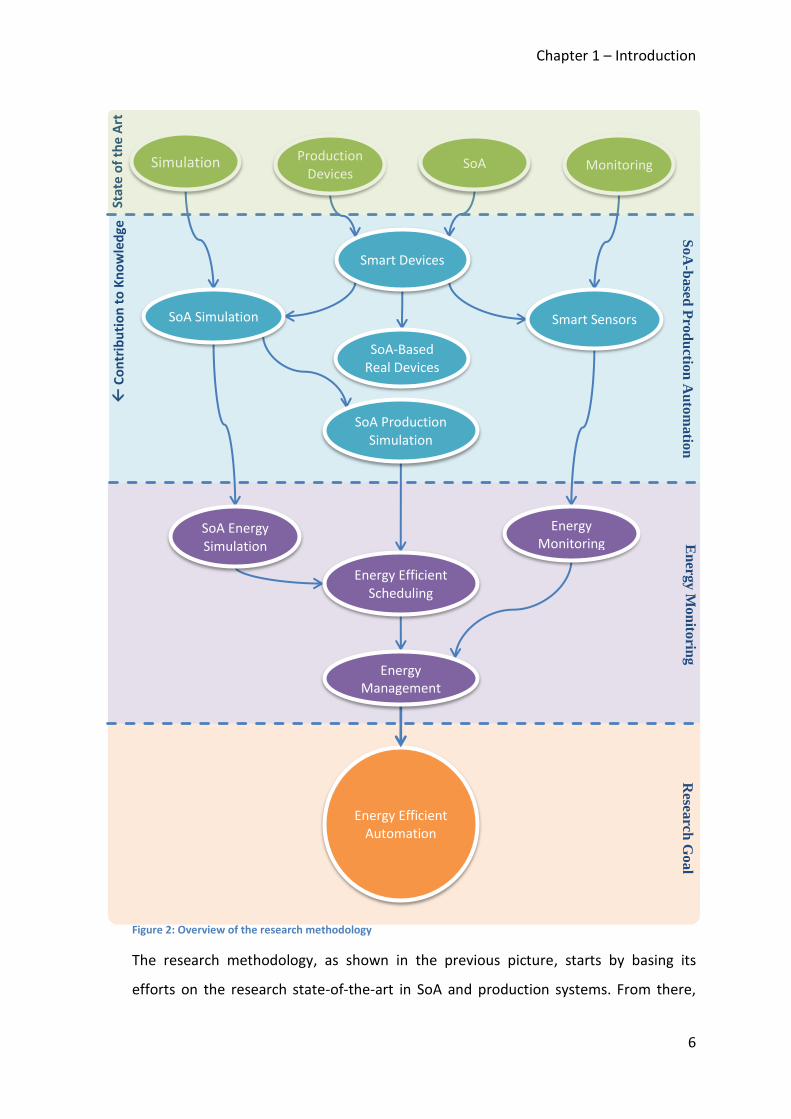
Figure 2: Overview of the research methodology
The research methodology, as shown in the previous picture, starts by basing its
efforts on the research state-of-the-art in SoA and production systems. From there,
Stat
e o
f th
e A
rt
Energy Efficient Automation
C
on
trib
uti
on
to
Kn
ow
led
ge
Smart Devices
SoA Simulation
SoA-Based Real Devices
SoA Energy Simulation
Smart Sensors
SoA Production Simulation
Energy Monitoring
Energy Efficient Scheduling
Energy Management
Simulation Production Devices
Monitoring SoA
So
A-b
ased
Pro
du
ction
Au
tom
atio
n
En
ergy M
on
itorin
g
Resea
rch G
oal
Chapter 1 – Introduction
7
iterative efforts are made towards SoA-based production automation tools, and then
their application to the fields of production monitoring and simulation with a focus on
energy. Finally, the efforts culminate in the application of all of the combined efforts
into the development of an integrated solution for energy efficient automation based
on the principles of service-oriented architectures.
The development of a flexible integrated solution for the entire production design
lifecycle enables the availability of relevant information from the shop floor, through
the offices of the production engineers, up to the enterprise management systems.
This is achieved through the very nature of a SoA-based network which is able to cross
the entire enterprise architecture by flattening the traditional layer hierarchy.
1.5. Useful Definitions
1.5.1. Devices
For the purposes of this document, devices represent the tools in the production cell
that support some degree of functionality required for the production, e.g. a conveyor.
The devices can be either real-world components, or virtual representations of those.
In the case of a virtual device, the component should at least offer a reasonable 2D/3D
representation of the geometry which allows a realistic layout in the virtual production
cell, as well as the basic description of movement that takes into account the
capabilities and limitations of the real-life component.
1.5.2. Productivity
The definition of productivity used throughout this work has been adopted from the
one used in the industrial setting: the rate of parts per hour (PPH), which represents
the amount of parts that a given machine is able to perform its designed operations on
in one hour. The same ratio can also be applied to groups of machines or even to the
complete production line.
This ratio makes it easy to compare machines of similar capabilities, as well as
ascertain the overall production health throughout the line, being a very important
factor in the early identification of problems in production.
Chapter 1 – Introduction
8
1.5.3. Energy
Given the breadth of the subject, it is necessary to define the terms and techniques
related to the subject of energy. For the purposes of this document, the following
definitions are used:
Energy Monitoring
Energy monitoring entails the application of production monitoring systems and
techniques to the need for keeping track of energy usage inside the industrial facilities.
Energy monitoring systems give production engineers access to historic, and
sometimes even real-time energy usage in the production system.
Though these systems are usually understood to monitor electrical energy, they can
include various other indexes, such as gas and fluid flow rates, pressure and
temperatures, as well as efficiency of ventilation, such as that of coolant extraction
systems. They can even monitor indexes which aren’t directly associated to any
production systems, such as interior and exterior ambient temperature and lighting.
Energy Efficiency
Energy efficiency is a technical term which is used to classify the ratio of conversion of
one form of energy into the use for which it is being employed. One example is the
transformation of energy into movement, as in an internal combustion engine, where
a percentage of the energy contained in the liquid fuel is transformed into movement,
and the rest is lost, mostly in the form of heat.
The term is sometimes confused with “efficient energy use”, which is simply the act of
increasing energy efficiency, or in other words, using less input energy to achieve the
same results.
Paradoxically, it has been suggested by economists Daniel Khazzoom and Leonard
Brookes that increased energy efficiency may lead to increased energy consumption.
The “Khazzoom–Brookes postulate”, as it has been dubbed by economist Harry
Saunders [22], defends that improved energy efficiency leads to cheaper energy costs,
thus encouraging increased use, both privately and in the whole economy. It also leads
Chapter 1 – Introduction
9
to the adoption of technologies, products and services which were previously being
constrained by high energy costs.
For the purposes of this work, energy efficiency leans on the definition for productivity
and so has been defined as the Energy per Part (EPP). This ration allows for the
comparison of the different energy management techniques on equal grounds, and
can be considered the true measure of energy efficiency gains.
Energy Management
Energy management in the scope of industrial production entails the proactive
intervention in the production process with the express intention of improving energy
efficiency.
Energy management usually takes the form of signalling production machines directly
in order to change their otherwise normal production behaviour. It may also
sometimes take the more subtle form of affecting the route of parts in the production
line, or tweaking the scheduler priority rules for selecting which machine to load when
more are available.
1.5.4. Web services
The W3C group describes Web Services as:
“Web Services provide a standard means of interoperating between different software applications, running on a variety of platforms and/or frameworks.” [23]
Though this definition is broad, Web Services are usually understood to those services
that have their interfaces described by using the WSDL format, and communicate
through SOAP-formatted XML envelopes.
In fact, the Web Services Interoperability Organization (WS-I), an industry consortium
led by companies such as IBM®, Microsoft®, Intel®, among others. This organization is
chartered to promote interoperability amongst the stack of Web services
specifications, only recognizes Web services in the context of these specifications [24].
The specifications for Web services are intentionally modular, and are implemented as
the circumstances and choice of technology dictate. For example, even though there is

Chapter 1 – Introduction
10
an established protocol for Web service discovery called Universal Description,
Discovery and Integration (UDDI), it is not required that it is implemented in every
Web Service, and in fact, other discovery protocols can be used.
Though there has been some criticism regarding the complexity of Web services,
recent efforts have been successful in creating lightweight Web service interfaces that
run on resource-constrained devices, such as industrial PLCs [25]. Moreover, the
recent advances in embedded platforms, mainly driven by the recent explosion of
mobile computing and communication devices, have greatly increased the processing
capabilities of production controllers while simultaneously benefitting from cost
reduction due to economies of scale.
1.5.5. Simulation
A fine definition of what simulation entails is presented in [26]:
“Simulation is the art and science of creating a representation of a process or system for the purpose of experimentation and evaluation. It is a powerful analytical tool that can significantly facilitate the problem-solving process.”
Essentially, a computer simulation is an attempt to model a real-life situation on a
computer so that the behaviour of the system can be analysed. The model can have
various degrees of detail, depending on the requirements of the analysis. This
technique can be employed in automation to model the layout and the interactions
between the various devices in the production system in order to study the various
facets of the production process.
With the growth of computer systems in the recent years and the increasing
application of industrial informatics in the production setting, production simulation
systems have become key components in the overall production system. Simulation
systems nowadays are used not only for simulating production data, but also to
perform joint analysis of 1) environmental impact calculations in combination with
discrete event simulation and 2) a virtual analysis tool for level-of-automation
evaluations in combination with ergonomic considerations [27].
For the purposes of this document, computer simulation techniques have been
separated in two categories: Real-Time Simulation (a subset of continuous simulation
Chapter 1 – Introduction
11
where the simulation clock advances in small, predetermined increments), and
Discrete Event Simulation.
Real-Time Simulation
Real-time simulation refers to a virtual model which, during simulation, runs according
to a real clock. This means that a device performing an operation in the virtual world
will take as long as its virtual representation performing the same operation in the
virtual world. In the simulation, however, the passage of simulated time can be slowed
down or sped up, according to the needs of the analysis.
This type of simulation is used when it is necessary to visualize the evolution of the
system during its process, for example, making sure that a mechanical arm does not
collide with its surroundings during a series of operations. These methods enable
production engineers to test various different scenarios before deployment, where
mistakes that could have been caught early by the simulation can be quite costly and
time-consuming when dealing with real hardware.
This technique is also sometimes used for performing monitoring of the production
line and for training the human operators or maintenance personnel.
Discrete Event Simulation
The discrete event simulation technique comprises a simulation run which doesn’t
follow a wall clock, but instead, a sequence of chronological events. In this type of
simulation, time is still kept, but on a relative scale, so that the system keeps track if
the time at which a given event occurs, and then jumps a predetermined amount of
time directly to the next event. The mechanisms behind a discrete event simulation
are described in detail in [28].
Because the time taken for each operation is abstracted, a discrete event simulation
usually completes much faster than a real-time simulation. This type of simulation is
usually employed in industrial production engineering in order to quickly collect
various types of statistics on relevant production parameters, such as jobs per hour,
worker rotation, maintenance scheduling, machine usage, and so forth. Armed with
Chapter 1 – Introduction
12
these tools, it is possible for the production engineers to test out different production
scenarios and optimize the process for a given objective.
This type of simulations are normally used during the design phase of the production
line to simulate the production under different scenarios in order to determine the
ideal loads, workforce shift arrangements and other important characteristics which
will factor in the development of the system. They are also useful in predicting the
expected productivity of the line, as well as other factors such as costs per unit, and
expected machine downtime (essential for the planning of maintenance schedules).
1.5.6. Monitoring
Monitoring an industrial environment generally requires three successive phases. It
begins with the validation of the environment’s hardware specifications, of its
software-control system and of the implementation of both (detection of coding
bugs). The second step concerns “on-line sensing” and “information collection”, which
are performed taking into account the real-time behaviour/evolution of the
environment and of the embedded control system. Finally, information and sensor
signals have to be processed in order to obtain a complete and reliable real-time view
of the behaviour of the whole industrial environment [29].
The application of these phases is only possible if monitoring methods capable of
fulfilling the required functionalities exist. In general, monitoring methods can be
divided into two categories: feature- and model-based methods as described in [30]
and references therein.
Feature-based Monitoring
Feature-based monitoring entails the monitoring of the device’s existing properties
and behaviour. These features are measured by adding the necessary sensors,
mapping those features to electronic signals which can be sent and understood over
communication networks.
This mapping creates a direct relationship between a given signal, or set of signals, and
the state of the device. When the mapping of the signals to device state is detailed
enough, the device can be treated as a black box with predictable operational output,
Chapter 1 – Introduction
13
so long as the sensors remain in proper operation. Through this information it is
possible to infer the state of the process without having to possess detailed
information on it.
Model-based Monitoring
Model-based monitoring moves away from the indexes exposed directly by sensors in
the device, and concentrates on the model of the process itself, as the machine runs
the operations necessary to achieve its desired functionality.
The model of the process can be represented in any logical language, i.e., differential
equations; petri nets; etc., and will contain a set of inputs and outputs, which can be
tapped into in order to extract information about the current state of the process.
Thus, in model-based monitoring, instead of reading sensor signals from a given
device, the internal processes of the device itself can be modelled in order to extract a
much more detailed view of the state of the process.
A particular case is that of simulation: since a virtual system must contain the model of
the process inside it, it can be said that during simulation the properties of the real
system can be detected by monitoring the properties of the model. It is thus possible
to analyse the model, and get information about the system.
1.5.7. Service-oriented Architecture
The concept of Service-oriented Architecture (SoA) has many definitions, but for the
purposes of this document, the following has been adopted from the SIRENA project
[31]:
“A Service-oriented Architecture is a set of architectural tenets for building autonomous yet interoperable systems.”
Though the authors admit that this definition is incomplete, it does include two key
words: “autonomous” and “interoperable”. Autonomous systems operate
independently of their surroundings and do not depend on others to achieve their full
functionality, while interoperable systems expose their interfaces as services at their
border making it possible that they can be completely replaced by another system that
Chapter 1 – Introduction
14
exposes the exact same interfaces, even if they hide a completely different
implementation.
Thus, in SoA, though the different services cooperate to achieve a higher-level
functionality, one service does not depend on its neighbours and will function
correctly even if other services in the system fail. Those failing systems can themselves
be substituted by drop-in replacements, as long as those support at least the same
functionality and interfaces.
In [31] the authors define “SoA for devices” as an extension of the SoA paradigm into
the device space, allowing the creation of a communications infrastructure entirely
based on high-level interaction patterns, categorized into six levels of functionality:
Addressing, Discovery, Description, Control, Eventing and Presentation.
1.6. Organization of the Thesis
This thesis presents a study on the challenges and techniques required in order to
implement an energy-aware, SoA-based system in the manufacturing domain.
The document is organized as follows: this introduction presents the state-of-the-art
tools and techniques employed throughout the study; Chapter 2 discusses the current
industrial requirements which serve as the backdrop for this research, as well as the
proposed avenues for facing those challenges.
In Chapter 3 the concept of SoA in industrial automation is fleshed out, and the
concept of SoA-based smart devices is introduced; Chapter 4 discusses the
technologies which will enable the implementation of SoA in the production line; and
in Chapter 5 a proof-of-concept of a production cell represented in the real and virtual
worlds is described; Chapter 6 then extends those concepts and discusses how they
could be applied to the field of energy efficiency in a real production line; and in
Chapter 7 those concepts are implemented using an existing, state-of-the-art
production cell, and experiments are carried out in order to test the usefulness of the
new systems.

Chapter 1 – Introduction
15
Chapter 8 presents a discussion on the overall conclusions taken from the work, and
the possible directions for future research in this area. It also presents the
contributions to knowledge made throughout this dissertation. The thesis ends with a
list of the references used throughout the document in Chapter 9.
Chapter 2 – Industrial Requirements and Trends
16
Chapter 2. Industrial Requirements and Trends
Energy prices are on the rise, and so are the environmental concerns coming from
both consumers and governmental agencies. Energy savings on the shop floor not only
have the direct benefit of spending less on energy, but will also have an impact on
direct and indirect sources of pollution generated from the manufacturing activity.
These concerns are being pushed onto companies through the use of energy and
pollution-related incentives, taxes and fines levied by governments all over the world.
As a major economic world power, Europe is well-positioned to act as a key player in
the global response to the financial crisis. To that effect, the European Commission has
recently taken the initiative in outlining its plans to face the economic situation in the
form of a coordinated response by the EU governments [32]. That response came in
the form of a document entitled the European Economic Recovery Plan, where the
European Commission has appointed 1.2 Billion Euro for a set of measures with a very
strong focus on reinforcing European competitiveness in the long term by investing in
industrial infrastructure, specifically focusing on energy efficiency, clean technologies,
infrastructure and innovation. In the investment, an amount of 200 Million Euro is
reserved for research areas related specifically with automation and energy efficiency
[33].
There are other recent efforts towards lowering emissions on a more global scale. The
Kyoto Protocol is one such effort in the form of an international agreement sponsored
by the United Nations which was aimed at combatting global warming by lowering
greenhouse gas emissions worldwide [34]. This was to be achieved through
cooperation by the participating governments by creating and gradually lowering the
limits on industrial and domestic emissions. Although promising at first, the protocol
suffered a major setback when the United States, the country with the highest per-
capita energy usage in the world, refused to sign the agreement. This has been
compounded more recently by Canada abandoning the agreement after failing to
meet its proposed goals. Still, the agreements signed in the protocol are in effect and
being followed by most industrialized nations in the world, directly affecting any
Chapter 2 – Industrial Requirements and Trends
17
industrial effort in those locations, particularly the energy-hungry manufacturing
process.
More recently, a number of talks have been held with the intention of following up on
the work started with the Kyoto Protocol. These sponsored by the United Nations
Framework Convention on Climate Change (UNFCCC), and have been driving towards
addressing the work which is to be conducted after the first “commitment period” of
the Kyoto Protocol, which expires at the end of 2012. In those talks, energy efficiency
was identified as one of the most promising avenues for significantly reducing
emissions at a low cost [35].
In the efforts towards improving global energy efficiency, the area of industrial
production is an ideal starting point, since the energy usage and emission sources tend
to be concentrated in fewer, large-scale facilities. Compared to, for example,
residential energy usage, improvements in just one industrial facility has the
equivalent impact of enhancements to countless homes and vehicles in private hands.
2.1. Industrial production
The industrial revolution, which began in the late 18th century with the introduction of
machine tools powered by water wheels, or innovations such as the coal-powered
Watt steam engine, had a profound impact in the society of the time. It contributed
greatly to the tremendous population and income growth observed in the last two
centuries, fuelled by the sharp increase in productivity in almost all aspects of daily
life.
Since then, technological innovation and the spread of industrialisation have had a
symbiotic relationship, feeding of each other in an effort to extract even more
productivity than was previously possible. One such innovation was the assembly line,
a technique based on the concept of division of labour first introduced by Adam Smith
in his seminal work The Wealth of Nations [36] and made popular by its successful
application by the Ford Motor Company in the early 20th century. This technique,
which focuses production efforts in large amounts of standardised parts, was one of
Chapter 2 – Industrial Requirements and Trends
18
the most influential in the success of the industrialisation movement, and even today
its basic principles remain mostly unchanged.
2.1.1. Industrial Automation
Nowadays, with technological progress, new breakthroughs have evolved the
industrial production paradigm towards industrial automation. This encompasses the
use of unsupervised production machines in the production line, thereby reducing the
need for human involvement in the production of goods. Although automation was
initially used to lower the overall cost of production, it soon became clear that the
increased reliability and precision when performing repeated tasks. It has also made it
possible to produce certain goods which wouldn’t be possible for humans due to the
toxicity involved in their manufacturing, or to the very strict tolerances necessary, e.g.,
manufacturing of computer processors.
Although automation has brought many improvements to industrial production, it is
not a silver bullet. The presence of human operators is still required in modern
production lines, either because some tasks are difficult to automate, or too
expensive. For this reason, any discussion of improvements to production facilities has
to take into account the human factors as well. Still, automation is becoming
increasingly important in industrial settings, particularly in first-world countries where
human labour is more expensive, and quality expectations are higher.
2.2. Enterprise Architecture
The field of enterprise architecture was born with a publication which discussed
solutions to managing complexity in increasingly distributed systems [37]. It started to
gain traction in the late 1980’s as a response to the problems presented in managing
rapidly growing companies faced with globalisation and swelling product and service
portfolios. The field concerns itself mainly with the IT infrastructure within the
enterprise, and the information pathways within it, with an eye towards managing the
different aspects of productivity in a timely and efficient manner.
The growth of the computer revolution in the enterprise sector within the last few
decades has resulted in a hodgepodge of ad-hoc solutions to localized challenges

Chapter 2 – Industrial Requirements and Trends
19
within the companies. These increasingly complex systems were becoming more and
more difficult to align with the business needs. The end result has been succinctly
described as “more cost, less value” [38].
An enterprise architecture system attempts to solve those problems through the use
of a number of comprehensive methodologies which are to be followed by the various
stakeholders within the enterprise. Together, these methodologies aim to reduce the
overall complexity and promote cooperation within the IT systems, while allowing
enough leeway for scope-specific requirements, such as specialized communication
protocols and interaction patterns.
The topic of enterprise architectures is especially important for companies involved in
manufacturing as it directly affects the communication pathways between the
enterprise management and the production lines. These pathways become
instrumental in implementing the company’s strategic vision in face of changing global
requirements.
In the last few decades there has been a lot of research and proposals for specific
enterprise architectures. The implementation of a specific enterprise architecture, or a
variation thereof, is strongly dependant on a number of factors, ranging from the
nature of the business sector, company size and existing infrastructure to the
company’s culture and work procedures.
In this work, two leading architectures in the field of industrial manufacturing have
been selected for review: ISA ’95 [39] and the Purdue Enterprise Reference
Architecture (PERA) [40].
2.2.1. ISA ‘95
ISA ’95 is an international standard for the integration of enterprise and control
systems. It was introduced by the International Society of Automation in order to
provide a standard terminology for the field of production automation, to facilitate
communication between suppliers and manufacturers. Moreover, it provides
consistent operation and information models which clearly define how information is
to be used and communicated within the enterprise framework.
Chapter 2 – Industrial Requirements and Trends
20
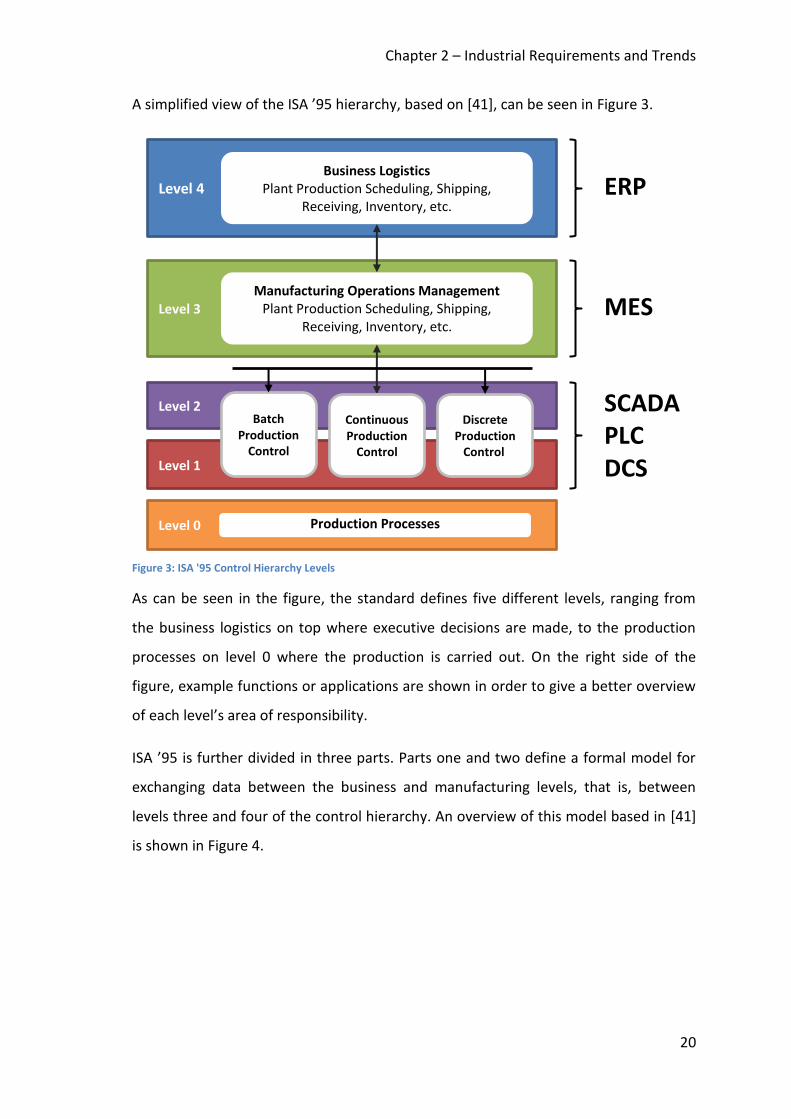
A simplified view of the ISA ’95 hierarchy, based on [41], can be seen in Figure 3.
Figure 3: ISA '95 Control Hierarchy Levels
As can be seen in the figure, the standard defines five different levels, ranging from
the business logistics on top where executive decisions are made, to the production
processes on level 0 where the production is carried out. On the right side of the
figure, example functions or applications are shown in order to give a better overview
of each level’s area of responsibility.
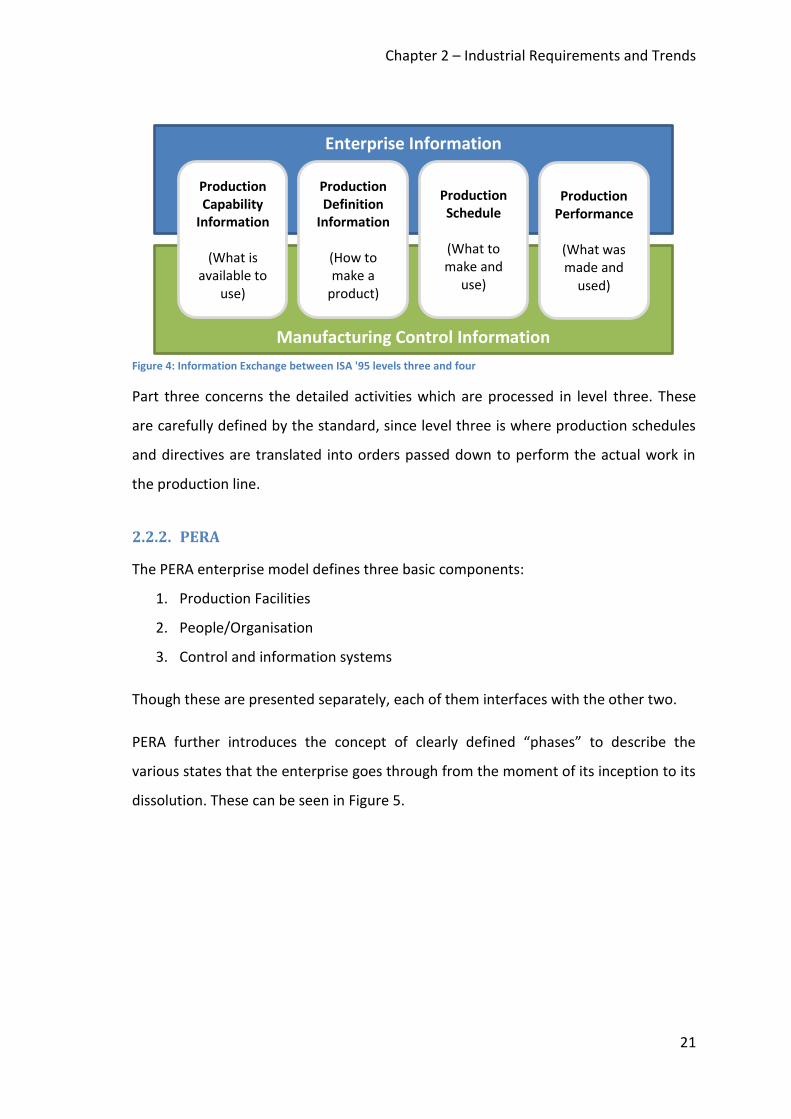
ISA ’95 is further divided in three parts. Parts one and two define a formal model for
exchanging data between the business and manufacturing levels, that is, between
levels three and four of the control hierarchy. An overview of this model based in [41]
is shown in Figure 4.
Level 1
Level 4 Business Logistics
Plant Production Scheduling, Shipping, Receiving, Inventory, etc.
Level 3 Manufacturing Operations Management
Plant Production Scheduling, Shipping, Receiving, Inventory, etc.
Level 2 Batch
Production Control
Continuous Production
Control
Discrete Production
Control
Level 0 Production Processes
ERP
MES
SCADA PLC DCS
Chapter 2 – Industrial Requirements and Trends
21
Figure 4: Information Exchange between ISA '95 levels three and four
Part three concerns the detailed activities which are processed in level three. These
are carefully defined by the standard, since level three is where production schedules
and directives are translated into orders passed down to perform the actual work in
the production line.
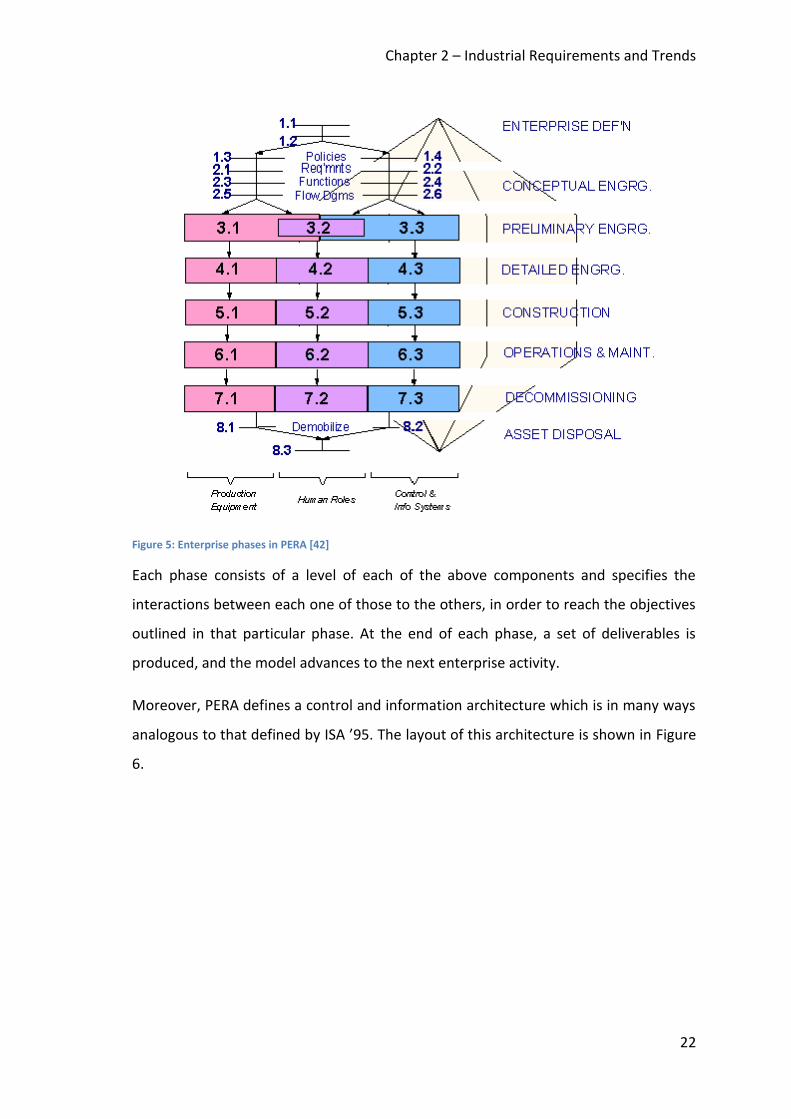
2.2.2. PERA
The PERA enterprise model defines three basic components:
1. Production Facilities
2. People/Organisation
3. Control and information systems
Though these are presented separately, each of them interfaces with the other two.
PERA further introduces the concept of clearly defined “phases” to describe the
various states that the enterprise goes through from the moment of its inception to its
dissolution. These can be seen in Figure 5.
Enterprise Information
Manufacturing Control Information
Production Capability
Information
(What is available to
use)
Production Definition
Information
(How to make a
product)
Production Schedule
(What to make and
use)
Production Performance
(What was made and
used)
Chapter 2 – Industrial Requirements and Trends
22
Figure 5: Enterprise phases in PERA [42]
Each phase consists of a level of each of the above components and specifies the
interactions between each one of those to the others, in order to reach the objectives
outlined in that particular phase. At the end of each phase, a set of deliverables is
produced, and the model advances to the next enterprise activity.
Moreover, PERA defines a control and information architecture which is in many ways
analogous to that defined by ISA ’95. The layout of this architecture is shown in Figure
6.

Chapter 2 – Industrial Requirements and Trends
23
Figure 6: Typical enterprise systems architecture according to PERA [42]
Though at first, the levels in the above figure seem to be analogous to those of ISA ’95,
seen in Figure 3, they are defined much closer to the needs of a production system. A
description of each of the PERA levels can be seen in Table 1.

Chapter 2 – Industrial Requirements and Trends
24
TABLE 1: PERA HIERARCHICAL LEVEL DESCRIPTION
Level Application
Timeframe for:
Response
Resolution
Reliability
Repairability
Level 5 Production Planning Accounting Supplier Rating Computer Assisted Drafting & Design Maintenance Costing
Days to Weeks
Level 4 Production Scheduling Maintenance Scheduling Manufacturing Resource Planning Material/Product Tracking Site-wide Production Reporting
Hours to Days
Level 3 Area Optimization Production Data History Maintenance Monitoring
Minutes to Hours
Level 2 Operator Interface Unit Optimization Trending Real-time Statistical Process Control
Seconds to Minutes
Level 1 Control Interlocking
Milliseconds to Seconds
Level 0 Sensors Actuators
Continuous
As in the ISA ’95 model for enterprise architectures, the PERA reference model defines
the boundary between the business logistics and the manufacturing processes
between levels four and five.
2.2.3. SoA and Enterprise Architecture
The advent of SoA-based enterprise networks is in many ways a complement to the
concerns with which enterprise architects struggle. The provision of a ubiquitous
network based on standard and open protocols brings with it the promise to greatly
simplify the enterprise IT systems, which directly translates into lower costs and higher
data availability.
Moreover, the addressing and discoverability features built into many SoA protocols
allows cross-domain communications between different actors, essentially resulting in
Chapter 2 – Industrial Requirements and Trends
25
the flattening of previously hard hierarchies without impacting the overall enterprise
architecture. Alternatively, more traditional hierarchical systems can still be
implemented through the use of service composition and orchestration. The more
likely result, however, is a combination of both approaches which hides unnecessary
complexity between scopes, but retains the ability for specific participants to access
that complexity as needed for specific use-cases. These features allow a well-designed
SoA-based enterprise architecture to be only as complex as needed in order to reach
its complete functionality.
2.3. State of the Manufacturing Industry
The recent trend of steeply growing energy prices, coupled with increasing
environmental concerns driving governmental incentives to lower the energy footprint
as well as pollution [33] [32], is putting a lot of pressure on the industry to improve the
energy efficiency in the production plants.
Significant energy savings in manufacturing have been predicted to be feasible.
Savings of 15-20% can be expected through process and production optimization that
takes energy consumption into account. 16% savings are envisioned through
optimized logistics, and integrated process chains could account for 30% savings [43].
In fact, early development work at Ford® has resulted in energy savings within
individual systems, and it is estimated that 21 million kWh, 6,500 tonnes CO2, worth
more than 1.8 million Euros has been saved in the diesel engine facility by adopting
energy saving strategies in individual systems [44].
Energy usage in a production plan can be separated into two main areas:
Machine Specific – The production machines use various types of energy for
performing their tasks, and while idle. Being the backbone of today’s
automation-based production, the machines take a big chunk of the energy
consumption in the plant. Because in some sectors, for example car
manufacturing, production lines are built to last for upwards of 10 to 20 years,
many of the installations still in function today were designed and built in a
time when energy concerns were not a high priority. This has resulted in
Chapter 2 – Industrial Requirements and Trends
26
machine designs which use energy in sub-optimal ways, many times not really
having a lower energy “idle” setting to speak of.
Building and Facilities – The building housing the production plant and the
facilities supporting the production system also consume a relatively large
portion of energy, from maintaining good working conditions for the operators
through lighting, climate control and air circulation and purification, to running
essential production support systems such as supply of coolant, compressed
air, lubricants, electricity, and others.
2.3.1. Production Monitoring
Improving energy efficiency, or any other aspect of the production system, requires
that those aspects first be measured. Most modern manufacturing installations
include some measure of manual and automatic measurement functionality which is
able to feed data from the production line to the offices of the production engineers.
Production monitoring systems serve as a vital component for evaluating the work
being proposed here.
Ford’s® Production Monitoring System
As one of the world’s largest car manufacturers, Ford® is positioned as an excellent
candidate for the study of state-of-the-art industrial practice in the field of car
manufacturing. For the purposes of supporting the research here presented, a review
has been done on the technologies and techniques being employed at the British Ford
Motor Company® headquarters in Dunton, as well as those employed at the Diesel
power train production plan in Dagenham, UK.
Ford® uses a proprietary system for production monitoring built in-house called
POSMon. The name stands for “Production Operation System Monitoring” and it was
first introduced in a Ford® production line in 1996, being now employed in the
majority of Ford’s® production plants worldwide. Essentially the system covers the
whole production system, bringing production information directly from the PLCs at
the machine level, to the production engineers.
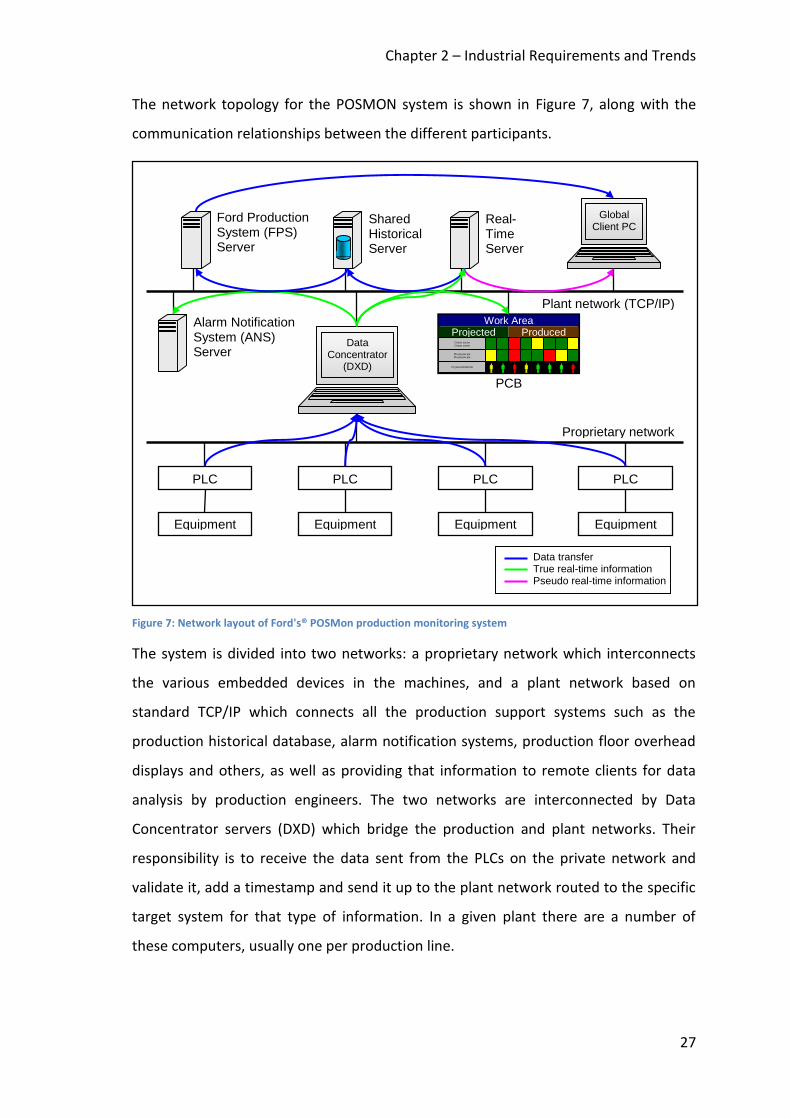
Chapter 2 – Industrial Requirements and Trends
27
The network topology for the POSMON system is shown in Figure 7, along with the
communication relationships between the different participants.
Figure 7: Network layout of Ford's® POSMon production monitoring system
The system is divided into two networks: a proprietary network which interconnects
the various embedded devices in the machines, and a plant network based on
standard TCP/IP which connects all the production support systems such as the
production historical database, alarm notification systems, production floor overhead
displays and others, as well as providing that information to remote clients for data
analysis by production engineers. The two networks are interconnected by Data
Concentrator servers (DXD) which bridge the production and plant networks. Their
responsibility is to receive the data sent from the PLCs on the private network and
validate it, add a timestamp and send it up to the plant network routed to the specific
target system for that type of information. In a given plant there are a number of
these computers, usually one per production line.
Equipment
PLC
Proprietary network
Plant network (TCP/IP)
Data Concentrator
(DXD)
Ford Production System (FPS) Server
Shared Historical Server
Real-Time Server
Global Client PC
Alarm Notification System (ANS) Server
Work Area Projected Produced
Cocoo cocoo
Coooo coooo
Piu piu piu piu
Piu piu piu piu
I’m just a birdie too
PCB
Equipment
PLC
Equipment
PLC
Equipment
PLC
Data transfer True real-time information Pseudo real-time information
Chapter 2 – Industrial Requirements and Trends
28
POSMon is currently installed in around 40 to 50 plants worldwide, essentially
representing all of the production being run in the western countries. The remaining
plants are running with little or no automation, most of the production being carried
out by people, and thus, not being fit for automatic monitoring. The exceptions to
these rules are a few plants in North America in which a third-party monitoring system
with similar functionality and objectives was implemented.
It is considered mature, and most of the development efforts being applied to it being
related to maintenance and adapting it to new production scenarios.
Functionally, POSMon is composed of three layers:
Productivity (plant level)
Control (machine level)
IT System
Control level
The control level is concerned with the routines running on the various PLCs
controlling the machines and collecting data in order to pass it over to the plant
network.
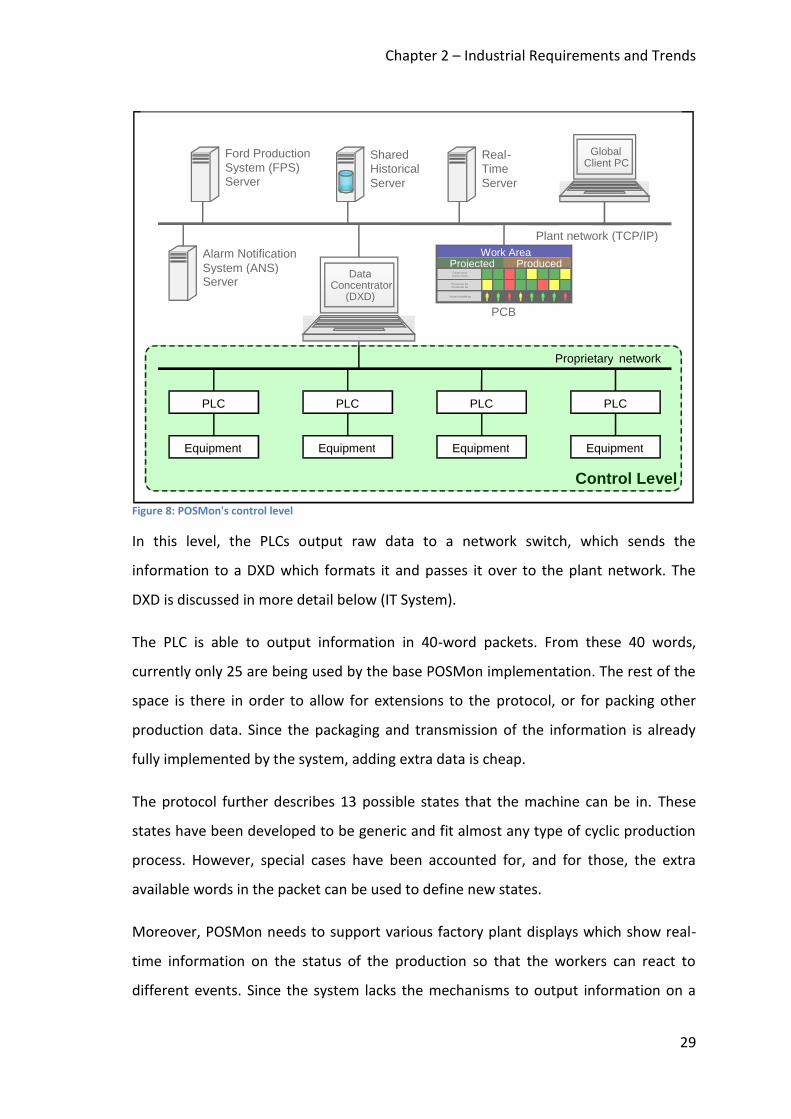
Chapter 2 – Industrial Requirements and Trends
29
Figure 8: POSMon's control level
In this level, the PLCs output raw data to a network switch, which sends the
information to a DXD which formats it and passes it over to the plant network. The
DXD is discussed in more detail below (IT System).
The PLC is able to output information in 40-word packets. From these 40 words,
currently only 25 are being used by the base POSMon implementation. The rest of the
space is there in order to allow for extensions to the protocol, or for packing other
production data. Since the packaging and transmission of the information is already
fully implemented by the system, adding extra data is cheap.
The protocol further describes 13 possible states that the machine can be in. These
states have been developed to be generic and fit almost any type of cyclic production
process. However, special cases have been accounted for, and for those, the extra
available words in the packet can be used to define new states.
Moreover, POSMon needs to support various factory plant displays which show real-
time information on the status of the production so that the workers can react to
different events. Since the system lacks the mechanisms to output information on a
Equipment
PLC
Proprietary network
Plant network (TCP/IP)
Data Concentrator
(DXD)
Ford Production System (FPS) Server
Shared Historical Server
Real - Time Server
Global Client PC
Alarm Notification System (ANS) Server
Work Area
Projected Produced
Cocoo cocoo
Coooo coooo
Piu piu piu piu
Piu piu piu piu I’m just a birdie too
PCB
Equipment
PLC
Equipment
PLC
Equipment
PLC
Control Level
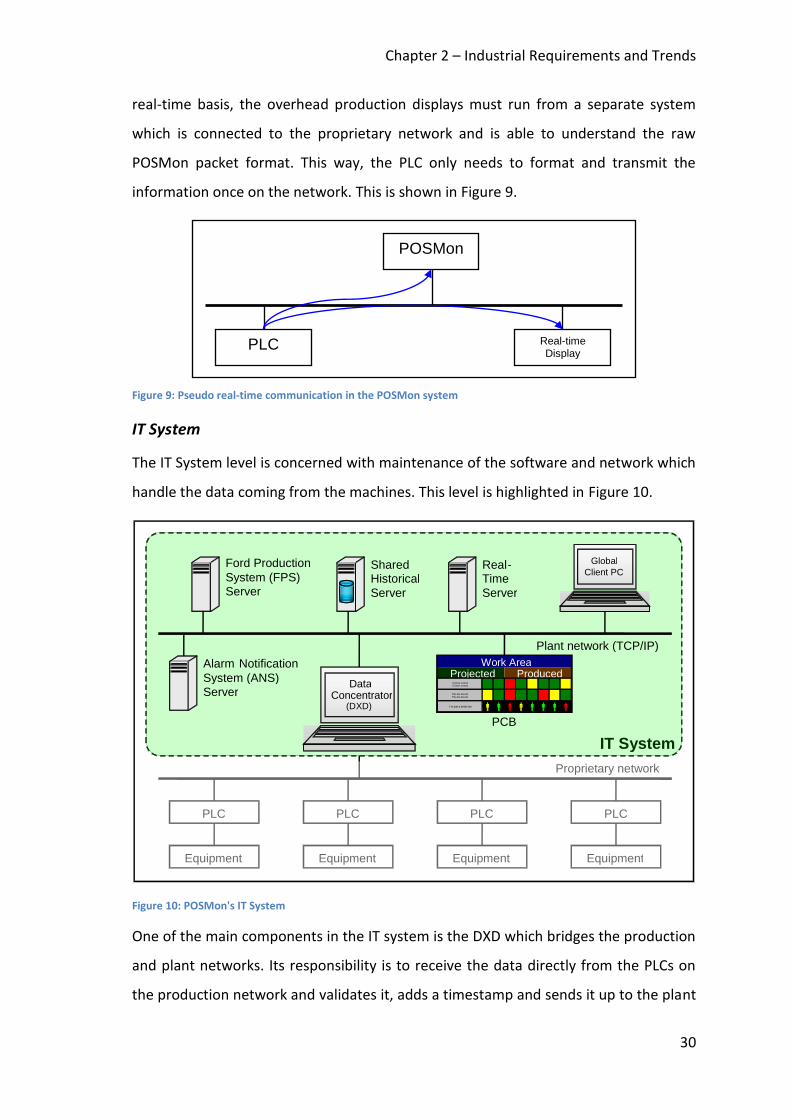
Chapter 2 – Industrial Requirements and Trends
30
real-time basis, the overhead production displays must run from a separate system
which is connected to the proprietary network and is able to understand the raw
POSMon packet format. This way, the PLC only needs to format and transmit the
information once on the network. This is shown in Figure 9.
Figure 9: Pseudo real-time communication in the POSMon system
IT System
The IT System level is concerned with maintenance of the software and network which
handle the data coming from the machines. This level is highlighted in Figure 10.
Figure 10: POSMon's IT System
One of the main components in the IT system is the DXD which bridges the production
and plant networks. Its responsibility is to receive the data directly from the PLCs on
the production network and validates it, adds a timestamp and sends it up to the plant
PLC
POSMon
Real-time Display
Equipment
PLC
Proprietary network
Equipment
PLC
Equipment
PLC
Equipment
PLC
Plant network (TCP/IP)
Data Concentrator
(DXD)
Ford Production System (FPS) Server
Shared Historical Server
Real - Time Server
Global Client PC
Alarm Notification System (ANS) Server
Work Area
Projected Produced
Cocoo cocoo
Coooo coooo
Piu piu piu piu
Piu piu piu piu I’m just a birdie too
PCB
IT System
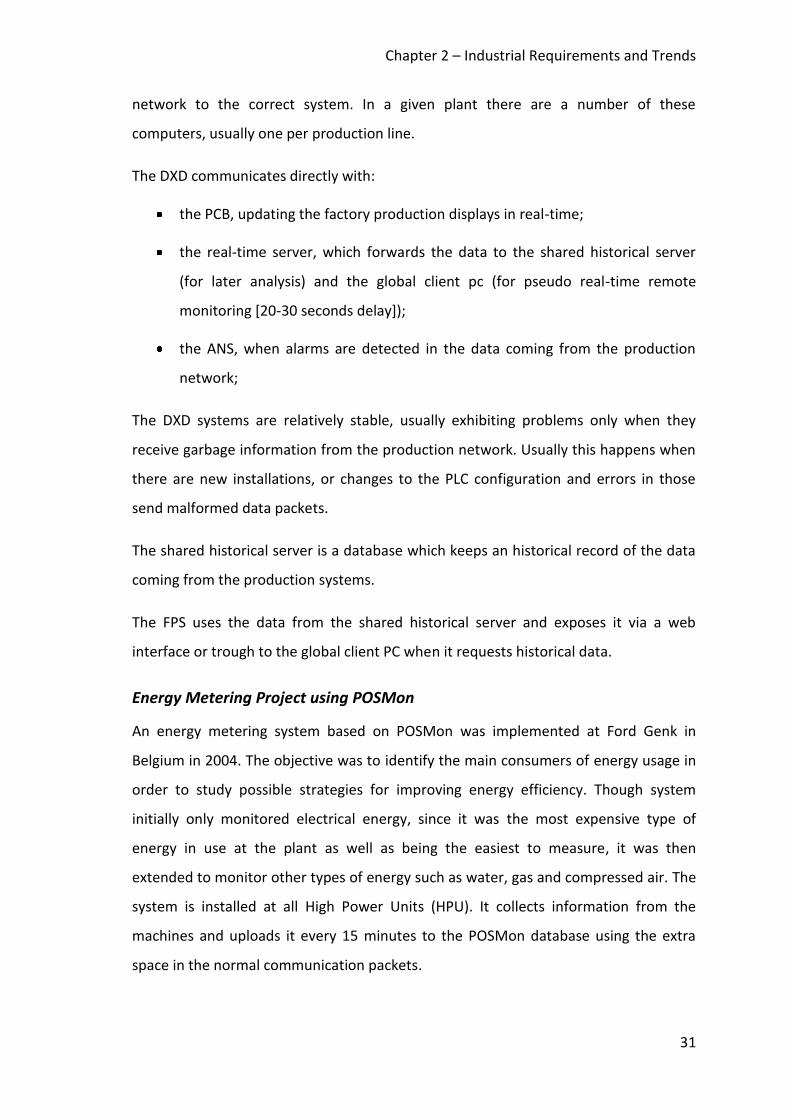
Chapter 2 – Industrial Requirements and Trends
31
network to the correct system. In a given plant there are a number of these
computers, usually one per production line.
The DXD communicates directly with:
the PCB, updating the factory production displays in real-time;
the real-time server, which forwards the data to the shared historical server
(for later analysis) and the global client pc (for pseudo real-time remote
monitoring [20-30 seconds delay]);
the ANS, when alarms are detected in the data coming from the production
network;
The DXD systems are relatively stable, usually exhibiting problems only when they
receive garbage information from the production network. Usually this happens when
there are new installations, or changes to the PLC configuration and errors in those
send malformed data packets.
The shared historical server is a database which keeps an historical record of the data
coming from the production systems.
The FPS uses the data from the shared historical server and exposes it via a web
interface or trough to the global client PC when it requests historical data.
Energy Metering Project using POSMon
An energy metering system based on POSMon was implemented at Ford Genk in
Belgium in 2004. The objective was to identify the main consumers of energy usage in
order to study possible strategies for improving energy efficiency. Though system
initially only monitored electrical energy, since it was the most expensive type of
energy in use at the plant as well as being the easiest to measure, it was then
extended to monitor other types of energy such as water, gas and compressed air. The
system is installed at all High Power Units (HPU). It collects information from the
machines and uploads it every 15 minutes to the POSMon database using the extra
space in the normal communication packets.
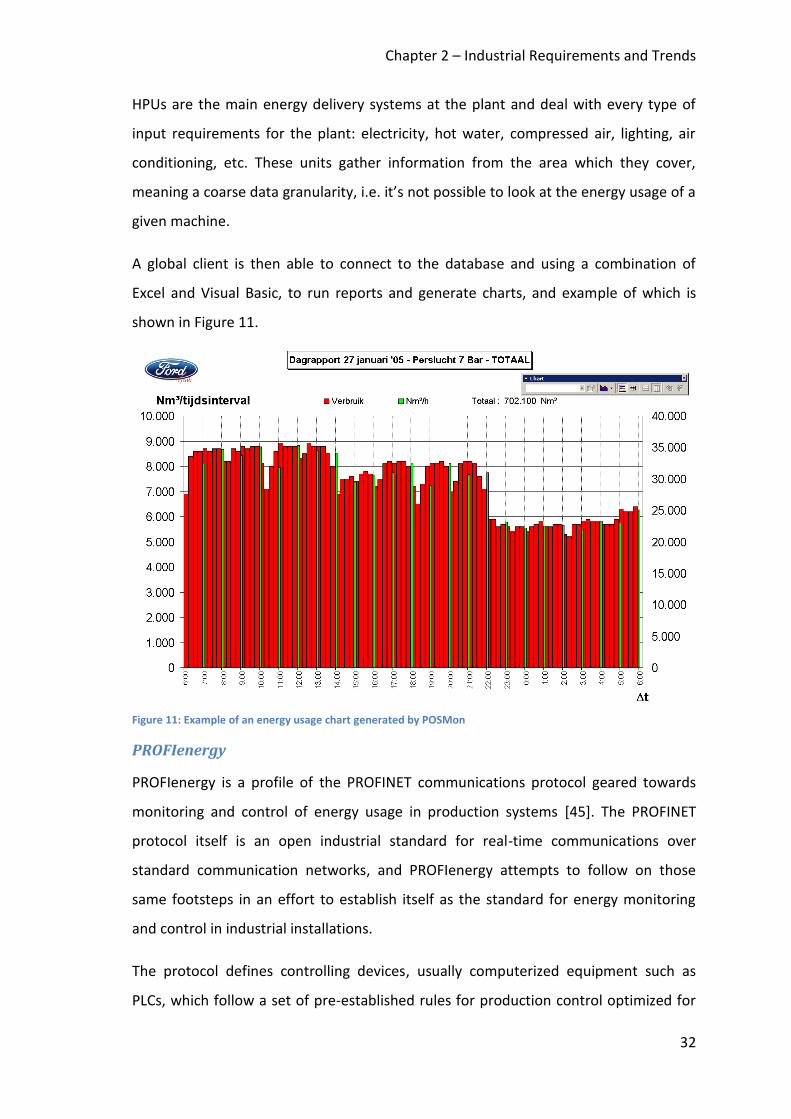
Chapter 2 – Industrial Requirements and Trends
32
HPUs are the main energy delivery systems at the plant and deal with every type of
input requirements for the plant: electricity, hot water, compressed air, lighting, air
conditioning, etc. These units gather information from the area which they cover,
meaning a coarse data granularity, i.e. it’s not possible to look at the energy usage of a
given machine.
A global client is then able to connect to the database and using a combination of
Excel and Visual Basic, to run reports and generate charts, and example of which is
shown in Figure 11.
Figure 11: Example of an energy usage chart generated by POSMon
PROFIenergy
PROFIenergy is a profile of the PROFINET communications protocol geared towards
monitoring and control of energy usage in production systems [45]. The PROFINET
protocol itself is an open industrial standard for real-time communications over
standard communication networks, and PROFIenergy attempts to follow on those
same footsteps in an effort to establish itself as the standard for energy monitoring
and control in industrial installations.
The protocol defines controlling devices, usually computerized equipment such as
PLCs, which follow a set of pre-established rules for production control optimized for

Chapter 2 – Industrial Requirements and Trends
33
energy usage. These control messages are then communicated to the production
devices, known as “energy consumers”, through the PROFINET network using
standardized messages in order to promote interoperability between different
vendors.
The energy consumers are expected to integrate a moderate level of intelligence,
which can then be used in order to best adapt the incoming control messages to the
specific hardware implementation of the device, i.e. for longer idle periods, it might be
possible to completely shut down a number of the device’s subsystems, therefore
saving energy. This architecture also allows optimization work to be carried out on the
devices themselves, without the need to make changes to either the network or the
controlling devices.
Moreover, PROFIenergy supports the feeding of energy data from the devices back to
the controllers in order to support more complex energy efficiency techniques.
2.3.2. Production Simulation
Production simulation systems are generally used during the design phase of the
production line in order to test the system under different conditions such as layout
variations and manufacturing load, in order to extract relevant data and predict real-
world usage.
Ford’s® Production Simulation System
The production simulation tools in current use at Ford® have been developed
internally by the company according to the needs expressed by the production
engineers who use them. Given the fact that the different simulation tools have been
developed internally, they feature similar technical characteristics, even if their end
uses are somewhat different.
Ford® has currently three different but similar simulation tools. All of them use
discrete simulation techniques and relying on complex Microsoft Excel® macros for
data input, and on the WITNESS™ simulation software as a simulation backend. After a
simulation run, the results are fed back to the spread sheet for posterior analysis.
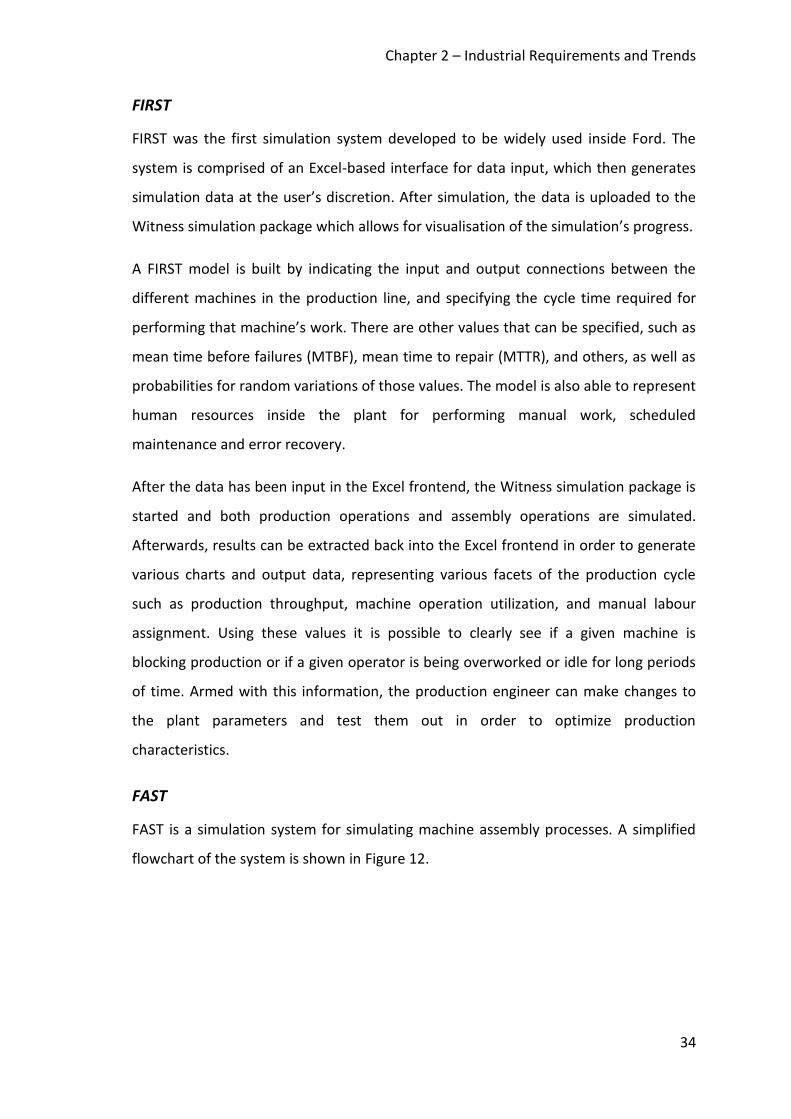
Chapter 2 – Industrial Requirements and Trends
34
FIRST
FIRST was the first simulation system developed to be widely used inside Ford. The
system is comprised of an Excel-based interface for data input, which then generates
simulation data at the user’s discretion. After simulation, the data is uploaded to the
Witness simulation package which allows for visualisation of the simulation’s progress.
A FIRST model is built by indicating the input and output connections between the
different machines in the production line, and specifying the cycle time required for
performing that machine’s work. There are other values that can be specified, such as
mean time before failures (MTBF), mean time to repair (MTTR), and others, as well as
probabilities for random variations of those values. The model is also able to represent
human resources inside the plant for performing manual work, scheduled
maintenance and error recovery.
After the data has been input in the Excel frontend, the Witness simulation package is
started and both production operations and assembly operations are simulated.
Afterwards, results can be extracted back into the Excel frontend in order to generate
various charts and output data, representing various facets of the production cycle
such as production throughput, machine operation utilization, and manual labour
assignment. Using these values it is possible to clearly see if a given machine is
blocking production or if a given operator is being overworked or idle for long periods
of time. Armed with this information, the production engineer can make changes to
the plant parameters and test them out in order to optimize production
characteristics.
FAST
FAST is a simulation system for simulating machine assembly processes. A simplified
flowchart of the system is shown in Figure 12.
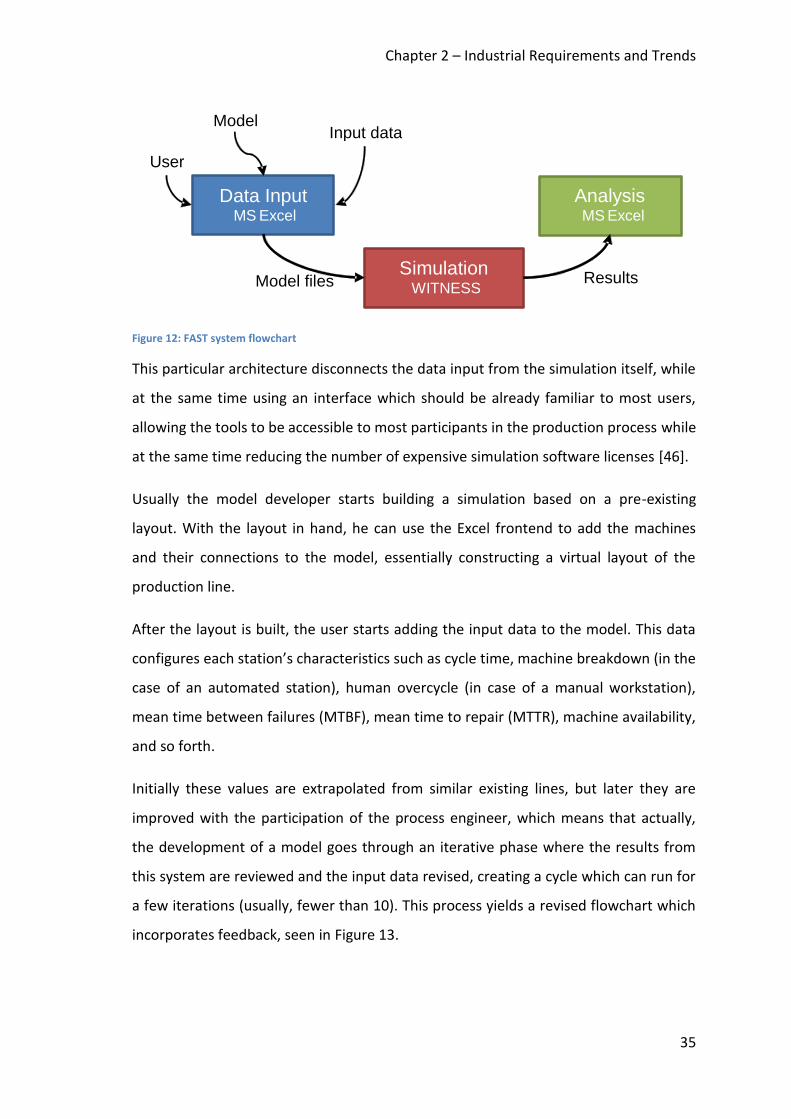
Chapter 2 – Industrial Requirements and Trends
35
Figure 12: FAST system flowchart
This particular architecture disconnects the data input from the simulation itself, while
at the same time using an interface which should be already familiar to most users,
allowing the tools to be accessible to most participants in the production process while
at the same time reducing the number of expensive simulation software licenses [46].
Usually the model developer starts building a simulation based on a pre-existing
layout. With the layout in hand, he can use the Excel frontend to add the machines
and their connections to the model, essentially constructing a virtual layout of the
production line.
After the layout is built, the user starts adding the input data to the model. This data
configures each station’s characteristics such as cycle time, machine breakdown (in the
case of an automated station), human overcycle (in case of a manual workstation),
mean time between failures (MTBF), mean time to repair (MTTR), machine availability,
and so forth.
Initially these values are extrapolated from similar existing lines, but later they are
improved with the participation of the process engineer, which means that actually,
the development of a model goes through an iterative phase where the results from
this system are reviewed and the input data revised, creating a cycle which can run for
a few iterations (usually, fewer than 10). This process yields a revised flowchart which
incorporates feedback, seen in Figure 13.
User
Model Input data
Model files Results
D ata Input MS Excel
S i mulation WITNESS
Analysis MS Excel
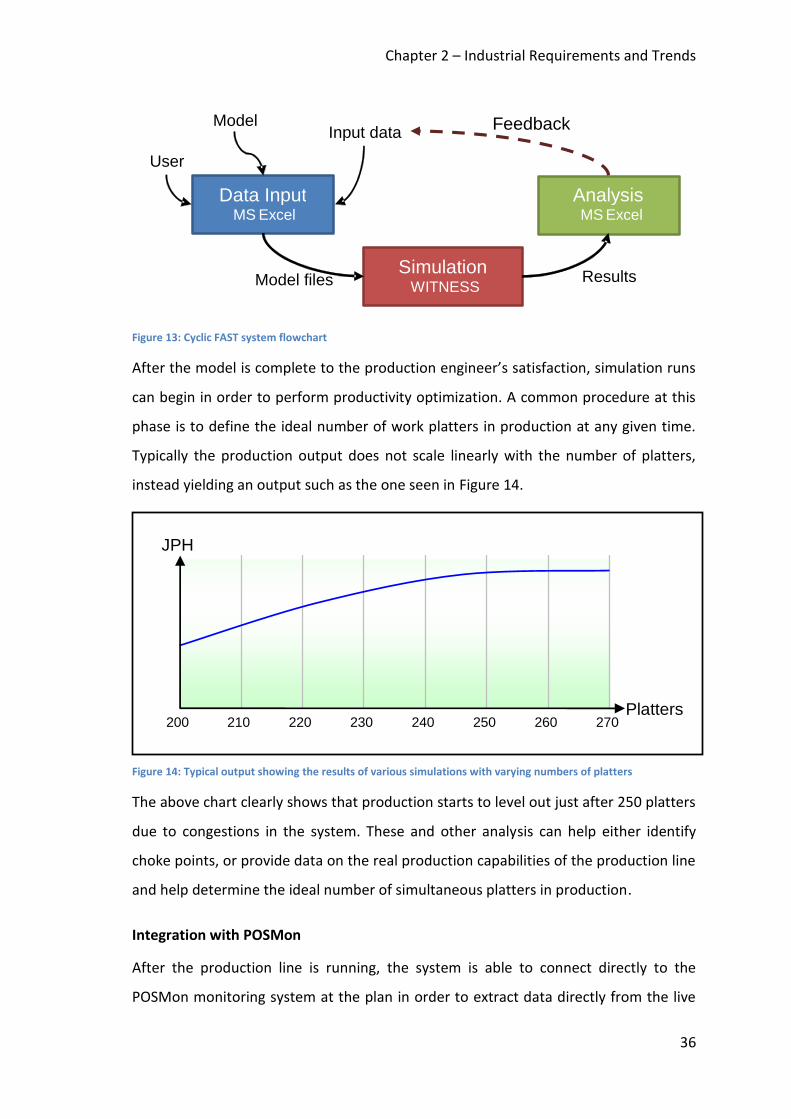
Chapter 2 – Industrial Requirements and Trends
36
Figure 13: Cyclic FAST system flowchart
After the model is complete to the production engineer’s satisfaction, simulation runs
can begin in order to perform productivity optimization. A common procedure at this
phase is to define the ideal number of work platters in production at any given time.
Typically the production output does not scale linearly with the number of platters,
instead yielding an output such as the one seen in Figure 14.
Figure 14: Typical output showing the results of various simulations with varying numbers of platters
The above chart clearly shows that production starts to level out just after 250 platters
due to congestions in the system. These and other analysis can help either identify
choke points, or provide data on the real production capabilities of the production line
and help determine the ideal number of simultaneous platters in production.
Integration with POSMon
After the production line is running, the system is able to connect directly to the
POSMon monitoring system at the plan in order to extract data directly from the live
User
Model Input data
Model files Results
D ata Input MS Excel
S i mulation WITNESS
Analysis
MS Excel
Feedback
JPH
Platters 270 200 260 210 220 250 240 230

Chapter 2 – Industrial Requirements and Trends
37
machines. The system is configured with the staff working times and breaks for the
different shifts, and with that information is able to identify and calculate the failure
times for each machine (subtracting the machine failure time from the worker’s break
time). This data is then used to calculate and improve the MTBF, MTTR and machine
availability indexes for those machines.
FORMAT
FORMAT is a tool for simulating material flows inside a production line. As with the
other Ford simulation tools previously described, this tool is composed of an Excel
front-end for data input and result display, using the Witness simulation package for
simulation runs.
This tool is, however, not being used anymore inside Ford, the reasons being that its
functionality is beginning to be covered by the other tools, and that it is considered to
be relatively more difficult to use.
Future work
The futures work plan on the area of simulation tools at Ford is directed to the
development of a single tool which comprises the functionality currently present in
the three existing tools, in addition to extended areas of expertise in order to try to
cover all the participants in the production process, as can be seen in Figure 15.
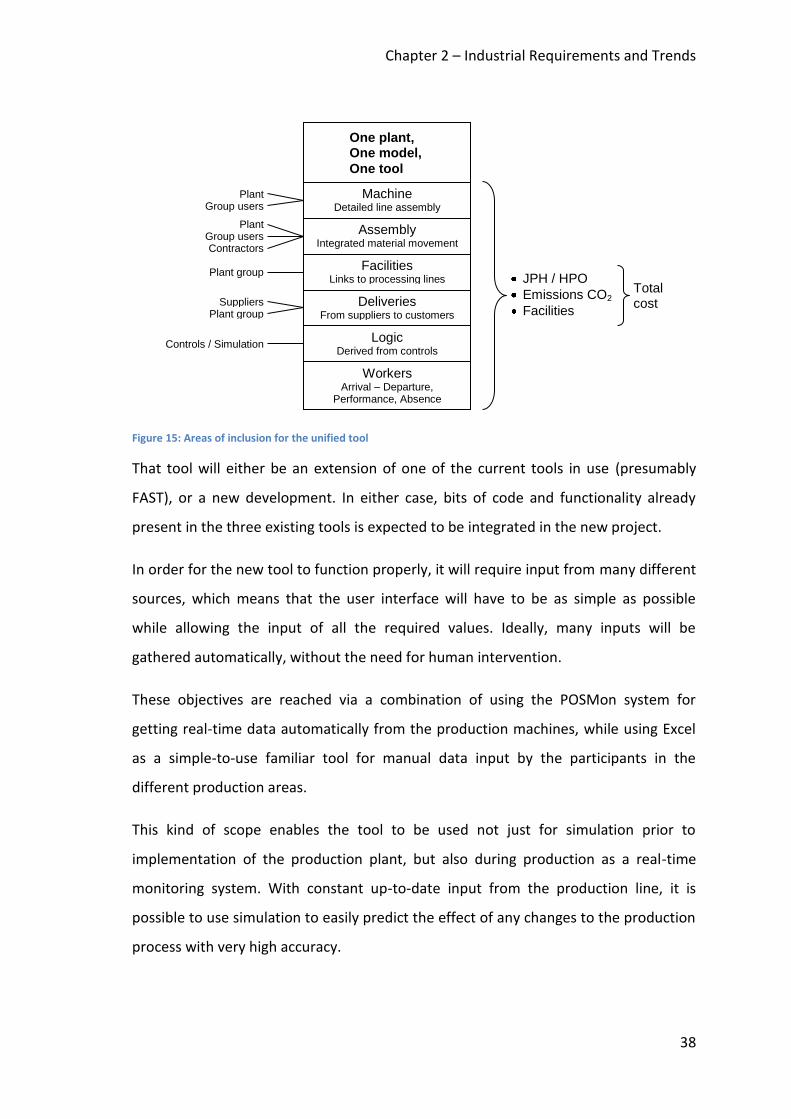
Chapter 2 – Industrial Requirements and Trends
38
Figure 15: Areas of inclusion for the unified tool
That tool will either be an extension of one of the current tools in use (presumably
FAST), or a new development. In either case, bits of code and functionality already
present in the three existing tools is expected to be integrated in the new project.
In order for the new tool to function properly, it will require input from many different
sources, which means that the user interface will have to be as simple as possible
while allowing the input of all the required values. Ideally, many inputs will be
gathered automatically, without the need for human intervention.
These objectives are reached via a combination of using the POSMon system for
getting real-time data automatically from the production machines, while using Excel
as a simple-to-use familiar tool for manual data input by the participants in the
different production areas.
This kind of scope enables the tool to be used not just for simulation prior to
implementation of the production plant, but also during production as a real-time
monitoring system. With constant up-to-date input from the production line, it is
possible to use simulation to easily predict the effect of any changes to the production
process with very high accuracy.
One plant, One model,
One tool
Machine Detailed line assembly
Assembly Integrated material movement
Facilities Links to processing lines
Deliveries From suppliers to customers
Logic Derived from controls
Workers Arrival – Departure,
Performance, Absence
Plant group
Plant Group users Contractors
Plant Group users
Suppliers Plant group
Controls / Simulation
JPH / HPO
Emissions CO2
Facilities
Total cost
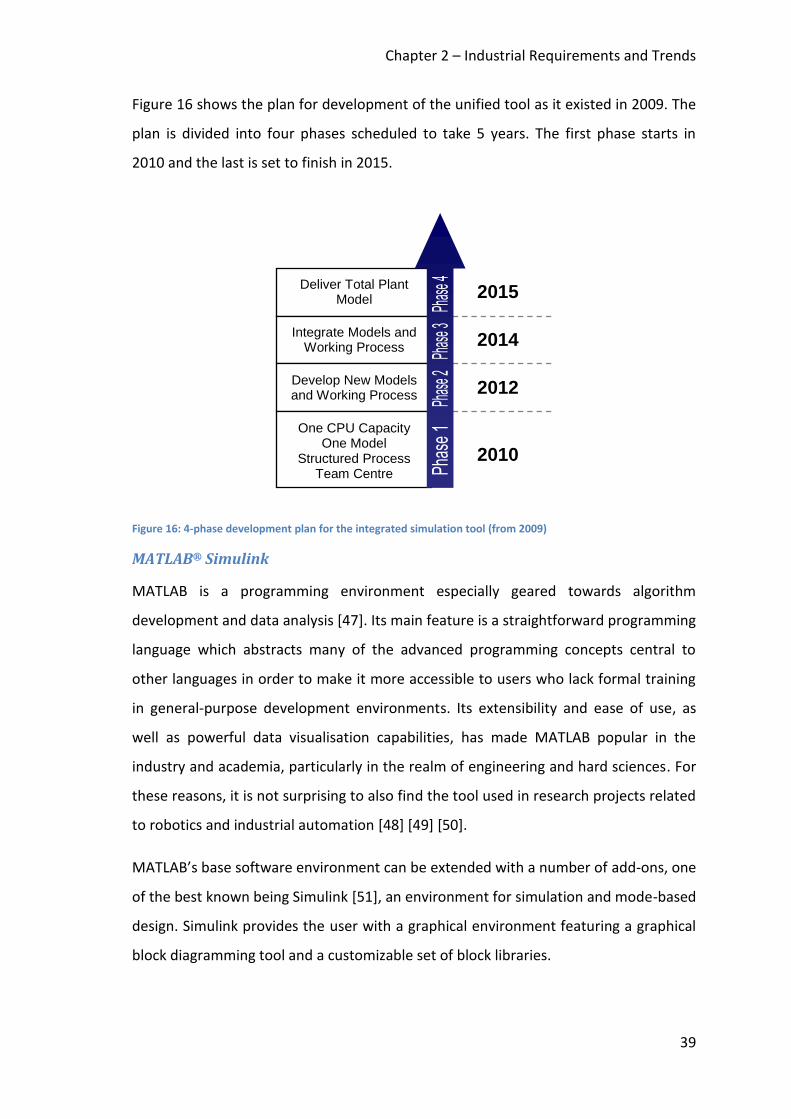
Chapter 2 – Industrial Requirements and Trends
39
Figure 16 shows the plan for development of the unified tool as it existed in 2009. The
plan is divided into four phases scheduled to take 5 years. The first phase starts in
2010 and the last is set to finish in 2015.
Figure 16: 4-phase development plan for the integrated simulation tool (from 2009)
MATLAB® Simulink
MATLAB is a programming environment especially geared towards algorithm
development and data analysis [47]. Its main feature is a straightforward programming
language which abstracts many of the advanced programming concepts central to
other languages in order to make it more accessible to users who lack formal training
in general-purpose development environments. Its extensibility and ease of use, as
well as powerful data visualisation capabilities, has made MATLAB popular in the
industry and academia, particularly in the realm of engineering and hard sciences. For
these reasons, it is not surprising to also find the tool used in research projects related
to robotics and industrial automation [48] [49] [50].
MATLAB’s base software environment can be extended with a number of add-ons, one
of the best known being Simulink [51], an environment for simulation and mode-based
design. Simulink provides the user with a graphical environment featuring a graphical
block diagramming tool and a customizable set of block libraries.
Deliver Total Plant Model
Integrate Models and Working Process
Develop New Models and Working Process
One CPU Capacity One Model
Structured Process Team Centre
2010
2012
2014
2015

Chapter 2 – Industrial Requirements and Trends
40
Besides featuring great extensibility and visualisation tools, Simulink also supports
code generation directly from its models, allowing the reutilisation of the models not
just for the initial design and research, but also as an important tool for deployment,
effectively making Simulink a useful tool throughout the entire lifecycle of the
production process. These features have caused some organizations to declare
substantial development time savings when transitioning from other tools to Simulink
[52] [53].
2.3.3. Production Support Systems
In order to connect and manage the various systems throughout the various levels of
the production system architecture, there is a need for enterprise management tools.
Typically these tools aim to have an overview of the entire production system so that
the general production strategies can be implemented. The recent trend in this field
has been to aggregate the various systems spanning the entire enterprise architecture
under a single set of tools, and when possible a single, or limited number of network
topologies.
Schneider Electric® ION™ EEM
ION™ is Schneider Electric’s® suite of tools designed to provide complete energy
management for office and industrial settings, such as electric utilities, industrial
facilities (oil & gas, chemical, automotive, etc.), water facilities, office and retail
buildings, etc. [54]. Figure 17 shows the overall architecture of the system.
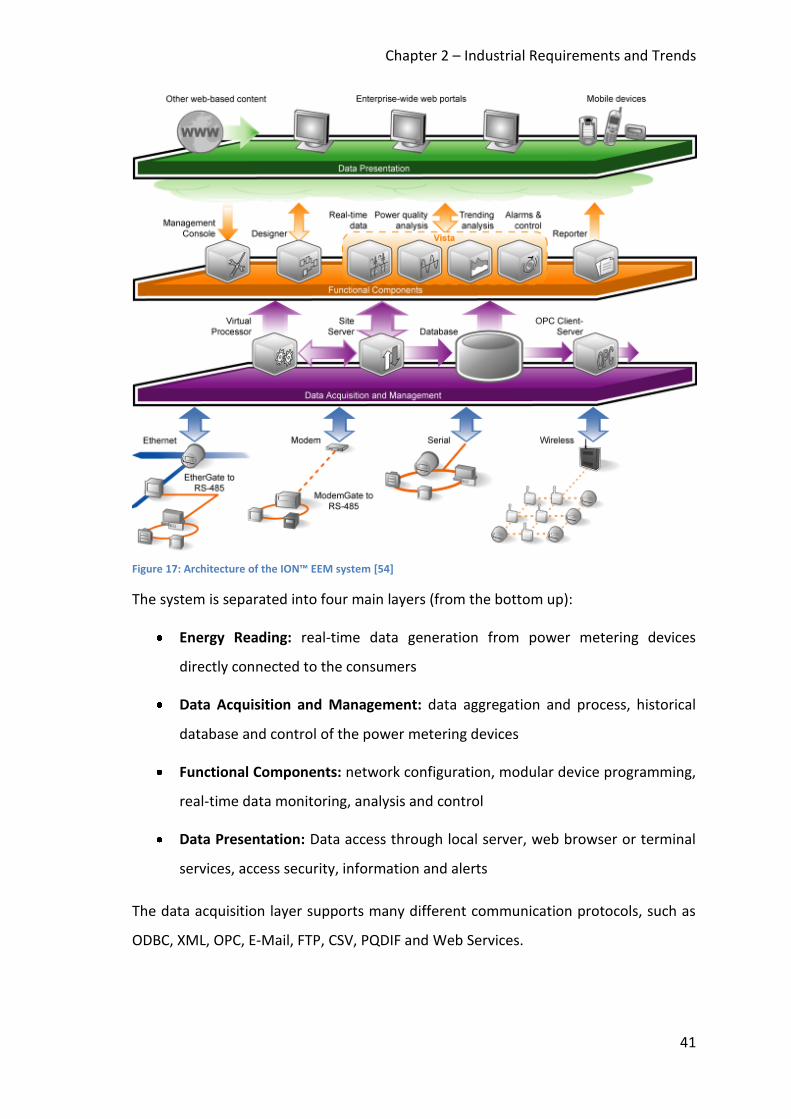
Chapter 2 – Industrial Requirements and Trends
41
Figure 17: Architecture of the ION™ EEM system [54]
The system is separated into four main layers (from the bottom up):
Energy Reading: real-time data generation from power metering devices
directly connected to the consumers
Data Acquisition and Management: data aggregation and process, historical
database and control of the power metering devices
Functional Components: network configuration, modular device programming,
real-time data monitoring, analysis and control
Data Presentation: Data access through local server, web browser or terminal
services, access security, information and alerts
The data acquisition layer supports many different communication protocols, such as
ODBC, XML, OPC, E-Mail, FTP, CSV, PQDIF and Web Services.

Chapter 2 – Industrial Requirements and Trends
42
SAP® Manufacturing Integration and Intelligence™
SAP's® MES system attempts to bridge the disconnect between the business level and
the different manufacturing sites through the use of the SAP® Manufacturing
Integration and Intelligence™ (MII™) system, as shown in Figure 18.
Figure 18: Business to Manufacturing Integration Through the Use of MII [55]
SAP® MII™ takes advantage of modern information technology and communication
infrastructures in order to interconnect geographically scattered manufacturing
facilities into a single, integrated overview of the production characteristics.
The system is able to perform real-time monitoring of manufacturing characteristics
such as traceability, order processing, order management, component confirmation,
production scrap, back-flush, operator certification, quality notifications, etc. It is also
able to set production parameters e.g. assigning batch numbers to shop orders; and
generate automated responses to the monitored indexes according to pre-defined
rules e.g. raising an alarm and shutting down a device when its temperature exceeds a
pre-set threshold. Finally, the application delivers preconfigured connectors to many
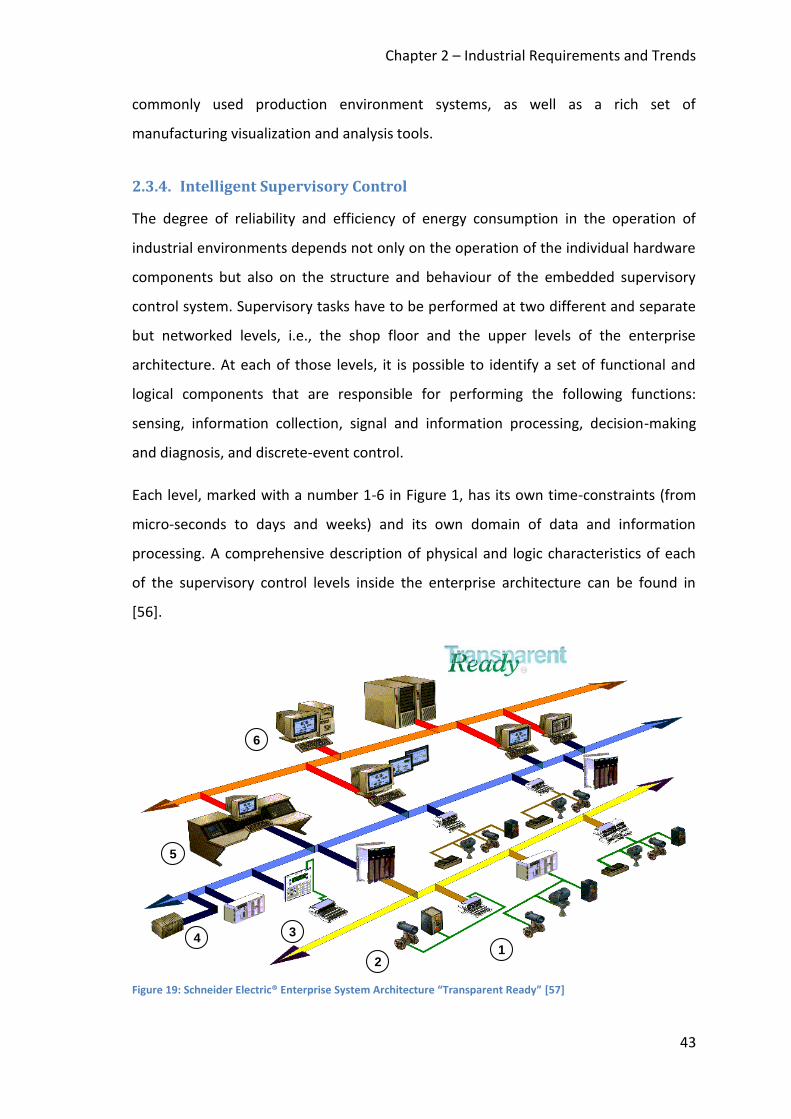
Chapter 2 – Industrial Requirements and Trends
43
commonly used production environment systems, as well as a rich set of
manufacturing visualization and analysis tools.
2.3.4. Intelligent Supervisory Control
The degree of reliability and efficiency of energy consumption in the operation of
industrial environments depends not only on the operation of the individual hardware
components but also on the structure and behaviour of the embedded supervisory
control system. Supervisory tasks have to be performed at two different and separate
but networked levels, i.e., the shop floor and the upper levels of the enterprise
architecture. At each of those levels, it is possible to identify a set of functional and
logical components that are responsible for performing the following functions:
sensing, information collection, signal and information processing, decision-making
and diagnosis, and discrete-event control.
Each level, marked with a number 1-6 in Figure 1, has its own time-constraints (from
micro-seconds to days and weeks) and its own domain of data and information
processing. A comprehensive description of physical and logic characteristics of each
of the supervisory control levels inside the enterprise architecture can be found in
[56].
Figure 19: Schneider Electric® Enterprise System Architecture “Transparent Ready” [57]
1
6
2
34
5
Chapter 2 – Industrial Requirements and Trends
44
Monitoring operations, the behaviour of the hardware components, and the system as
a whole is then an essential function of such a supervisory control system. For the
purposes of this topic, the definition of “monitoring” is considered as the act of
identifying the characteristic changes in a process and in the behaviour of hardware
resources by evaluating process and component signatures without interrupting
normal operations as described in [30] and references therein.
2.4. Previous Research at Ford®
Some work has already been done at Ford’s® plant in Dagenham in order to optimize
energy usage. That work has been done using the available tools such as the POSMon
production monitoring system allied with ad-hoc energy readings from the machines.
The work conducted there focused on reducing the ratio of energy footprint in relation
to machine productivity, measured in jobs per hour (JPH). Conceptually visualizing that
ratio in a 2-dimensional chart, in ideal proportional ratio of growth would be seen in
both axes -- 0 JPH would correlate to 0 KW of energy spent and 100% JPH (full
production rate) would correlate to the maximum energy usage, with a straight line
between those two points.
The reality though is that even at 0 JPH energy needs to be spent by the machine due
to inefficiencies and in order to maintain its production readiness. These factors
remain true at any value below full productivity, yielding an energy-to-productivity
curve instead of a nice, clean line.
Although it is unlikely that all energy inefficiencies can ever be resolved, it is no less
true that there is a great potential for optimizations to the equipment and process
that can yield substantial energy and cost savings. Figure 20 shows a conceptual chart
of what the realistic expectations would be from such research.

Chapter 2 – Industrial Requirements and Trends
45
Figure 20: Results of an initial effort to improve energy efficiency using POSMon
The following are examples of results from actual research conducted at the Ford®
Dagenham plant towards improving the overall plant energy efficiency.
2.4.1. Production Machine’s Design
By feeding real-world readings taken directly from working CNC machines to the
machine’s suppliers, they have been able to improve on the current designs to develop
more energy efficient components for future models. These are currently being tested
in testing cells in order to ascertain the benefits of the new technology compared to
the current installations.
It was also found that some machines feature electrical motors which during operation
were revealed to be too large and powerful for the intended tasks. Future versions of
those machines can be specified with smaller motors which will be cheaper and easier
to work with and maintain, as well as being more energy efficient.
2.4.2. Electrical Installations
It was discovered that in some of the equipment, the cable gauges were over-
specified, making them capable of currents an order of magnitude higher than those
required for actual production. These findings were communicated back to the
supplier, so that future installations would be optimized.
Similar discoveries were made regarding the support machinery and cabling for
individual production cells, although here more care must be taken before aggressively
optimizing the installation hardware. A sensible installation should retain enough
KW
JPH 100%
Before improvements Ideal ratio After improvements
0%
Chapter 2 – Industrial Requirements and Trends
46
flexibility so that changes to the cell can be implemented easily and in a cost-effective
way as the production needs evolve.
2.4.3. Coolant Pump Stations
The pumps controlling the circulation of the coolant throughout the plant were
configured to run permanently at full power. It was later found that for most
situations, the pressure generated by the pumps was too great, so perforated plates
were inserted into the pipes in order to add resistance and therefore control pressure.
A study was conducted in order to test if a variable speed drive (VSD) could be used to
control the pressure by lowering the pump motor’s power instead of using the plates.
In that study, conducted on only for one of the three motors which compose the
coolant pump stations, the plates were completely removed and a VSD was installed in
the motor’s power supply. The study yielded a reduction of 70% in energy costs.
Though these results were only for one pump, they can’t be directly extrapolated for
the other three pumps since the pumping system works as a whole, with only one
pump running constantly, and the others starting up only when required. Still, it is
expected that further improvements would be made from adding similar solutions to
the entire system.
2.4.4. Coolant Extraction System
The plant’s coolant mist extraction system was originally designed for three machines
with a potential for expansion of another three at a later date. Since the power
requirements for the system were designed for six machines but currently supply only
three, there was an excess of energy being supplied compared to that required for
performing the needed work.
Taking from the results obtained in the study described above, a study was conducted
to find out if VSDs could be used in a cost-effective way to reduce the power being fed
to the machines to their original specifications. The study found that this solution
reduced power consumption by as much as 68%, translating into substantial cost
savings. Though the initial cost of the VSD and is installation was high, the energy cost
savings meant that the investment was paid back in just a few months. Furthermore, if
Chapter 2 – Industrial Requirements and Trends
47
the system is expanded in the future, the reconfiguration of the VSD is an easy task up
until a time when all of the six machines originally specified are installed, at which
point the VSD can be removed and used for a new installation, saving on
implementation costs.
2.4.5. Engine Block Washer
The machine which washes away coolant and lubricant residues from parts in
production was found out to be idle for long periods of time while it waited for parts
to arrive from the upstream machines. During this idle time, the block washer was
constantly running its internal pumps and wasting water, as well as cleaning fluids.
Here, the proposed solution was to shut the machine down if a part doesn’t come
within a set number of minutes, and restart it once a new incoming part is detected at
a certain point up the transport system. Since the machine’s start-up time is in the
order of 15-20 seconds, the point of detection was set at a reasonable distance so that
the machine would be ready when the part arrives.
Although this solution is still not optimal, since it still leaves the block washer running
for longer periods than necessary, it has nonetheless yielded substantial cost savings
from a relatively small investment.
2.5. Related Academic Research Projects
The modern industrial enterprise is facing many challenges. Besides the energy
efficiency concerns discussed previously in this chapter, there’s also the need to cater
to increasingly varied consumer needs, leading to ever shorter production lifecycles.
This has led to the rise of mass customization, where there is an attempt to satisfy the
individual customer’s needs without compromising production efficiency [58].
Fortunately, the various solutions to all of these challenges may pass through a
common set of innovations. The challenge of mass customization in particular requires
the development of flexible production lines which are capable of responding quickly
to changes in the product, and even producing a varied array of model types using the
same set of machines. This is usually supported by the development of more generic
Chapter 2 – Industrial Requirements and Trends
48
machines which are capable of a wider range of operations, thereby replacing a
number of single-purpose machines, and making them easily adaptable to new
production requirements.
Partly as a reaction to the increasing complexity in software control mechanisms for
these more generic production lines is the advent of decentralized systems [9], a
recent research avenue which concerns itself with separating the various production
components into autonomous entities. These simpler entities allow for easier
development of a truly flexible production through the separation of concerns
between the devices and the various hierarchies in the production system. Moreover,
by implementing clearly defined communication interfaces, such systems can be easily
replaced by others with similar or identical interfaces, leading to much better
integration, replaceability and reusability within the production line.
The following research project descriptions focus mainly on three areas:
Production Simulation – Despite being a relatively recent addition to the
production environment, the use of simulation techniques for supporting the
design and operation of production systems has been steadily becoming more
popular. The enormous advances in almost every aspect of computerised
system technology witnessed recently have expanded on the possibilities
afforded to early simulation systems, integrating them more and more deeply
into the entire lifecycle of the production process and taking up increasing
responsibilities in the manufacturing system. Some of these new challenges are
being faced by state-of-the-art research projects, with promising results.
Service-oriented Architecture – One of the paradigms supporting decentralized
systems which have recently been the focus of much research and investment
is the concept of Service-oriented Architectures (SoA). The application of the
SoA paradigm for automation was thoroughly studied in SIRENA, an European
research project with the objective to develop a “Service Infrastructure for Real
time Embedded Networked Applications” [5]. The project first introduced the
concept of a service-oriented architecture for devices, and developed the
DPWS protocol [31].
Chapter 2 – Industrial Requirements and Trends
49
Production Monitoring and Energy Efficiency – Given the high visibility that
the energy problem has in the industry nowadays, there have recently
appeared a number of research projects dedicated to tackling the various
facets of this issue. A lot of those efforts are being concentrated on providing
the basis for distributed monitoring systems which can then be used for
keeping track of energy consumption.
2.5.1. SIRENA
The principles outlined above have been the subject of the SIRENA project [5],
sponsored by the European Commission under the Framework Programme initiative
[59]. The programme aims to support and encourage research within the European
area by bringing academic and industrial partners together through a combination of
funding incentives and the promise of favourable sharing of results between the
partners.
SIRENA was part of the 5th Framework Programme (FP5) with the goal of leveraging
SoA-based technologies to promote seamless, cross-domain interaction between
embedded devices. This came about after the recognition that miniaturization had
made it possible to embed networking and processing capabilities in increasingly
smaller packages, which could be leveraged into better connectivity and newer
communication paradigms between devices, and even components of those devices.
At the same time, it was recognized that an open, extensible and generic standard was
needed in order to create a usable network of connected devices in order to facilitate
adoption of those technologies, as well as promote healthy competition in the market
place.
The SIRENA project focused its efforts on adapting the SoA approach to the needs of
connected devices. From this work came the first draft of the Devices Profile for Web
Services, an extensible protocol which defined the minimal requirements and
implementation details for SoA-based embedded devices. These were implemented in
the form of software libraries as a proof of concept, and in order to foster acceptance
by the community.
Chapter 2 – Industrial Requirements and Trends
50
These software libraries were instrumental not only as a demonstration of the
capabilities of the proposed technology, but also as a starting point for the
investigation into SoA-based devices in the production scenario.
2.5.2. SOCRADES
The SOCRADES project, as a follow-up to SIRENA, had as its primary objective to
develop a design, execution and management platform for next-generation industrial
automation systems, exploiting the Service Oriented Architecture paradigm both at
the device and at the application level [6]. This project was carried out by a varied
number of academic research facilities in various European universities, as well as
various industry partners.
The project targeted the industrial manufacturing domain, and focused its
developments on a small number of representative use-cases where SoA-enabled
devices would be implemented in small production cells in order to study the
requirements for design, control, supervision, performance, and other aspects
important to the field of industrial production.
From these projects a number of results were achieved. First and foremost, the initial
DPWS implementation as developed during the SIRENA project was fleshed out and
published as an open source project with an independent home at SoA4D (SoA for
devices) [60]. Other results included the development of various orchestration and
choreography-based control mechanisms, as well as a number of SoA-based
simulation systems, one of which is described in detail in Chapter 5.
These results were very positive and paved the ground for further investigation into
the SoA based monitoring and control techniques used throughout this document.
2.5.3. SODA
SODA [61] was another follow-up to SIRENA under the European Commission’s
Framework Programme which ran in parallel to the SOCRADES project. Much like in
SOCRADES, the objective of the SODA project was to create a SoA-based ecosystem of
Chapter 2 – Industrial Requirements and Trends
51
devices, though unlike the previous project, simultaneously targeting various
application domains (industrial, home, automotive, telecommunications, etc.).
The SODA project focused its efforts on developing the infrastructure necessary for
the actual implementation of the SoA paradigm in devices, an objective which was
declared successful with the development of a proof of concept low-cost device with
integrated web services [62]. Moreover, the devices developed under the umbrella of
the SODA project were used directly in the SOCRADES proof-of-concept
demonstrators.
Though the work presented here did not directly use the tools and devices developed
at SODA, it did, nonetheless feed off of the results achieved by other groups who
benefited from the availability of real, physical web-enabled components in their own
research.
2.5.4. AESOP
The AESOP project [63] started in September 2010 as a follow-up to SOCRADES and
SOPA. The project is under the umbrella of the European Commission as part of the
new Framework Programme 7, and is scheduled to run until February 2013. The goal
of the project is to investigate the SoA approaches outlined in the earlier projects for
monitoring and process control applications, by extending the earlier results into
complex infrastructures spanning the entire enterprise architecture, from the devices
in the production floor, to the enterprise systems. Moreover, the project will study
transition strategies for legacy systems, while at the same time, outlining approaches
for further system upgradeability for the future.
Like the previous projects, AESOP will focus on demonstrations of the research
through the use of pilot applications showcasing the tools and methodologies as they
are developed.
The proposed objectives are in line with the work here presented, though to a much
greater scope. While the AESOP project is concerned with spanning the entire
enterprise architecture, the work here discussed is only concerned with an extensible
monitoring system from the devices up to the supervisory level as a support

Chapter 2 – Industrial Requirements and Trends
52
mechanism for studying energy efficiency strategies for the production line. These
objectives are, however, compatible, particularly considering the underlying SoA-
based methodology. It is expected that further work will be able to easily incorporate
results from both research avenues into productive research.
2.5.5. SIMTER
The SIMTER project [27] is a joint Finnish-Swedish research project which ran between
2007 and 2009 under a consortium composed of various academic and industrial
partners. The project’s goal was to research and implement a production simulation
tool with a focus on the human workers within the industrial automation setting.
The result of the investigation was the development of a simulation tool which is able
to perform production simulation while taking into account levels of automation,
human ergonomics and environmental impacts. In order to better simulate the actions
of workers within the production system, a digital human model was created based on
a database of measured and recorded human motions. Moreover, an environmental
database was integrated with the tool so that its impact could be assessed as part of
the results.
The human factor is many times disregarded in the research of the aspects connected
with industrial energy optimization. However, given the fact that humans are the most
adaptable components of a production system, they can play a surprisingly important
role in the implementation of an efficient energy policy. Though the SIMTER tool
focused its results on production efficiency, the research done into adapting the
human behaviour to the production simulation environment could very well be
adapted towards a production energy simulation system.
2.5.6. E-Energy – Smart Grids Made In Germany
E-Energy [64] is a program sponsored by the German Federal Ministry of Economics
and Technology which aims to study and deploy smart-grid technology in large scales.
The project’s plan is to exploit the rapidly expanding availability of wide-area
communication networks to perform real-time energy readings and propagate them
throughout the entire span of the electricity supply infrastructure, from generation, to
Chapter 2 – Industrial Requirements and Trends
53
distribution, to consumption [65]. The end goal of these activities is to use these new
information capabilities to improve communication between the different
stakeholders in the power sector and through better cooperation, identify
inefficiencies in the power distribution network and find more energy efficient
solutions.
One of the key factors to the work being proposed is the standardization of
technologies and protocols within the smart grid, in order to encourage participation
promote interoperability. Towards this goal, different standards have been proposed,
among them, IEC 62357 – SoA Energy Management Systems.
Though the availability of these systems may initially seem out of the scope of the
research here described in this document, it is nonetheless a very important topic. In
Chapter 7, once of the proposed strategies for improving energy efficiency and
lowering costs includes dealing directly with the energy supplier in order to optimize
the peak power availability. This proposal outlines the usefulness of expanding the
scope of the energy usage from inside the production floor to its neighbouring
facilities towards improving energy usage throughout the system.
2.5.7. klima:aktiv
The Austrian klima:aktiv [66] research program is a governmental initiative designed to
develop a country-wide energy strategy geared towards environmental concerns. The
program is managed by the Austrian Energy Agency and focuses on improving
efficiency of energy usage within the enterprise sector by analysing the different
domains that compose that sector’s power requirements, i.e., lighting, ventilation,
pumps, engines, controllers, etc.
The project seeks to improve energy usage through close cooperation with the
concerned companies by identifying and working close together with the people
responsible for the different energy domains inside the industry [67]. The project thus
acts as a central repository of knowledge for energy efficiency tools and techniques
which grows with each successful project, thus allowing companies to share the
Chapter 2 – Industrial Requirements and Trends
54
benefits of the research and feeding of each other’s successes without having to
reinvent the wheel.
This type of governmental intervention tends to be very effective, as it breaks through
the barriers of competition in order to provide benefits to companies and consumers
alike, a result which may be harder to accomplish through the use of financial or legal
incentives alone.
2.5.8. Ambient Monitoring
One promising research vector is the study of knowledge-based, ambient intelligent
monitoring systems. These systems aim to integrate communication technology into
varied sensors within a network in order to extract comprehensive information about
the different aspects of the environment’s evolution.
Typically, these systems depend on the availability of ubiquitous wireless
communication technologies within the monitored area. The selection of the correct
wireless technology is, however, not an easy one, as different technologies exhibit
completely orthogonal characteristics regarding important factors such as price,
performance, security, stability, scalability, mobility, among others.
The interesting nature of the problem has given rise to a few research projects with
somewhat overlapping goals, but with different problem areas. The FlexWARE [68]
and WASP [69] projects were started with the goal of looking at the different facets of
the software and hardware components required in order to implement smart
wireless sensors.
Complementing those results are projects like Ginseng [70] and AmiMOSES [71] which
are investigating the various sensor protocols and architectures which are fit for large-
scale deployment. These projects aim to tackle the practical issues raised by the
practical use of these technologies in actual production environments. They include
considerations like monitoring interactions between human operators and machines
or processes, as well as process-related measurements.
Chapter 2 – Industrial Requirements and Trends
55
Together, these projects paint a plausible picture of what monitoring systems could
look like in the near to medium term. Any developments on the domains of production
monitoring and energy efficiency would best take this in mind, so that any
recommendations for methodologies are compatible with the overall direction of the
research.
2.6. Research Direction
In the survey conducted here, the major requirements for supporting sustainable
research on energy efficiency in the production floor have been identified:
Accessible, ubiquitous communication framework
Flexible production monitoring system
Flexible production simulation system
Although at first these requirements may seem unrelated, together they form the
basis for an energy management framework which will provide production engineers
the necessary tools to design and manage more energy efficient production lines.
2.6.1. Communication Framework
Developing an energy management system which is not only flexible, but also in many
ways easy to update requires a solid base on which to build upon. A review of current
production trends points towards very promising research and even implementations
using service-oriented architectures. The SoA paradigm allows for ubiquitous
communication between systems crossing all levels of the enterprise architecture. The
concept of autonomous components with clearly specified high-level interfaces makes
them easily interchangeable and upgradeable. Moreover, the fact that the underlying
technologies for communication are all based on popular open standards makes
implementations straight-forward in most modern platforms.
Although there has been a lot of research activity surrounding SoA-based solutions for
industrial automation, there have been no proposals for SoA-based production devices
that bridge the virtual and real worlds using the exact same protocols and interfaces.
Such a solution would fit the production with a toolset which would allow the
Chapter 2 – Industrial Requirements and Trends
56
progressive development and test of devices as they are made available for the
production line.
The research here presented will therefore look at how existing SoA-based
frameworks can be used to build a complete production network and how it can be
then exploited to interact simultaneously and transparently between the real and
virtual worlds.
2.6.2. Production Simulation System
Production simulation systems are a common component in modern industrial
automation systems. These systems are used throughout the entire lifecycle of the
production line in order to test and optimise different parameters of the process.
These systems are, however, usually monolithic and built upon aging technologies
whose architectures make changes particularly challenging.
The advent of SoA-based production systems requires the development of production
simulation tools which can be easily adapted towards supporting not only the
interactions between service-based components, but also be flexible enough to
support easily testing different aspects of the simulation without making profound
changes to the framework. This work must explore the limits to which current
simulation packages can be extended to support the SoA paradigm in automation, and
study the requirements for going beyond what is possible with today’s tools in order
to support SoA-based simulation, up to and including designing the basic architecture
for a new simulation package.
2.6.3. Production Monitoring System
A central part to any production system is a monitoring system capable of feeding
various bits of data from the production floor up to the management execution
systems. Fortunately, most production systems nowadays feature some form of
monitoring built-in. These systems tend to be custom-purpose developments built to
the specific production scenario they support, and network protocol availability. The
data produced by these systems is then aggregated using custom-made bridges
Chapter 2 – Industrial Requirements and Trends
57
between the different network topologies, to make it available throughout the entire
enterprise network.
The advent of SoA-based communications in the production line brings with it the
opportunity to do away with the need to support and maintain various different
systems and network bridges, and concentrate on a more heterogeneous system
which is directly accessible to all the levels of concern. Given the novelty of the
proposed technologies, the basis for such a system must be well thought out before
any implementation is undertaken. These topics need to be thoroughly discussed and
possible issues and their solutions need to be identified.
Fortunately, the implementation of a new monitoring system does not necessarily
mean the wholesale replacement of the existing system. It is expected that any real-
life implementation of a modern production monitoring system would begin by setting
up a small number of devices in parallel networks, and gradually expanding it to
eventually cover the entire production floor. Throughout this process, the new
monitoring system would have time to mature and prove its reliability up to a point
where it could finally replace the old system while maintaining the same production
capabilities.
2.6.4. Energy Management
By bringing the above components together, it is possible to make a first attempt at
creating a tool to support energy management in the production scenario. The tool’s
architecture and implementation details should showcase the benefits of the
techniques previously identified, and solve the outstanding issues found in existing
systems. Finally, the tool should be used to demonstrate the benefits of the availability
of such a system to support the efforts towards improving energy efficiency in the
production line.
Chapter 3 – SoA-based Flexible Production Systems
58
Chapter 3. SoA-based Flexible Production Systems
3.1. SoA in Industrial Automation
Today’s modern factories are facing an increasing challenge: the products being
manufactured tend to have progressively shorter lifecycles, while being more often
updated. Compounding this problem is increased customization and versioning
requirements for those products.
Manufacturers have been facing these problems by standardizing on internal
components, or differentiating the products by inserting artificial limitations either by
removing functions in the control software, or by disabling hardware components [72].
While these techniques have been somewhat successful in managing different
concurrent versions of the same product on the same production lines, thereby
ensuring favourable economies of scale, they are in reality band-aids to the larger
problem of lack of flexibility in the production line.
A flexible production line is able to refactor itself in order to accommodate changes to
the production process while minimizing the time during which the production is
disrupted [73]. Ideally, a flexible production system would be able to hold different
production runs simultaneously, sharing the common resources between all
production processes.
Such a production line cannot exist with current centralized monolithical programming
techniques which are usually programmed in a system-dependent and sometimes
proprietary programming language and where a small change usually requires that the
whole production line is stopped for reprogramming and testing. Moreover, because
of the monolithical nature of the programming, one small change in one device can
impact the functioning in another device, making the system harder to debug.
The flexible production line requires, thus, modular devices which can be plugged into
the production line and participate in a network of devices which are then configured
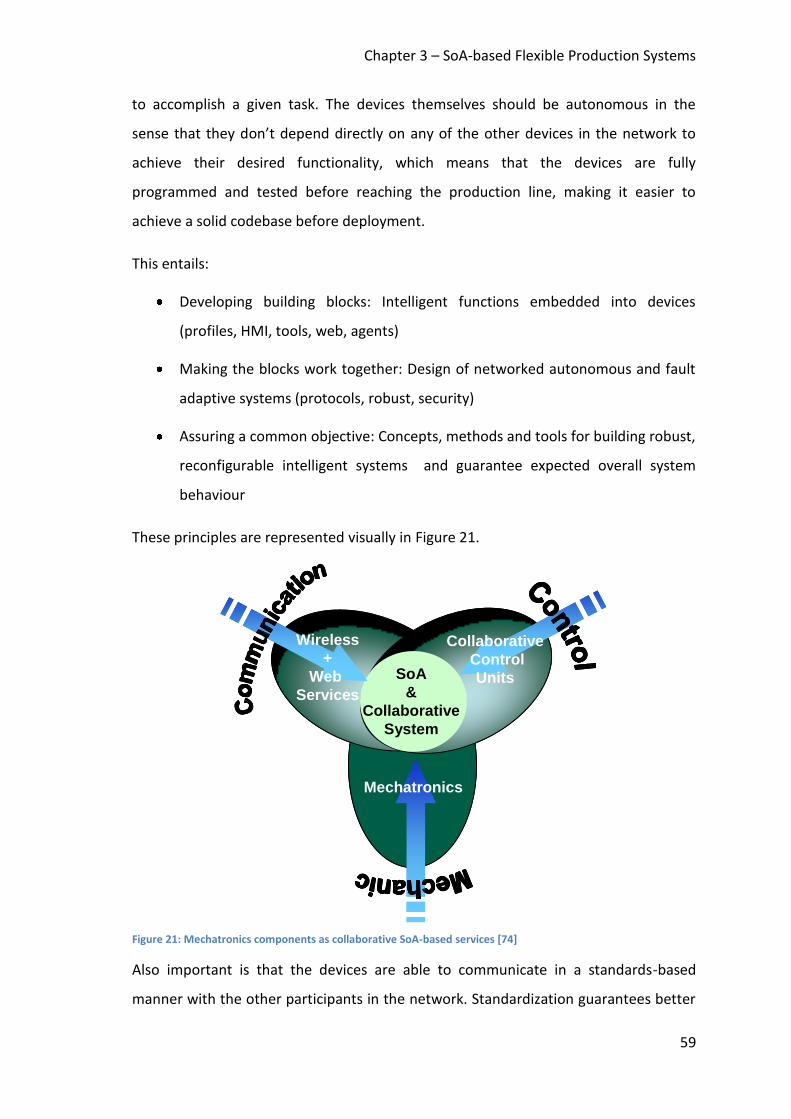
Chapter 3 – SoA-based Flexible Production Systems
59
to accomplish a given task. The devices themselves should be autonomous in the
sense that they don’t depend directly on any of the other devices in the network to
achieve their desired functionality, which means that the devices are fully
programmed and tested before reaching the production line, making it easier to
achieve a solid codebase before deployment.
This entails:
Developing building blocks: Intelligent functions embedded into devices
(profiles, HMI, tools, web, agents)
Making the blocks work together: Design of networked autonomous and fault
adaptive systems (protocols, robust, security)
Assuring a common objective: Concepts, methods and tools for building robust,
reconfigurable intelligent systems and guarantee expected overall system
behaviour
These principles are represented visually in Figure 21.
Figure 21: Mechatronics components as collaborative SoA-based services [74]
Also important is that the devices are able to communicate in a standards-based
manner with the other participants in the network. Standardization guarantees better
SoA
&
Collaborative
System
Collaborative
Control
Units
Wireless
+
Web
Services
Mechatronics
SoA
&
Collaborative
System
Collaborative
Control
Units
Wireless
+
Web
Services
Mechatronics
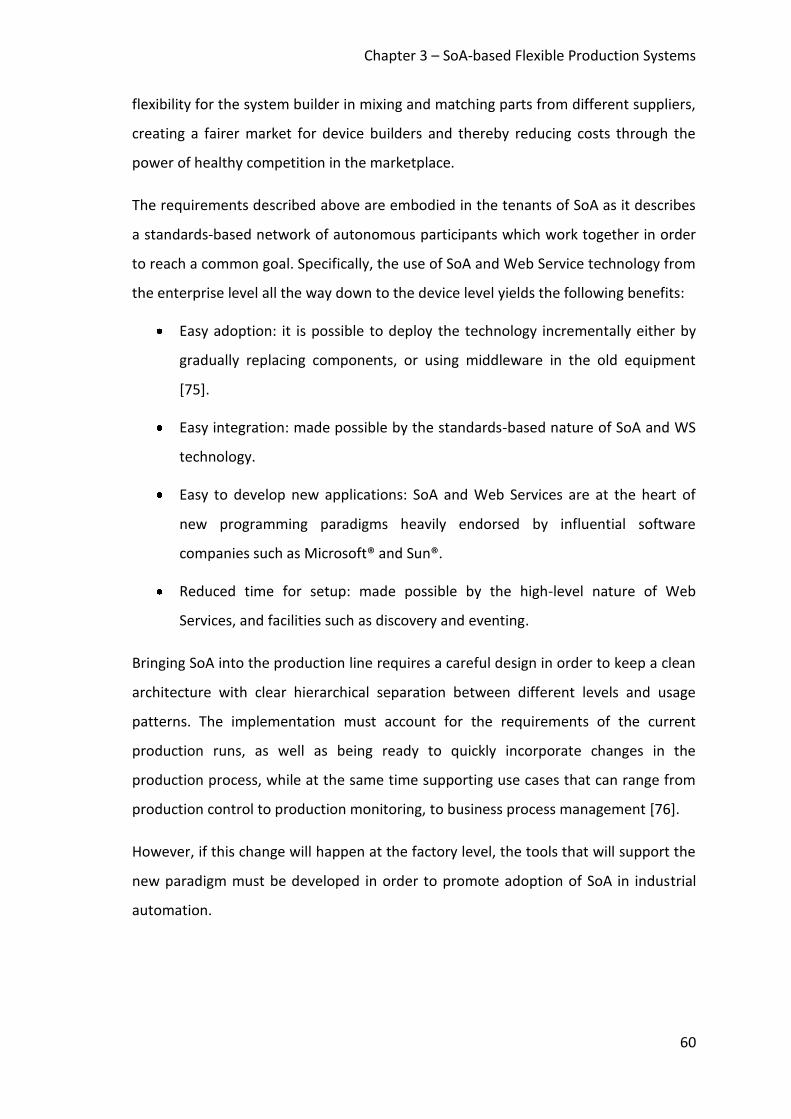
Chapter 3 – SoA-based Flexible Production Systems
60
flexibility for the system builder in mixing and matching parts from different suppliers,
creating a fairer market for device builders and thereby reducing costs through the
power of healthy competition in the marketplace.
The requirements described above are embodied in the tenants of SoA as it describes
a standards-based network of autonomous participants which work together in order
to reach a common goal. Specifically, the use of SoA and Web Service technology from
the enterprise level all the way down to the device level yields the following benefits:
Easy adoption: it is possible to deploy the technology incrementally either by
gradually replacing components, or using middleware in the old equipment
[75].
Easy integration: made possible by the standards-based nature of SoA and WS
technology.
Easy to develop new applications: SoA and Web Services are at the heart of
new programming paradigms heavily endorsed by influential software
companies such as Microsoft® and Sun®.
Reduced time for setup: made possible by the high-level nature of Web
Services, and facilities such as discovery and eventing.
Bringing SoA into the production line requires a careful design in order to keep a clean
architecture with clear hierarchical separation between different levels and usage
patterns. The implementation must account for the requirements of the current
production runs, as well as being ready to quickly incorporate changes in the
production process, while at the same time supporting use cases that can range from
production control to production monitoring, to business process management [76].
However, if this change will happen at the factory level, the tools that will support the
new paradigm must be developed in order to promote adoption of SoA in industrial
automation.
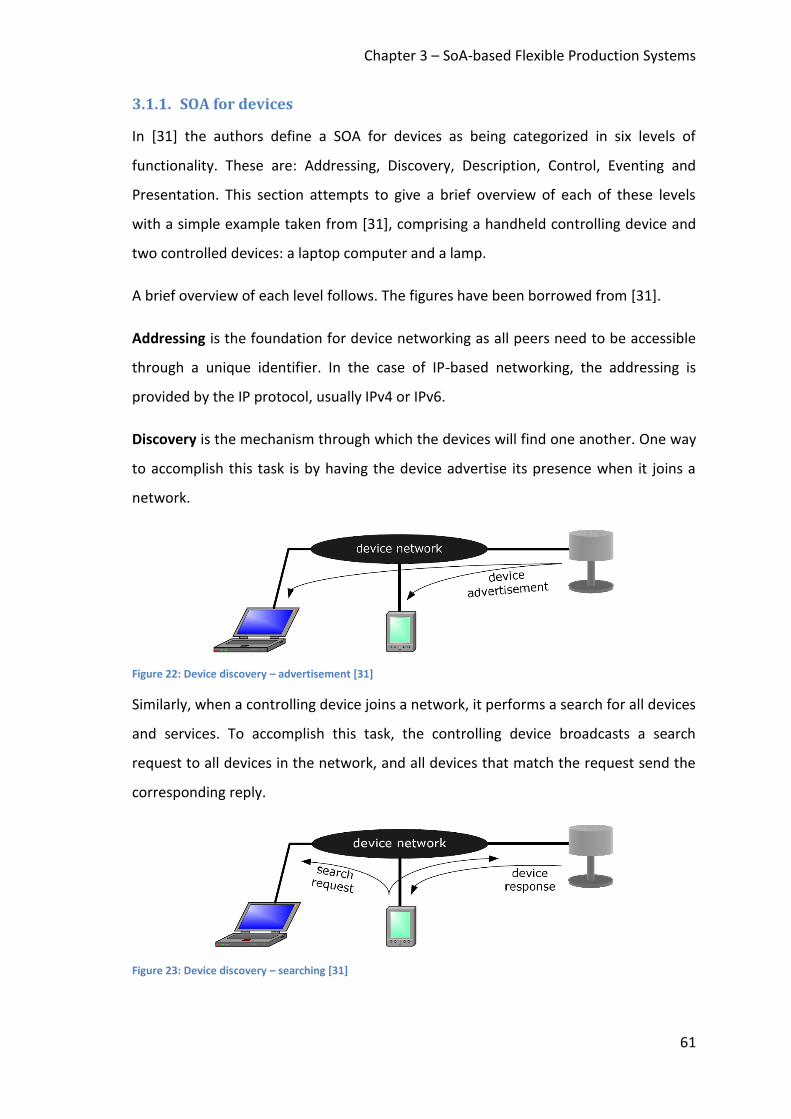
Chapter 3 – SoA-based Flexible Production Systems
61
3.1.1. SOA for devices
In [31] the authors define a SOA for devices as being categorized in six levels of
functionality. These are: Addressing, Discovery, Description, Control, Eventing and
Presentation. This section attempts to give a brief overview of each of these levels
with a simple example taken from [31], comprising a handheld controlling device and
two controlled devices: a laptop computer and a lamp.
A brief overview of each level follows. The figures have been borrowed from [31].
Addressing is the foundation for device networking as all peers need to be accessible
through a unique identifier. In the case of IP-based networking, the addressing is
provided by the IP protocol, usually IPv4 or IPv6.
Discovery is the mechanism through which the devices will find one another. One way
to accomplish this task is by having the device advertise its presence when it joins a
network.
Figure 22: Device discovery – advertisement [31]
Similarly, when a controlling device joins a network, it performs a search for all devices
and services. To accomplish this task, the controlling device broadcasts a search
request to all devices in the network, and all devices that match the request send the
corresponding reply.
Figure 23: Device discovery – searching [31]
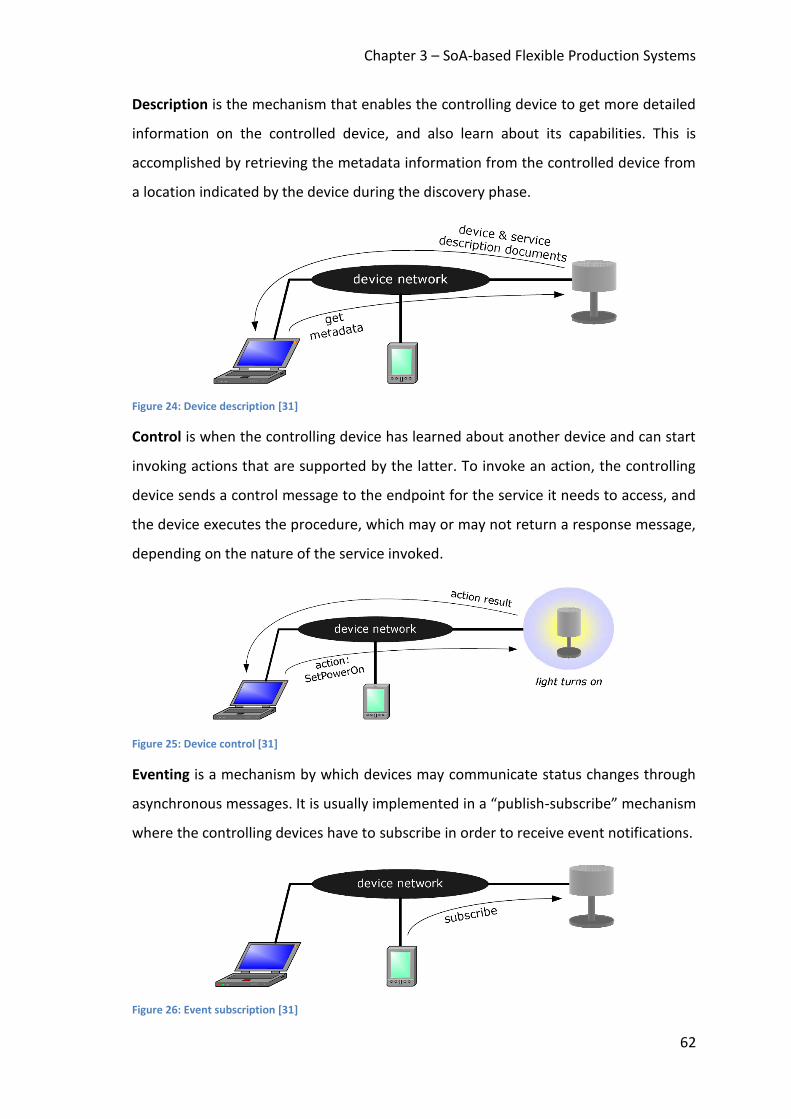
Chapter 3 – SoA-based Flexible Production Systems
62
Description is the mechanism that enables the controlling device to get more detailed
information on the controlled device, and also learn about its capabilities. This is
accomplished by retrieving the metadata information from the controlled device from
a location indicated by the device during the discovery phase.
Figure 24: Device description [31]
Control is when the controlling device has learned about another device and can start
invoking actions that are supported by the latter. To invoke an action, the controlling
device sends a control message to the endpoint for the service it needs to access, and
the device executes the procedure, which may or may not return a response message,
depending on the nature of the service invoked.
Figure 25: Device control [31]
Eventing is a mechanism by which devices may communicate status changes through
asynchronous messages. It is usually implemented in a “publish-subscribe” mechanism
where the controlling devices have to subscribe in order to receive event notifications.
Figure 26: Event subscription [31]
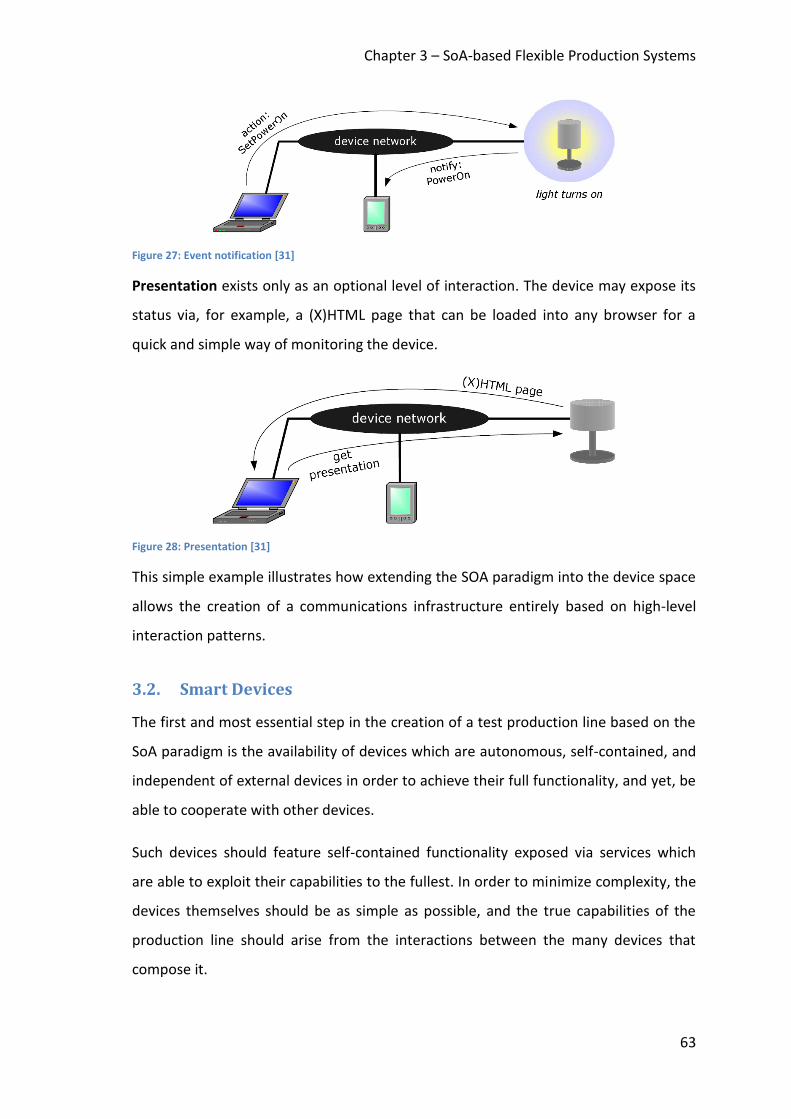
Chapter 3 – SoA-based Flexible Production Systems
63
Figure 27: Event notification [31]
Presentation exists only as an optional level of interaction. The device may expose its
status via, for example, a (X)HTML page that can be loaded into any browser for a
quick and simple way of monitoring the device.
Figure 28: Presentation [31]
This simple example illustrates how extending the SOA paradigm into the device space
allows the creation of a communications infrastructure entirely based on high-level
interaction patterns.
3.2. Smart Devices
The first and most essential step in the creation of a test production line based on the
SoA paradigm is the availability of devices which are autonomous, self-contained, and
independent of external devices in order to achieve their full functionality, and yet, be
able to cooperate with other devices.
Such devices should feature self-contained functionality exposed via services which
are able to exploit their capabilities to the fullest. In order to minimize complexity, the
devices themselves should be as simple as possible, and the true capabilities of the
production line should arise from the interactions between the many devices that
compose it.
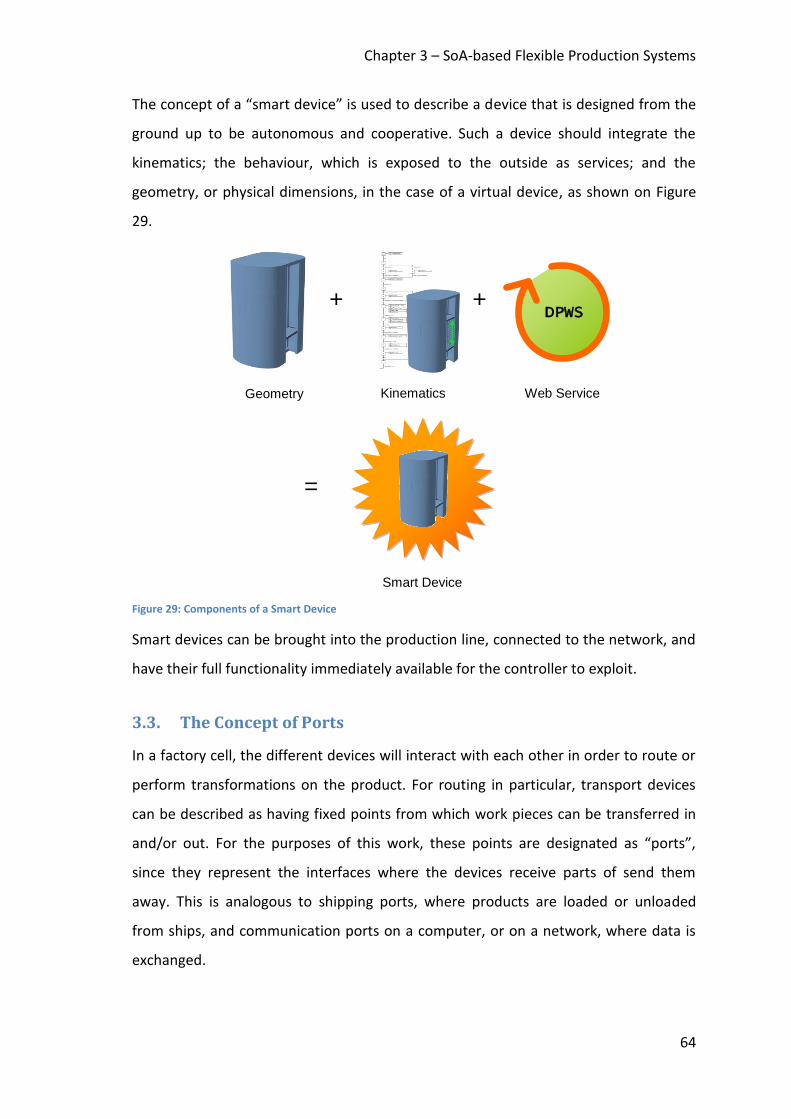
Chapter 3 – SoA-based Flexible Production Systems
64
The concept of a “smart device” is used to describe a device that is designed from the
ground up to be autonomous and cooperative. Such a device should integrate the
kinematics; the behaviour, which is exposed to the outside as services; and the
geometry, or physical dimensions, in the case of a virtual device, as shown on Figure
29.
Figure 29: Components of a Smart Device
Smart devices can be brought into the production line, connected to the network, and
have their full functionality immediately available for the controller to exploit.
3.3. The Concept of Ports
In a factory cell, the different devices will interact with each other in order to route or
perform transformations on the product. For routing in particular, transport devices
can be described as having fixed points from which work pieces can be transferred in
and/or out. For the purposes of this work, these points are designated as “ports”,
since they represent the interfaces where the devices receive parts of send them
away. This is analogous to shipping ports, where products are loaded or unloaded
from ships, and communication ports on a computer, or on a network, where data is
exchanged.
Geometry
Kinematics
+
+
Web Service
Smart Device
=
DPWS
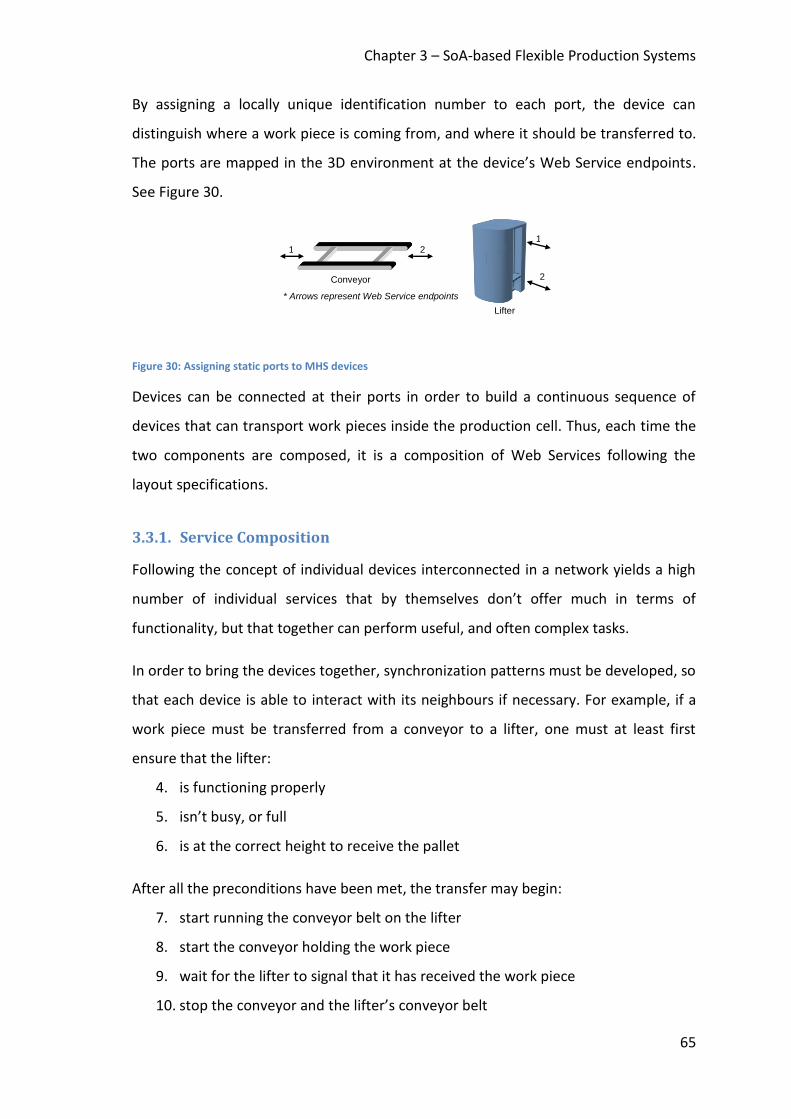
Chapter 3 – SoA-based Flexible Production Systems
65
By assigning a locally unique identification number to each port, the device can
distinguish where a work piece is coming from, and where it should be transferred to.
The ports are mapped in the 3D environment at the device’s Web Service endpoints.
See Figure 30.
Figure 30: Assigning static ports to MHS devices
Devices can be connected at their ports in order to build a continuous sequence of
devices that can transport work pieces inside the production cell. Thus, each time the
two components are composed, it is a composition of Web Services following the
layout specifications.
3.3.1. Service Composition
Following the concept of individual devices interconnected in a network yields a high
number of individual services that by themselves don’t offer much in terms of
functionality, but that together can perform useful, and often complex tasks.
In order to bring the devices together, synchronization patterns must be developed, so
that each device is able to interact with its neighbours if necessary. For example, if a
work piece must be transferred from a conveyor to a lifter, one must at least first
ensure that the lifter:
4. is functioning properly
5. isn’t busy, or full
6. is at the correct height to receive the pallet
After all the preconditions have been met, the transfer may begin:
7. start running the conveyor belt on the lifter
8. start the conveyor holding the work piece
9. wait for the lifter to signal that it has received the work piece
10. stop the conveyor and the lifter’s conveyor belt
Conveyor
2
1
2
1
Lifter
* Arrows represent Web Service endpoints
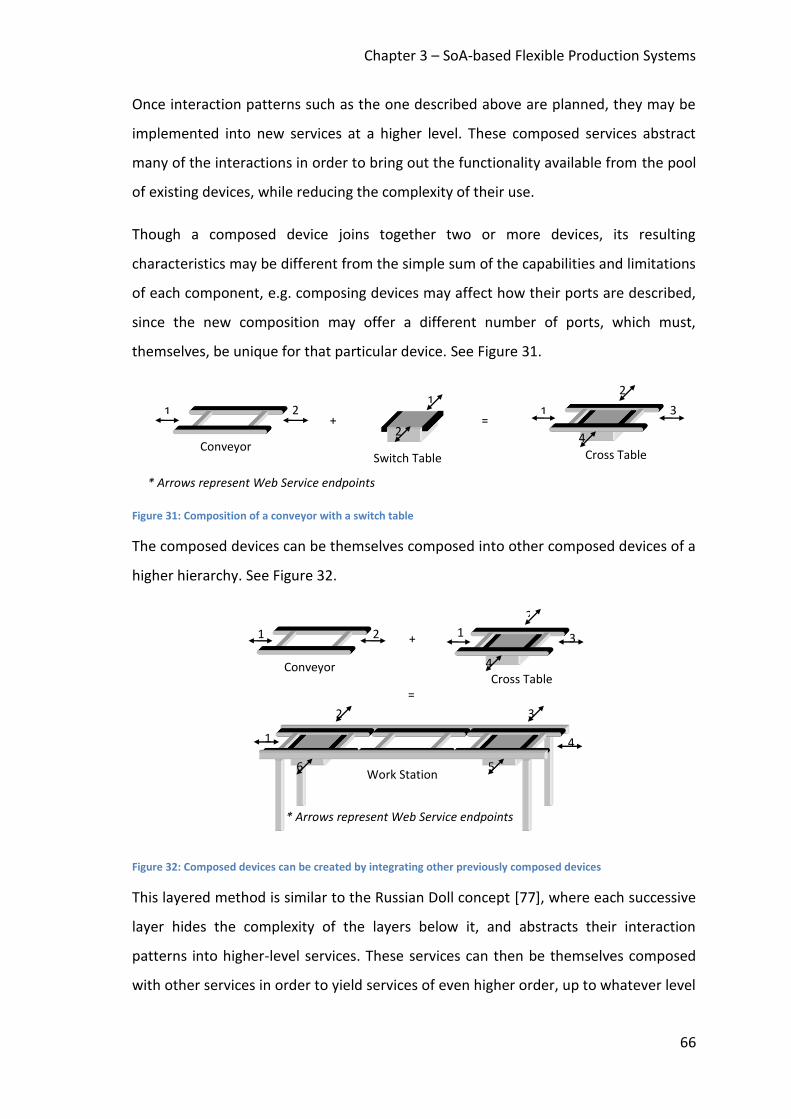
Chapter 3 – SoA-based Flexible Production Systems
66
Once interaction patterns such as the one described above are planned, they may be
implemented into new services at a higher level. These composed services abstract
many of the interactions in order to bring out the functionality available from the pool
of existing devices, while reducing the complexity of their use.
Though a composed device joins together two or more devices, its resulting
characteristics may be different from the simple sum of the capabilities and limitations
of each component, e.g. composing devices may affect how their ports are described,
since the new composition may offer a different number of ports, which must,
themselves, be unique for that particular device. See Figure 31.
Figure 31: Composition of a conveyor with a switch table
The composed devices can be themselves composed into other composed devices of a
higher hierarchy. See Figure 32.
Figure 32: Composed devices can be created by integrating other previously composed devices
This layered method is similar to the Russian Doll concept [77], where each successive
layer hides the complexity of the layers below it, and abstracts their interaction
patterns into higher-level services. These services can then be themselves composed
with other services in order to yield services of even higher order, up to whatever level
Conveyor
2 1
Switch Table
2
1
Cross Table
3
1
2
4
+
=
* Arrows represent Web Service endpoints
Cross Table
3
1
2
4
Conveyor
2 1
+
=
Work Station
1
4
2
3
5
6
* Arrows represent Web Service endpoints
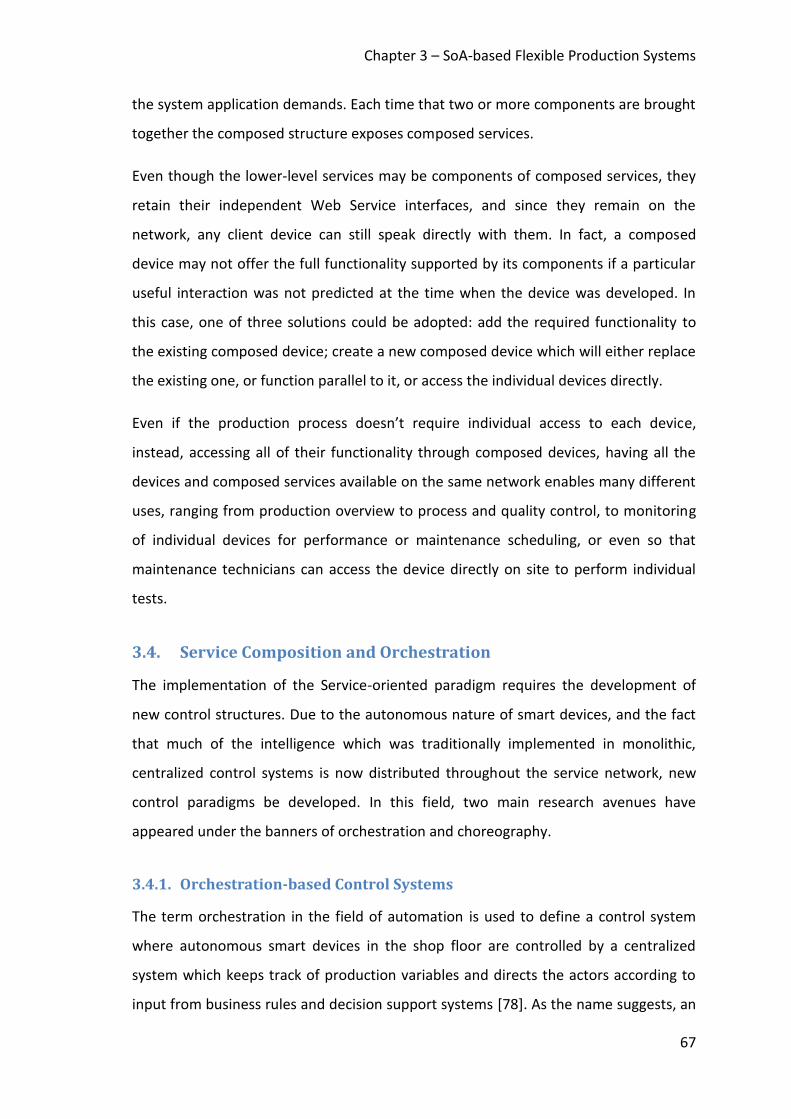
Chapter 3 – SoA-based Flexible Production Systems
67
the system application demands. Each time that two or more components are brought
together the composed structure exposes composed services.
Even though the lower-level services may be components of composed services, they
retain their independent Web Service interfaces, and since they remain on the
network, any client device can still speak directly with them. In fact, a composed
device may not offer the full functionality supported by its components if a particular
useful interaction was not predicted at the time when the device was developed. In
this case, one of three solutions could be adopted: add the required functionality to
the existing composed device; create a new composed device which will either replace
the existing one, or function parallel to it, or access the individual devices directly.
Even if the production process doesn’t require individual access to each device,
instead, accessing all of their functionality through composed devices, having all the
devices and composed services available on the same network enables many different
uses, ranging from production overview to process and quality control, to monitoring
of individual devices for performance or maintenance scheduling, or even so that
maintenance technicians can access the device directly on site to perform individual
tests.
3.4. Service Composition and Orchestration
The implementation of the Service-oriented paradigm requires the development of
new control structures. Due to the autonomous nature of smart devices, and the fact
that much of the intelligence which was traditionally implemented in monolithic,
centralized control systems is now distributed throughout the service network, new
control paradigms be developed. In this field, two main research avenues have
appeared under the banners of orchestration and choreography.
3.4.1. Orchestration-based Control Systems
The term orchestration in the field of automation is used to define a control system
where autonomous smart devices in the shop floor are controlled by a centralized
system which keeps track of production variables and directs the actors according to
input from business rules and decision support systems [78]. As the name suggests, an
Chapter 3 – SoA-based Flexible Production Systems
68
orchestration is defined by a set of services that work together in a predefined
sequence, just like various musicians in an orchestra follow a music sheet. The parallel
goes further to suggest that there is a central controller (maestro) that is able to
command musicians to perform a given part at a given moment. In the automation
world, the maestro would be known as an orchestration engine.
The advantage of using an orchestration engine versus a traditional central controller
is that it allows rethinking the tools used for designing production processes. This
clean approach is possible due to the abstraction of the communication and transport
protocols, as well as the high-level nature of the service interfaces. This ends the
process engineer’s dependence on complex programs that deal simultaneously with
the hardware interrupts, and the high-level business processes. Instead, programs can
be built using a variety of formal languages, e.g. Petri Nets which, being based in
mathematical constructs, are subject to formal validation and simulation of the
models [79] [29] [80].
By having the orchestration engine itself offer a service interface, several smaller-
purpose controllers can be implemented for sections of the production line and be
themselves integrated by higher-level orchestrators. This creates a multi-layered
“Russian doll” approach where the first layer controls the hardware directly, while
those on top of it become increasingly higher-level, while limiting the complexity in
each [78].
3.4.2. Choreography-based Control Systems
Choreography is a term which is usually employed in factory automation to describe
systems where, at least at a certain level, there is no centralized control, e.g. multi-
agent systems. In a choreographed production system, devices are usually fitted with
some amount of intelligence which enables them to negotiate directly with their peers
on production in order to follow the business rules which dictate the objectives of
production.
The advantage of a choreography-based control system is that production bottlenecks
and priorities can be handled in real-time, as devices generate automatically small
Chapter 3 – SoA-based Flexible Production Systems
69
control procedures for the parts being produced. This process results in an emergent
behaviour, since the sequences of actions haven’t been specifically programmed.
Emergent behaviour can be a double-edged sword, though, since it can also be hard to
debug when an unwanted or inefficient behaviour crops up.
In addition, having the machines function in a decoupled environment means that
adding, removing or replacing machines is easier, since there are no direct
dependencies between devices. Even changes to the process require only changes to
its configuration, and if those changes are supported by the machines, the production
line can remain untouched while the changes are implemented.

Chapter 4 – Enabling Technologies for SoA-based Production Systems
70
Chapter 4. Enabling Technologies for SoA-based Production Systems
The development of SoA-based production systems depends on existing state-of-the-
art tools and technologies. This section lists some of the ones which were considered
most important to perform the work described in this document.
4.1. Software
4.1.1. OPC
OPC stands for OLE for Process Control and is maintained by the OPC Foundation,
composed of over 300 members from around the world and including nearly all of the
world's major providers of control systems, instrumentation, and process control
systems. The protocol is summarized as [81]:
A standard mechanism for communicating to numerous data sources, either devices on the factory floor, or a database in a control room is the motivation for OPC.
Thus OPC fills a need in automation the same way printer drivers did for windows, by
abstracting the communication between different devices within a network,
eliminating the need for each device to have drivers in order to communicate with the
other members of the network [82].
Figure 33: Different applications working with many OPC servers
This is achieved through a collection of standard specifications that account for
different deployment scenarios. These are some of the specifications:
OPC Server “B”
OPC Server “A”
OPC Server “C”
Application “X”
Application “Z”
…
OPC Interface
OPC Interface
Chapter 4 – Enabling Technologies for SoA-based Production Systems
71
OPC Data Access: Provides reading and writing primitives for accessing values
within devices
OPC Alarm and Events: Provides mechanisms for OPC clients to be notified of
specified alarms and events
OPC Historical Data Access: Data storage for analysis purposes
OPC XML Data Access: Equivalent to OPC DA, with the exception that the
communication medium is through XML and Web services
OPC DA
OPC Data Access (OPC DA) specifies an open communication mechanism to access
variables in a device, providing the baseline functionality for reading and writing data
from various networked devices via a standard set of interfaces made available
through the Microsoft’s Component Object Model (COM) communication package.
The interfaces facilitate the interoperability between clients and servers discovering
one another and communicating each other’s set of capabilities [83].
The primary intent of OPC Data Access is to provide the interfaces for data acquisition
in support of the vertical architecture (serve data from a device to a client application
on a higher level computer).
Different vendors may provide OPC Servers. Vendor supplied code determines the
devices and data to which each server has access, the data names, and the details
about how the server physically accesses that data.
OPC XML-DA
The OPC Foundation has defined interfaces to Data Access Servers, Event Servers,
Batch Servers, and History Data Access Servers. These servers have information that is
currently being provided via OLE/COM based interfaces [84].
XML and XML-based schema languages provide another means to describe and
exchange structured information between collaborating applications, and it is more
readily available across a wide range of platforms. OPC XML-Data Access (OPC XML-
Chapter 4 – Enabling Technologies for SoA-based Production Systems
72
DA) is the OPC Foundation’s adoption of the XML set of technologies to facilitate the
exchange of plant data across the internet, and upwards into the enterprise domain.
In order to accomplish this, OPC XML-DA leverages the use of SOAP envelopes to
exchange information at its interfaces made available through the use of Web
services. XML-DA servers may stand alone, or may be developed to wrap COM based
servers. Because of this, XML-DA Web services only allow the standard methods
equivalent to those found in OPC DA, and thus, are not as descriptive as the Web
services envisioned by the principles behind SOA.
Currently, OPC has not defined a mechanism to detect other neighbouring OPC-XML-
DA Servers. The UDDI protocol is a widely used standard for Web services and it will be
the likely basis for any future OPC specification for Web service discovery. Until then,
an OPC-XML-DA client needs to know the URL of any OPC-XML-DA server it wants to
use.
4.1.2. gSOAP
gSOAP is a mature and fast open source Web services development toolkit that
facilitates development of Web services in C/C++ by offering both XML to C/C++ as
well as C/C++ to XML language bindings. It supports many platforms, including
embedded systems [85].
By using these bindings, SOAP/XML interoperability is achieved with a simple API
relieving the user from the burden of WSDL and SOAP details, thus enabling him or her
to concentrate on the application-essential logic, and thus, being freed from worrying
about the internals of Web service functionality. The end result is a self-contained, full-
featured Web service implementation that is both lightweight and portable.
The toolkit is available in a number of different licenses, including one for commercial
use, which should enable its use in many different contexts.
4.1.3. DPWS
The Devices Profile for Web Services specification (DPWS) defines a minimal set of
implementation constraints to enable secure Web Service messaging, discovery,
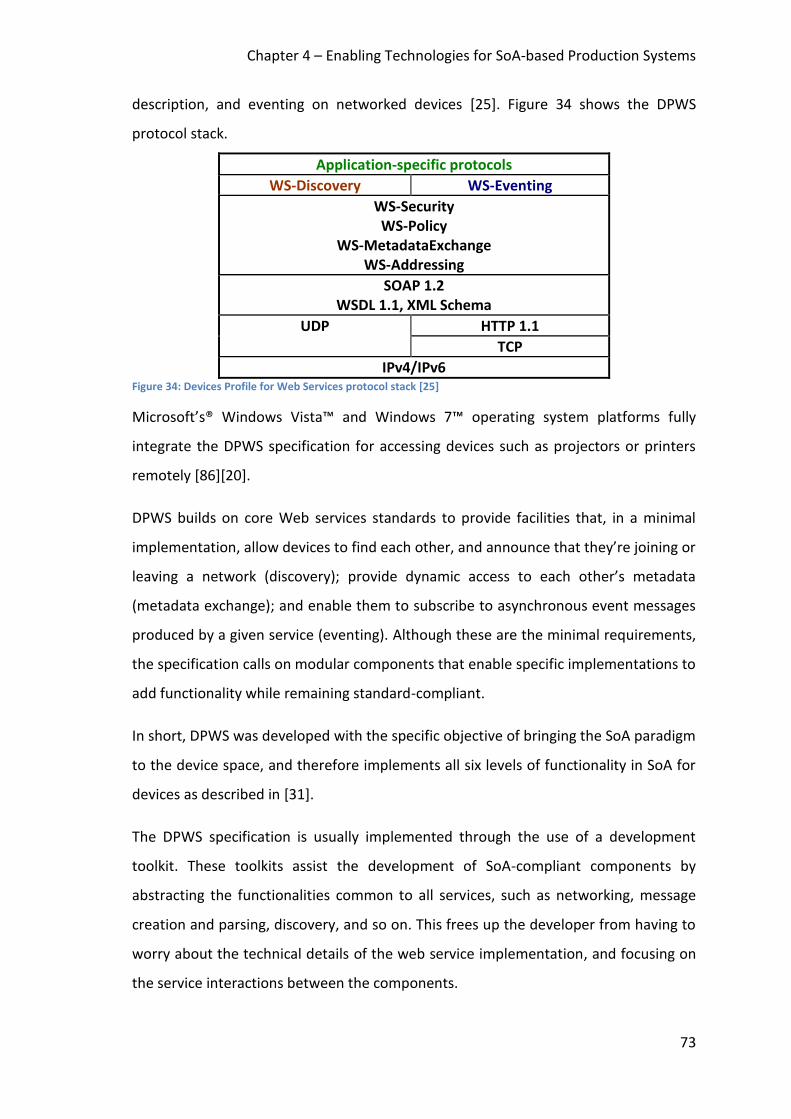
Chapter 4 – Enabling Technologies for SoA-based Production Systems
73
description, and eventing on networked devices [25]. Figure 34 shows the DPWS
protocol stack.
Application-specific protocols
WS-Discovery WS-Eventing
WS-Security WS-Policy
WS-MetadataExchange WS-Addressing
SOAP 1.2 WSDL 1.1, XML Schema
UDP HTTP 1.1
TCP
IPv4/IPv6 Figure 34: Devices Profile for Web Services protocol stack [25]
Microsoft’s® Windows Vista™ and Windows 7™ operating system platforms fully
integrate the DPWS specification for accessing devices such as projectors or printers
remotely [86][20].
DPWS builds on core Web services standards to provide facilities that, in a minimal
implementation, allow devices to find each other, and announce that they’re joining or
leaving a network (discovery); provide dynamic access to each other’s metadata
(metadata exchange); and enable them to subscribe to asynchronous event messages
produced by a given service (eventing). Although these are the minimal requirements,
the specification calls on modular components that enable specific implementations to
add functionality while remaining standard-compliant.
In short, DPWS was developed with the specific objective of bringing the SoA paradigm
to the device space, and therefore implements all six levels of functionality in SoA for
devices as described in [31].
The DPWS specification is usually implemented through the use of a development
toolkit. These toolkits assist the development of SoA-compliant components by
abstracting the functionalities common to all services, such as networking, message
creation and parsing, discovery, and so on. This frees up the developer from having to
worry about the technical details of the web service implementation, and focusing on
the service interactions between the components.
Chapter 4 – Enabling Technologies for SoA-based Production Systems
74
The toolkit used in the work described in this document is an open-source
implementation [60] of the DPWS specification that was originally developed at
Schneider Electric® by building DPWS-specific extensions on top of the open-source
gSOAP toolkit [85]. By exploiting a mature codebase, the DPWS toolkit inherits some of
its benefits such as efficiency, portability and ease of use. These qualities have been
demonstrated in [25] where early performance measurements were very promising,
while still leaving room for improvement.
4.1.4. Enabling Applications
There are many different commercially available virtual engineering tools and
associated 3D simulation environments. For the purposes of this study, Delmia
Automation™ was used.
Delmia Automation™ is a powerful solution for control engineering and automation
lifecycle management which features a 3D environment where virtual equipment can
be modelled and controlled [87]. Furthermore, it is part of the 3D PLM suite from
Dassault Systèmes® which supports the product lifecycle from product design to
planning and realisation.
The Delmia™ platform enables programming of various Programmable Logic
Controllers (PLC), and validation of that logic against a virtual machine, a cell, or an
entire line, all within a simulated environment, thus helping to cut ramp-up time
significantly by evaluating PLC program changes on the virtual equipment instead of
taking risks on real hardware, which can be both costly and time-consuming. Also, the
availability of such an environment, when coupled with the previously described tools
for enabling WS technology in devices, supports the study and simulation of the
interactions between devices in SoA-based systems.
In addition, the platform supports implementation of the control logic for the virtual
components to be based on outside control libraries, allowing for more complex
interactions, such as Web service-enabled devices.
Chapter 4 – Enabling Technologies for SoA-based Production Systems
75
4.2. Hardware
Given that most of the work presented here has been performed in virtual
environments, the study of hardware components falls outside of the scope of this
research. Still, in order to show the positioning of the research in the industry, a few
enabling commercial products are presented in this section.
4.2.1. Industrial PLCs
Industrial PLCs are the controllers for individual devices, or in some cases, small groups
of devices. PLCs are usually where any and all the computing power from a given
machine is stored, and are, for that reason, where the interface between the machine
and the rest of the production network is made. The PLC is exceedingly important to
this research as it is the component with which the smart device implementation
would communicate with, and in the future, where that intelligence would be directly
integrated.
Schneider Electric® has made some research and development efforts in integrating
SoA-based interfaces into the Advantys® STB™ line of PLCs [88]. Though most efforts in
this area are currently available only in prototype form, they are a positive sign of
industrial acceptance of SoA-based production systems.
4.2.2. Energy Meters
Energy Meters are at the heart of the energy efficient industrial automation, for a
reliable monitoring system is essential to the optimization efforts. Energy meters come
in all shapes and sizes, from portable devices which can be attached to any power
source for later reading, to permanent installations which in some cases are able to
report on energy usage in real-time, such as the industry standard Itron™ ACE SL7000®
[89], or Schneider Electric’s® PowerLogic™ power and energy meters [90], where
research is being done on bringing SoA-based connectivity to the market.
Chapter 5 – SoA-based Production Systems Using Smart Devices
76
Chapter 5. SoA-based Production Systems Using Smart Devices
The work described here describes in detail the implementation of virtual Smart
Devices which feature Web Service interfaces and are capable of interaction in a SoA-
based virtual/real production network. The development of virtual Smart Devices
allows them to be used for demonstration, testing and verification of production line
layout, control logic, and other related development activities.
This chapter walks through the implementation of a Smart Device from start to finish,
using an industrial clamp as an example. The example is built using Delmia
Automation™ as the simulation environment, and the DPWS toolkit for the
implementation of the SoA-based functionality.
5.1. SoA-based Production Simulation
Current simulation systems tend to be complex, monolithic software packages. The
very nature of the software makes it difficult to make changes, or to greatly benefit
from code reuse when adding new features and functionality. It is believed that the
traditional simulation systems must be re-engineered with agility and extensibility in
mind, by basing the simulation system in a strong framework with simple rules and
interaction patterns, and delegating complex functionality to external, autonomous
participants.
The SoA paradigm fits these requirements like a glove. By implementing a SoA-based
communication network as our simulation framework, the remaining simulation
components can be then implemented as Virtual Smart Devices with all of the benefits
that those have, e.g., autonomy, extensibility, reusability, etc. In this scenario it is
feasible that the underlying framework could remain virtually unchanged over time,
even in the face of fundamental changes to the simulation software such as the
example of adding a completely new set of energy indexes to an existing simulation
system.

Chapter 5 – SoA-based Production Systems Using Smart Devices
77
Other aspects of the SoA paradigm, such as the plug-and-play nature of the devices
are also a powerful argument for SoA-based simulation systems. The fact that the
production engineer is able to quickly create and test a production cell in his computer
is a major advantage when trying out ideas both before and after deployment of the
production system. Furthermore, by using service composition, those cells can be
connected to each other, thereby abstracting the complexity of the complete virtual
production line without sacrificing the simulation complexity inside those cells. This
way, given a pre-existing agreement on the communication interface, a team of
engineers can develop each individual cell in parallel without worrying about their
neighbour's implementation. As those cells are finished, they can be integrated into
the factory simulation system as black boxes with clearly defined interfaces.
5.2. Implementing a Virtual Smart Device
The implementation of a virtual Smart Device begins with the geometry of the model
being implemented. It is important that the geometry has accurate dimensions, so that
the connections to the other devices can be properly simulated. Our example uses an
industrial clamp model retried from a library. The smart clamp model, which can be
seen in Figure 35, is relatively simple, comprising the physical representation of the
clamp, as well as the joint which allows for the movement of the clamp’s gripper.
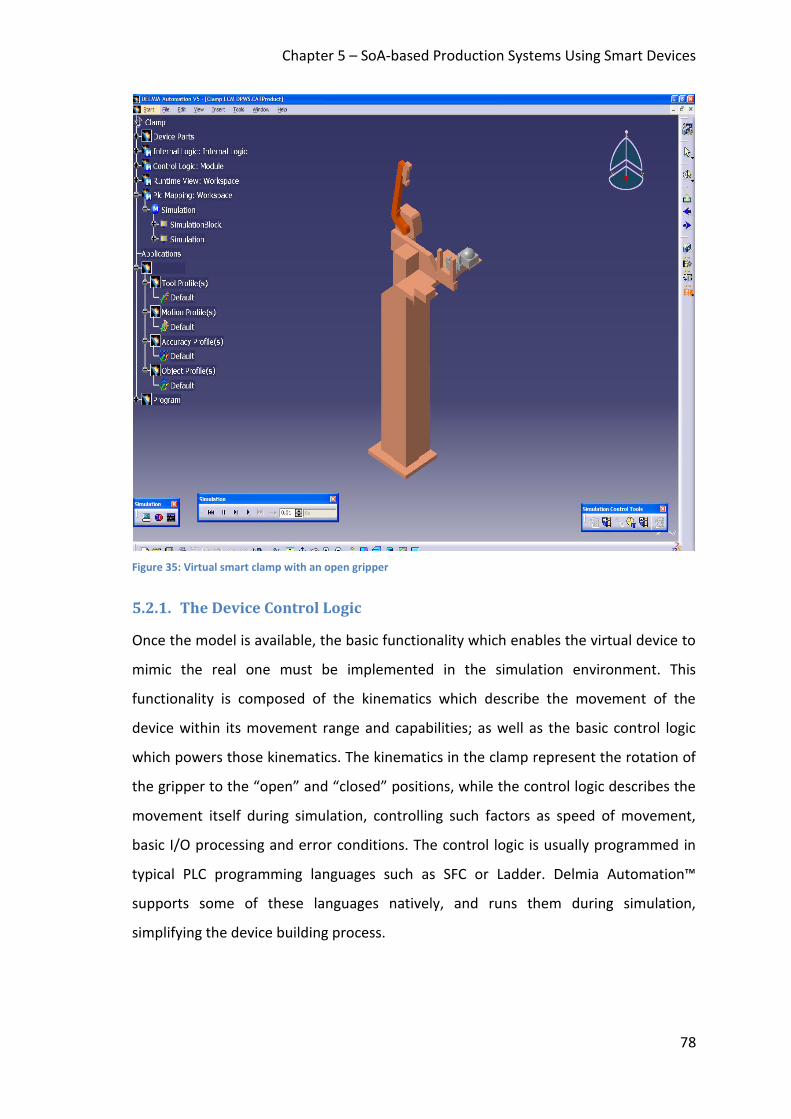
Chapter 5 – SoA-based Production Systems Using Smart Devices
78
Figure 35: Virtual smart clamp with an open gripper
5.2.1. The Device Control Logic
Once the model is available, the basic functionality which enables the virtual device to
mimic the real one must be implemented in the simulation environment. This
functionality is composed of the kinematics which describe the movement of the
device within its movement range and capabilities; as well as the basic control logic
which powers those kinematics. The kinematics in the clamp represent the rotation of
the gripper to the “open” and “closed” positions, while the control logic describes the
movement itself during simulation, controlling such factors as speed of movement,
basic I/O processing and error conditions. The control logic is usually programmed in
typical PLC programming languages such as SFC or Ladder. Delmia Automation™
supports some of these languages natively, and runs them during simulation,
simplifying the device building process.
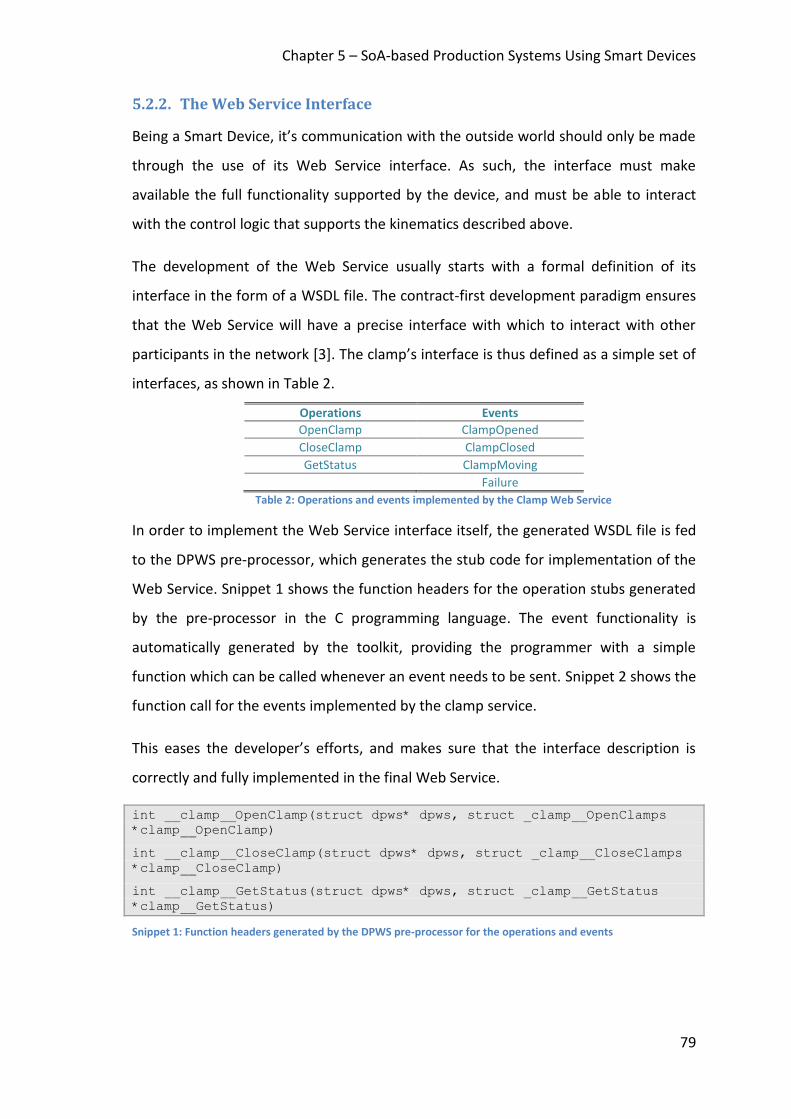
Chapter 5 – SoA-based Production Systems Using Smart Devices
79
5.2.2. The Web Service Interface
Being a Smart Device, it’s communication with the outside world should only be made
through the use of its Web Service interface. As such, the interface must make
available the full functionality supported by the device, and must be able to interact
with the control logic that supports the kinematics described above.
The development of the Web Service usually starts with a formal definition of its
interface in the form of a WSDL file. The contract-first development paradigm ensures
that the Web Service will have a precise interface with which to interact with other
participants in the network [3]. The clamp’s interface is thus defined as a simple set of
interfaces, as shown in Table 2.
Operations Events
OpenClamp ClampOpened
CloseClamp ClampClosed
GetStatus ClampMoving
Failure
Table 2: Operations and events implemented by the Clamp Web Service
In order to implement the Web Service interface itself, the generated WSDL file is fed
to the DPWS pre-processor, which generates the stub code for implementation of the
Web Service. Snippet 1 shows the function headers for the operation stubs generated
by the pre-processor in the C programming language. The event functionality is
automatically generated by the toolkit, providing the programmer with a simple
function which can be called whenever an event needs to be sent. Snippet 2 shows the
function call for the events implemented by the clamp service.
This eases the developer’s efforts, and makes sure that the interface description is
correctly and fully implemented in the final Web Service.
int __clamp__OpenClamp(struct dpws* dpws, struct _clamp__OpenClamps
*clamp__OpenClamp)
int __clamp__CloseClamp(struct dpws* dpws, struct _clamp__CloseClamps
*clamp__CloseClamp)
int __clamp__GetStatus(struct dpws* dpws, struct _clamp__GetStatus
*clamp__GetStatus)
Snippet 1: Function headers generated by the DPWS pre-processor for the operations and events
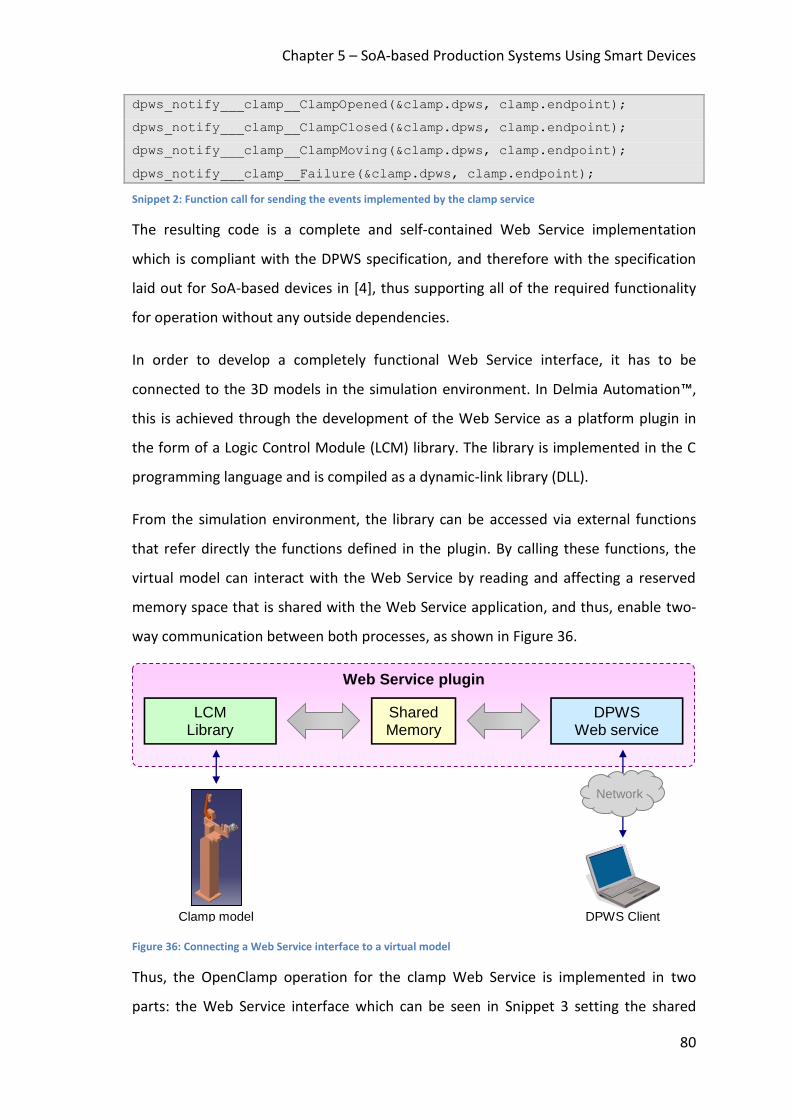
Chapter 5 – SoA-based Production Systems Using Smart Devices
80
dpws_notify___clamp__ClampOpened(&clamp.dpws, clamp.endpoint);
dpws_notify___clamp__ClampClosed(&clamp.dpws, clamp.endpoint);
dpws_notify___clamp__ClampMoving(&clamp.dpws, clamp.endpoint);
dpws_notify___clamp__Failure(&clamp.dpws, clamp.endpoint);
Snippet 2: Function call for sending the events implemented by the clamp service
The resulting code is a complete and self-contained Web Service implementation
which is compliant with the DPWS specification, and therefore with the specification
laid out for SoA-based devices in [4], thus supporting all of the required functionality
for operation without any outside dependencies.
In order to develop a completely functional Web Service interface, it has to be
connected to the 3D models in the simulation environment. In Delmia Automation™,
this is achieved through the development of the Web Service as a platform plugin in
the form of a Logic Control Module (LCM) library. The library is implemented in the C
programming language and is compiled as a dynamic-link library (DLL).
From the simulation environment, the library can be accessed via external functions
that refer directly the functions defined in the plugin. By calling these functions, the
virtual model can interact with the Web Service by reading and affecting a reserved
memory space that is shared with the Web Service application, and thus, enable two-
way communication between both processes, as shown in Figure 36.
Figure 36: Connecting a Web Service interface to a virtual model
Thus, the OpenClamp operation for the clamp Web Service is implemented in two
parts: the Web Service interface which can be seen in Snippet 3 setting the shared
Web Service plugin
Shared Memory
DPWS Web service
LCM Library
Clamp model
DPWS Client
Network
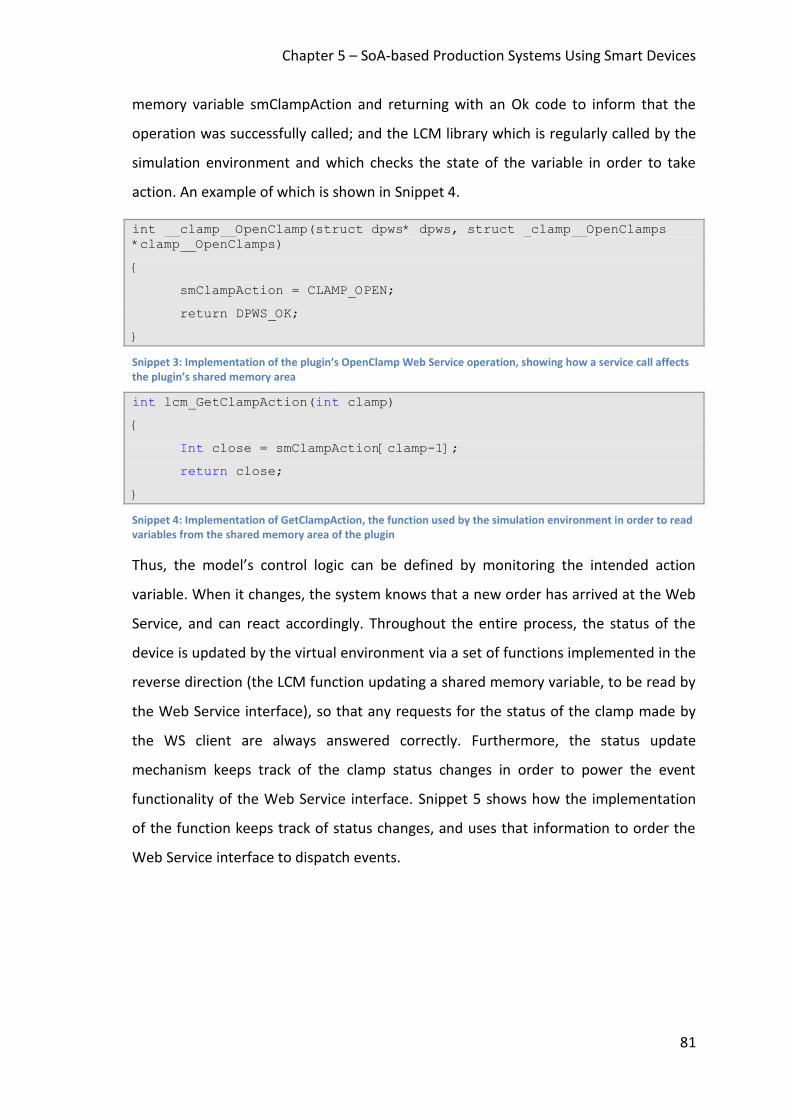
Chapter 5 – SoA-based Production Systems Using Smart Devices
81
memory variable smClampAction and returning with an Ok code to inform that the
operation was successfully called; and the LCM library which is regularly called by the
simulation environment and which checks the state of the variable in order to take
action. An example of which is shown in Snippet 4.
int __clamp__OpenClamp(struct dpws* dpws, struct _clamp__OpenClamps
*clamp__OpenClamps)
{
smClampAction = CLAMP_OPEN;
return DPWS_OK;
}
Snippet 3: Implementation of the plugin’s OpenClamp Web Service operation, showing how a service call affects the plugin’s shared memory area
int lcm_GetClampAction(int clamp)
{
Int close = smClampAction[clamp-1];
return close;
}
Snippet 4: Implementation of GetClampAction, the function used by the simulation environment in order to read variables from the shared memory area of the plugin
Thus, the model’s control logic can be defined by monitoring the intended action
variable. When it changes, the system knows that a new order has arrived at the Web
Service, and can react accordingly. Throughout the entire process, the status of the
device is updated by the virtual environment via a set of functions implemented in the
reverse direction (the LCM function updating a shared memory variable, to be read by
the Web Service interface), so that any requests for the status of the clamp made by
the WS client are always answered correctly. Furthermore, the status update
mechanism keeps track of the clamp status changes in order to power the event
functionality of the Web Service interface. Snippet 5 shows how the implementation
of the function keeps track of status changes, and uses that information to order the
Web Service interface to dispatch events.
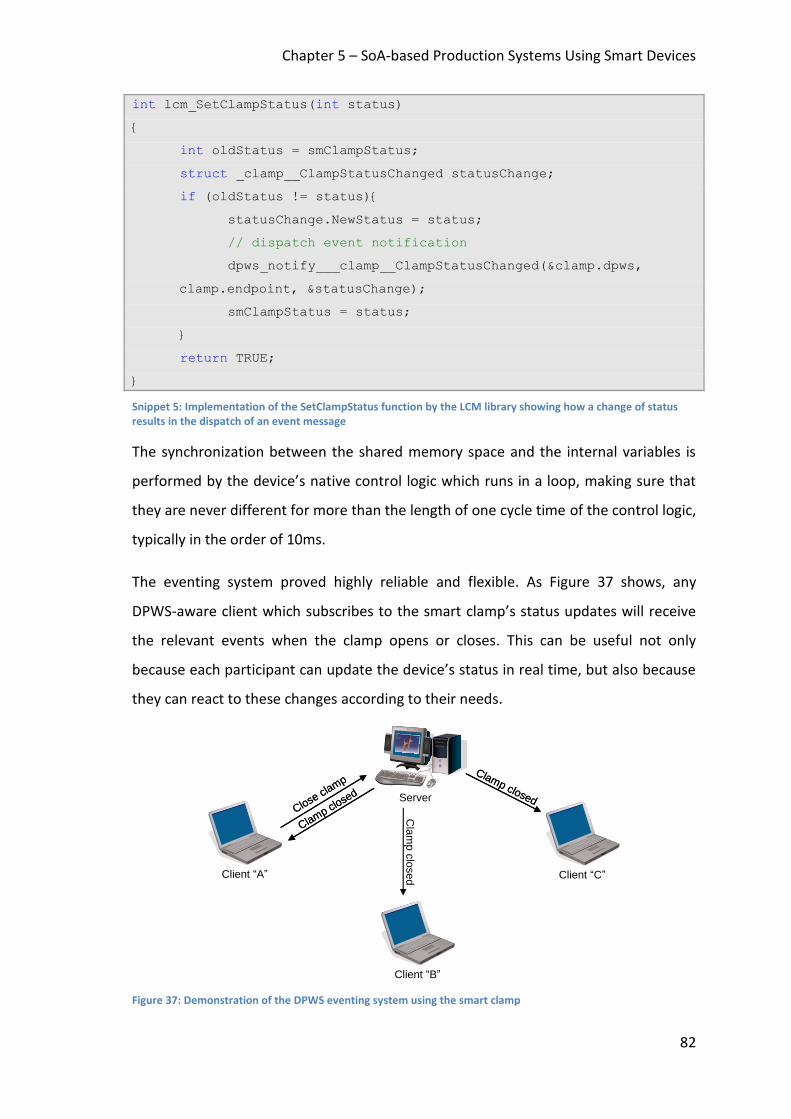
Chapter 5 – SoA-based Production Systems Using Smart Devices
82
int lcm_SetClampStatus(int status)
{
int oldStatus = smClampStatus;
struct _clamp__ClampStatusChanged statusChange;
if (oldStatus != status){
statusChange.NewStatus = status;
// dispatch event notification
dpws_notify___clamp__ClampStatusChanged(&clamp.dpws,
clamp.endpoint, &statusChange);
smClampStatus = status;
}
return TRUE;
}
Snippet 5: Implementation of the SetClampStatus function by the LCM library showing how a change of status results in the dispatch of an event message
The synchronization between the shared memory space and the internal variables is
performed by the device’s native control logic which runs in a loop, making sure that
they are never different for more than the length of one cycle time of the control logic,
typically in the order of 10ms.
The eventing system proved highly reliable and flexible. As Figure 37 shows, any
DPWS-aware client which subscribes to the smart clamp’s status updates will receive
the relevant events when the clamp opens or closes. This can be useful not only
because each participant can update the device’s status in real time, but also because
they can react to these changes according to their needs.
Figure 37: Demonstration of the DPWS eventing system using the smart clamp
Client “A”
Close clamp
Close clamp
Server
Clamp closed
Clamp closed
Cla
mp c
losed
Clamp closed
Clamp closed
Client “B”
Client “C”
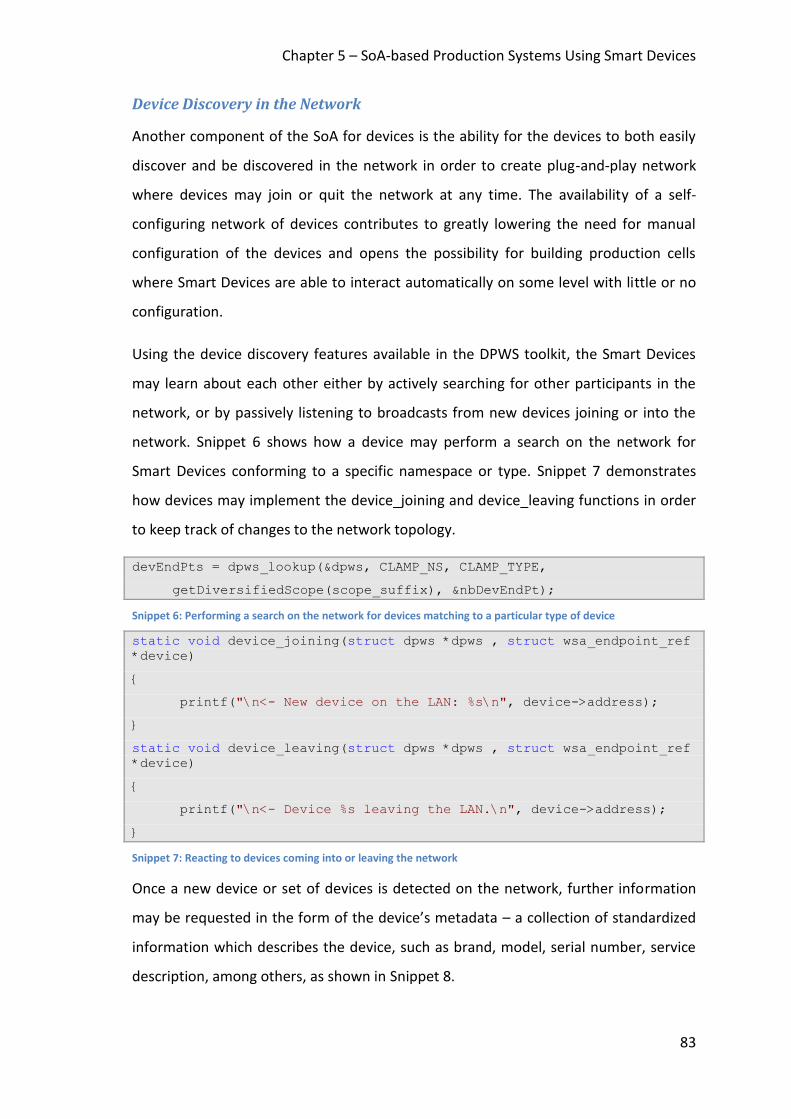
Chapter 5 – SoA-based Production Systems Using Smart Devices
83
Device Discovery in the Network
Another component of the SoA for devices is the ability for the devices to both easily
discover and be discovered in the network in order to create plug-and-play network
where devices may join or quit the network at any time. The availability of a self-
configuring network of devices contributes to greatly lowering the need for manual
configuration of the devices and opens the possibility for building production cells
where Smart Devices are able to interact automatically on some level with little or no
configuration.
Using the device discovery features available in the DPWS toolkit, the Smart Devices
may learn about each other either by actively searching for other participants in the
network, or by passively listening to broadcasts from new devices joining or into the
network. Snippet 6 shows how a device may perform a search on the network for
Smart Devices conforming to a specific namespace or type. Snippet 7 demonstrates
how devices may implement the device_joining and device_leaving functions in order
to keep track of changes to the network topology.
devEndPts = dpws_lookup(&dpws, CLAMP_NS, CLAMP_TYPE,
getDiversifiedScope(scope_suffix), &nbDevEndPt);
Snippet 6: Performing a search on the network for devices matching to a particular type of device
static void device_joining(struct dpws *dpws , struct wsa_endpoint_ref
*device)
{
printf("\n<- New device on the LAN: %s\n", device->address);
}
static void device_leaving(struct dpws *dpws , struct wsa_endpoint_ref
*device)
{
printf("\n<- Device %s leaving the LAN.\n", device->address);
}
Snippet 7: Reacting to devices coming into or leaving the network
Once a new device or set of devices is detected on the network, further information
may be requested in the form of the device’s metadata – a collection of standardized
information which describes the device, such as brand, model, serial number, service
description, among others, as shown in Snippet 8.
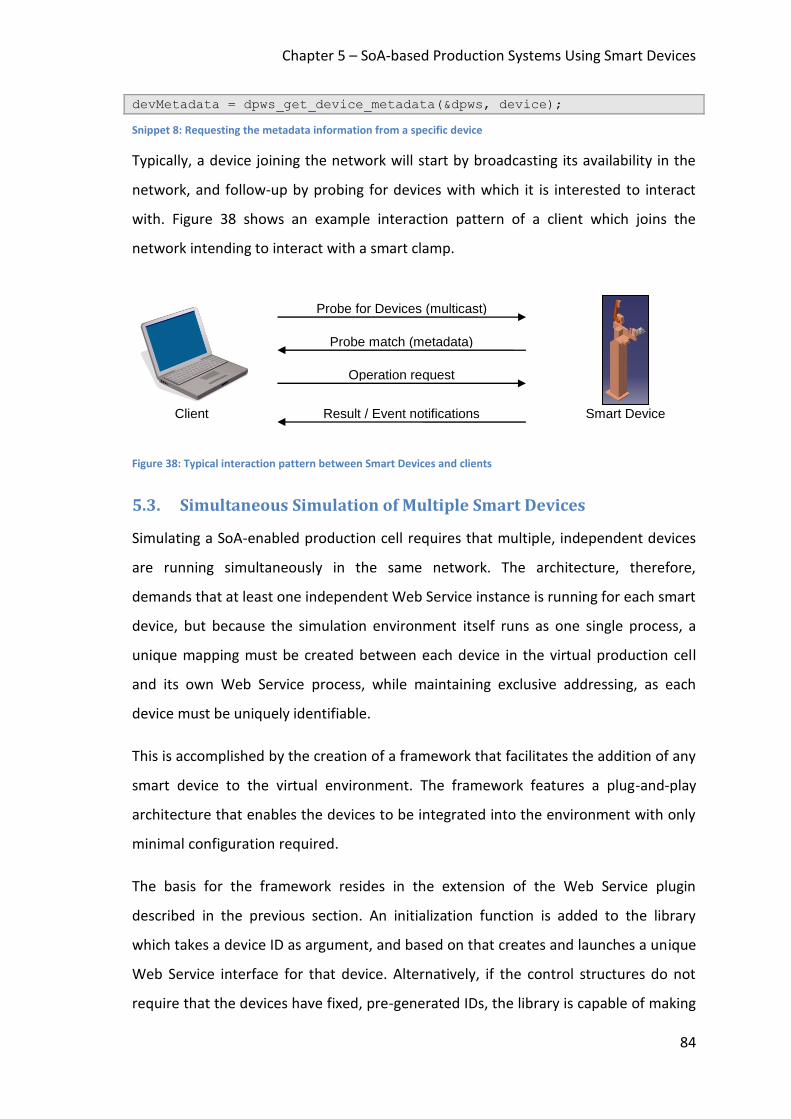
Chapter 5 – SoA-based Production Systems Using Smart Devices
84
devMetadata = dpws_get_device_metadata(&dpws, device);
Snippet 8: Requesting the metadata information from a specific device
Typically, a device joining the network will start by broadcasting its availability in the
network, and follow-up by probing for devices with which it is interested to interact
with. Figure 38 shows an example interaction pattern of a client which joins the
network intending to interact with a smart clamp.
Figure 38: Typical interaction pattern between Smart Devices and clients
5.3. Simultaneous Simulation of Multiple Smart Devices
Simulating a SoA-enabled production cell requires that multiple, independent devices
are running simultaneously in the same network. The architecture, therefore,
demands that at least one independent Web Service instance is running for each smart
device, but because the simulation environment itself runs as one single process, a
unique mapping must be created between each device in the virtual production cell
and its own Web Service process, while maintaining exclusive addressing, as each
device must be uniquely identifiable.
This is accomplished by the creation of a framework that facilitates the addition of any
smart device to the virtual environment. The framework features a plug-and-play
architecture that enables the devices to be integrated into the environment with only
minimal configuration required.
The basis for the framework resides in the extension of the Web Service plugin
described in the previous section. An initialization function is added to the library
which takes a device ID as argument, and based on that creates and launches a unique
Web Service interface for that device. Alternatively, if the control structures do not
require that the devices have fixed, pre-generated IDs, the library is capable of making
Client
Probe for Devices (multicast)
Smart Device
Probe match (metadata)
Operation request
Result / Event notifications
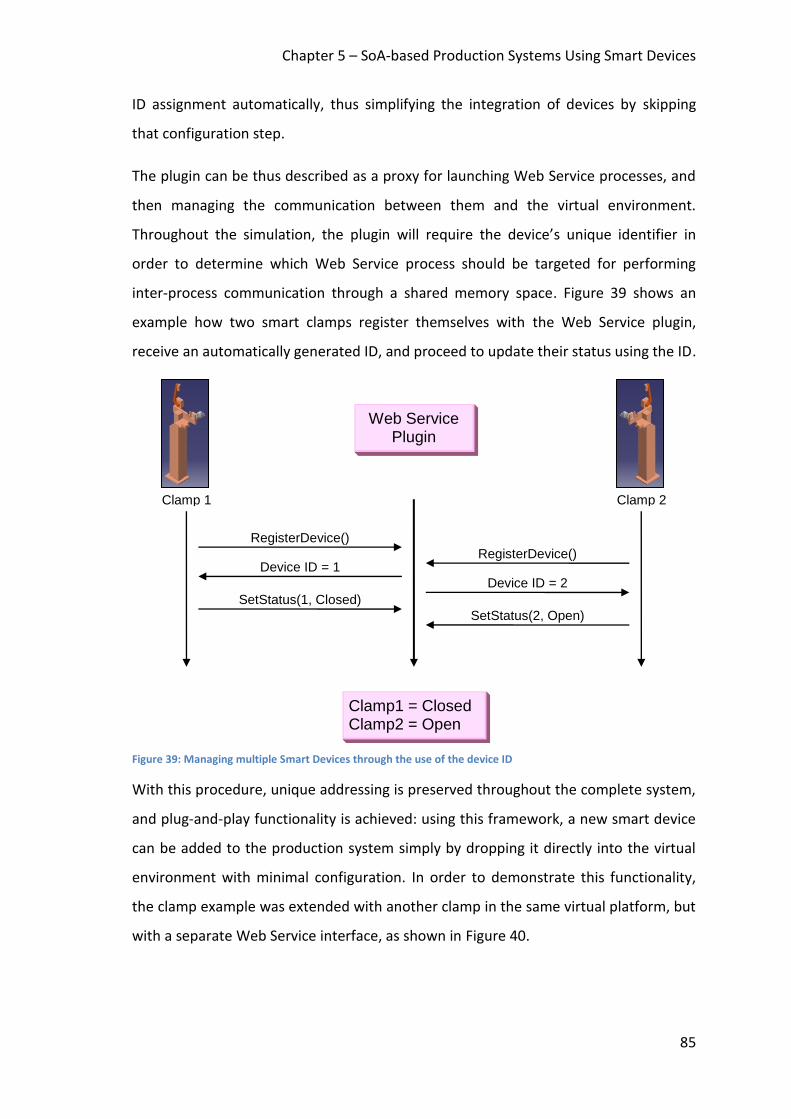
Chapter 5 – SoA-based Production Systems Using Smart Devices
85
ID assignment automatically, thus simplifying the integration of devices by skipping
that configuration step.
The plugin can be thus described as a proxy for launching Web Service processes, and
then managing the communication between them and the virtual environment.
Throughout the simulation, the plugin will require the device’s unique identifier in
order to determine which Web Service process should be targeted for performing
inter-process communication through a shared memory space. Figure 39 shows an
example how two smart clamps register themselves with the Web Service plugin,
receive an automatically generated ID, and proceed to update their status using the ID.
Figure 39: Managing multiple Smart Devices through the use of the device ID
With this procedure, unique addressing is preserved throughout the complete system,
and plug-and-play functionality is achieved: using this framework, a new smart device
can be added to the production system simply by dropping it directly into the virtual
environment with minimal configuration. In order to demonstrate this functionality,
the clamp example was extended with another clamp in the same virtual platform, but
with a separate Web Service interface, as shown in Figure 40.
Web Service Plugin
Clamp 1
Clamp 2
Clamp1 = Closed Clamp2 = Open
RegisterDevice()
Device ID = 1
SetStatus(1, Closed)
RegisterDevice()
Device ID = 2
SetStatus(2, Open)
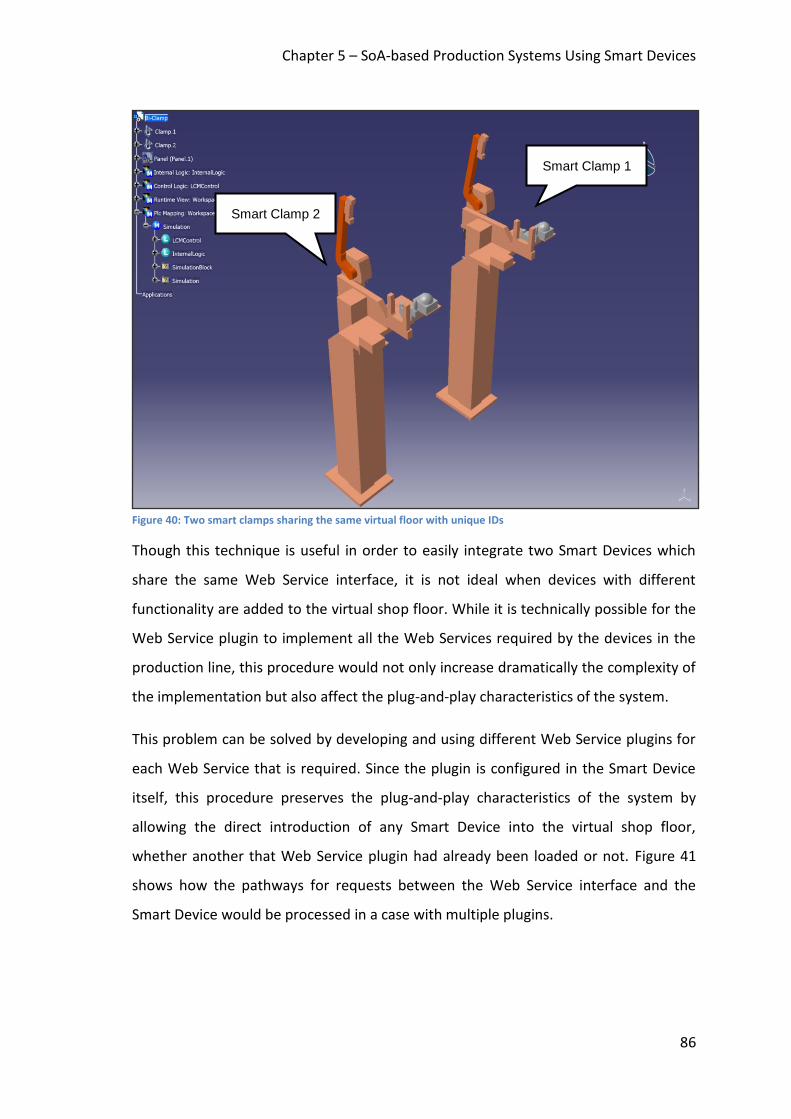
Chapter 5 – SoA-based Production Systems Using Smart Devices
86
Figure 40: Two smart clamps sharing the same virtual floor with unique IDs
Though this technique is useful in order to easily integrate two Smart Devices which
share the same Web Service interface, it is not ideal when devices with different
functionality are added to the virtual shop floor. While it is technically possible for the
Web Service plugin to implement all the Web Services required by the devices in the
production line, this procedure would not only increase dramatically the complexity of
the implementation but also affect the plug-and-play characteristics of the system.
This problem can be solved by developing and using different Web Service plugins for
each Web Service that is required. Since the plugin is configured in the Smart Device
itself, this procedure preserves the plug-and-play characteristics of the system by
allowing the direct introduction of any Smart Device into the virtual shop floor,
whether another that Web Service plugin had already been loaded or not. Figure 41
shows how the pathways for requests between the Web Service interface and the
Smart Device would be processed in a case with multiple plugins.
Smart Clamp 2
Smart Clamp 1
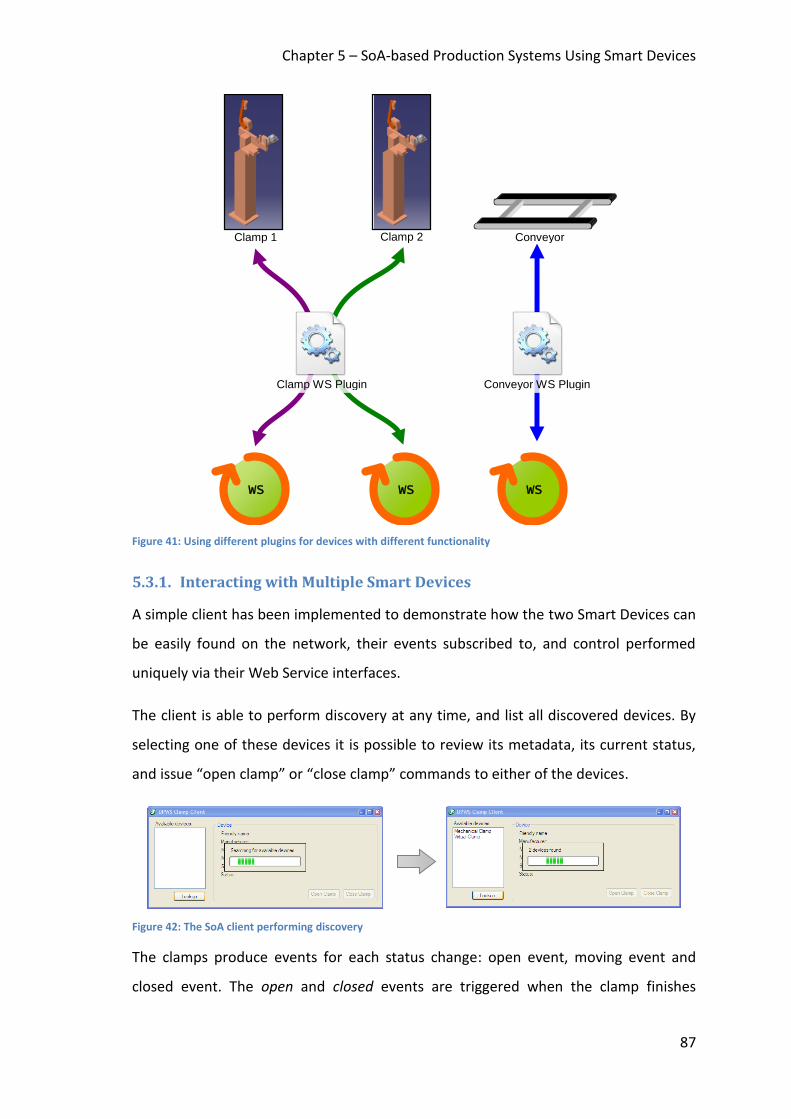
Chapter 5 – SoA-based Production Systems Using Smart Devices
87
Figure 41: Using different plugins for devices with different functionality
5.3.1. Interacting with Multiple Smart Devices
A simple client has been implemented to demonstrate how the two Smart Devices can
be easily found on the network, their events subscribed to, and control performed
uniquely via their Web Service interfaces.
The client is able to perform discovery at any time, and list all discovered devices. By
selecting one of these devices it is possible to review its metadata, its current status,
and issue “open clamp” or “close clamp” commands to either of the devices.
Figure 42: The SoA client performing discovery
The clamps produce events for each status change: open event, moving event and
closed event. The open and closed events are triggered when the clamp finishes
Clamp 1
WS WS
Conveyor Clamp 2
WS
Clamp WS Plugin Conveyor WS Plugin
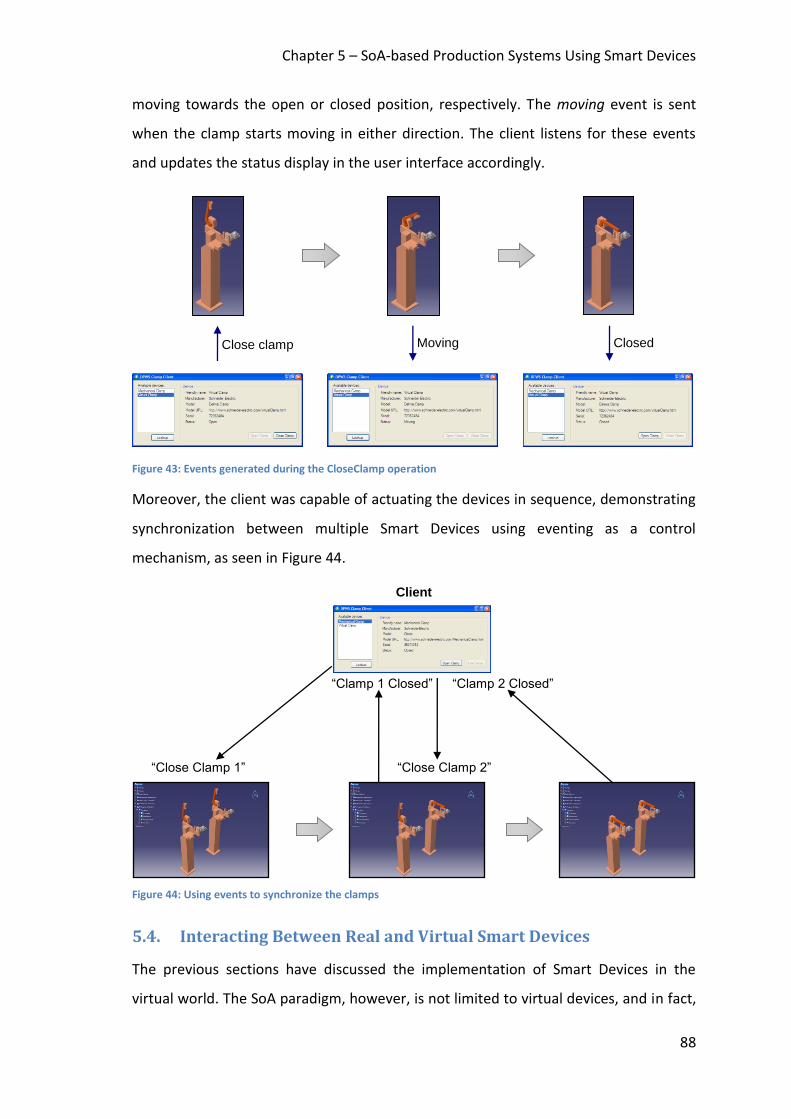
Chapter 5 – SoA-based Production Systems Using Smart Devices
88
moving towards the open or closed position, respectively. The moving event is sent
when the clamp starts moving in either direction. The client listens for these events
and updates the status display in the user interface accordingly.
Figure 43: Events generated during the CloseClamp operation
Moreover, the client was capable of actuating the devices in sequence, demonstrating
synchronization between multiple Smart Devices using eventing as a control
mechanism, as seen in Figure 44.
Figure 44: Using events to synchronize the clamps
5.4. Interacting Between Real and Virtual Smart Devices
The previous sections have discussed the implementation of Smart Devices in the
virtual world. The SoA paradigm, however, is not limited to virtual devices, and in fact,
Close clamp
Moving
Closed
“Close Clamp 1”
“Clamp 1 Closed”
“Close Clamp 2”
“Clamp 2 Closed”
Client
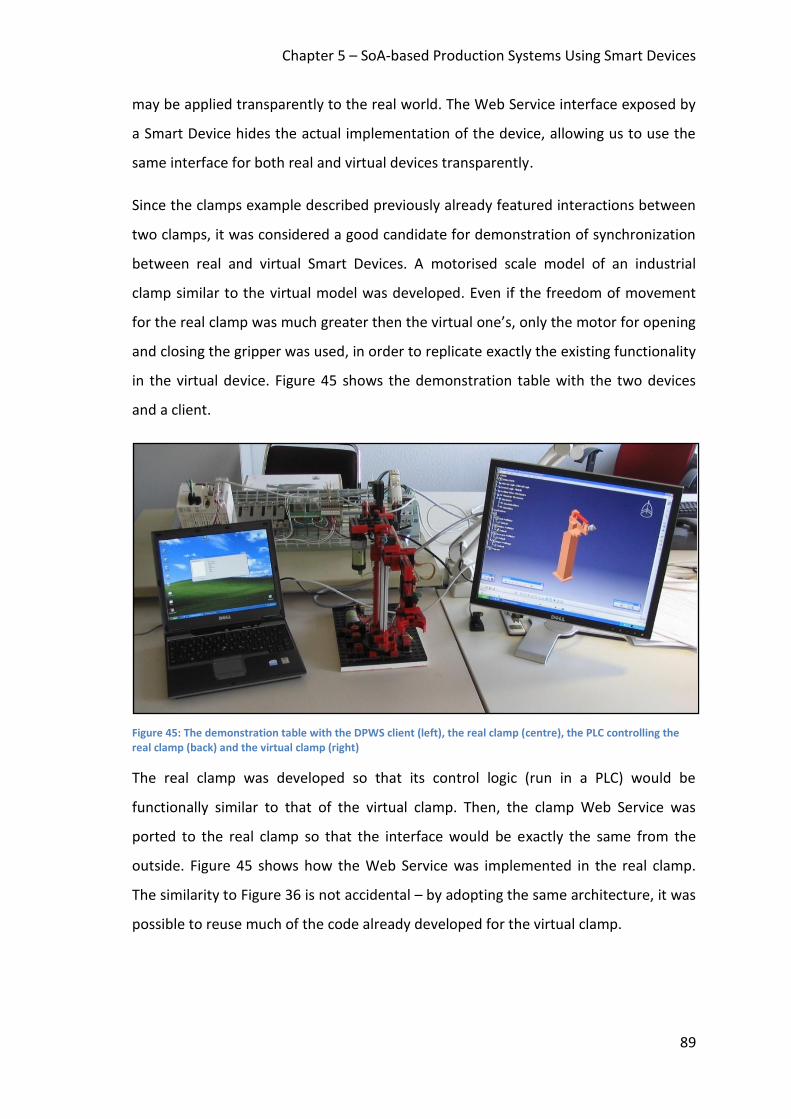
Chapter 5 – SoA-based Production Systems Using Smart Devices
89
may be applied transparently to the real world. The Web Service interface exposed by
a Smart Device hides the actual implementation of the device, allowing us to use the
same interface for both real and virtual devices transparently.
Since the clamps example described previously already featured interactions between
two clamps, it was considered a good candidate for demonstration of synchronization
between real and virtual Smart Devices. A motorised scale model of an industrial
clamp similar to the virtual model was developed. Even if the freedom of movement
for the real clamp was much greater then the virtual one’s, only the motor for opening
and closing the gripper was used, in order to replicate exactly the existing functionality
in the virtual device. Figure 45 shows the demonstration table with the two devices
and a client.
Figure 45: The demonstration table with the DPWS client (left), the real clamp (centre), the PLC controlling the real clamp (back) and the virtual clamp (right)
The real clamp was developed so that its control logic (run in a PLC) would be
functionally similar to that of the virtual clamp. Then, the clamp Web Service was
ported to the real clamp so that the interface would be exactly the same from the
outside. Figure 45 shows how the Web Service was implemented in the real clamp.
The similarity to Figure 36 is not accidental – by adopting the same architecture, it was
possible to reuse much of the code already developed for the virtual clamp.
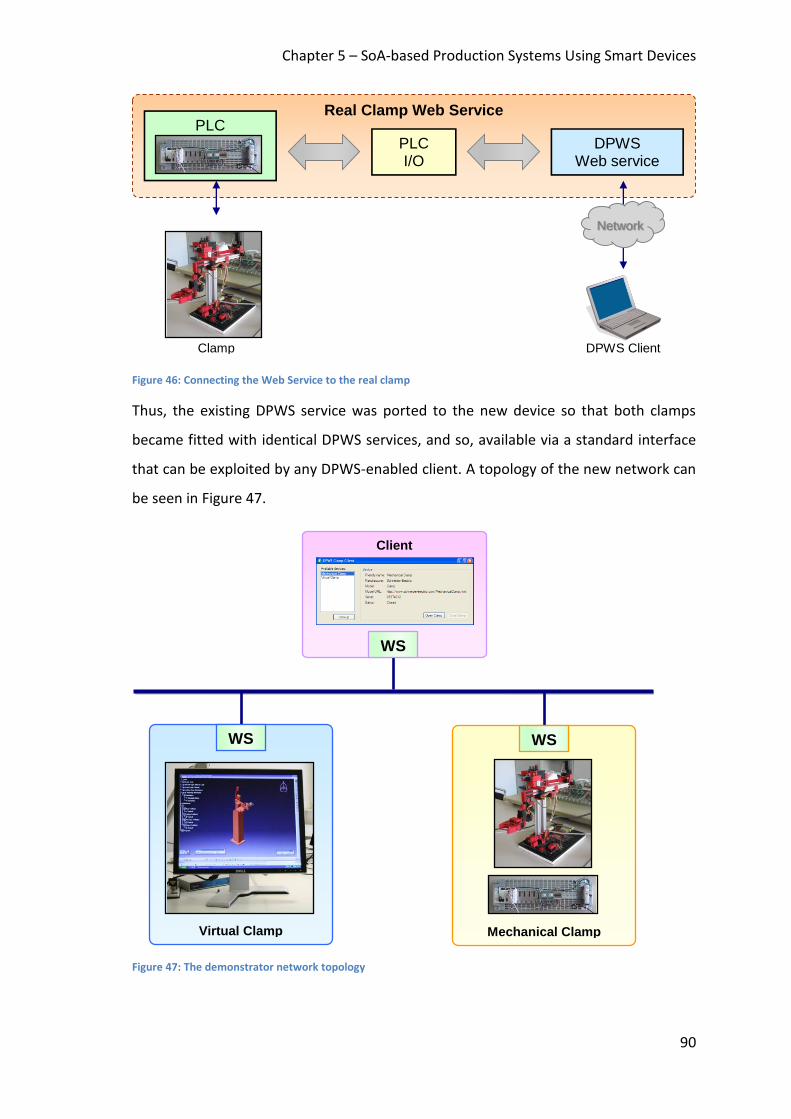
Chapter 5 – SoA-based Production Systems Using Smart Devices
90
Figure 46: Connecting the Web Service to the real clamp
Thus, the existing DPWS service was ported to the new device so that both clamps
became fitted with identical DPWS services, and so, available via a standard interface
that can be exploited by any DPWS-enabled client. A topology of the new network can
be seen in Figure 47.
Figure 47: The demonstrator network topology
Real Clamp Web Service
PLC I/O
DPWS Web service
PLC
Clamp
DPWS Client
Network
Client
Mechanical Clamp Virtual Clamp
WS
WS
WS
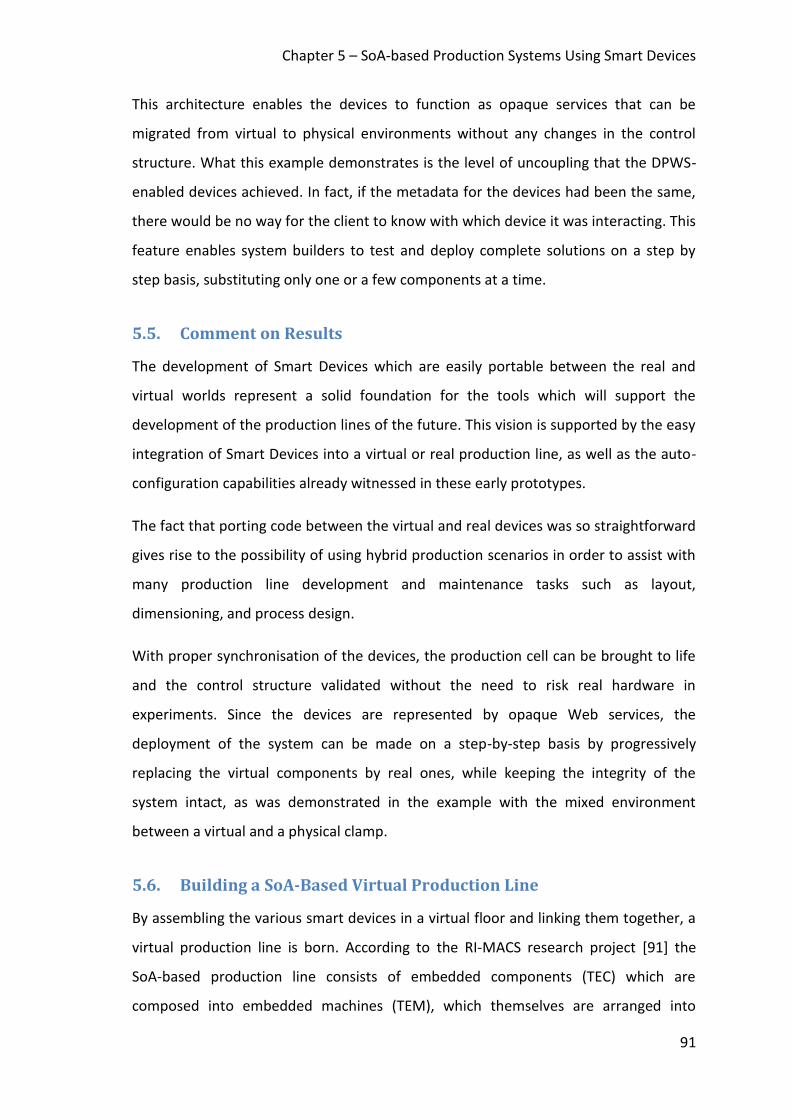
Chapter 5 – SoA-based Production Systems Using Smart Devices
91
This architecture enables the devices to function as opaque services that can be
migrated from virtual to physical environments without any changes in the control
structure. What this example demonstrates is the level of uncoupling that the DPWS-
enabled devices achieved. In fact, if the metadata for the devices had been the same,
there would be no way for the client to know with which device it was interacting. This
feature enables system builders to test and deploy complete solutions on a step by
step basis, substituting only one or a few components at a time.
5.5. Comment on Results
The development of Smart Devices which are easily portable between the real and
virtual worlds represent a solid foundation for the tools which will support the
development of the production lines of the future. This vision is supported by the easy
integration of Smart Devices into a virtual or real production line, as well as the auto-
configuration capabilities already witnessed in these early prototypes.
The fact that porting code between the virtual and real devices was so straightforward
gives rise to the possibility of using hybrid production scenarios in order to assist with
many production line development and maintenance tasks such as layout,
dimensioning, and process design.
With proper synchronisation of the devices, the production cell can be brought to life
and the control structure validated without the need to risk real hardware in
experiments. Since the devices are represented by opaque Web services, the
deployment of the system can be made on a step-by-step basis by progressively
replacing the virtual components by real ones, while keeping the integrity of the
system intact, as was demonstrated in the example with the mixed environment
between a virtual and a physical clamp.
5.6. Building a SoA-Based Virtual Production Line
By assembling the various smart devices in a virtual floor and linking them together, a
virtual production line is born. According to the RI-MACS research project [91] the
SoA-based production line consists of embedded components (TEC) which are
composed into embedded machines (TEM), which themselves are arranged into
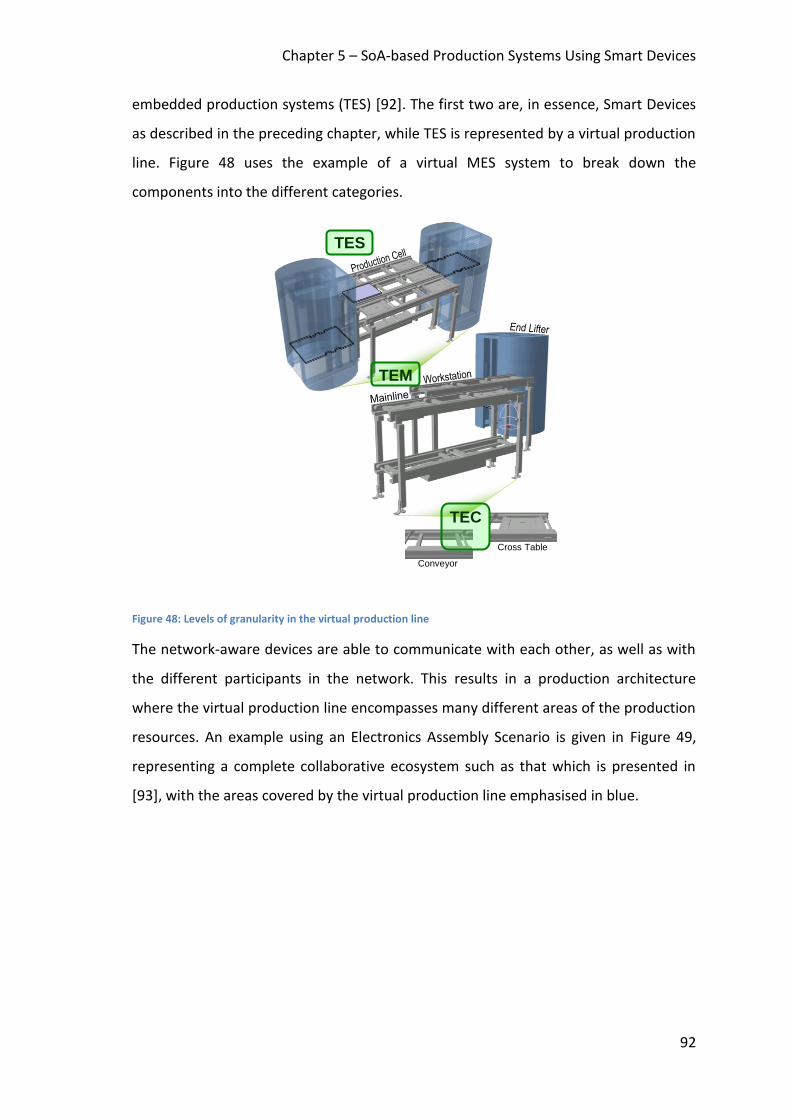
Chapter 5 – SoA-based Production Systems Using Smart Devices
92
embedded production systems (TES) [92]. The first two are, in essence, Smart Devices
as described in the preceding chapter, while TES is represented by a virtual production
line. Figure 48 uses the example of a virtual MES system to break down the
components into the different categories.
Figure 48: Levels of granularity in the virtual production line
The network-aware devices are able to communicate with each other, as well as with
the different participants in the network. This results in a production architecture
where the virtual production line encompasses many different areas of the production
resources. An example using an Electronics Assembly Scenario is given in Figure 49,
representing a complete collaborative ecosystem such as that which is presented in
[93], with the areas covered by the virtual production line emphasised in blue.
Conveyor
Cross Table
TES
TEM
TEC

Chapter 5 – SoA-based Production Systems Using Smart Devices
93
Figure 49: The different functions of the virtual production line in an Electronics Assembly Scenario, emphasising those which are implemented by the virtual production line
Since all participants in the production line share the same network and high-level
functionality, and the components in the virtual environment appear in the network as
autonomous devices, there is no clear distinction between them (from the controller’s
point of view) and the real devices, which allows replacing some of the virtual
components for real ones for testing purposes, resulting in an open architecture
where all the participants can participate freely according to their function, as seen in
Figure 50.
ERP/MES
WS
Orchestrator
WS
Engineering System
WS
Device
WS
Dist. IO
WS
Work Piece
WS Service
Mediator
WS
Gateway
WS
Legacy and Low Resource
Devices
Wireless Sensor / Actuator Network
PLC, RC
WS

Chapter 5 – SoA-based Production Systems Using Smart Devices
94
Figure 50: Various devices participating in the SoA-based device network
This technique allows the production engineer to validate the production cell’s layout
and process control on the virtual production floor first, and then replace the virtual
devices for real ones as necessary for testing until the control software is running the
full, physical, production cell. Similarly, the installation of a new device can be tested
by first connecting a virtual device, and replacing it with the real device only after
validating the new configuration.
5.7. The Flexlink™ Virtual Production Line
The work described in this section entails the development of a proof-of-concept
virtual production line. The virtual production line models the Flexlink™ cell
demonstrator being implemented for the SOCRADES project, which consists of a main
line, two work stations and two end-lifters in a closed loop configuration.
The production cell is built using only the following atomic smart devices (TEC):
Conveyor, Cross Table and End Lifter. All the devices offer independent Web service
interfaces and require only minimal configuration which is performed during design
time.
5.7.1. Smart Devices
The model describes an assembly of typical components of a material handling system
(MHS) which, despite their differences in usage and functionality, share a common
MHS Controller
WS
WS
Virtual Production
Line
WS
Maintenance Technician
WS
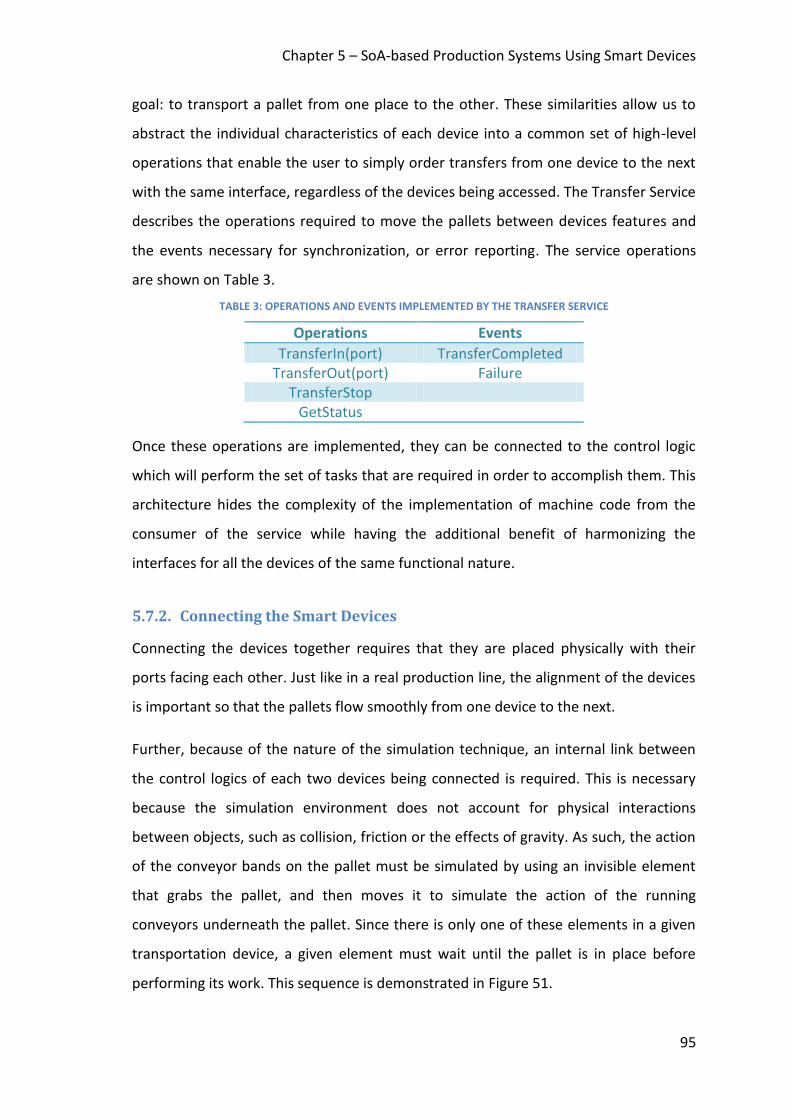
Chapter 5 – SoA-based Production Systems Using Smart Devices
95
goal: to transport a pallet from one place to the other. These similarities allow us to
abstract the individual characteristics of each device into a common set of high-level
operations that enable the user to simply order transfers from one device to the next
with the same interface, regardless of the devices being accessed. The Transfer Service
describes the operations required to move the pallets between devices features and
the events necessary for synchronization, or error reporting. The service operations
are shown on Table 3.
TABLE 3: OPERATIONS AND EVENTS IMPLEMENTED BY THE TRANSFER SERVICE
Operations Events
TransferIn(port) TransferCompleted TransferOut(port) Failure
TransferStop GetStatus
Once these operations are implemented, they can be connected to the control logic
which will perform the set of tasks that are required in order to accomplish them. This
architecture hides the complexity of the implementation of machine code from the
consumer of the service while having the additional benefit of harmonizing the
interfaces for all the devices of the same functional nature.
5.7.2. Connecting the Smart Devices
Connecting the devices together requires that they are placed physically with their
ports facing each other. Just like in a real production line, the alignment of the devices
is important so that the pallets flow smoothly from one device to the next.
Further, because of the nature of the simulation technique, an internal link between
the control logics of each two devices being connected is required. This is necessary
because the simulation environment does not account for physical interactions
between objects, such as collision, friction or the effects of gravity. As such, the action
of the conveyor bands on the pallet must be simulated by using an invisible element
that grabs the pallet, and then moves it to simulate the action of the running
conveyors underneath the pallet. Since there is only one of these elements in a given
transportation device, a given element must wait until the pallet is in place before
performing its work. This sequence is demonstrated in Figure 51.
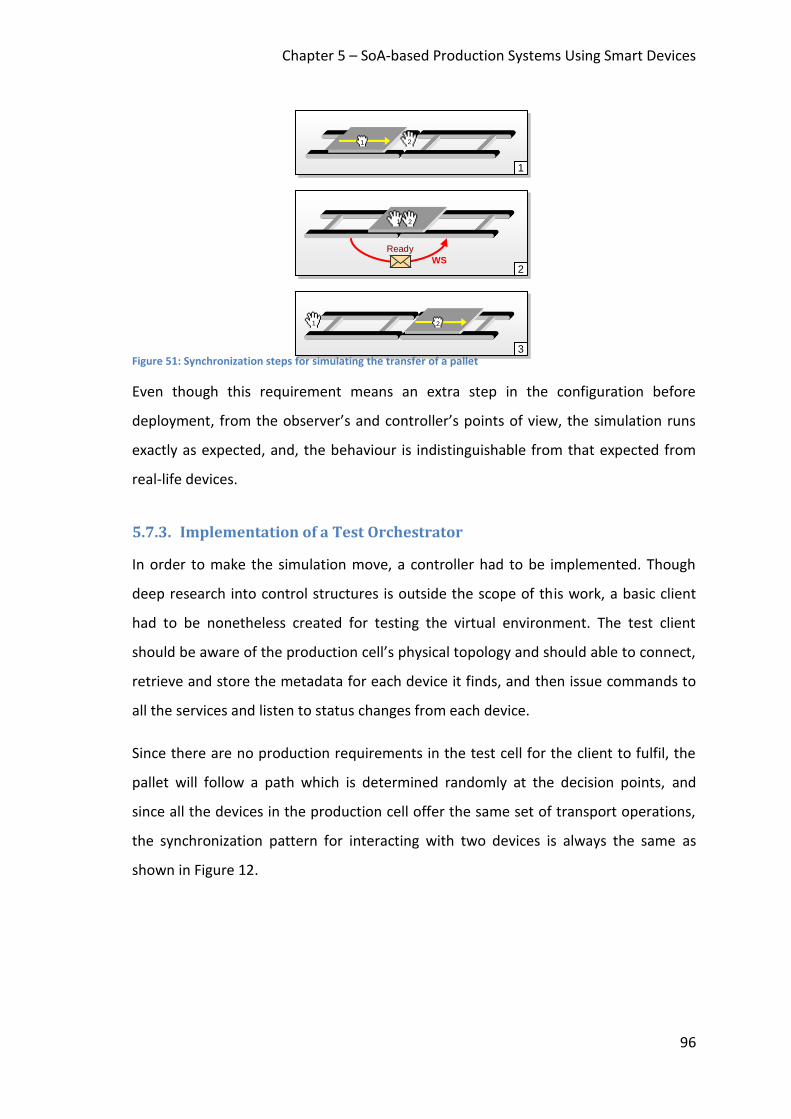
Chapter 5 – SoA-based Production Systems Using Smart Devices
96
Figure 51: Synchronization steps for simulating the transfer of a pallet
Even though this requirement means an extra step in the configuration before
deployment, from the observer’s and controller’s points of view, the simulation runs
exactly as expected, and, the behaviour is indistinguishable from that expected from
real-life devices.
5.7.3. Implementation of a Test Orchestrator
In order to make the simulation move, a controller had to be implemented. Though
deep research into control structures is outside the scope of this work, a basic client
had to be nonetheless created for testing the virtual environment. The test client
should be aware of the production cell’s physical topology and should able to connect,
retrieve and store the metadata for each device it finds, and then issue commands to
all the services and listen to status changes from each device.
Since there are no production requirements in the test cell for the client to fulfil, the
pallet will follow a path which is determined randomly at the decision points, and
since all the devices in the production cell offer the same set of transport operations,
the synchronization pattern for interacting with two devices is always the same as
shown in Figure 12.
2
3
2
1
1
2
Ready
1
2
1
WS
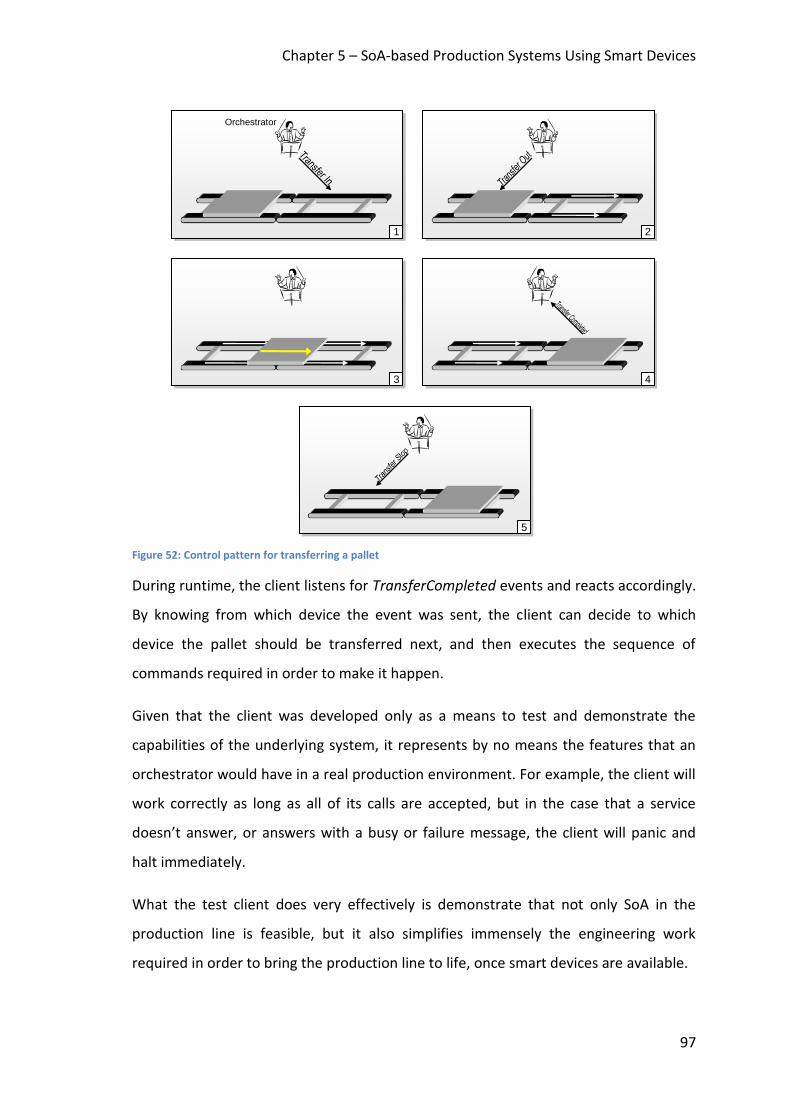
Chapter 5 – SoA-based Production Systems Using Smart Devices
97
Figure 52: Control pattern for transferring a pallet
During runtime, the client listens for TransferCompleted events and reacts accordingly.
By knowing from which device the event was sent, the client can decide to which
device the pallet should be transferred next, and then executes the sequence of
commands required in order to make it happen.
Given that the client was developed only as a means to test and demonstrate the
capabilities of the underlying system, it represents by no means the features that an
orchestrator would have in a real production environment. For example, the client will
work correctly as long as all of its calls are accepted, but in the case that a service
doesn’t answer, or answers with a busy or failure message, the client will panic and
halt immediately.
What the test client does very effectively is demonstrate that not only SoA in the
production line is feasible, but it also simplifies immensely the engineering work
required in order to bring the production line to life, once smart devices are available.
2
5
3
4
1
Orchestrator
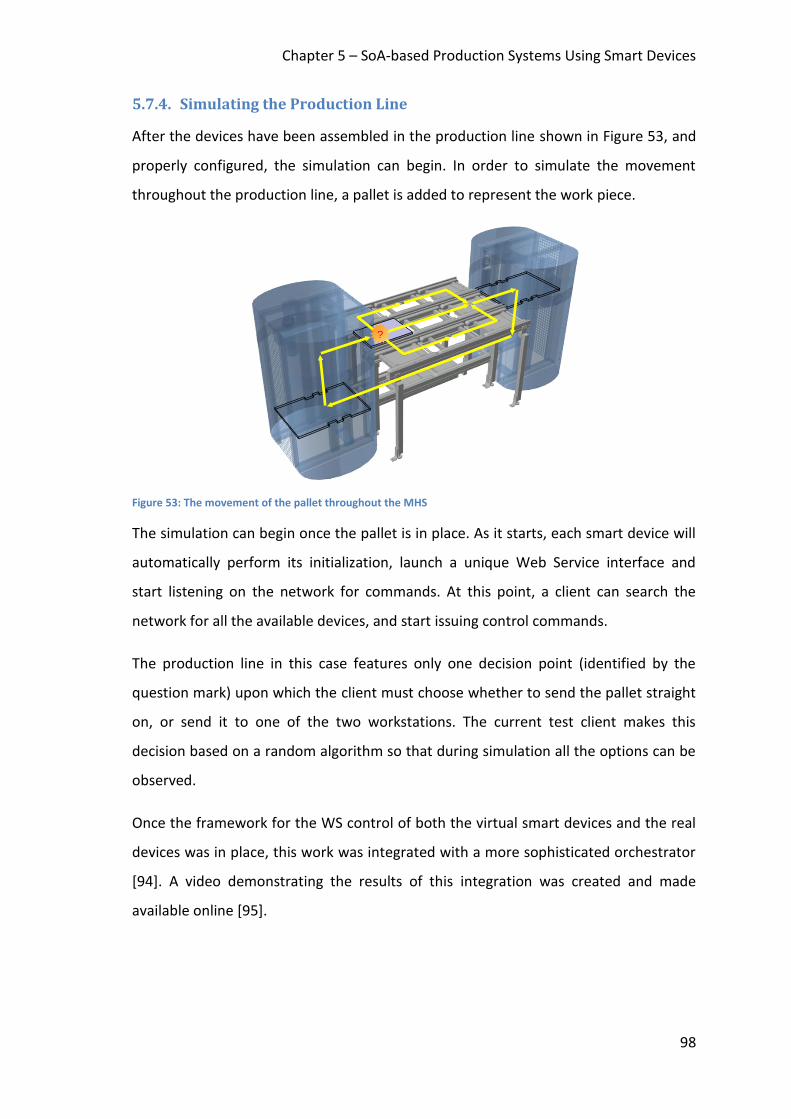
Chapter 5 – SoA-based Production Systems Using Smart Devices
98
5.7.4. Simulating the Production Line
After the devices have been assembled in the production line shown in Figure 53, and
properly configured, the simulation can begin. In order to simulate the movement
throughout the production line, a pallet is added to represent the work piece.
Figure 53: The movement of the pallet throughout the MHS
The simulation can begin once the pallet is in place. As it starts, each smart device will
automatically perform its initialization, launch a unique Web Service interface and
start listening on the network for commands. At this point, a client can search the
network for all the available devices, and start issuing control commands.
The production line in this case features only one decision point (identified by the
question mark) upon which the client must choose whether to send the pallet straight
on, or send it to one of the two workstations. The current test client makes this
decision based on a random algorithm so that during simulation all the options can be
observed.
Once the framework for the WS control of both the virtual smart devices and the real
devices was in place, this work was integrated with a more sophisticated orchestrator
[94]. A video demonstrating the results of this integration was created and made
available online [95].
?
Chapter 5 – SoA-based Production Systems Using Smart Devices
99
5.8. Comments on Results
The results achieved with this experiment demonstrate that a SoA-based engineering
tool can support the production engineer by greatly simplifying the process of
production line layout and configuration. The simulation capabilities offered by the
tool are indispensible for quick prototyping and testing of the capabilities,
performance and throughput of the production process.
Furthermore, both the high-level nature of the Web Service-based components and
the generic support of the virtual 3D platform enable the quick development of new
components and their adaptation into an existing production environment, where
they can be thoroughly tested before deployment.
After deployment, the same environment which was created for assisting the
development of the production line can be retooled in order to act as a 3D-enabled
production monitor which can accompany in real-time the production process as it
happens in the factory floor.
The open and standard nature of the technologies and protocols used in the
communication between the different devices enable a future where factories don’t
have to rely on a limited set of vendors for all of their production or control devices,
but instead, benefit from an ecosystem where competing companies which all develop
their products targeting the same standards, giving rise to a modular factory floor
where the different machines are mixed-and-matched according to their quality,
capabilities and price.
Thus the proposed engineering environment is not only an important tool in the
production engineering process, but it also becomes an integral part in the support of
the production line throughout its whole lifecycle.
Chapter 6 – Monitoring and Simulation of Production Energy Usage Using SoA
100
Chapter 6. Monitoring and Simulation of Production Energy Usage Using SoA
This chapter presents a study on the challenges and techniques required in order to
implement an energy-aware, SoA-based system in the manufacturing domain. It
makes use of the Smart Device technology that has been described in Chapter 5 with a
focus on implementation on existing lines in a real production scenario at Ford Motor
Company®, and therefore, focuses on the tools currently in use at the company’s
production sites.
Production monitoring and simulation systems represent a key component in the
design of the production process and are, therefore, ideal candidates to
implementation of energy-related functionality.
Even though traditionally, simulation systems have been mostly concerned with
predicting worker and machine availability as well as production throughput, the case
can be made that simply adding energy usage parameters to the system being
simulated could immediately yield data which would influence significantly the design
of the production process compared to traditional solutions. Moreover, the efficient
use of simulation systems requires detailed knowledge of the energy usage during
production, which could be supplied by an energy-aware production monitoring
system.
These simple changes to current production scenario, while valuable, do not, however,
represent the full scale of the possibilities available with current research and
technologies in modern manufacturing systems. The advent of SoA-based production
systems is positioned as a major solution to many of the problems currently facing the
industry, including the specific fields of production monitoring, simulation and energy
efficiency.
It is expected that the SoA-based tools and techniques applied in the previous
chapters can be applied directly to these fields.

Chapter 6 – Monitoring and Simulation of Production Energy Usage Using SoA
101
First, however, a study must be made on the industrial requirements for these
systems, as well as the tools currently in use. Moreover, the energy usage as well as
the main strategies for improving energy efficiency in the factory floor must first be
understood. This information can then be used as a starting point to the development
of a strategy for the implementation of the SoA paradigm in the current industrial
setting.
6.1. Approach
Monitoring a production cell entails keeping track of that cell’s status over time. This,
in turn, is achieved by monitoring the relevant indexes of each composing devices, and
their relation to each other.
6.1.1. Feature-based Monitoring
The proposed approach, shown in Figure 54, aims to take the signals generated by the
hardware, wrapping them in an XML format with extended, relevant data, e.g. a
timestamp, and exposing it via a Web Service interface. The information is packaged as
an event which is to be broadcast to all the interested participants in the network in
real-time.
Figure 54: Components of a smart sensor
This procedure is repeated for each mechatronic component which is able to support
computerized processing power. Those components, when enhanced with Web
Service functionality can thus be seen as a SoA-based component, or a Smart Device
with embedded Web Services, as defined in [7].
Sensor Signal XML Data
Web Service
Smart Sensor
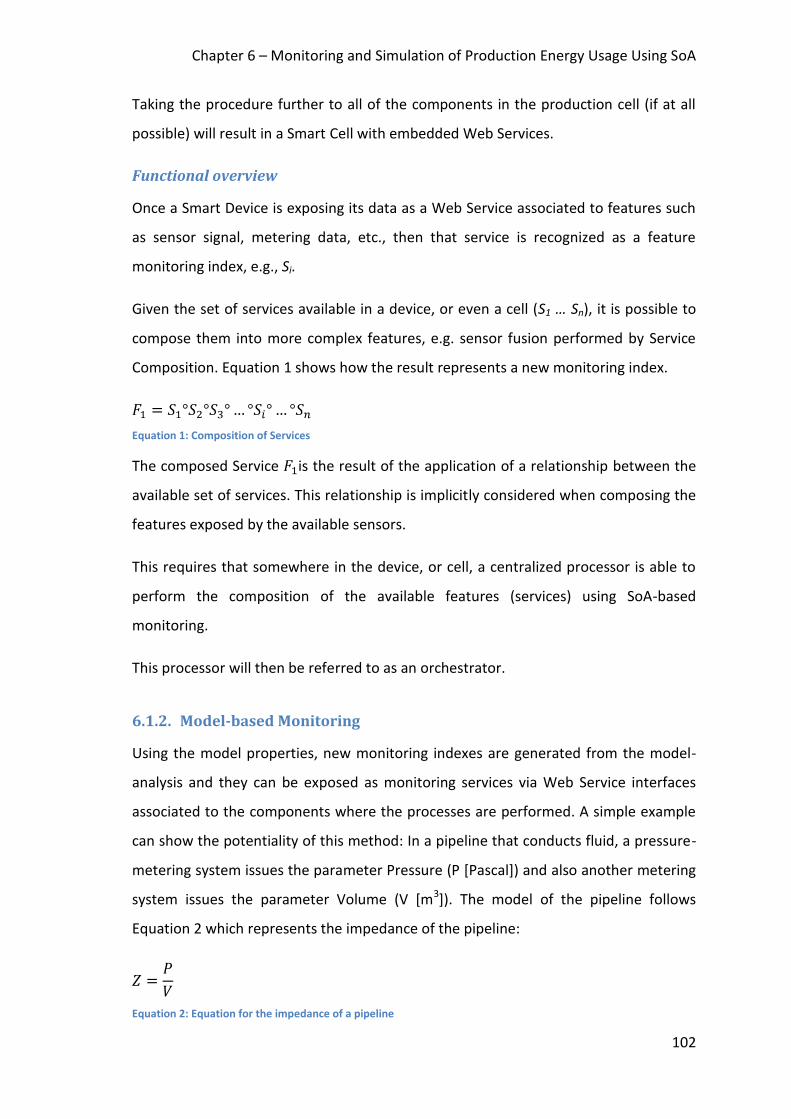
Chapter 6 – Monitoring and Simulation of Production Energy Usage Using SoA
102
Taking the procedure further to all of the components in the production cell (if at all
possible) will result in a Smart Cell with embedded Web Services.
Functional overview
Once a Smart Device is exposing its data as a Web Service associated to features such
as sensor signal, metering data, etc., then that service is recognized as a feature
monitoring index, e.g., Si.
Given the set of services available in a device, or even a cell (S1 … Sn), it is possible to
compose them into more complex features, e.g. sensor fusion performed by Service
Composition. Equation 1 shows how the result represents a new monitoring index.
Equation 1: Composition of Services
The composed Service is the result of the application of a relationship between the
available set of services. This relationship is implicitly considered when composing the
features exposed by the available sensors.
This requires that somewhere in the device, or cell, a centralized processor is able to
perform the composition of the available features (services) using SoA-based
monitoring.
This processor will then be referred to as an orchestrator.
6.1.2. Model-based Monitoring
Using the model properties, new monitoring indexes are generated from the model-
analysis and they can be exposed as monitoring services via Web Service interfaces
associated to the components where the processes are performed. A simple example
can show the potentiality of this method: In a pipeline that conducts fluid, a pressure-
metering system issues the parameter Pressure (P [Pascal]) and also another metering
system issues the parameter Volume (V [m3]). The model of the pipeline follows
Equation 2 which represents the impedance of the pipeline:
Equation 2: Equation for the impedance of a pipeline
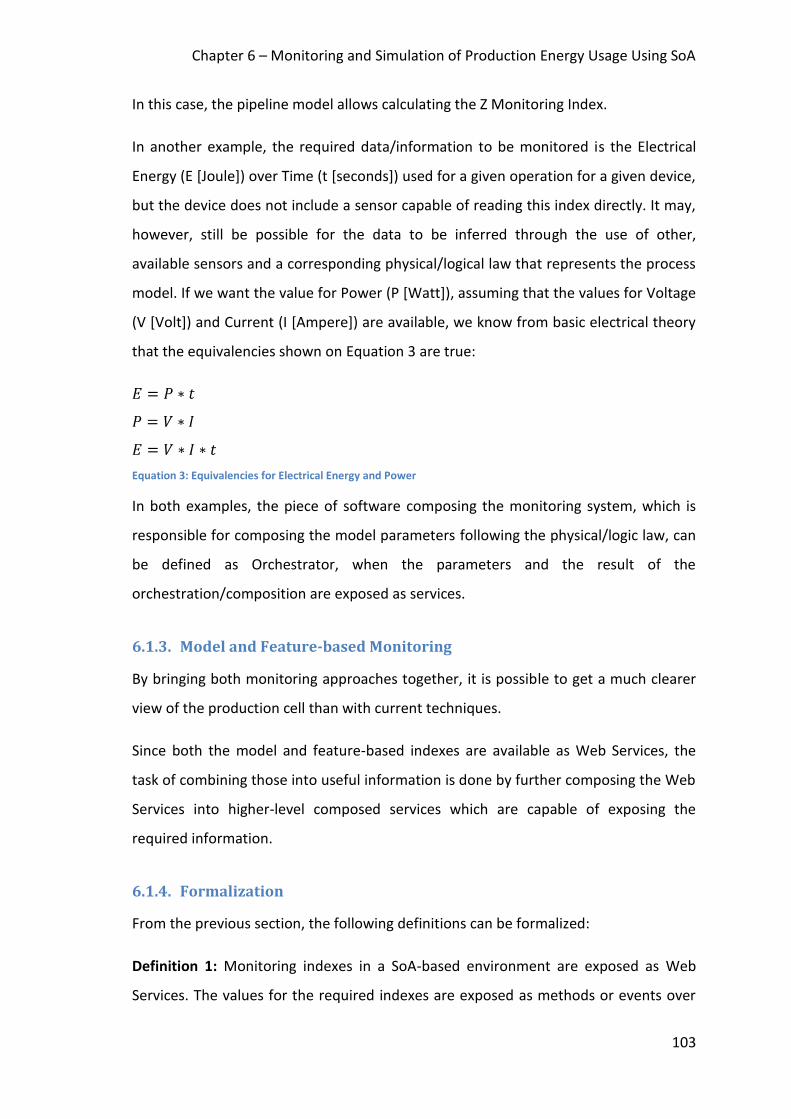
Chapter 6 – Monitoring and Simulation of Production Energy Usage Using SoA
103
In this case, the pipeline model allows calculating the Z Monitoring Index.
In another example, the required data/information to be monitored is the Electrical
Energy (E [Joule]) over Time (t [seconds]) used for a given operation for a given device,
but the device does not include a sensor capable of reading this index directly. It may,
however, still be possible for the data to be inferred through the use of other,
available sensors and a corresponding physical/logical law that represents the process
model. If we want the value for Power (P [Watt]), assuming that the values for Voltage
(V [Volt]) and Current (I [Ampere]) are available, we know from basic electrical theory
that the equivalencies shown on Equation 3 are true:
Equation 3: Equivalencies for Electrical Energy and Power
In both examples, the piece of software composing the monitoring system, which is
responsible for composing the model parameters following the physical/logic law, can
be defined as Orchestrator, when the parameters and the result of the
orchestration/composition are exposed as services.
6.1.3. Model and Feature-based Monitoring
By bringing both monitoring approaches together, it is possible to get a much clearer
view of the production cell than with current techniques.
Since both the model and feature-based indexes are available as Web Services, the
task of combining those into useful information is done by further composing the Web
Services into higher-level composed services which are capable of exposing the
required information.
6.1.4. Formalization
From the previous section, the following definitions can be formalized:
Definition 1: Monitoring indexes in a SoA-based environment are exposed as Web
Services. The values for the required indexes are exposed as methods or events over
Chapter 6 – Monitoring and Simulation of Production Energy Usage Using SoA
104
the Web Service interface, and the required composition is done through the
composition of those Web Services. Thus we define them as being equivalent.
Definition 2: Feature-based monitoring indexes are Web Services exposed by smart
sensors. Smart sensors are sensors fitted with a Web Service interface, capable of
exposing sensor data over the SoA-based network.
Definition 3: Model-based monitoring indexes are Web Services exposed by
orchestrators following an orchestration approach, which basically allows the formal
composition of monitoring functions.
Definition 4: The monitor orchestrator always follows one or two of the two
approaches:
Signal composition, e.g. sensor fusion, resulting in a Web Services that is
composing atomic Web Services
Model of the process, resulting in a Web Service that composes model
parameters or functional processes
6.2. Improving Energy Efficiency in the industry
Since wholesale rebuilding of the productions plants as well as the buildings and
facilities supporting them with energy efficiency in mind isn’t economically feasible,
other methods must be found in order to make short-term energy efficiency gains in
the production process. The strategies for improving energy efficiency in the
production system can be broken down into three approaches:
6.2.1. Optimization of energy usage
Generally, three ways to optimize energy usage in current production plants were
considered in this study: machine replacement; changes to existing machines, and
Software/Process optimization.
Hardware Replacement
Hardware replacement in the sense of energy usage optimization entails the exchange
of existing hardware for newer models with energy saving features, or more efficient
Chapter 6 – Monitoring and Simulation of Production Energy Usage Using SoA
105
operation, e.g. replacing an inefficient production machine, or redesigning the lighting
fixtures.
Newer models of production machines are starting to become more energy-aware. For
example, in certain old CNC machines, discarded material debris is flushed from the
machine’s platform using large amounts of coolant liquid. This is wasteful because
coolant liquid is both expensive and requires energy to be refrigerated and pumped
through the plant. Moreover, the coolant fluids may contain chemicals hazardous to
the health and environment. Newer machine designs are starting to take this issue
into account and use a much more targeted nozzle to spray the area with a pressure
jet, achieving the same results using much less material. Another example are drilling
machines which require permanent lubricant while in operation. Older models simply
flood the drill with lubricant from the outside, while newer technology allows feeding
a mist of lubricant directly through a hollow tube inside the drill itself, saving on the
fluids itself, as well as on the energy used for pumping and the recapture process.
From these examples, it is inferred that exchanging existing machines for newer
models would bring about substantial energy savings, but this approach is rarely
feasible due to the high initial costs of the machines and the fact that usually, machine
replacement carries with it high integration efforts as well as prolonged production
downtime. Many of the machines currently in operation were projected for prolonged
operation, sometimes in the order of decades, and are usually replaced only at the end
of their program.
Still, new installations will be made and eventually old machines will be replaced, so it
is useful to work with machine suppliers in identifying observed energy consumption
issues during production so that these may be rectified in the next models.
Changes to Existing Hardware
Another viable avenue for improving energy efficiency in the production line is by
making small changes to existing hardware. For example, upgrading components of a
production machine with more energy-efficient ones, or replacing the existing lighting
installation with modern alternatives with a much lower energy footprint.
Chapter 6 – Monitoring and Simulation of Production Energy Usage Using SoA
106
Even if some machines can’t be directly upgraded by more energy efficient technology,
there may still be parts of the installation which can be changed in order to get
considerable improvements. A common problem with many production cells is that
their power requirements were either over-specified at installation, were specified for
later expansion, or the machines simply aren’t always producing at 100% throughput
even though they may use the same amount of energy as when they are. Furthermore,
even if a given machine is running at its full throughput, it may eventually be blocked
by a slower machine downstream, in which case it may be worthwhile to operate it at
a lower speed so as to avoid congestion in the material flow. In those cases, it may
make sense to, for example, use a variable speed drive in order to lower the
performance of the machine to the desired level.
Software/Process Optimization
Depending on the source of the energy losses and the machine’s construction, it isn’t
always possible to make changes to the machines themselves to enable energy
savings. In these situations it may still be possible to optimize the machine controlling
software in order to lower its overall energy usage.
Changes to the software controlling the various systems throughout the plan can
sometimes yield strong results with a relatively small investment and little to no
requirements for changes to existing hardware. This type of optimization of energy
efficiency is usually achieved by improving production line workload and balancing the
use of the production systems with an eye towards energy consumption.
Typically this is the cheapest solution to implement since there are no (or very low)
hardware or installation costs besides developer time.
Software optimization can take many forms, i.e., through a technique called Predicted
Shutdown, which consists of detecting when machines are going to be idle for long
periods of time, allowing for their shutdown in order to save energy. A corresponding
technique, Predicted Start-up seeks to restart an idle machine in anticipation of a new
part so that it is ready to work when the part arrives.

Chapter 6 – Monitoring and Simulation of Production Energy Usage Using SoA
107
6.3. Industrial Requirements and Trends
Implementing a modern factory floor is an incredibly expensive and time-consuming
task as production specifications must be transformed into the machine code
connecting all of the devices together. Likewise, a monitoring framework must also be
implemented so that production engineers can have a real-time view of the machine’s
status, production flow, energy usage, stock management, as well as other essential
production indexes.
In order to tackle the problem of how to best use the available emerging technologies
in the modern production line, it is necessary to first understand the requirements for
production monitoring and the current state of the art in that area.
6.3.1. Monitoring Systems
Modern monitoring systems are currently employed for evaluating machine
performance, usage and transmitting basic information to the production engineers,
operators and maintenance crews on the factory floor. Though these basic
requirements are mostly satisfied by the current system, the system’s architecture is
rapidly becoming obsolete as the complexities of the production line and process
grow.
In POSMon, there are two kinds of real-time communication pathways which can be
seen in Figure 7 on section 2.3.1. The green arrows in the topology show “true real-
time” communication, which takes at most a few seconds to transfer between the
participants. This is considered fast enough for most uses, as the communication is
quick enough for the current use-cases, e.g., updating the overhead displays for the
plant personnel.
POSMon also features a “pseudo real-time” communication, represented in the same
figure as the pink arrow from going from the real-time server to the global client PC. In
these cases, the data is fed live through the network to a remote client with a
considerable delay (a few minutes). The real-time functionality currently implemented
in the system is done so using polling mechanisms.
Chapter 6 – Monitoring and Simulation of Production Energy Usage Using SoA
108
It is clear that an event-based system would not only free up network resources, but
also improve response time from it taking a few seconds to being nearly
instantaneous.
The difference between one second a few milliseconds isn’t relevant when the
system’s purpose is to inform the human operators on the shop floor, but having true
real-time information of production status will enable scenarios where the machines
themselves become smart enough to directly become the information consumers,
taking certain pre-determined actions in response to those signals, e.g. starting-up or
shutting down machines according to the line’s production throughput in order to save
energy.
The machine should be capable of generating events for all of its operating
procedures. From an external process point of view, relevant events might be sent to
inform that the machine has received a part, has finished a part, is in fault or
maintenance mode, and so forth. This would enable other participants in the network
to know that machine’s status at any given time and adapt their own work in that
regard.
Energy Monitoring
Though production energy monitoring is still in its infancy in regards to automation,
some efforts have been made towards this goal at Ford®. The natural expectation is
that the existing POSMon system could be extended in order to report energy usage
parameters in addition to the standard production data.
Though this can be somewhat achieved by appending the energy data to the normal
POSMon packets, the amount of data in the packets is limited, so care must be taken
that the full data payload doesn’t exceed the available space. Otherwise, the existing
systems could still be exploited by creating new packets devoted exclusively for energy
monitoring parameters, essentially creating a parallel network for energy reporting.
Though this would free the production engineers from the restrictions imposed by
trying to fit all of the information into the same, relatively short data packet, it would
also create a new parallel network which would need to be maintained and accounted

Chapter 6 – Monitoring and Simulation of Production Energy Usage Using SoA
109
for, and which might compete with the standard POSMon functions for available
bandwidth.
6.3.2. Simulation Systems
Production simulation systems are typically used during the design phase of the
production line to simulate the production under different scenarios in order to
determine the ideal loads, workforce shift arrangements and other important
characteristics which will factor in the development of the system. They are also useful
in predicting the expected productivity of the line, as well as other factors such as
costs per unit, and expected machine downtime (essential for the planning of
maintenance schedules).
Simulation systems can be used to explore alternative schedules and timings and their
effects on production energy efficiency without interfering with on-going production.
Moreover, they may predict system behaviour and detect energy-related system
malfunctions by continuously comparing real with simulated production. At the
highest layer, filtered and aggregated energy consumption data can be integrated into
a company-wide, global view of energy consumption. That data can be used to
uncover and visualize differences in energy efficiency at various production sites,
allowing for identification of the best-performing sites and applying their concepts and
processes to all locations. Additionally, course planning can benefit from the energy
information, e. g. shifting energy-intensive production steps or batches to time periods
when energy demand and price is low.
It is even possible that the difference in the energy costs between running a given
process at full production speed and those for running it at a slower pace may be so
great, that a lowered production output is outweighed by the energy savings. If these
and other energy-related factors are going to be taken into account in the design of
the production lines of the future, then the production engineers will have to be fitted
with the required tools that will help them make the right decisions.
Existing simulation systems could be adapted by making it possible to specify the
energy requirements for the different machines at different loads. With these
Chapter 6 – Monitoring and Simulation of Production Energy Usage Using SoA
110
changes, the simulation would be able to output the energy usage values for each
machine, or section of the production line during the different production phases. This
would make it easier for the process engineer to identify and experiment with
innovative strategies for reducing energy usage in the production process.
The following section describes how modern tools and paradigms may facilitate this
transition without impacting major changes on the existing tools.
6.4. Developments
Recent trends in the industry point towards reduced time-to-market, shorter product
lifecycles and mass customization of the product itself. In order to face these
challenges, the production lines require the increased flexibility which will allow them
to adapt to evolving production processes, and even to support various simultaneous
production runs with shared resources.
These production goals are supported by the advent of modern computerized
systems, tending to be ever more powerful, reliable and miniaturized, while featuring
increasingly sophisticated communication capabilities. This has led to production
machines featuring embedded information systems, making them more intelligent and
better able to cooperate rather than simply operate in the production system.
Fully taking advantage of these new capabilities, however, requires the development
of new production paradigms. One possibility which is taking track both in the industry
and in academia is the adoption of the SoA paradigm in the production setting. In [9]
the authors define the concept of “SoA for devices” as an extension of the SoA
paradigm into the production device space, allowing the creation of a communications
infrastructure entirely based on high-level interaction patterns, categorized into six
levels of functionality: Addressing, Discovery, Description, Control, Eventing and
Presentation.
These characteristics have been compiled in a specification called Devices Profile for
Web Services (DPWS) [25] which defines a minimal set of implementation constraints
for SoA-based production devices. Thus, a DPWS-based device is guaranteed to
feature a minimal set of plug-and-play functionality, enabling it to plug into a
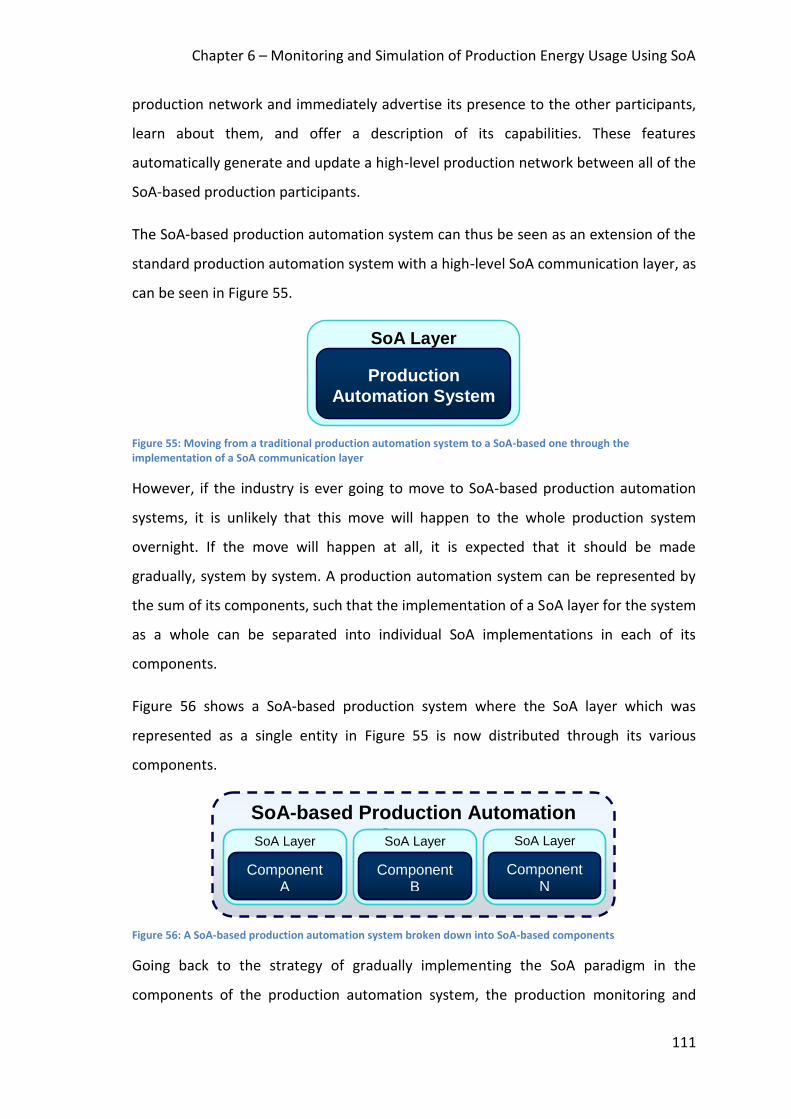
Chapter 6 – Monitoring and Simulation of Production Energy Usage Using SoA
111
production network and immediately advertise its presence to the other participants,
learn about them, and offer a description of its capabilities. These features
automatically generate and update a high-level production network between all of the
SoA-based production participants.
The SoA-based production automation system can thus be seen as an extension of the
standard production automation system with a high-level SoA communication layer, as
can be seen in Figure 55.
Figure 55: Moving from a traditional production automation system to a SoA-based one through the implementation of a SoA communication layer
However, if the industry is ever going to move to SoA-based production automation
systems, it is unlikely that this move will happen to the whole production system
overnight. If the move will happen at all, it is expected that it should be made
gradually, system by system. A production automation system can be represented by
the sum of its components, such that the implementation of a SoA layer for the system
as a whole can be separated into individual SoA implementations in each of its
components.
Figure 56 shows a SoA-based production system where the SoA layer which was
represented as a single entity in Figure 55 is now distributed through its various
components.
Figure 56: A SoA-based production automation system broken down into SoA-based components
Going back to the strategy of gradually implementing the SoA paradigm in the
components of the production automation system, the production monitoring and
SoA Layer
Production
Automation System
SoA-based Production Automation
System SoA Layer
Component A
SoA Layer
Component B
SoA Layer
Component N
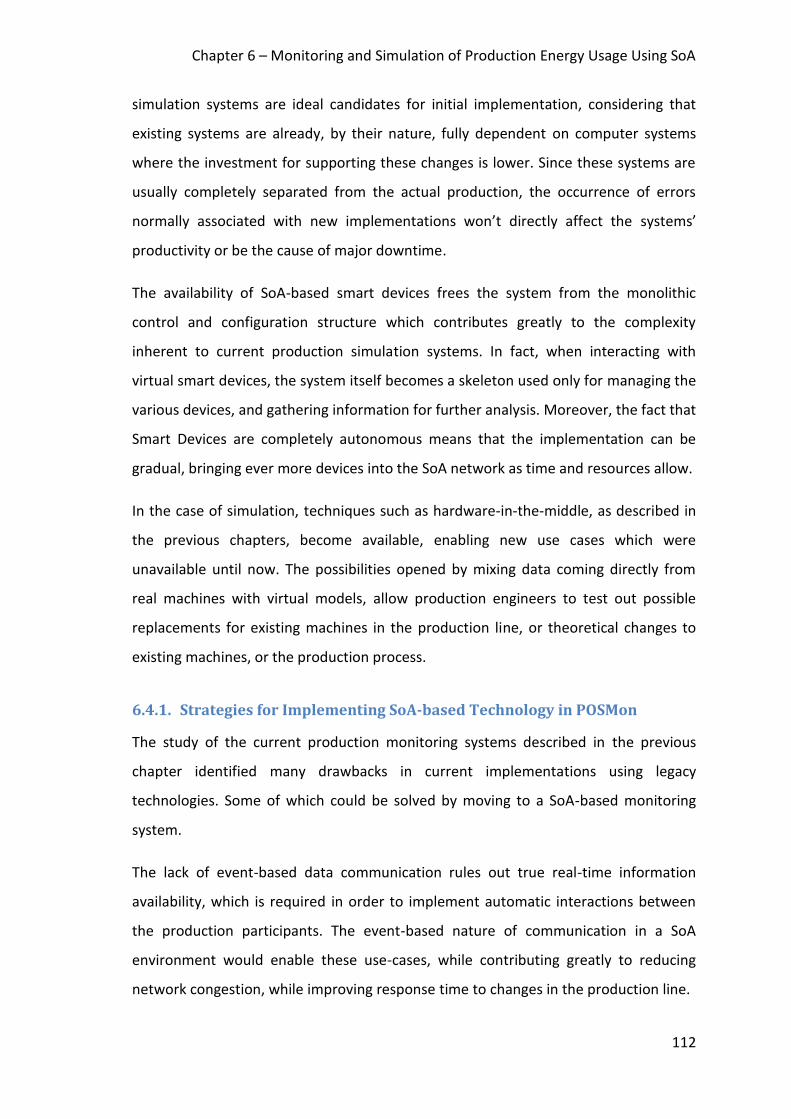
Chapter 6 – Monitoring and Simulation of Production Energy Usage Using SoA
112
simulation systems are ideal candidates for initial implementation, considering that
existing systems are already, by their nature, fully dependent on computer systems
where the investment for supporting these changes is lower. Since these systems are
usually completely separated from the actual production, the occurrence of errors
normally associated with new implementations won’t directly affect the systems’
productivity or be the cause of major downtime.
The availability of SoA-based smart devices frees the system from the monolithic
control and configuration structure which contributes greatly to the complexity
inherent to current production simulation systems. In fact, when interacting with
virtual smart devices, the system itself becomes a skeleton used only for managing the
various devices, and gathering information for further analysis. Moreover, the fact that
Smart Devices are completely autonomous means that the implementation can be
gradual, bringing ever more devices into the SoA network as time and resources allow.
In the case of simulation, techniques such as hardware-in-the-middle, as described in
the previous chapters, become available, enabling new use cases which were
unavailable until now. The possibilities opened by mixing data coming directly from
real machines with virtual models, allow production engineers to test out possible
replacements for existing machines in the production line, or theoretical changes to
existing machines, or the production process.
6.4.1. Strategies for Implementing SoA-based Technology in POSMon
The study of the current production monitoring systems described in the previous
chapter identified many drawbacks in current implementations using legacy
technologies. Some of which could be solved by moving to a SoA-based monitoring
system.
The lack of event-based data communication rules out true real-time information
availability, which is required in order to implement automatic interactions between
the production participants. The event-based nature of communication in a SoA
environment would enable these use-cases, while contributing greatly to reducing
network congestion, while improving response time to changes in the production line.
Chapter 6 – Monitoring and Simulation of Production Energy Usage Using SoA
113
Furthermore, current monitoring systems tend to be proprietary systems based on
closed, legacy networks which are difficult to extend as the production line evolves.
New devices must be programmed, usually by the system’s integrator, to work within
a very specific set of functionality offered by the monitoring system. A SoA-based
system would mean that the system is implemented according to standardized, open
protocols. This would enable the system integrator to offload the development and
testing of the monitoring system to the machine vendors, possibly working the
competition between vendors to its advantage.
Finally, using the discoverability protocols inherent to SoA-based automation systems,
the configuration and expansion of new machines in the production line would
become much easier for the system integrator, since the machine would be
automatically visible to the monitoring system.
Connection to the Production Process
Currently, there is no connection between the production monitoring systems and the
production process. In fact, the production process in many modern production
facilities is comprised of autonomous, statically programmed sequences of operations
implemented on each machine’s local controller. This means that as a work piece
comes into a given machine in the production line, it is identified, and the program for
the machining of that part is run locally. After the program is finished, the part is
ejected to the output conveyor and goes on to the next machine for further
operations.
It is expected that major savings in energy used during production can be achieved by
getting information on the process status, e.g., for shutting down a machine if no parts
are expected to arrive at that machine for a long period of time. If the machine in that
case could subscribe to the events coming from a centralized process controller, or
even from the individual machines on its upstream, it would be able to calculate how
long it would take until the next part arrives, and decide if it should shut down
automatically, according to its individual energy parameters.
Chapter 6 – Monitoring and Simulation of Production Energy Usage Using SoA
114
Another option would be to have a centralized energy efficiency governor which
would monitor events coming from all the machines under its area of influence in the
production line, and run these types of energy efficiency optimizations locally.
Improvements to Existing Systems
It isn’t realistic to think that it is possible to replace a system as complex as POSMon by
a more modern system anytime soon. A new system would have to support all of the
functionality existing in the current system, while making sure that the benefits of the
migration would outweigh the costs of development and staff retraining. Furthermore,
it would have to support legacy systems in already existing production lines. This
monumental investment would be a hard sell, and would probably take too long to
implement in a reliable manner.
It is, however, more credible that SoA-based functionality could be brought to the
current POSMon system by selectively improving its subsystems in order to iteratively
implement event-based communication in the production line according to specific
needs. It is conceivable that a machine would be able to participate simultaneously in
a legacy POSMon network and on a parallel SoA-based network.
As more and more machines in the production line become participants in the new
network, other legacy machines can be brought over to it through the use of
middleware solutions which translate traditional POSMon data packets into event-
based messages.
6.4.2. Development of an Energy-related, SoA-based Production System
The recent drive towards improving energy efficiency in every facet of modern life has
been hit with the realization that the current methods for measuring energy usage are
usually very basic and unsuitable for large-scale adoption of energy-saving measures.
In many production plants, as in most homes, the energy usage information is no more
detailed than the values for the energy being used by the whole building which can be
read at the electricity meter, without any way to know exactly how that energy is
distributed inside it, or even how that usage is distributed.
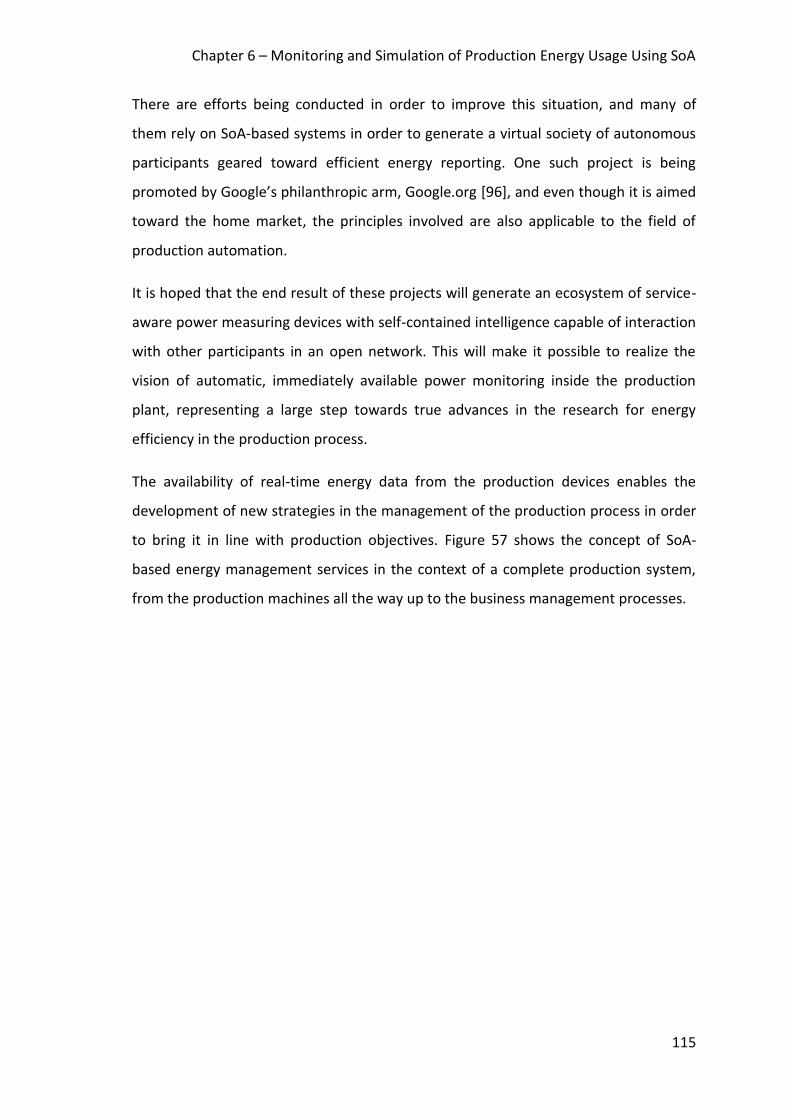
Chapter 6 – Monitoring and Simulation of Production Energy Usage Using SoA
115
There are efforts being conducted in order to improve this situation, and many of
them rely on SoA-based systems in order to generate a virtual society of autonomous
participants geared toward efficient energy reporting. One such project is being
promoted by Google’s philanthropic arm, Google.org [96], and even though it is aimed
toward the home market, the principles involved are also applicable to the field of
production automation.
It is hoped that the end result of these projects will generate an ecosystem of service-
aware power measuring devices with self-contained intelligence capable of interaction
with other participants in an open network. This will make it possible to realize the
vision of automatic, immediately available power monitoring inside the production
plant, representing a large step towards true advances in the research for energy
efficiency in the production process.
The availability of real-time energy data from the production devices enables the
development of new strategies in the management of the production process in order
to bring it in line with production objectives. Figure 57 shows the concept of SoA-
based energy management services in the context of a complete production system,
from the production machines all the way up to the business management processes.
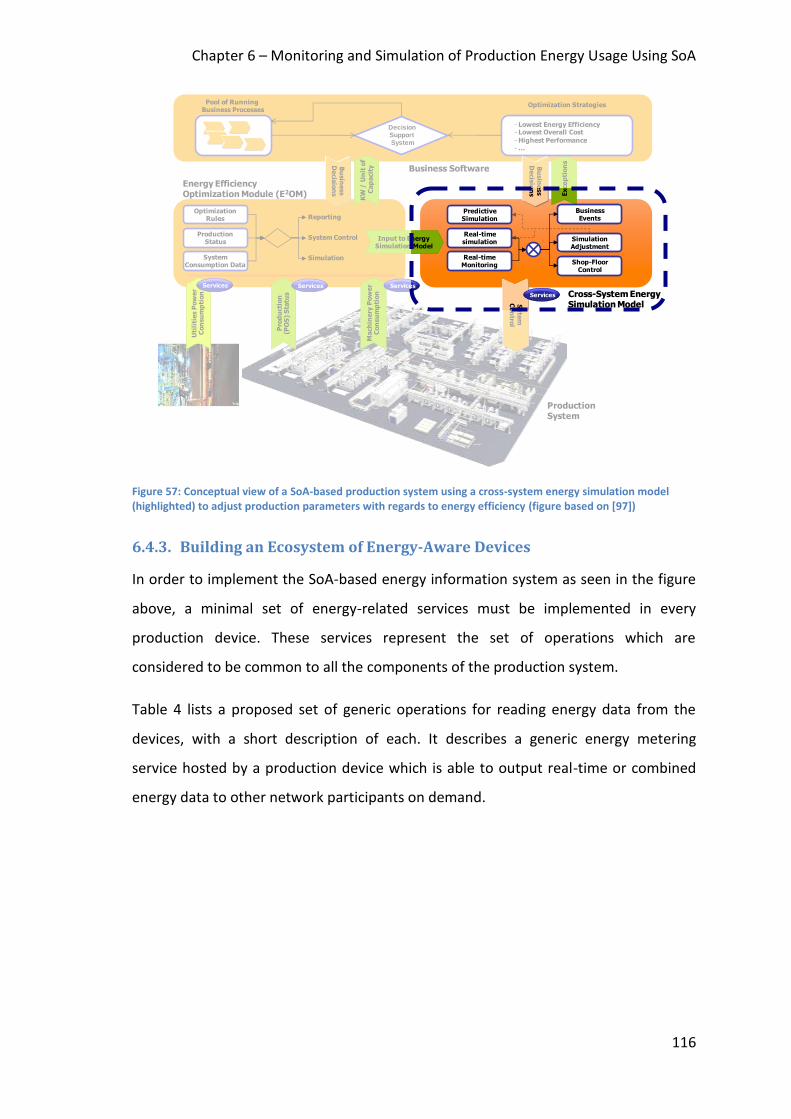
Chapter 6 – Monitoring and Simulation of Production Energy Usage Using SoA
116
Figure 57: Conceptual view of a SoA-based production system using a cross-system energy simulation model (highlighted) to adjust production parameters with regards to energy efficiency (figure based on [97])
6.4.3. Building an Ecosystem of Energy-Aware Devices
In order to implement the SoA-based energy information system as seen in the figure
above, a minimal set of energy-related services must be implemented in every
production device. These services represent the set of operations which are
considered to be common to all the components of the production system.
Table 4 lists a proposed set of generic operations for reading energy data from the
devices, with a short description of each. It describes a generic energy metering
service hosted by a production device which is able to output real-time or combined
energy data to other network participants on demand.
Energy EfficiencyOptimization Module (E2OM)
Mach
inery
Pow
er
Co
nsu
mp
tion
Uti
liti
es P
ow
er
Con
su
mp
tion
Pro
du
cti
on
(P
OS
) S
tatu
s
Reporting
ProductionSystem
Cross-System Energy Simulation Model
Bu
sin
ess
Decis
ion
s
Services Services Services
Business Software
KW
/ U
nit
of
Ca
pacit
y
Excep
tion
s
Input to EnergySimulation Model
Pool of Running Business Processes
DecisionSupport System
Optimization Strategies
- Lowest Energy Efficiency- Lowest Overall Cost
-Highest Performance-…
Bu
sin
ess
Decis
ion
s
OptimizationRules
ProductionStatus
System Consumption Data
Syte
mC
on
trol
Services
Simulation
System Control
PredictiveSimulation
Real-time simulation
Real-timeMonitoring
Business Events
Simulation Adjustment
Shop-FloorControl
Energy EfficiencyOptimization Module (E2OM)
Mach
inery
Pow
er
Con
su
mp
tion
Uti
liti
es P
ow
er
Co
nsu
mp
tio
n
Pro
du
cti
on
(P
OS
) S
tatu
s
Reporting
ProductionSystem
Cross-System Energy Simulation Model
Bu
sin
ess
Decis
ion
s
Services Services Services
Business Software
KW
/ U
nit
of
Ca
pa
cit
y
Excep
tion
s
Input to EnergySimulation Model
Pool of Running Business Processes
DecisionSupport System
Optimization Strategies
- Lowest Energy Efficiency- Lowest Overall Cost
-Highest Performance-…
Bu
sin
ess
Decis
ion
s
OptimizationRules
ProductionStatus
System Consumption Data
Syte
mC
on
trol
Services
Simulation
System Control
PredictiveSimulation
Real-time simulation
Real-timeMonitoring
Business Events
Simulation Adjustment
Shop-FloorControl

Chapter 6 – Monitoring and Simulation of Production Energy Usage Using SoA
117
TABLE 4: SERVICE DESCRIPTION FOR ENERGY METERING
Operation Type Description
GetActualReading Request-Reply
Returns the current value of the measured resource
ActualReading Event (cyclic)
Cyclic event containing the current value of the measured resource
GetPhysicalUnit Request-Reply
Returns the SI unit of the measured resource
GetMinMaxReading Request-Reply
Returns the minimal and maximal value of the measured resource since the last reset
ResetMinMax Request Resets the minimal and maximal value of the measured resource
GetOperationStateStatistics Request-Reply
Returns the collected resource consumption of the Monitored Consumer
ResetOperationStateStatistics Request Resets the average, minimal and maximal values of the collected resource consumption
OperationStateChanged Event Event generated when the device’s operation state changes
In the same spirit, another set of services is proposed for performing energy-related
control operations on the devices themselves. These operations, which can be seen in
Table 5, were developed in order to support the predicted start-up and shutdown
techniques described previously in this chapter.
Chapter 6 – Monitoring and Simulation of Production Energy Usage Using SoA
118
TABLE 5: SERVICE DESCRIPTION FOR ENERGY MANAGEMENT
Operation Type Description
AnnounceActivity Request Creates a new activity in the device’s queue for a given timeframe
RevokeAllActivities Request Revokes all pending activities GetState Request-
Reply Retrieve the actual state of the controlled device
GetNextActivity Request-Reply
Returns the time to the next activity
SetMinimalOffTime Request Set the minimal time in state “off”, avoiding unnecessarily shutting down the controlled device
GetMinimalOffTime Request-Reply
Retrieve the minimal time in state “off”
SetMaximalStartupTime Request Sets the maximum allowed time to start up the controlled device
GetMaximalStartupTime Request-Reply
Retrieves the maximum allowed time to start the controlled device
OperationStateChanged Event Event generated when the device’s operation state changes
Once the production system is fitted with SoA-based power measurement devices, the
data can be gathered by the production monitoring system, along with other relevant
production data. The information may be then worked-on according to current
production rules and other criteria supplied both by the production engineer and via
interaction with the business process controller, feeding the results as input to an
energy simulation model which, via further consultation with the business process, is
able to generate different energy usage scenarios according to the different energy
profiles in effect.
The output from the simulation is then used by the production controller’s decision
support system to influence the process accordingly.
6.5. Comments
The advent of the SoA paradigm for production automation may represent the
solution that manufacturers need in order to face today’s manufacturing challenges. A
profound change in production paradigms does not, however, happen overnight, but
by gradually adapting existing components in a hybrid system until the change has
been completed. In this respect, the simulation system is an ideal candidate for initial
Chapter 6 – Monitoring and Simulation of Production Energy Usage Using SoA
119
adaptation, considering its software-based nature and disconnect from the essential
production equipment.
Ford’s® production support systems represent the current state-of-the-art in their
respective fields. Though the systems have benefitted from years of development and
are still serving Ford’s® production engineers successfully, the drawbacks imposed by
their aging architecture and years of feature creep are withholding them from
straightforward adaptation to the new technologies and techniques being made
available by the advent of SoA-based production systems.
This document does not, however, argue for a wholesale replacement of the existing
systems, but instead suggests that much of the currently centralized functionality can
be modularized by moving much of it to the scope of the device, generating a next
generation system which would benefit from more efficient cooperation between the
simulation and monitoring systems and networked virtual or real smart devices.
The availability of SoA-based smart devices with built-in energy management services
would enable new avenues to explore, both during the design of production lines and
later during operation, by making energy usage and cost comparison available in real-
time to the production engineers. Moreover, the advent of SoA-based energy
monitoring in the production floor will generate new uses for the simulation system
where it migrates from being used only for energy simulation usage during the design
phase, to becoming an active participant. Using the real-time information supplied by
the monitoring system, and the energy simulation output, the decision support system
is fitted with new information which may allow it to lower energy usage in the
production line, and therefore, production costs.
Chapter 7 – Energy Management Using SoA
120
Chapter 7. Energy Management Using SoA
This chapter describes the implementation of a production simulation system with a
focus on improving energy efficiency in production automation systems. The
extensibility afforded by the flexible nature of SoA-based production systems is
explored with the addition of energy parameters to the virtual environment.
7.1. SoA-based Energy Simulation
The advent of SoA-based production systems is positioned as a major solution to many
of the problems currently facing the industry, including the specific fields of
production monitoring, simulation and energy efficiency. It is expected that the SoA-
based tools and techniques described in the previous section can be applied directly to
these fields.
First, however, a study must be made on the industrial requirements for these
systems, as well as the tools currently in use. Moreover, the energy usage as well as
the main strategies for improving energy efficiency in the factory floor must first be
understood. This information can then be used as a starting point to the development
of a strategy for the implementation of the SoA paradigm in the current industrial
setting.
7.1.1. Building a SoA-based Energy Simulation System
The first step in building an energy simulation system is creating a detailed definition
of its requirements. For the purposes of this study, the following were identified:
Accurately simulate the productivity of a production cell over time
Track the energy usage for the devices in the production cell
Retain a high level of configurability so that different scenarios can be easily
tested
Chapter 7 – Energy Management Using SoA
121
Quickly generate results in order to lower the effort for testing various
iterations of different scenarios
Present the results in an easily manageable, cross-platform data format
Moreover, the above requirements can be used to simplify the design, development
and operation of the simulation system by selecting the aspects of the real production
system which do not need to be simulated, for example:
Small variations in the timings or energy usage of a given operation for a given
device type, as those have been measured to be relatively small across
installations;
Personnel shifts, break times and machine breakdown;
Production details such as parts rejected;
Energy usage does not need to be presented in real-time curves.
It is important to expand upon a few of the above aspects. The level of detail in the
simulation and presentation of productivity-related data is intentionally low due to the
fact that it is largely unimportant to the work here described. These indicators have
been the focus of traditional simulation packages since the dawn of production
simulation, and have been developed to considerable complexity in other packages.
Attempting to replicate those features would increase enormously the scope of the
proposed system, and detract from the original intended goal of monitoring and
analysing the energy usage inside the production cell.
Instead, the proposed system abstracts the above features and attempts to replicate
the simulated functionality so that the average productivity of the simulated hardware
fits with known average values for that specific line. Once this is achieved, the
scheduling of the new simulation is validated, and it is possible to proceed with
measuring the energy usage within the line.
Furthermore, it was decided against reporting the real-time curves in the energy
usage, but instead to focus on the sum amount of energy used for a given time span,
e.g. the time it takes for the machine to perform a given task. This keeps the focus of
Chapter 7 – Energy Management Using SoA
122
the energy reports on the overall energy usage in the production cell, while also
simplifying reconfigurability and the development of new virtual smart devices by not
requiring that the detailed energy usage profiles of each task in each machine be
reproduced.
Once the requirements for the simulation system have been gathered, it is possible to
make informed decisions on its overall architecture and implementation. The first
consideration to be made, and the one which will have the deepest impact on the
resulting system is the choice between real-time or discrete event simulation systems.
For our purposes the second was chosen given that the requirements call for the
simulation of productivity over a period of time and aren't concerned with real-time
production characteristics such as object collision or part transfer procedures.
Moreover, the characteristics of the required data output means that the simulated
devices do not need to feature the complex inner workings of their real counterparts.
However, given the need for easy reconfigurability, the smart devices cannot
encompass too much functionality, as those characteristics might change with a new
production layout.
7.1.2. Discrete Event Simulation Systems With Smart Devices
The development and usage of Smart Devices has been previously discussed by the
authors at length in previous publications, e.g., [98] and [74]. There are however a few
important distinctions in the Smart Devices as described in those documents, and the
ones proposed here which have risen due to the fundamental differences between a
real-time simulation system, which was the target in the referred articles, and the
discrete event simulation system here proposed.
It should be made clear that any variations are limited to implementation details, and
not the overall Smart Device model. Functionally, the virtual devices in both simulation
paradigms have identical characteristics, and use cases, conforming to the original
definition of what constitutes a Smart Device. Specifically, those devices remain self-
contained, autonomous participants in the production network, with clearly defined
service interfaces.
Chapter 7 – Energy Management Using SoA
123
From a technical point of view, discrete simulation systems are meant to run in a
single computer system. Since they feature a custom clock, they're also not meant to
interact with outside systems, at least during the simulation run, since that would
require very complex synchronization with the outside participant, and would defeat
the purpose of the event-based nature since its goal is exactly to advance time as
quickly as possible by maintaining complete control over the event queue.
Given that no communication to the outside is necessary, the service implementation
in the smart devices has to be fundamentally changed from what had been
implemented previously. Instead of using a service development framework, such as
DPWS [25], a different infrastructure has to be developed, catered to local
communication which maintains the major capabilities expected from smart devices.
Even when stripped of its asynchronous communication features, the SoA paradigm is
still very beneficial in a closed system such as the one here described due to its focus
on fully integrated and autonomous functionality, with a clear interface description
and eventing capabilities. These properties contribute to greatly simplify the
development and integration of the smart devices into the internal simulation
network.
7.1.3. Adding Energy Monitoring Indexes to the Simulation System
Given the SoA-based nature of the simulation system and its uncoupled nature, the
addition of the desired functionality can be achieved by simply adding new energy-
related services to the existing framework. Once the energy-aware services are
defined, they need to be implemented in the smart devices by adding that service to
the existing pool of running services in the device. After that, once the logging
component is made aware of the new messages, it can start recording the changing
values, normally by using the system-wide events generated by the devices, though
that data may also be collected in a more direct manner using regular service calls. It is
up to the particular implementation to decide which method is more convenient,
depending on the intended use.
Chapter 7 – Energy Management Using SoA
124
The relative ease with which energy monitoring indexes are added to an existing
system is a testament to the flexibility afforded by the SoA-based simulation systems,
and one of the strongest arguments in favour of its adoption in large-scale production
manufacturing. Going forwards, it is comforting to know that if new monitoring
requirements emerge, their availability is a few service implementations away.
7.2. Architecture of the SoA-based Discrete Event Simulation System
In order to develop a SoA-based simulation system, the following facilities are
expected:
Controller: a production control system which may be centralized or
distributed, depending on the specific architecture of the cell;
Service framework: Describes the available services and specifies how the
different participants in the simulation communicate with each other;
Devices: Implement the required services in order to participate in the network
to achieve their desired functionality;
Log: Keeps a list of relevant events which are given as results when the
simulation terminates.
Moreover, because a discrete event simulation system advances time from one
simulation event to the next, it is required that those events and their timings be
known beforehand. To that end, an extra component unique to a discrete event
simulation system has to be created. This component keeps track of all of the
simulation events in the system, and allows any device to create (schedule) or delete
(unscheduled) events from the event queue, according to the evolution of the
simulated production:
Simulation manager: Keeps and advances the virtual clock time. It also
maintains a list of events, the device which created the event and the time at
which they occur.
The Simulation Manager maintains the current simulation time and an internal
database where events are stored ordered by their scheduled firing times.
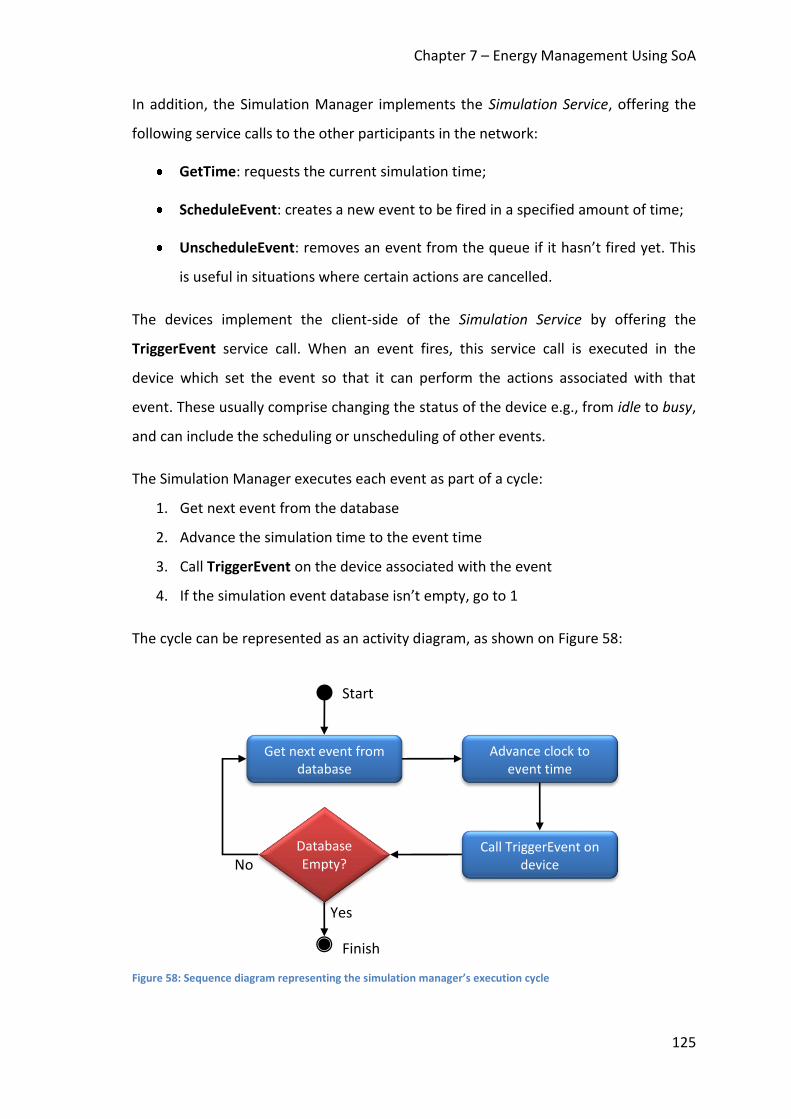
Chapter 7 – Energy Management Using SoA
125
In addition, the Simulation Manager implements the Simulation Service, offering the
following service calls to the other participants in the network:
GetTime: requests the current simulation time;
ScheduleEvent: creates a new event to be fired in a specified amount of time;
UnscheduleEvent: removes an event from the queue if it hasn’t fired yet. This
is useful in situations where certain actions are cancelled.
The devices implement the client-side of the Simulation Service by offering the
TriggerEvent service call. When an event fires, this service call is executed in the
device which set the event so that it can perform the actions associated with that
event. These usually comprise changing the status of the device e.g., from idle to busy,
and can include the scheduling or unscheduling of other events.
The Simulation Manager executes each event as part of a cycle:
1. Get next event from the database
2. Advance the simulation time to the event time
3. Call TriggerEvent on the device associated with the event
4. If the simulation event database isn’t empty, go to 1
The cycle can be represented as an activity diagram, as shown on Figure 58:
Figure 58: Sequence diagram representing the simulation manager’s execution cycle
Get next event from database
Advance clock to event time
Call TriggerEvent on device
Database Empty?
Yes
No
Start
Finish
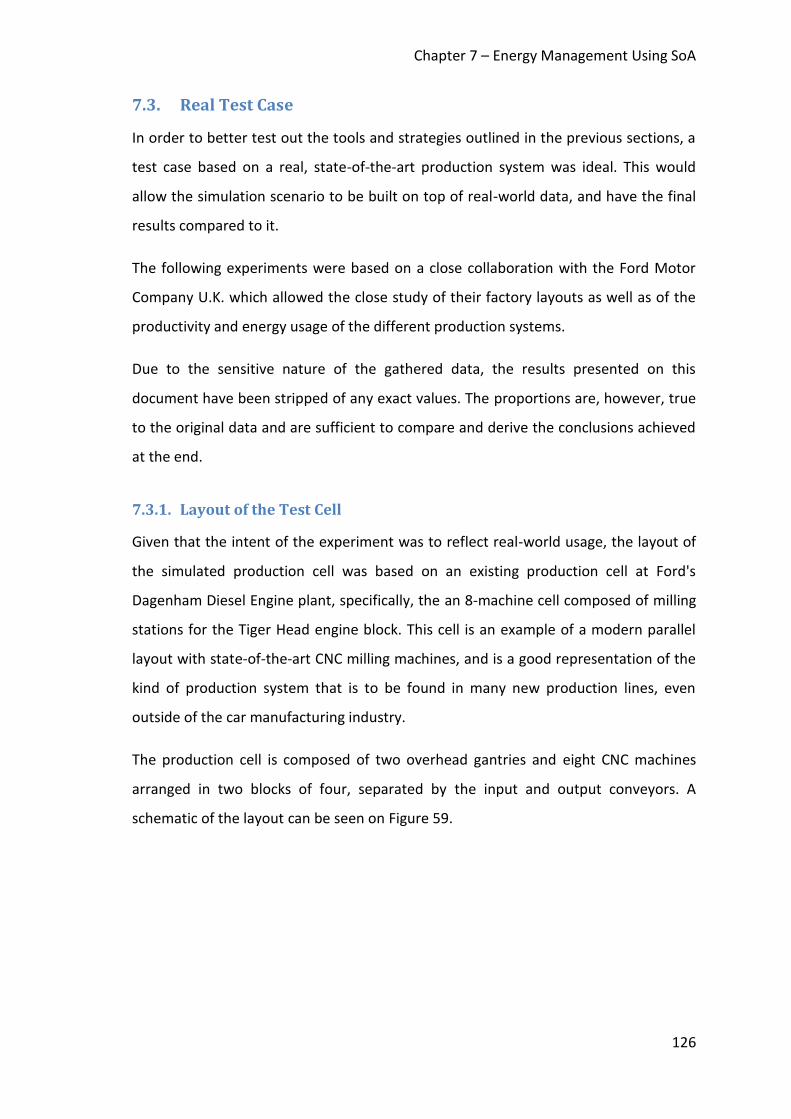
Chapter 7 – Energy Management Using SoA
126
7.3. Real Test Case
In order to better test out the tools and strategies outlined in the previous sections, a
test case based on a real, state-of-the-art production system was ideal. This would
allow the simulation scenario to be built on top of real-world data, and have the final
results compared to it.
The following experiments were based on a close collaboration with the Ford Motor
Company U.K. which allowed the close study of their factory layouts as well as of the
productivity and energy usage of the different production systems.
Due to the sensitive nature of the gathered data, the results presented on this
document have been stripped of any exact values. The proportions are, however, true
to the original data and are sufficient to compare and derive the conclusions achieved
at the end.
7.3.1. Layout of the Test Cell
Given that the intent of the experiment was to reflect real-world usage, the layout of
the simulated production cell was based on an existing production cell at Ford's
Dagenham Diesel Engine plant, specifically, the an 8-machine cell composed of milling
stations for the Tiger Head engine block. This cell is an example of a modern parallel
layout with state-of-the-art CNC milling machines, and is a good representation of the
kind of production system that is to be found in many new production lines, even
outside of the car manufacturing industry.
The production cell is composed of two overhead gantries and eight CNC machines
arranged in two blocks of four, separated by the input and output conveyors. A
schematic of the layout can be seen on Figure 59.
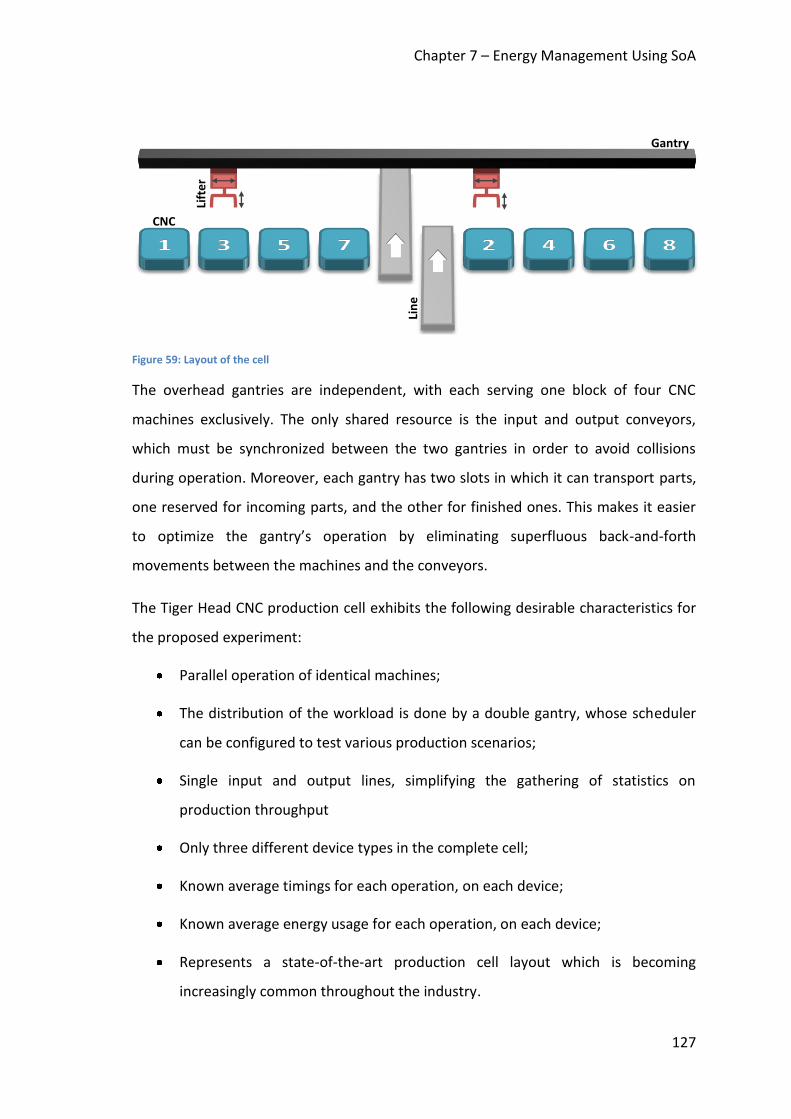
Chapter 7 – Energy Management Using SoA
127
Figure 59: Layout of the cell
The overhead gantries are independent, with each serving one block of four CNC
machines exclusively. The only shared resource is the input and output conveyors,
which must be synchronized between the two gantries in order to avoid collisions
during operation. Moreover, each gantry has two slots in which it can transport parts,
one reserved for incoming parts, and the other for finished ones. This makes it easier
to optimize the gantry’s operation by eliminating superfluous back-and-forth
movements between the machines and the conveyors.
The Tiger Head CNC production cell exhibits the following desirable characteristics for
the proposed experiment:
Parallel operation of identical machines;
The distribution of the workload is done by a double gantry, whose scheduler
can be configured to test various production scenarios;
Single input and output lines, simplifying the gathering of statistics on
production throughput
Only three different device types in the complete cell;
Known average timings for each operation, on each device;
Known average energy usage for each operation, on each device;
Represents a state-of-the-art production cell layout which is becoming
increasingly common throughout the industry.
Gantry
CNC Li
fte
r
Lin
e

Chapter 7 – Energy Management Using SoA
128
7.3.2. SoA Architecture
Figure 60 depicts the various components of the test cell, mapped to the SoA-based
discrete simulation system. The figure shows the various components, their various
service endpoints and their relationships inside the SoA-based network.
Figure 60: Architecture of the test cell applied to the SoA-based discrete simulation system
This architecture allows modelling the complex interactions between the various
components with a relatively simple set of rules. Given a degree of intelligence
contained in the devices, coupled with the ubiquity of the communication medium
afforded by the service architecture, it is possible to abstract the knowledge of the
devices’ operational properties into their own implementations. This allows the virtual
devices to retain the required features which define a Smart Device.
It also removes the necessity for the Simulation Manager, or any other component, to
have prior knowledge of the devices in the system, thus conserving the easy
configuration and plug-and-play capabilities of the modelled cell which are the
desirable characteristics of a SoA-based simulation platform.
Controller Simulation Manager
CNC Machine Gantry Line
Log
Scheduler Lifter
SoA Network
S LD ED
S: Simulation Service P: Production Service E: Energy Service G: Gantry Service LD: Log Database ED: Event Database
E P S P
E P S S E P S
G
G G
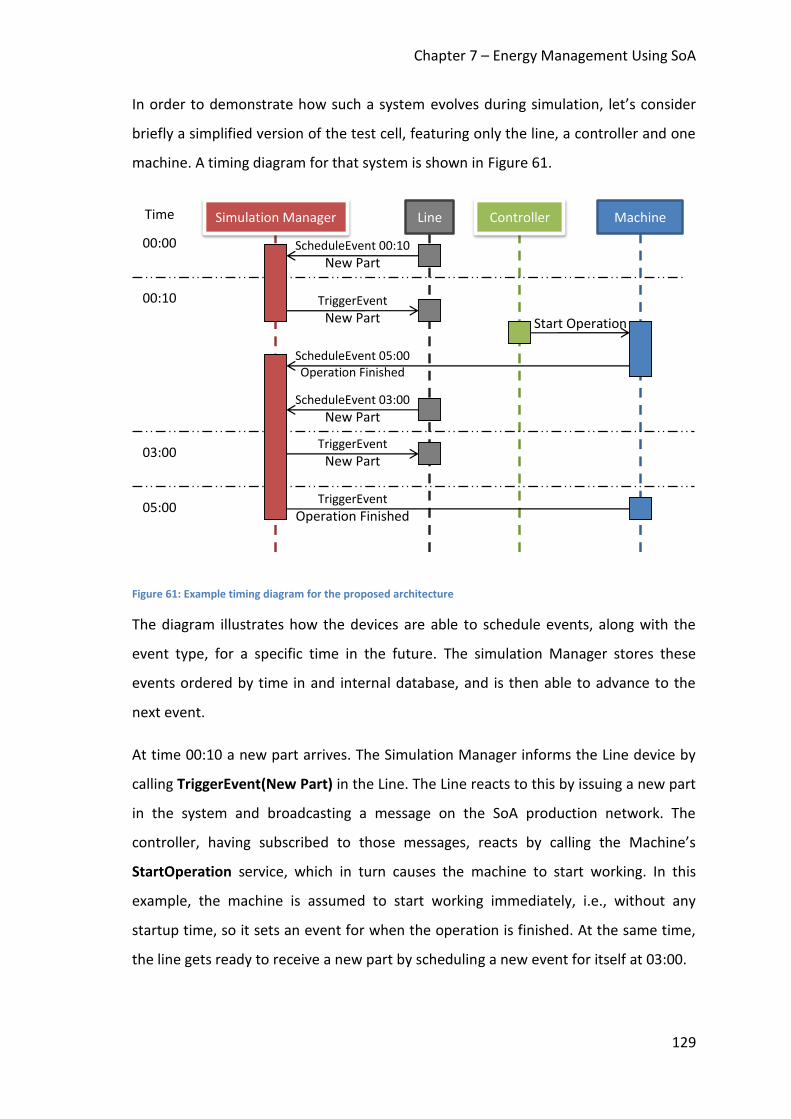
Chapter 7 – Energy Management Using SoA
129
In order to demonstrate how such a system evolves during simulation, let’s consider
briefly a simplified version of the test cell, featuring only the line, a controller and one
machine. A timing diagram for that system is shown in Figure 61.
Figure 61: Example timing diagram for the proposed architecture
The diagram illustrates how the devices are able to schedule events, along with the
event type, for a specific time in the future. The simulation Manager stores these
events ordered by time in and internal database, and is then able to advance to the
next event.
At time 00:10 a new part arrives. The Simulation Manager informs the Line device by
calling TriggerEvent(New Part) in the Line. The Line reacts to this by issuing a new part
in the system and broadcasting a message on the SoA production network. The
controller, having subscribed to those messages, reacts by calling the Machine’s
StartOperation service, which in turn causes the machine to start working. In this
example, the machine is assumed to start working immediately, i.e., without any
startup time, so it sets an event for when the operation is finished. At the same time,
the line gets ready to receive a new part by scheduling a new event for itself at 03:00.
Time
ScheduleEvent 00:10
New Part
00:00
00:10
TriggerEvent
New Part
Start Operation
ScheduleEvent 05:00 Operation Finished
05:00 TriggerEvent
Operation Finished
ScheduleEvent 03:00
New Part
03:00
TriggerEvent
New Part
Simulation Manager Line Machine Controller
Chapter 7 – Energy Management Using SoA
130
At time 03:00 we see the Simulation Manager again informing the Line that its event
has completed, but this time there are no further actions because the only machine is
already busy.
Finally, at time 05:00 we see the event informing the machine that the operation is
finished being fired. Typically, this would cause the machine to broadcast the
completion of the part in the SoA production network. The controller, reacting to this
broadcast might order the machine to begin another operation on the part which had
arrived at 03:00. The system would continue cycling as long as new parts were being
generated by the Line.
7.4. Experimental Simulation
The cell has been implemented in a simulated environment using the tools and
techniques described in the previous sections in this document. For this
implementation, the following components were developed as virtual devices:
Line: a device which is able to generate new parts in pre-set intervals. It also
acts as a sink for completed parts. The line isolates the simulated production
cell by abstracting the production systems up- and downstream as a black box-
like part input and output system. Since the line controls the part arrival rate, it
is instrumental in the implementation of the different production test
scenarios;
CNC machines: able to accept one part at a time. Upon reception of a part, the
machine starts a pre-set operation with known duration and average energy
usage. At the end of the operation, a notification is sent to its subscribers. This
device is at any time in one of four exclusive states: idle, busy, offline or
starting up;
Lifter: a component of the gantry which is able to simulate the timings and
energy usage necessary for picking and/or placing a part, either in one of the
CNC machines or on the line. A lifter represents the overhead gantry
component which serves either the left or right group of CNC machines in the
cell;
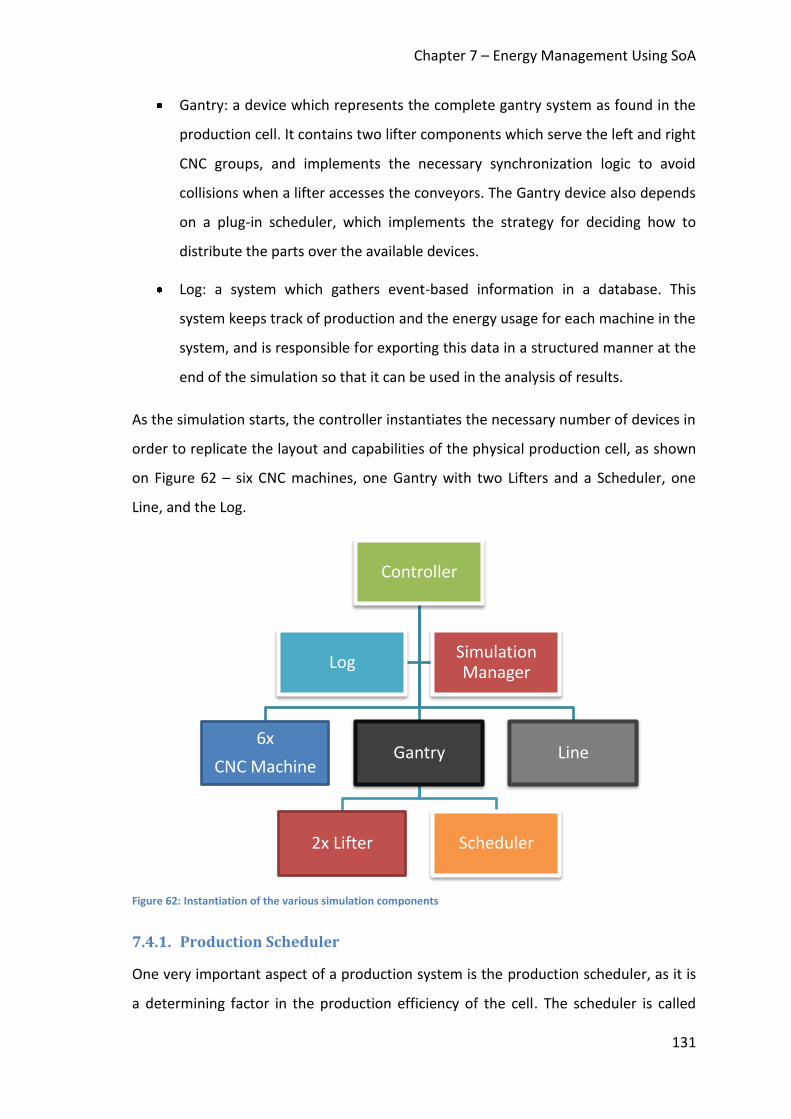
Chapter 7 – Energy Management Using SoA
131
Gantry: a device which represents the complete gantry system as found in the
production cell. It contains two lifter components which serve the left and right
CNC groups, and implements the necessary synchronization logic to avoid
collisions when a lifter accesses the conveyors. The Gantry device also depends
on a plug-in scheduler, which implements the strategy for deciding how to
distribute the parts over the available devices.
Log: a system which gathers event-based information in a database. This
system keeps track of production and the energy usage for each machine in the
system, and is responsible for exporting this data in a structured manner at the
end of the simulation so that it can be used in the analysis of results.
As the simulation starts, the controller instantiates the necessary number of devices in
order to replicate the layout and capabilities of the physical production cell, as shown
on Figure 62 – six CNC machines, one Gantry with two Lifters and a Scheduler, one
Line, and the Log.
Figure 62: Instantiation of the various simulation components
7.4.1. Production Scheduler
One very important aspect of a production system is the production scheduler, as it is
a determining factor in the production efficiency of the cell. The scheduler is called
Controller
6x
CNC Machine Gantry
2x Lifter Scheduler
Line
Log Simulation Manager
Chapter 7 – Energy Management Using SoA
132
into action whenever there is a part which needs to be picked up, either because a
new one has arrived in the line, or one of the CNC machines has finished its operation.
When that happens, the scheduler must decide which lifter to use, and, in the case of
a new part, which idle machine to load next.
Normally the information available to the scheduler is limited to its direct
environment, which is usually limited to the actual status of the relevant machines, as
well as the availability of new parts. As a consequence, the scheduler must implement
a best-effort strategy based on the meagre information available in order to maximize
the desired production objectives.
As we will see later, however, in a Service-based production system, it is possible for
the scheduler to query other participants in the network directly in order to better
estimate the upcoming workload and adapt its strategy accordingly.
The Traditional Production Scheduler
The typical production schedulers which can be found in operation in today’s
production systems were usually developed with the sole concern of maximizing
production throughput (measured in parts per hour, or PPH) at the expense of many
other considerations, one of which being energy usage. Those production-maximizing
strategies follow roughly the following rules:
When a new part arrives, it is fed to the nearest idle machine
If a new part arrives and all machines are busy, the part is pre-loaded in one of
the lifters
When a new part is completed it is put back on the production line as soon as
possible
7.4.2. Test Scenario
For this work, a test scenario was envisioned where production suffers from a
breakdown somewhere upstream in the line, severely strangling the flow of new parts
arriving at our test cell. Before the breakdown, the flow is close to optimal, i.e., all the
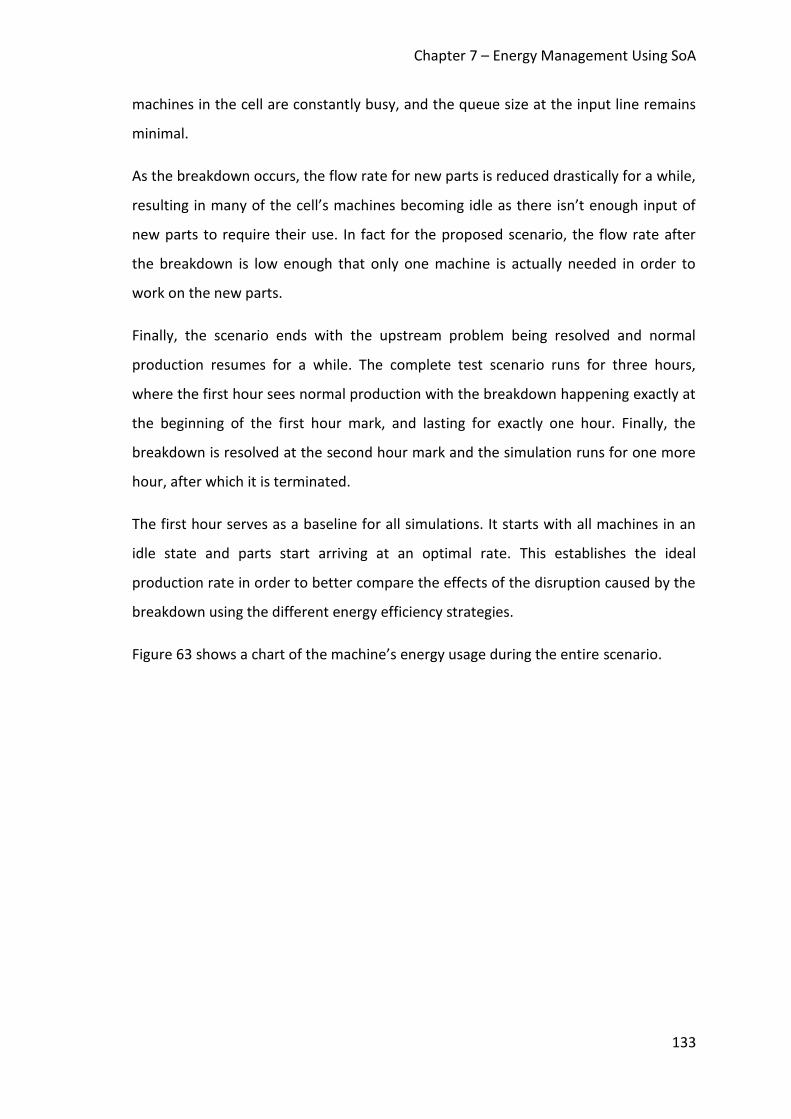
Chapter 7 – Energy Management Using SoA
133
machines in the cell are constantly busy, and the queue size at the input line remains
minimal.
As the breakdown occurs, the flow rate for new parts is reduced drastically for a while,
resulting in many of the cell’s machines becoming idle as there isn’t enough input of
new parts to require their use. In fact for the proposed scenario, the flow rate after
the breakdown is low enough that only one machine is actually needed in order to
work on the new parts.
Finally, the scenario ends with the upstream problem being resolved and normal
production resumes for a while. The complete test scenario runs for three hours,
where the first hour sees normal production with the breakdown happening exactly at
the beginning of the first hour mark, and lasting for exactly one hour. Finally, the
breakdown is resolved at the second hour mark and the simulation runs for one more
hour, after which it is terminated.
The first hour serves as a baseline for all simulations. It starts with all machines in an
idle state and parts start arriving at an optimal rate. This establishes the ideal
production rate in order to better compare the effects of the disruption caused by the
breakdown using the different energy efficiency strategies.
Figure 63 shows a chart of the machine’s energy usage during the entire scenario.
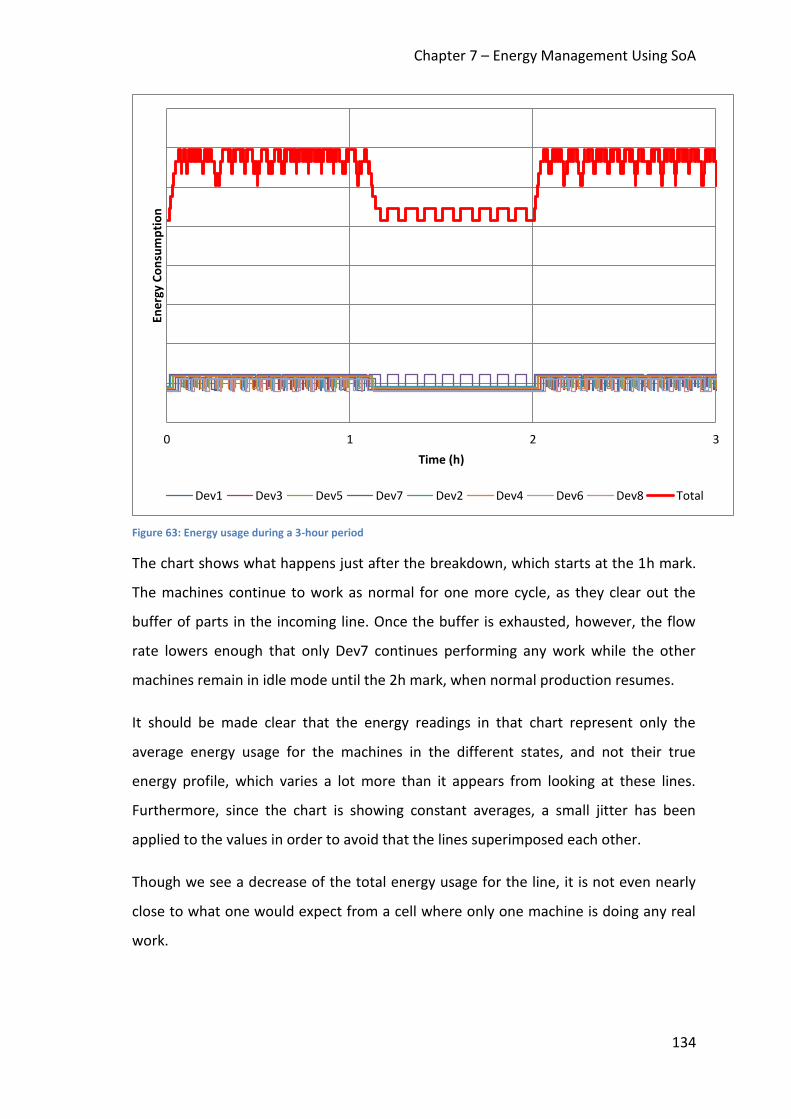
Chapter 7 – Energy Management Using SoA
134
Figure 63: Energy usage during a 3-hour period
The chart shows what happens just after the breakdown, which starts at the 1h mark.
The machines continue to work as normal for one more cycle, as they clear out the
buffer of parts in the incoming line. Once the buffer is exhausted, however, the flow
rate lowers enough that only Dev7 continues performing any work while the other
machines remain in idle mode until the 2h mark, when normal production resumes.
It should be made clear that the energy readings in that chart represent only the
average energy usage for the machines in the different states, and not their true
energy profile, which varies a lot more than it appears from looking at these lines.
Furthermore, since the chart is showing constant averages, a small jitter has been
applied to the values in order to avoid that the lines superimposed each other.
Though we see a decrease of the total energy usage for the line, it is not even nearly
close to what one would expect from a cell where only one machine is doing any real
work.
0 1 2 3
Ene
rgy
Co
nsu
mp
tio
n
Time (h)
Dev1 Dev3 Dev5 Dev7 Dev2 Dev4 Dev6 Dev8 Total
Chapter 7 – Energy Management Using SoA
135
7.4.3. Improving Energy Efficiency During Periods of Low Production
One obvious way in which to lower the energy usage during periods of lower
production output is to simply shut down any machines not in active use. The reality,
however, is never that simple.
Most production machines have long startup times, which can be attributed to many
different reasons, but are usually related to quality concerns. In our scenario the CNC
machines work with very fine tolerances which can only be guaranteed at specific
temperatures, and therefore need long warm-up times before being ready to work.
The concern becomes then, to detect the situations where the part flow rate has
lowered enough that it is worthwhile shutting down a few machines to save energy,
preferably without impacting the line’s overall productivity.
Automatic Startup and Timed Shutdown
One strategy employed in [44] was to use a timer which fires whenever a machine is
idle for a pre-set duration. This strategy, named Timed Shutdown (TSD) was
implemented in the simulated production scheduler in conjunction with Automatic
Startup (ASU), a simplistic startup strategy which basically checks whether any offline
machines need to be started up whenever a new piece arrives. The conjunction of
these two strategies is abbreviated to ASU/ TSD. The results of the simulation can be
seen on Figure 64.
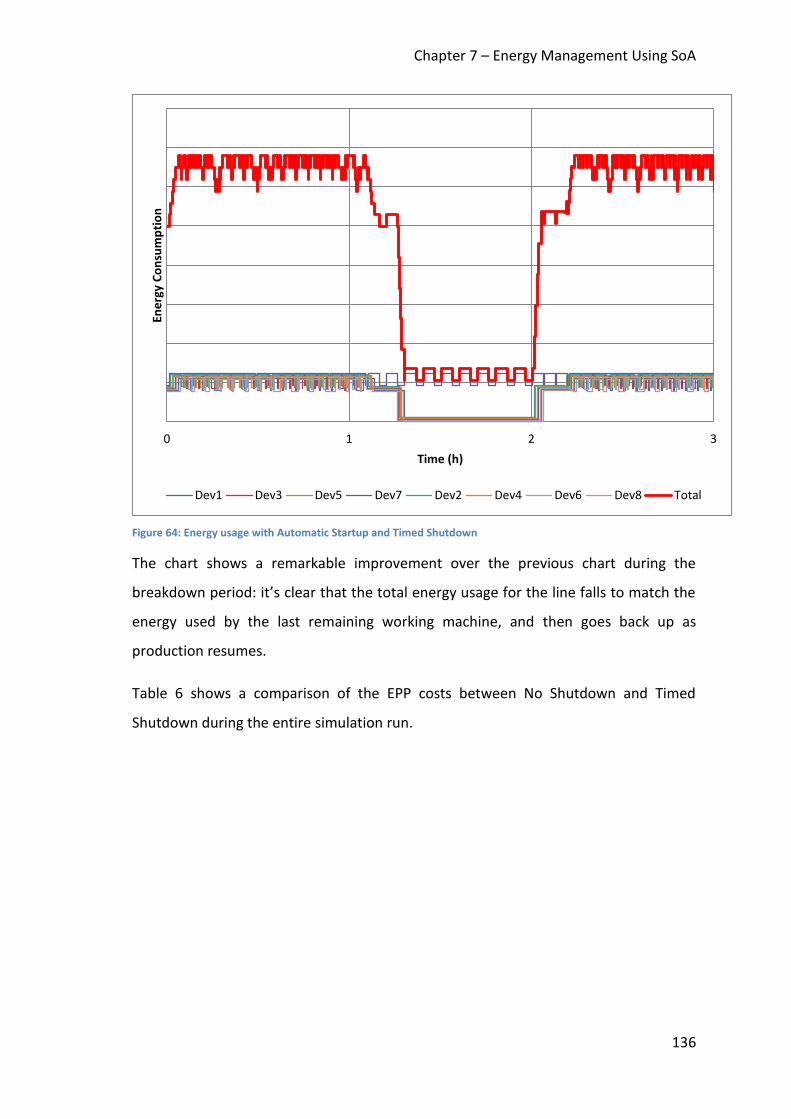
Chapter 7 – Energy Management Using SoA
136
Figure 64: Energy usage with Automatic Startup and Timed Shutdown
The chart shows a remarkable improvement over the previous chart during the
breakdown period: it’s clear that the total energy usage for the line falls to match the
energy used by the last remaining working machine, and then goes back up as
production resumes.
Table 6 shows a comparison of the EPP costs between No Shutdown and Timed
Shutdown during the entire simulation run.
0 1 2 3
Ene
rgy
Co
nsu
mp
tio
n
Time (h)
Dev1 Dev3 Dev5 Dev7 Dev2 Dev4 Dev6 Dev8 Total
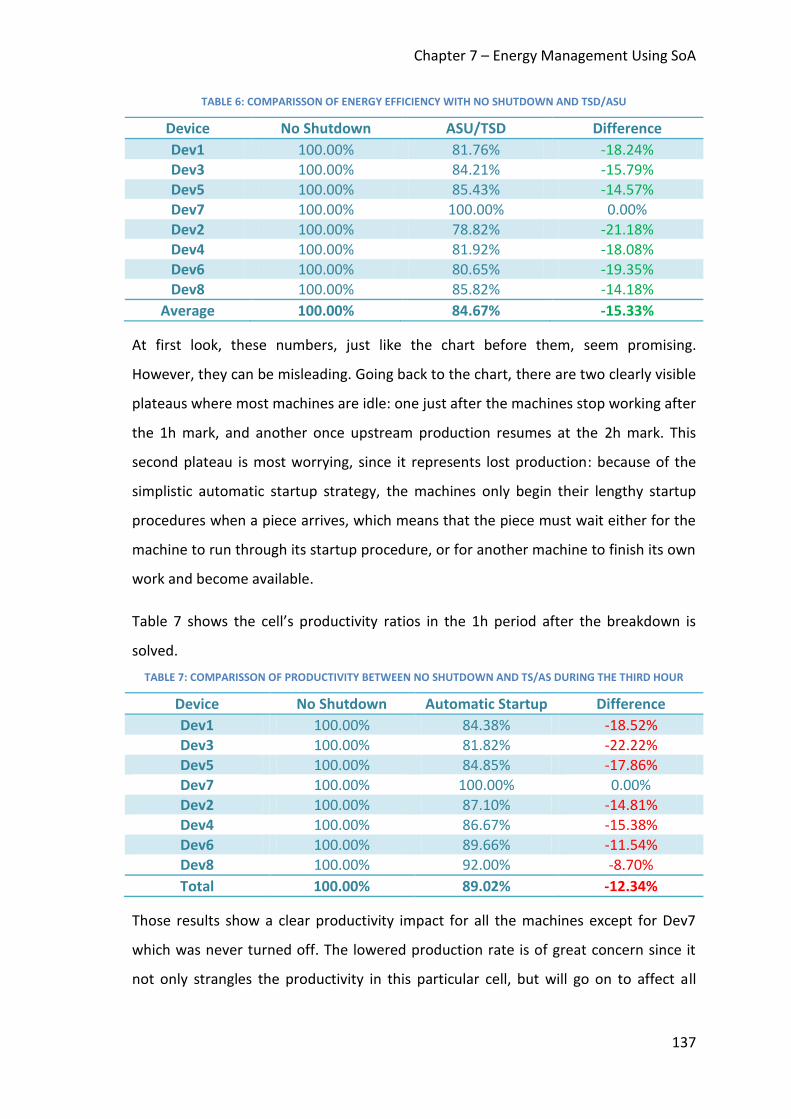
Chapter 7 – Energy Management Using SoA
137
TABLE 6: COMPARISSON OF ENERGY EFFICIENCY WITH NO SHUTDOWN AND TSD/ASU
Device No Shutdown ASU/TSD Difference
Dev1 100.00% 81.76% -18.24% Dev3 100.00% 84.21% -15.79% Dev5 100.00% 85.43% -14.57% Dev7 100.00% 100.00% 0.00% Dev2 100.00% 78.82% -21.18% Dev4 100.00% 81.92% -18.08% Dev6 100.00% 80.65% -19.35% Dev8 100.00% 85.82% -14.18%
Average 100.00% 84.67% -15.33%
At first look, these numbers, just like the chart before them, seem promising.
However, they can be misleading. Going back to the chart, there are two clearly visible
plateaus where most machines are idle: one just after the machines stop working after
the 1h mark, and another once upstream production resumes at the 2h mark. This
second plateau is most worrying, since it represents lost production: because of the
simplistic automatic startup strategy, the machines only begin their lengthy startup
procedures when a piece arrives, which means that the piece must wait either for the
machine to run through its startup procedure, or for another machine to finish its own
work and become available.
Table 7 shows the cell’s productivity ratios in the 1h period after the breakdown is
solved.
TABLE 7: COMPARISSON OF PRODUCTIVITY BETWEEN NO SHUTDOWN AND TS/AS DURING THE THIRD HOUR
Device No Shutdown Automatic Startup Difference
Dev1 100.00% 84.38% -18.52% Dev3 100.00% 81.82% -22.22% Dev5 100.00% 84.85% -17.86% Dev7 100.00% 100.00% 0.00% Dev2 100.00% 87.10% -14.81% Dev4 100.00% 86.67% -15.38% Dev6 100.00% 89.66% -11.54% Dev8 100.00% 92.00% -8.70%
Total 100.00% 89.02% -12.34%
Those results show a clear productivity impact for all the machines except for Dev7
which was never turned off. The lowered production rate is of great concern since it
not only strangles the productivity in this particular cell, but will go on to affect all

Chapter 7 – Energy Management Using SoA
138
downstream production systems, potentially leading to compound losses in the whole
production line.
Despite the productivity losses though, depending on the price of energy and on the
overall production priorities, it might still, in some circumstances, be worth it to
exchange some amount of productivity for the energy savings. That’s not, however, an
easy decision to make, and fortunately one that might not be needed, as shown in the
following section.
Predicted Startup
Given the substantial energy savings obtained using the Timed Shutdown technique,
the challenge now is to solve its productivity losses while keeping the energy benefits
of shutting down the idle machines. This can be achieved by telling the offline
machines to initiate their startup procedures in advance of the parts arriving, so that
when they do arrive, the machines are ready to start working on them, causing no
delays in the production line.
This would, of course require that a mechanism to predict the arrival of parts is in
place. That mechanism would need to inform the production cell that new parts are
arriving with ideally at least as much time as it takes for a full startup procedure to
complete. Though a shorter prediction time would still mean there would be delays as
the parts would arrive before the startup procedure had completed, it’d still be a net
benefit compared to the Automatic Startup discussed in the previous chapter.
This technique, called Predicted Startup (PSU) has actually already been employed in
[44] using a hardware sensor installed in the line just a few meters before the piece
would reach the machine, turning it on if necessary. This is, however, not a general
solution to the problem, given that each instance of a sensor would have to be
custom-built for each machine or production cell where automatic shutdown would be
employed.
A more general solution may be instead available using the SoA-based factory
framework. Given the availability of Smart Devices throughout the production floor,
and the flat topology of the service-based communication network, it is possible for
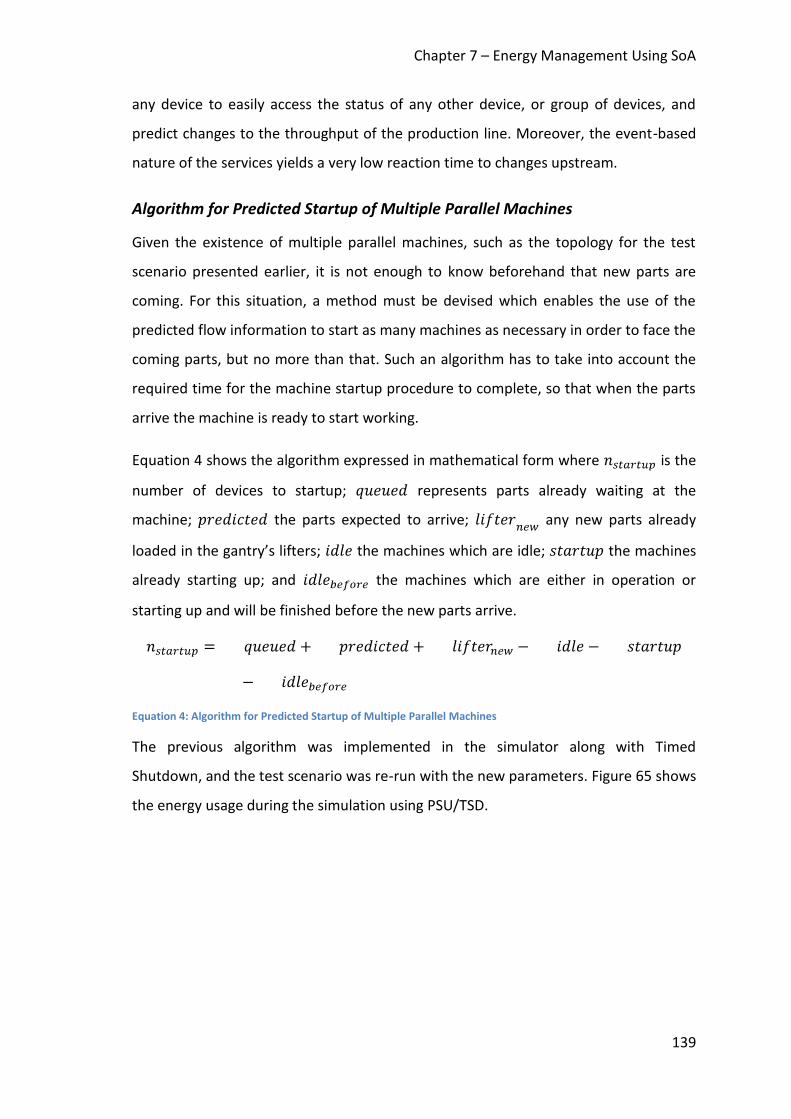
Chapter 7 – Energy Management Using SoA
139
any device to easily access the status of any other device, or group of devices, and
predict changes to the throughput of the production line. Moreover, the event-based
nature of the services yields a very low reaction time to changes upstream.
Algorithm for Predicted Startup of Multiple Parallel Machines
Given the existence of multiple parallel machines, such as the topology for the test
scenario presented earlier, it is not enough to know beforehand that new parts are
coming. For this situation, a method must be devised which enables the use of the
predicted flow information to start as many machines as necessary in order to face the
coming parts, but no more than that. Such an algorithm has to take into account the
required time for the machine startup procedure to complete, so that when the parts
arrive the machine is ready to start working.
Equation 4 shows the algorithm expressed in mathematical form where is the
number of devices to startup; represents parts already waiting at the
machine; the parts expected to arrive; any new parts already
loaded in the gantry’s lifters; the machines which are idle; the machines
already starting up; and the machines which are either in operation or
starting up and will be finished before the new parts arrive.
Equation 4: Algorithm for Predicted Startup of Multiple Parallel Machines
The previous algorithm was implemented in the simulator along with Timed
Shutdown, and the test scenario was re-run with the new parameters. Figure 65 shows
the energy usage during the simulation using PSU/TSD.
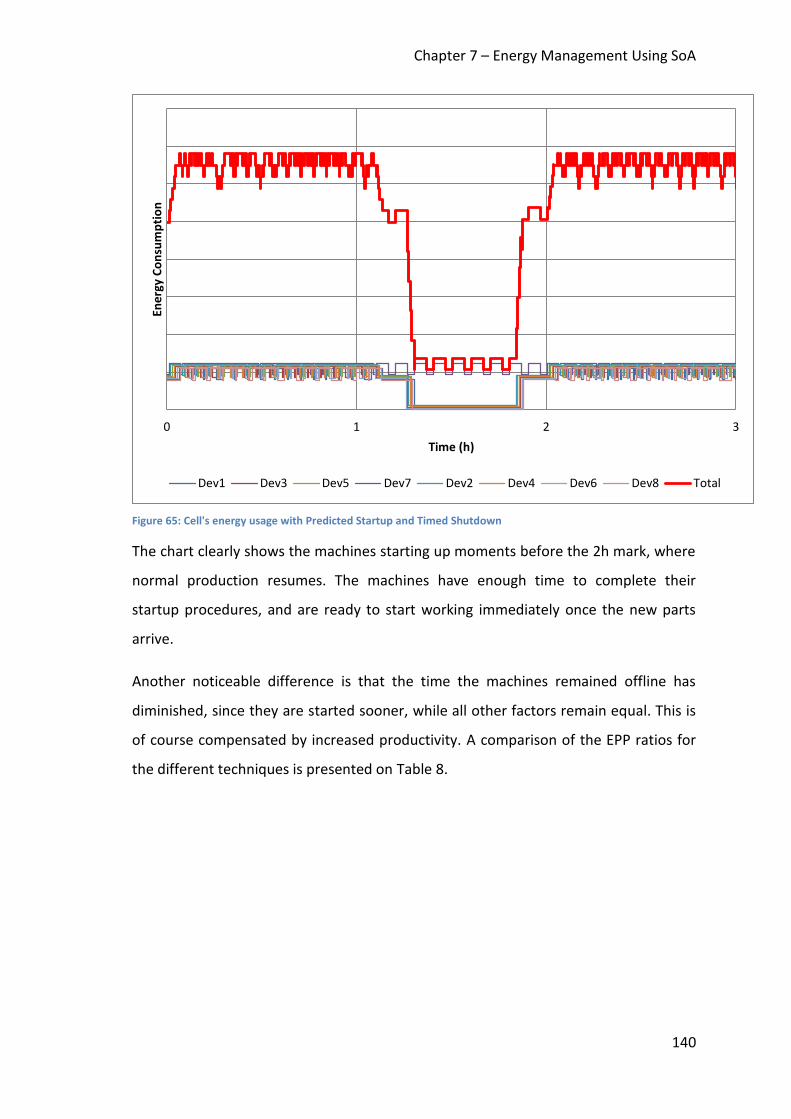
Chapter 7 – Energy Management Using SoA
140
Figure 65: Cell's energy usage with Predicted Startup and Timed Shutdown
The chart clearly shows the machines starting up moments before the 2h mark, where
normal production resumes. The machines have enough time to complete their
startup procedures, and are ready to start working immediately once the new parts
arrive.
Another noticeable difference is that the time the machines remained offline has
diminished, since they are started sooner, while all other factors remain equal. This is
of course compensated by increased productivity. A comparison of the EPP ratios for
the different techniques is presented on Table 8.
0 1 2 3
Ene
rgy
Co
nsu
mp
tio
n
Time (h)
Dev1 Dev3 Dev5 Dev7 Dev2 Dev4 Dev6 Dev8 Total

Chapter 7 – Energy Management Using SoA
141
TABLE 8: COMPARISON OF EFFICIENCY RATIOS NO SHUTDOWN AND PREDICTED STARTUP
Device No Shutdown Difference ASU/TSD Difference PSU/TSD
Dev1 100.00% -18.24% -17.77% Dev3 100.00% -15.79% -18.66% Dev5 100.00% -14.57% -17.18% Dev7 100.00% 0.00% 0.00% Dev2 100.00% -21.18% -17.66% Dev4 100.00% -18.08% -18.17% Dev6 100.00% -19.35% -19.61% Dev8 100.00% -14.18% -18.96%
Total 100.00% -15.33% -16.22%
Though the EPP gains are modest at best, it must be noted that the most important
factor is the increased productivity. The productivity losses incurred in TS/AS were
fully reverted back to the reference levels seen when the machines were never shut
down, despite a 16% energy efficiency increase.
Predicted Shutdown
Though the previous techniques have already shown themselves able to improve
energy efficiency in the proposed scenario, the chart in Figure 65 still lends itself to
one final optimization. Given that the cell already has information about the predicted
flow of parts, it should be possible to shut the machines down when the flow is
predicted to fall instead of waiting for the shutdown timers to run out, thus creating
an analogous strategy to the Predicted Startup, appropriately named Predicted
Shutdown.
This strategy, named Predicted Shutdown (PSD) works in much the same way as
Predicted Startup by adapting the startup algorithm as shown in Equation 5. The new
adaptation starts from the total number of available devices, looks at how many of
them are already working, how many are predicted to be needed according to the
startup algorithm, and shuts the remaining devices down.
Equation 5: Algorithm for Predicted Shutdown of multiple parallel machines
This new algorithm, when applied to the test scenario yielded the results seen in
Figure 66.
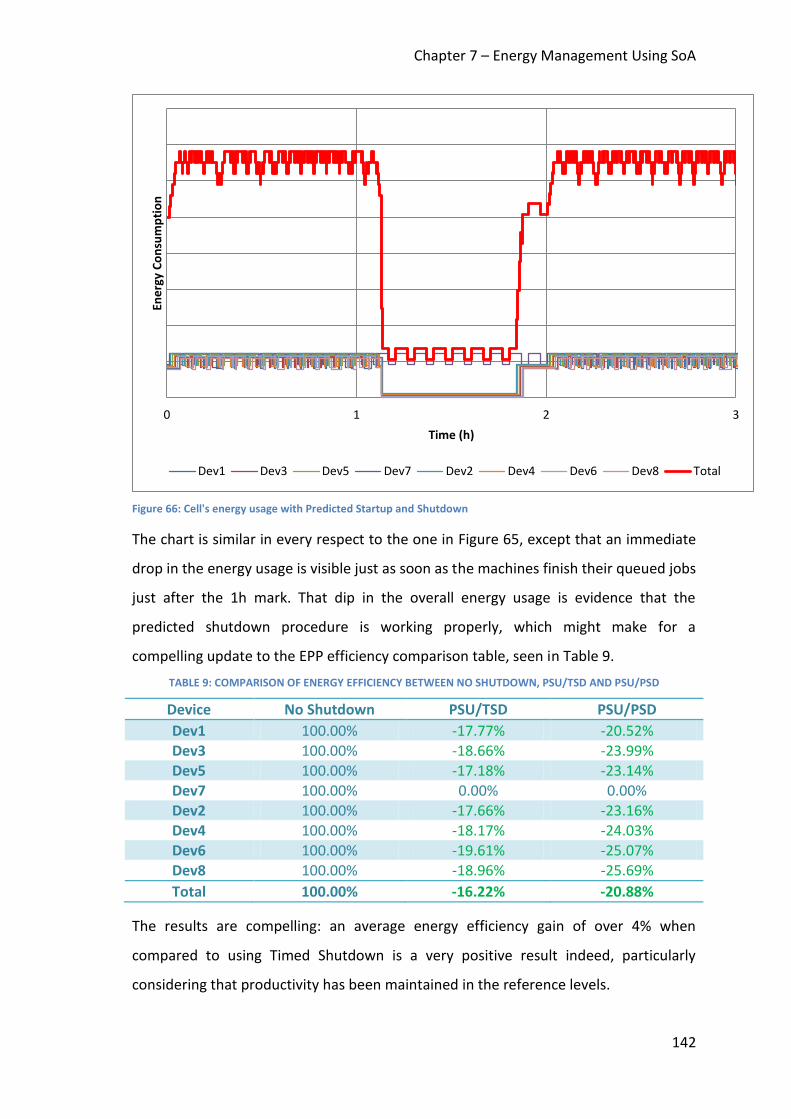
Chapter 7 – Energy Management Using SoA
142
Figure 66: Cell's energy usage with Predicted Startup and Shutdown
The chart is similar in every respect to the one in Figure 65, except that an immediate
drop in the energy usage is visible just as soon as the machines finish their queued jobs
just after the 1h mark. That dip in the overall energy usage is evidence that the
predicted shutdown procedure is working properly, which might make for a
compelling update to the EPP efficiency comparison table, seen in Table 9.
TABLE 9: COMPARISON OF ENERGY EFFICIENCY BETWEEN NO SHUTDOWN, PSU/TSD AND PSU/PSD
Device No Shutdown PSU/TSD PSU/PSD
Dev1 100.00% -17.77% -20.52% Dev3 100.00% -18.66% -23.99% Dev5 100.00% -17.18% -23.14% Dev7 100.00% 0.00% 0.00% Dev2 100.00% -17.66% -23.16% Dev4 100.00% -18.17% -24.03% Dev6 100.00% -19.61% -25.07% Dev8 100.00% -18.96% -25.69%
Total 100.00% -16.22% -20.88%
The results are compelling: an average energy efficiency gain of over 4% when
compared to using Timed Shutdown is a very positive result indeed, particularly
considering that productivity has been maintained in the reference levels.
0 1 2 3
Ene
rgy
Co
nsu
mp
tio
n
Time (h)
Dev1 Dev3 Dev5 Dev7 Dev2 Dev4 Dev6 Dev8 Total
Chapter 7 – Energy Management Using SoA
143
It should be noted, however, that the results presented in this section are specific to
the cell which is the focus of this study. More important are the trends and the theory
behind the numbers, which reveal themselves as promising strategies that may be
applicable to the complete production line.
7.4.4. Determining Ideal Prediction Timing
Though it is expected that the above strategies can be applied to most, if not all the
machines in the production system, some device-specific adaptations will certainly be
necessary. Particularly, the ideal prediction times will have to be calculated for each
class of device where this system is to be implemented, i.e., how long before a new
part comes does a device need to be started up (Predicted Startup Time), and after
how long an interval does it make more sense to shut down a machine, as opposed to
letting it run idle (Predicted Shutdown Time).
The Predicted Startup Time is simple to calculate: it should be the same amount of
time which is necessary for the device’s startup procedure to complete. This is enough
to guarantee that the machine will be up and running when the part arrives. This
makes Equation 6 very simple indeed.
Equation 6: Determining the Predicted Startup Time
The Predicted Shutdown Time, however, is more complex since the decision to shut a
given machine down must factor in both the timings and the energy costs involved.
For example, if the startup procedure uses more energy than simply letting it run idle
for the same period of time, then this aspect must be taken into consideration.
Equation 7 is used to determine the Predicted Shutdown Time.
Equation 7: Determining the Predicted Shutdown Time
Finally, there are other considerations still, such as the possible effects of shutting
down machines on the device’s Mean Time Before Failure (MTBF) ratio, i.e., the fact
that repeatedly shutting down a given machine may affect its long-term operational
Chapter 7 – Energy Management Using SoA
144
capabilities. These considerations, however, are very implementation-specific and
must be tackled on a case-by-case basis.
7.5. Reducing Installation Costs
Another energy-related issue in modern production facilities are the installation costs
when building new production systems. Those systems need to be dimensioned for
their expected energy usage, and the supporting equipment must be acquired and
installed accordingly.
This topic is important since the hardware costs, and the subsequent maintenance
costs for the support equipment can increase exponentially with higher power
requirements, even if those levels are rarely reached. Moreover, if we take the
example of electrical power, the supply companies usually charge hefty fees in order
to guarantee that certain power levels will be available, if necessary.
7.5.1. Using Energy Simulation to Evaluate New Installations
The capability of predicting the exact power consumption during production can yield
enormous long-term savings if it is applied during the production system’s design
phase. Figure 67 shows a chart of the detailed power profile during operation for a
CNC machine such as the ones used in the test scenario from the previous sections. It
also plots a moving average of the overall power usage as a baseline comparison. Due
to the sensitive nature of the data, the real figures have been removed, but the
proportions remain true to the original readings.
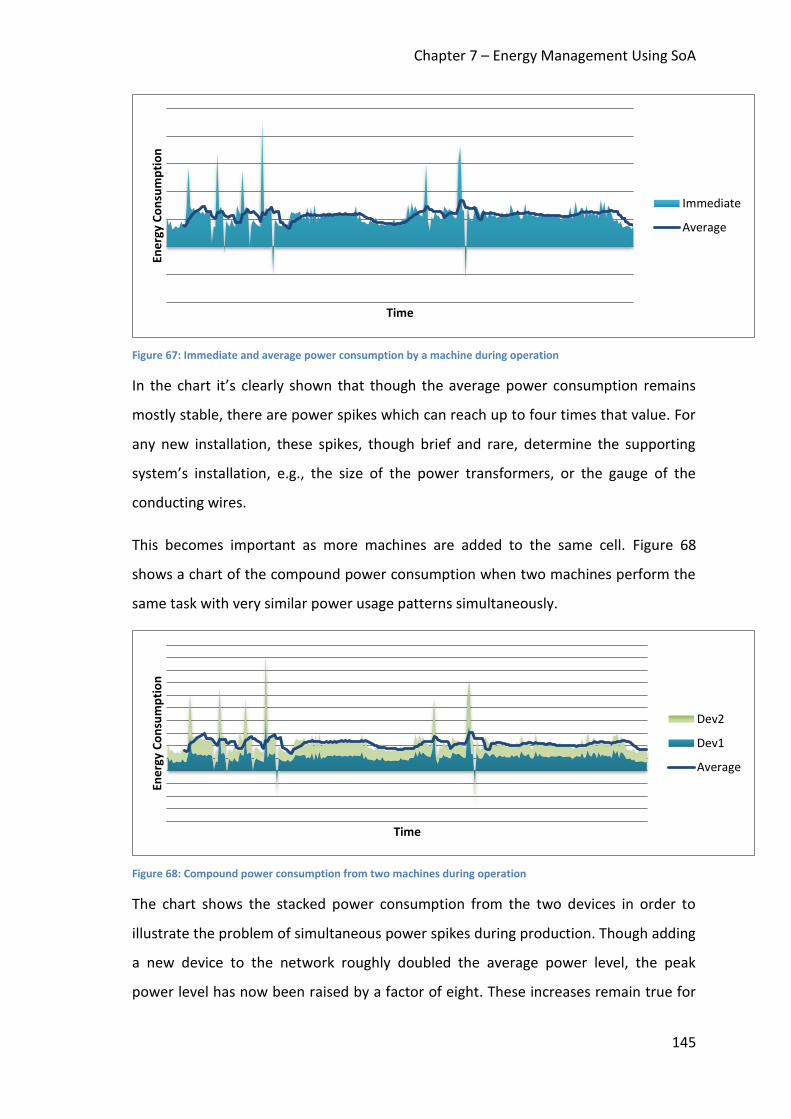
Chapter 7 – Energy Management Using SoA
145
Figure 67: Immediate and average power consumption by a machine during operation
In the chart it’s clearly shown that though the average power consumption remains
mostly stable, there are power spikes which can reach up to four times that value. For
any new installation, these spikes, though brief and rare, determine the supporting
system’s installation, e.g., the size of the power transformers, or the gauge of the
conducting wires.
This becomes important as more machines are added to the same cell. Figure 68
shows a chart of the compound power consumption when two machines perform the
same task with very similar power usage patterns simultaneously.
Figure 68: Compound power consumption from two machines during operation
The chart shows the stacked power consumption from the two devices in order to
illustrate the problem of simultaneous power spikes during production. Though adding
a new device to the network roughly doubled the average power level, the peak
power level has now been raised by a factor of eight. These increases remain true for
Ene
rgy
Co
nsu
mp
tio
n
Time
Immediate
Average
Ene
rgy
Co
nsu
mp
tio
n
Time
Dev2
Dev1
Average
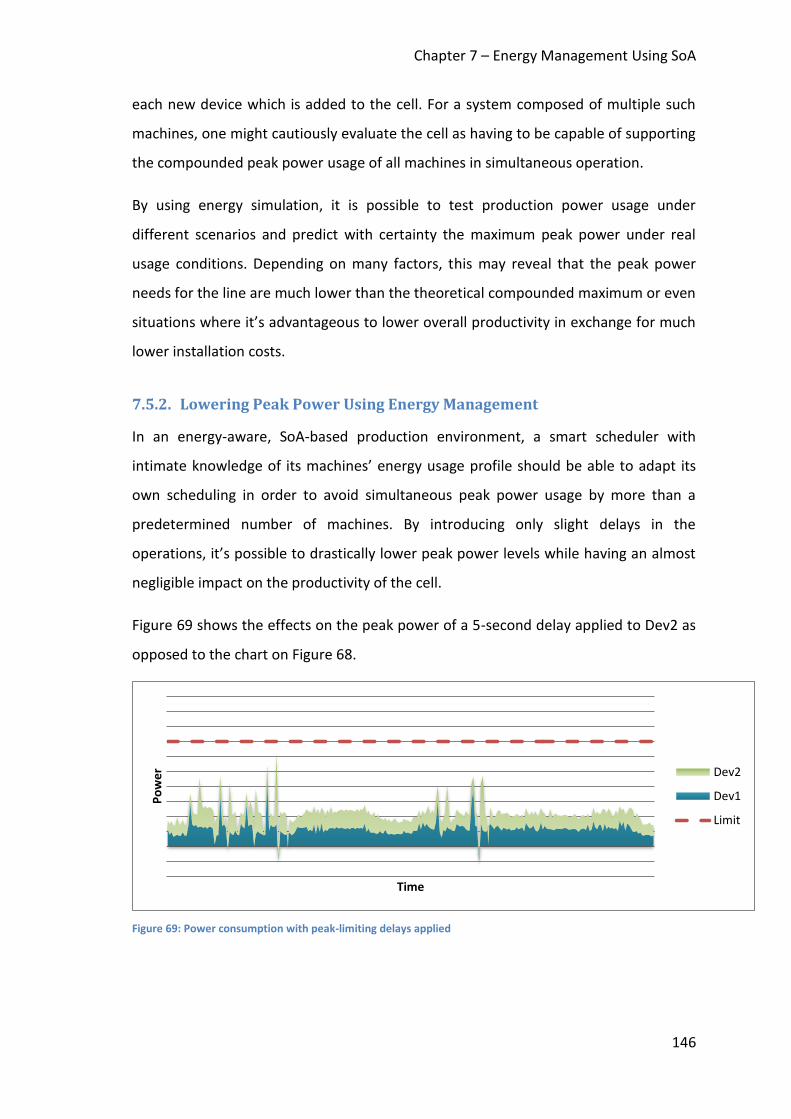
Chapter 7 – Energy Management Using SoA
146
each new device which is added to the cell. For a system composed of multiple such
machines, one might cautiously evaluate the cell as having to be capable of supporting
the compounded peak power usage of all machines in simultaneous operation.
By using energy simulation, it is possible to test production power usage under
different scenarios and predict with certainty the maximum peak power under real
usage conditions. Depending on many factors, this may reveal that the peak power
needs for the line are much lower than the theoretical compounded maximum or even
situations where it’s advantageous to lower overall productivity in exchange for much
lower installation costs.
7.5.2. Lowering Peak Power Using Energy Management
In an energy-aware, SoA-based production environment, a smart scheduler with
intimate knowledge of its machines’ energy usage profile should be able to adapt its
own scheduling in order to avoid simultaneous peak power usage by more than a
predetermined number of machines. By introducing only slight delays in the
operations, it’s possible to drastically lower peak power levels while having an almost
negligible impact on the productivity of the cell.
Figure 69 shows the effects on the peak power of a 5-second delay applied to Dev2 as
opposed to the chart on Figure 68.
Figure 69: Power consumption with peak-limiting delays applied
Po
we
r
Time
Dev2
Dev1
Limit

Chapter 7 – Energy Management Using SoA
147
The configured peak limit, shown as a red dashed line, causes the scheduler to adjust
the timings for Dev2’s operation so that the peaks from both machines happen at
different moments, lowering the highest power peak by a factor of almost 50%.
7.6. Comments on Results
The simulation scenario based on a real, state-of-the-art production cell proved
instrumental in the development and adaptation of the strategies for improving
energy efficiency proposed in the previous chapters. This cell was chosen, among
other characteristics, for featuring parallel operation of identical machines, a fact
which helped diagnose the different strategies in more complex scenarios than the
more traditional sequential operation where the breakdown of one machine meant
complete blockage of that production line. It also proved that the strategies are
applicable in the modern factory layouts currently being implemented in new
production lines.
The results presented in section 7.4 are very positive and serve as the best argument
for the application of the proposed solutions. Although the absolute energy savings
were very specific for the scenario, and would be expected to vary wildly under
different circumstances, they are, nonetheless representative of the types of new
avenues for research on strategies for improving energy efficiency afforded by the
availability of agile production installations composed intelligent, fully networked
devices. An example of such a strategy is demonstrated on section 7.5, where the very
same technologies are applied towards solving a problem which, while not affecting
energy efficiency directly, could still bring about substantial cost savings and even
bring about optimizations for the company responsible for power generation.
Beyond the specifics of the proposed scenario, however, is the fact that a fully
functional, modular, SoA-based discrete simulation system for production is not only
possible, but a very compelling solution to the problem of having the backend
production engineering systems keep up with a quickly evolving production line, both
in terms of technologies, as well as methodologies.

Chapter 7 – Energy Management Using SoA
148
The quick adaptability of the virtual production cell to almost any scenario, and the
possibility to quickly extract results from production runs, turns these systems into
essential parts of the production engineer’s toolbox. Armed with these tools, those
engineers will be better equipped to face the coming challenges posed by the
production lines of the future.
Chapter 8 – Conclusions and Future Work
149
Chapter 8. Conclusions and Future Work
This dissertation describes the developments towards a proposal for implementation
of an energy-aware simulation system for production automation following the SoA
paradigm. This is done by basing the system architecture on the theories and practices
developed in the latest state of the art research literature. The proposed solutions try
to solve many of the problems encountered with traditional systems, such as the
monolithic design and lack of flexibility for change. Furthermore, the proposed
systems attempt to avoid obsolescence by building on top of a simple and extensible
SoA framework which depends on clearly defined interfaces for communication,
running on a stable foundation of open standards developed with future-proofing in
mind.
However, the industry is resistant to change, and for good reason: when a production
stoppage of only a few hours can mean huge losses, production engineers are quite
justified in being exceedingly careful when playing with new concepts and
technologies. Still, in a highly competitive environment and considering the rising costs
of energy, companies cannot afford to sit still, so it is expected that with enough time
and investment, these techniques will eventually be adopted. If that is to be the case,
that adoption will start with non-critical systems such as production simulation and
monitoring, where system failures are less likely to impact productivity directly, and
then moving on to more critical systems as the technology is put through its paces.
This principle was shown back in section 1.2, in Figure 1 where the SoA-based
simulation system becomes an integral part of the production line design lifecycle.
The replacement of existing systems in the production scenario is, however, not a
trivial task. The complex functionality which has been added to those systems over the
years can't be easily replaced overnight. In order for it to happen, SoA-based systems
will have to prove their worth in the production scenario, most likely by implementing
smaller, more manageable requirements. It is believed that production energy
simulation is a perfect candidate for such an endeavour, as it serves as both an

Chapter 8 – Conclusions and Future Work
150
excellent showcase scenario, at the same time fulfilling a requirement of growing
importance in the design of production facilities: that of energy efficiency.
In that vein, this research is well positioned as it fits quite well with the general
direction taken by other research efforts in the same area. Applying the SoA paradigm
to industrial automation is a hot topic in academia and is already being picked up by
the industry in some areas. Of particular note is the work performed in partnership
with other researchers on SoA-based production control, the results of which have
been published in [99] and [100].
Though this research deals with very young technologies, the achieved results offer
very compelling motivation for the continued development and eventual applicability
of the strategies in real production environments. The results achieved in Chapter 7
lead to the belief that current research has only been scratching the surface of the
possibilities that these technologies afford. It is certainly felt that these are interesting
and profitable research avenues for the future.
8.1. Contributions to Knowledge
The work here presented features varied contributions to knowledge in the narrow
field of flexible production automation. The list of concepts which have been explored
throughout this document is presented here following the structure laid out in Figure
2 outlining the research methodology for this research.
8.1.1. SoA-based Production Automation
Smart Devices were introduced in paragraph 3.2 as autonomous self-contained,
SoA-enabled devices which are able to participate cooperatively in a SoA-based
production system. The architecture of the smart devices is geared for
reusability and was specifically developed to be platform agnostic. These
design principles enabled the development of functionally equivalent virtual
and real smart devices which feature the exact same service interfaces and
capabilities;
In paragraph 3.3, the concept of ports in the context of SoA-based production
manufacturing is introduced as a mechanism through which the connections
Chapter 8 – Conclusions and Future Work
151
between smart devices is standardized to the point of allowing easy layout
assembly, as well as simplifying the process of orchestrating the
communication patterns for transferring parts between those devices;
The technical details regarding an implementation of smart devices featuring
ports is demonstrated in Chapter 5. Those devices are then used to construct a
real production cell, as well as its virtual representation. The production cell is
a MHS in a closed loop showcasing the benefits of using smart devices in the
production scenario, and opens a discussion on some of the issues surrounding
their implementation;
The importance of monitoring and simulation in modern industrial automation
is explored in Chapter 6. In that chapter, a discussion is made on the current
state of both technologies, and how they can benefit from the application of
the same SoA principles as were earlier applied to industrial devices;
8.1.2. Energy Monitoring
Paragraph 6.2 expands on the challenge of improving energy efficiency in the
industrial setting. The following paragraphs feature a discussion on how a SoA-
based production network, allied with intelligent monitoring and simulation
systems, can play a large part in tackling those issues;
In Chapter 7, a real world case-study is made using the principles explored in
the previous chapters. This chapter represents the culmination of all of the
previous research applied to a real, modern production cell in current
operation. The early results presented throughout the text paint a compelling
picture for SoA-based industrial automation;
Furthermore, in section 7.4 an algorithm, described as Equation 5 is introduced
which decides how many devices in a production cell are required for a given
number of expected work parts, when those devices are laid out in a parallel
configuration;

Chapter 8 – Conclusions and Future Work
152
Also in section 7.4 two more algorithms for determining the ideal prediction
timings for startup and shutdown. Those are described mathematically in
Equation 6 and Equation 7.
8.1.3. Research Goal
Section 7.6 presents the experimental results achieved by bringing all of the
previous methodologies together in a real production scenario. The results
achieved show how the research here presented can be used as the basis for
implementing energy efficient automation in the real world.
8.2. Going Forward
Though the results achieved using the methodologies in the previous chapters have
been mainly positive, and seem to be well aligned with the industry needs identified at
the start of this dissertation, they are still not ready for deployment in a real-world
production scenario.
The simulation tools as presented have been built as prototypes to test the feasibility
and applicability of the proposed concepts. Though they have performed as expected
for their intended scenarios, their prototypical nature also means a low code maturity,
weak usability, and propensity for fatal errors. Introducing changes to the simulated
cell causes frequent crashes, and sometimes generates obviously incorrect results.
Though these situations have been corrected one a case-by-case basis whenever
found, it must be said that the generation of a complete, commercial-grade tool falls
very much outside of the scope of this work. Instead, the tools are presented here as
an example, and possibly framework for a possible future implementation by a
qualified software development team.
An easier migration path can be envisioned for the proposed monitoring systems.
Some modern PLCs and energy monitoring systems already support web services out
of the box, leading to the possibility of gradually introducing a SoA-based monitoring
system such as the one described previously in a parallel network without having to
make any changes to the existing systems. As the SoA-based network grows, legacy
Chapter 8 – Conclusions and Future Work
153
systems can be brought online through the use of SoA-based communication
gateways, until such a time as the legacy network is empty and can be retired.
These developments, however, are dependent on the quality and availability of the
hardware devices from commercial vendors. A review of those needs to be done to
assess a number of aspects before a real-life SoA-based monitoring system ever
becomes a reality.
Finally, though the strategies for energy efficiency tested in Chapter 7 have borne
successful results, they do not even nearly represent the entire breadth of possible
solutions to the problem of excessive energy usage in production systems. Instead,
those strategies were used as a representation of how the right tools can support the
development of innovative engineering solutions. With further development of those
methodologies and tools, making them increasingly capable and easier to use, it is
hoped that future production engineers can free their creativity to generate new and
inventive strategies for their own particular scenarios, thereby benefiting the entire
industry and society as a whole.
8.3. Dissemination
The following is a list of documents which were published throughout the research
and development phases of the doctoral programme. These documents describe the
various stages of the research, and have been distributed and peer-reviewed in
international scientific publications.
8.3.1. Journal Articles
D. Cachapa, R. Harrison, A. Colombo, and L. Lee, "SoA-based Production Simulation for
Energy Efficient Automation," to be submitted early 2012.
D. Cachapa, R. Harrison, and A. Colombo, "Configuration of SoA-based devices in
virtual production cells," International Journal of Production Research, vol. 49, no. 24,
pp. 7397-7423, December 2011.
Chapter 8 – Conclusions and Future Work
154
P. Leitão et al., "Integration of virtual and real environments for engineering service-
oriented manufacturing systems," Journal of Intelligent Manufacturing, pp. 1-13,
September 2011.
8.3.2. Conference Papers
D. Cachapa, R. Harrison, and A. Colombo, “An Architecture for Energy-Aware SoA-
based Simulation Tools”, to be submitted early 2012.
D. Cachapa, R. Harrison, and A. Colombo, "Monitoring functions as service
composition in a SoA-based industrial environment," in 36th Annual Conference on
IEEE Industrial Electronics Society, Phoenix, 2010, pp. 1353 - 1358.
D. Cachapa, R. Harrison, A. Colombo, and L. Lee, "Improving Energy Efficiency in the
Production Floor Using SoA-based Monitoring Techniques," IFIP Advances in
Information and Communication Technology, vol. 314, pp. 159-166, 2010.
D. Cachapa, R. Harrison, A. Colombo, and L. Lee, "Improving energy efficiency in
service-oriented production automation systems," in IEEE International Symposium on
Industrial Electronics , Bari, 2010, pp. 3533 - 3538.
D. Cachapa, R. Harrison, A. Colombo, and Les Lee, "SoA-based Production Monitoring
Systems for Energy Efficiency: A Case-study Using Ford’s POSMon System," in IEEE
International Conference on Industrial Technology, Viña del Mar, 2010, pp. 1077-1081.
P. Leitão, J. Mendes, A. Bepperling, D. Cachapa, and A. Colombo, "Engineering tools for
the integration of service-oriented production systems," in 13th IFAC Symposium on
Information Control Problems in Manufacturing, Moscow, 2009.
A. Bepperling, D. Cachapa, A. Colombo, and M. Feike, "Integration von virtuellen und
realen Automatisierungsgeräten in einer serviceorientierten Architektur," in
SPS/IPC/DRIVES/Elektrische Automatisierung - Systeme und Komponenten,
Nuremberg, 2007.
D. Cachapa, A. Colombo, M. Feike, and A. Bepperling, "An approach for integrating real
and virtual production automation devices applying the service-oriented architecture
Chapter 8 – Conclusions and Future Work
155
paradigm," in IEEE Conference on Emerging Technologies and Factory Automation,
Patras, 2007, pp. 309 - 314.
8.3.3. Patent Applications
D. Cachapa and A. Colombo, "Verfahren, System und Computer-Programm-Produkt
zur Simulation eines Produktions-Automatisierungs-Systems mit Service-orientierter
Architektur," Patent no. pending, November 2011.
A. Colombo and D. Cachapa, "Method and System for Providing Monitoring
Characteristics in an SOA Based Industrial Environment," Patent no. WO 2011/138375
A1, May 2011.
A. Colombo and D. Cachapa, "Method for Configuring a Service-Oriented Production
Line Comprising Virtual and/or Real Components and Service-Oriented Production
Line," Patent no. WO 2010/136561 A1, May 2010.
A. Colombo, A. Bepperling, D. Cachapa, and R. Milagaia, "Automation System
Comprising an Implemented Engineering-Environment," Patent no. WO 2008/090216
A1, January 2008.
Chapter 9 – References
156
Chapter 9. References
[1] European Union. FP6 NoE Innovative Production Machines and Systems (I*PROMS). [Online]. http://www.iproms.org
[2] J. Lastra, Reference Mechatronic Architecture for Actor-Based Assembly Systems. Tampere, Finland: Tampere University of Technology, 2004.
[3] R. Harrison and A. Colombo, "Collaborative Automation: From Rigid Coupling towards Dynamic Reconfigurable Production Systems," in Proceedings of the 16th IFAC World Congress, Prague, Czech Republic, July 2004.
[4] R. Zurawsky, The Industrial Information Technology Handbook. Boca Raton, USA: CRC Press, 2005.
[5] SIRENA Consortium. SIRENA. [Online]. http://www.sirena-itea.org
[6] SOCRADES Consortium. SOCRADES. [Online]. http://www.socrades.eu
[7] I. Delamer and J. Lastra, "Self-orchestration and choreography: towards architecture-agnostic manufacturing systems," in 20th International Conference on Advanced Information Networking and Applications, Vienna, 2006, p. 5 pp.
[8] ARC Advisory Group, "Collaborative automation: the platform for operational excellence," Ed. E. Basset, White Paper 2003.
[9] R. Harrison, A. Colombo, A. West, and S. Lee, "Reconfigurable modular automation systems for automotive power-train manufacture," International Journal of Flexible Manufacturing Systems, vol. 18, no. 3, pp. 175-190, September 2006.
[10] P. Spiess and S. Karnouskos, "Maximizing the business value of networked embedded systems through process-level integration into enterprise software," in 2nd International Conference on Pervasive Computing and Applications, Birmingham, 2007, pp. 536-541.
[11] A. Colombo and R. Harrison, "Modular and collaborative automation: achieving manufacturing flexibility and reconfigurability," International Journal of Manufacturing Technology and Management, vol. 14, no. 3-4, pp. 249-265, March 2008.
[12] ARC Advisory Group, "Collaborative manufacturing management strategies," Ed. E. Basset, Report 2002.
[13] OECD. (2001) Policy Brief: Sustainable development: Critical issues. [Online]. http://www.oecd.org/document/55/0,3343,en_2649_34589_1890487_1_1_1_1,00.html
[14] Department of Trade and Industry, "Energy Consumption in the United
Chapter 9 – References
157
Kingdom," London, 2002.
[15] European Climate Foundation, "Power Perspectives 2030," European Union, Report 2011.
[16] D. Cachapa, R. Harrison, A. Colombo, and Les Lee, "SoA-based Production Monitoring Systems for Energy Efficiency: A Case-study Using Ford’s POSMon System," in IEEE International Conference on Industrial Technology, Viña del Mar, 2010, pp. 1077-1081.
[17] D. Cachapa, R. Harrison, A. Colombo, and L. Lee, "Improving energy efficiency in service-oriented production automation systems," in IEEE International Symposium on Industrial Electronics , Bari, 2010, pp. 3533 - 3538.
[18] European Comission, "Embedding intelligence in collaborative automation systems (production systems engineering)," Consultation IST and the Preparation of the Framework Program 7 (2007-2013), Workshop on “Agile, Wireless Manufacturing Plant” 2005.
[19] A. Colombo, R. Schoop, and R. Neubert, "An agent-based intelligent control platform for industrial holonic manufacturing systems," IEEE Transactions on Industrial Electronics, vol. 53, no. 1, pp. 322-337, February 2006.
[20] P. Leitão, A.W. Colombo, and F.J. Restivo, "ADACOR: a collaborative production automation and control architecture," IEE Intelligent Systems, vol. 20, no. 1, pp. 58-66, January 2005.
[21] A. Colombo, "Industrial Agents: Towards Collaborative Production-Automation, -Management and -Organization," vol. 52, no. 4, December 2005.
[22] Harry Saunders, "The Khazzoom-Brookes Postulate and Neoclassical Growth," The Energy Journal, vol. 13, no. 4, pp. 130-148, 1992.
[23] W3C - World Wide Web Consortium. (2004, February) Web Services Architecture. [Online]. http://www.w3.org/TR/ws-arch/#introduction
[24] OASIS Web Services Interoperability. WS-i. [Online]. http://www.oasis-ws-i.org
[25] F. Jammes, A. Mensch, and H. Smit, "Service-oriented Device Communications Using the Devices Profile for Web Services," in MPAC '05 Proceedings of the 3rd international workshop on Middleware for pervasive and ad-hoc computing, New York, 2005, pp. 1-8.
[26] T. Gogg and J. Mott, "Introduction to Simulation," in Proceedings of the 25th Conference on Winter Simulation, New York, 1993, pp. 9-17.
[27] S. Lind et al., "SIMTER - A Joint Simulation Tool for Production Development," VTT Finland, Espoo, Working Paper 125 2009.
[28] T. Schriber and D. Brunner, "Inside discrete-event simulation software: How it works and why it matters," in Proceedings of the 2010 Winter Simulation Conference, Phoenix, 2010, pp. 151 - 165.
Chapter 9 – References
158
[29] K. Feldmann and A. Colombo, "Monitoring of flexible production systems using high-level petri net specifications," Control Engineering Practice, vol. 7, pp. 1449-1466, December 1999.
[30] M. Elbestawi, S. Wu, and R. Du, "Automated Monitoring of Manufacturing Processes, Part 1: Monitoring Methods," Journal of Engineering for Industry, vol. 117, no. 2, pp. 121-132, May 1995.
[31] F. Jammes and H. Smit, "Service-oriented architectures for devices - the SIRENA view," in 3rd IEEE International Conference on Industrial Informatics, Perth, 2005, pp. 140-147.
[32] European Commission, "Communication of 29 October," Brussels, 2008.
[33] European Commission, "Communication from the Commission to the European Council: a European economic recovery plan," Brussels, 2008.
[34] United Nations Framework Convention on Climate Change, "Kyoto Protocol Reference Manual," 2008.
[35] United Nations, "Vienna UN conference shows consensus on key building blocks for effective international response to climate change," Vienna, Press Release 2007.
[36] Adam Smith, An Inquiry into the Nature and Causes of the Wealth of Nations. London, UK: W. Strahan and T. Cadell, 1776.
[37] J. Zachman, "A framework for information systems architecture," IBM Systems Journal paper, vol. 26, no. 3, pp. 276-292, 1987.
[38] Roger Sessions. (2007, May) A Comparison of the Top Four Enterprise-Architecture Methodologies. [Online]. http://msdn.microsoft.com/en-us/library/bb466232.aspx
[39] ISA. ISA95 Enterprise-Control System Integration. [Online]. http://www.isa.org/ISA95
[40] PERA. Pera Enterprise Integration Website. [Online]. http://pera.net/
[41] Batch Control. Introduction to S95. [Online]. http://www.batchcontrol.com/s95/s95.shtml
[42] PERA. PERA Control and Information Architecture. [Online]. http://www.pera.net/Pera/PERA_Information_Architecture.html
[43] European Commission, "2020 vision: Saving our energy," Brussels, 2007.
[44] J. O'Shea, "Reducing the electrical energy consumption of Cross Hueller CNC machines," Ford Motor Company, Dunton, Internal Presentation 2009.
[45] PROFIBUS Nutzerorganisation e.V., "The PROFIenergy Profile," Karlsruhe, White Paper 2012.

Chapter 9 – References
159
[46] J. Ladbrook and A. Januszczak, "Ford's power train operations: changing the simulation environment," in Proceedings of the Winter Simulation Conference, Arlington, 2001, pp. 863-869.
[47] The Mathworks, Inc. (2012) MATLAB and Simuling for Technical Computing. [Online]. http://www.mathworks.com
[48] E. Estevez, M. Marcos, U. Gangoiti, and D. Orive, "A tool integration framework for industrial distributed control systems," in 44th IEEE Conference on Decision and Control, Seville, 2005, pp. 8373 - 8378.
[49] U. Hatnik and S. Altmann, "Using ModelSim, Matlab/Simulink and NS for Simulation of Distributed Systems," in International Conference on Parallel Computing in Electrical Engineering, Dresden, 2004, pp. 114-119.
[50] J.N. Pires, S.S. Ge, T.H. Lee, D.L. Gu, and L.C. Woon, "Interfacing industrial R&A equipment using Matlab," IEEE Robotics & Automation Magazine, vol. 7, no. 3, pp. 32-41, September 2000.
[51] The MathWorks, Inc. (2012) Simulink - Simulation and Model-Based Design. [Online]. http://www.mathworks.com/products/simulink
[52] J. Friedman, "MATLAB/Simulink for automotive systems design," in Proceedings of the conference on Design, automation and test in Europe, Leuven, 2006.
[53] Green Car Congress. (2009, October) General Motors Developed Two-Mode Hybrid Powertrain With MathWorks Model-Based Design; Cut 24 Months Off Expected Dev Time. [Online]. http://www.greencarcongress.com/2009/10/general-motors-developed-twomode-hybrid-powertrain-with-mathworks-modelbased-design-cut-24-months-of.html
[54] Schneider Electric, "PowerLogic ION Entreprise: A Complete Power Management Solution," 2009.
[55] SAP, "SAP Manufacturing Execution: Optimizing Operations, Manufacturing," 2008.
[56] PERA. (2006) Purdue Reference Architecture. [Online]. http://www.pera.net
[57] Schneider Electric. Transparent Ready Automation. [Online]. http://products.schneider-electric.us/products-services/products/webenabled-solutions/transparent-ready-automation
[58] J. Jiao and M. Tseng, "A methodology of developing product family architecture for mass customization," Journal of Intelligent Manufacturing, vol. 10, no. 1, pp. 3-20, March 1999.
[59] European Commission. (2012) European Commission: CORDIS: FP7. [Online]. http://cordis.europa.eu/fp7
[60] SOA4D Group. Service Oriented Architecture For Devices. [Online].

Chapter 9 – References
160
http://soa4d.org
[61] SODA Consortium. SODA. [Online]. http://www.soda-itea.org
[62] ITEA, "ITEA Achievement Award 2009 Press Release," Madrid, Press Release 2009.
[63] European Comission. (2011, May) IMC-AESOP: ArchitecturE for Service-Oriented Process - Monitoring and Control. [Online]. http://cordis.europa.eu/projects/95545_en.html
[64] Federal Ministry for Economics and Technology, Germany. (2012) E-Energy - IKT-basiertes Energiesystem der Zukunft. [Online]. http://www.e-energy.de
[65] German Commission for Electrical, Electronic & Information Technologies of DIN and VDE, "The German Roadmap: E-Energy/Smart Grid," Frankfurt am Main, Roadmap 2012.
[66] Austrian Energy Agency. klima:aktiv. [Online]. http://www.klimaaktiv.at
[67] Austrian Energy Agency, "Energieeffizienzprogramm für Betriebe," in 11. Symposium Energieinnovation, Graz, 2010.
[68] FlexWARE Consortium. FlexWARE. [Online]. http://www.flexware.at
[69] WASP Consortium. WASP - Wirelessly Accessible Sensor Populations. [Online]. http://www.wasp-project.org
[70] GINSENG Consortium. GINSENG. [Online]. www.ict-ginseng.eu
[71] AmI-MoSES Consortium. AmI-MoSES. [Online]. www.ami-moses.eu
[72] C. Shapiro and H. Varian, Information Rules: A Strategic Guide to the Network Economy, 1st ed. USA: Harvard Business School Press, 1998.
[73] G. Cândido, J. Barata, A. Colombo, and F. Jammes, "SOA in reconfigurable supply chains: A research roadmap," International Journal on Engineering Applications of Artificial Intelligence, vol. 22, no. 6, pp. 939-949, September 2009.
[74] D. Cachapa, R. Harrison, and A. Colombo, "Configuration of SoA-based devices in virtual production cells," International Journal of Production Research, vol. 49, no. 24, pp. 7397-7423, December 2011.
[75] N. Priyantha, A. Kansal, M. Goraczko, and F. Zhao, "Tiny web services: design and implementation of interoperable and evolvable sensor networks," in Proceedings of the 6th ACM Conference on Embedded Network Sensor Systems, Raleigh, 2008, pp. 253-266.
[76] S. Karnouskos, O. Baecker, L. de Souza, and P. Spiess, "Integration of SoA-ready Networked Embedded Devices in Enterprise Systems via a Cross-Layered Web Service Infrastructure," in Proceedings of the IEEE Conference on Emerging Technologies and Factory Automation, Patras, 2007, pp. 293 - 300.
Chapter 9 – References
161
[77] F. Jammes, "Service-oriented paradigms in industrial automation," in IEEE Transactions on Industrial Informatics, 2005, pp. 62-70.
[78] F. Jammes, H. Smit, J. Lastra, and I. Delamer, "Orchestration of service-oriented manufacturing processes," in 10th IEEE Conference on Emerging Technologies and Factory Automation, Catania, 2005, pp. 624-632.
[79] P. Leitão, A.W. Colombo, and F.J. Restivo, "A formal specification approach for holonic control systems: the ADACOR case," International Journal of Manufacturing Technology and Management, vol. 8, no. 1-3, pp. 37-57, January 2006.
[80] J. Mendes, P. Leitão, A. Colombo, and F. Restivo, "Service-oriented process control using High-Level Petri Nets," in 6th IEEE International Conference on Industrial Informatics, Daejeon, 2008, pp. 750-755.
[81] OPC Task Force, "OPC Overview," OPC Foundation, Industry Standard Specification 1998.
[82] OPC Foundation. (2011) What is OPC? [Online]. http://www.opcfoundation.org/Default.aspx/01_about/01_whatis.asp?MID=AboutOPC
[83] OPC Foundation, "Data Access Custom Interface Standard," 2003.
[84] OPC Foundation, "OPC XML-DA Specification," 2004.
[85] gSOAP. gSOAP: SOAP C++ Web Services. [Online]. http://www.cs.fsu.edu/~engelen/soap.html
[86] Microsoft Corporation. (2006, June) Web Services and the Microsoft Platform. [Online]. http://msdn2.microsoft.com/en-us/library/aa480728.aspx
[87] Dassault Sistèmes, "DELMIA V5 Automation: Fact Sheet R15," Grenoble, 2006.
[88] Schneider Electric, "Advantys STB Standard Dual Port Ethernet Modbus TCP/IP Network Interface Module Applications Guide," Product Guide 2010.
[89] Itron Inc. Technical Specifications for the ACE SL7000 Meter. [Online]. https://www.itron.com/productsAndServices/Pages/ACE%20SL7000.aspx?market=electricity
[90] Schneider Electric. Power Logic Web Site. [Online]. http://www.powerlogic.com
[91] R. Checcozzo et al., "RI-MACS: an innovative approach for future automation systems," International Journal of Mechatronics and Manufacturing Systems, vol. 2, no. 3, pp. 242-264, May 2009.
[92] A. Colombo, "Integration of Web-Services and Agent Technology: A Service-Oriented Architecture-based Automation Framework," VDI/VDE-Gesellschaft Mess-und Automatisierungstechnik (GMA), Stuttgart, Workshop "Agenten in der Automatisierungstechnik" 2008.
Chapter 9 – References
162
[93] A. Colombo and S. Karnouskos, "Towards the Factory of the Future: A Service-oriented Cross-layer Infrastructure," in ICT Shaping the World, John Wiley & Sons Ltd., Ed.: European Telecomunications Standardards Institute, 2009, ch. 6, pp. 65-81.
[94] J. Mendes, P. Leitão, A. Colombo, and F. Restivo, "High-Level Petri Nets control modules for service-oriented devices: a case study," in 34th Annual Conference of IEEE Industrial Electronics, Orlando, 2009, pp. 1487-1492.
[95] SOCRADES Consortium. (2008, December) YouTube: IP SOCRADES Demonstration of Service-Oriented Architecture integrating Real and Virtual Devices in the Electronic Assembly Scenario. [Online]. http://www.youtube.com/watch?v=0aRRvqEln2I
[96] Google, Inc. Google.org. [Online]. http://www.google.org
[97] EnProMa Consortium, "Energy Efficiency Service enabled Production Management - EnProMa," Project proposal 2009.
[98] D. Cachapa, A. Colombo, M. Feike, and A. Bepperling, "An approach for integrating real and virtual production automation devices applying the service-oriented architecture paradigm," in IEEE Conference on Emerging Technologies and Factory Automation, Patras, 2007, pp. 309 - 314.
[99] P. Leitão et al., "Integration of virtual and real environments for engineering service-oriented manufacturing systems," Journal of Intelligent Manufacturing, pp. 1-13, September 2011.
[100]
P. Leitão, J. Mendes, A. Bepperling, D. Cachapa, and A. Colombo, "Engineering tools for the integration of service-oriented production systems," in 13th IFAC Symposium on Information Control Problems in Manufacturing, Moscow, 2009.
[101]
D. Cachapa, R. Harrison, and A. Colombo, "Monitoring functions as service composition in a SoA-based industrial environment," in 36th Annual Conference on IEEE Industrial Electronics Society, Phoenix, 2010, pp. 1353 - 1358.
[1] European Union. FP6 NoE Innovative Production Machines and Systems (I*PROMS). [Online]. http://www.iproms.org
[2] J. Lastra, Reference Mechatronic Architecture for Actor-Based Assembly Systems. Tampere, Finland: Tampere University of Technology, 2004.
[3] R. Harrison and A. Colombo, "Collaborative Automation: From Rigid Coupling towards Dynamic Reconfigurable Production Systems," in Proceedings of the 16th IFAC World Congress, Prague, Czech Republic, July 2004.
[4] R. Zurawsky, The Industrial Information Technology Handbook. Boca Raton, USA: CRC Press, 2005.
Chapter 9 – References
163
[5] SIRENA Consortium. SIRENA. [Online]. http://www.sirena-itea.org
[6] SOCRADES Consortium. SOCRADES. [Online]. http://www.socrades.eu
[7] I. Delamer and J. Lastra, "Self-orchestration and choreography: towards architecture-agnostic manufacturing systems," in 20th International Conference on Advanced Information Networking and Applications, Vienna, 2006, p. 5 pp.
[8] ARC Advisory Group, "Collaborative automation: the platform for operational excellence," Ed. E. Basset, White Paper 2003.
[9] R. Harrison, A. Colombo, A. West, and S. Lee, "Reconfigurable modular automation systems for automotive power-train manufacture," International Journal of Flexible Manufacturing Systems, vol. 18, no. 3, pp. 175-190, September 2006.
[10] P. Spiess and S. Karnouskos, "Maximizing the business value of networked embedded systems through process-level integration into enterprise software," in 2nd International Conference on Pervasive Computing and Applications, Birmingham, 2007, pp. 536-541.
[11] A. Colombo and R. Harrison, "Modular and collaborative automation: achieving manufacturing flexibility and reconfigurability," International Journal of Manufacturing Technology and Management, vol. 14, no. 3-4, pp. 249-265, March 2008.
[12] ARC Advisory Group, "Collaborative manufacturing management strategies," Ed. E. Basset, Report 2002.
[13] OECD. (2001) Policy Brief: Sustainable development: Critical issues. [Online]. http://www.oecd.org/document/55/0,3343,en_2649_34589_1890487_1_1_1_1,00.html
[14] Department of Trade and Industry, "Energy Consumption in the United Kingdom," London, 2002.
[15] European Climate Foundation, "Power Perspectives 2030," European Union, Report 2011.
[16] D. Cachapa, R. Harrison, A. Colombo, and Les Lee, "SoA-based Production Monitoring Systems for Energy Efficiency: A Case-study Using Ford’s POSMon System," in IEEE International Conference on Industrial Technology, Viña del Mar, 2010, pp. 1077-1081.
[17] D. Cachapa, R. Harrison, A. Colombo, and L. Lee, "Improving energy efficiency in service-oriented production automation systems," in IEEE International Symposium on Industrial Electronics , Bari, 2010, pp. 3533 - 3538.
[18] European Comission, "Embedding intelligence in collaborative automation systems (production systems engineering)," Consultation IST and the Preparation of the Framework Program 7 (2007-2013), Workshop on “Agile, Wireless Manufacturing Plant” 2005.
Chapter 9 – References
164
[19] A. Colombo, R. Schoop, and R. Neubert, "An agent-based intelligent control platform for industrial holonic manufacturing systems," IEEE Transactions on Industrial Electronics, vol. 53, no. 1, pp. 322-337, February 2006.
[20] P. Leitão, A.W. Colombo, and F.J. Restivo, "ADACOR: a collaborative production automation and control architecture," IEE Intelligent Systems, vol. 20, no. 1, pp. 58-66, January 2005.
[21] A. Colombo, "Industrial Agents: Towards Collaborative Production-Automation, -Management and -Organization," vol. 52, no. 4, December 2005.
[22] Harry Saunders, "The Khazzoom-Brookes Postulate and Neoclassical Growth," The Energy Journal, vol. 13, no. 4, pp. 130-148, 1992.
[23] W3C - World Wide Web Consortium. (2004, February) Web Services Architecture. [Online]. http://www.w3.org/TR/ws-arch/#introduction
[24] OASIS Web Services Interoperability. WS-i. [Online]. http://www.oasis-ws-i.org
[25] F. Jammes, A. Mensch, and H. Smit, "Service-oriented Device Communications Using the Devices Profile for Web Services," in MPAC '05 Proceedings of the 3rd international workshop on Middleware for pervasive and ad-hoc computing, New York, 2005, pp. 1-8.
[26] T. Gogg and J. Mott, "Introduction to Simulation," in Proceedings of the 25th Conference on Winter Simulation, New York, 1993, pp. 9-17.
[27] S. Lind et al., "SIMTER - A Joint Simulation Tool for Production Development," VTT Finland, Espoo, Working Paper 125 2009.
[28] T. Schriber and D. Brunner, "Inside discrete-event simulation software: How it works and why it matters," in Proceedings of the 2010 Winter Simulation Conference, Phoenix, 2010, pp. 151 - 165.
[29] K. Feldmann and A. Colombo, "Monitoring of flexible production systems using high-level petri net specifications," Control Engineering Practice, vol. 7, pp. 1449-1466, December 1999.
[30] M. Elbestawi, S. Wu, and R. Du, "Automated Monitoring of Manufacturing Processes, Part 1: Monitoring Methods," Journal of Engineering for Industry, vol. 117, no. 2, pp. 121-132, May 1995.
[31] F. Jammes and H. Smit, "Service-oriented architectures for devices - the SIRENA view," in 3rd IEEE International Conference on Industrial Informatics, Perth, 2005, pp. 140-147.
[32] European Commission, "Communication of 29 October," Brussels, 2008.
[33] European Commission, "Communication from the Commission to the European Council: a European economic recovery plan," Brussels, 2008.
[34] United Nations Framework Convention on Climate Change, "Kyoto Protocol
Chapter 9 – References
165
Reference Manual," 2008.
[35] United Nations, "Vienna UN conference shows consensus on key building blocks for effective international response to climate change," Vienna, Press Release 2007.
[36] Adam Smith, An Inquiry into the Nature and Causes of the Wealth of Nations. London, UK: W. Strahan and T. Cadell, 1776.
[37] J. Zachman, "A framework for information systems architecture," IBM Systems Journal paper, vol. 26, no. 3, pp. 276-292, 1987.
[38] Roger Sessions. (2007, May) A Comparison of the Top Four Enterprise-Architecture Methodologies. [Online]. http://msdn.microsoft.com/en-us/library/bb466232.aspx
[39] ISA. ISA95 Enterprise-Control System Integration. [Online]. http://www.isa.org/ISA95
[40] PERA. Pera Enterprise Integration Website. [Online]. http://pera.net/
[41] Batch Control. Introduction to S95. [Online]. http://www.batchcontrol.com/s95/s95.shtml
[42] PERA. PERA Control and Information Architecture. [Online]. http://www.pera.net/Pera/PERA_Information_Architecture.html
[43] European Commission, "2020 vision: Saving our energy," Brussels, 2007.
[44] J. O'Shea, "Reducing the electrical energy consumption of Cross Hueller CNC machines," Ford Motor Company, Dunton, Internal Presentation 2009.
[45] PROFIBUS Nutzerorganisation e.V., "The PROFIenergy Profile," Karlsruhe, White Paper 2012.
[46] J. Ladbrook and A. Januszczak, "Ford's power train operations: changing the simulation environment," in Proceedings of the Winter Simulation Conference, Arlington, 2001, pp. 863-869.
[47] The Mathworks, Inc. (2012) MATLAB and Simuling for Technical Computing. [Online]. http://www.mathworks.com
[48] E. Estevez, M. Marcos, U. Gangoiti, and D. Orive, "A tool integration framework for industrial distributed control systems," in 44th IEEE Conference on Decision and Control, Seville, 2005, pp. 8373 - 8378.
[49] U. Hatnik and S. Altmann, "Using ModelSim, Matlab/Simulink and NS for Simulation of Distributed Systems," in International Conference on Parallel Computing in Electrical Engineering, Dresden, 2004, pp. 114-119.
[50] J.N. Pires, S.S. Ge, T.H. Lee, D.L. Gu, and L.C. Woon, "Interfacing industrial R&A equipment using Matlab," IEEE Robotics & Automation Magazine, vol. 7, no. 3, pp. 32-41, September 2000.
Chapter 9 – References
166
[51] The MathWorks, Inc. (2012) Simulink - Simulation and Model-Based Design. [Online]. http://www.mathworks.com/products/simulink
[52] J. Friedman, "MATLAB/Simulink for automotive systems design," in Proceedings of the conference on Design, automation and test in Europe, Leuven, 2006.
[53] Green Car Congress. (2009, October) General Motors Developed Two-Mode Hybrid Powertrain With MathWorks Model-Based Design; Cut 24 Months Off Expected Dev Time. [Online]. http://www.greencarcongress.com/2009/10/general-motors-developed-twomode-hybrid-powertrain-with-mathworks-modelbased-design-cut-24-months-of.html
[54] Schneider Electric, "PowerLogic ION Entreprise: A Complete Power Management Solution," 2009.
[55] SAP, "SAP Manufacturing Execution: Optimizing Operations, Manufacturing," 2008.
[56] PERA. (2006) Purdue Reference Architecture. [Online]. http://www.pera.net
[57] Schneider Electric. Transparent Ready Automation. [Online]. http://products.schneider-electric.us/products-services/products/webenabled-solutions/transparent-ready-automation
[58] J. Jiao and M. Tseng, "A methodology of developing product family architecture for mass customization," Journal of Intelligent Manufacturing, vol. 10, no. 1, pp. 3-20, March 1999.
[59] European Commission. (2012) European Commission: CORDIS: FP7. [Online]. http://cordis.europa.eu/fp7
[60] SOA4D Group. Service Oriented Architecture For Devices. [Online]. http://soa4d.org
[61] SODA Consortium. SODA. [Online]. http://www.soda-itea.org
[62] ITEA, "ITEA Achievement Award 2009 Press Release," Madrid, Press Release 2009.
[63] European Comission. (2011, May) IMC-AESOP: ArchitecturE for Service-Oriented Process - Monitoring and Control. [Online]. http://cordis.europa.eu/projects/95545_en.html
[64] Federal Ministry for Economics and Technology, Germany. (2012) E-Energy - IKT-basiertes Energiesystem der Zukunft. [Online]. http://www.e-energy.de
[65] German Commission for Electrical, Electronic & Information Technologies of DIN and VDE, "The German Roadmap: E-Energy/Smart Grid," Frankfurt am Main, Roadmap 2012.
[66] Austrian Energy Agency. klima:aktiv. [Online]. http://www.klimaaktiv.at
Chapter 9 – References
167
[67] Austrian Energy Agency, "Energieeffizienzprogramm für Betriebe," in 11. Symposium Energieinnovation, Graz, 2010.
[68] FlexWARE Consortium. FlexWARE. [Online]. http://www.flexware.at
[69] WASP Consortium. WASP - Wirelessly Accessible Sensor Populations. [Online]. http://www.wasp-project.org
[70] GINSENG Consortium. GINSENG. [Online]. www.ict-ginseng.eu
[71] AmI-MoSES Consortium. AmI-MoSES. [Online]. www.ami-moses.eu
[72] C. Shapiro and H. Varian, Information Rules: A Strategic Guide to the Network Economy, 1st ed. USA: Harvard Business School Press, 1998.
[73] G. Cândido, J. Barata, A. Colombo, and F. Jammes, "SOA in reconfigurable supply chains: A research roadmap," International Journal on Engineering Applications of Artificial Intelligence, vol. 22, no. 6, pp. 939-949, September 2009.
[74] D. Cachapa, R. Harrison, and A. Colombo, "Configuration of SoA-based devices in virtual production cells," International Journal of Production Research, vol. 49, no. 24, pp. 7397-7423, December 2011.
[75] N. Priyantha, A. Kansal, M. Goraczko, and F. Zhao, "Tiny web services: design and implementation of interoperable and evolvable sensor networks," in Proceedings of the 6th ACM Conference on Embedded Network Sensor Systems, Raleigh, 2008, pp. 253-266.
[76] S. Karnouskos, O. Baecker, L. de Souza, and P. Spiess, "Integration of SoA-ready Networked Embedded Devices in Enterprise Systems via a Cross-Layered Web Service Infrastructure," in Proceedings of the IEEE Conference on Emerging Technologies and Factory Automation, Patras, 2007, pp. 293 - 300.
[77] F. Jammes, "Service-oriented paradigms in industrial automation," in IEEE Transactions on Industrial Informatics, 2005, pp. 62-70.
[78] F. Jammes, H. Smit, J. Lastra, and I. Delamer, "Orchestration of service-oriented manufacturing processes," in 10th IEEE Conference on Emerging Technologies and Factory Automation, Catania, 2005, pp. 624-632.
[79] P. Leitão, A.W. Colombo, and F.J. Restivo, "A formal specification approach for holonic control systems: the ADACOR case," International Journal of Manufacturing Technology and Management, vol. 8, no. 1-3, pp. 37-57, January 2006.
[80] J. Mendes, P. Leitão, A. Colombo, and F. Restivo, "Service-oriented process control using High-Level Petri Nets," in 6th IEEE International Conference on Industrial Informatics, Daejeon, 2008, pp. 750-755.
[81] OPC Task Force, "OPC Overview," OPC Foundation, Industry Standard Specification 1998.
Chapter 9 – References
168
[82] OPC Foundation. (2011) What is OPC? [Online]. http://www.opcfoundation.org/Default.aspx/01_about/01_whatis.asp?MID=AboutOPC
[83] OPC Foundation, "Data Access Custom Interface Standard," 2003.
[84] OPC Foundation, "OPC XML-DA Specification," 2004.
[85] gSOAP. gSOAP: SOAP C++ Web Services. [Online]. http://www.cs.fsu.edu/~engelen/soap.html
[86] Microsoft Corporation. (2006, June) Web Services and the Microsoft Platform. [Online]. http://msdn2.microsoft.com/en-us/library/aa480728.aspx
[87] Dassault Sistèmes, "DELMIA V5 Automation: Fact Sheet R15," Grenoble, 2006.
[88] Schneider Electric, "Advantys STB Standard Dual Port Ethernet Modbus TCP/IP Network Interface Module Applications Guide," Product Guide 2010.
[89] Itron Inc. Technical Specifications for the ACE SL7000 Meter. [Online]. https://www.itron.com/productsAndServices/Pages/ACE%20SL7000.aspx?market=electricity
[90] Schneider Electric. Power Logic Web Site. [Online]. http://www.powerlogic.com
[91] R. Checcozzo et al., "RI-MACS: an innovative approach for future automation systems," International Journal of Mechatronics and Manufacturing Systems, vol. 2, no. 3, pp. 242-264, May 2009.
[92] A. Colombo, "Integration of Web-Services and Agent Technology: A Service-Oriented Architecture-based Automation Framework," VDI/VDE-Gesellschaft Mess-und Automatisierungstechnik (GMA), Stuttgart, Workshop "Agenten in der Automatisierungstechnik" 2008.
[93] A. Colombo and S. Karnouskos, "Towards the Factory of the Future: A Service-oriented Cross-layer Infrastructure," in ICT Shaping the World, John Wiley & Sons Ltd., Ed.: European Telecomunications Standardards Institute, 2009, ch. 6, pp. 65-81.
[94] J. Mendes, P. Leitão, A. Colombo, and F. Restivo, "High-Level Petri Nets control modules for service-oriented devices: a case study," in 34th Annual Conference of IEEE Industrial Electronics, Orlando, 2009, pp. 1487-1492.
[95] SOCRADES Consortium. (2008, December) YouTube: IP SOCRADES Demonstration of Service-Oriented Architecture integrating Real and Virtual Devices in the Electronic Assembly Scenario. [Online]. http://www.youtube.com/watch?v=0aRRvqEln2I
[96] Google, Inc. Google.org. [Online]. http://www.google.org
[97] EnProMa Consortium, "Energy Efficiency Service enabled Production Management - EnProMa," Project proposal 2009.
Chapter 9 – References
169
[98] D. Cachapa, A. Colombo, M. Feike, and A. Bepperling, "An approach for integrating real and virtual production automation devices applying the service-oriented architecture paradigm," in IEEE Conference on Emerging Technologies and Factory Automation, Patras, 2007, pp. 309 - 314.
[99] P. Leitão et al., "Integration of virtual and real environments for engineering service-oriented manufacturing systems," Journal of Intelligent Manufacturing, pp. 1-13, September 2011.
[100]
P. Leitão, J. Mendes, A. Bepperling, D. Cachapa, and A. Colombo, "Engineering tools for the integration of service-oriented production systems," in 13th IFAC Symposium on Information Control Problems in Manufacturing, Moscow, 2009.
[101]
D. Cachapa, R. Harrison, and A. Colombo, "Monitoring functions as service composition in a SoA-based industrial environment," in 36th Annual Conference on IEEE Industrial Electronics Society, Phoenix, 2010, pp. 1353 - 1358.