a snapshot of title i schools, 2000-01 (ms word) … · web viewdoc # 2003–02. office of the...
TRANSCRIPT

This is some
POLICY AND PROGRAM STUDIES SERVICE
A SA SNAPSHOTNAPSHOT OFOF T TITLEITLE I S I SCHOOLSCHOOLS, 2000–01, 2000–01
U.S. DEPARTMENT OF EDUCATIONDOC # 2003–02
OFFICE OF THE UNDER SECRETARY


A SA SNAPSHOTNAPSHOT OFOF T TITLEITLE I S I SCHOOLSCHOOLS, 2000–01, 2000–01
SHEILA NATARAJ KIRBYJENNIFER SLOAN MCCOMBS
SCOTT NAFTELSHEILA E. MURRAY
RAND1200 SOUTH HAYES STREET
ARLINGTON, VIRGINIA 22202-5050
2003

This report was prepared for the U.S. Department of Education under Contract Number EA 97010001. The views expressed herein are those of the contractor. No official endorsement by the U.S. Department of Education is intended or should be inferred.
U.S. Department of EducationRoderick R. Paige Secretary
Office of the Under Secretary Eugene HickokUnder Secretary
Policy and Program Studies ServiceAlan L. GinsburgDirector
Program and Analytic Studies DivisionDavid GoodwinDirector
October 2003
This report is in the public domain. Authorization to reproduce it in whole or in part is granted. While permission to reprint this publication is not necessary, the citation should be: U.S. Department of Education, Office of the Under Secretary, Policy and Program Studies Service, A Snapshot of Title I Schools, 2000–01, Washington, D.C., 2003.
To order copies of this report, write:ED PubsEducation Publications CenterU.S. Department of Education P. O. Box 1398Jessup, MD 20794-1398; via fax, dial (301) 470-1244;or via electronic mail, send your request to: [email protected]. You may also call toll-free: 1-877-433-7827 (1-877-4ED-PUBS). If 877 service is not yet available in your area, call 1-800-872-5327 (1-800-USA-LEARN); Those who use a telecommunications device for the deaf (TDD) or a teletypewriter (TTY) should call 1-800-437-0833.To order online, point your Internet browser to: www.ed.gov/pubs/edpubs.html. This report is also available on the Department’s Web site at: http://www.ed.gov/about/offices/list/ous/ppss/index.html. On request, this publication is available in alternative formats, such as Braille, large print, audiotape, or computer diskette. For more information, please contact the Department’s Alternate Format Center (202) 260-9895 or (202) 205-8113.

CONTENTS
Introduction.......................................................................................................1
Data Sources....................................................................................................1
Caveats............................................................................................................2
Key Terms........................................................................................................2
Notes................................................................................................................3
Acknowledgments............................................................................................3
Key Findings.....................................................................................................5
Profile of Title I Schools, Students, and Teachers...........................................7
Student Outcomes..........................................................................................12
Coordination of Funds....................................................................................26
Provision of Extended Learning Time Programs............................................27
Provision of Additional Instructional Services................................................28
Parent Involvement in Schools.......................................................................30
Professional Development.............................................................................32
Instructional Leadership.................................................................................36
School Accountability Under Title I.................................................................37
Appendix........................................................................................................43
Page i | A Snapshot of Title I Schools, 2000–01

Page ii | A Snapshot of Title I Schools, 2000–01

EXHIBITS
Exhibit 1. School Poverty Level.............................................................................................................................................................................7Exhibit 2. Percentage Minority Students...............................................................................................................................................................8Exhibit 3. Schools Serving Selected Student Subgroups......................................................................................................................................9Exhibit 4. Experience and Attrition Rates of Teachers........................................................................................................................................10Exhibit 5. Prevalence of Schoolwide Programs and Research-Based School Reform Models...........................................................................11Exhibit 6. Student Readiness for the Next Grade and Promotion Rates.............................................................................................................12Exhibit 7. Trends in Participation of Selected Student Subgroups in Annual State Assessments......................................................................13Exhibit 8. Reporting of Disaggregated Assessment Results...............................................................................................................................14Exhibit 9. State Reports of the Categories by Which They Disaggregate State Assessment Results................................................................15Exhibit 10. Proficiency Levels of Low-Income and Other Students on the 2002 State NAEP, 4th Grade Reading................................................16Exhibit 11. Gap in Proficiency Levels of Low-Income and Other Students on the 2002 State NAEP, 4th Grade Reading....................................17Exhibit 12. Gap in Proficiency Levels in High- and Low-Poverty Schools on the 2001 State Assessments, 4 th Grade Reading..........................18Exhibit 13. Proficiency Levels of Low-Income and Other Students on the 2000 State NAEP, 8th Grade Mathematics.........................................19Exhibit 14. Gap in Proficiency Levels of Low-Income and Other Students on the 2000 State NAEP, 8th Grade Mathematics.............................20Exhibit 15. Gap in Proficiency Levels in High- and Low-Poverty Schools on the 2001 State Assessments, 8 th Grade Mathematics..................21Exhibit 16. Student Proficiency Levels on the 2002 State NAEP and 2001 State Assessments, 4th Grade Reading...........................................22Exhibit 17. Differences in Student Proficiency Levels on the 2002 State NAEP and 2001 State Assessments, 4 th Grade Reading....................23Exhibit 18. Student Proficiency Levels on the 2000 State NAEP and 2001 State Assessments, 8th Grade Mathematics....................................24Exhibit 19. Differences in Student Proficiency Levels on the 2000 State NAEP and 2001 State Assessments, 8 th Grade Mathematics..............25Exhibit 20. Coordination of Title I Funds with Other Sources of Funds.................................................................................................................26Exhibit 21. Prevalence of Extended Learning Time Programs..............................................................................................................................27Exhibit 22. Settings in Which Additional Instructional Services Were Provided....................................................................................................28Exhibit 23. Use of Teacher Aides to Provide Additional Instructional Services.....................................................................................................29Exhibit 24. Level of Parent Involvement in Schools..............................................................................................................................................30Exhibit 25. Strategies to Increase Parent Involvement in Student Learning..........................................................................................................31Exhibit 26. Focus of Teacher Professional Development......................................................................................................................................32
Page iii | A Snapshot of Title I Schools, 2000–01

Exhibit 27. Duration of Teacher Professional Development Activities and Relationship to Teaching Practices....................................................33Exhibit 28. Relationship Between Professional Development and Teacher Preparedness..................................................................................34Exhibit 29. Professional Development Opportunities for Teacher Aides...............................................................................................................35Exhibit 30. Teachers’ Ratings of Principals as Instructional Leaders....................................................................................................................36Exhibit 31. Percentage of Title I Schools Identified as In Need of Improvement Under Title I, State Reports......................................................37Exhibit 32. Principal Knowledge About the School Improvement Process............................................................................................................38Exhibit 33. Poverty and Minority Status of Schools Identified as In Need of Improvement Under Title I and All Title I Schools...........................39Exhibit 34. Provision of Technical Assistance.......................................................................................................................................................40Exhibit 35. Additional Strategies Adopted by Schools as a Result of Being Identified for Improvement...............................................................41Exhibit 36. Additional Steps and Corrective Actions Taken by Districts with Schools as a Result of Their Being Identified for
Improvement....................................................................................................................................................................................... 42Exhibit A.1. Categories by Which State Assessment Results Are Disaggregated, 2000–01..................................................................................44Exhibit A.2. Percentage of Students Scoring at or Above the Proficient Level on the 2002 State NAEP and 2001 State Assessments,
4th Grade Reading...............................................................................................................................................................................47Exhibit A.3. Percentage of Students Scoring at or Above the Proficient Level on the 2000 State NAEP and 2001 State Assessments,
8th Grade Mathematics........................................................................................................................................................................50Exhibit A.4. Percentage of Students Scoring at or Above the Proficient Level on the 2002 State NAEP, 4 th Grade Reading,
Categorized by Eligibility for the Free and Reduced-Price Lunch Program.........................................................................................53Exhibit A.5. Percentage of Students Scoring at or Above the Proficient Level on the 2000 State NAEP, 8 th Grade Mathematics,
Categorized by Eligibility for the Free and Reduced-Price Lunch Program.........................................................................................56Exhibit A.6. Gap Between High- and Low-Poverty Schools in the Percentage of Students Scoring at or Above the Proficient Level on
the 2001 State Assessments, 4th Grade Reading and 8th Grade Mathematics....................................................................................59Exhibit A.7. Title I Schools Identified for School Improvement, by State, 1998–99, 1999–2000, and 2000–01.....................................................62
Page iv | A Snapshot of Title I Schools, 2000–01

INTRODUCTION Title I of the Elementary and Secondary Education Act (ESEA) is the largest compensatory federal education program—currently about $12 billion annually—aimed at improving the educational opportunities of disadvantaged students. It provides resources to schools to improve learning for students at risk of educational failure, especially in districts with the highest concentrations of poverty. More than 15 million students in public and private schools participate in Title I, two-thirds of whom are in elementary schools. Ninety-six percent of the nation’s highest-poverty schools (defined as those with 75 percent or more of students eligible for the free and reduced-price lunch program) receive nearly half of the Title I funds provided to schools.
The No Child Left Behind Act of 2001 (NCLB) embodies four principles: stronger accountability for results; expanded flexibility and local control; an emphasis on teaching methods that have been proven to work; and expanded options for parents. For example, NCLB requires states to develop and implement challenging content and performance standards for all students, to adopt yearly assessments that are aligned with these standards, and to establish rigorous and explicit criteria for measuring school progress (adequate yearly progress or AYP). At the same time, schools with 40 percent or more of their students eligible for the free and reduced-price lunch program have been given increased flexibility in combining Title I funds with other sources of funding to implement schoolwide Title I programs, to improve the educational program for all students rather than just targeted Title I students. Schools are to be provided data on the performance of their students, disaggregated by a number of characteristics, including race-ethnicity, poverty status, limited English proficiency status, student disability status, gender, and migrant status, to foster data-driven decisionmaking.1 If schools fail to attain the AYP goal for two consecutive years, they are to be identified as in need of improvement under Title I and provided technical assistance to help them improve. In the first year of being identified as in need of improvement, schools must provide students the option of transferring to a better-performing school; in the second year, schools must also provide eligible students supplemental educational services from approved providers (including outside groups). If schools fail to make progress for two years after being identified for improvement, they are subject to “corrective action” by districts, including replacing school staff, imposition of a new curriculum, significantly decreased management authority, or restructuring. Many of these provisions were first introduced by the 1994 reauthorization of the ESEA. As such, understanding the progress that Title I schools made in implementing the provisions of the 1994 legislation and the challenges they faced in doing so should offer useful lessons for the implementation of NCLB.
This booklet presents a collection of exhibits utilizing data from several sources. Taken together, these exhibits provide a profile of Title I schools just prior to the passage of NCLB and document how conditions in these schools changed over time, particularly with respect to the implementation of several key provisions of both the 1994 and 2001 legislation. Thus, this booklet offers baseline data on Title I schools against which to measure progress under NCLB.
DATA SOURCESThis report integrates data from several different sources, including the following:
(a) Schools and Staffing Survey, Public School and Public Charter School Files, school year (SY) 1999–2000 (Exhibits 1–3).
1The definition of adequate yearly progress for schools includes separate objectives for improvement in the achievement of students grouped by these categories, with the exception of gender and migrant status.
Page 1 | A Snapshot of Title I Schools, 2000–01

(b) National Assessment of Educational Progress (NAEP) state assessments (Exhibits 10, 11, 13, 14, 16, 17, 18, 19; A.2, A.3, A.4, A.5). The state NAEP is designed to provide accurate and representative state-level estimates of the performance of students based on representative state samples. Data shown are from the 2002 State NAEP assessment (4 th grade reading) and the 2000 State NAEP assessment (8th grade mathematics).
(c) U.S. Department of Education Consolidated State Performance Reports:
a. Student performance on 4th grade reading and 8th grade mathematics on the 2001 state-mandated assessments (Exhibits 12, 15, 16, 17, 18, 19; A.2, A.3, A.6); and
b. Student categories by which state assessment data are disaggregated (Exhibits 9; A.1).
(d) State reports to the U.S. Department of Education on the number of schools identified as in need of improvement under Title I (Exhibits 31; A.7).
(e) National Longitudinal Survey of Schools (NLSS), the primary source of data for the exhibits, except as noted above. This was a three-year study launched by the U.S. Department of Education to collect data on the implementation of the 1994 provisions from a nationally-representative sample of 1,507 Title I schools in SY 1998–99. Designed and conducted by Westat, the principal and teacher surveys of the NLSS were first fielded during 1998–99; schools that remained in the Title I program were followed for the next two years through 2000–01. The total number of responding schools was 1,081 in 1998–99, 987 in 1999–2000, and 967 in 2000–01. Up to six teachers were sampled in each school: a Title I teacher (where present), and mathematics and reading, language arts, or English teachers. The total number of responding teachers was 5,422 in 1998–99, 5,419 in 1999–2000, and 5,255 in 2000–01.
CAVEATSIt is important to keep in mind that the NLSS analyses reported here are based on survey data that rely on respondents’ self-reports. In addition, the findings generally present subgroup comparisons (e.g., highest-poverty versus low-poverty schools) for the variables of interest, but are not meant to suggest causality. Another important caveat is that the samples of respondents in 1999–2000 and 2000–01 are only representative of the 1998–99 population of Title I schools that remained eligible in those two subsequent years, and not of the population of Title I schools in 1999–2000 or 2000–01 (which would include new Title I schools not represented in the 1998–99 sample).
KEY TERMSTitle I School: School receiving Title I funds.
School Poverty Level: Measured by the percentage of students eligible for the free and reduced-price lunch program. Schools are categorized as follows, based on the percentage of students eligible for the free and reduced-price lunch program: “highest-poverty” (≥75 percent); “high-poverty” (≥50 percent); “low-to-medium poverty” (35–49.9 percent); and “low-poverty” (<35 percent).
Low-Income Student: Measured by a student’s eligibility for the free and reduced-price lunch program.
Percentage Minority Students: Measured by the percentage of students who were classified as other than “white, non-Hispanic.” Schools are categorized as follows, based on the percentage of minority students: “highest-minority” (≥75 percent); “high-minority” (≥50 percent); “low-to-medium minority” (25–49.9 percent); and “low-minority” (<25 percent).
Page 2 | A Snapshot of Title I Schools, 2000–01
Schoolwide Schools: Under the 1994 legislation, high-poverty schools (those with school poverty level ≥50 percent) were allowed to use Title I money, in combination with other federal, state, and local funds, to improve the entire educational program for all their students (rather than just targeted Title I students), i.e., to operate schoolwide programs.2 Schools that do not meet the eligibility criteria can sometimes get a waiver to operate schoolwide programs. Schools operating schoolwide programs are referred to as “schoolwide schools.”
Targeted Assistance Schools: Targeted assistance programs use Title I funds to provide services to students identified as failing or most at risk of failing to meet a state’s content and student performance standards. Schools operating targeted assistance programs are referred to as “targeted assistance schools.”
Significant: The term is used in the statistical sense to indicate that the difference between the estimates being compared was statistically significant at the 0.05 level.
NOTES Results from the NAEP are compared with data from the state assessments to provide multiple indicators of student performance in the states.
Note that, because of the differences in definitions of proficiency levels in the NAEP and state performance standards, these data are not directly comparable.3 Nonetheless, the data provide an indication of how results vary between standard setting methods used by the NAEP and the states in terms of percentage of students regarded as “proficient.”
The NLSS exhibits report weighted estimates. Each exhibit is accompanied by an “Exhibit reads” below the graph or table. This is not intended to highlight the key points of the exhibit or
statistically significant findings, but simply to illustrate how to read the first few data points on the exhibit. The text in the main body of the exhibit discusses key points and where appropriate, the statistical significance of the findings. The exhibits report estimates that have been rounded. As a result, numbers may not total 100 percent.
ACKNOWLEDGMENTSWe thank Susan Sanchez and Daphne Hardcastle, the former and current Contracting Officer’s Representative (COR) for the NLSS, and Babette Gutmann of Westat, the Project Director of the NLSS, for their interest in and support of this study. Several staff members of the U.S. Department of Education, in particular Stephanie Stullich, David Goodwin, and Alan Ginsburg, provided useful comments on earlier versions of this report. We are grateful to the following RAND colleagues for their assistance with this report: Stephen Bloodsworth, our graphics artist; Paul Arends, our editor; Heather Barney, our research assistant; and Carolyn Rowe, our administrative assistant.
Most of all, we thank the teachers, principals, and staff in the studied schools who gave of their time to participate in the surveys.
2As mentioned, the 2001 legislation expanded eligibility from schools with 50 percent or more of their students eligible for the free and reduced-price lunch program to schools with 40 percent or more of their students eligible for the free and reduced-price lunch program. 3See, for example, National Research Council. (1999). Uncommon measures: Equivalence and linkage among educational tests. Washington DC: National Academy Press; Linn, R. L. (2000). Assessments and accountability. Educational Researcher, 29 (2); Linn, R. L. (2003). Performance standards: Utility for different uses of assessments. Education Policy Analysis Archives, 11(31).
Page 3 | A Snapshot of Title I Schools, 2000–01

THIS PAGE INTENTIONALLY LEFT BLANK
Page 4 | A Snapshot of Title I Schools, 2000–01

KEY FINDINGS
Compared with all public schools in 2000–01, Title I schools had higher student poverty levels and served higher percentages of minority students, students with limited English proficiency, migrant students, and Native American students.
Compared with Title I low-poverty schools, Title I highest-poverty schools faced greater challenges in terms of higher teacher attrition and teacher inexperience, higher percentages of students not being prepared to work at the next grade level, and lower levels of parent involvement. However, these schools had adopted a number of strategies, including appointing parent liaisons and offering training for parents, to increase parental involvement in student learning.
Despite legislation requiring schools to minimize pullout programs (programs that remove struggling students from class to provide them supplemental instructional services), over 70 percent of Title I schoolwide schools used pullout programs to provide other instructional services.
Participation of migrant students and students with disabilities in the state assessments increased markedly over time from 1998–99 to 2000–01.
The percentage of low-income students achieving at or above the proficient level on the NAEP in both reading and mathematics was much lower than the percentage of students who were not low-income who scored at or above the proficient level. The gap between high- and low-poverty schools in the percentage of students scoring at or above the proficient level on state assessments in both reading and mathematics was large. In half the states for which data were available, the difference was 30 percentage points or higher.
About half the states reported disaggregating assessment results by various categories of students including poverty, migrant, limited English proficiency, and disability status of students. However, while the percentage of Title I schools receiving disaggregated results increased from 1998–99 to 2000–01, many principals reported not yet receiving disaggregated data.
There was considerable confusion on the part of principals about the school improvement process. Only a little more than half of the principals in schools identified by the district for improvement agreed that their school had been identified as in need of improvement. Of these, many did not know what the state considered to be adequate yearly progress.
Only half of the schools in need of improvement had received additional technical assistance or professional development as required by the law. Districts appeared to be targeting newly-identified schools and schools that had been identified for four or more years for technical assistance.
Page 5 | A Snapshot of Title I Schools, 2000–01

THIS PAGE INTENTIONALLY LEFT BLANK
Page 6 | A Snapshot of Title I Schools, 2000–01

Exhibit 1 Profile of Title I Schools, Students, and Teachers
School Poverty Level
SOURCE: Schools and Staffing Survey, SY 1999–2000.
Compared with non-Title I public schools, Title I schools were much poorer. For example, in 1999–2000, over a quarter (26 percent) of Title I schools were highest-poverty schools, defined as those with 75 percent or more of students eligible for the free and reduced-price lunch program, compared with only 7 percent of non-Title I schools. Overall, more than half of Title I schools (52 percent) were high-poverty schools, with 50 percent or more of students eligible for the free and reduced-price lunch program, compared with 18 percent of non-Title I schools. About two-thirds of non-Title I schools (67 percent) were low-poverty schools, defined as those with less than 35 percent of students eligible for the free and reduced-price lunch program, compared with only 30 percent of Title I schools. All the differences between Title I and non-Title I public schools shown in the exhibit were statistically significant.
School Poverty Level: Title I and Non-Title I Public Schools, 1999–2000
Exhibit reads: In 1999–2000, 26 percent of Title I schools were highest-poverty schools, compared with 7 percent of non-Title I schools.
Page 7 | A Snapshot of Title I Schools, 2000–01

Exhibit 2 Profile of Title I Schools, Students, and Teachers
Percentage Minority Students
SOURCE: Schools and Staffing Survey, SY 1999–2000.
In 1999–2000, Title I schools served a higher percentage of minority students than did non-Title I schools. For example, 23 percent of Title I schools were in the highest-minority category, with 75 percent or more students being minority, compared with only 10 percent of non-Title I schools. Thirty-seven percent of Title I schools served student bodies that were 50 percent or more minority compared with 19 percent of non-Title I schools. All the differences between Title I and non-Title I public schools shown in the exhibit were statistically significant.
Percentage Minority Students: Title I and Non-Title I Public Schools, 1999–2000
Exhibit reads: In 1999–2000, 23 percent of Title I schools were in the highest-minority category of schools, compared with 10 percent of non-Title I schools.
Exhibit 3 Profile of Title I Schools, Students, and Teachers
Schools Serving Selected Student Subgroups
SOURCE: Schools and Staffing Survey, SY 1999–2000.
In 1999–2000, students with limited English proficiency, migrant students, and Native American students were much more likely to attend Title I schools than non-Title I schools. For example, 69 percent of students with limited English proficiency, 71 percent of migrant students, and 64 percent of Native American students attended a Title I school. All the differences between Title I and non-Title I public schools shown in the exhibit were statistically significant.
Percentage of Selected Student Subpopulations Being Served by Title I and Non-Title I Public Schools,
1999–2000
Exhibit reads: In 1999–2000, 69 percent of students with limited English proficiency attended Title I schools, while 31 percent attended non-Title I schools.

Exhibit 4 Profile of Title I Schools, Students, and Teachers
Experience and Attrition Rates of Teachers
SOURCE: NLSS Principal Survey, SY 2000–01.
In 2000–01, 12 percent of teachers in Title I schools had less than three years of experience, and 7 percent of the teachers did not return to the same school after summer break. The highest-poverty schools were significantly more likely to have higher percentages of inexperienced teachers and rates of teacher attrition than low-poverty schools. Seventeen percent of teachers in Title I highest-poverty schools had less than three years of experience, compared with 9 percent in the low-poverty schools. The annual attrition rate of teachers in the highest-poverty schools was also higher than that of teachers in the low-poverty schools (8 percent versus 5 percent).
Percentage of Inexperienced Teachers and Attrition Rates of Teachers: Title I Schools, by School Poverty Level, 2000–01
Exhibit reads: In 2000–01, on average, 12 percent of the teachers in all Title I schools had less than three years’ teaching experience, compared with 17 percent of the teachers in the highest-poverty schools and 9 percent of the teachers in low-poverty schools.

Exhibit 5 Profile of Title I Schools, Students, and Teachers
Prevalence of Schoolwide Programs and Research-Based School Reform Models
SOURCE: NLSS Principal Survey, SY 1999–2000 and SY 2000–01.
In 2000–01, 85 percent of high-poverty Title I schools and 30 percent of other Title I schools (with less than 50 percent low-income students) operated schoolwide programs that allowed schools to use Title I funds for overall school improvement, and this difference was statistically significant. Many schools had adopted “research-based” reform models as a way of improving teaching, learning, and student achievement (although the degree to which all these models were based on research is open to question). High-poverty Title I schools were somewhat more likely to adopt a school reform model than were other schools, although the difference was not statistically significant. Although not shown in the exhibit, schools operating schoolwide programs or schools that had been identified as in need of improvement were more likely to adopt school reform models than were targeted assistance schools or schools that had not been identified (only the former difference was statistically significant). The percentage of Title I schools that reported adopting a research-based school reform model increased significantly between 1999–2000 and 2000–01, from 46 to 62 percent.
Percentage of Schools Adopting Schoolwide Programs and Research-Based School Reform Models: Title I Schools, by School Poverty Level, 2000–01
Exhibit reads: Fifty-nine percent of all Title I schools operated schoolwide Title I programs, as did 85 percent of the high-poverty schools and 30 percent of the medium- to low-poverty schools.

Exhibit 6 Student Outcomes
Student Readiness for the Next Grade and Promotion Rates
SOURCE: NLSS Principal Survey, SY 2000–01.
In 2000–01, principals in Title I schools reported that 19 percent of their students were not prepared to work at the next grade level, but only 5 percent of students were not promoted to the next grade. Students in the highest-poverty schools were significantly less likely to be prepared to do work at the next grade level. For example, on average, principals in the highest-poverty schools reported that 24 percent of students were not ready for the next grade, compared with 10 percent of students in the low-poverty schools. Despite this, only 8 percent of students in the highest-poverty schools and 3 percent in the low-poverty schools were retained in grade, and this difference was statistically significant.
Principal Reports About Percentage of Students Not Prepared to Work at the Next Grade Level and Percentage Not Promoted: Title I Schools, by School Poverty Level, 2000–01
Exhibit reads: Title I school principals reported that while 19 percent of their students were not prepared to work at the next grade level, only 5 percent of their students were not promoted to the next grade level.

Exhibit 7 Student Outcomes
Trends in Participation of Selected Student Subgroups in Annual State Assessments
NOTE: Questions were asked of principals who reported their school used the state or district assessment. Questions regarding participation of migrant students and students with limited English proficiency in the 1997–98 assessments were asked only of principals in schools with migrant students or more than 10 percent of students with limited English proficiency. The question was changed to include any students with limited English proficiency in the later year. For comparability, data shown for both years are for schools with more than 10 percent of students with limited English proficiency.
SOURCE: NLSS Principal Survey, SY 1998–99 and SY 2000–01.
Principals reported that over 90 percent of students participated in the 1997–98 and 1999–2000 state or district assessments. Participation of students with limited English proficiency increased from 80 percent to 83 percent between 1997-98 and 1999-2000, although the difference was not statistically significant. Participation of students with disabilities (i.e., those with individualized education plans or IEPs) increased significantly from 72 percent to 86 percent between 1997–98 and 1999–2000, as did the participation of migrant students, from 60 percent to 86 percent.
Percentage of All Students and Selected Student Subgroups Participating in State Assessments: Title I Schools, 1997–98 and 1999–2000
Exhibit reads: In 1997–98, 92 percent of all students participated in the state assessments and 93 percent participated in 1999–2000.

Exhibit 8 Student Outcomes
Reporting of Disaggregated Assessment Results
NOTE: Questions were asked of principals who reported their school used the state or district assessment. Questions regarding participation of migrant students and students with limited English proficiency in the 1997–98 assessments were asked only of principals in schools with migrant students or more than 10 percent of students with limited English proficiency. The question was changed to include any students with limited English proficiency in the subsequent years. For comparability, data shown for all years are for schools with more than 10 percent of students with limited English proficiency.
SOURCE: NLSS Principal Survey, SY 1998–99, SY 1999–2000, and SY 2000–01.
States and districts were required to disaggregate assessment results (once final assessments were in place by 2000–01) by various categories of students and to provide this information to schools to facilitate data-driven decisionmaking. There was some progress in providing such disaggregated data to Title I schools from 1998–99 to 2000–01, with most of the progress occurring between 1998–99 and 1999–2000. The percentage of schools receiving results summarized by disability status of students (i.e., students with and without IEPs), race-ethnicity, Title I participation, and poverty level increased significantly from 1998–99 to 2000–01. However, many principals reported not yet receiving disaggregated data. (It may also be that districts provided disaggregated data but principals either did not receive them or failed to remember receiving them). For example, in 2000–01, only 38 percent of schools received results summarized by student poverty level, 57 percent received results summarized by race-ethnicity, and 62 percent received results summarized by gender.
Percentage of Schools Receiving Assessment Results Summarized by Subgroups of Students: Title I Schools, 1998–99 to 2000–01
Exhibit reads: In 1998–99, 54 percent of Title I schools received state assessment results disaggregated by gender. In 1999–2000 and 2000–01, this had increased to 62 percent.
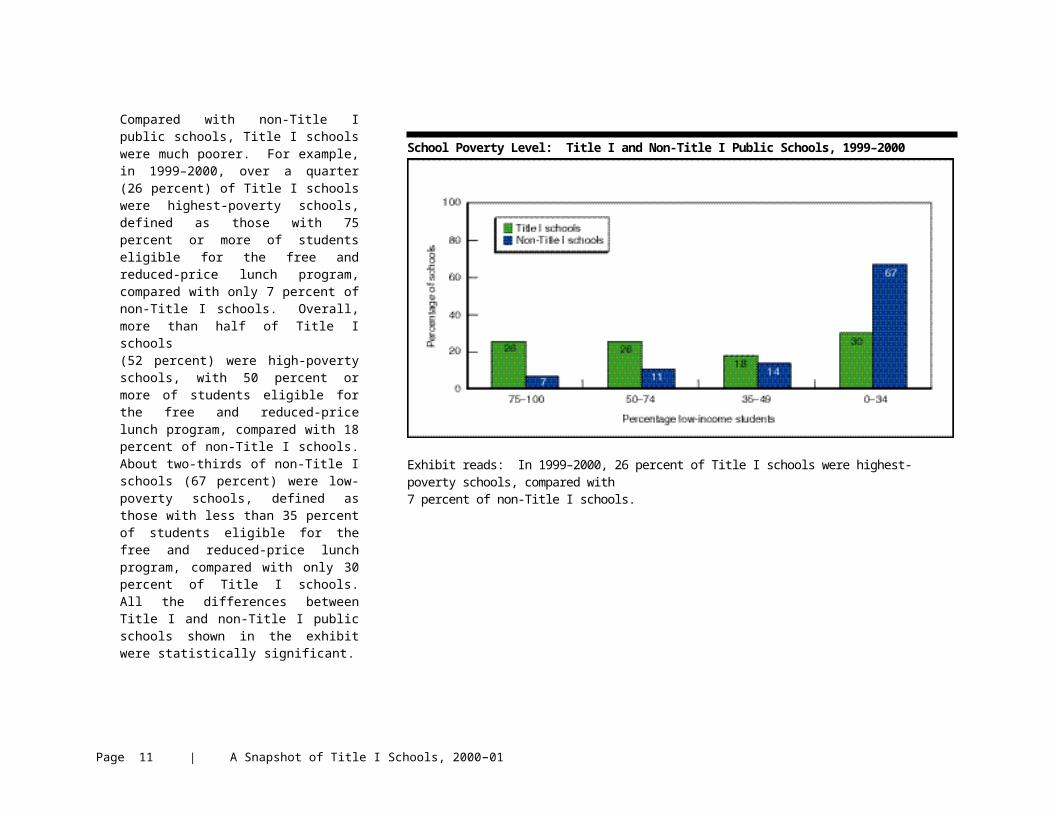
Exhibit 9 Student Outcomes
State Reports of Categories by Which They Disaggregate State Assessment Results
SOURCE: Consolidated State Performance Reports, 2001.

In 2000–01, of the 50 states, plus the District of Columbia and Puerto Rico (both of which are included in subsequent exhibits as “states”), a total of 37 states reported that they disaggregated state assessment results by whether schools were high-poverty or not. With respect to characteristics of students, over 40 states disaggregated state assessment results by race-ethnicity (44), limited English proficiency (43), and disability status of students (44). A somewhat smaller number (38) reported they disaggregated results by the migrant status of students, and only 30 states reported doing so by student poverty level. Half of the states reported information disaggregated by all the above categories. Three states (Arizona, Connecticut, Pennsylvania) did not report this information, one state (Hawaii) did not administer a state assessment in 2000–01, and two states (Iowa, Nebraska) did not have uniform, statewide assessments. (See Exhibit A.1 in the appendix for more details.)
Number of States Reporting Disaggregating State Assessment Results Summarized by Various Subgroups of Schools and Students: 2000–01
Exhibit reads: In 2000–01, 37 states disaggregated state assessment results by poverty status of the school.

Exhibit 10 Student Outcomes
Proficiency Levels of Low-Income and Other Students on the 2002 State NAEP, 4th Grade Reading
SOURCE: 2002 State NAEP.
The percentage of low-income students scoring at or above the proficient level on the 2002 4th grade reading state NAEP was much lower than the percentage of students who were not low-income who scored at this level. Among the 44 states for which data were available, the percentage of low-income students scoring at or above the proficient level ranged from 5 percent (District of Columbia) to 30 percent (Minnesota). In contrast, between 23 percent (District of Columbia) and 56 percent (Massachusetts) of students who were not low-income scored at or above the proficient level. There is little overlap between the two distributions. There was only one state in which the percentage of low-income students achieving at or above the proficient level reached 30 percent. In 40 out of 44 states, the percentage of students who were not low-income who reached proficiency level was 30 percent or higher, and in 22 states, the percentage was 40 percent or higher. (See Exhibit A.4 in the appendix for the detailed results by state.)
Number of States by Percentage of Low-Income and Other Students Scoring at or Above the Proficient Level on the 2002 State NAEP, 4th Grade Reading
Exhibit reads: In two states, the percentage of low-income 4th grade students scoring at or above the proficient level in reading on the 2002 State NAEP was less than 10 percent. There was no state in which the percentage of other (i.e., not low-income) students scoring at or above the proficient level was below 10 percent.

Exhibit 11 Student Outcomes
Gap in Proficiency Levels of Low-Income and Other Students on the 2002 State NAEP, 4th Grade Reading
NOTE: Gap = Proficiency levels of students who were not low-income minus proficiency levels of students who were low-income.
SOURCE: 2002 State NAEP.
The difference between the percentage of low-income students scoring at or above the proficient level on the 2002 4th grade reading state NAEP and the percentage of students who were not low-income scoring at this level was between 11 and 33 percentage points. Of the states for which data were available, two states reported differences of between 10 and 14 percentage points, 19 states reported differences of between 20 and 24 percentage points, and five states reported differences of 30 percentage points or higher. The smallest differences were in Minnesota and Nevada (11 and 14 percentage points respectively), and the largest difference was in Massachusetts, where 56 percent of students who were not low-income scored at or above the proficient level, compared with only 23 percent of students who were low-income. (See Exhibit A.4 in the appendix for the detailed results by state.)
Gap in the Percentage of Low-Income and Other Students Scoring at or Above the Proficient Level on the 2002 State NAEP, 4th Grade Reading
Exhibit reads: In two states, the difference between the percentage of low-income 4th grade students scoring at or above the proficient level in reading on the 2002 State NAEP and the percentage of students who were not low-income scoring at this level was between 10 and 14 percentage points.

Exhibit 12 Student Outcomes
Gap in Proficiency Levels in High- and Low-Poverty Schools on the 2001 State Assessments, 4th Grade Reading
NOTE: Gap = Proficiency levels of students in low-poverty schools minus proficiency levels of students in high-poverty schools.
SOURCE: Consolidated State Performance Reports, 2001.
Large differences existed in the relative performance of 4 th grade students from high- and low-poverty schools on the 2001 state reading assessments. In all states but two, students from low-poverty schools achieved higher scores than did students from high-poverty schools. For example, in 8 of the 32 states for which data were reported, the percentage of students from low-poverty schools that scored at or above the proficient level was 40–65 percentage points higher than the percentage of students from high-poverty schools who scored at this level. In 18 of the 32 states, the difference was 30 percentage points or higher. Virginia reported a small negative difference (–4 percentage points) and Louisiana reported no difference in the proficiency levels of students from low-poverty and high-poverty schools. The largest difference was reported in Indiana (65 percentage points). (See Exhibit A.6 in the appendix for the detailed results by state.)
Gap Between High- and Low-Poverty Schools in the Percentage of Students Scoring at or Above the Proficient Level on the 2001 State Assessments, 4th Grade Reading
Exhibit reads: In two states, the gap in the relative performance of 4th grade students from high- and low-poverty schools on the 2001 state reading assessments was less than 10 percentage points.
Exhibit 13 Student Outcomes
Proficiency Levels of Low-Income and Other Students on the 2000 State NAEP, 8th Grade Mathematics
SOURCE: 2000 State NAEP.
Similar to the 2002 results for 4th grade reading, the percentage of low-income students who scored at or above the proficient level in mathematics on the 2000 8 th grade state NAEP was lower across the states than the percentage of students not classified as low-income who scored at this level. Of the 38 states for which data were available, the percentage of low-income students scoring at or above the proficient level ranged from 2 percent (District of Columbia) to 27 percent (Minnesota). In contrast, between 14 percent (Mississippi) and 43 percent (Montana) of students who were not low-income scored at this level. In 19 out of 38 states, the percentage of students who were not low-income who achieved the proficiency level was 30 percent or higher. There was no state in which the percentage of low-income students achieving at or above the proficient level reached 30 percent. (See Exhibit A.5 in the appendix for the detailed results by state.)
Number of States by Percentage of Low-Income and Other Students Scoring at or Above the Proficient Level on the 2000 State NAEP, 8th Grade Mathematics
Exhibit reads: In 22 states, the percentage of low-income 8th grade students scoring at or above the proficient level in mathematics on the 2000 state NAEP was less than 10 percent. There were no states in which the percentage of other students scoring at or above the proficient level was less than 10 percent.

Exhibit 14 Student Outcomes
Gap in Proficiency Levels of Low-Income and Other Students on the 2000 State NAEP, 8th Grade Mathematics
NOTE: Gap = Proficiency levels of students who were not low-income minus proficiency levels of students who were low-income.
SOURCE: 2000 State NAEP.
The difference between the percentage of low-income students scoring at or above the proficient level on the 2000 8th grade mathematics state NAEP and the percentage of students who were not low-income scoring at this level was between 11 and 35 percentage points. The percentage of low-income students scoring at or above the proficient level was consistently lower than the percentage of students who were not low-income who scored at this level. Six states reported differences of 10–14 percentage points, while six states reported differences of 25–35 percentage points. The smallest differences were in Arkansas and Mississippi (11 percentage points), and the largest difference was in Connecticut, where 42 percent of students who were not low-income scored at or above the proficient level, compared with only 7 percent of students who were low-income. (See Exhibit A.5 in the appendix for the detailed results by state.)
Gap in the Percentage of Low-Income Students and Other Students Scoring at or Above the Proficient Level on the 2000 State NAEP, 8th Grade Mathematics
Exhibit reads: In six states, the difference between the percentage of low-income 8th grade students scoring at or above the proficient level in mathematics on the 2000 state NAEP and the percentage of students who were not low-income scoring at this level was between 10 and 14 percentage points.
Exhibit 15 Student Outcomes
Gap in Proficiency Levels in High- and Low-Poverty Schools on the 2001 State Assessments, 8th Grade Mathematics
NOTE: Gap = Proficiency levels of students in low-poverty schools minus proficiency levels of students in high-poverty schools.
SOURCE: Consolidated State Performance Reports, 2001.
Similar to what was shown earlier for 4th grade reading, there were fairly large differences in the relative performance of 8th grade students from high- and low-poverty schools on the 2001 state mathematics assessments. For example, in 11 of the 26 states for which data were reported, the difference between the percentage of students from high-poverty schools who scored at or above the proficient level and the percentage of students from low-poverty schools who scored at this level was 40–49 percentage points, with the largest difference being in Maryland. Only in five states was the difference less than 10 percentage points: Puerto Rico (–2), South Carolina (0), West Virginia (5), Alaska (8), and Texas (9). (See Exhibit A.6 in the appendix for the detailed results by state.)
Gap Between High- and Low-Poverty Schools in the Percentage of Students Scoring at or Above the Proficient Level on the 2001 State Assessments, 8th Grade Mathematics
Exhibit reads: In five states, the gap in the relative performance of 8th grade students from high- and low-poverty schools on the 2001 state mathematics assessments was less than 10 percentage points.

Exhibit 16 Student Outcomes
Student Proficiency Levels on the 2002 State NAEP and 2001 State Assessments, 4th Grade Reading
SOURCE: 2002 State NAEP and Consolidated State Performance Reports, 2001.

The distributions of proficiency levels of 4 th
grade students in reading from the 2002 State NAEP and the 2001 state assessments are very different, with little overlap. The NAEP reports show that, among the 44 states for which data were available, the highest percentage of students scoring at or above the proficient level was 47 percent (Massachusetts) and the lowest was 10 percent (District of Columbia). According to the state assessments, the highest score was 91 percent (Texas) and the lowest was 23 percent (Rhode Island). In fact, 28 states reported that 50 percent or more of their students scored at or above the proficient level on their state assessments while, according to the NAEP, in no state did the percentage of students scoring at this level reach 50 percent. (See Exhibit A.2 in the appendix for the detailed results by state.)
Number of States by Percentage of Students Scoring at or Above the Proficient Level on the 2002 State NAEP and 2001 State Assessments, 4th Grade Reading
Exhibit reads: In two states 10 and 19 percent of their students achieved at or above the proficient level on the 2002 State NAEP for 4th grade reading. There were no states in which less than 20 percent of 4th grade students achieved at or above the proficient level on the 2001 state assessments.

Exhibit 17 Student Outcomes
Differences in Student Proficiency Levels on the 2002 State NAEP and 2001 State Assessments, 4th Grade Reading
NOTE: Difference = Proficiency levels of students on 2001 state assessments minus proficiency levels of students on 2002 State NAEP.
SOURCE: 2002 State NAEP and Consolidated State Performance Reports, 2001.
Within-state comparisons of the percentage of students at or above proficient level on 4 th grade reading on the state assessments and the state NAEP show large differences. The percentage point differences within states ranged from a low of –9 percentage points to a high of 65 percentage points. Rhode Island scored higher on the state NAEP than on its own state assessment. In two states, Mississippi and Texas, the difference exceeded 60 percentage points. For example, Mississippi reported that 81 percent of students scored at or above the proficient level on the state assessment on 4th grade reading, compared with only 16 percent of students who scored at or above this level on the state NAEP. The comparable numbers for Texas were 91 percent and 28 percent respectively. Of the 30 states for which data were available, 10 states had a difference of 40 percentage points or higher, and 21 states had a difference of 20 percentage points or higher. (See Exhibit A.2 in the appendix for the detailed results by state.)
Number of States by Difference Between Percentages of Students Scoring at or Above the Proficient Level on the 2001 State Assessments and 2002 State NAEP, 4th Grade Reading
Exhibit reads: In one state, the within-state percentage point difference between the percentages of 4th grade students scoring at or above the proficient level in reading on the 2001 state assessments and 2002 State NAEP was less than zero.

Exhibit 18 Student Outcomes
Student Proficiency Levels on the 2000 State NAEP and 2001 State Assessments, 8th Grade Mathematics
SOURCE: 2000 State NAEP and Consolidated State Performance Reports, 2001.

As seen earlier with respect to 4th grade reading results comparing the 2002 NAEP and 2001 state assessments, there was considerable difference between the distributions of proficiency levels of 8 th
grade students in mathematics from the 2000 state NAEP and the 2001 state assessments. Of the 38 states participating in the state NAEP, the highest percentage of students scoring at or above the proficient level was 40 percent (Minnesota) and the lowest was 6 percent (District of Columbia). According to the state assessments, the highest percentage was 93 percent (Texas) and the lowest was 11 percent (District of Columbia). Eighteen states reported that 50 percent or more of their students scored at or above the proficient level in 8th grade mathematics on their state assessment, while according to the NAEP, in no state did the percentage of students scoring at or above the proficient level reach 50 percent. All but two states scored lower on the 2000 state NAEP than on the 2001 state assessments. (See Exhibit A.3 in the appendix for the detailed results by state.)
Number of States by Percentage of Students Scoring at or Above the Proficient Level on the 2000 State NAEP and 2001 State Assessments, 8th Grade Mathematics
Exhibit reads: In two states, less than 10 percent of students scored at or above the proficient level on the 2000 state NAEP for 8th grade mathematics. There was no state in which the percentage of 8th grade students scoring at or above the proficient level in mathematics on the 2001 state assessments was less than 10 percent.

Exhibit 19 Student Outcomes
Differences in Student Proficiency Levels on the 2000 State NAEP and 2001 State Assessments, 8th Grade Mathematics
NOTE: Difference = Proficiency levels of students on 2001 state assessments minus proficiency levels of students on 2000 state NAEP.
SOURCE: 2000 State NAEP and Consolidated State Performance Reports, 2001.
The differences between the percentage of students scoring at or above the proficient level on 8th grade mathematics reported on the 2001 state assessments and the 2000 state NAEP ranged from a low of –12 percentage points to a high of 69 percentage points. Two states, Maine and Utah, reported a higher percentage of students scoring at or above the proficient level on the state NAEP than on their own state assessments. The largest difference was in Texas, where 93 percent of students scored at or above the proficient level on the state assessment, compared with only 24 percent of students who scored at or above this level on the state NAEP. For the 21 states for which data were available, six states had a difference of 40 percentage points or higher and 15 states had a difference of 20 percentage points or higher. (See Exhibit A.3 in the appendix for the detailed results by state.)
Number of States by Difference Between Percentage of Students Scoring at or Above the Proficient Level on the 2001 State Assessments and 2000 State NAEP, 8th Grade Mathematics
Exhibit reads: In two states, the within-state percentage point difference between the percentages of 8th grade students scoring at or above the proficient level in mathematics on the 2001 state assessments and the 2000 state NAEP was less than zero.

Exhibit 20 Coordination of Funds
Coordination of Title I Funds with Other Sources of Funds
SOURCE: NLSS Principal Survey, SY 2000–01.
When principals were asked about the challenges they faced in coordinating federal resources with other school funds, almost two-thirds of them (66 percent) responded that district control over the use of funds was a challenge, and 53 percent reported state control over the use of funds as a problem. About 45 percent of principals reported that they were unsure about what funds could be combined, creating a challenge in coordinating different sources of funding.
Percentage of Principals Reporting Various Challenges in Coordinating Title I Funds with Other Sources of Funding: Title I Schools, 2000–01
Exhibit reads: In 2000–01, 66 percent of principals in Title I schools reported that district control over the use of funds was a challenge in coordinating Title I funds with other sources of funds.

Exhibit 21 Provision of Extended Learning Time Programs
Prevalence of Extended Learning Time Programs
SOURCE: NLSS Principal Survey, SY 1998–99 and SY 2000–01.

In 2000–01, the majority of Title I schools offered before- or after-school instructional programs (69 percent) or summer or intersession programs (68 percent). Relatively few schools offered an extended school-year program (21 percent), weekend program (8 percent), or year-round program (5 percent). There was a significant 17 percentage point increase in the number of schools offering before- or after-school programs between 1998–99 and 2000–01.
The percentage of principals reporting that they funded the programs through Title I varied a great deal across the programs. Between 25 and 29 percent of Title I schools used Title I funds for before- or after-school instructional programs or summer or intersession programs while only 2–6 percent of schools used Title I funds for year-round programs or weekend programs. The percentage of schools using Title I funds for summer or intersession programs, extended school-year programs, or year-round programs decreased significantly between 1998–99 and 2000–01.
Percentage of Schools Offering Extended Learning Time Programs and Funding Them Through Title I:Title I Schools, 2000–01
Exhibit reads: Sixty-nine percent of Title I schools offered before- or after-school instructional programs, and 29 percent of Title I schools funded these programs through Title I funds.

Exhibit 22 Provision of Additional Instructional Services
Settings in Which Additional Instructional Services Were Provided
NOTE: Questions were asked of regular classroom teachers who reported having students who received additional instructional services. Data shown are as a percentage of all elementary teachers.
Although the exhibit refers to “additional instructional services,” students receiving these services, particularly in pullout settings, may be missing part of their regular instruction.
SOURCE: NLSS Teacher Survey, SY 2000–01.
Almost 90 percent of teachers in Title I elementary schools reported that their students received additional instructional services in mathematics or reading. These instructional services were significantly more likely to be provided either in a pullout setting or through extended learning time, such as a before- or after-school instructional program, in schoolwide schools than in targeted assistance schools. For example, about 72 percent of the teachers in elementary schoolwide schools reported that additional instructional services were provided in a pullout setting compared with 56 percent of teachers in targeted assistance schools. Similarly, 50 percent of teachers in schoolwide schools reported that instructional services were provided through extended learning time programs compared with 25 percent of teachers in targeted assistance schools. About 38 percent of teachers in schoolwide schools and 27 percent of teachers in targeted assistance schools reported that services were provided in both pullout and in-class settings (not shown). This difference was statistically significant, as was the difference in the percentage of teachers reporting that services were provided in all three settings (24 percent versus 13 percent).
Percentage of Elementary Teachers Reporting That Additional Instructional Services Were Provided in Class, in Pullout Settings, or Through Extended Learning Time Programs: Title I Elementary Schools, by Title I Type, 2000–01
Exhibit reads: Forty-seven percent of teachers in Title I schools operating schoolwide programs and 40 percent in Title I schools operating targeted assistance programs reported that additional instructional services were provided in class.

Exhibit 23 Provision of Additional Instructional Services
Use of Teacher Aides to Provide Additional Instructional Services
NOTE: Questions regarding the use of teacher aides were asked only about Title I-funded teacher aides. Data shown are as a percentage of all Title I elementary principals.
Questions about services for students with limited English proficiency offered in English and the student’s native language were only asked of principals in schools with more than 10 percent of students with limited English proficiency.
Although the exhibit refers to “additional instructional services,” students receiving these services, particularly in pullout settings, may be missing part of their regular instruction.
SOURCE: NLSS Principal Survey, SY 2000–01.
Over 90 percent of elementary principals reported that their school used teacher aides. Although not shown, highest-poverty schools were significantly more likely than low-poverty schools to fund teacher aides through Title I. There was little difference in the use of teacher aides to provide additional instructional services between schoolwide and targeted assistance schools at the elementary level, with 47 percent of schools using teacher aides to provide instruction in reading and 30–31 percent using aides to provide instruction in mathematics. Among elementary schoolwide schools with more than 10 percent of students with limited English proficiency, schoolwide schools were somewhat more likely to use teacher aides to provide services designed to teach English to these students and to provide services taught in the student’s native language, compared with targeted assistance schools. However, the differences were not statistically significant.
Percentage of Principals Reporting That Teacher Aides Were Used to Provide Additional Instructional Services: Title I Elementary Schools, by Title I Type, 2000–01
Exhibit reads: Forty-seven percent of elementary school principals in both schoolwide schools and targeted assistance schools reported that their school used teacher aides to provide additional instructional services in reading.

Exhibit 24 Parent Involvement in Schools
Level of Parent Involvement in Schools
SOURCE: NLSS Teacher Survey, SY 2000–01.
Teachers were asked about the percentage of parents who attended parent-teacher conferences, volunteered in classrooms, and signed their students’ homework assignments. Teachers in low-poverty elementary schools reported a significantly higher level of parent involvement with the school than did teachers in the highest-poverty elementary schools. For example, teachers in the low-poverty schools estimated that about 88 percent of parents attended parent-teacher conferences, compared with the 63 percent reported by teachers in the highest-poverty schools. Smaller, but still significant, differences existed on the other two indicators of parent involvement: volunteering in classrooms and signing homework assignments.
Teacher Reports About Percentage of Parents Participating in Various Activities: Title I Elementary Schools, by School Poverty Level, 2000–01
Exhibit reads: Teachers in Title I highest-poverty elementary schools reported that 63 percent of parents attended parent-teacher conferences, compared with the 88 percent reported by teachers in Title I low-poverty elementary schools.

Exhibit 25 Parent Involvement in Schools
Strategies to Increase Parent Involvement in Student Learning
SOURCE: NLSS Principal Survey, SY 2000–01.
Title I schools had adopted a number of strategies to increase parent involvement in student learning. Over half (between 55 and 57 percent) of Title I schools offered training for parents and had parent liaisons to improve communication between school and home, while 32 percent offered family literacy programs. The highest-poverty schools were significantly more likely to have parent liaisons and offer training and family literacy programs than were the low-poverty schools, at both the elementary and secondary levels. For example, among the highest-poverty schools, 69 percent of elementary schools and 93 percent of secondary schools had parent liaisons, compared with only 41 and 51 percent of the low-poverty schools, respectively. Very few low-poverty schools offered family literacy programs.
Percentage of Schools with Parent Liaisons, Training for Parents, and Family Literacy Programs: Title I Schools, by School Level and School Poverty Level, 2000–01
Exhibit reads: Sixty-nine percent of Title I highest-poverty elementary schools had parent liaisons, compared with 41 percent of Title I low-poverty elementary schools.

Exhibit 26 Professional Development
Focus of Teacher Professional Development
NOTE: Questions about teaching students with limited English proficiency were only asked of principals in schools with more than 10 percent of students with limited English proficiency.
SOURCE: NLSS Principal Survey, SY 2000–01.
Principals were asked the extent to which professional development for teachers focused on various topics. Well over half the principals reported that professional development was focused “to a great extent” on content and performance standards (60 percent), assessments (55 percent), or curriculum and instruction specific to reading, language arts, or English (54 percent). About 42 percent reported curriculum and instruction specific to mathematics as being a primary focus. Smaller percentages reported that professional development focused on teaching students of varying academic abilities (34 percent) and integrating technology into classroom instruction (28 percent). Although not shown in the exhibit, about 41 percent of principals of schools with more than 10 percent of students with limited English proficiency reported that professional development in their school focused on teaching these students.
Percentage of Principals Reporting that Teacher Professional Development Was Focused “To a Great Extent” on Various Topics: Title I Schools, 2000–01
Exhibit reads: Sixty percent of principals in Title I schools reported that teacher professional development was focused “to a great extent” on content and performance standards.

Exhibit 27 Professional Development
Duration of Teacher Professional Development Activities and Relationship to Teaching Practices
CAVEAT: The analyses reported here rely on respondents’ self-reports and may reflect socially desirable responses. The findings focus on comparisons among variables of interest and are not meant to suggest causality.
SOURCE: NLSS Teacher Survey, SY 2000–01.
Teachers reported greater improvement in teaching practices from professional development activities that were ongoing and frequent than activities that were of a short duration. For example, of the teachers who reported engaging in common planning time “a few times a year,” approximately 13 percent reported that it improved their teaching practice “to a great extent.” This figure compares with 31 percent of teachers who engaged in the activity “once a month,” 45 percent of those who engaged in the activity “2–3 times a month,” and 68 percent of those who engaged in the activity “once a week.” All these differences were significant, and the same trend holds for mentoring and networking activities.
Percentage of Teachers Reporting That Participation in Various Activities Changed Their Teaching Practice “To a Great Extent:” Title I Schools, 2000–01
Exhibit reads: Thirteen percent of teachers in Title I schools who participated in common planning time ”a few times a year” reported that it changed their teaching practices “to a great extent,” compared with 31 percent of teachers who participated “once a month,” 45 percent of teachers who participated “2-3 times a month,” and 68 percent of teachers who participated “once a week.”

Exhibit 28 Professional Development
Relationship Between Professional Development and Teacher Preparedness
CAVEAT: The analyses reported here rely on respondents’ self-reports and may reflect socially desirable responses. The findings focus on comparisons among variables of interest and are not meant to suggest causality.
NOTE: Questions were asked only of teachers who reported receiving professional development in the past 12 months. Questions regarding content standards were asked of teachers who taught the specific subject and were familiar with content standards.
SOURCE: NLSS Teacher Survey, SY 2000–01.
Teachers who received professional development in a given area in the past 12 months were significantly more likely to report feeling prepared “to a great extent” to teach or address that area than were teachers who had not participated in such activity. For example, close to 70 percent of teachers who had received professional development in how to teach to content standards in reading or mathematics reported being very well prepared to do so, compared with 49 and 56 percent of teachers who had not received such professional development. (Note that we do not know whether these teachers had received such professional development in prior years.) The difference with respect to the level of preparedness to use student performance assessment techniques was even larger between teachers who had received this kind of professional development and those who had not (54 percent versus 31 percent).
Percentage of Teachers Reporting They Felt Prepared “To a Great Extent” to Address a Given Area: Title I Schools, 2000–01
Exhibit reads: Eighty-six percent of teachers in Title I schools who received professional development in their main subject assignment in the past 12 months reported feeling prepared “to a great extent” to teach that area, compared with 72 percent of teachers who did not receive such professional development.

Exhibit 29 Professional Development
Professional Development Opportunities for Teacher Aides
SOURCE: NLSS Principal Survey, SY 2000–01.
In 2000–01, 88 percent of the principals in schools with teacher aides reported that teacher aides were included in professional development activities. Overall, about 31 percent of principals in schools that had teacher aides and included them in professional development activities reported that their district provided career ladders for teacher aides or offered funding or release time for aides to take higher education courses. About 21 percent reported that their school districts offered release time for the teacher aides to take a class or study for their high school or General Educational Development (GED) diploma, while 12 percent offered funding for high school diploma or GED classes. There were no statistically significant differences among principal reports by the poverty level of the school.
Percentage of Principals Reporting That Their School District Offered Various Professional Development Opportunities for Teacher Aides: Title I Schools, 2000–01
Exhibit reads: About 31 percent of principals in schools that had teacher aides and included them in professional development activities reported that their district provided career ladders for teacher aides.

Exhibit 30 Instructional Leadership
Teachers’ Ratings of Principals as Instructional Leaders
SOURCE: NLSS Teacher Survey, SY 2000–01.
Teachers in Title I highest-poverty elementary schools gave significantly higher marks to their principals as instructional leaders, compared with teachers in Title I low-poverty schools. About 64 percent of teachers in the highest-poverty schools reported that their principal encouraged professional collaboration among teachers, compared with 53 percent of teachers in low-poverty schools. Over half of these teachers reported that principals discussed content standards and student evaluation results with them and arranged school staff and time to allow teachers to focus on classroom instruction, compared with 30–40 percent of teachers in low-poverty schools. All these differences in teacher reports between the highest-poverty and low-poverty schools were statistically significant.
Percentage of Elementary Teachers Reporting That Their Principal Performed a Given Task “To a Great Extent:” Title I Elementary Schools, by School Poverty Level, 2000–01
Exhibit reads: Fifty-four percent of teachers in Title I highest-poverty elementary schools reported that their principal discussed content standards with teachers, compared with 39 percent of teachers in low-poverty elementary schools.

Exhibit 31 School Accountability Under Title I
Percentage of Title I Schools Identified as In Need of Improvement Under Title I, State Reports
SOURCE: U.S. Department of Education, State Reports, SY 1998–99 and SY 2000–01.

In 2000–01, most states identified fewer than 20 percent of their schools as in need of improvement under Title I. Fifteen states identified between 10 and 19 percent of their schools, and 22 states identified less than 10 percent of their schools as in need of improvement. The number of states identifying 40 percent or more of their schools declined, from eight states in 1998–99 to three states in 2000–01. The states identifying the largest percentages of schools in 2000–01 were Michigan (75 percent) and Hawaii (69 percent). Two states (Florida and Wyoming) reported identifying no schools as needing improvement, and one state (New Jersey) did not report any information on this item. (See Exhibit A.7 in the appendix for more details.)
Number of States by Percentage of Title I Schools Identified as In Need of Improvement Under Title I, 1998–99 and 2000–01
Exhibit reads: In 1998–99, one state had no schools identified as in need of improvement under Title I.

Exhibit 32 School Accountability Under Title I
Principal Knowledge About the School Improvement Process
SOURCE: NLSS Principal Survey and District Screener, SY 2000–01.

In 2000–01, about 17 percent of Title I schools were identified by the district as in need of improvement. However, many principals were confused about the school identification and improvement process. For example, among these schools, only 54 percent of principals agreed with the district that their school had been identified as in need of improvement under Title I. In addition, even in schools where the principal agreed with the district identification, about two in five principals (43 percent) reported they were unfamiliar with state measures of adequate yearly progress (not shown).
Percentage of Principals Reporting They Agreed with, Disagreed With, or Did Not Know About the District Identification of Their School as In Need of Improvement Under Title I: Title I Schools Identified by the District as In Need of Improvement Under Title I, 2000–01
Exhibit reads: Fifty-four percent of principals agreed with the district that their school had been identified as in need of improvement under Title I.

Exhibit 33 School Accountability Under Title I
Poverty and Minority Status of Schools Identified as In Need of Improvement Under Title I and All Title I Schools
NOTE: Data for schools identified as in need of improvement include only schools where the principal agreed with the district identification. See Exhibit 32 for data on level of agreement between principals and districts regarding identification.
SOURCE: NLSS Principal Survey, SY 2000–01 and Schools and Staffing Survey, SY 1999–2000.
Compared with all Title I schools, schools identified as in need of improvement under Title I (where the principal and district agreed regarding the identification) were disproportionately poor schools serving minority students. For example, about 80 percent of Title I schools identified as in need of improvement were high-poverty schools and 44 percent were in the highest-poverty category, compared with 52 percent and 26 percent respectively of all Title I schools. Sixty-eight percent of Title I schools identified for improvement were high-minority schools and 59 percent were in the highest-minority category, compared with 19 percent and 10 percent respectively of all Title I schools. Over one-third of the Title I schools identified as in need of improvement were both highest-poverty and highest-minority schools.
Distribution of Schools by School Poverty Level and Percentage of Minority Students: Schools Identified as In Need of Improvement Under Title I and All Title I Schools, 2000–01
Exhibit reads: Forty-four percent of Title I schools identified as in need of improvement under Title I were highest-poverty schools compared with 26 percent of all Title I schools.
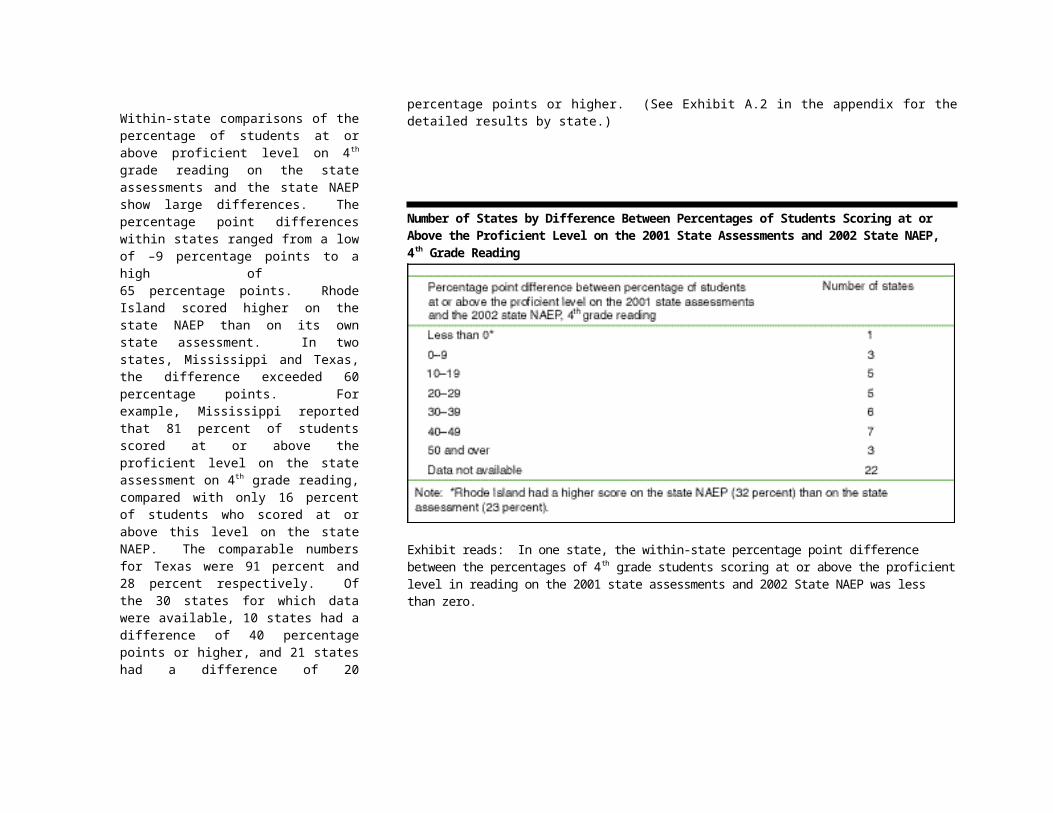
Exhibit 34 School Accountability Under Title I
Provision of Technical Assistance
NOTE: Data for schools identified as in need of improvement include only schools where the principal agreed with the district identification. See Exhibit 32 for data on level of agreement between principals and districts regarding identification.
SOURCE: NLSS Principal Survey, SY 2000–01.
Principals were asked how long their school had been identified as needing improvement, whether they had received additional technical assistance or professional development as required by law, and if so, from whom. In 2000–01, only half of the principals in schools in need of improvement had received additional technical assistance or professional development. Data reported by the principals showed that districts seemed to be focusing their attention on the most recently identified schools and schools that had been identified for four or more years. For example, over 60 percent of these schools had received additional assistance, compared with only one-fourth to one-third of schools that had been identified for two or three years.
Schools received assistance from a variety of sources. About 40 percent of schools identified as in need of improvement had received assistance from the district; about 18 percent from the state; a little over one-third from an intermediate or regional education agency; and about a quarter had received assistance from school support teams (not shown).
Percentage of Schools That Received Additional Technical Assistance: Title I Schools Identified as In Need of Improvement under Title I, by Number of Years the School Had Been Identified for Improvement, 2000–01
Exhibit reads: Seventy-two percent of schools that had been identified as in need of improvement for one year had received technical assistance from the district.

Exhibit 35 School Accountability Under Title I
Additional Strategies Adopted by Schools as a Result of Being Identified for Improvement
NOTE: Data for schools identified as in need of improvement include only schools where the principal agreed with the district identification. See Exhibit 32 for data on level of agreement between principals and districts regarding identification.
SOURCE: NLSS Principal Survey, SY 2000–01.
Schools that had been identified as in need of improvement adopted a number of additional strategies to help them improve. About 67 percent of schools in need of improvement had adopted strategies that included increasing family and community involvement, revising or developing a school plan, or placing greater emphasis on test-taking skills. About 64 percent had made changes to the curriculum. About 46 percent had sought assistance from outside the district, and schools that had been identified for one year or four or more years were most likely to do so. About 44 percent offered increased professional development for teachers.
Percentage of Schools That Adopted Various Additional Strategies as a Result of Being Identified for Improvement: Title I Schools Identified as In Need of Improvement under Title I, 2000–01
Exhibit reads: Sixty-seven percent of schools that had been identified as in need of improvement had adopted strategies to increase family and community involvement in order to help the school improve.

Exhibit 36 School Accountability Under Title I
Additional Steps and Corrective Actions Taken by Districts with Schools as a Result of Their Being Identified for Improvement
NOTE: Data for schools identified as in need of improvement include only schools where the principal agreed with the district identification. See Exhibit 32 for data on level of agreement between principals and districts regarding identification.
SOURCE: NLSS Principal Survey, SY 2000–01.
Under the 1994 legislation, if schools identified for improvement failed to show progress, states and districts could take additional steps or corrective actions. The most frequently adopted strategies were requiring schools to adopt comprehensive school reform models (40 percent) and arranging to provide social support services from other public agencies (23 percent). Authorization of transfers of students to other public schools and decreased decisionmaking authority were reported by about 6 percent of principals in schools identified for improvement. The majority of principals in schools that had been identified for one year reported that they had been required to adopt a comprehensive school reform model.
Percentage of Schools Subjected to Additional Steps or Corrective Actions by the District: Title I Schools Identified as In Need of Improvement under Title I, 2000–01
Exhibit reads: Forty percent of schools identified as in need of improvement were required to adopt a comprehensive school reform model.

APPENDIX
Page 51 | A Snapshot of Title I Schools, 2000–01
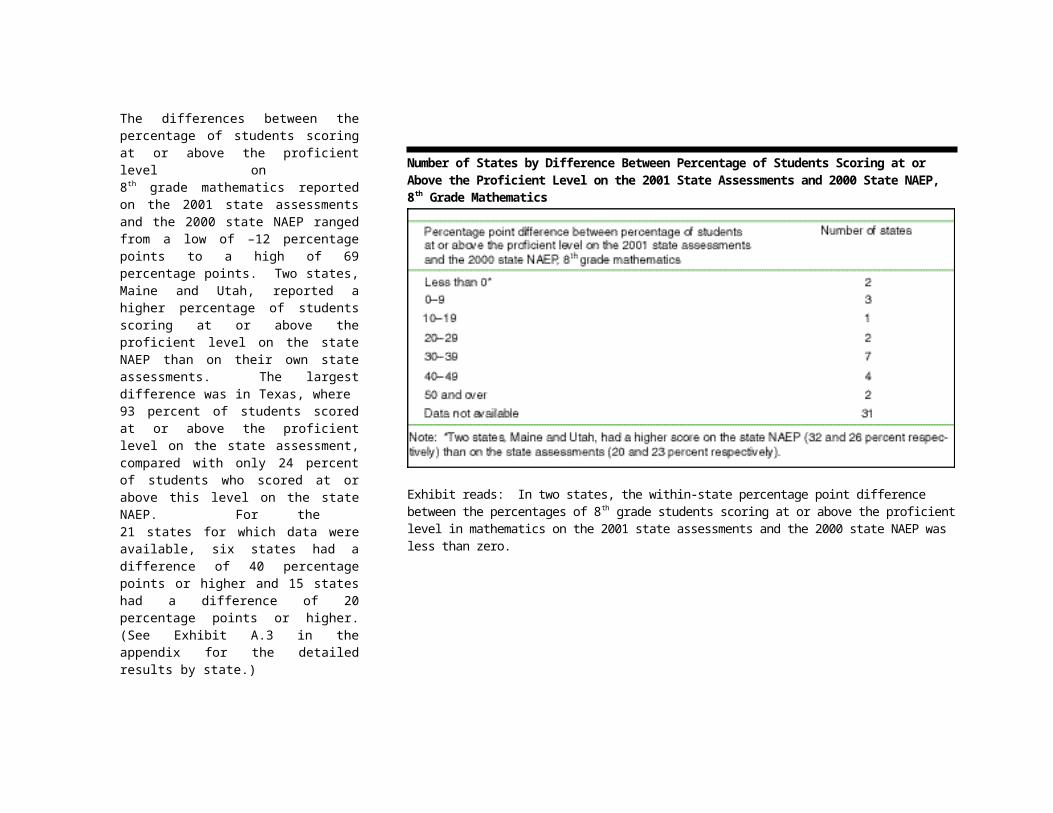
Exhibit A.1. Categories by Which State Assessment Results Are Disaggregated, 2000–01
State
Disaggregated by:High-poverty
schoolsRace-ethnicity
of studentsLimited English
proficiency of studentsMigrant status
of studentsDisability status
of studentsEconomically
disadvantaged studentsAlabama X X X X XAlaska X X X X X XArizona X X X XArkansas Not reportedCalifornia X X X X X XColorado X X X XConnecticut Not reportedDelaware X X X X X XDistrict of Columbia X X X X X XFlorida X X X X X XGeorgia X X X X X XHawaii Assessments not administered 2000–01Idaho X X X X X XIllinois X X X X X XIndiana XIowa NoneKansas X X X X X XKentucky X X X X X XLouisiana X X X X XMaine X X X X XMaryland X X X X XMassachusetts X X X X
Page 52 | A Snapshot of Title I Schools, 2000–01

Exhibit A.1. Categories by Which State Assessment Results Are Disaggregated, 2000–01 (cont.)
State
Disaggregated by:High-poverty
schoolsRace-ethnicity
of studentsLimited English
proficiency of studentsMigrant status
of studentsDisability status
of studentsEconomically
disadvantaged studentsMichigan X X X X X XMinnesota X X X X X XMississippi X X X XMissouri X X X X XMontana X X X X XNebraska NoneNevada X X X X X XNew Hampshire X X X X X XNew Jersey X X X X XNew Mexico X X X XNew YorkNorth Carolina X X X X X XNorth Dakota X X XOhio X X X X XOklahoma X X X X X XOregon X X X X XPennsylvania Not reportedPuerto Rico X X X X X XRhode Island X X X X X XSouth Carolina X X X X X X
Page 53 | A Snapshot of Title I Schools, 2000–01

Exhibit A.1. Categories by Which State Assessment Results Are Disaggregated, 2000-01 (cont.)
State
Disaggregated by:High poverty
schoolsRace-ethnicity
of studentsLimited English
proficiency of studentsMigrant status
of studentsDisability status
of studentsEconomically
disadvantaged studentsSouth Dakota X X X XTennessee X X X X X XTexas X X X X X XUtah X X X X X XVermont X X X X X XVirginia X X X X X XWashington X X X XWest Virginia X X X X XWisconsin X X X XWyoming X X X X X X
Totals 37 44 43 38 44 30
SOURCE: Consolidated State Performance Reports, SY 2000–01.
Page 54 | A Snapshot of Title I Schools, 2000–01

Exhibit A.2. Percentage of Students Scoring at or Above the Proficient Level on the 2002 State NAEP and 2001 State Assessments, 4th Grade Reading
2002 State NAEP 2001 State Assessment
Percentage Point Difference(2001 State Assessment —
2002 State NAEP)Alabama 22 64 42Alaska NA 78 NAArizona 22 NA NAArkansas 26 NA NACalifornia 21 33 12Colorado NA 63 NAConnecticut 43 NA NADistrict of Columbia 10 29 19Delaware 35 75 40Florida 27 61 34Georgia 28 74 46Hawaii 21 NA NAIdaho 32 NA NAIllinois NA 62 NAIndiana 33 NA NAIowa 35 68 33Kansas 34 63 29Kentucky 30 58 28Louisiana 20 NA NAMaine 35 51 16Maryland 30 38 8Massachusetts 47 51 4
Page 55 | A Snapshot of Title I Schools, 2000–01

Exhibit A.2. Percentage of Students Scoring at or Above the Proficient Level on the 2002 State NAEP and 2001 State Assessments, 4th Grade Reading (cont.)
2002 State NAEP 2001 State Assessment
Percentage Point Difference(2001 State Assessment —
2002 State NAEP)Michigan 30 60 30Minnesota 37 49 12Mississippi 16 81 65Missouri 32 NA NAMontana 36 79 43Nebraska 34 70 36Nevada 21 48 27New Hampshire NA 38 NANew Jersey NA 79 NANew Mexico 21 56 35New York 35 NA NANorth Carolina 32 75 43North Dakota 34 75 41Ohio 34 56 22Oklahoma 26 66 40Oregon 31 84 53Pennsylvania 34 NA NAPuerto Rico NA 39 NARhode Island 32 23 –9South Carolina 26 NA NA
Page 56 | A Snapshot of Title I Schools, 2000–01

Exhibit A.2. Percentage of Students Scoring at or Above the Proficient Level on the 2002 State NAEP and 2001 State Assessments, 4th Grade Reading (cont.)
2002 State NAEP 2001 State Assessment
Percentage Point Difference(2001 State Assessment —
2002 State NAEP)South Dakota NA 63 NATennessee 25 NA NATexas 28 91 63Utah 33 48 15Vermont 39 NA NAVirginia 37 45 8Washington 35 66 31West Virginia 28 56 28Wisconsin NA 79 NAWyoming 31 NA NASOURCE: 2002 State NAEP and Consolidated State Performance Reports, 2001.
Page 57 | A Snapshot of Title I Schools, 2000–01

Exhibit A.3. Percentage of Students Scoring at or Above the Proficient Level on the 2000 State NAEP and 2001 State Assessments, 8th Grade Mathematics
2000 State NAEP 2001 State Assessments
Percentage Point Difference(2001 State Assessment —
2000 State NAEP)Alabama 16 66 50Alaska NA 73 NAArizona 21 NA NAArkansas 14 NA NACalifornia 18 49 31Colorado NA 37 NAConnecticut 34 NA NADistrict of Columbia 6 11 5Delaware NA 43 NAFlorida NA 63 NAGeorgia 19 NA NAHawaii 16 NA NAIdaho 27 NA NAIllinois NA 50 NAIndiana 31 NA NAIowa NA 74 NAKansas 34 65 31Kentucky 21 28 7Louisiana 12 NA NAMaine 32 20 –12Maryland 29 49 20Massachusetts 32 34 2
Page 58 | A Snapshot of Title I Schools, 2000–01

Exhibit A.3. Percentage of Students Scoring at or Above the Proficient Level on the 2000 State NAEP and 2001 State Assessments, 8th Grade Mathematics (cont.)
2000 State NAEP 2001 State Assessment
Percentage Point Difference(2001 State Assessment —
2000 State NAEP)Michigan 28 NA NAMinnesota 40 NA NAMississippi 8 39 31Missouri 22 NA NAMontana 37 68 31Nebraska 31 67 36Nevada 20 52 32New Hampshire NA 26 NANew Jersey NA 61 NANew Mexico 13 24 11New York 26 NA NANorth Carolina 30 79 49North Dakota 31 75 44Ohio 31 61 30Oklahoma 19 63 44Oregon 32 55 23Pennsylvania NA NA NAPuerto Rico NA 60 NARhode Island 24 NA NASouth Carolina 18 NA NA
Page 59 | A Snapshot of Title I Schools, 2000–01

Exhibit A.3. Percentage of Students Scoring at or Above the Proficient Level on the 2000 State NAEP and 2001 State Assessments, 8th Grade Mathematics (cont.)
2000 State NAEP 2001 State Assessment
Percentage Point Difference(2001 State Assessment —
2000 State NAEP)South Dakota NA 32 NATennessee 17 NA NATexas 24 93 69Utah 26 23 –3Vermont NA NA NAVirginia 26 NA NAWashington NA 27 NAWest Virginia 18 58 40Wisconsin NA 41 NAWyoming 25 NA NASOURCE: 2000 State NAEP and Consolidated State Performance Reports, 2001.
Page 60 | A Snapshot of Title I Schools, 2000–01

Exhibit A.4. Percentage of Students Scoring at or Above the Proficient Level on the 2002 State NAEP, 4th Grade Reading, Categorized by Eligibility for the Free and Reduced-Price Lunch Program
Eligible for the Free and Reduced-Price Lunch Program
Not Eligible for the Free and Reduced-Price Lunch Program
Percentage Point Difference
(Not Eligible — Eligible)
Nation 16 41 25
Alabama 13 35 22
Alaska NA NA NA
Arizona 11 32 21
Arkansas 17 38 21
California 9 37 28
Colorado NA NA NA
Connecticut 21 51 30
District of Columbia 5 23 18
Delaware 19 44 25
Florida 18 39 21
Georgia 16 39 23
Hawaii 12 29 17
Idaho 21 42 21
Illinois NA NA NA
Indiana 17 41 24
Iowa 22 41 19
Kansas 21 43 22
Kentucky 19 40 21
Louisiana 12 37 25
Maine 22 42 20
Maryland 15 39 24
Massachusetts 23 56 33
Page 61 | A Snapshot of Title I Schools, 2000–01

Exhibit A.4. Percentage of Students Scoring at or Above the Proficient Level on the 2002 State NAEP, 4th Grade Reading, Categorized by Eligibility for the Free and Reduced-Price Lunch Program (cont.)
Eligible for the Free and Reduced-Price Lunch Program
Not Eligible for the Free and Reduced-Price Lunch Program
Percentage Point Difference
(Not Eligible — Eligible)
Michigan 16 39 23
Minnesota 30 41 11
Mississippi 10 29 19
Missouri 17 43 26
Montana 23 45 22
Nebraska 22 43 21
Nevada 13 27 14
New Hampshire NA NA NA
New Jersey NA NA NA
New Mexico 15 35 20
New York 19 50 31
North Carolina 17 47 30
North Dakota 23 39 16
Ohio 18 42 24
Oklahoma 17 38 21
Oregon 18 42 24
Pennsylvania 16 45 29
Puerto Rico NA NA NA
Rhode Island 14 44 30
South Carolina 14 39 25
Page 62 | A Snapshot of Title I Schools, 2000–01

Exhibit A.4. Percentage of Students Scoring at or Above the Proficient Level on the 2002 State NAEP, 4th Grade Reading, Categorized by Eligibility for the Free and Reduced-Price Lunch Program (cont.)
Eligible for the Free and Reduced-Price Lunch Program
Not Eligible for the Free and Reduced-Price Lunch Program
Percentage Point Difference
(Not Eligible — Eligible)
South Dakota NA NA NA
Tennessee 15 34 19
Texas 20 39 19
Utah 22 39 17
Vermont 21 46 25
Virginia 18 46 28
Washington 22 43 21
West Virginia 19 37 18
Wisconsin NA NA NA
Wyoming 21 38 17SOURCE: 2002 State NAEP.
Page 63 | A Snapshot of Title I Schools, 2000–01

Exhibit A.5. Percentage of Students Scoring at or Above the Proficient Level on the 2000 State NAEP, 8th Grade Mathematics, Categorized by Eligibility for the Free and Reduced-Price Lunch Program
Eligible for the Free and Reduced-Price Lunch Program
Not Eligible for the Free and Reduced-Price Lunch Program
Percentage Point Difference
(Not Eligible — Eligible)
Nation 10 35 25
Alabama 5 23 18
Alaska NA NA NA
Arizona 9 27 18
Arkansas 7 18 11
California 4 24 20
Colorado NA NA NA
Connecticut 7 42 35
District of Columbia 2 18 16
Delaware NA NA NA
Florida NA NA NA
Georgia 5 27 22
Hawaii 8 21 13
Idaho 17 32 15
Illinois NA NA NA
Indiana 13 36 23
Iowa NA NA NA
Kansas 17 41 24
Kentucky 8 29 21
Louisiana 4 22 18
Maine 20 36 16
Maryland 7 37 30
Massachusetts 11 38 27
Page 64 | A Snapshot of Title I Schools, 2000–01

Exhibit A.5. Percentage of Students Scoring at or Above the Proficient Level on the 2000 State NAEP, 8th Grade Mathematics, Categorized by Eligibility for the Free and Reduced-Price Lunch Program (cont.)
Eligible for the Free and Reduced-Price Lunch Program
Not Eligible for the Free and Reduced-Price Lunch Program
Percentage Point Difference
(Not Eligible — Eligible)
Michigan 9 35 26
Minnesota 27 42 15
Mississippi 3 14 11
Missouri 9 26 17
Montana 25 43 18
Nebraska 15 36 21
Nevada 6 24 18
New Hampshire NA NA NA
New Jersey NA NA NA
New Mexico 6 21 15
New York 12 34 22
North Carolina 13 38 25
North Dakota 21 35 14
Ohio 10 36 26
Oklahoma 8 26 18
Oregon 16 37 21
Pennsylvania NA NA NA
Puerto Rico NA NA NA
Rhode Island 7 31 24
South Carolina 6 27 21
Page 65 | A Snapshot of Title I Schools, 2000–01

Exhibit A.5. Percentage of Students Scoring at or Above the Proficient Level on the 2000 State NAEP, 8th Grade Mathematics, Categorized by Eligibility for the Free and Reduced-Price Lunch Program (cont.)
Eligible for the Free and Reduced-Price Lunch Program
Not Eligible for the Free and Reduced-Price Lunch Program
Percentage Point Difference
(Not Eligible — Eligible)
South Dakota NA NA NA
Tennessee 7 23 16
Texas 11 34 23
Utah 15 29 14
Vermont NA NA NA
Virginia 8 31 23
Washington NA NA NA
West Virginia 8 25 17
Wisconsin NA NA NA
Wyoming 15 28 13SOURCE: 2000 State NAEP.
Page 66 | A Snapshot of Title I Schools, 2000–01

Exhibit A.6. Gap Between High- and Low-Poverty Schools in the Percentage of Students Scoring at or Above the Proficient Level on the 2001 State Assessments, 4th Grade Reading and 8th Grade Mathematics
4th Grade Reading 8th Grade MathematicsPercentage Point Difference
(Low-Poverty Schools — High-Poverty Schools)Alabama 32 24
Alaska 46 8
Arizona NA NA
Arkansas NA NA
California 44 42
Colorado NA NA
Connecticut NA NA
District of Columbia 46 40
Delaware 41 NA
Florida 36 40
Georgia 25 NA
Hawaii NA NA
Idaho NA NA
Illinois 44 46
Indiana 65 45
Iowa NA NA
Kansas 35 46
Kentucky 27 24
Louisiana 0 NA
Maine NA NA
Maryland 29 49
Massachusetts NA NA
Page 67 | A Snapshot of Title I Schools, 2000–01

Exhibit A.6. Gap Between High- and Low-Poverty Schools in the Percentage of Students Scoring at or Above the Proficient Level on the 2001 State Assessments, 4th Grade Reading and 8th Grade Mathematics (cont.)
4th Grade Reading 8th Grade MathematicsPercentage Point Difference
(Low-Poverty Schools — High-Poverty Schools)Michigan 32 NA
Minnesota 41 NA
Mississippi NA NA
Missouri 23 15
Montana 30 47
Nebraska NA NA
Nevada 34 23
New Hampshire NA NA
New Jersey 37 44
New Mexico 33 26
New York NA NA
North Carolina 25 21
North Dakota 36 44
Ohio 40 46
Oklahoma 30 30
Oregon 17 33
Pennsylvania NA NA
Puerto Rico 12 –2
Rhode Island 27 NA
South Carolina NA 0
Page 68 | A Snapshot of Title I Schools, 2000–01

Exhibit A.6. Gap Between High- and Low-Poverty Schools in the Percentage of Students Scoring at or Above the Proficient Level on the 2001 State Assessments, 4th Grade Reading and 8th Grade Mathematics (cont.)
4th Grade Reading 8th Grade MathematicsPercentage Point Difference
(Low-Poverty Schools — High-Poverty Schools)South Dakota NA NA
Tennessee 21 18
Texas 12 9
Utah 22 16
Vermont NA NA
Virginia –4 NA
Washington NA NA
West Virginia 14 5
Wisconsin NA NA
Wyoming NA NASOURCE: Consolidated State Performance Reports, 2001.
Page 69 | A Snapshot of Title I Schools, 2000–01

Exhibit A.7. Participating Title I Schools Identified for School Improvement, by State, 1998–99, 1999–2000, and 2000–01
State
1998–99 1999–2000 2000–01Total
numberNumber in
improvement% in
improvementTotal
numberNumber in
improvement% in
improvementTotal
numberNumber in
improvement% in
improvementAlabama 812 60 7 815 60 7 833 61 7Alaska 361 8 2 281 14 5 278 11 4Arizona 841 181 22 870 169 19 935 346 37Arkansas 783 499 64 783 505 64 795 287 36California 4,543 210 5 4,888 765 16 5,319 1,275 24Colorado 597 91 15 540 273 51 557 156 28Connecticut 422 26 6 NA NA NA 446 28 6Delaware 101 32 32 97 32 33 116 20 17District of Columbia 125 100 80 156 28 18 161 12 7Florida 977 73 7 1,135 4 * 1,213 0 0Georgia 1,020 603 59 1,032 658 64 1,063 625 59Hawaii 138 91 66 147 97 66 125 86 69Idaho 397 14 4 397 61 15 397 88 22Illinois 2,259 727 32 2,164 378 17 2,245 403 18Indiana 826 98 12 822 173 21 822 211 26Iowa 878 148 17 804 33 4 797 26 3Kansas 687 154 22 681 143 21 642 118 18Kentucky 872 615 71 872 114 13 867 108 12Louisiana 873 162 19 881 61 7 883 20 2Maine NA NA NA 405 12 3 444 20 5Maryland 300 18 6 311 113 36 382 113 30Massachusetts 933 399 43 1,047 276 26 1,084 259 24
Page 70 | A Snapshot of Title I Schools, 2000–01

Exhibit A.7. Participating Title I Schools Identified for School Improvement, by State, 1998–99, 1999–2000, and 2000–01 (cont.)
State
1998–99 1999–2000 2000–01Total
numberNumber in
improvement% in
improvementTotal
numberNumber in
improvement% in
improvementTotal
numberNumber in
improvement% in
improvementMichigan 2,011 1,523 76 2,229 1,712 77 2,145 1,602 75Minnesota NA NA NA 961 56 6 968 79 8Mississippi 680 100 15 681 125 18 683 118 17Missouri NA NA NA NA NA NA 1,156 171 15Montana 619 62 10 633 60 9 629 68 11Nebraska 496 204 41 422 126 30 436 104 24Nevada 98 35 36 100 8 8 106 19 18New Hampshire 185 4 2 244 4 2 258 4 2New Jersey NA NA NA NA NA NA NA NA NANew Mexico 450 149 33 464 62 13 477 63 13New York 2,512 492 20 2,586 369 14 2,844 484 17North Carolina 1,030 46 4 1,030 12 1 1,026 6 1North Dakota 285 20 7 274 19 7 273 23 8Ohio 2,020 508 25 2,027 673 33 2,048 723 35Oklahoma 1,146 31 3 1,138 19 2 1,162 29 2Oregon 584 28 5 518 9 2 585 16 3Pennsylvania 1,731 215 12 1,798 301 17 1,857 253 14Puerto Rico 1,406 200 14 1,519 109 7 1,462 234 16Rhode Island 136 34 25 136 32 24 136 33 24South Carolina 499 75 15 513 35 7 515 31 6
Page 71 | A Snapshot of Title I Schools, 2000–01

Exhibit A.7. Participating Title I Schools Identified for School Improvement, by State, 1998–99, 1999–2000, and 2000–01 (cont.)
State
1998–99 1999–2000 2000–01Total
numberNumber in
improvement% in
improvementTotal
numberNumber in
improvement% in
improvementTotal
numberNumber in
improvement% in
improvementSouth Dakota 396 0 0 406 15 4 360 22 6Tennessee 770 17 2 806 77 10 794 132 17Texas 4,141 61 1 4,367 127 3 4,447 121 3Utah 232 20 9 228 25 11 219 24 11Vermont 212 27 13 212 30 14 219 28 13Virginia 741 150 20 732 149 20 758 34 4Washington 853 71 8 948 33 3 970 58 6West Virginia 456 130 29 456 118 26 439 13 3Wisconsin 1,036 66 6 1,056 166 16 1,120 98 9Wyoming 144 31 22 140 17 12 164 0 0Bureau of Indian Affairs 173 147 85 173 48 28 NA NA NA
Total 43,787 8,755 20 45,921 8,505 19 48,660 8,863 18
SOURCE: U.S. Department of Education, State Reports, SY 1998–99, SY 1999–2000, and SY 2000–01.
* Less than 0.5 percent.NOTES: The information shown in this Exhibit should be viewed with caution, as states may have made changes to the assessments in place or assessment levels reported from one year
to the next.For 1998–99, 1999–2000, and 2000–01, New Jersey was unable to provide information on the number of schools identified for improvement. Additionally, Maine and Minnesota were unable to provide this information for 1998–99 and Connecticut was unable to provide it for 1999–2000.The Bureau of Indian Affairs (BIA) has not yet provided a complete consolidated report submission for 2000–01.
Page 72 | A Snapshot of Title I Schools, 2000–01