a small survey of exposure to rubber process dust, rubber ... · pdf filehealth and safety...
TRANSCRIPT

Health and Safety Executive
A small survey of exposure to rubber process dust, rubber fume and N-nitrosamines
Prepared by the Health and Safety Laboratory for the Health and Safety Executive 2010
RR819 Research Report

Health and Safety Executive
A small survey of exposure to rubber process dust, rubber fume and N-nitrosamines
Chris Keen Harpur Hill Buxton Derbyshire SK17 9JN
This work was carried out in support of HSE’s FIT3 Disease Reduction Programme Cancer Project’s aim to develop a strategy to reduce the incidence of occupational cancer in Great Britain.
Earlier, research had identified a need for current intelligence on the standard of exposure control being achieved in the UK General Rubber Goods (GRG) industry. The primary objectives of the work were to:
n gather information on inhalation exposures to rubber process dust, rubber fume and nitrosamines;
n assess exposure control strategies; and
n assess potential for dermal exposure.
This study was unable to identify a correlation between nitrosamine exposures and rubber fume exposures at the 7 sites visited. The wide variety of rubber types, curing accelerators and curing conditions mean that nitrosamine exposures may not be predicted from rubber fume exposures. This study reports that:
n although rubber fume exposures were typically below the WEL, LEV was not applied in accordance with guidance already issued in HSE’s ‘COSHH essentials for rubber manufacturers’; and
n dermal exposure risks at rubber compounding are not adequately controlled and recommends dermal exposure control guidance be added to HSE’s ‘COSHH essentials for rubber manufacturers’ to address this issue.
This report and the work it describes were funded by the Health and Safety Executive (HSE). Its contents, including any opinions and/or conclusions expressed, are those of the author alone and do not necessarily reflect HSE policy.
HSE Books

© Crown copyright 2010
First published 2010
All rights reserved. No part of this publication may be reproduced, stored in a retrieval system, or transmitted in any form or by any means (electronic, mechanical, photocopying, recording or otherwise) without the prior written permission of the copyright owner.
Applications for reproduction should be made in writing to: Licensing Division, Her Majesty’s Stationery Office, St Clements House, 2-16 Colegate, Norwich NR3 1BQ or by e-mail to [email protected]
ii

CONTENTS
1 INTRODUCTION......................................................................................... 1 1.1 Background ............................................................................................. 1 1.2 Rubber process dust and fume................................................................ 1 1.3 N-nitrosamines ........................................................................................ 2
2 METHODOLOGY........................................................................................ 4 2.1 Site selection. .......................................................................................... 4 2.2 Visit methodology .................................................................................... 4
3 MAIN FINDINGS......................................................................................... 6 3.1 Rubber fume............................................................................................ 6 3.2 Rubber process dust................................................................................ 7 3.3 Exposure to N-nitrosamines .................................................................... 9
4 DISCUSSION............................................................................................ 11 4.1 Rubber fume.......................................................................................... 11 4.2 Rubber process dust.............................................................................. 13 4.3 N-nitrosamines ...................................................................................... 15
5 CONCLUSIONS........................................................................................ 18
6 APPENDICES........................................................................................... 19
7 REFERENCES.......................................................................................... 26
iii

iv

EXECUTIVE SUMMARY
This report has been endorsed by the Rubber Industry Advisory Committee (RUBIAC).
RUBIAC is the tripartite body comprising HSE, employers and Trades Unions that aims to deliver improvements in health and safety in the rubber industry.
Objectives
The work described in this report was performed as part of HSE’s Disease Reduction Programme (DRP) cancer project. It was performed to address a need for current intelligence on the standard of exposure control being achieved in the UK General Rubber Goods (GRG) industry. The primary objectives of the work were :
i) To gather information on inhalation exposures to rubber process dust, rubber fume and nitrosamines in the UK GRG industry.
ii) To assess exposure control strategies in the UK GRG industry.
iii) To assess the potential for dermal exposure in the UK GRG industry.
Main Findings
Seven GRG sites were visited by HSE as part of the 2007 DRP cancer project. Data from a further 5 HSE site visits, performed in the preceding 3 years, was also studied as this was deemed representative of current or very recent exposures. This resulted in a set of 75 data points for rubber fume exposure from 9 sites, 25 data points for rubber process dust exposures from 4 sites, and 38 data points for N-nitrosamine exposure, from 7 sites.
Rubber fume is encountered at sites where rubber items are cured. For rubber fume ;
i) exposures were mostly controlled to less than the UK Workplace Exposure Limit (WEL) of 0.6 mg/m3 8 hour TWA. Only 6 from 75 measured exposures exceeded this value. These exposures were measured on reactive site visits, in situations where a HSE inspector had reason to believe that exposure control was inadequate. No exposures in excess of the WEL were measured on the 2007 DRP visits at sites selected at random in an attempt to capture the typical situation within the industry.
ii) the median exposure from 9 sites visited between 2004 and 2007 was 0.13 mg/m3. When HSE last systematically assessed the industry, in the mid to late 1990s, the median exposure was 0.3 mg/m3.
iii) although exposures are typically below the WEL, exposures are not being controlled as low as reasonably practicable (ALARP), as is the requirement for carcinogens under the COSHH regulations. Almost all sites visited had significant deficiencies related to the engineering controls used to control rubber fume exposures. Moulding presses without local exhaust ventilation (LEV) fitted were frequently encountered. Where LEV was installed, deficiencies linked to design, use and maintenance were observed. The use of respiratory protective equipment (RPE) to control fume exposures was uncommon.
v

Rubber process dust is only encountered at sites where rubber is compounded. For rubber process dust ;
i) two from 25 measured exposures breached the UK WEL of 6 mg/m3. One of these was measured on a reactive site visit, the other was measured on one of the 2007 DRP visits.
ii) the median exposure from 4 sites visited between 2004 and 2007 was 2.1 mg/m3. When HSE last systematically assessed the industry, in the mid to late 1990s, the median exposure was 1.0 mg/m3.
iii) although LEV was typically present for operations with the potential for rubber process dust exposure, deficiencies in the design, use and maintenance of these systems mean that they are not controlling exposures to ALARP. RPE was frequently used in addition to LEV systems.
iv) dermal exposures were not adequately controlled during rubber compounding.
Nitrosamines are components of rubber fume. They are formed incidentally when certain precursor substances exist under favourable reaction conditions. The amine precursors for nitrosamine formation can be liberated when certain curing accelerators decompose during curing. For nitrosamines ;
i) the median total airborne nitrosamine exposure from seven sites visited for the 2007 DRP survey was 0.3 µg/m3. The principal nitrosamines detected were Nnitrosomorpholine and N-nitrosodimethylamine. When HSE last assessed nitrosamine concentrations in the GRG industry, between 1998 and 2001, the median exposure for measurements taken at 4 sites was 1.64 µg/m3. The principal nitrosamines detected at that time were the same as in the 2007 visits. There are no UK WELs for N-nitrosamines.
ii) there was no correlation between nitrosamine exposures and rubber fume exposures at the 7 sites visited for the 2007 DRP survey. The wide variety of rubber types, curing accelerators and curing conditions mean that nitrosamine exposures may not be predicted from rubber fume exposures.
Recommendations
This report identifies that dermal exposure risks at rubber compounding are not adequately controlled. This situation should be addressed by improved working practices and handling procedures, possibly in conjunction with an improved PPE programme. This report recommends dermal exposure control guidance be added to HSE’s ‘COSHH essentials for rubber manufacturers’ to address this issue.
This report identifies that LEV was not applied in accordance with guidance already issued in HSE’s ‘COSHH essentials for rubber manufacturers’. This report recommends that industry stakeholders address this shortcoming.
vi

This report identifies that COSHH assessments in the rubber industry are not suitable and sufficient. This report recommends that industry stakeholders address this shortcoming.
vii

viii

1 INTRODUCTION
1.1 BACKGROUND
As part of the Disease Reduction Programme (DRP) chemical carcinogens project, HSE has a need for information on dust and fume exposures in the UK rubber industry, and the standard of exposure control currently being achieved within this industry. In the 3 years prior to the DRP baseline survey, HSE had performed reactive visits to only 3 rubber factories to measure dust or fume exposures, hence there was very little quantitative exposure information on which to base firm conclusions. For this reason 7 visits were performed specifically for the DRP in 2007 to improve and update HSE’s knowledge base in this area. Nitrosamine exposures were also measured on these visits, this is discussed in more detail below. This report details the findings of these visits. A further 2 reactive visits to measure rubber process dust or fume were also performed by HSE in 2007. The findings of these, plus the other 3 reactive visits performed between 2004 and 2006 are also considered. HSE has made recent estimates for the size of the UK rubber industry of around 250 operational sites, with approximately 10,000 workers potentially exposure to rubber process dust and/or rubber fume (WATCH paper 2006/7, annex 2). However, discussions with industry stakeholders since the issue of the WATCH paper have lead to the estimate of the number of exposed workers being revised downward to 3,000.
1.2 RUBBER PROCESS DUST AND FUME
Rubber process dust and rubber fume are carcinogenic. Both agents are specifically listed in Schedule 1 of the COSHH regulations 2002 (as amended). Rubber process dust is defined as ‘dust arising in the stages of rubber manufacture where ingredients are handled, weighed, added to or mixed with uncured material or synthetic elastomers. It does not include dusts arising from the abrasion of cured rubber’ (EH40, 2005). Rubber process dust is assigned a UK Workplace Exposure Limit (WEL) of 6 mg/m3 (8 hour TWA). Rubber fume is defined as ‘fume evolved in the mixing, milling and blending of natural rubber or synthetic elastomers, or of natural rubber and synthetic polymers combined with chemicals, and in the processes which convert the resultant blends into finished products or parts thereof, and including any inspection procedures where fume continues to be evolved’ (EH40, 2005). Rubber fume is assigned a WEL of 0.6 mg/m3 (8 hour TWA).Guidance on the control of exposures to rubber process dust and rubber fume is included in HSE’s COSHH essentials package (www.coshh-essentials.org.uk).
HSE conducted a detailed study of rubber process dust and rubber fume exposures in the UK in the late 1990s (Dost et al, 2000). This study collected rubber companies own exposure monitoring data from 52 GRG companies, plus 29 retread tyre manufacturers and 7 new tyre manufacturers. The exposure monitoring data was mainly from the period 1995 to 1997. The survey concluded that rubber fume exposures were higher in the GRG sector than in the other two sectors considered. The median rubber fume exposure reported in the GRG sector was 0.3 mg/m3, with 22% of exposures exceeding the maximum exposure limit (MEL) of 0.6 mg/m3
which was in place at the time of the survey. The median rubber process dust exposure reported in the GRG sector was 1 mg/m3, with 9% of exposures in excess of the MEL of 6 mg/m3 which was in place at the time of the survey. Inadequate risk (COSHH) assessments and inadequate exposure controls were reported in a significant proportion of GRG companies.
1
1.3 N-NITROSAMINES
Rubber fume is a complex mixture of components. The composition of the fume is a result of a variety of factors, including the ingredients of the rubber mixture and the curing conditions. It is known that rubber fume can contain N-nitrosamines. Many N-nitrosamines are carcinogenic. There are no UK WELs for these substances.
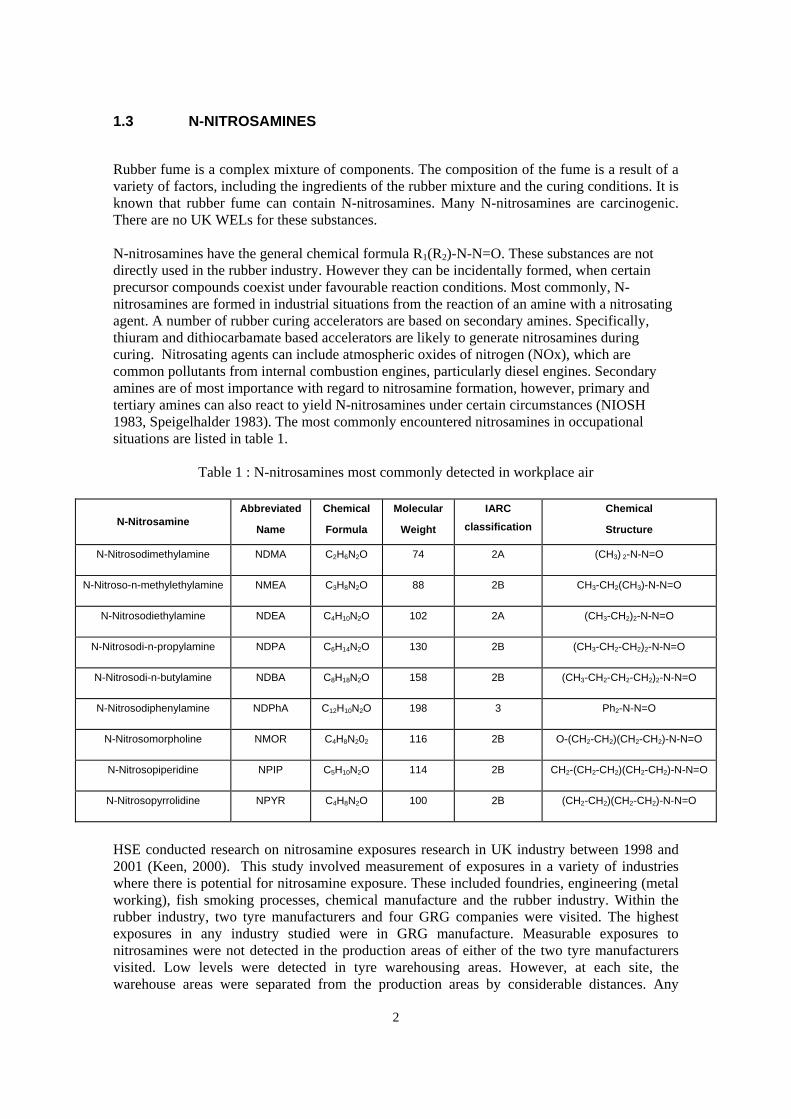
N-nitrosamines have the general chemical formula R1(R2)-N-N=O. These substances are not directly used in the rubber industry. However they can be incidentally formed, when certain precursor compounds coexist under favourable reaction conditions. Most commonly, N-nitrosamines are formed in industrial situations from the reaction of an amine with a nitrosating agent. A number of rubber curing accelerators are based on secondary amines. Specifically, thiuram and dithiocarbamate based accelerators are likely to generate nitrosamines during curing. Nitrosating agents can include atmospheric oxides of nitrogen (NOx), which are common pollutants from internal combustion engines, particularly diesel engines. Secondary amines are of most importance with regard to nitrosamine formation, however, primary and tertiary amines can also react to yield N-nitrosamines under certain circumstances (NIOSH 1983, Speigelhalder 1983). The most commonly encountered nitrosamines in occupational situations are listed in table 1.
Table 1 : N-nitrosamines most commonly detected in workplace air
N-Nitrosamine Abbreviated
Name
Chemical
Formula
Molecular
Weight
IARC classification
Chemical
Structure
N-Nitrosodimethylamine NDMA C2H6N2O 74 2A (CH3) 2-N-N=O
N-Nitroso-n-methylethylamine NMEA C3H8N2O 88 2B CH3-CH2(CH3)-N-N=O
N-Nitrosodiethylamine NDEA C4H10N2O 102 2A (CH3-CH2)2-N-N=O
N-Nitrosodi-n-propylamine NDPA C6H14N2O 130 2B (CH3-CH2-CH2)2-N-N=O
N-Nitrosodi-n-butylamine NDBA C8H18N2O 158 2B (CH3-CH2-CH2-CH2)2-N-N=O
N-Nitrosodiphenylamine NDPhA C12H10N2O 198 3 Ph2-N-N=O
N-Nitrosomorpholine NMOR C4H8N202 116 2B O-(CH2-CH2)(CH2-CH2)-N-N=O
N-Nitrosopiperidine NPIP C5H10N2O 114 2B CH2-(CH2-CH2)(CH2-CH2)-N-N=O
N-Nitrosopyrrolidine NPYR C4H8N2O 100 2B (CH2-CH2)(CH2-CH2)-N-N=O
HSE conducted research on nitrosamine exposures research in UK industry between 1998 and 2001 (Keen, 2000). This study involved measurement of exposures in a variety of industries where there is potential for nitrosamine exposure. These included foundries, engineering (metal working), fish smoking processes, chemical manufacture and the rubber industry. Within the rubber industry, two tyre manufacturers and four GRG companies were visited. The highest exposures in any industry studied were in GRG manufacture. Measurable exposures to nitrosamines were not detected in the production areas of either of the two tyre manufacturers visited. Low levels were detected in tyre warehousing areas. However, at each site, the warehouse areas were separated from the production areas by considerable distances. Any
2
nitrosamines detected in these warehouses could not be linked to the production areas in any way. No rubber fume exposure measurements were made as part of this project, hence the measured nitrosamine exposures could not be compared with rubber fume exposures. After consultation with industry stakeholders, it was decided that this was a deficiency of the original study. For this reason, nitrosamine exposures were measured in parallel with rubber fume exposures at the sites visited for the 2007 DRP survey, to allow such comparisons to be made.
3
2 METHODOLOGY
2.1 SITE SELECTION.
Published literature suggests that fume exposures in GRG sector are slightly higher than new and retread tyre making (Dost et al 2000). HSE’s earlier research indicated that detectable nitrosamine exposures do not occur in tyre manufacturing (although measurable exposures were seen in tyre warehousing). For these reasons, the 2007 DRP project focussed on the GRG sector.
For the 2007 DRP survey sites were selected from information held on HSE databases, principally the COIN (Corporate Operational Information System) database. Of the 7 sites visited for the 2007 DRP project, 6 were SMEs with between 20 and 100 employees. The other site was somewhat larger, with approximately 320 employees, and volunteered for inclusion via the British Rubber and Polyurethane Products Association (BRPPA). In general, sites employing more than 20 employees were selected in an attempt to maximise the amount of exposure data gathered during the visits. Participation in this project was voluntary. HSL occupational hygienists conducted these visits. All of the sites visited were provided with feedback. This consisted of a full occupational hygiene visit report, containing the results of exposure measurements together with interpretation, opinion on the site’s exposure control strategy and conclusions. Five of the sites visited were performing moulding, extrusion or curing operations, with rubber fume being the agent of concern. The other two were rubber compounders, where rubber process dust exposures were assessed. For research purposes, airborne nitrosamines were measured at all 7 sites.
A further 2 GRG sites were visited for reactive purposes by HSE in 2007 to assess rubber fume and/or rubber process dust exposures. Three site visits to assess rubber fume and/or rubber process dust exposures were conducted by HSE between 2004 and 2006. The monitoring results and findings from these 5 visits are also considered in this report. No nitrosamine measurements were made on these reactive visits. Reactive visits to assess exposure are made by HSE for a variety of reasons, but frequently their purpose is to investigate situations where exposure control is considered inadequate. It is known that the exposure data obtained from HSE reactive visits is generally higher than that obtained by when monitoring ‘typical’ situations (IOM 2006). Four of the sites visited for reactive purposes were SMEs, the other site employed in excess of 600 workers
2.2 VISIT METHODOLOGY
On all site visits, rubber process dust and/or rubber fume exposures were determined using methodology described in MDHS 47/2 (Determination of rubber process dust and rubber fume (measured as cyclohexane soluble material) in air). Rubber process dust was determined gravimetrically, rubber fume was determined as the cyclohexane soluble fraction of the sample.
For the DRP visits performed in 2007, inhalation exposures to N-nitrosamines were also measured. This was done by sampling onto Thermosorb-N cartridges at a nominal flow rate of 1.0 litre/minute. These samples were solvent desorbed and analysed by gas chromatography coupled with a mass spectrometric detection system. Full details of the analytical methodology are contained in appendix 2.
4

The air sampling strategy focussed on measurement of worker exposures. Hence the majority of samples taken were personal samples, with the sampling device mounted in the worker’s breathing zone. A small number of static (background) samples were taken but the results of these are not considered to be representative of worker exposures and have not been included in the statistical analysis of data. Samples were taken over a sufficiently long period as to be representative of full shift exposure, and hence the results have been used, in conjunction with information of shift length, to calculate 8 hour time weighted average exposures. Typically the sampling duration was at least 50% of the work shift. At each site, workers were sampled in all areas where there was exposure potential. At all sites visited, work on the day of the visit was generally considered as being normal. Attempts were made to capture typical, rather than worst case, exposures. At the smaller sites, a significant proportion of the overall workforce was sampled. At larger sites, it was necessary to select a sample of the potentially exposed workforce whose exposures were considered representative of the whole workforce.
For the 2007 DRP visits the site’s exposure control strategy was assessed by an occupational hygienist, in addition to exposure measurement. This included assessment of management controls, qualitative and quantitative assessment of engineering controls, and the use of respiratory protective equipment (RPE), where applicable. To ensure consistency, engineering controls were compared to those described in HSE’s COSHH essentials (www.coshhessentials.org.uk). The potential for exposure by routes other than inhalation was also assessed. Information on company history, relevant processes and number/age/sex of workers potentially exposed was recorded. Where sites had conducted recent exposure monitoring exercises of their own, the results and reports from these assessments were also collected, with the companies’ permission.
5

3 MAIN FINDINGS
NB – unless otherwise stated, all exposures discussed below are 8 hour time weighted averages (8 hour TWA).
3.1 RUBBER FUME
3.1.1 Inhalation exposure
HSE has measured rubber fume exposures at 9 sites between 2004 and 2007. Four of these visits were performed for reactive purposes, the remaining five were performed for the 2007 DRP project. A total of 75 exposure measurements were made for rubber fume over this period. The results of these measurements are summarised in Table 2, and represented graphically in Figure 1.
Table 2 : Rubber fume exposures (mg/m3) measured by HSE between 2004 and 2007 Number of sites
Number of measurem ents
Exposure range
Mean Geo mean
Median Results < LOD
Results > WEL
Sites > WEL
Reactive visits
4 45 ND – 1.75 0.27 0.16 0.16 12 6 2
DRP survey
5 30 ND – 0.53 0.15 0.1 0.08 17 0 0
All data 9 75 ND – 1.75 0.22 0.14 0.13 29 6 2
The limit of detection of the analytical method is dependant upon the volume of air sampled, and on the results of blank determinations. This varied slightly between visits, but was typically around 0.1 mg/m3. For the purpose of statistical analysis a numerical value of LOD/2, 0.05mg/m3, was used for these results. Seventeen (57%) of the results from the DRP visits were <LOD, 12 (27%) of results from the reactive visits were <LOD. Overall, 29 (39%) fume results were <LOD.
The rubber fume WEL was not breached at any of the sites visited for the DRP project. Two of the four sites visited for reactive purposes had measured exposures in excess of the WEL. In total, 6 of the 75 measured exposures (8%) exceeded the WEL.
30
25
20
15
10
5
0
Fume (mg/m3)
6
frequ
ency
0 0.4 0.8 1.2 1.6 2

Figure 1 : Histogram of HSE rubber fume exposure data 2004-2007
3.1.2 Exposure controls
All sites visited for the 2007 DRP survey were judged to have some deficiencies in their exposure control strategy. These ranged from relatively minor to significant. Four of the 5 sites were performing compression or injection moulding with no LEV. In addition, 2 of the 4 sites visited for reactive purposes were running moulding presses without LEV. The LEV was inadequate at another of these sites due to a combination of poor design and inadequate maintenance. In total, of the 9 sites visited by HSE between 2004 and 2007 to assess rubber fume exposure, six were running moulding presses with no LEV, and the LEV was inadequate at one other site. Only 2 of these sites were deemed to have suitable, well maintained LEV installed to control rubber fume exposures.
Of the 5 sites visited for the 2007 DRP survey, only 1 had had a suitable and sufficient COSHH assessment, 2 sites had conducted recent (within the past 5 years) exposure monitoring. Detailed information on these aspects of the exposure control strategy was not available from the 4 reactive visits.
RPE was used as a rubber fume exposure control at one of the sites visited for the 2007 DRP survey. However, there were inadequacies within the RPE programme, for example workers with beards were observed wearing equipment which relied upon the face seal for protection.
3.1.3 Dermal exposure
Exposure control strategies generally paid little, if any, regard to the potential for dermal exposure to rubber fume. Cured, and uncured rubber was handled at several of the sites visited without gloves. There may be dermal risks associated with the handling of uncured, or freshly cured rubber, although these are not necessarily linked to dermal exposure to rubber fume. The absence of COSHH assessments at most of the sites visited make it difficult to evaluate whether dutyholders have adequately considered the potential for dermal exposure during rubber curing.
3.2 RUBBER PROCESS DUST
3.2.1 Inhalation exposure
HSE has measured rubber process dust exposures at 4 sites since 1st January 2004. Two of the visits were performed for reactive purposes, the other two were performed specifically for the 2007 DRP project. The results of these measurements are summarised in Table 3, and represented graphically in Figure 2.
7

Table 3 : Rubber process dust exposures (mg/m3) measured by HSE 2004 and 2007 inclusive Number of sites
Number of measureme nts
Exposure range
Mean Geo mean
Median Results < LOD
Results > WEL
Sites > WEL
Reactive visits
2 12 0.34 – 19.3
3.53 2.02 2.07 0 1 1
DRP survey
2 13 0.1 – 8.5 2.41 1.46 2.37 0 1 1
All data 4 25 0.1 – 19.3
2.95 1.71 2.1 0 2 2
The limit of detection of the analytical method is dependent upon the volume of air sampled, and on the results of blank determinations. This varied slightly between visits, but was typically below 0.1 mg/m3. No results below the limit of detection were recorded.
The rubber process dust WEL was breached at one of the sites visited for the DRP survey, and at one of the sites visited for reactive purposes. Overall, the WEL was breached at 2 of the 4 sites where rubber process dust was handled, with 2 from 25 (8%) of results exceeding the WEL.
10
8
6
4
2
0
Rubber process dust (mg/m3)
Figure 2 : Histogram of HSE rubber process dust exposure data 2004-2007
3.2.2 Exposure controls
LEV was present on all weighing and mixing equipment at all four sites where rubber process dust exposures were assessed. However, examples of poor LEV design were seen, with very little enclosure of the exposure source.
Open mill mixing was observed at 3 sites. Canopy extraction was present on all open mill mixing equipment. Typically the canopy is located 1 to 2 metres above the main exposure source, with operators frequently having to work with their heads in close proximity to the dust generated as the powders are manually applied to the mill. The flexible side curtains recommended in COSHH essentials guidance sheet RB04 (Dust and fume from milling) were not present on any open mill mixing equipment at these sites.
8
frequ
ency
0 4 8 12 16 20
3.3
LEV applied to ingredient weighing varied greatly in design. Again, much of the LEV observed for this process provided very little enclosure of the exposure source. Examples were observed where the LEV consisted only of a single slot, with no canopy or hood fitted.
Both sites visited for the 2007 survey were judged to have deficiencies in their exposure control strategy. One site claimed to have a written COSHH assessment, and a programme of thorough maintenance, examination and testing in place for their LEV systems. However, documentation to support this claim was not made available at the time of the visit, or when requested post visit. Power assisted full face filtered RPE was available at this site but was not worn consistently for all tasks with rubber process dust exposure potential. It was worn for some weighing and mixing operations, but not others where comparable substances were being handled and the potential for dust exposure was similar. This site conducted regular in-house exposure monitoring. The results of the monitoring were studied on the day of the visit. These indicated that breaches of the rubber process dust WEL were uncommon. One exposure in excess of the WEL was measured on the day of the HSE visit, and the engineering controls applied to some of the mixing equipment were judged to be inadequate. No exposures in excess of the WEL were measured at the other site. This company had no programme of LEV maintenance, examination and testing. Their COSHH assessment was not suitable and sufficient. The company had conducted no exposure monitoring since 2001. FFP3 standard RPE was available, but again, was not used consistently for dusty tasks.
RPE was available at both sites visited for reactive purposes. Detailed information on the usage of this equipment was not available.
3.2.3 Dermal exposure
Neither of the 2 sites visited for the 2007 DRP survey were deemed to be adequately controlling dermal exposures. At both sites it was noted that operators received significant, visible dermal contamination with the powders being handled. This could have been reduced by improved working practices and handling procedures, possibly in conjunction with an improved PPE programme in both cases. The extent of dermal contamination was such that there would be an additional risk of inadvertent ingestion exposure.
EXPOSURE TO N-NITROSAMINES
Inhalation exposure to N-nitrosamines was measured at the 7 sites visited for the 2007 DRP project. Total airborne nitrosamine (TAN) results are summarised in Table 4.
Table 4 : Total airborne nitrosamine exposures (µg/m3) measured on 2007 DRP survey visits. Number of sites
Number of measurements
Exposure range
Mean Geo mean
Median Results < LOD
Results >1µg/m3
All data 7 38 ND – 2.01
0.56 0.33 0.3 2 8
The limit of detection of the analytical method is dependant upon the volume of air sampled, and on the results of blank determinations. This varied slightly between visits, but was typically around 0.1 µg/m3 for any individual nitrosamine. Two results below the limit of detection were recorded. For statistical analysis these were replaced with LOD/2. The main nitrosamines detected were NMOR, present in 29 samples, and NDMA, present in 24 samples. NDEA was detected in 10 samples, NDBA was detected in 4 samples. No other nitrosamines were detected. No UK occupational exposure limits exist for nitrosamines. An OEL of 1 µg/m3 was set in
9
Germany, although it is unclear whether this is extant. Eight of the 38 measured exposures exceeded this value. Nitrosamines are a component of rubber fume, hence exposure controls, and the potential for dermal exposure, are similar to those already described in sections 3.1.2 and 3.1.3.
10

4.1
4 DISCUSSION
RUBBER FUME
For the 30 samples taken for the 2007 DRP survey, covering 5 different sites, the geometric mean exposure was 0.1 mg/m3 and the median 0.08 mg/m3. No breaches of the WEL were measured. When the other HSE reactive visits performed since 1st January 2004 are taken into consideration the number of samples increases to 75, covering 9 different sites. The geometric mean of these data 0.14 mg/m3, the median is 0.13 mg/m3. Six results, 8% of the measured exposures, exceeded the WEL.
Measured 8 hour TWA exposures at each site are represented in a box and whisker plot, figure 3. For this, and other box and whisker plots presented in this report, the rectangular part of the plot extends from the lower quartile to the upper quartile, covering the centre half of the sample. The centre line within the box shows the location of the sample median. The plus sign indicates the location of the sample mean. The whiskers extend from the box to the minimum and maximum values in the sample. In figure 3, sites 1,2 and 4 to 6 inclusive were visited for the 2007 DRP survey. Sites 9, 10, 11 and 12 were visited for reactive purposes. No rubber fume measurements were made at sites 3,7 and 8.
Rub
ber f
ume
expo
sure
- m
g/m
3 1.8
1.5
1.2
0.9
0.6
0.3
0
Site
1
Site
2
Site
4
Site
5
Site
6
Site
9
Site
10
Site
11
Site
12
Figure 3 : Rubber fume exposures measured by HSE since 2004
Dost et.al (2000) reported data from 341 exposure measurements taken at 52 UK GRG companies in the mid to late 1990s The mean exposure reported by this study was 0.41 mg/m3, the median was 0.3 mg/m3. 75 results, 22% of measured exposures, exceeded the MEL of 0.6 mg/m3 which was in place at the time of the study. Whilst keeping in mind the uncertainties associated with the small data set, the rubber fume exposures measured for the DRP survey in 2007, and all exposures measured by HSE since 2004, suggest a decrease in rubber fume exposures in the UK since the mid to late 1990s. The median exposures from the Dost survey and the HSE data for 2004-07 are presented graphically in Figure 4.
11

Rub
ber f
ume
expo
sure
s - m
g/m
3
0.3
0.25
0.2
0.15
0.1
0.05
0 1995-97 2004-07
Figure 4 : Median rubber fume exposures reported by Dost et al and from HSE data 2004-07
Other researchers have reported yearly reductions in rubber fume exposure in the UK. One study reported annual exposure reductions in crude materials handling areas of 4.5% and in curing areas of 2.0% for the period 1975 to 2005 (de Vocht et al, 2007). Other work (IOM 2006) reported annual reductions in exposure of 2.9% based on industry’s own data and 4.8% based on HSE data.
Although no breaches of the UK WEL occurred at any of the sites visited for the 2007 survey, four of the 5 sites were running compression or injection moulding presses with no LEV. The COSHH essentials package of guidance (www.coshh-essentials.org.uk) contains specific information on the control of rubber fume which indicates that LEV is the appropriate control option. Schedule 2A of the COSHH regulations 2002 (as amended) contains 8 principles of good control practice. Of these, principle (a) ‘Design and operate processes and activities to minimise emission, release and spread of substances hazardous to health’ and (d) ‘Choose the most effective and reliable control options which minimise the escape and spread of substances hazardous to health’ are relevant. Rubber fume is a carcinogen, specifically listed in Schedule 1 of the COSHH regulations 2002 (as amended). Given this status, the more stringent requirements of Appendix 1 of these regulations ‘Control of carcinogenic and mutagenic substances’ should also be applied. These state that where the carcinogen cannot be eliminated and the process cannot be performed within totally enclosed systems, that partial enclosures, in conjunction with LEV and general ventilation are the preferred control option. Regulation 7 (7) of the COSHH regulations 2002 (as amended), states that for carcinogens, exposure should be controlled to as low a level as is reasonably practicable. The running of moulding presses with no LEV is not in accordance with any of these requirements.
Other common deficiencies identified from the 5 sites visited for the 2007 DRP survey include inadequate maintenance, examination and testing of LEV systems at 4 sites, COSHH assessments deemed not to be suitable and sufficient at 4 sites, and an absence of exposure monitoring at 3 sites. These deficiencies relate to COSHH regulations 9.2, 6 and 10 respectively.
12

4.2
Inhalation would be the only significant route of exposure to rubber fume. There may be dermal risks associated with the handling of uncured, or freshly cured rubber although these are not necessarily linked to dermal exposure to rubber fume. The absence of COSHH assessments at most of the sites visited make it difficult to evaluate whether dutyholders have adequately considered the potential for dermal exposure during rubber curing.
RUBBER PROCESS DUST
Rubber process dust measurements were made at two sites during the 2007 DRP survey. The geometric mean exposure of the 13 measurements was 1.46 mg/m3. One result exceeded the WEL of 6 mg/m3. When the other 2 reactive visits performed since 2004 are considered also, the geometric mean exposure of the 25 measurements made at these 4 sites is 1.71 mg/m3. Two results, 8% of the measured exposures, exceeded the WEL.
All data from these 4 visits falls within the HSE definition of rubber process dust (dust arising in the stages of rubber manufacture where ingredients are handled, weighed, added to or mixed with uncured material or synthetic elastomers. It does not include dusts arising from the abrasion of cured rubber).
Measured 8 hour TWA exposures for each site are represented in figure 5. Sites 3 and 7 were visited for the 2007 DRP survey, sites 8 and 9 were visited for reactive purposes. No rubber process dust measurements were made at the other sites.
Rub
ber p
roce
ss d
ust e
xpos
ure
- mg/
m3
20
16
12
8
4
0
Site
3
Site
7
Site
8
Site
9
Figure 5: Rubber process dust exposures measured by HSE since 2004
Dost et al reported that a high proportion of ‘rubber process dust’ measurements taken do not actually fall within the HSE definition of this material. For this reason, they separated exposures by process for statistical analysis. In the GRG sector, the highest exposures were reported for weighing operations (mean 4.9 mg/m3, median 4.2mg/m3) followed by mixing operations (mean 2.6 mg/m3, median 1.2 mg/m3) and milling operations (mean 1.3 mg/m3, median 0.8 mg/m3). 13

When the number of samples is taken into consideration, the mean exposure across these 3 jobs was 2.3 mg/m3, the median 1.0 mg/m3. Seven results, 9% of the measured exposures, exceeded the MEL of 6 mg/m3 which was in place at the time of the study. Measurements taken at processes other than weighing, mixing and milling were discounted as there was a high probability that they were not rubber process dust, according to the HSE definition. The median exposures from the Dost survey and the HSE data for 2004-07 are presented graphically in Figure 6.
Rub
ber p
roce
ss d
ust e
xpos
ures
- m
g/m
3
2.4
2
1.6
1.2
0.8
0.4
0 1995-97 2004-07
Figure 6 : Median rubber process dust exposures reported by Dost et al and from HSE data 2004-07.
As is the case for rubber fume, published studies report a reduction in rubber process dust exposure over time. One study (IOM) reports an annual decrease in exposures in compounding and mixing departments of 12.1% based on HSE data and 5.3% based on industries own data. Another study reports an annual decrease of 3.9 % in crude materials, mixing and milling departments (de Vocht et al, 2007). The limited data obtained by HSE since 2004 do not support this downward trend but the data set is so small as to make this conclusion uncertain.
LEV was applied to most processes with potential for rubber process dust exposure at the 4 sites where these exposures have been assessed by HSE since 2004. However, in a significant proportion of cases, this equipment was poorly designed, offering very little enclosure of the exposure sources and hence poor capture of dust emissions. The use of RPE as a control measure appears to be more common for controlling rubber process dust exposures than fume. However, where available, RPE was not always used consistently. It should be borne in mind that, although RPE can potentially reduce inhalation exposures, improved exposure control at source should be the aim, which would reduce exposure by all routes. Given the carcinogen status of rubber process dust, improved design of LEV systems to better control dust at source is desirable.
There is significant potential for dermal exposure in rubber compounding. Many of the raw materials incorporated into the mixes are dusty solids. Some are known to be irritants or skin sensitisers. Anecdotal evidence obtained from rubber formulation chemists during the visits,
14

4.3
suggests that, whilst the industry have made significant efforts to remove carcinogens from rubber mixes wherever possible, it would be very difficult to remove certain skin sensitisers. Visible contamination of workers clothing and unprotected skin was commonplace at the 2 sites visited in the 2007 survey.
The dermal exposure risk was not adequately considered in either site’s exposure control strategy. Improved working practices and handling procedures, engineering controls and PPE programmes could significantly reduce dermal exposures, with a concomitant reduction in the risk of dermatitis and of systemic exposure via the ingestion route.
N-NITROSAMINES
Inhalation exposures to nitrosamines were detected at all 5 sites curing rubber in the 2007 DRP survey. At these sites, exposures ranged from not detected to 1.56 µg/m3. Four of the measured exposures exceeded 1 µg/m3. Airborne nitrosamines were detected at trace levels at one of the compounding sites, and at significantly higher levels at the second compounding site with exposures ranging from not detected to 2.01 µg/m3. Four from 8 measured exposures exceeded 1 µg/m3 at this site. The source of nitrosamines at this site is unclear. Overall, across the 7 sites visited in 2007, 38 nitrosamine exposure measurements were made. These ranged from ND to 2.01 µg/m3, with a geometric mean of 0.33 µg/m3.
As part of an earlier research project, conducted between 1998 and 2001, HSE measured nitrosamine exposures at 4 GRG factories. A total of 40 measurements were taken. The data from this survey are summarised in table 5, which also contains the 2007 data to allow comparison of the 2 data sets. The data are also presented graphically in Figure 7.
Table 5 : comparison of nitrosamine exposure data (µg/m3)from 1998-2001 survey and 2007 survey. Data source
Number of sites
Number of measurements
Exposure range
Mean Geo mean
Median Results < LOD
Results >1µg/m3
1998 – 2001 survey
4 40 ND – 8.85
1.94 0.99 1.64 5 25
2007 DRP survey
7 38 ND – 2.01
0.56 0.33 0.3 2 4
Comparing these two data sets suggests that nitrosamine exposures in GRG factories have fallen in recent years. However, as is the case for rubber fume and rubber process dust discussed above, the small data set means that this conclusion can be tentative only. The reduced exposures may be a result of improved engineering controls. Alternatively, it is possibly linked to increased awareness of the nitrosamine risk and a resultant effort within the industry to reduce the use of curing accelerators which are able to form nitrosamines. The use of nitrate/nitrite salt bath curing systems is known to generate elevated levels of airborne nitrosamines, and lead to exposure of workers operating this type of equipment and others in the area. When the 1998-2001 survey was conducted, salt bath curing systems appeared to be in widespread use in GRG companies. All four of the sites visited at this time used salt bath curing for certain items. Only one site visited for the 2007 DRP survey were using salt bath curing. This company had a good awareness of the risks of generating nitrosamines from the process and a good standard of engineering control was applied at the salt bath.
15

Nitr
osam
ine
expo
sure
- µg
/m3 10
8
6
4
2
0
Year of survey
1998-2001 2007
Figure 7 : comparison of nitrosamine exposure data from 1998-2001 survey and 2007 survey.
One of the aims of the 2007 DRP survey was to investigate links between nitrosamine exposure and rubber fume exposure. Data from parallel sampling of these two agents is illustrated in figure 8. The data used for this analysis are a mixture of personal and static samples. The data from personal samples is discussed in various sections above. In generating this data, each sampling subject wore a rubber fume sampler and a nitrosamine sampler, at the same time, mounted adjacent to each other in the workers breathing zone. The data from static sampling was generated by sampling for these two agents, in parallel, at various fixed positions in the factories visited. The static sampling data is not representative of personal exposures, but still allows a valid comparison between rubber fume and nitrosamine concentrations to be made. Linear regression analysis of this data indicates no statistically significant correlation at the 90% confidence level, between these two variables.
Rub
ber f
ume
(mg/
m3)
0
0.1
0.2
0.3
0.4
0.5
0.6
0 0.4 0.8 1.2 1.6 2 Total airborne nitrosamine (ug/m3)
Figure 8 : plot of rubber fume vs nitrosamine concentration from parallel sampling.
16
It is known that the generation of airborne nitrosamines during rubber curing is linked to the use of certain curing accelerators. Information on the types of rubber being handled at the time of sampling was collected at some, but not all, of the sites visited. Information on the specific curing agents in use was provided at two sites. For reasons of commercial secrecy, other sites were reluctant to divulge specific ingredients within the rubber mixes being handled at the time of the monitoring survey. Hence, it is not possible to further investigate links between airborne nitrosamine concentration and specific curing accelerators. Many GRG companies will process a variety of rubber blends containing various curing agents, in varying quantities, under varying cure conditions. A systematic investigation of links between airborne rubber fume and nitrosamine levels and the various parameters influencing nitrosamine formation is not practicable.
It must be concluded that airborne nitrosamine exposure cannot be predicted from rubber fume exposures in general terms. In this situation, the overriding duty for the rubber industry under COSHH is to control rubber fume exposures. HSE would support a precautionary approach to control of nitrosamine exposures in accordance with the ALARP principle that, under the COSHH regulations, should be applied to any carcinogen.
17

5 CONCLUSIONS
HSE has made 75 rubber fume exposure measurements at 9 different GRG sites between 2004 and 2007. The geometric mean of these data is 0.14 mg/m3, the median is 0.13 mg/m3. The rubber fume WEL of 0.6 mg/m3 was exceeded at two sites. Six measured exposures, 8% of the measurements taken, exceeded the WEL.
The limited amount of rubber fume data obtained recently by HSE supports the findings of other researchers that rubber fume exposures have reduced in the past decade.
HSE has made 25 rubber process dust exposure measurements at 4 different GRG sites between 2004 and 2007. The geometric mean of these data is 1.71 mg/m3, the median is 2.1 mg/m3. The rubber process dust WEL of 6 mg/m3 was exceeded at two sites. Two measured exposures, 8% of the measurements taken, exceeded the WEL.
The limited amount of rubber process dust exposure data obtained recently by HSE does not support a downward trend in inhalation exposure to this agent. Dermal exposure controls at the two sites visited in 2007 where rubber compounding operations were carried out were not adequate. In view of these two findings, a precautionary approach, as required by COSHH for working with carcinogens, should continue to be applied to processes where exposures to rubber process dust are likely. This will provide for better control of both dermal and inhalation exposures.
HSE made 38 nitrosamine exposure measurements in GRG factories, at 7 sites in 2007. The geometric mean total airborne nitrosamine exposure was 0.32 µg/m3 . Eight results exceeded 1µg/m3. The principal nitrosamines detected were n-nitrosomorpholine and Nnitrosodimethylamine.
When compared against data obtained from a previous HSE survey, the nitrosamine exposure data obtained in 2007 suggests a reduction in nitrosamine exposures in the GRG industry in recent years. However, the data set is small, and hence will be subject to large uncertainties.
A detailed study at 7 GRG sites in 2007 revealed common deficiencies in exposure controls.
LEV was not applied appropriately at 6 of the 7 sites visited for the 2007 DRP survey. Where it was applied, deficiencies were common. These related to poor design, incorrect use and inadequate maintenance, examination and testing.
Written COSHH assessments were totally absent or contained significant deficiencies for at least 5 of the 7 sites visited for the 2007 study.
Recent exposure monitoring had only been conducted at 3 of the sites visited for the 2007 study.
Some of the conclusions of this report are subject to a high degree of uncertainty, since they are based on a relatively small sample of the UK GRG industry. Greater statistical confidence would be obtained by performing further site visits.
18

6 APPENDICES
Appendix 1 – summaries of site visit reports.
Sites 1 to 7 were visited for the 2007 DRP survey. Sites 8 to 12 were visited for reactive purposes between 2004 and 2007.
Site 1. The company operate from a modern industrial unit, manufacturing small items for the automotive industry using manually operated compression moulding machines. Approximately 30 workers are potentially exposed to rubber fume. There is no compounding on site, and hence no exposure to rubber process dust.
There are approximately 25 moulding presses on the site and 3 post curing ovens. No LEV was applied to any of this equipment. Hot items are regularly removed from the presses and placed on adjacent cooling tables whilst still visibly fuming. Personal monitoring was performed on 5 press operators and a single worker in the final inspection area. 8 hour TWA rubber fume exposures ranged from not detected (<0.1 mg/m3) to 0.25 mg/m3. 8 hour TWA TAN exposures ranged from 0.22 µg/m3 to 0. 71 µg/m3.
The main deficiencies at the site included the absence of a written COSHH assessment covering the processes generating rubber fume and the absence of LEV on any equipment. RPE was not worn and no exposure monitoring had been carried out at any time prior to the project visit.
Site 2. This company operate from a large, purpose designed facility which is less than 10 years old. They manufacture a variety of moulded rubber products of varying sizes using injection moulding and continuous cold extrusion with autoclave curing. Over 300 workers are employed at the site, with approximately 100 potentially exposed to rubber fume. There is no compounding on site, and hence no exposure to rubber process dust.
There are numerous moulding presses on this site, all fitted with LEV. However, on some presses, hot fuming items were removed and placed on adjacent cooling tables which did not have LEV. Some of the autoclave emptying operations emitted large quantities of fume, with operators required to work in close proximity to the fuming rubber for this task. RPE is provided for this, however there has been no fit testing or formal training in it’s use, and misuse was observed during the visit. Personal monitoring was performed on 9 operators, working on a cross section of tasks. 8 hour TWA rubber fume exposures ranged from not detected to 0.53 mg/m3. Corresponding nitrosamine exposures ranged from 0.2 to 1.56 µg/m3. The company supplied data from their own exposure monitoring exercises, conducted between 2000 and 2004. This included 33 measurements of rubber fume exposure. None of these exceeded the 0.6 mg/m3 (the current UK WEL), with 28 of the results being below 0.3 mg/m3.
Overall, the site’s exposure control strategy was deemed adequate. It would have been possible to improve LEV design at some operations, and to improve the management, usage and maintenance of RPE.
Site 3. This company operate from a modern industrial unit, this being their only site. They are rubber compounders, making a range of rubber compounds for a variety of customers. 50 to 100 workers are employed on site, with approximately 25 potentially exposed to rubber process dust. There is no curing of the compounded rubber on site, hence no exposure to rubber fume.
19

The company compound black and non black rubbers on this site. These two product lines are kept separate to remove the potential for cross contamination. LEV is applied to ingredient weighing. There are several weighing stations with differing designs of LEV. Black rubbers are mixed in enclosed (Banbury type) mixing machinery. Non black rubbers are mixed on open mill mixing equipment. The LEV design on the open mill mixers could potentially be improved. There were some issues regarding RPE maintenance and training which may have compromised the protection afforded by this equipment to some extent. 8 hour TWA rubber process dust exposures ranged from 2.37 mg/m3 to 8.5 mg/m3 . The highest exposure was for a weighing operative in the black rubber weighing area and did exceed the WEL. No other exposures exceeded the WEL at this site. The company did conduct their own program of regular exposure monitoring, using 3.5 mg/m3 (the carbon black WEL) as an OEL. The majority of results were below this value, and wherever a result exceeded this value an investigation was made, However, the company were not prepared to supply the raw data from this monitoring to HSE, hence no detailed analysis can be made. The company claimed to have a COSHH assessment which covered control of rubber process dust. However, this document was not made available during the visit, or subsequently when requests were made, hence no conclusion can be drawn regarding the suitability and sufficiency. Dermal exposure to the raw ingredients was significant for certain operations, most notably some ingredient weighing and the operation of the open mill mixers. Positive pressure P2 RPE was available, and was worn for some, but not all, operations with rubber process dust exposure potential. As the potential for nitrosamine exposure was not deemed significant at compounding operations, only static sampling for nitrosamines was performed at this site. Trace levels of NDMA were detected in one of these samples, but the concentrations were significantly lower than exposures measured at other sites.
The main deficiencies on this site were poor design of LEV systems, inconsistent RPE use and poor control of dermal exposures.
Site 4. This company operate from a variety of adjacent industrial units of varying ages and states of repair. Thirty five workers are employed at the site, with 12 potentially exposed to rubber fume. A variety of products are manufactured using compression moulding equipment. There is no compounding on site, and hence no exposure to rubber process dust.
Compression moulding is performed in 2 separate buildings. Smaller items are manufactured in one of these buildings. LEV is available in this area, both on the moulding machines and the cooling tables. However, it is not always used correctly, which is indicative of poor operator training. In the second building, larger items are manufactured in larger moulding presses. There was no LEV in this area, although forced general ventilation was good and went some way to controlling fume exposures. Measured rubber fume exposures on the day of the visit ranged from not detected (<0.1 mg/m3) to 0.34 mg/m3. At the request of HSE, the site had commissioned an occupational hygiene survey, including exposure measurement, approximately 1 year prior to the visit. The measured exposures on that occasion were slightly higher, but still did not breach the WEL. The OH consultant’s report made several recommendations regarding improved exposure control, but the company had not actioned these effectively.
Measured nitrosamine exposures on the day of the visit ranged from not detected (<0.01 µg/m3) to 0.25 µg/m3. The main nitrosamine detected was NMOR, with NDMA being detected in some samples at lower concentrations.
20

The main deficiencies at the site included the absence of a written COSHH assessment covering the processes generating rubber fume, and the absence of LEV on some equipment. Where it did exist, LEV was poorly maintained and operator training in its use was inadequate.
Site 5. The company operate from a single industrial unit. Approximately 25 workers are employed on the site, with approximately 15 of these potentially exposed to rubber fume. The company manufacture a variety of products, mainly using continuous curing extrusion lines and compression moulding equipment. There is no compounding on site, and hence no exposure to rubber process dust.
All continuous curing extrusion lines are fitted with extracted enclosures around the curing area. These were well designed and would be expected to provide adequate exposure control. The site have fluidised bed (Ballotini) microwave and salt bath curing equipment. Salt baths in particular have been implicated in generating nitrosamines. The moulding presses were not fitted with LEV. Measured rubber fume exposures on the day of the survey were all at or below the limit of detection (0.1mg/m3). Nitrosamine exposures ranged from 0.07 µg/m3 to 0.75 µg/m3. NDMA was the main nitrosamine detected, with NMOR and NDBA also detected in some samples. The compression moulding machines were not used on the day of the visit, hence exposures could not be assessed for operating this equipment.
The main deficiencies at this site were the absence of a written COSHH assessment for processes generating rubber fume (although the company had employed the services of an external H&S consultant at the time of the visit to remedy this) and the absence of LEV on the moulding presses. The company had exposure monitoring data for the moulding presses from their use at a previous site without LEV which indicated that exposures significantly in excess of the rubber fume WEL had been measured for workers operating this equipment.
Site 6. This company operate from a single site manufacturing a variety of rubber articles. Approximately 25 people are employed on the site, with around 15 of these potentially exposed to rubber fume. The site houses a number of continuous curing extrusion lines (not salt baths). Other items are made by cold extrusion with autoclave curing, or by compression moulding.
The continuous curing lines are fitted with extracted enclosures around the curing area. These were well designed and would be expected to provide adequate exposure control. Neither the autoclaves nor the compression moulding machines are fitted with LEV. Measured rubber fume exposures on the day of the survey ranged from not detected to 0.5 mg/m3. N-nitrosamine exposures ranged from 0.1 µg/m3 to 0.15 µg/m3. NMOR was the predominant nitrosamine, with lesser amounts of NDMA and NDBA detected.
The main deficiencies at this site were the absence of LEV on the moulding presses and autoclaves, the absence of a written COSHH assessment for processes generating rubber fume and the absence of exposure monitoring.
Site 7. This company operate from a single site. They are rubber compounders, making a range of rubber compounds for a variety of customers. There is no curing of the compounded rubber on site, and hence no exposure to rubber fume.
21

There are approximately 70 people on site, of which 63 are potentially exposed to rubber process dust. Exposures were measured for 8 individuals, these ranged from not detected (0.1 mg/m3 ) to 3.0 mg/m3, 8 hour TWA. LEV was applied to most dusty processes, but was not present in some ingredient weighing areas. Significant dermal exposure was noted at this site. Measured nitrosamine exposures ranged from not detected to 2 µg/m3. NMOR was the predominant nitrosamine detected, with smaller amounts of NDMA and NDBA. Significant nitrosamine exposures have not previously been observed during rubber compounding. The source of nitrosamines at this site was unclear and would require further investigation.
The main deficiencies at this site were the absence of LEV on certain tasks, the absence of a current thorough maintenance, exam and test on the LEV, inconsistent and poorly managed use of RPE and poor control of dermal exposures.
Site 8. This was a reactive site visit, conducted in early 2005. The company compound their own rubber, then manufacture finished products using compression moulding. Approximately 30 workers were potentially exposed to rubber fume, four were exposed to rubber process dust.
LEV was applied to dusty processes in the powder weighing and mixing areas. The mixer was of the enclosed, ‘Banbury’ type. The engineering controls in these areas were judged to be reasonably effective in capturing dust. Rubber process dust exposures measured on the day of the survey ranged from 0.81 mg/m3 to 2.04 mg/m3.
LEV was applied to most moulding presses and cooling areas, although it was absent from some presses. The LEV did not adequately capture fume on certain moulding operations. Rubber fume exposures measured on the day of the survey ranged from not detected to 0.76 mg/m3. Three (from 6) of the measured exposures were in excess of the UK WEL.
Site 9. This was a reactive site visit, conducted in November 2004. The company employ 160 people on site, of which 60 are potentially exposed to rubber fume, including 20 females. Various products are manufactured using both compression moulding and injection moulding. There are approximately 60 moulding presses on the site, most of which were fitted with LEV. Rubber fume exposures were measured for 26 individuals, over 2 days. Measured 8 hour TWA exposures ranged from not detected to 1.75 mg/m3 Sixteen results were below the limit of detection of the analytical method (approximately 0.1 mg/m3). Three exposures were in excess of the WEL, these were attributed to poor maintenance of LEV systems, some of which were visibly leaking fume into the workroom as a result of loss of integrity.
Site 10. This was a reactive site visit, conducted in February 2007. The company are an SME , employing less than 10 workers, manufacturing speciality items using compression moulding equipment. LEV was installed, but certain tasks where fume was evolved were performed outside it’s influence, rendering the LEV ineffective. Rubber fume exposures for workers operating the moulding equipment (n=2) were in the range 0.2 to 0.3 mg/m3.
Site 11. This was a reactive site visit, conducted in September 2007. The company are an SME, employing 12 staff, compounding rubber. Some equipment has LEV, some not. Rubber process dust exposures were measured for 8 from 9 potentially exposed workers. These ranged from 0.34 mg/m3 to 19.3 mg/m3. One exposure exceeded the WEL. Although RPE was available, it’s was only used by a minority of workers. No information is available on the potential for dermal exposure.
22

Site 12. This was a reactive site visit, conducted in July 2005. The company employ 750 workers on site, of which 60 are potentially exposed to rubber fume, including 20 females. The company manufacture rubber seals for the automotive industry, using continuous curing extrusion lines and compression moulding. Extrusion lines were fitted with LEV, moulding equipment was not. Rubber fume exposures were measured for 9 individuals, exposures ranged from 0.07 mg/m3 to 0.36 mg/m3.
23

Appendix 2 – Nitrosamine analysis methodology.
Standard solutions were prepared containing nine N-nitrosamines, NDMA, NMEA, NDEA, NDPA, NDBA, NMOR, NPYR, NPIP and NDPhA, in a 9:1 mixture of dichloromethane and methanol. The concentration range was 0 – 1000 ng/ml (with the lowest standard at 8 ng/ml).
The samples taken for the 1998-2001 nitrosamine survey were analysed using gas chromatography with a thermal energy analyser detection system. This method is described fully in a separate HSL report (Pengelly 1996).
For the 2007 DRP survey, the nitrosamine samples were analysed using gas chromatography coupled to mass spectrometric detection. The methodology is described fully below.
In order to achieve the required sensitivity, a single ion monitoring (SIM) mass spectrometry (MS) method was used. It was also necessary to devise a GC temperature program capable of separating the most volatile component (NDMA) from the solvent front. Details of the chromatographic and SIM parameters are given in Tables 1 and 2.
Table 1: Nitrosamine Analysis by GC-MS - Chromatographic Parameters
Column Type Hewlett Packard HP-5 Temperature Ramp 1 50°C/minute
Column Dimensions 25 m × 0.32 mm × 1 µm Temperature 2 100°C
Carrier Gas Helium Time at Temperature 2 2 minutes
Gas Flow Rate 2 ml/min Temperature Ramp 2 5°C/minute
Split Flow 20 ml/min Temperature 3 120°C
Split Ratio 10:1 Time at Temperature 3 0 minutes
Injector Temperature 250°C Temperature Ramp 3 20°C/minute
Injection Volume 5 µl Temperature 4 200°C
Temperature 1 50°C Time at Temperature 4 3.5 minutes
Time at Temperature 1 0.50 minutes Total Run Time 15 minutes
Table 2: Nitrosamine Analysis by GC-MS - SIM Parameters
Component SIM Ions SIM Window (RT) Analysis Ion
NDMA 30; 42; 43; 57; 74; 88 2.0 – 3.2 mins (2.29) 74
NMEA 30; 42; 43; 57; 74; 88 2.0 – 3.2 mins (2.76) 88
NDEA 42; 44; 56; 57; 102 3.2 – 5.0 mins (3.40) 102
NPYR 41; 42; 56; 68; 69; 70; 100; 113; 116; 130 4.5 – 6.5 mins (6.07) 100
NMOR 41; 42; 56; 68; 69; 70; 100; 113; 116; 130 4.5 – 6.5 mins (6.11) 116
NDPA 41; 42; 56; 68; 69; 70; 100; 113; 116; 130 4.5 – 6.5 mins (6.13) 130
NPIP 41; 55; 56; 114 6.5 – 8.0 mins (6.99) 114
NDBA 41; 56; 99; 116; 141; 158 8.0 – 10.0 mins (9.56) 116 + 158
An example chromatogram (at a concentration of 50 ng/ml) obtained using the conditions given in Tables 1 and 2 is shown in Figure 1. For all eight components, the peak area data give a good linear response up to a concentration of around 500 ng/ml (when the slopes begin to increase).
24

At concentrations above 1000 ng/ml (1 µg/ml) several components begin to show evidence of overloading (poor peak shape, peak splitting, etc). Peak areas in the ‘blank’ solution were all less than 2 ng/ml.
20000
18000
NM
EA16000
14000
12000
10000
8000
6000
4000
2000
0
ND
MA
ND
EA
NPY
R/N
MO
R/N
DPA
NPI
P
ND
BA
SIM
Res
pons
e
2 3 4 5 6 7 8 9 10
Retention Time (mins)
Figure 1: N-Nitrosamines by GC-MS (50 ng/ml Standard)
The "real" samples contained numerous other interfering components, mainly at much higher concentrations. Some of the samples were therefore re-run in SCAN mode to obtain full spectra and identify both the interfering components and, where possible, to provide confirmation of the nitrosamine peaks (NB: to obtain a recognisible mass spectrum typically requires a concentration of around 50 – 100 ng/ml (which is around 5 – 10× the typical detection limit of 5 – 10 ng/ml)). In some samples the "nitrosamine" peak could not be confirmed and these results were therefore marked out as being "suspect" in the results sheets.
25
7 REFERENCES
Speigelhalder B and Preussmann R. ‘Occupational nitrosamine exposure. 1. Rubber and tire industry’. Carcinogenesis, vol 4, No. 9, pp 1147-1152, 1983.
D P Rounbehler and J M Fajen. 'N-Nitroso compounds in the factory environment'. National Institute for Occupational Safety and Health, Cincinnati, Ohio 45226, USA. NIOSH Technical Report (Publication No. 83-114), 1983.
AA Dost , D Redman and G Cox. ‘Exposure to rubber fume and rubber process dust in the general rubber goods, tyre manufacturing and retread industries.’ Annals of Occupational Hygiene, vol 44, No. 9, 2000.
IOM 2006. ‘Trends in inhalation exposure. Mid 1980s till present’. HSE research report 460.
Frank De Vocht, Roel Vermeulen, Igor Bustyn, Woltek Sabala, Abid Dost, Dirk Taeger, Ulf Bergendorf, Kurt Straif, Paul Swuste, Hans Kromhout. ‘Exposure to inhalable dust and it’s cyclohexane soluble fraction since 1970s in the rubber manufactuiring industry in the European Union.’ Occupational Environmental medicine, online edition, October 2007.
C Keen, R Guiver, H Chambers. ‘Survey of occupational exposure to nitrosamines – interim report.’ HSL internal report OMS/2000/03.
Pengelly 1996. ‘Development of a method for measurement of airborne N-nitrosamines’. HSE internal report IR/L/SP/08/95.
EH40 2005. ‘Workplace exposure limits’. HSE publication EH40/2005, HSE Books, ISBN 07176-2977-5.
COSHH regulations 2002 (as amended). ‘Control of substances hazardous to health (fifth edition), Approved code of practice and guidance’. HSE publication L5, HSE Books, ISBN 07176-2981-3.
WATCH paper /2006/7 – Annex 2. Disease Reduction programme : cancer project. The nature and extent of use of, and occupational exposure to, chemical carcinogens in current UK workplaces.
26

27

Published by the Health and Safety Executive 07/10

Health and Safety Executive
A small survey of exposure to rubber process dust, rubber fume and N-nitrosamines
This work was carried out in support of HSE’s FIT3 Disease Reduction Programme Cancer Project’s aim to develop a strategy to reduce the incidence of occupational cancer in Great Britain.
Earlier, research had identified a need for current intelligence on the standard of exposure control being achieved in the UK General Rubber Goods (GRG) industry. The primary objectives of the work were to:
n gather information on inhalation exposures to rubber process dust, rubber fume and nitrosamines;
n assess exposure control strategies; and
n assess potential for dermal exposure.
This study was unable to identify a correlation between nitrosamine exposures and rubber fume exposures at the 7 sites visited. The wide variety of rubber types, curing accelerators and curing conditions mean that nitrosamine exposures may not be predicted from rubber fume exposures.
This study reports that:
n although rubber fume exposures were typically below the WEL, LEV was not applied in accordance with guidance already issued in HSE’s ‘COSHH essentials for rubber manufacturers’; and
n dermal exposure risks at rubber compounding are not adequately controlled and recommends dermal exposure control guidance be added to HSE’s ‘COSHH essentials for rubber manufacturers’ to address this issue.
This report and the work it describes were funded by the Health and Safety Executive (HSE). Its contents, including any opinions and/or conclusions expressed, are those of the author alone and do not necessarily reflect HSE policy.
RR819
www.hse.gov.uk