a six-stage workflow for robust application of … · ©2015 genentech stage 6: supporting study...
TRANSCRIPT
©2015, Genentech
A Six-Stage Workflow for Robust Application of
Systems Pharmacology
Kapil Gadkar
AAPS
November, 2016

©2015 Genentech
Acknowledgements
Genentech, South San Francisco
Saroja Ramanujan – QSP Group Lead
Iraj Hosseini
Dan Kirouac
PCSK9 QSP working group
Asthma QSP working group
External Collaborators & Advisors
Piet van der Graaf
Don Mager
Doug Lauffenburger
©2015 Genentech
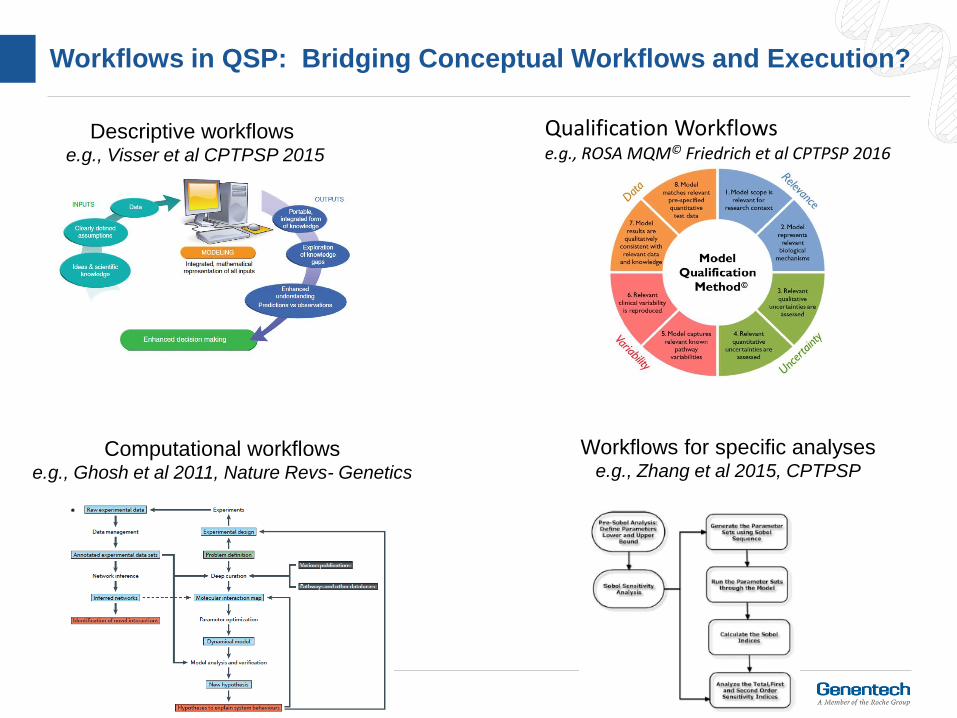
Workflows in QSP: Bridging Conceptual Workflows and Execution?
Descriptive workflows e.g., Visser et al CPTPSP 2015
Qualification Workflowse.g., ROSA MQM© Friedrich et al CPTPSP 2016
Computational workflowse.g., Ghosh et al 2011, Nature Revs- Genetics
Workflows for specific analysese.g., Zhang et al 2015, CPTPSP
©2015 Genentech
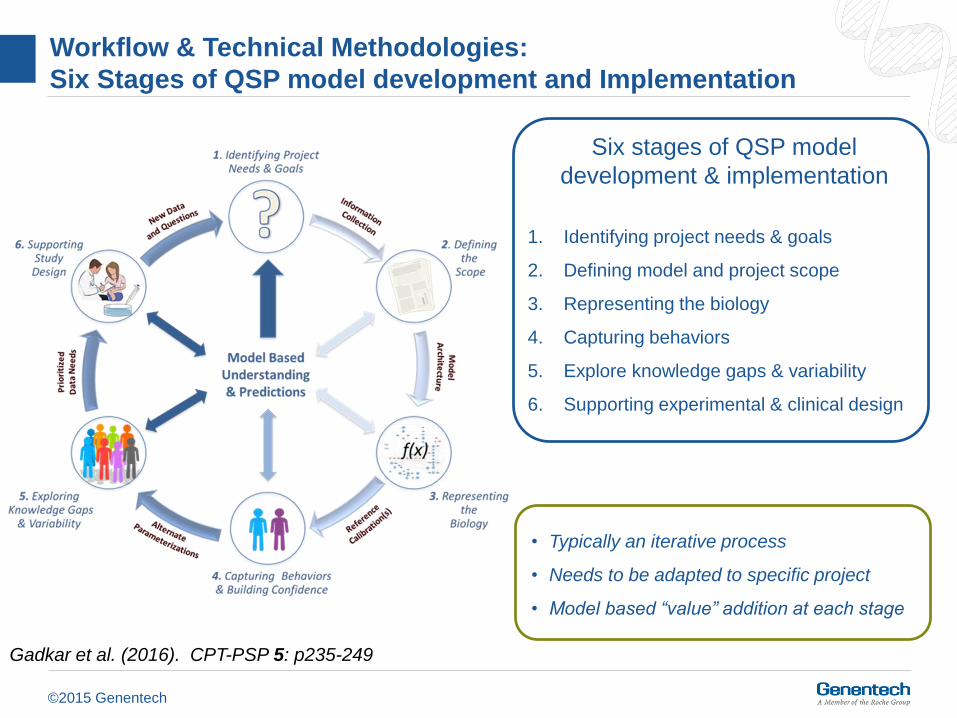
Workflow & Technical Methodologies:
Six Stages of QSP model development and Implementation
Six stages of QSP model
development & implementation
1. Identifying project needs & goals
2. Defining model and project scope
3. Representing the biology
4. Capturing behaviors
5. Explore knowledge gaps & variability
6. Supporting experimental & clinical design
Gadkar et al. (2016). CPT-PSP 5: p235-249
• Typically an iterative process
• Needs to be adapted to specific project
• Model based “value” addition at each stage

©2015 Genentech
Frequently Asked Questions of QSP models
• How can you build a model of biology we don’t quite understand? What about competing hypotheses? Conflicting data?
• With enough parameters you can fit an elephant. The model is underspecified and the parameters are not identifiable.
• The population/disease is heterogeneous? How can you represent this in one model?
• How do we evaluate and interpret this work? How robust are the predictions?
• The model is too complex to explain to collaborators
• The model predictions were wrong. Therefore the model is not useful
5

©2015 Genentech
Stage 1: Clear understanding of the project needs & goals is
primary to the ultimate success of any QSP effort
Considerations & Activities
• Careful evaluation of problem context
and specification of the needs to be
met
• Clear understanding of the decisions
that will be potentially impacted
• Deadlines & time frame for decisions
and milestones
• Evaluation of whether QSP is the
right approach
• Identification and interaction with key
stakeholders and collaborators

©2015 Genentech
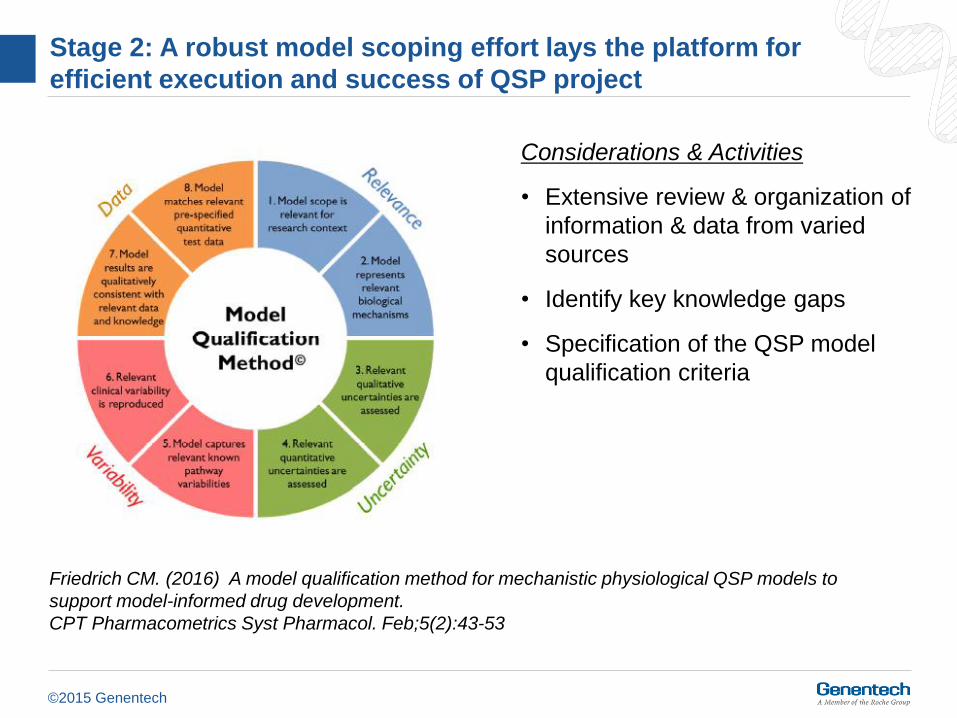
Stage 2: A robust model scoping effort lays the platform for
efficient execution and success of QSP project
Considerations & Activities

©2015 Genentech
Stage 2: A robust model scoping effort lays the platform for
efficient execution and success of QSP project
Considerations & Activities
• Extensive review & organization of
information & data from varied
sources
• Identify key knowledge gaps
KOLsLiterature & Abstracts
Databases (eg)
“in-house” data
General Understanding
Disease biology and
clinical experts
Review papers
Mechanistic understanding
and data
Disease biology & target
experts
in vitro and in vivo studies
PathwaysMolecular
In vitro andin vivo
studies
Clinical understanding
and data
Clinical experts
Clinical reports and study results
TrialsSummary &
Patient-level data
Modeling Approaches
QSP, PKPD, bioinformatics, and statistics
expertsPrior art
Model repositories
PKPD &Statistical models
©2015 Genentech
Stage 2: A robust model scoping effort lays the platform for
efficient execution and success of QSP project
Considerations & Activities
• Extensive review & organization of
information & data from varied
sources
• Identify key knowledge gaps
• Specification of the QSP model
qualification criteria
Friedrich CM. (2016) A model qualification method for mechanistic physiological QSP models to
support model-informed drug development.
CPT Pharmacometrics Syst Pharmacol. Feb;5(2):43-53
©2015 Genentech
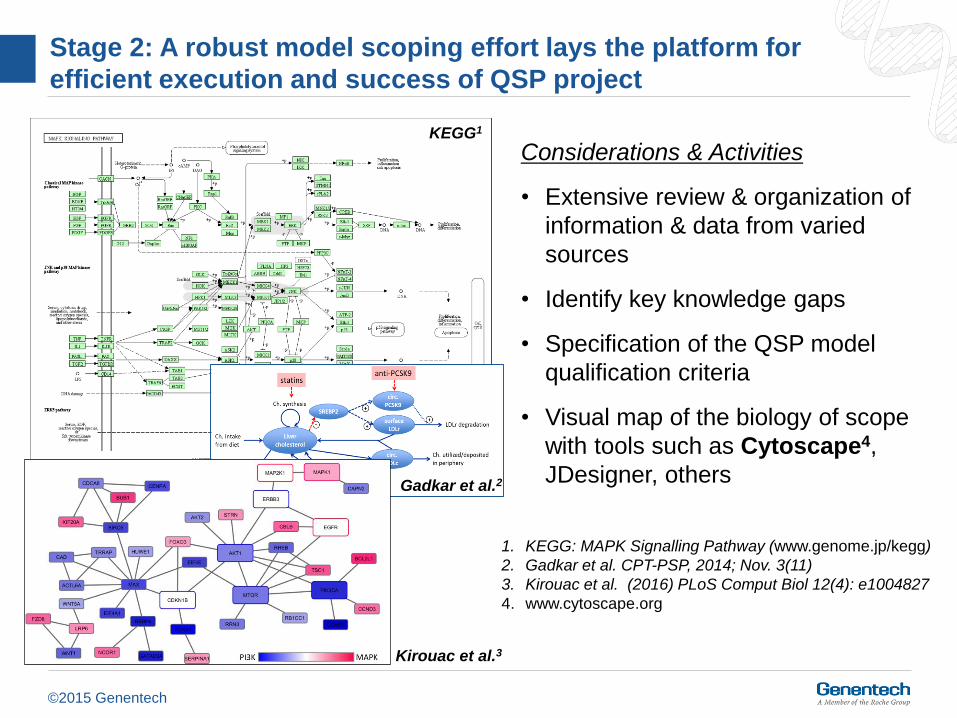
Stage 2: A robust model scoping effort lays the platform for
efficient execution and success of QSP project
Considerations & Activities
• Extensive review & organization of
information & data from varied
sources
• Identify key knowledge gaps
• Specification of the QSP model
qualification criteria
• Visual map of the biology of scope
with tools such as Cytoscape4,
JDesigner, others
1. KEGG: MAPK Signalling Pathway (www.genome.jp/kegg)
2. Gadkar et al. CPT-PSP, 2014; Nov. 3(11)
3. Kirouac et al. (2016) PLoS Comput Biol 12(4): e1004827
4. www.cytoscape.org
KEGG1
Gadkar et al.2
Kirouac et al.3

©2015 Genentech
Stage 1 & 2: QSP Model Verification, Validation & Qualification:
considerations at this stage
• Are the questions asked of the QSP model well defined?
• Is there sufficient data collected (or hypotheses generated) to develop the QSP model?
• Are the KOLs in agreement with the details (or lack thereof) of the visual map?

©2015 Genentech
Stage 3: Selection from various options for mathematical
representation of the biology of interest is case specific
Considerations & Activities
©2015 Genentech
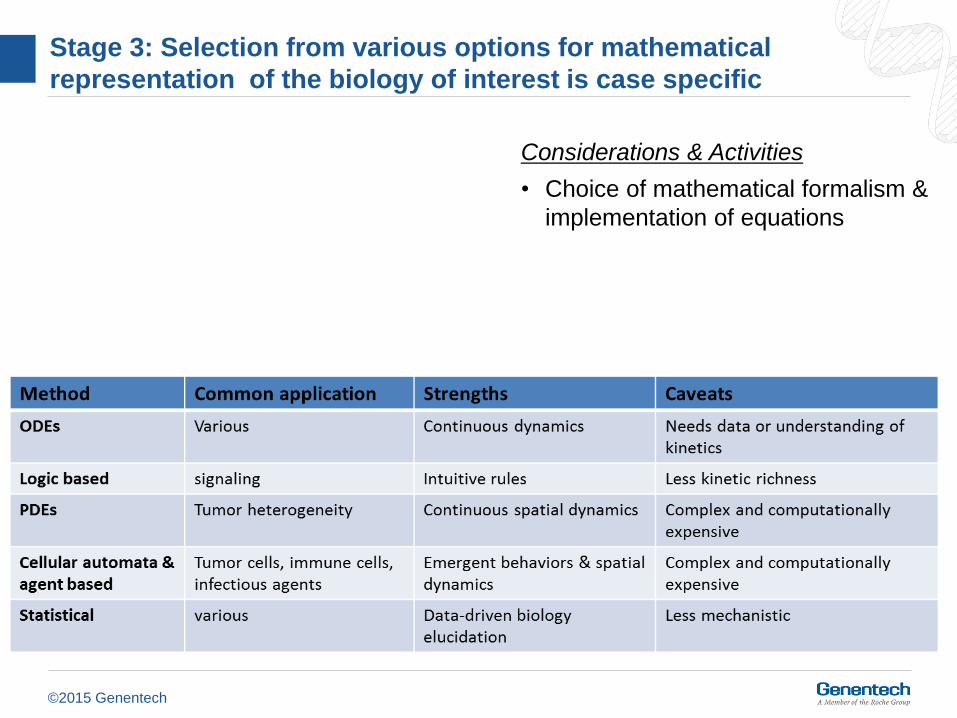
Stage 3: Selection from various options for mathematical
representation of the biology of interest is case specific
Considerations & Activities
• Choice of mathematical formalism &
implementation of equations
Gadkar et al, CPT-PSP 2016

©2015 Genentech
Stage 3: Selection from various options for mathematical
representation of the biology of interest is case specific
Considerations & Activities
• Choice of mathematical formalism &
implementation of equations
• Alternate model structures and/or
topologies
Julio Saez-Rodriguez et al. “Comparing signaling networks between normal and transformed hepatocytes using
discrete logical models” Cancer Res 2011;71:5400-5411
©2015 Genentech
Stage 3: QSP Model Verification, Validation & Qualification:
considerations at this stage
• Is the model over-parameterized? Can the mathematical complexity be reduced?
• Have alternate hypotheses that can impact the answers to the questions asked of the model been considered?

©2015 Genentech
Workflow & Technical Methodologies:
Six Stages of QSP model development and Implementation
Stage 4: Capturing “Reference”
behavior
• Overview of tools
Stage 5: Virtual populations (Vpops)
as a means to explore variability &
uncertainty
• A methodology for developing
Vpops
Case studies demonstrating
application of the tools and
workflows
Gadkar et al, CPT-PSP 2016
©2015 Genentech
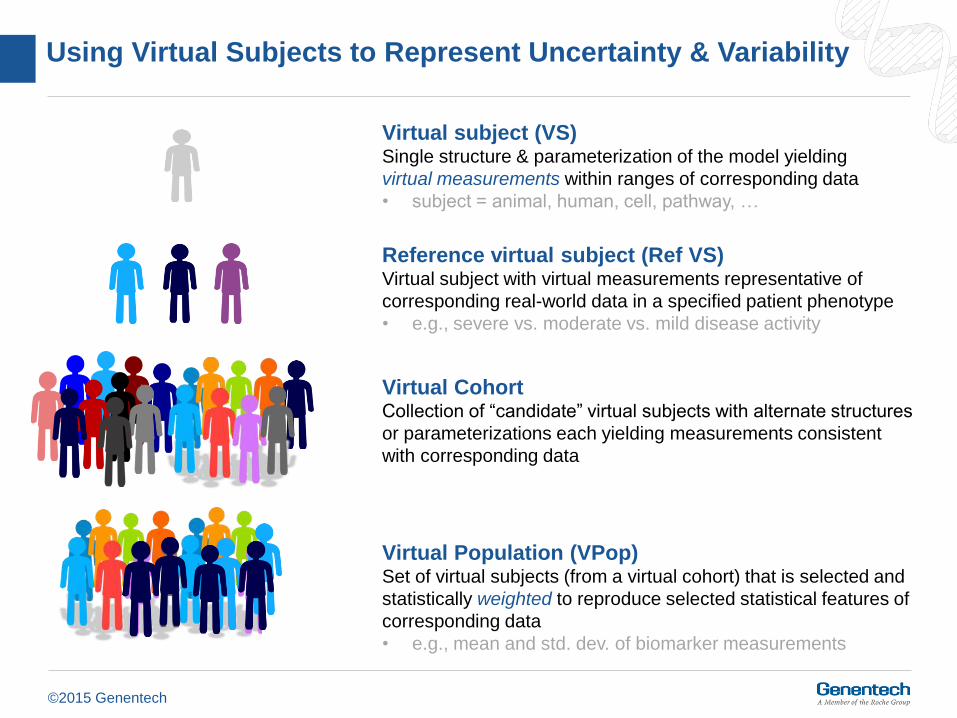
Using Virtual Subjects to Represent Uncertainty & Variability
Reference virtual subject (Ref VS)Virtual subject with virtual measurements representative of
corresponding real-world data in a specified patient phenotype
• e.g., severe vs. moderate vs. mild disease activity
Virtual CohortCollection of “candidate” virtual subjects with alternate structures
or parameterizations each yielding measurements consistent
with corresponding data
Virtual Population (VPop)Set of virtual subjects (from a virtual cohort) that is selected and
statistically weighted to reproduce selected statistical features of
corresponding data
• e.g., mean and std. dev. of biomarker measurements
Virtual subject (VS)Single structure & parameterization of the model yielding
virtual measurements within ranges of corresponding data
• subject = animal, human, cell, pathway, …

©2015 Genentech
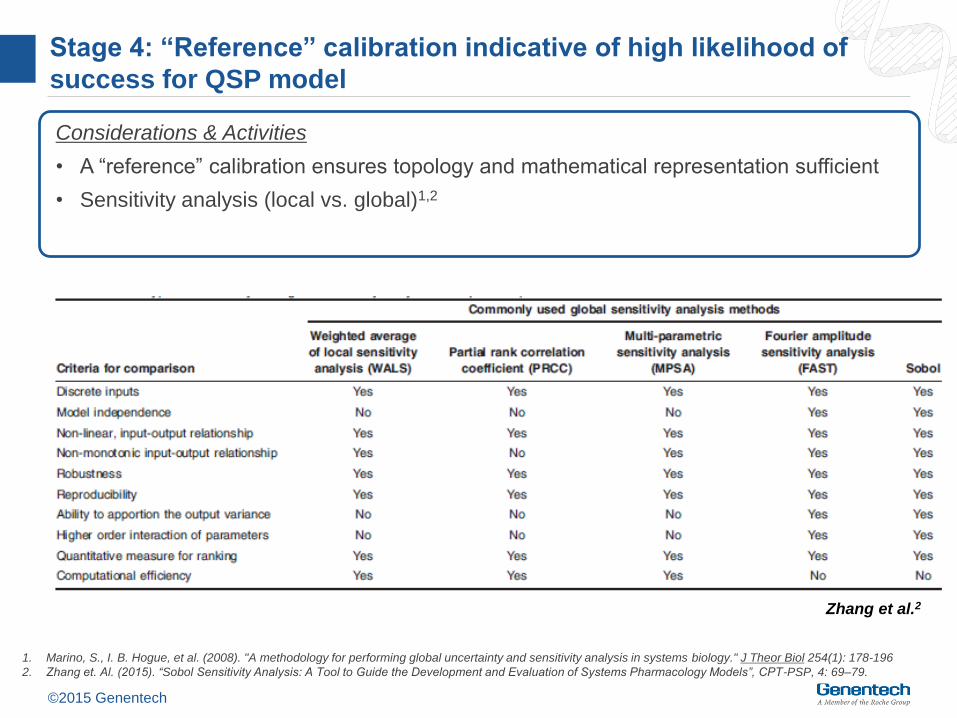
Stage 4: “Reference” calibration indicative of high likelihood of
success for QSP model
Considerations & Activities
• A “reference” calibration ensures topology and mathematical representation sufficient
©2015 Genentech
Stage 4: “Reference” calibration indicative of high likelihood of
success for QSP model
Considerations & Activities
• A “reference” calibration ensures topology and mathematical representation sufficient
• Sensitivity analysis (local vs. global)1,2
1. Marino, S., I. B. Hogue, et al. (2008). "A methodology for performing global uncertainty and sensitivity analysis in systems biology." J Theor Biol 254(1): 178-196
2. Zhang et. Al. (2015). “Sobol Sensitivity Analysis: A Tool to Guide the Development and Evaluation of Systems Pharmacology Models”, CPT-PSP, 4: 69–79.
Zhang et al.2

©2015 Genentech
Stage 4: “Reference” calibration indicative of high likelihood of
success for QSP model
Considerations & Activities
• A “reference” calibration ensures topology and mathematical representation sufficient
• Sensitivity analysis (local vs. global)1,2
• Parameter estimation via optimization3,4
Optimization
approach
Example
algorithms
Strengths Caveats Example prior
applications
Local Levenberg-MarquardtSimplicity,
Computational efficiency
Local minimum only;
Requires convex, smooth
objective function
Multiple
Deterministic
GlobalBranch and Bound Guaranteed global min
Computationally
expensiveMetabolic systems
Stochastic
Global
Simulated Annealing,
Genetic Algorithms,
Evolutionary Programming,
Evolutionary Strategies,
Particle Swarm,
Scatter Search
Computational efficiency;
Near global minimum
Global minimum not
guaranteed
Blood coagulation
Signal transduction
Hybrid Combinations of the aboveLeverages strengths of local
and global approaches
Fewer and less widely
tested algorithms
available
Lipid metabolism
1. Marino, S., I. B. Hogue, et al. (2008). "A methodology for performing global uncertainty and sensitivity analysis in systems biology." J Theor Biol 254(1): 178-196
2. Zhang et. Al. (2015). “Sobol Sensitivity Analysis: A Tool to Guide the Development and Evaluation of Systems Pharmacology Models”, CPT-PSP, Feb.
3. Sun, J., V. Palade, et al. (2014). "Biochemical systems identification by a random drift particle swarm optimization approach." BMC Bioinformatics 15 Suppl 6: S1
4. Rodriguez-Fernandez et al. (2006). "Novel metaheuristic for parameter estimation in nonlinear dynamic biological systems." BMC Bioinformatics 7: 483

©2015 Genentech
Considerations
• Defining the objective function is non-trivial & critical for efficient Reference Subject calibration
• Iteration on QSP model representation is critical at this stage: (i) modifications to mathematical
representation; (ii) expansion/reduction of biology included; (iii) alternate hypothesis testing
• Developing a suite of algorithms/tools specific for to QSP models is of high value
Physiological outcomes
“Acceptance” Criteria
y1
y2
y3
y4
y5
y6
y7
y8
y9Parameter space, p
Structural Model
p1
p2
pn
Stage 4: Workflow and considerations for Reference Subject
calibration
Virtual Subjects
Reference
Virtual
Subject
Invalid
Virtual
Subject
©2015 Genentech
Stage 4: QSP Model Verification, Validation & Qualification:
considerations at this stage
• Are the model parameters that are estimated within biological feasible ranges?
• Does the “Reference” virtual subject reproduce expected behaviors?
• Criteria of what is “expected” needs to be defined during project scoping
• Does the “Reference” virtual subject reproduce behaviors that were not used for model calibration?

©2015 Genentech
Stage 5: Exploration of variability and knowledge gaps an extremely
important aspect of QSP-based work
1.Gutenkunst, R. N., J. J. Waterfall, et al. (2007). "Universally sloppy parameter sensitivities in systems biology models." PLoS Comput Biol 3(10): 1871-1878.
Considerations
• Kinds of uncertainty & variability include:
• Insufficient or imperfect mechanistic knowledge
• Quantitative uncertainty in the available data
• Known inter-subject or intra-subject (spatial or time) variability
• Knowledge gaps typically explored via alternate model structures or alternate
parameterizations; each instance a Virtual Subject
• Multiple Virtual Subjects may “behave” similarly to the known data– i.e, non-unique
• Collective available data utilized to develop the Virtual Population
• Testing against “new” data establishes predictive capability
• “Typical” QSP models are “sloppy”1: focus on ranges of predictions rather than
parameter values
Outcomes/learnings
• Robust QSP-based findings grounded in quantitative biology

©2015 Genentech
Workflow for developing a Virtual Population
Developing the Virtual Cohort

©2015 Genentech
Workflow for developing a Virtual Population
Virtual Cohort
Virtual Population
Statistical weighting
Predictive SimulationsClinical Statistics
Weighting algorithm
Virtual Cohort
Developing the Virtual Cohort
Developing the Virtual Population
©2015 Genentech
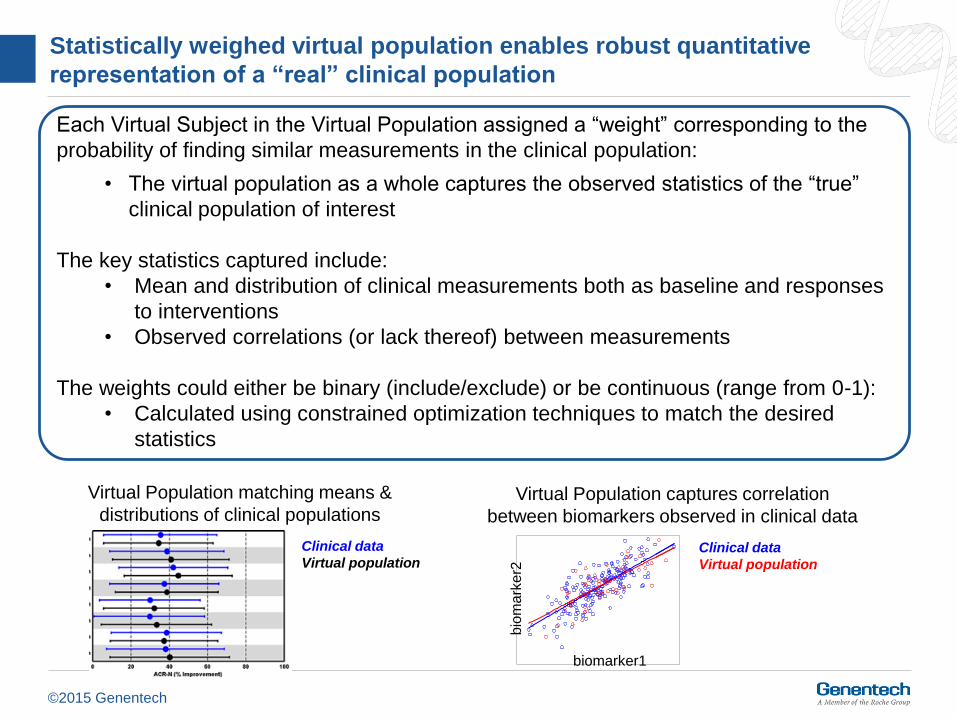
Statistically weighed virtual population enables robust quantitative
representation of a “real” clinical population
Each Virtual Subject in the Virtual Population assigned a “weight” corresponding to the
probability of finding similar measurements in the clinical population:
• The virtual population as a whole captures the observed statistics of the “true”
clinical population of interest
The key statistics captured include:
• Mean and distribution of clinical measurements both as baseline and responses
to interventions
• Observed correlations (or lack thereof) between measurements
The weights could either be binary (include/exclude) or be continuous (range from 0-1):
• Calculated using constrained optimization techniques to match the desired
statistics
Virtual Population matching means &
distributions of clinical populations
Clinical data
Virtual population
Virtual Population captures correlation
between biomarkers observed in clinical data
Clinical data
Virtual population
biomarker1
bio
ma
rke
r2

©2015 Genentech
Stage 5: QSP Model Verification, Validation & Qualification:
considerations at this stage
• Is the “known” variability in the underlying biology & measured outcomes captured in the virtual population?
• Does the virtual population reproduce with statistical rigor outcomes/behaviors that were not used for development?
©2015 Genentech
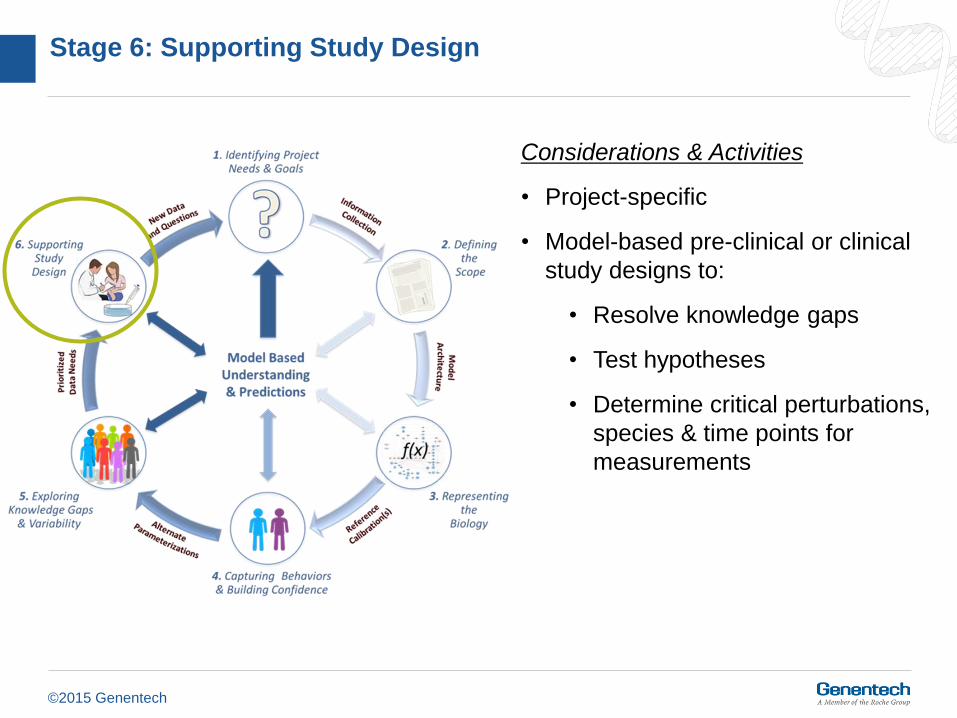
Stage 6: Supporting Study Design
Considerations & Activities
• Project-specific
• Model-based pre-clinical or clinical
study designs to:
• Resolve knowledge gaps
• Test hypotheses
• Determine critical perturbations,
species & time points for
measurements
©2015 Genentech
Stage 6: QSP Model Verification, Validation & Qualification:
considerations at this stage
• Are model based predictions confirmed with new data?

©2012, Genentech
QSP Case StudyAnti-PCSK9

©2015 Genentech
Scientific background: mechanism of action of anti-PCSK9
Peterson & Young, J. Lipid Res. 2008. 49:
1595–1599
Anti-PCSK9 Reduces LDLR degradation,
thereby increasing LDL clearance
PCSK9
LDLR
LDL
In the absence of PCSK9, LDLR cycles back and forth from the cell
surface to the endosome, internalizing multiple LDL particles
In the presence of PCSK9, LDLR is degraded along
with LDL after internalization
LDLc response to a single dose of anti-PCSK9 (Phase 1 study)
Nageshwar R. Budha et al; 7th Noordwijkerhout Symposium on PKPD and Systems Pharmacology 2014

©2015 Genentech
Stage 1: Questions Asked of QSP for anti-PCSK9 Program
?
Mechanistic Quantification
Complex pathway feedback?LDLr-independent LDL clearance?
Untested Population Responses(no clinical data)
Familial hypercholesterolemics?Asian population
Phase II & III Predictions(insufficient Phase I data to resolve)
Impact of baseline LDL?Impact of endogenous PCSK9?
Impact of statin background? Competitive evaluation?
Biomarker Investigation(insufficient Phase I data to resolve)
Baseline measurementsPhase II proposed biomarkers

©2015 Genentech
Stage 2 & 3: Robust scoping effort determines the biology to be
included in the QSP model & collection of diverse data sets for
development
33
Model schematic developed from current knowledge & input from biology experts
Biological Mechanisms & Behaviors
• Untreated hepatic cholesterol balance
• LDLr synthesis/degradation including
regulation by PCSK9
• LDL synthesis and uptake via LDLr
• SREBP2 regulation of PCSK9 & LDLr
expression
• Anti-PCSK9 binding of PCSK9
• Statin inhibition of cholesterol synthesis
Available data
Preclinical data
• Impact of pcsk9 on LDLr in vitro
• Regulation of pcsk9 and LDLr via SREBP2 in vitro
• LDLr specific vs non-specific LDL clearance in
animal models
Patient populations
• pcsk9 & LDLc levels in dyslipidemia, familial
hypercholesterolemia
• Kinetics of hepatocyte cholesterol regulation,
apoB-100 particle dynamics, etc
Statin clinical data (Jupiter & TNT studies)
• Change in LDLc with statins
• Changes in pcsk9 levels on statins and correlations with other biomarkers
Anti-pcsk9 clinical data (Genentech Phase I study)
• Phase I clinical data for anti-pcsk9, total pcsk9, LDLc profiles for monotherapy and combo with statins
d[LDLr]
dt= f (SREBP2)- k1[PCSK9][LDLr]- k2[LDLr][LDLc]
Mathematical Formulation

©2015 Genentech
Stage 4: Anti-PCSK9 calibration & validation: predictions for multi-
dose anti-PCSK9 with and without statin background validated
against Phase I results
34
blue lines: individual subject clinical datared lines: model simulation of virtual patients (median & 10-90 percentile range)
Statin start
anti-pcsk9 first doseanti-pcsk9 first dosestatin stop
150 mg, multiple dose (validation)
aPCSK9 Tot PCSK9 LDL (%)
No statin Statin pre-start
LDL (%)
300 mg, single dose (anti-PCSK9 calibration & virtual patient selection)
©2015 Genentech
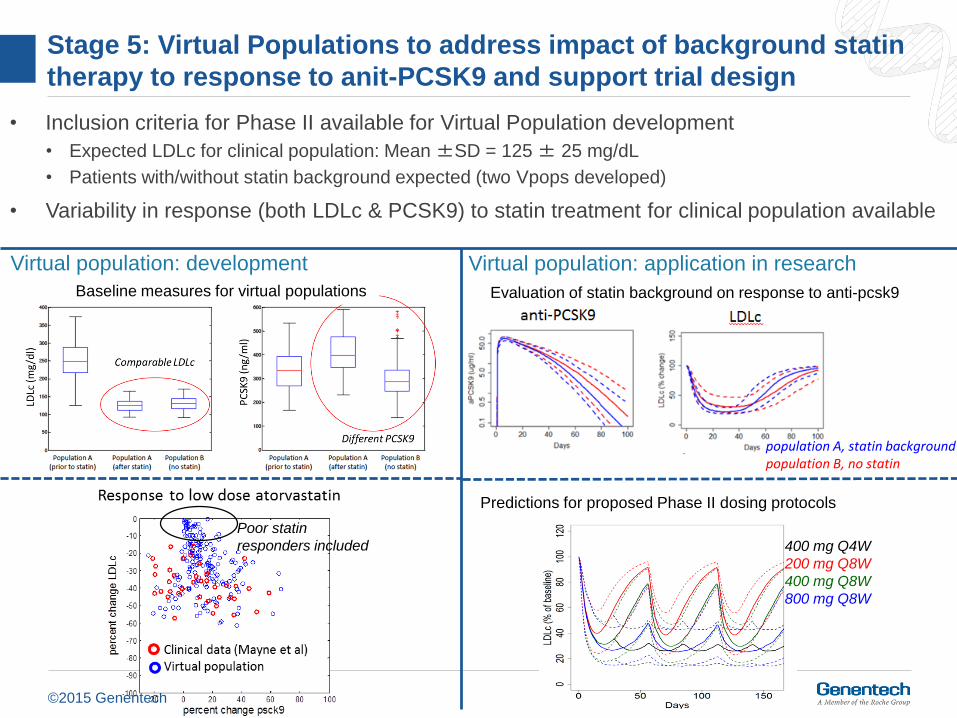
Stage 5: Virtual Populations to address impact of background statin
therapy to response to anit-PCSK9 and support trial design
• Inclusion criteria for Phase II available for Virtual Population development
• Expected LDLc for clinical population: Mean ±SD = 125± 25 mg/dL
• Patients with/without statin background expected (two Vpops developed)
• Variability in response (both LDLc & PCSK9) to statin treatment for clinical population available
Poor statin
responders included
Baseline measures for virtual populations
Virtual population: development Virtual population: application in research
400 mg Q4W
200 mg Q8W
400 mg Q8W
800 mg Q8W
Predictions for proposed Phase II dosing protocols
Evaluation of statin background on response to anti-pcsk9
population A, statin backgroundpopulation B, no statin

©2015 Genentech
Stage 5: Virtual Populations developed to evaluate response to anti-
PCSK9 for a specific patient sub-phenotype
• The most common genetic defects in Familial hypercholesterolemia (FH) patients are LDLr mutations
• Function LDLr activity in heterozygous FH is 10-25%
• Function LDLr activity in homozygous FH is <5%
• FH patients have high LDLc levels
• Correlations of baseline LDLc & PCSK9 levels
reported in literature (Raal et al. 2003)
Virtual population: development Virtual population: application in research
Altered in FH patients
• Range of clinical measures (LDLc, PCSK9) at baseline consistent with expected enrollment in potential clinical study
• QSP model predicts that response to anti-pcsk9 is compromised for FH subjects with LDLr activity less than 10% of normal
©2015 Genentech
Frequently Asked Questions of QSP models
• How can you build a model of biology we don’t quite understand? What about competing hypotheses? Conflicting data?
• With enough parameters you can fit an elephant. The model is underspecified and the parameters are not identifiable.
• The population/disease is heterogeneous? How can you represent this in one model?
• How do we evaluate and interpret this work? How robust are the predictions?
• The model is too complex to explain to collaborators
• The model predictions were wrong. Therefore the model is not useful
37
©2015 Genentech
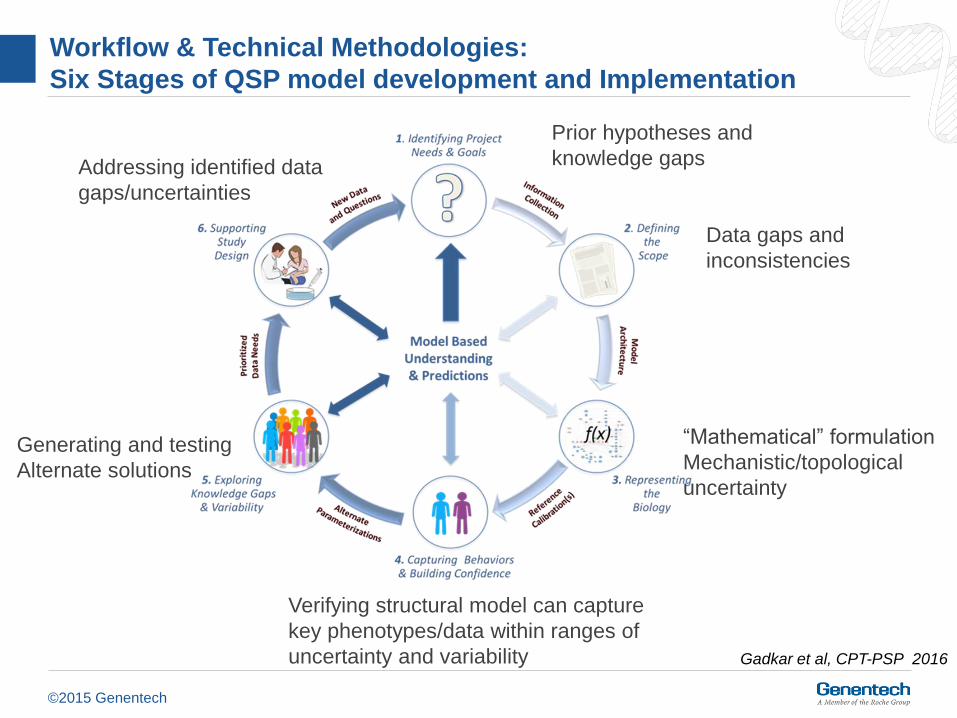
Workflow & Technical Methodologies:
Six Stages of QSP model development and Implementation
Gadkar et al, CPT-PSP 2016
Prior hypotheses and
knowledge gaps
Data gaps and
inconsistencies
“Mathematical” formulation
Mechanistic/topological
uncertainty
Verifying structural model can capture
key phenotypes/data within ranges of
uncertainty and variability
Generating and testing
Alternate solutions
Addressing identified data
gaps/uncertainties

©2012, Genentech
QSP Case StudyAsthma
©2015 Genentech
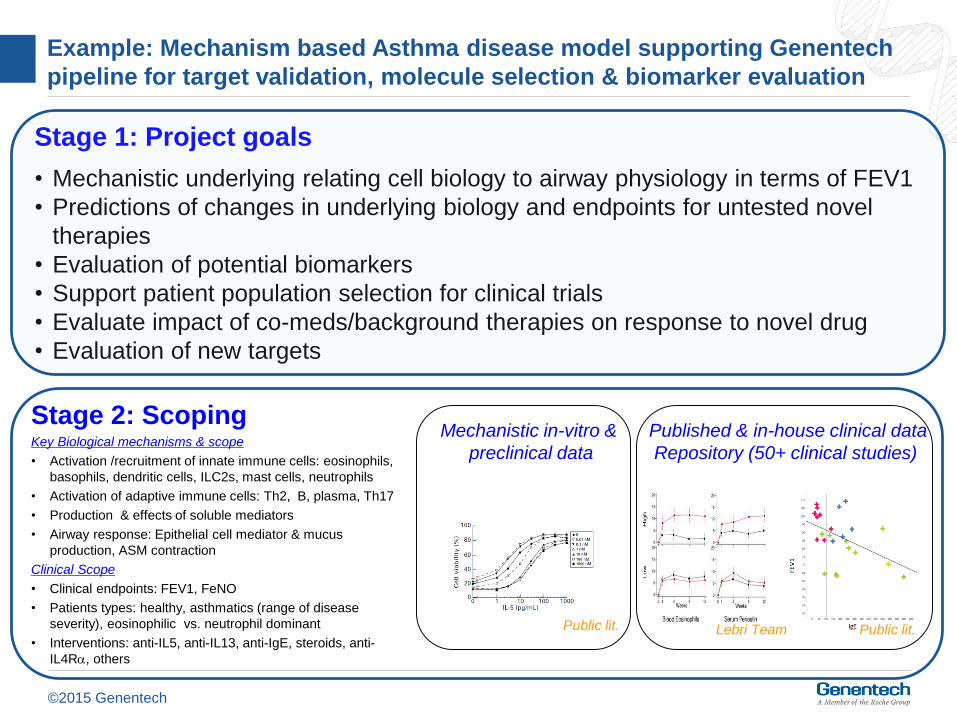
Stage 1: Project goals
• Mechanistic underlying relating cell biology to airway physiology in terms of FEV1
• Predictions of changes in underlying biology and endpoints for untested novel
therapies
• Evaluation of potential biomarkers
• Support patient population selection for clinical trials
• Evaluate impact of co-meds/background therapies on response to novel drug
• Evaluation of new targets
Example: Mechanism based Asthma disease model supporting Genentech
pipeline for target validation, molecule selection & biomarker evaluation
Stage 2: ScopingKey Biological mechanisms & scope
• Activation /recruitment of innate immune cells: eosinophils,
basophils, dendritic cells, ILC2s, mast cells, neutrophils
• Activation of adaptive immune cells: Th2, B, plasma, Th17
• Production & effects of soluble mediators
• Airway response: Epithelial cell mediator & mucus
production, ASM contraction
Clinical Scope
• Clinical endpoints: FEV1, FeNO
• Patients types: healthy, asthmatics (range of disease
severity), eosinophilic vs. neutrophil dominant
• Interventions: anti-IL5, anti-IL13, anti-IgE, steroids, anti-
IL4R, others
Mechanistic in-vitro &
preclinical data
Published & in-house clinical data
Repository (50+ clinical studies)
Public lit. Lebri Team Public lit.
©2015 Genentech
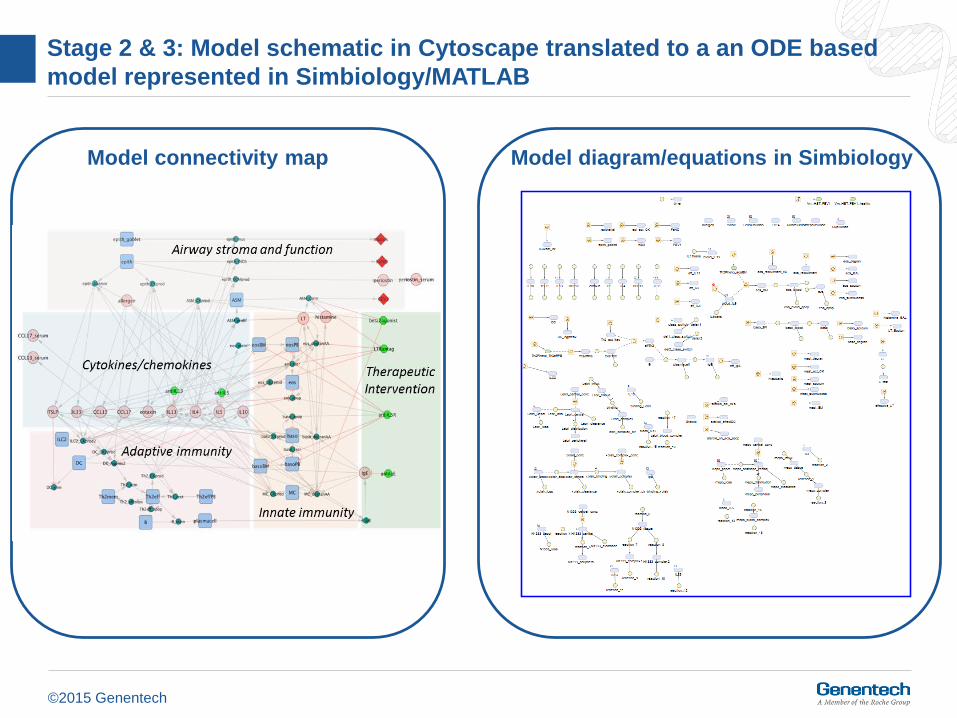
Stage 2 & 3: Model schematic in Cytoscape translated to a an ODE based
model represented in Simbiology/MATLAB
Model connectivity map Model diagram/equations in Simbiology

©2015 Genentech
Stage 4: Application of stochastic global optimization for Reference
Subject(s) calibrations in the Asthma QSP platform
Implementation Considerations
• Data for different patient phenotypes (variability in mechanistic drivers, disease
severity)
• Data across multiple cell types, mediators & clinical readouts for multiple
therapies/interventions
• Appropriate data normalization
• Simultaneous simulations of all interventions for objective function evaluation
• Several mechanistic limitations of model identified in this step and model updated
accordingly
Capturing the “reference” behavior
Baseline characteristics Response to therapies (severe reference subject)
Lebrikizumab (anti-IL13)1 Omalizumab (anti-IgE)2,3
(1) Corren J et al. Lebrikizumab treatment in adults with asthma. N Engl J Med. 2011 Sep 22;365(12):1088-98
(2) Hanania NA, et al. Omalizumab in severe allergic asthma inadequately controlled with standard therapy: a
randomized trial. Ann Intern Med. 2011 May 3;154(9):573-82
(3) Djukanović R, et al. Effects of treatment with anti-immunoglobulin E antibody omalizumab on airway inflammation
in allergic asthma. Am J Respir Crit Care Med. 2004 Sep 15;170(6):583-93
Gadkar et al. ASCPT 2015

©2015 Genentech
Stage 5: Variability at baseline and responses to intervention
represented in virtual population
FeN
O(p
pb)
FE
V1
Blue: clinical data
Red: Virtual population
Solid circle is mean
Box is 25-75 percentile
Error bars is range
Baseline characteristics
Response to interventions
IgE
(% c
hange)
FeN
O
(% c
hange*) Clinical data (response to anti-IL13)
Virtual population

©2015 Genentech
BACKUP
©2015 Genentech
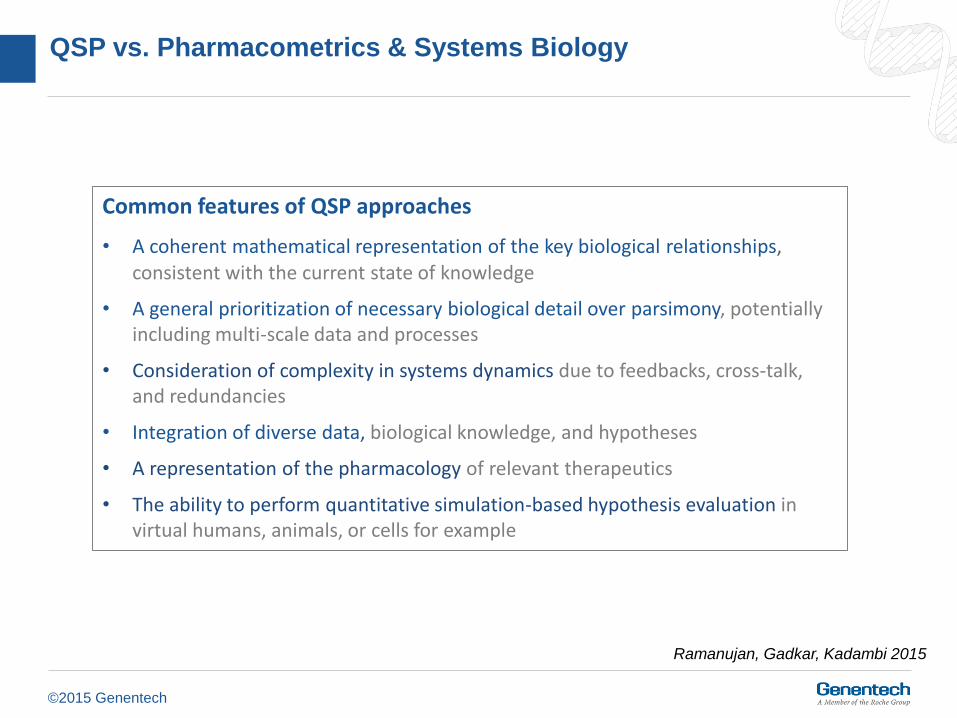
QSP vs. Pharmacometrics & Systems Biology
Ramanujan, Gadkar, Kadambi 2015
Common features of QSP approaches
• A coherent mathematical representation of the key biological relationships, consistent with the current state of knowledge
• A general prioritization of necessary biological detail over parsimony, potentially including multi-scale data and processes
• Consideration of complexity in systems dynamics due to feedbacks, cross-talk, and redundancies
• Integration of diverse data, biological knowledge, and hypotheses
• A representation of the pharmacology of relevant therapeutics
• The ability to perform quantitative simulation-based hypothesis evaluation in virtual humans, animals, or cells for example
©2015 Genentech
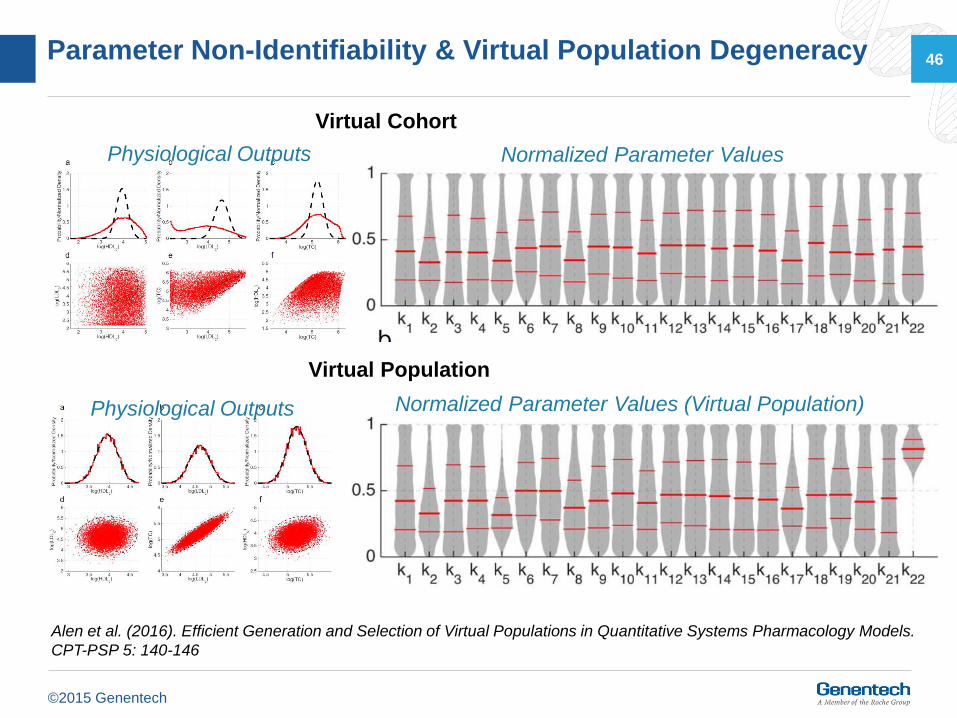
Parameter Non-Identifiability & Virtual Population Degeneracy 46
Alen et al. (2016). Efficient Generation and Selection of Virtual Populations in Quantitative Systems Pharmacology Models.
CPT-PSP 5: 140-146
Physiological Outputs Normalized Parameter Values
Virtual Cohort
Normalized Parameter Values (Virtual Population)Physiological Outputs
Virtual Population