a situation analysis of poverty pockets in bhopal · a situation analysis of poverty pockets in...
TRANSCRIPT

C
M
Y
K
A Situation Analysis ofPoverty Pockets in Bhopal
A Situation Analysis ofPoverty Pockets in Bhopal
Water AidBhopal Municipal Corporation

The Government of Madhya Pradesh has accepted the Municipal Action Plan for Poverty Reduction (MAPP) as an
instrument for slum level intervention. A city wide poverty mapping exercise for identifying the poor and creating a data
base of their condition is a primary requirement for this purpose.
I am happy to learn that on the request of Government of Madhya Pradesh, UN-HABITAT and Water Aid India in
Partnership with our Municipal Corporation has for the first time carried out a city wide Poverty Pocket Situational
Analysis (PPSA) for mapping the poverty and environmental infrastructural deficiencies in each poverty pocket for
prioritizing interventions in our cities in Madhya Pradesh. This survey assumes greater significance for the reason that it
takes into account all poverty pockets of the city instead of only those slums that exist in municipality records. This has
resulted in the identification of a large number of Poverty Pockets which are still not notified and presently therefore not
entitled for municipal services provisions. There is a large concentration of the poor in these areas, which underscores
the importance of formalizing the non-notified and the urgent need to take the facilities and entitlements to the large
concentrations of poor in these pockets.
It is understood that this survey is part of the Slum Environment Sanitation Initiative (SESI), jointly implemented by
UN-HABITAT under its Water for Asian Cities Programme, along with Water Aid India, its local counterpart NGO and
our city Municipal Corporation. The overall purpose of this project is to demonstrate and develop approaches for slum
improvement (with focus on water, sanitation and hygiene education), which could influence investments in these
areas resulting in access to services for the marginalized. The PPSA will serve as a very useful planning tool for the
preparation of proposals under the Integrated Housing & Slum Development Programme of Government of India as
well as for preparing the Municipal Action Plan for Poverty Reduction (MAPP).
Municipal Corporation will make all the possible efforts for making interventions in selected poverty pockets totaling five
thousand households in our city with a target of achieving zero open defecation in these selected pockets. It is my hope
that this tool, lessons learnt and the follow up interventions will provide better environment and improve the living
condition for the citizen of the city and thus help promote the full and active participation of all stakeholders in the
attainment of the Millennium Development Goal 7, target 10 of halving by 2015 the proportion of people without
sustainable access to drinking water and basic sanitation
( Sunil Sood )MayorBhopal
Resi. : D-53, B.D.A. Colony, Koh-e-Fiza, Bhopal
Sunil SoodMayor
Off. : 91-755-2542223Fax : 91-755-2542141
Res. : 91-755-2541651, 5242030
Municipal Corporation, BhopalSadar Manzil, Bhopal (M.P.) 462001
Ref. No. 259/M.O./06 Date : 25-11-06

Table of Content
1. Context of Poverty Mapping
1.1 Slums Environmental Sanitation Initiative (SESI)
1.2 Poverty Pocket Situation Analysis (PPSA): Purpose and Approach
2. Methodology
2.1 PPSA Bhopal : Poverty Pockets Mapping
3. A City wide Analysis
3.1 Overview
3.2 Scenario in Poverty Pockets
3.2.1 Below Poverty Line Households
3.2.2 Status of Water Availability
3.2.3 Status of Sanitation
3.2.4 Status of Drainage and Water Logging Status in PPs
3.2.5 Status of Grey Water and Solid Waste Disposal
3.2.6 Status of Roads, Street Lights and Community Activity Areas
3.2.7 Status of Schools, Aanganwadis, Baalwadis and Public Health Centre
Service
4. Inter Poverty Pocket Disparity Status
4.1 Categorisation of Poverty Pockets on MAPP parameters
4.2 Categorisation of Poverty Pockets on MDG parameters
5. Conclusions
5.1 Basic Infrastructure: Road, Electricity, School, Anganwadi, Baalwari and
Health Centres, Community Activity Area
5.2 Availability of Water in the Poverty Pockets
5.3 Sanitation: Access and Availability
5.4 Water and Sanitation in Schools (Including Aanganwadis and Baalwadis
5.5 Sanitary Condition of PPs: Solid Waste and Waste Water Disposal
Diagram 1 : Bhopal Zone and Ward Map
Annexure 1 : PPSA Questionnaire

Table 3.1 : Number of Households and Below Poverty Line (BPL) Households
Table 3.2 : Drinking Water Supply Sources
Table 3.3 : Drinking Water Supply Scenario
Table 3.4 : Water Quality
Table 3.5 : Status of Toilets
Table 3.6 : Community Toilets : Availability and Access
Table 3.7 : Community Toilets : Use
Table 3.8 : Status of Pay and Use Toilets in PPs
Table 3.9 : Condition of Drains
Table 3.10 : Areas Prone to Water Logging
Table 3.11 : Grey Water Scenario
Table 3.12 : Solid Waste Scenario
Table 3.13 : Condition of Roads
Table 3.14 : Number of Functional Street Light Poles
Table 3.15 : Community Activity Area
Table 3.16 : Water and Sanitation in Schools
Table 3.17 : Aanganwadis and Baalwadis
Table 3.18 : Average Distance of Health Sub Centres from the PPs
Table 4.1 : Percentage Deficiency of Lined Roads
Table 4.2 : Percentage Deficiency of Lined Drains
Table 4.3 : Percentage Deficiency of Street Lights
Table 4.4 : Percentage Deficiency of Grey Water Disposal
Table 4.5 : Percentage Deficiency of Piped Water Supply
Table 4.6 : Availability of Water in PPs
Table 4.7 : Percentage Deficiency of Individual Toilets
Table 4.8 : Access to Sanitation Scenario: Inter PP analysis
Table 4.9 : Access to Improved Water Source
Table 4.10 : Deficiency Matrix based Water and Sanitation Facilities
Table 5.1 : Overall Analysis of Poverty Pockets in Bhopal, 2006
i
Poverty Mapping - Bhopal
List of Tables

Poverty Mapping - Bhopal
ii
ABBREVIATIONS
ADB : Asian Development Bank
BMC : Bhopal Municipal Corporation
BPL : Below Poverty Line
DFID : Department for International Development
FGDs : Focus Group Discussions
GoI : Government of India
GoMP : Government of Madhya Pradesh
HH : Households
ICDS : Integrated Child Development Services
MDGs : Millennium Development Goals
MDM : Mid-Day Meals
MP : Madhya Pradesh
MoU : Memorandum of Understanding
NGO : Non Government Organisation
PP : Poverty Pockets
PLA : Participatory Learning and Action
PPSA : Poverty Pocket Situation Analysis
SSEI : Slums Environmental Sanitation Initiative
ULBs : Urban Local Bodies
UPAI : Urban Poverty Alleviation Initiatives
UN-HABITAT : United Nations Human Settlements Programme
WAC : Water for Asian Cities
WAI : WaterAid India
1
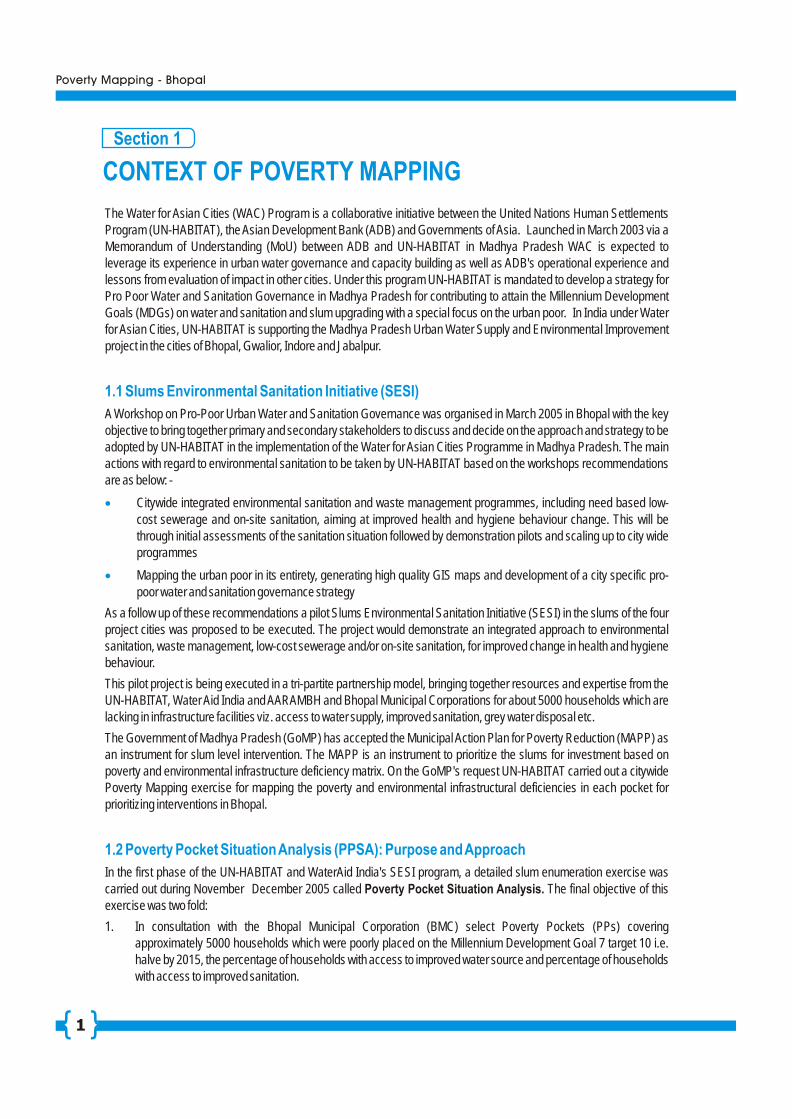
The Water for Asian Cities (WAC) Program is a collaborative initiative between the United Nations Human Settlements Program (UN-HABITAT), the Asian Development Bank (ADB) and Governments of Asia. Launched in March 2003 via a Memorandum of Understanding (MoU) between ADB and UN-HABITAT in Madhya Pradesh WAC is expected to leverage its experience in urban water governance and capacity building as well as ADB's operational experience and lessons from evaluation of impact in other cities. Under this program UN-HABITAT is mandated to develop a strategy for Pro Poor Water and Sanitation Governance in Madhya Pradesh for contributing to attain the Millennium Development Goals (MDGs) on water and sanitation and slum upgrading with a special focus on the urban poor. In India under Water for Asian Cities, UN-HABITAT is supporting the Madhya Pradesh Urban Water Supply and Environmental Improvement project in the cities of Bhopal, Gwalior, Indore and Jabalpur.
A Workshop on Pro-Poor Urban Water and Sanitation Governance was organised in March 2005 in Bhopal with the key objective to bring together primary and secondary stakeholders to discuss and decide on the approach and strategy to be adopted by UN-HABITAT in the implementation of the Water for Asian Cities Programme in Madhya Pradesh. The main actions with regard to environmental sanitation to be taken by UN-HABITAT based on the workshops recommendations are as below: -
Citywide integrated environmental sanitation and waste management programmes, including need based low-
cost sewerage and on-site sanitation, aiming at improved health and hygiene behaviour change. This will be through initial assessments of the sanitation situation followed by demonstration pilots and scaling up to city wide programmes
Mapping the urban poor in its entirety, generating high quality GIS maps and development of a city specific pro-
poor water and sanitation governance strategy
As a follow up of these recommendations a pilot Slums Environmental Sanitation Initiative (SESI) in the slums of the four project cities was proposed to be executed. The project would demonstrate an integrated approach to environmental sanitation, waste management, low-cost sewerage and/or on-site sanitation, for improved change in health and hygiene behaviour.
This pilot project is being executed in a tri-partite partnership model, bringing together resources and expertise from the UN-HABITAT, Water Aid India and AARAMBH and Bhopal Municipal Corporations for about 5000 households which are lacking in infrastructure facilities viz. access to water supply, improved sanitation, grey water disposal etc.
The Government of Madhya Pradesh (GoMP) has accepted the Municipal Action Plan for Poverty Reduction (MAPP) as an instrument for slum level intervention. The MAPP is an instrument to prioritize the slums for investment based on poverty and environmental infrastructure deficiency matrix. On the GoMP's request UN-HABITAT carried out a citywide Poverty Mapping exercise for mapping the poverty and environmental infrastructural deficiencies in each pocket for prioritizing interventions in Bhopal.
In the first phase of the UN-HABITAT and WaterAid India's SESI program, a detailed slum enumeration exercise was
carried out during November December 2005 called Poverty Pocket Situation Analysis. The final objective of this exercise was two fold:
1. In consultation with the Bhopal Municipal Corporation (BMC) select Poverty Pockets (PPs) covering approximately 5000 households which were poorly placed on the Millennium Development Goal 7 target 10 i.e. halve by 2015, the percentage of households with access to improved water source and percentage of households with access to improved sanitation.
1.1 Slums Environmental Sanitation Initiative (SESI)
·
·
1.2 Poverty Pocket Situation Analysis (PPSA): Purpose and Approach
CONTEXT OF POVERTY MAPPING
Section 1
Poverty Mapping - Bhopal

2
2. To collate the data on all PPs on availability of environmental deficiency parameters for kick starting the MAPP process by the MCs.
This study is not a household survey but the data under this study has primarily been derived from key informant interviews/ group discussions and reflects the multiple and overlapping perspectives of different stakeholders in poverty pockets. This has been triangulated by qualitative survey using participatory exercises for community's direct feedback from six Poverty Pockets for final analysis.
As far as estimate of 'access' to infrastructures in poverty pockets is concerned, this study does not claim to be one that explores issues of the city in all their complexity and against any benchmark of accessibility. It does not look at differential access to facilities or the current status of facilities as much as the availability of facilities or lack of it, for designing interventions in the most water and sanitation facilities deficient areas. The study, however, understands access to mean the availability of useable and quality infrastructure in any given locality. The following analysis (especially the cross tabulation) and ranking has been undertaken keeping this understanding of access in mind.
Qualitative feedback however uncovers different nuances of 'access', helping us to identify areas of most concern in the perception of surveyed communities. This feedback has been interwoven with quantitative data in order to define issues of access for the following environmental infrastructure deficiency indicators have been considered:
1. Percentage of length not covered with pucca drains,
2. Percentage deficiency of pucca road,
3. Percentage deficiency in street lights,
4. Percentage of households not covered with piped water supply,
5. Percentage of hourly water supply available to population,
6. Percentage of households not covered with toilets and
7. Percentage of households with access to improved way of disposal of grey water.
1. Access to improved sanitation
2. Access to improved water supply
Categorizing PPs on MAPP pockets:
Categorizing PPs on MDG platform:
Poverty Mapping - BhopalPoverty Mapping - Bhopal

2.1 PPSA Bhopal: Poverty Pockets Mapping
Stage 1.
Stage 2.
Stage 3.
Stage 4.
····
······
The process of slum mapping started in November in Bhopal. A format was jointly developed and adopted uniformly by
partner NGO AARAMBH, Bhopal Municipal Corporation, UN-Habitat and WaterAid India for gathering the necessary
data. Field teams comprised of two NGO staff and one municipal corporation staff in each team to carryout the survey.
An orientation workshop was conducted in early November 2005 with all the team members to discuss and clarify the
format of the survey. WAI, UN Habitat, Bhopal Municipal Corporation and AARAMBH attended the workshop and
oriented the teams about the program and importance of the correct information collection through focus group
discussions, transect and observations in the PPs.
The survey covered 380 PPs in Bhopal. In the process of data collection AARAMBH and Bhopal Municipal Corporation
officials verified the collected data with their signatures. UNH and WAI team members also cross-verified the data
collected in the forms by NGO and Municipal Corporation field staff. Each team filled in the survey form and signed on
each of them for authenticity. The data was then compiled by the partner NGO AARAMBH, and sent to WaterAid India for
analysis and poverty pocket ranking.
The questions asked were mainly bordering on population (no of households, no of families below poverty line, total
population etc.), presence of infrastructure (roads, street lights, schools, anganwadi, baalwadi, health centers etc),
access to water supply (hours of water supply, no of individual and community water connections, quality of water etc)
and access to sanitation (individual and community toilets, open defecation practice, solid waste management etc). The
data analysis provided information on PPs with least access to water and sanitation and where the number of people
living below poverty line was high apart from access to infrastructure. Based on individual poverty pocket's information
on these counts, PPs were categorized and ranked.
In order to triangulate the quantitative data as well as to collect information on quality and status of available
infrastructure and basic services impacting quality of life in PPs, qualitative survey was undertaken separately using
participatory tools.
Tools used included:Focus Group DiscussionTransect WalkObservationIndividual Interaction
The data analysis provided information on slums with least access to water and sanitation and where the number of
people living below poverty line was high apart from access to infrastructure. Qualitative data was collected through
transect walks, FGDs, observations and individual transations from the following locations:
Dashmesh Nagar J J Camp, Zone 8, Ward-64Patra Lane near Fiber home-Bhopal, Zone 7, Ward 38Durga Nagar, Zone-14, Ward-53Subhash Nagar, Foota Maqbara- Chola Road, Zone-4, Ward-20Rajeev Nagar Basti, Ward 29Sai Baba Nagar, Zone-14, Ward 52
Section 2
PPSA METHODOLOGY
3
Poverty Mapping - Bhopal

Bhopal, MP's capital city, with a population of 1.43 million in an area of 284.9 sq km, has the highest urban poverty ratio of 148.4% (199394) among all Indian states. A rough government estimate would suggest that around 8.81% of Bhopal's
population was living in notified slums in the year 2000. However, there has not been any estimate of either slum population or BPL households in the last five years, while the decadal growth rate of population of Bhopal has been
234.92% (2001).
Multidimensional urban expansion i.e. population growth, industrialization, infrastructure growth etc, has put enormous stress on various resources, not the least of which are space, energy, water supply and waste disposal facilities. Due to lack of planned settlement and shelter for the urban poor, Bhopal has witnessed mushrooming informal settlements notified and non-notified slums especially, in the last twenty years; many of which are the most service or infrastructure deficient Poverty Pockets of the city.
The Municipal Corporation of Bhopal is divided into 69 wards and 209 locations are notified as slums. This study however, for the first time, and in consultation with the Municipal Corporation, looked at both notified slums (209) and irregular colonies or un-notified slums (171), together amounting to a total of 380 'Poverty Pockets'.
Qualitative data gathered from six slums (see table below) highlighted the large gap between notified and un-notified poverty pockets in Bhopal city. If we consider that according to the Census of India Bhopal's slum population is approximately 0.1 million, one can safely assume that a large percentage of slum dwellers are in fact based in un-notified slums as the total population in the sample poverty pockets was just over 0.64 million as per this survey. This not only underscores the importance of formalizing un-notified PPs, but also the urgent need to take facilities and entitlements to the large concentrations of households in such PPs.
3.2 Scenario in Poverty Pockets
3.2.1 Below Poverty Line Households
Section 3
A CITY WIDE ANALYSIS
3.1 Overview
As mentioned in the section on methodology, obtaining estimates of poverty even at the district level presents challenges. According to the 1998-99 data, Bhopal has an urban poverty of 68.94%. The base data for this figure is however the 1991 census and with the increase in population and decrease in poverty (a country wide trend) the percentage is likely to have come down significantly over the decade. The only official estimate available for no. of BPL households is that of the Directorate of Food and Civil Supplies, Government of Madhya Pradesh, according to which 122076 ration cards have been issued in Bhopal District as a whole (one card per family, data for 1997-98).
1 Planning Commission's Estimates of Poverty (1997) Census of India, 2001 2 Municipal Corporation in M.P. Sl No Municipal Corporation Decadal growth rate of population 1981-91 1991-2001 Bhopal 58.38 34.92 Slum Population, Census of India 2001, www.censusindia.net
4
Poverty Mapping - Bhopal
Table 3.1: Number of Households and Below Poverty Line (BPL) Households
Total Number of PP
380
Total No. of Households
128170
No. of BPL Households in PP
63921
% of BPL Households in PP
49.8

The percentage of BPL households (49.8%) is therefore in line with, rather than significantly higher than estimates for Bhopal as a whole. Two explanations could possibly account for this a) decrease in poverty and increase in population over the last seven years, b) migration patterns of poorest most mobile populations from poverty pockets at the time of the survey (November, December 2005). Checking these
1hypotheses, however, was beyond the scope of the current survey .
Within the surveyed poverty pockets the question of overall access to basic services water, sanitation has been addressed using the proxy indicators of presence of quality infrastructure such as roads, drainage, street light poles, schools, water supply and community toilets etc. Qualitative feedback however uncovers different nuances of 'access', helping us to identify areas of most concern in the perception of surveyed communities. This feedback has been interwoven with quantitative data in order to define issues of access.
More than 82% of the Poverty Pockets depend on public stand posts to meet their daily water requirements. Simply fetching water takes a long time and has gender implications as arranging water in most urban and rural contexts has resulted in more drudgery for women. Also the most significant outcome of poor water and sanitation conditions are health problems such as diarrhoea. And the most vulnerable population are children.
3.2.2 Status of Water Availability:
5
3.2.2.1 Drinking water supply:
In the surveyed poverty pockets a large proportion of households depend on public stand posts, boreholes, wells, springs etc for drinking water (66%) which have been designated as a safe source of drinking water. Overall an overwhelming 70% of the households do not have access to piped water supply. But of the 39562 households that do have access to piped water, more than over 95% are in areas where water supply is only available for up to 2 hours and at extremely low pressure, representing again the limited use ability of available infrastructure.
1 For details see 'Priya Deshingkar and Daniel Start: Seasonal Migration for Livelihoods Coping, Accumulation and Exclusion; Overseas Development Institute, UK, 2003. While the favored season for intrastate migration in MP is Rabi, migrants prefer to harvest and tend to their rainfed crops before heading to the cities. S. Chandrashekhar (Unpublished Paper): Growth of Slums, Availability of Infrastructure and Demographic Outcomes in Slums: Evidence from India, IGIDR, 2005
Poverty Mapping - Bhopal
Total Number of PP
Table 3.2: Drinking water supply sources
No. of Public Stand Posts
No. of Wells Number of Hand Pumps
Number of Tube Wells
380 6549 146 703 585
Table 3.3: Drinking Water Supply Scenario
No. of households
having access to piped water
No. of households using public
stand posts/taps, borehole or pump, protected wells,
prote cted springs or rainwater/hand pumps
No. of households
depending on tankers, vendors providing water
or unprotected wells and springs
Total Households
39562 83223 5385128170

Drinking Wate Supply Scenario
39562
83223
5385
No. of households having access to piped water
No. of households using public stand posts/taps, borehole or pump, protected wells, protected springs or rainwater/handpumps
No. of households depending on tankers, vendors providing water or unprotected wells and springs
6
3.2.2.2 Water Quality: -
The water supplied thru stand posts or house connections is reportedly of sweet taste and potable. However very few slums have reported of the presence of hard water or tasteless water. These are generally from hand pumps or in-situ bore wells.
“There are four water tanks (Sintex) - out of them two are non functional, Water crisis deepens during the summer season. Quality of water of the tanks is not safe for drinking. A lot of noise and fighting happen at the tank for water collection. There are two community water handpumps, both of them are non functional. Water is supplied on alternate days by tankers that too in the nearby basti. Water table is about 260 feet deep.” PLA, Dashmesh Nagar.
“There are only 3 water taps. These taps pass through the drainage causing water contamination. Water availability is a serious concern.” PLA, Durganagar.
“There are community taps available in each lane but water pressure is very low. Therefore the people collect water from the railway station and main road. At least half an hour is wasted only to fetch water.” PLA, Subhash Nagar .
“Water supply is highly inadequate and insufficient. The water table is very deep. Handpumps cannot function. There is one water line in the community but water does not flow because of low water pressure. 2 water tanks (one cemented and one Sintex) are filled with water by a water tanker, but that is highly insufficient. People have to bring water from other colonies from a distance over a slope of at least 1 kilometer taking more than ½ hour.” PLA Sai Baba Nagar
3.2.3 Status of Sanitation:
3.2.3.1. Availability of toilets:
Nearly half the households (approximately 49%) in the surveyed Poverty Pockets have no access to individual toilets and 42% in fact still defecate in the open (only 6.1% use community toilets), indicative perhaps of the
Poverty Mapping - Bhopal
Sweet test Salty Taste less
Number of PP 335 23 22
Table 3.4: Water quality

7
limited impact that community toilets have had in improving the sanitation environment in the area. The data for use of community toilets here reinforces the view expressed under table below that availability of community toilet facilities has not led to their useability or accessibility largely due to the large numbers of households dependent on limited facilities.
66558
7856
53756
Individual Community Open Defecation
3.2.3.2. Availability and Operation of community toilets:
Of the total community toilets, women used 47% of seats while 53% of the toilet seats are used by men. Only 44% of all
the community toilets had the facility of a bathroom. A very low percentage of PPs (approximately 19%) have access to
community toilets and only 59% of these are linked with water supply. Nearly 83% are linked to a septic tank or sewerage.
However only 11% of the drains in the PPs are lined (see relevant table) so the chances of contamination flowing into
ground water is high and general unsanitary conditions prevail as can be seen in the observations of the PLA as well. An
unforeseeable issue emerging from lack of water and sanitation in Dashmesh Nagar (see text below) was that children
had to stay at home while parents went out to meet these basic requirements and were therefore unable to attend school.
Of the total community toilets 22% are not in use and 38% are maintained but overcrowded. 13% (13 in total) of the toilets
were reported as well maintained and less crowded. Again around 21% of the toilets are poorly managed but people use
them due to lack of alternatives.
Poverty Mapping - Bhopal
Status of Toilets
Table 3.6: Community Toilets: Availability and Access
Total Seats Total No. of
PP
Total Number of
Community Toilet
/Seats Male Female
Have a
permanent
water supply
facility
Have a bath
facility
Connected to
a septic tank
or sewerage
380 71/841 448 393 42 31 59
Individual Community Open Defecation Total Households
66558 7856 53756 128170
Table 3.5: Status of Toilet

8
42
71
31
71
59
71
0
10
20
30
40
50
60
70
80
Nu
mb
ers
Have a permanent watersupply facility
Have a bath facility Connected to a septictank or sewerage
Availability & Access of Community Toilets
16
1527
13
Not maintained/not useable Poorly managed but used
Maintained but overcrowded Maintained and not crowded
Community Toilets: Status and Use
In the case of Bhopal, the survey revealed that 42 out of the 73 CTs having satisfactory maintenance. However, overcrowding appears to be an important issue in Bhopal and it seems that the number of seats is not enough to cater to the demand of the population in a substantial number of poverty pockets.
There is no community toilet. The available individual toilets were constructed by the Nagar Nigam on subsidized rates, the contribution of the families was Rs 200 per unit. Majority of people use open ground for defecation that too quite far. Lots of time is wasted for water and defecation purposes. Children have to stay at their homes when parents go out. Consequently, children are deprived of schooling and parents also have to leave their work quite often. The people want water and community toilets immediately.” Dashmesh Nagar PLA
Poverty Mapping - Bhopal
Having Facility Total Toilets
Total No. of
PP
Total Number of
Community Toilet
Not maintained/not
useable
Poorly
managed
but used
Maintained but
overcrowded
Maintained
and not
crowded
380 71 16 15 27 13
Table 3.7: Community Toilets: Use

9
“Majority of the population use open ground, railway track and nala for defecation. 20% households have toilets without tanks. Sweepers carry night soil on their heads and dump in the drain.” Subhash Nagar PLA
Users pay for 28 of the 71 community toilets. It was found that 13 out of the 28 pay and use toilets were maintained and less crowded, implying that where users paid for the services, facilities were better maintained. Presently there are only 39% of the community toilets were of pay and use category.
3.2.3.3. Paying for community toilet services:
28
71
43
71
0
10
20
30
40
50
60
70
80
Nu
mb
ers
Users paying for the services Users Not paying for the services
Status of Pay and Use toilets in PPs
3.2.4 Status of Drainage and Water Logging Status in PPs
3.2.4.1 Drainage
Analysis shows that only 11% (approx.) of drains are lined. (For further correlations and spatial trends see the next section on inter PP analysis). In terms of the absolute presence of 'any drainage systems', this dataset (8%) shows better results in comparison to the national average of 22% for both notified and un-notified slums.
Poverty Mapping - Bhopal
Table 3.8: Status of Pay and Use Toilets in PPs
Total Number of
Community toilet
Users paying for the
services
Users Not paying for
the servicesTotal Number of PP
71
28
43
380
Table 3.9: Condition of Drains
Total Number of PP Total Length of Drains in Km Length of Lined Drains
380 1683.50 184.76

10
However the vast majority of available drains 89% were unlined. Another concern related to unlined drains emerging from the PLA was the contamination of water sources such as taps were lines crossed unlined drains. In the perception of PLA respondents the open drainage system and water logging were serious problems and contributed directly to unhygienic and unsanitary conditions in the slums.
3.2.4.2 Water Logging:
156
380
224
380
0
50
100
150
200
250
300
350
400
Nu
mb
ers
No. of Water Logged PPs No. of PPs free from Water Logging
Areas Prone to Water Logging
Over 40% of the Poverty Pockets report the incidence of water logging. Nearly 30% of the PPs where stagnant
water was found reported that garbage was thrown in the drains implying this may be a serious cause of water
logging. Water logging, a major result of this, was reported as an area of concern in three of the six randomly
selected slums (Bhopal PLA). This was caused either due to the absence of an appropriate sewer system,
faulty slope and planning of the habitation, or due to slum specific factors such as the proximity of a 'dhobhi
ghat'.
Only 12% of the total households have access to a sewer or septic tank in which to dispose grey water. 88% of
the households let waste water flow into open drains and streets, causing a major health hazard.
3.2.5 Status of Grey Water and Solid Waste Disposal:
3.2.5.1. Disposal of Grey water (waste water from household chores):
Poverty Mapping - Bhopal
Total Number of PP No. of Water Logged PPs No. of PPs free from Water Logging
380 156 224
Table 3.10: Areas Prone to Water Logging

11
Grey Water Scenario
40739
72887
11690
2854
0
10000
20000
30000
40000
50000
60000
70000
80000
Nu
mb
er
1No. of households letting it out into the streets No. of households disposing in open drains
No. of households disposing to septic tanks Number of households disposing by sewerage system
3.2.5.2. Disposal of Solid Waste Management:
A vast majority of the households (more than 52%) are dumping waste in the open leaving the area, and particularly its children, vulnerable to diseases borne by flies and mosquitoes and other such parasites. Only 11% are receiving a doorstep facility and 24% are taking the garbage to neighbourhood points. A matter of serious concern is that 12% of the households are letting the garbage flow into drains. An initial reading of the data also shows that it is PPs where the practice of throwing garbage in drains combines with relatively high populations that this issue becomes most severe. Nearly 30% of the PPs where stagnant water was found reported that garbage was thrown in the drains implying this may be a serious cause of water logging. It is also noticed that poverty pockets also have two to three systems of solid waste disposals out of the options given in the table and hence the sum total of the PPs does not match the responses.
Poverty Mapping - Bhopal
Table 3.11: Grey Water Scenario
No. of households
letting it out into the streets
No. of households
disposing in open Drains
No. of households
disposing to septic tanks
Number of households
disposing in the sewerage system
Total
Households
1169040739128170 286472887
Total Number of
HH
No. of households having the facility of
solid wastecollection at their
doorstep
128170
No. of households having the facility
of solid wastecollection at
neighborhood points
No. of householdshaving solid
waste finding its way into the drains
No. of householdsdumping solid waste in the
open
14481 66727 1589231070
Table 3.12: Solid Waste Scenario

14481
31070
66727
15892
0
10000
20000
30000
40000
50000
60000
70000
Nu
mb
er
of
HH
Collection at the doorsteps Collection at theneighbourhood points
Dumped in open area Drains
Solid Waste Scenario
3.2.6 Status of Roads, Street Lights and Community Activity Areas
3.2.6.1. Roads:
In an urban context, roads form a direct link in access to public infrastructure and transport.
While 73% of the total road length is metalled, qualitative feedback have shown how even pucca roads are in a bad state and are not well maintained. This would imply that an understanding of the 'condition of roads' would need to be deepened through a checklist of what constitutes a serviceable road .e.g. its accessibility during the rainy season, its visible condition, accessibility for public transport, markings for ease of night-time traffic etc.
12
Poverty Mapping - Bhopal
Table 3.13 : Condition of Roads
Total Number of PP Total Length of Road in Km Length of Pucca Road in km
380 430 315

13
“There are poles in our slum but no electricity.” Rajeev Nagar Basti PLA“There are poles but not working due to the change in cable.” Subhash Nagar PLA
3.2.6.3. Community Activity Areas:
A community activity area here refers to any common area such as a playground, or park for use by PP inhabitants. A large majority (88%) of the Poverty Pockets did not have a community activity area. The PLAs revealed that children would largely stay at home after school and a community activity area would mean obvious improvements in quality of life for children for example.
Taking a population median of 1300 we found that for PPs with less than 1300 population there were only 12 PPs with the incidence of at least one community activity areas whereas for PP with more than 1300 population there were 35 such PPs. While data is not available for physical size of HABITATion or PP this would seem to imply a direct relationship between the two.
47
333
No. of PPs having a Community Activity Area No. of PPs without a community activity area
Community Activity Area
3.2.6.2. Streetlights:
Of the 380 PP there are only 6367 street light poles. Over 24% of the PPs had five or less functional street light poles indicative of the extreme lack of infrastructure in this area. Only 50% (approximately) of the total road length is covered through street light poles. (Data was not available for the total number of electricity poles). Given the direct relation this has to safety and security of inhabitants, particularly women, this constitutes a serious concern in the poverty pockets. Again the PLA exercise provides key insights on the issue of whether 'availability' amounts to 'useability' or accessibility of a facility (see below).
Poverty Mapping - Bhopal
Table 3.14 Number of Functional Street Light Poles
Total Number of PP
380
Functional Street light poles
6367
Total Number of PPNo. of PPs having a
Community Activity AreaNo. of PPs without a
community activity area
380 47 333
Table 3.15: Community Activity Area

14
3.2.7 Status of Schools, Aanganwadis, Baalwadis and Public Health Centre Service
3.2.7.1 Schools :
40% of the poverty pockets have no primary schools. Presence of primary schools in the area also does not automatically ensure enrolment, retention and regular attendance in these schools due to a variety of infrastructural issues. The first of these is the availability of basic drinking water and toilet facilities. Of the primary schools 21% do not have drinking water facilities and 26% do not have toilet facilities. Nearly 50% of the schools do not have separate toilet facilities for girls and boys a key factor in low enrolments and retention of girl students. The qualitative survey in two out of six slums revealed parent were reluctant to send children to school if it was located across a main road due to the danger of accidents. So a number of physical infrastructural and locational issues impact the usability of primary schools for slum dwellers and would need to be taken into account in the planning for such facilities. The figure of primary schools represented in the data also includes the private schools running in the area.
306
386
284
386
198
386
0
50
100
150
200
250
300
350
400
No
.o
fP
rim
ary
Sc
ho
ols
With drinking water supply With sanitation facility and
water supply
With separate toilets for girls
and boys
Water and Sanitation in Schools
3.2.7.2. Aanganwadis and Baalwadis :There is a much higher degree of access to aanganwadis in the Poverty Pockets (115%) as compared to Baalwadis (14%). To some extent the lack of Balwadis is compensated by the relatively higher presence of primary schools in the PPs, however given that this is a preschool program and has additional support from the government for the improvement of the nutrition and health of children - a closer on the ground analysis is required to understand this assumption more closely. In both the aanganwadis and baalwadis the lack of toilet facilities (approximately 50% in both lack toilet facilities) can be seen as a major issue of concern especially from a gender perspective in the context of both these programs being central to the government's mother and child health care policies.
Poverty Mapping - Bhopal
Total Number of PP
No. of PrimarySchool
No. of Primary School having drinking water
supply
No. of Primary School having
Sanitationfacility and water
supply
Number of PrimarySchool having
Separate toilets forgirls and boys
229 346 281 208 66
Table 3.16: Conditions of Schools
Total Number of PP
No. of PrimarySchool
No. of Primary School having drinking water
supply
No. of Primary School having
Sanitationfacility and water
supply
Number of PrimarySchool having
Separate toilets forgirls and boys
380 386 306 284 198
Table 3.16: Water and Sanitation in Schools

222
438
2554
0
50
100
150
200
250
300
350
400
450
No. of Aanganwadis having toilets with watersupply
Number of Balwadis having toilets with watersupply
Aanganwadis and Baalwadis
3.2.7.3. Distance to the closest Health Sub-Centre:
Of the total 380 poverty pockets, around 30% had reported to have the health sub center within around 0.5 kilometers while 21% of the pockets have it at a distance of 0.5 to 1 kilometer. Around 27% of the poverty pockets reported to access health sub center at a distance of 1-2 kilometer while for 22% of the pockets, it is more than 2 kilometers.
15
Poverty Mapping - Bhopal
Total Number of PP
No. of Aganwadis
No. of Aganwadishaving toilets
with water supply
No. of Balwadis
No. of Balwadishaving toilets
with water supply
380 438 222 54 25
Table 3.17: Conditions of Aanganwadis and Baalwadis
Distance
Number of PP
Table 3.18: Distance to the closest Sub Health Centre
0-0.5 Km 0.5-1 Km 1-2 Km > 2 Km
115 (30%) 79 (21%) 103 (27%) 83 (22%)

Section 4
INTER POVERTY POCKET DISPARITY STATUS
4.1 Categorisation of Poverty Pockets on MAPP parameters:
4.1.1. Roads:
Of the PPs surveyed a substantial percentage (27%) were completely covered by lined roads. Complete coverage by lined roads implies that out of the total length of road 100% is lined for a particular PP. However across the total length of roads for the city only around 73% is in fact lined and as PLA data reveals even lined road are not in an optimal condition.
0 0< 25% >25% to 50% > 50% to 75% > 75% but less than 100% 100%
Percentage deficiency of Pucca Roads
101
122
80
37
21 19
4.1.2. Drainage:
A large number percentage of poverty pockets (27%) remains deficient in terms of any coverage by lined drains and only 0.2% of the PP are fully covered by lined drains. 72% of the total Poverty Pockets are lined to varying extents. Coverage here is the length of lined drains in relation to road length. The length of lined drains is 185 Km approximately in relation to the total length of drains of 1684 kms which is barely 11% of the total drainage length. This in itself is an indicator of the potential for sanitation problems to emerge in the slums indicated also by the incidence of water logging.
16
Poverty Mapping - Bhopal
Percentageof Pucca Road
No. of PPs
Percentage
Table 4.1: Percentage deficiency of Pucca Roads
0
101
27
0 < 25%
122
32
25% to 50%
80
21
50% to75%
37
10
More than 75% but lessthan 100%
21
5
100%
19
5
Total
380
100

0 0< 25% >25% to 50% > 50% to 75% > 75% but less than 100% 100%
Percentage deficiency of Lined Drains
1 29
127
119
104
4.1.3. Street lights:
In order to assess whether the above availability of street lights were sufficient the standard measure adopted was one street light for every 30 metres of road. A large number of PPs proved to have insufficient lighting against this benchmark with nearly 18% of the PPs falling in the categories where there was 75% or above deficiency in street lights. Only 3% of the PPs showed no deficiency in the presence of this infrastructure.
17
Poverty Mapping - Bhopal
Percentageof deficiency of Lined Drains
No. of PPs
Percentage
0
1
0.2
0 < 25% 25% to 50%
29
8
50% to75%
127
33
More than 75% but lessthan 100%
119
31
100%
104
27
Total
380
100
Table 4.2: Percentage deficiency of lined DrainsTable 4.2: Percentage deficiency of Lined Drains
Percentageof deficiency of Street Lights
No. of PPs
Percentage
0
13
3
0 < 25%
130
34
25% to 50%
67
18
50% to75%
78
21
More than 75% but lessthan 100%
65
17
100%
27
7
Total
380
100
Table 4.3: Percentage deficiency of street lights

13
130
67
78
65
27
0
20
40
60
80
100
120
140
0 < 25% >25% to 50% > 50% to 75% > 75% but lessthan 100%
100%
No. of Poverty Pockets
Percentage Deficiency of Street Lights
18
4.1.4. Grey Water Disposal
In terms of disposal of grey water a large majority (68%) of the Poverty Pockets report that they do not have improved ways to dispose grey water. In fact only 1% of the PPs report that they have such improved ways. This is indicative of how pervasive this issue is across the entire city needing particular attention and being linked as it were to the overall issue of lack of drainage.
259
65
2813 10 5
0
50
100
150
200
250
300
0 < 25% >25% to 50% > 50% to 75% > 75% but less
than 100%
100%
Number of Poverty Pockets
Percentage deficiency to Improved Way of Disposal of Grey Water
Poverty Mapping - Bhopal
Percentagedeficiency to improvedway ofDisposal of GreyWater
No. of PPs
Percentage
0
259
68
0 < 25%
65
17
25% to 50%
28
7
50% to75%
13
3
More than 75% but lessthan 100%
10
3
100%
5
1
Total
380
100
Table 4.4 : Percentage deficiency of grey water disposal

4.1.5. Access to Piped Water Supply
The inter PP analysis also brings out issues of distribution of water and degree of accessibility by different PPs. The large percentage of PPs (43%) without any access to piped water would indicate that the 29% households with access to piped water are highly concentrated. This survey, taking a deeper look at water supply issues, also assessed quality of water and availability of water supply.
57
32 29 24
73
165
0
20
40
60
80
100
120
140
160
180
0 < 25% >25% to 50% > 50% to 75% > 75% but lessthan 100%
100%
Percentage Deficiency of Piped Water Supply
Percentage Deficiency of Piped Water Supply
4.1.6 Hourly Water Supply
While the quality of water available in the PPs is sound (91% of the slums reported the availability of sweet water) the fact remains that the vast majority (64%) of the PPs are dependent on 1 -2 hrs of water supply and many slums (24%) have no water at all. Given the pressure of population on each source (see analysis above) this low level of supply (a total of 88% of PPs in the 0-2 hrs supply categories) creates extreme hardship for the families.
19
Poverty Mapping - Bhopal
Total
380
100
50% to75%
24
6
More than 75% but lessthan 100%
73
20
100%
165
43
25% to 50%
29
8
0 < 25%
32
8
0
57
15
Percentageof deficiency of Piped Water
No. of PPs
Percentage
Table 4.5: Drinking Water Supply Scenario: Inter PP analysis

20
Poverty Mapping - Bhopal
4.1.7 Individual Toilets:
The survey data on the sanitation behaviour of the PPs revealed that nearly 80% of the poverty pockets are 25 100 % deficient in toilet facilities. There is need for awareness creation for the behavioural change towards adoption of low cost sanitation units.
75
83
55
46
71
50
0
10
20
30
40
50
60
70
80
90
No
.of
Po
vert
yP
ock
ets
0 < 25% >25% to 50% > 50% to 75% > 75% but lessthan 100%
100%
Percentage deficiency with Individual toilets Number of Poverty Pockets
4.2 Categorisation of Poverty Pockets on MDG parameters
4.2.1. Access to Improved Sanitation
It is revealed that 20 percent of the PPs doesn't have any scientific ways of sanitation services. Focus on densely populated PPs as an initial step can really help to improve the overall sanitation profile of Bhopal city.
Total
380
100
Table 4.6 Availability of Water
No. of Hrs
supply per day
from stand
posts/piped
water supply
No. of PovertyPockets
Percentage
No water
supply
through
pipeline
(assuming 01 hr amounts
to no supply)
92
24
Between
1-2 hours
per day
(including
2 hrs)
245
64
Between 2-5 hours per
day
(including
5 hrs)
40
10
Between 5 -
10 Hrs per
day
(including 10
hrs)
1
0.2
>10
hours
2
0.5
0
75
20
Percentageof deficiency
with individual toilets
No. of PPs
Percentage
Table 4.7: Percentage deficiency of Individual Toilets
0 < 25%
83
37
25% to 50%
55
19
50% to75%
46
12
More than 75% but lessthan 100%
72
19
100%
50
13
Total
380
100

50
77
5047
8175
0
10
20
30
40
50
60
70
80
90
0 < 25% >25% to 50% > 50% to 75% > 75% but less
than 100%
100%
Percentage population having access to improved sanitation
4.2.2. Access to Improved Water Source
The large number of Poverty Pockets (88%) with 100% reporting access to improved water supply is not necessarily borne out by quantitative and qualitative data for drinking water supply and water for sanitation as has been discussed in previous sections. This would seem to indicate that reporting on improved water sources needs to be more detailed and qualitative in order to bring out the real issues of access across Bhopal slums.
Percentage population having access to improved sanitation
21
Poverty Mapping - Bhopal
PercentagePopulation havingaccess to improvesanitation
No. of PPs
Percentage
0
50
13
0 < 25%
77
20
25% to 50%
50
13
50% to75%
47
12
Table 4.8: Access to Sanitation Scenario : Inter PP analysis
Total
380
100
100%
75
20
More than 75% but lessthan 100%
81
21
PercentageAccess to ImprovedWater supply
No. of PPs
Percentage
0
7
2
0 < 25%
4
1
25% to 50%
10
3
50% to75%
4
1
Total
380
100
100%
336
88
More than 75% but lessthan 100%
19
5
Table 4.9: Access to Improved Water Source

7 4 10 4 19
336
0 < 25% >25% to 50% > 50% to 75% > 75% but less than 100% 100%
Percentage Access to Improved Water Supply
22
Poverty Mapping - Bhopal
Table 4.10: Deficiency Matrix based Water and Sanitation Facilities
Percentage Access to Improved water SupplyPercentage Access to Improved Sanitation
0
1-25
26-50
51-75
76-99
100
Total
0
2
2
1
1
1
-
7
1-25
1
1
-
-
2
-
4
26-50
2
2
1
-
1
4
10
51-75
-
1
-
2
-
1
4
76-99
-
3
2
4
8
2
19
100
45
69
45
40
69
68
336
Total
50
78
49
47
81
75
380

With the purpose of making interventions to improve water and sanitation services in the most water and sanitation service deficient poverty pockets, a PPSA was conducted during November to December 2005 in 380 PPs in Bhopal. The primary objective of the PPSA was to identifying the poor, their condition and needs. The overall situation in the PPs as emerged through the PPSA is presented in Table 29.
Survey data using participatory methodologies provide contrasting answers to the research questions of access to water, sanitation and basic infrastructure and is indicative perhaps of the complexity of the issues at hand. Broadly the survey conducted in Bhopal indicates that lack of access to piped water supply and toilets were extremely high at approximately 70% and 42% respectively. Still (and in contrast also to qualitative survey feedback), in the perception of a vast majority of respondents (95.64%), the current situation is an improvement in terms of access to an improved water sources. Improvements in sanitation too have been reported for over 58% of the households.
Section 5
CONCLUSION
Table-5.1: Overall Analysis of Poverty Pockets in Bhopal, 2006
Total No of Poverty Pockets Identified 380
Total Households 128,170
Number of Household living in the poverty pockets Below Poverty Line 63,921
% of household living Below Poverty Line 49.8
% hh living in the poverty pockets with access to improved water source (average) 95.80
% hh living in the poverty pockets with access to improved sanitation (average) 58.0
% hh living in the poverty pockets defecating in open 42
% hh living in the poverty pockets with piped water supply 30.8
Lack of access to basic services to the residents of PPs such as road, lights, school, health centres and community activity areas bring out the interrelatedness of poverty, lack of basic services and other aspects of human development.
The analysis revealed that 40% of the PPs have no primary schools and where they exist, lower enrolment, poor retention and irregular attendance were pointed out as the key issues. There is a much higher degree of access to aanganwadis in the Poverty Pockets (115%) as compared to Baalwadis (14%). Of the total 380 poverty pockets, around 30% had reported to have the health sub center within around 0.5 kilometres while 21% of the pockets have it at a distance of 0.5 to 1 kilometre. Around 27% of the poverty pockets reportedly have to access health sub center at a distance of 1-2 kilometer while for 22% of the pockets, it is more than 2 kilometers.
Marginalization of PP areas in a city is also impacted by poor access to road within the slum and the link of the settlement with the main road. Even though 73% of the total road length is metalled, qualitative survey of Dashmesh Nagar shows that even pucca roads are in a bad state. Only 30% (approximately) of the total road length is covered through functional street light poles. Over 25% of the PPs had five or less functional street light poles indicative of the extreme lack of infrastructure in this area and qualitative survey indicates that 'availability' does not amount to 'usability' or accessibility of a facility. Community members of Rajiv Nagar reported that “there are poles but no electricity”, while in Subhas Nagar residents reported that “there are poles but not working due to change in cable”.
The absence of facilities is more acute in PPs with smaller pockets. The analysis indicates that a Small Scattered Poverty Pocket is less likely to have Basic Facilities in terms of incidence of facilities.
In the surveyed 380 poverty pockets, more than 82% of the PPs depend on public stand posts to meet their daily water requirements. The hardship of water becomes manifold in many of those slums where neither does community tap work
5.2 Availability of Water in the Poverty Pockets
5.1 Basic Infrastructures: Road, Electricity, School, Anganwadi, Baalwari and Health Centres,
Community Activity Area Infrastructure Facility
23
Poverty Mapping - Bhopal

nor is there any other drinking water source. In total, 24% PP settlements, especially smaller ones, do not have water supply services at all. Out of 128,170 households in 380 Poverty pockets, an overwhelming 70% of the households do not have access to individual piped water supply. This emphasizes the degree of scarcity of water in the poverty pockets of Bhopal.
Given the pressure of population on each source this low level of supply affect the quantity of water that each household gets. At places “People have to bring water from other colonies from a distance over a slope of at least 1 kilometer taking more than ½ hour.” (Sai Baba Nagar) while elsewhere community reported “At least half an hour is wasted only to fetch water.” (Subhash Nagar)
Diagram 1 : Bhopal Zone & Ward Map
The analysis revealed that poverty, deficiency of access to basic water and sanitation services are spatially clustered in the North West zones of Bhopal city (Fig 2). Trends across poverty pockets indicate that the highest co-incidence of BPL households, lack of access to improved water sources and lack of access to improved sanitation occurs across zones One, Three and Ten in the north and North West of the city. The highest individual incidence of BPL households is in zone three while the highest individual incidence of lack of access to water and sanitation is in zones 12 and 14 respectively. In terms of concentration of population however Central Bhopal is most populated with an average population of nearly 3500 persons per PP in zone no. Five. Any intervention planned at addressing these concerns should therefore keep in view the above distribution of access and poverty.
24
Poverty Mapping - Bhopal
Zone No
1 Wards 1,2 ,3,4 Zone No
8 Ward No.45,46,47,64
Zone
No.2
Ward No.
5,6,8,9,10,13 Zone No
9 Ward No.48,49
Zone No
3 Ward 11,12,14,15,16 Zone No
10 Ward No.55,56,57,58
Zone No
4 Ward No.17,18,20 Zone No
11
Ward
No.59,60,61,62,63
Zone No
5
Ward
No.24,25 ,26,27,34 Zone No
12 Ward No.65,66
Zone No
6 Ward No.28,29,30,31
Zone No
13 Ward No.39,40,41,42
Zone No
7
Ward No.
35,36,37,38,43,44
Zone No
14 Ward No. 51,52,53
Lack of access to water (Z.12)
Lack of Access to Sanitation (Z.14)
Area with highest no. of Rank A PPs
B
H
O
P
A
L
Z
O
N
E
A
N
D
W
A
R
D
M
A
P
Concentration of poverty (Z.3)

25
5.3 Sanitation: Access and Availability
5.4 Water and Sanitation in Schools (Including Aanganwadis and Baalwadis)
5.5 Sanitary Condition of PPs: Solid Waste and Waste Water Disposal
Status of access to sanitation facilities sanitary conditions seems to be far worse than water. Nearly half the households
(49%) in 380 surveyed Poverty Pockets have no access to individual toilets and 43% households, in fact, still defecate in
the open. Not more than 6% households use community toilets. This is indicative of the limited use of the community
toilets in improving the sanitation environment in the area. Its limited use is also explained by the lower availability and
accessibility, apart from poor maintenance in terms of irregular or no water supply, bad sanitary condition and lack of
proper drainage, among many. As low as approximately 21% households in the surveyed PPs claim to have access to
the 71 community toilets that exist in 380 PPs of Bhopal While only 60% of these toilets are linked with the secured water
supply source. It sufficiently explains why 18% community toilets are not in use and 27% are maintained but
overcrowded.
Community members from Subhas Nagar and Dashmesh Nagar reported that “Majority of people use open ground for
defecation, that too quite far. Lots of time is thus wasted in the process.” In the Subhas Nagar community estimated that
20% households have toilets without tanks. Sweepers carry night soil on their heads and dump in the drain.”
Lack of infrastructure contributes further to lower retention rate, especially of the girl child/adolescent, in the fewer
schools (only in 60% PPs) that are available there. Almost one fifth (21%) of the primary schools do not have drinking
water facilities and 26% schools (among all categories) are without toilet facilities. Nearly 50% of the schools do not have
separate toilet facilities for girls and boys. The major issue of concern in both the aanganwadis and baalwadis is the lack
of toilet facilities as approximately 50% of both lack the same, despite both these programs being central to the
government's mother and child health care policies and gender equity.
Absence of planned development of PPs is a major reason for absence of waste disposal facilities (both liquid and solid
waste). In the absence of sewer facilities 88% of the households let waste water flow into open drains and streets,
causing a major health hazard, as only 12% of the total households have access to a sewer or septic tank in which to
dispose grey water.
Like any other slums of the city, the availability of dustbins, their regular cleaning and user's waste disposal behaviour
are not very different here. Lack of a defined garbage dump point or designated areas for solid waste disposal and
inefficient municipal services could be responsible for more than 53% households dumping waste in the open making
the area vulnerable to diseases borne by flies and mosquitoes and other such parasites. Only 11% households in 380
PPs receive a doorstep facility for solid waste disposal and only 24% are taking the garbage to neighbourhood points. A
matter of serious concern is that 13% of the households are letting the garbage flow into drains.
A large percentage of poverty pockets (22%) remain totally deficient in terms of coverage by lined drains. Worse still,
where stagnant water was reported, garbage was being thrown in the drainage channels of the slum implying a serious
cyclical problem of water logging. As a result over 40% of the Poverty Pockets reported the incidence of water logging.
This is also because only 11% (approx.) of drains are lined in those PPs and not cleaned regularly.
In the perception of PLA (qualitative survey) respondents the open drainage system and water logging were serious
problems and contributed directly to unhygienic and unsanitary conditions in the slums. Another concern related to
unlined drains emerging from qualitative survey was the contamination of water sources such as taps were lines crossed
unlined drains. The PPSA thus calls for planning interventions for improvement of basic services in PPs with emphasis
on water and sanitation facilities.
Poverty Mapping - Bhopal

26
Poverty Mapping - Bhopal
NOTE TO THE ENUMERATOR AND MUNICIPAL CORPORATION STAFF: RECORD GENERAL OBSERVATIONS ABOUT THE NEIGHBOURHOOD ENVIRONS. THE PURPOSE IS TO CAPTURE FEATURES OF THE POCKET THAT ARE COMMON TO ALL DWELLINGS AND PERSONS LIVING IN THE AREA AND DEPICTING IT ON A MAP.
Q 1. Name of the Poverty PocketA. WARD NUMBER: …….
B. NAME OF THE WARD SUPERVISOR (HEALTH DEPARTMENT): ………
C. NAME OF THE SUB ENGINEER (WATER SUPPLY DEPARTMENT): ………….
Q 2.
a. Number of Households -------------
b. Population-------------
Q 3. Number of BPL Households
Q 4. Physical boundary landmarks for demarcating the North, South, East and West Edges for the pocket :
a.Distance from North to East Landmark ……………….
b.Distance from East to South Landmark ……………….
c.Distance from South to West Landmark ……………….
d.Distance from West to North Landmark ………………..
Q 5. Condition of roads:
a. Total Length of road…………………
b. Length of kucha road ………………..
c. Length of pucca road …………………
(In Kilometre)
Q 6. Condition of drains:
a. Total Length of drains …………..
b. Length of pucca drains …………..
c. Length of kucha drains .....................
(In Kilometre)
Q 7. Is the area prone to water logging: Yes/No
Annexure - 1
PPSA Questionnaire
27
Poverty Mapping - Bhopal
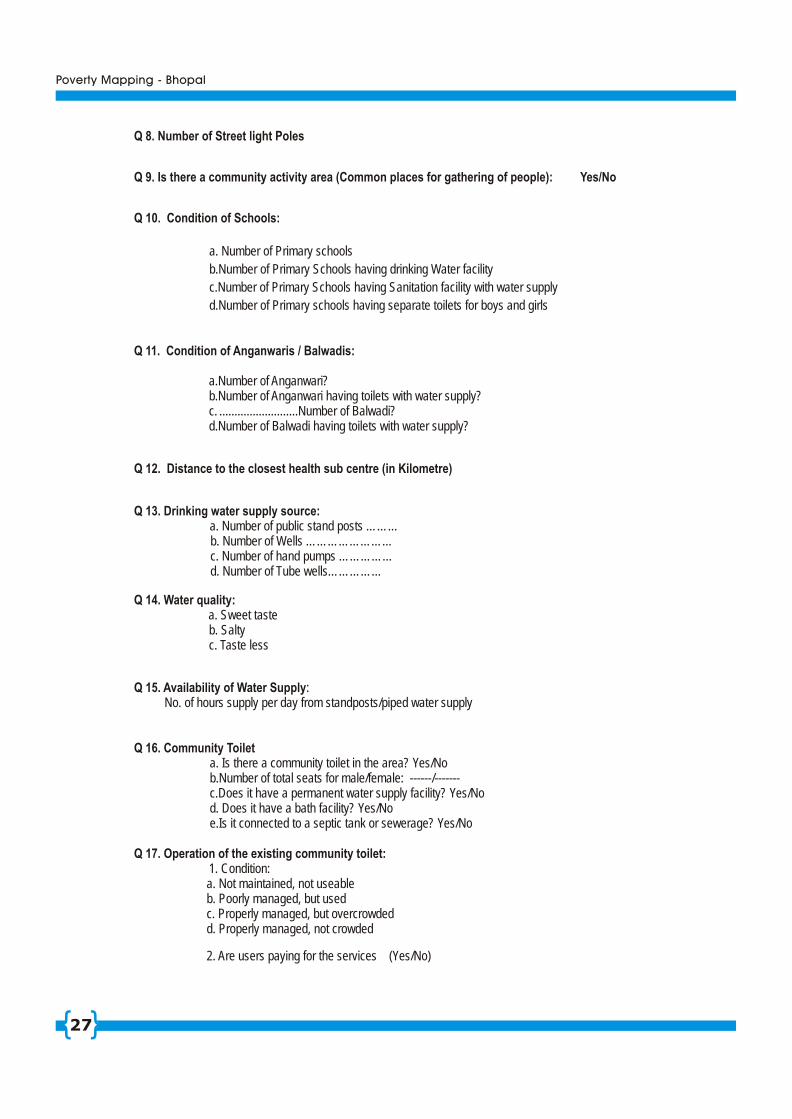
Q 8. Number of Street light Poles
Q 9. Is there a community activity area (Common places for gathering of people): Yes/No
Q 10. Condition of Schools:
a. Number of Primary schools
b.Number of Primary Schools having drinking Water facility
c.Number of Primary Schools having Sanitation facility with water supply
d.Number of Primary schools having separate toilets for boys and girls
Q 11. Condition of Anganwaris / Balwadis:
a.Number of Anganwari?b.Number of Anganwari having toilets with water supply?c. ..........................Number of Balwadi?d.Number of Balwadi having toilets with water supply?
Q 12. Distance to the closest health sub centre (in Kilometre)
Q 13. Drinking water supply source: a. Number of public stand posts ………b. Number of Wells ……………………c. Number of hand pumps ……………d. Number of Tube wells……………
Q 14. Water quality:a. Sweet tasteb. Saltyc. Taste less
Q 15. Availability of Water Supply: No. of hours supply per day from standposts/piped water supply
Q 16. Community Toileta. Is there a community toilet in the area? Yes/Nob.Number of total seats for male/female: ------/-------c.Does it have a permanent water supply facility? Yes/Nod. Does it have a bath facility? Yes/Noe.Is it connected to a septic tank or sewerage? Yes/No
Q 17. Operation of the existing community toilet:1. Condition:a. Not maintained, not useableb. Poorly managed, but used c. Properly managed, but overcrowdedd. Properly managed, not crowded
2. Are users paying for the services (Yes/No)

28
Poverty Mapping - Bhopal
* Note 1: In items 19, 20 and 21 the number of Households in various categories should add up to the total number of households in the area as given in 02
Note 2: Except Q : 1, 2, 3, 7, 12, 15, 17, 18, 19 the remaining physical features should be depicted on a map prepared on a scale of 1 : 600 (1” = 50') with clear boundary demarcations.
Q 18. Solid waste scenario:
Either of:
a.Facility of solid waste collection at the doorstepsb.Facility of solid waste collection at the neighbourhood pointsc.Solid waste is dumped openly in the area d.Solid waste finding its way into the drains
Q 19* Disposal of Grey water (waste water from household chores):
a.Number of households letting it out on the streetb.Number of households disposing to open drainsc.Number of households disposing to septic tanksd.Number of households disposing by sewerage system
Q 20*. Sanitary facilities scenario:
a. Number of Households having individual toilets,b.Number of Households using community toilet…………………………c.Number of households defecating in the open………………
Q 21*. Drinking water supply scenario:
a.Number of Households having access to Piped water supply ………………….b.Number of households using public standposts/taps, borehole or pump, protected wells,
protected springs or rainwater/ handpumps …………………c.Number of households depending on tankers, vendor provided water or unprotected wells
and springs…………..........................
Municipal Corporation Staff 1 Municipal Corporation Staff 2
Name………………………... Name………………………...
Designation ………………… Designation………………….
Sign…………………………. Sign………………………….
Enumerator 1 Enumerator 2
Name………………………... Name………………………...
Sign…………………………. Sign………………………….

29
Poverty Mapping - Bhopal
REPORT FORMAT [ALL IN KILOMETRES]
Length of roads (pucca and kucha)
Length of pucca drains
% of length not covered with pucca drains
[1-{(b)/(a)}] * 100
(a) (b) (c)
Q.05 answer code=1 Q.06 answer code=2
Length of roads (pucca and kucha)
Length of pucca road
% of deficiency of pucca road [1-{(b)/(a)}] * 100
(a) (b) (c)
Q.05 answer code=1 Q.05 answer code=3
Length of roads (pucca and kucha)
No. of existing streetlights
% of deficiency in street lights [1-{(b)/((a)/30)}]*100
(a) (b) (c)
Q.05 answer code=1 Q.08
Total Number of Households
Households served by Piped Water
Supply
% of households not covered with piped water supply
[1-((b)/(a))]* 100
(a) (b) (c)
Q2.0 answer code=1
Q.21 answer code=1
No of hours supply per day % of hourly supply available to population
(% of hours supply ) [(b)/24] * 100
(a) (b)
Q.15
Total number of Households
Households covered with toilets
% of households not covered with toilets
[1-(b)/(a)]* 100
(a) (b) (c)
Q2 answer code=1 Q 20 answer code 1
30
Poverty Mapping - Bhopal
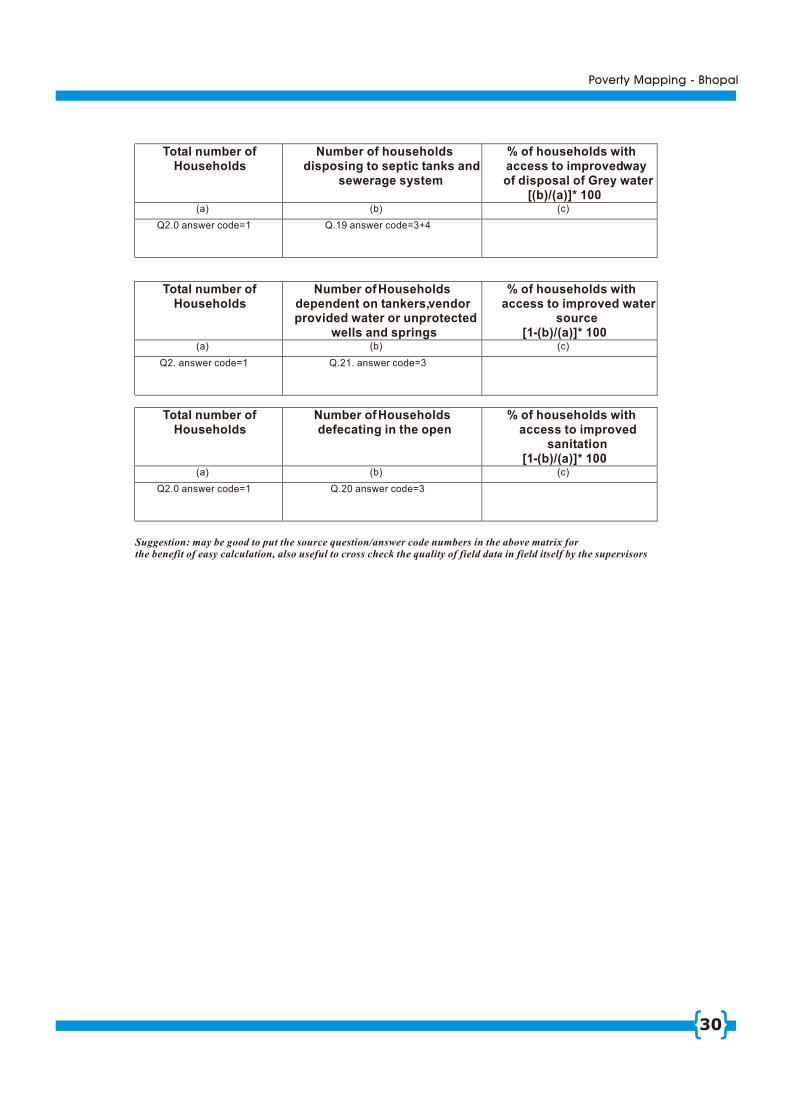
Total number of Households
Number of households disposing to septic tanks and
sewerage system
% of households with access to improved way of disposal of Grey water
[(b)/(a)]* 100 (a) (b) (c)
Q2.0 answer code=1 Q.19 answer code=3+4
Total number of Households
Number of Households dependent on tankers, vendor provided water or unprotected
wells and springs
% of households with access to improved water
source [1-(b)/(a)]* 100
(a) (b) (c)
Q2. answer code=1 Q.21. answer code=3
Total number of Households
Number of Households defecating in the open
% of households with access to improved
sanitation [1-(b)/(a)]* 100
(a) (b) (c)
Q2.0 answer code=1 Q.20 answer code=3
Suggestion: may be good to put the source question/answer code numbers in the above matrix forthe benefit of easy calculation, also useful to cross check the quality of field data in field itself by the supervisors

Partner Organisation :
Water Aid India25, Navjivan ViharMalviya NagarNew Delhi - 110017Tel. : +91-11-26692206 / 2693724Fax : +91-11-26691468E-mail : [email protected]
Programme Contact Person :
Programme ManagerWater for Cities ProgrammesUnited Nations Human Settlements Programme(UN-HABITAT)Water, Sanitation and Infrastructure BranchP.O. Box 30030, Nairobi, KenyaTel. : +254-20-7623060, 7625082Fax : +254-20-7623588E-mail : [email protected]
Chief Technical Advisor
Water for Asian Cities ProgrammeUnited Nations Human Settlements Programme(UN-HABITAT)EP 16/17, Chandragupta Marg, ChanakyapuriNew Delhi - 110 0021, IndiaTel. : +91-11-2410-4970/1/2/3Fax : +91-11-2410-4961E-mail [email protected]
Water Aid IndiaRegional Office WestE-7/846, Arera ColonyBhopal - 462 016Madhya PradeshTel. Fax : +91-755-4294724, 4294317
Chief Technical Advisor
Water for Asian Cities ProgrammeUnited Nations Human Settlements Programme(UN-HABITAT)E-1/191, Arera Colony, Bhopal - 462016, IndiaTel.: +91-755-2460836, Fax : +91-755-246037
DISCLAIMER
The designations employed and presentation of material in this publication do not imply the expression of any opinion whatsoever on the part of the Secretariat of the United Nations concerning the legal status of any country, territory, city or area of its authorities, or concerning the delimitation of its frontiers of boundaries or regarding its economic system or degree of development. The analysis, conclusion and recommendations of the report do not necessarily reflect the views of the United Nations Human Settlements Programme (UN-HABITAT), the Governing Council of UN-HABITAT or its Member States.
Excerpts may be reproduced without authorization, on condition that the source is indicated.
United Nations Human Settlements Programme (UN-HABITAT), 2006
UN-HABITAT Report on Poverty Mapping : A Situation Analysis of Poverty Pockets in Bhopal
HS/858/06E