a simplified model to predict oxygen attenuation on earth
TRANSCRIPT

0018-926X (c) 2017 IEEE. Personal use is permitted, but republication/redistribution requires IEEE permission. See http://www.ieee.org/publications_standards/publications/rights/index.html for more information.
This article has been accepted for publication in a future issue of this journal, but has not been fully edited. Content may change prior to final publication. Citation information: DOI 10.1109/TAP.2017.2765541, IEEETransactions on Antennas and Propagation
> REPLACE THIS LINE WITH YOUR PAPER IDENTIFICATION NUMBER (DOUBLE-CLICK HERE TO EDIT) <
1
Abstract— A simplified yet accurate model to predict oxygen
attenuation for Earth-space applications (10-350 GHz range) is
presented in this contribution. The model is developed by taking
advantage of an extensive set of high-resolution radiosonde
observations (RAOBS) collected in several sites worldwide. It
predicts the statistics of oxygen attenuation along the path by
retaining the accurate formulation for the specific oxygen
attenuation included in the Liebe MPM93 model, but it relies on
simplified meteorological input values (namely the mean yearly
ground temperature and the statistics of the ground water vapor
content), rather than on full atmospheric vertical profile. Tested
against attenuation estimates obtained from Liebe MPM93 model
coupled with the mentioned RAOBS data, the model provides a
very good prediction accuracy in the full 10-350 GHz range,
which turns out to be almost independent of the considered site.
Index Terms— Electromagnetic wave propagation, oxygen
attenuation, atmospheric effects, Earth-space links
I. INTRODUCTION
HE complexity of satellite communication (SatCom)
systems is progressively increasing in order to
accommodate the users’ request, which is slowly shifting from
simple TV broadcast to more comprehensive interactive
services (e.g. Internet via satellite, contents on demand, …)
[1]. The key requirement to deliver such services is large
bandwidth, which is available at higher frequency bands (e.g.
Ka, for gateways and users links, and Q and V for gateways in
the near future), at the expense of a strong increase in the
atmospheric impairments [2]. Among them, the attenuation
induced by rain has an extremely detrimental impact,
especially in the millimeter-wave range; nevertheless, it is of
paramount importance to devise accurate models for the
prediction of the effect of any constituent interacting with
electromagnetic waves, i.e. also clouds, water vapor and
oxygen [3]. In fact, as frequency increases, it is progressively
more critical to guarantee high levels of system availability,
such that even small differences in the power margin aimed at
coping with atmospheric impairments might have a
determinant role on the link quality. In addition, although
Manuscript received XXXX.
Lorenzo Luini and Carlo Riva are with the Dipartimento di Elettronica,
Informazione e Bioingegneria, Politecnico di Milano, Piazza Leonardo da
Vinci, 35, 20133, Milano, Italy, and with the Istituto di Elettronica e di
Ingegneria dell'Informazione e delle Telecomunicazioni (IEIIT), CNR,
Milano, Italy (e-mail: [email protected]).
gases definitely have a reduced contribution to total
attenuation if compared to clouds and hydrometeors, (save for
frequencies around absorption peaks, e.g. roughly 60 GHz for
oxygen and 22 GHz for water vapor), they are always present
in the atmosphere. When low-elevation angle applications are
concerned (e.g. links between ground stations and
Medium/Low Earth Orbit satellites [4]), even in absence of
clouds, the gaseous attenuation might amount to several dBs
(especially in tropical/equatorial sites) [5]. As a matter of fact,
any upgrade in the models’ prediction accuracy can yield a
significant improvement in estimating the link performance.
The most accurate and acknowledged methods to predict the
attenuation induced by oxygen, AOX, are mass absorption
models: typical examples are the methods proposed by Liebe
et al. (MPM93 [6]) and Roserkranz [7], for the 1-1000 GHz
frequency range, or methodologies implemented in popular
simulation software packages (e.g. MODTRAN®4 [8] and
LBLRTM [9]), which, however, are intended to be used
mostly for the THz range [10]. These methodologies integrate
along the path the specific attenuation due to oxygen OX,
whose variation along the profile is taken into due account by
employing vertical profiles of pressure (P), temperature (T)
and relative humidity (RH), typically collected using
radiosondes.
The Liebe’s MPM93 model is currently adopted by the
ITU-R (International Telecommunication Union –
Radiocommunication sector) in Annex 1 of Recommendation
P.676-11 [11]. Due to the difficulty in retrieving P-RH-T
vertical profiles worldwide and the complexity of such a
method, the same Recommendation includes (in Annex 2) also
an approximate AOX prediction approach, which relies on mean
yearly values of the ground temperature, pressure and relative
humidity and on the definition of the oxygen equivalent height,
taking into account, in a simplified way, the variation of OX
with height. Actually, this prediction method has a limited
applicability (altitudes below 10 km) and accuracy
(particularly degraded in some bands, such as 50-70 GHz) and
it estimates only the mean yearly value of AOX.
This work aims at overcoming such limitations by
presenting an alternative simplified prediction model for
Earth-space links operating in the 10-350 GHz frequency
range. Specifically, the proposed method, developed by taking
advantage of an extensive set of high-resolution radiosonde
observations (RAOBS) collected in 24 sites worldwide,
maximizes the prediction accuracy in the whole 10-350 GHz
A Simplified Model to Predict Oxygen
Attenuation on Earth-space Links
Lorenzo Luini, Senior Member, IEEE, and Carlo Riva, Senior Member, IEEE
T
0018-926X (c) 2017 IEEE. Personal use is permitted, but republication/redistribution requires IEEE permission. See http://www.ieee.org/publications_standards/publications/rights/index.html for more information.
This article has been accepted for publication in a future issue of this journal, but has not been fully edited. Content may change prior to final publication. Citation information: DOI 10.1109/TAP.2017.2765541, IEEETransactions on Antennas and Propagation
> REPLACE THIS LINE WITH YOUR PAPER IDENTIFICATION NUMBER (DOUBLE-CLICK HERE TO EDIT) <
2
frequency range and provides as output the full
Complementary Cumulative Distribution Function (CCDF) of
AOX. However, the method still relies on simplified
meteorological input values: the mean yearly ground
temperature and the CCDF of the ground water vapor content
(both of which are already available in terms of global digital
maps attached to ITU-R recommendations [12],[13]).
The remainder of the paper is organized as follows: Section
II presents the RAOBS dataset, while the central part of the
work lies in Section III, briefly recalling the MPM93 model
and presenting the new prediction model; its accuracy is tested
in Section IV, while Section V draws some conclusions.
II. THE RADIOSONDE OBSERVATION DATASET
RAOBS are a source of paramount importance for
atmospheric sciences (for instance, they are assimilated into
Numerical Weather Prediction – NWP – models), but are also
of a very useful means to study the Earth-space propagation of
electromagnetic waves, as they allow to quantify the effects
induced by atmospheric gases such as water vapor and oxygen
using accurate mass absorption models [6],[7]. In this
contribution, we take advantage of a large set of RAOBS data
collected in 24 sites across the Globe, for ten years and
characterized by high accuracy and fine vertical resolution.
The RAOBS dataset used in this work was extracted from
the NCAR (National Center for Atmospheric Research)
database. More in detail, it includes vertical profiles of
pressure, temperature and relative humidity, collected
regularly twice a day between 1980 and 1989 in 24 sites across
the Globe. Table I lists the details of the sites where
radiosondes were launched, showing coverage of different
latitudes, e.g. high (Finland) to equatorial (Singapore) ones.
Additional details on the RAOBS database are included in
[14], where the data validation is duly described. As an
example of the preprocessing procedures applied, RAOBS
levels showing inversions of pressure were excluded and
outliers of integrated parameters (e.g. the total water vapor
content) were discarded.
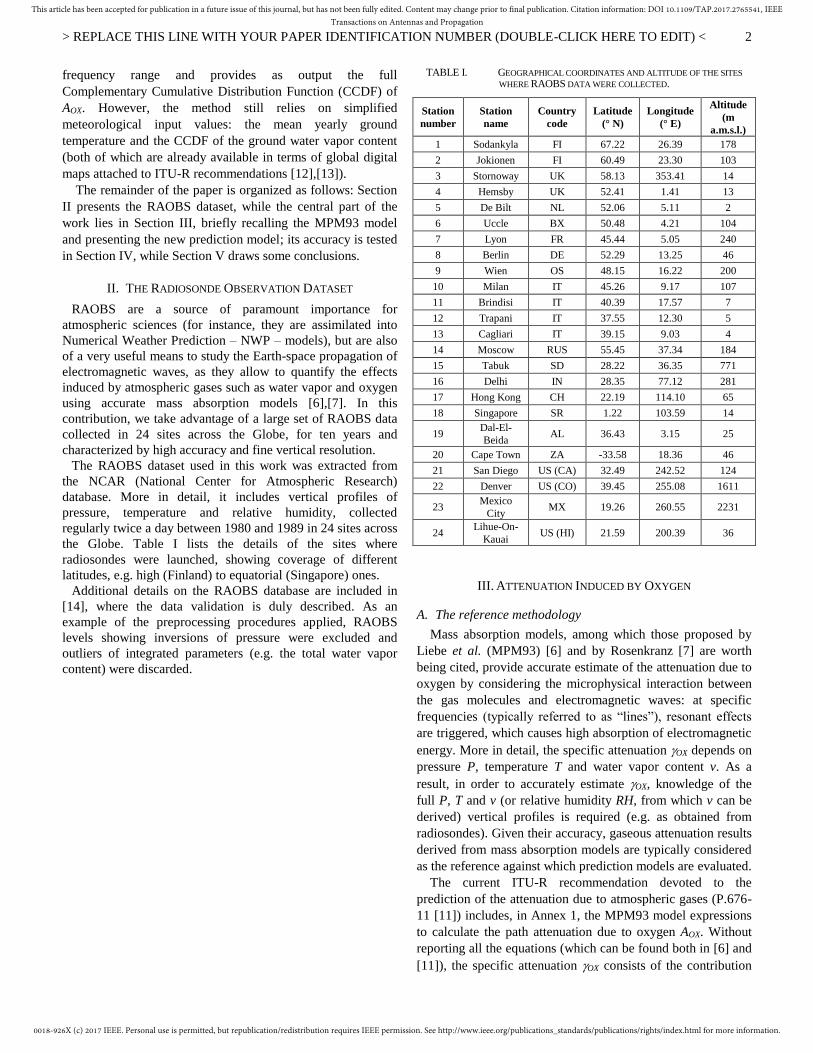
TABLE I. GEOGRAPHICAL COORDINATES AND ALTITUDE OF THE SITES
WHERE RAOBS DATA WERE COLLECTED.
Station
number
Station
name
Country
code
Latitude
(° N)
Longitude
(° E)
Altitude
(m
a.m.s.l.)
1 Sodankyla FI 67.22 26.39 178
2 Jokionen FI 60.49 23.30 103
3 Stornoway UK 58.13 353.41 14
4 Hemsby UK 52.41 1.41 13
5 De Bilt NL 52.06 5.11 2
6 Uccle BX 50.48 4.21 104
7 Lyon FR 45.44 5.05 240
8 Berlin DE 52.29 13.25 46
9 Wien OS 48.15 16.22 200
10 Milan IT 45.26 9.17 107
11 Brindisi IT 40.39 17.57 7
12 Trapani IT 37.55 12.30 5
13 Cagliari IT 39.15 9.03 4
14 Moscow RUS 55.45 37.34 184
15 Tabuk SD 28.22 36.35 771
16 Delhi IN 28.35 77.12 281
17 Hong Kong CH 22.19 114.10 65
18 Singapore SR 1.22 103.59 14
19 Dal-El-
Beida AL 36.43 3.15 25
20 Cape Town ZA -33.58 18.36 46
21 San Diego US (CA) 32.49 242.52 124
22 Denver US (CO) 39.45 255.08 1611
23 Mexico
City MX 19.26 260.55 2231
24 Lihue-On-
Kauai US (HI) 21.59 200.39 36
III. ATTENUATION INDUCED BY OXYGEN
A. The reference methodology
Mass absorption models, among which those proposed by
Liebe et al. (MPM93) [6] and by Rosenkranz [7] are worth
being cited, provide accurate estimate of the attenuation due to
oxygen by considering the microphysical interaction between
the gas molecules and electromagnetic waves: at specific
frequencies (typically referred to as “lines”), resonant effects
are triggered, which causes high absorption of electromagnetic
energy. More in detail, the specific attenuation OX depends on
pressure P, temperature T and water vapor content v. As a
result, in order to accurately estimate OX, knowledge of the
full P, T and v (or relative humidity RH, from which v can be
derived) vertical profiles is required (e.g. as obtained from
radiosondes). Given their accuracy, gaseous attenuation results
derived from mass absorption models are typically considered
as the reference against which prediction models are evaluated.
The current ITU-R recommendation devoted to the
prediction of the attenuation due to atmospheric gases (P.676-
11 [11]) includes, in Annex 1, the MPM93 model expressions
to calculate the path attenuation due to oxygen AOX. Without
reporting all the equations (which can be found both in [6] and
[11]), the specific attenuation OX consists of the contribution
0018-926X (c) 2017 IEEE. Personal use is permitted, but republication/redistribution requires IEEE permission. See http://www.ieee.org/publications_standards/publications/rights/index.html for more information.
This article has been accepted for publication in a future issue of this journal, but has not been fully edited. Content may change prior to final publication. Citation information: DOI 10.1109/TAP.2017.2765541, IEEETransactions on Antennas and Propagation
> REPLACE THIS LINE WITH YOUR PAPER IDENTIFICATION NUMBER (DOUBLE-CLICK HERE TO EDIT) <
3
of 44 absorption lines (from roughly 50 to 840 GHz), whose
intensity and shape vary from peak to peak and as a function of
P, T and v. Moreover, OX also includes a dry air continuum
term, which, for frequencies f above 10 GHz, is due to
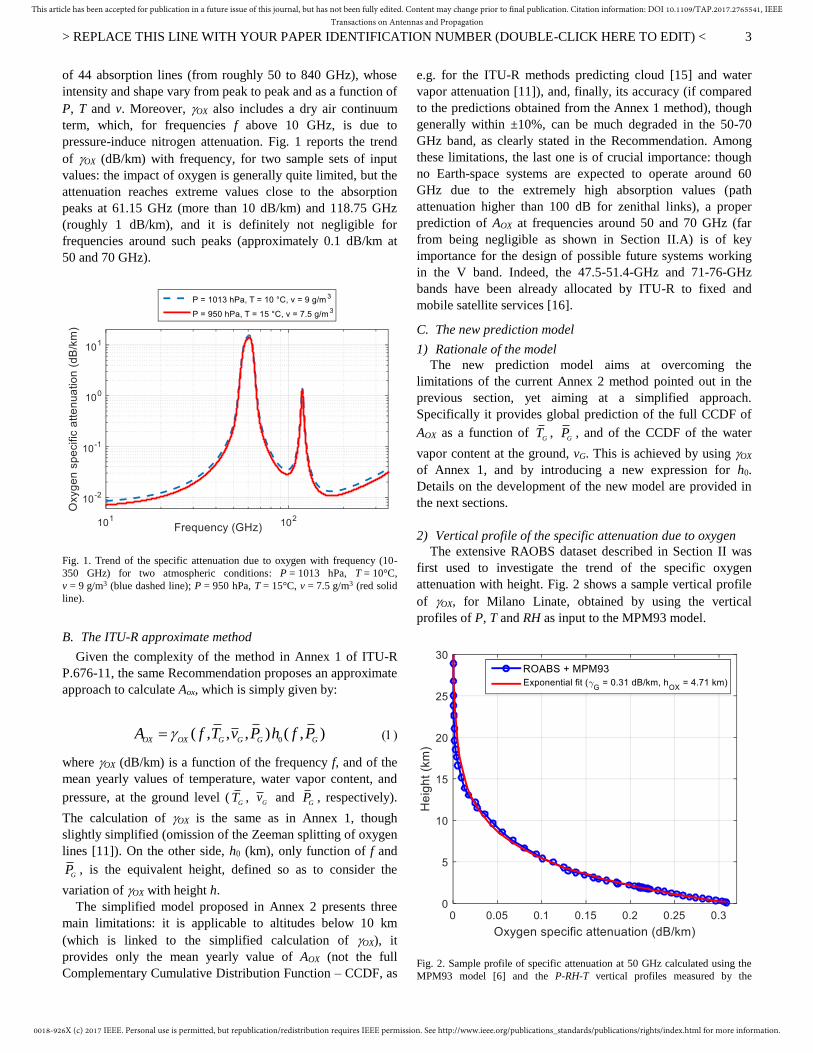
pressure-induce nitrogen attenuation. Fig. 1 reports the trend
of OX (dB/km) with frequency, for two sample sets of input
values: the impact of oxygen is generally quite limited, but the
attenuation reaches extreme values close to the absorption
peaks at 61.15 GHz (more than 10 dB/km) and 118.75 GHz
(roughly 1 dB/km), and it is definitely not negligible for
frequencies around such peaks (approximately 0.1 dB/km at
50 and 70 GHz).
Fig. 1. Trend of the specific attenuation due to oxygen with frequency (10-
350 GHz) for two atmospheric conditions: P = 1013 hPa, T = 10°C,
v = 9 g/m3 (blue dashed line); P = 950 hPa, T = 15°C, v = 7.5 g/m3 (red solid
line).
B. The ITU-R approximate method
Given the complexity of the method in Annex 1 of ITU-R
P.676-11, the same Recommendation proposes an approximate
approach to calculate Aox, which is simply given by:
0( , , , ) ( , )
OX OX G G G GA f T v P h f P
where OX (dB/km) is a function of the frequency f, and of the
mean yearly values of temperature, water vapor content, and
pressure, at the ground level (G
T , G
v and G
P , respectively).
The calculation of OX is the same as in Annex 1, though
slightly simplified (omission of the Zeeman splitting of oxygen
lines [11]). On the other side, h0 (km), only function of f and
GP , is the equivalent height, defined so as to consider the
variation of OX with height h.
The simplified model proposed in Annex 2 presents three
main limitations: it is applicable to altitudes below 10 km
(which is linked to the simplified calculation of OX), it
provides only the mean yearly value of AOX (not the full
Complementary Cumulative Distribution Function – CCDF, as
e.g. for the ITU-R methods predicting cloud [15] and water
vapor attenuation [11]), and, finally, its accuracy (if compared
to the predictions obtained from the Annex 1 method), though
generally within ±10%, can be much degraded in the 50-70
GHz band, as clearly stated in the Recommendation. Among
these limitations, the last one is of crucial importance: though
no Earth-space systems are expected to operate around 60
GHz due to the extremely high absorption values (path
attenuation higher than 100 dB for zenithal links), a proper
prediction of AOX at frequencies around 50 and 70 GHz (far
from being negligible as shown in Section II.A) is of key
importance for the design of possible future systems working
in the V band. Indeed, the 47.5-51.4-GHz and 71-76-GHz
bands have been already allocated by ITU-R to fixed and
mobile satellite services [16].
C. The new prediction model
1) Rationale of the model
The new prediction model aims at overcoming the
limitations of the current Annex 2 method pointed out in the
previous section, yet aiming at a simplified approach.
Specifically it provides global prediction of the full CCDF of
AOX as a function of G
T , G
P , and of the CCDF of the water
vapor content at the ground, vG. This is achieved by using OX
of Annex 1, and by introducing a new expression for h0.
Details on the development of the new model are provided in
the next sections.
2) Vertical profile of the specific attenuation due to oxygen
The extensive RAOBS dataset described in Section II was
first used to investigate the trend of the specific oxygen
attenuation with height. Fig. 2 shows a sample vertical profile
of OX, for Milano Linate, obtained by using the vertical
profiles of P, T and RH as input to the MPM93 model.
Fig. 2. Sample profile of specific attenuation at 50 GHz calculated using the
MPM93 model [6] and the P-RH-T vertical profiles measured by the
0018-926X (c) 2017 IEEE. Personal use is permitted, but republication/redistribution requires IEEE permission. See http://www.ieee.org/publications_standards/publications/rights/index.html for more information.
This article has been accepted for publication in a future issue of this journal, but has not been fully edited. Content may change prior to final publication. Citation information: DOI 10.1109/TAP.2017.2765541, IEEETransactions on Antennas and Propagation
> REPLACE THIS LINE WITH YOUR PAPER IDENTIFICATION NUMBER (DOUBLE-CLICK HERE TO EDIT) <
4
radiosonde launched at Milano Linate airport (blue circles) and its
exponential fit (red curve).
It is clear from the figure that the OX profile can be
accurately modeled by an exponential expression:
( ) exp( )OX G OX
h h h
where G (dB/km) is the oxygen specific attenuation relative to
the ground, while hOX (km), typically named scale height,
regulates the decay of OX with height. The legend in Fig. 2
reports G and hOX obtained by fitting the expression in (2) to
the RAOBS-derived OX profile. For the sake of comparison,
the equivalent height, calculated according to Annex 2 of ITU-
R P.676-11 (see (1)) is h0 = 5.07 km.
Starting from (2), the zenithal path attenuation due to
oxygen is obtained by integrating OX vertically:
/
0 km
OXh h
OX G G OXA e dh h
(3)
According to (3), the oxygen scale height is equal to the
equivalent height, and can be used, together with the ground
specific attenuation due to oxygen, to accurately approximate
AOX. As an example, for the profile shown in Fig. 2,
AOX = 1.37 dB and 1.46 dB (roughly 5% of percentage
difference) according to the MPM93 model and equation (3),
respectively, where, as indicated in the legend of Fig. 2,
G = 0.31 dB/km and hOX = 4.71 km.
3) Oxygen scale height
This section investigates the dependence of the oxygen scale
height on frequency, as well as on ground pressure,
temperature and water vapor content, in order to define an
analytical expression to relate hOX to simple local
meteorological inputs. To this aim, the full set of RAOBS data
was exploited (see Table I). Specifically, hOX was calculated
for each ascent of each RAOBS station by fitting equation (2)
to the MPM93-derived vertical profile of OX (see Fig. 2). This
exercise was repeated for frequencies ranging from 10 GHz
(limit below which the zenithal path attenuation due to oxygen
falls below 0.05 dB) to 350 GHz (the limit of validity for the
approximated method in Annex 2 of ITU-R P.676-11). The
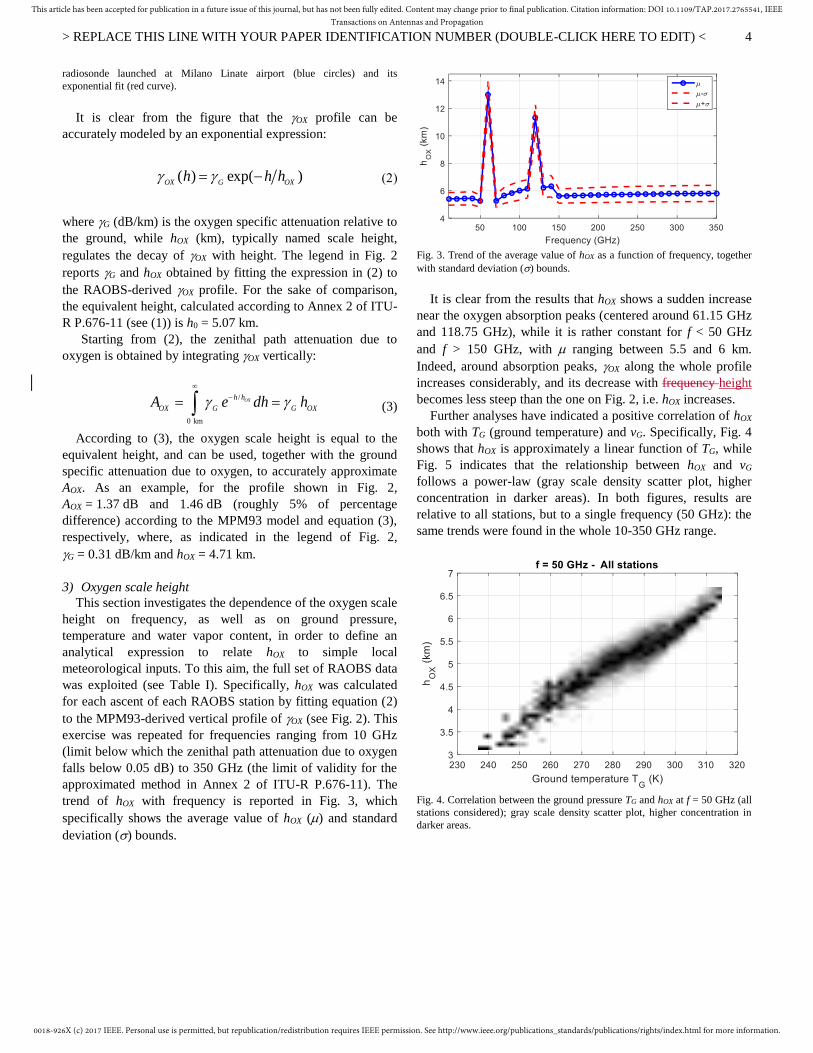
trend of hOX with frequency is reported in Fig. 3, which
specifically shows the average value of hOX () and standard
deviation () bounds.
Fig. 3. Trend of the average value of hOX as a function of frequency, together
with standard deviation () bounds.
It is clear from the results that hOX shows a sudden increase
near the oxygen absorption peaks (centered around 61.15 GHz
and 118.75 GHz), while it is rather constant for f < 50 GHz
and f > 150 GHz, with ranging between 5.5 and 6 km.
Indeed, around absorption peaks, OX along the whole profile
increases considerably, and its decrease with frequency height
becomes less steep than the one on Fig. 2, i.e. hOX increases.
Further analyses have indicated a positive correlation of hOX
both with TG (ground temperature) and vG. Specifically, Fig. 4
shows that hOX is approximately a linear function of TG, while
Fig. 5 indicates that the relationship between hOX and vG
follows a power-law (gray scale density scatter plot, higher
concentration in darker areas). In both figures, results are
relative to all stations, but to a single frequency (50 GHz): the
same trends were found in the whole 10-350 GHz range.
Fig. 4. Correlation between the ground pressure TG and hOX at f = 50 GHz (all
stations considered); gray scale density scatter plot, higher concentration in
darker areas.

0018-926X (c) 2017 IEEE. Personal use is permitted, but republication/redistribution requires IEEE permission. See http://www.ieee.org/publications_standards/publications/rights/index.html for more information.
This article has been accepted for publication in a future issue of this journal, but has not been fully edited. Content may change prior to final publication. Citation information: DOI 10.1109/TAP.2017.2765541, IEEETransactions on Antennas and Propagation
> REPLACE THIS LINE WITH YOUR PAPER IDENTIFICATION NUMBER (DOUBLE-CLICK HERE TO EDIT) <
5
Fig. 5. Correlation between the ground pressure vG and hOX at f = 50 GHz (all
stations considered); gray scale density scatter plot, higher concentration in
darker areas.
On the contrary, almost no correlation was found between
hOX and PG, as shown in Fig. 6. The different “zones” clearly
discernible in Fig. 6 are associated to stations lying at different
altitudes (see Table I). In fact, while the height of most sites is
lower than 300 m a.m.s.l., Tabuk (SD), Denver (USA) and
Mexico City (MX) are more elevated (771 m, 1611 and 2231
m), i.e. associated to lower values of PG.
Fig. 6. Correlation between the ground pressure PG and hOX at f = 50 GHz (all
stations considered).
4) Total path attenuation
As anticipated in Section II.C2, the zenithal path attenuation
due to oxygen AOX (dB) can be calculated with good accuracy
from the knowledge of the ground specific attenuation and the
oxygen scale height. Hence, we propose the following
expression to calculate the attenuation due to oxygen,
exceeded with probability, p, between 0.005 and 1 (absolute
value), in an average year, along a link with elevation angle
between 5° and:
0
( , , ( ), ) ( , , ( ))( )
sin
OX G G G G G
OX
f T v p P h f T v pA p
The specific attenuation due to oxygen is calculated
according to the MPM93 model/Annex 1 of Recommendation
P.676-11, while the oxygen scale height is given by
2 261.15 118.75
1.58 1.44
0
0.543 4
( , , ( )) 10.27 8.87
6.1 10 0.36 ( ) 1.5 10 3.28
f f
G G
G G
h f T v p e e
f v p T
and depends on frequency, as well as on the ground
temperature and water vapor content, on the basis of the
correlations pointed out in the previous section. As is clear
from (4) and (5), aiming at devising a prediction model of
simple applicability, we opted for a compromise between
accuracy and complexity. Indeed, both yOX and hOX receive as
input mean yearly values as for ground temperature and
pressure, while only the ground water vapor content is
provided in statistical terms (CCDF). A further simplification
to the model comes from the fact that, given the reduced
impact of pressure on both yOX and hOX, G
P (hPa) can actually
be calculated assuming a standard atmospheric pressure at the
mean sea level of 1013.25 hPa [17] and the following
exponential profile for pressure (confirmed by the full RAOBS
dataset) [18]:
7.6
01013.25
SS
P
h h
h
GP P e e
where hS is the site altitude in km. The RAOBS analysis
pointed out that the variation of hP is quite limited, both
throughout the year, and from site to site. Indeed the standard
deviation of hP (all sites, all profiles) is 0.23 km, which
increases the significance of the average value P
h =7.6 km.
The coefficients in (5) were derived using an optimization
procedure aiming at maximizing the agreement between the
CCDF of AOX, as calculated from the RAOBS dataset and the
MPM93 model (frequencies in the range 10-350 GHz) and as
estimated using (4) (G
T and vG(p) are extracted from RAOBS
data, while G
P is calculated according to (6)). It is worth
pointing out that only half of the 24 sites (see the 12 circles in
Fig. 7) were actually selected to regress the coefficients in (5),
while the remaining locations (12 asterisks) were employed
only to perform independent tests on the model’s prediction
accuracy, as thorough reported in the next section.
0018-926X (c) 2017 IEEE. Personal use is permitted, but republication/redistribution requires IEEE permission. See http://www.ieee.org/publications_standards/publications/rights/index.html for more information.
This article has been accepted for publication in a future issue of this journal, but has not been fully edited. Content may change prior to final publication. Citation information: DOI 10.1109/TAP.2017.2765541, IEEETransactions on Antennas and Propagation
> REPLACE THIS LINE WITH YOUR PAPER IDENTIFICATION NUMBER (DOUBLE-CLICK HERE TO EDIT) <
6
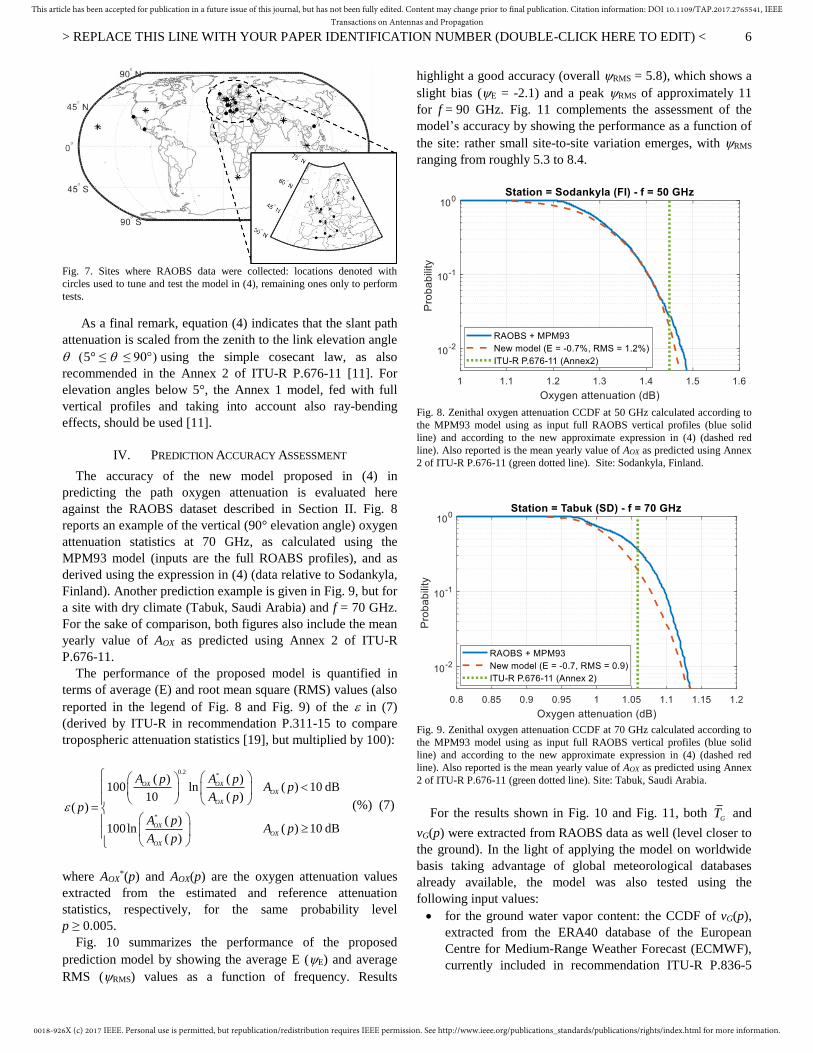
Fig. 7. Sites where RAOBS data were collected: locations denoted with
circles used to tune and test the model in (4), remaining ones only to perform
tests.
As a final remark, equation (4) indicates that the slant path
attenuation is scaled from the zenith to the link elevation angle
5° ≤ ≤using the simple cosecant law, as also
recommended in the Annex 2 of ITU-R P.676-11 [11]. For
elevation angles below 5°, the Annex 1 model, fed with full
vertical profiles and taking into account also ray-bending
effects, should be used [11].
IV. PREDICTION ACCURACY ASSESSMENT
The accuracy of the new model proposed in (4) in
predicting the path oxygen attenuation is evaluated here
against the RAOBS dataset described in Section II. Fig. 8
reports an example of the vertical (90° elevation angle) oxygen
attenuation statistics at 70 GHz, as calculated using the
MPM93 model (inputs are the full ROABS profiles), and as
derived using the expression in (4) (data relative to Sodankyla,
Finland). Another prediction example is given in Fig. 9, but for
a site with dry climate (Tabuk, Saudi Arabia) and f = 70 GHz.
For the sake of comparison, both figures also include the mean
yearly value of AOX as predicted using Annex 2 of ITU-R
P.676-11.
The performance of the proposed model is quantified in
terms of average (E) and root mean square (RMS) values (also
reported in the legend of Fig. 8 and Fig. 9) of the in (7)
(derived by ITU-R in recommendation P.311-15 to compare
tropospheric attenuation statistics [19], but multiplied by 100):
0.2
*
*
( ) ( )100 ln ( ) 10 dB
10 ( )( )
( )100ln ( ) 10 dB
( )
OX OX
OX
OX
OX
OX
OX
A p A pA p
A pp
A pA p
A p
(%) (7)
where AOX*(p) and AOX(p) are the oxygen attenuation values
extracted from the estimated and reference attenuation
statistics, respectively, for the same probability level
p ≥ 0.005.
Fig. 10 summarizes the performance of the proposed
prediction model by showing the average E (E) and average
RMS (RMS) values as a function of frequency. Results
highlight a good accuracy (overall RMS = 5.8), which shows a
slight bias (E = -2.1) and a peak RMS of approximately 11
for f = 90 GHz. Fig. 11 complements the assessment of the
model’s accuracy by showing the performance as a function of
the site: rather small site-to-site variation emerges, with RMS
ranging from roughly 5.3 to 8.4.
Fig. 8. Zenithal oxygen attenuation CCDF at 50 GHz calculated according to
the MPM93 model using as input full RAOBS vertical profiles (blue solid
line) and according to the new approximate expression in (4) (dashed red
line). Also reported is the mean yearly value of AOX as predicted using Annex
2 of ITU-R P.676-11 (green dotted line). Site: Sodankyla, Finland.
Fig. 9. Zenithal oxygen attenuation CCDF at 70 GHz calculated according to
the MPM93 model using as input full RAOBS vertical profiles (blue solid
line) and according to the new approximate expression in (4) (dashed red
line). Also reported is the mean yearly value of AOX as predicted using Annex
2 of ITU-R P.676-11 (green dotted line). Site: Tabuk, Saudi Arabia.
For the results shown in Fig. 10 and Fig. 11, both G
T and
vG(p) were extracted from RAOBS data as well (level closer to
the ground). In the light of applying the model on worldwide
basis taking advantage of global meteorological databases
already available, the model was also tested using the
following input values:
for the ground water vapor content: the CCDF of vG(p),
extracted from the ERA40 database of the European
Centre for Medium-Range Weather Forecast (ECMWF),
currently included in recommendation ITU-R P.836-5

0018-926X (c) 2017 IEEE. Personal use is permitted, but republication/redistribution requires IEEE permission. See http://www.ieee.org/publications_standards/publications/rights/index.html for more information.
This article has been accepted for publication in a future issue of this journal, but has not been fully edited. Content may change prior to final publication. Citation information: DOI 10.1109/TAP.2017.2765541, IEEETransactions on Antennas and Propagation
> REPLACE THIS LINE WITH YOUR PAPER IDENTIFICATION NUMBER (DOUBLE-CLICK HERE TO EDIT) <
7
[12] (spatial resolution: 1.125°×1.125°);
for the ground temperature: mean yearly values extracted
again from the ERA40 database, but not yet included in
any ITU-R recommendation (however, the digital map of
GT , but with spatial resolution of 1.5°×1.5°, is currently
attached to recommendation ITU-R P.1510-0 [13]).
Fig. 10. Mean E (E) and mean RMS (RMS) as a function of frequency
(average over all stations).
Fig. 11. Mean E (E) and mean RMS (RMS) as a function of the RAOBS site
(average over all frequencies).
The results obtained using such NWP products are very
similar to those reported in Fig. 10 and Fig. 11: the trends of
E and RMS, both with frequency and with site, are the same,
but the overall score shows just a slight worsening (E = -2.9
and RMS = 6.1). This corroborates the use of the proposed
model for the prediction of AOX statistics, which represents a
significant improvement over the approximate prediction
method currently proposed in Annex 2 of recommendation
ITU-R P.676-11.
V. CONCLUSIONS
This contribution presents a simplified yet accurate model
for the prediction oxygen attenuation at millimeter-wave on
Earth-space links, which receives as input simple local
meteorological information, namely the mean yearly ground
temperature G
T and the statistics of ground water vapor
content vG(p). Taking advantage of an extensive set of RAOBS
ascents collected in several sites worldwide and characterized
by high accuracy and reliability, the model is devised by
investigating and modeling the dependence of the oxygen
equivalent scale height on frequency, as well as on G
T and
vG(p), while the ground specific oxygen attenuation is
calculated according to the accurate formulation included in
the Liebe’s MPM93 mass absorption model.
The proposed model, tested against reference oxygen
attenuation statistics obtained using the Liebe MPM93 model
coupled with the mentioned RAOBS dataset, shows a very
satisfactory accuracy, both in terms of overall prediction error
(average RMS equal to 5.8, considering all sites and all
frequencies), as well as in terms of performance stability,
which turns out to be slightly dependent on frequency, and
almost independent of the considered site.
ACKNOWLEDGMENT
The authors would like to acknowledge Dr. Martellucci
from the European Space Agency for the provision of FERAS
radiosonde data.
REFERENCES
[1] A. Botta, A. Pescape, “On the performance of new generation satellite broadband internet services,” IEEE Communications Magazine, pp. 202-209, Vol. 52, Issue 6, 2014.
[2] J.E. Allnutt, “Satellite to ground radiowave propagation,” 2nd edition, the IET.
[3] C. Riva, C. Capsoni, L. Luini, M. Luccini, R. Nebuloni, A. Martellucci, “The Challenge of Using the W Band in Satellite Communication,” Int. J. Satell. Commun. Network., 2014; 32:187–200.
[4] L. Luini, C. Capsoni, R. Nebuloni, “Free Space Optics to Enable High Data Rate Download from LEO Satellites: the Impact of Clouds”, 3rd International Workshop on Optical Wireless Communications – 2014 (IWOW2014), pp. 35-39, 17-19 September 2014, Funchal, Madeira, Portugal.
[5] P. Bouchard, “Approximate method for estimating gaseous loss at very low angles along paths of finite length and earth-space paths,” IEEE Trans. Antennas Propag., vol. 64, no. 2, pp. 687–699, Feb. 2016.
[6] H. J. Liebe, G. A. Hufford, M. G. Cotton, “Propagation modeling of moist air and suspended water/ice particles at frequencies below 1000 GHz,” in Proc. AGARD 52nd Spec. Meeting EM Wave Propag.
[7] P. Rosenkranz, “Water vapor microwave continuum absorption: A comparison of measurements and models,” Radio Sci., vol. 33, no. 4, pp. 919–928, Jul./Aug 1998.
[8] A. Berk et al., “MODTRAN4 radiative transfer modeling for atmospheric correction,” Proc. SPIE, vol. 3756, pp. 348-353, Oct. 1999.
[9] LBLRTM. accessed on Nov. 2016. [Online]. Available: http://rtweb.aer.com/lblrtm.html.
[10] J. Sun, F. Hu, S. Lucyszyn, “Predicting atmospheric attenuation under pristine conditions between 0.1 and 100 THz,” IEEE Access, vol. 4, pp. 9377-9399, Nov. 2016.
[11] ITU-R recommendation P.676-11, “Attenuation by atmospheric gases,” Geneva, Switzerland, 2016.
[12] ITU-R recommendation P.836-5, “Water vapour: surface density and total columnar content,” Geneva, Switzerland, 2013.
[13] ITU-R recommendation P.1510-0, “Annual mean surface temperature,” Geneva, Switzerland, 2001.
[14] COST Action 255 Final Report, “Precipitation, Clouds and Other Related Non-Refractive Effects,” J. P. V. Poiares Baptista, Ed. Noordwijk, The Netherlands: ESA Publication Division, ch. 3.2.
[15] ITU-R recommendation P.840-6, “Attenuation due to clouds and fog,” Geneva, Switzerland, 2013.
[16] ITU-R, “Radio Regulations,” Geneva, Switzerland, November 2016.
[17] International Organization for Standardization, Standard Atmosphere, ISO 2533:1975, 1975.
[18] L. Luini, C. Capsoni, “Using NWP Reanalysis Data for Radiometric Calibration in Electromagnetic Wave Propagation Experiments,” IEEE

0018-926X (c) 2017 IEEE. Personal use is permitted, but republication/redistribution requires IEEE permission. See http://www.ieee.org/publications_standards/publications/rights/index.html for more information.
This article has been accepted for publication in a future issue of this journal, but has not been fully edited. Content may change prior to final publication. Citation information: DOI 10.1109/TAP.2017.2765541, IEEETransactions on Antennas and Propagation
> REPLACE THIS LINE WITH YOUR PAPER IDENTIFICATION NUMBER (DOUBLE-CLICK HERE TO EDIT) <
8
Transactions on Antennas and Propagation, vol. 64, no. 2, Page(s): 700 - 707, February 2016.
[19] ITU-R recommendation P.311-15, “Acquisition, presentation and analysis of data in studies of tropospheric propagation,” Geneva, Switzerland, 2015.