a simple incubation tank for photosynthesis measurements ... · a simple incubation tank for...
TRANSCRIPT

A simple incubation tank for photosynthesis measurementswith six light intensities
Viktor R. Toth* and Sandor Herodek
Hungarian Academy of Sciences, Balaton Limnological Research Institute, Klebelsberg K.u. 3, Tihany, 8237, Hungary
Received 30 January 2009; Accepted 7 July 2009
Abstract – The aim of the study was to design and put together a compact, easy-to-assemble and cost-efficient incubation system for aquatic plant photosynthesis measurements. Incubation tank consisting of glass
sidewalls and mirror inner walls was constructed. The tank was split into six incubation cells and two watercollecting cells. Each incubation cell was built of mirror with reflective side turned into the incubation cells toprevent the self shading of plants and minimized the variance of light intensity within the cell. The wall of
each incubation cell facing the source of light was made of 3 mm glass and was covered by light absorbingfilm. To produce different light intensities single light source (fluorescent tubes) and light absorbing film(3M ScotchtintTM Sun Control RE50NEARL) were chosen. The sidewall of each incubation cell was covered
with metal-coated neutral sun control film to produce six distinct light intensities. The different transparencyof the sidewalls was achieved by lamination of the chosen film in increasing numbers of layers. The effect ofthe lamination on optical properties of the film was also studied. The variation of photon flux density within acell was 3.9%. Continuous use of the system and occasional repetitive measurements of film’s transparency
showed that it maintained its neutral optical properties over a long period of time.
Key words: Incubation tank / photosynthesis / light intensities / aquatic macrophytes / ecophysiology
Introduction
Irradiance in aquatic environment shows great tem-poral, spatial and spectral variation (Sand-Jensen, 1989;Bjorkman and Demmig-Adams, 1994; Kirk, 1996; Wetzel,2001). Besides the atmospheric attenuation of solarradiation, light in the water column is altered by additionalfactors like air/water surface reflection, back-scattering,absorption by water and suspended particles, shadingeffect of aquatic macrophytes and epiphytes (Sand-Jensen,1989; Kirk, 1996; Van Duin et al., 2001). The greatdeviation in photon flux density in aquatic environmentdemands a photosynthetic apparatus with equally greatresponsiveness.
Photosynthesis is one of the most studied processesof macrophyte physiology (for example: Maberly, 1983;Sand-Jensen and Madsen, 1991; Schwarz and Howard-Williams, 1993; etc.). The sensitivity of photosynthesis toa large amount of abiotic (Adams et al., 1974; Madsenand Sand-Jensen, 1991; Madsen et al., 1996; Short andNeckles, 1999) and biotic factors (Sand-Jensen, 1977;
Kirk, 1996; Larcher, 2003) makes it a perfect tool for stressphysiological researches, as an indicator process in teststudies and environmental risk assessments, etc. (Wangand Freemark, 1995; Nystrom et al., 2002; Lambert et al.,2006). The only limitation that stops the spread and usageof plants photosynthesis processes for test proceduresis the price and the complexity of equipments used forphotosynthesis measurements.
A great variety of non-destructive method of photo-synthesis measurements is known. In studies of recentyears mostly chlorophyll fluorescence was used for esti-mation of photosynthetic capacity of a plant (Nystromet al., 2002; Eggert et al., 2003; Cedergreen et al., 2005;Lambert et al., 2006; Shen and Song, 2007). Besideschlorophyll fluorescence oxygen consumption and carbonemission can be utilised in experiments via direct measure-ment with different types of electrodes (Vermaat andVerhagen, 1996; Maberly and Madsen, 1998; Asaedaet al., 2004; Jones, 2005; Shen and Song, 2007; Machovaet al., 2008). A number of experiments used specialequipments that employ either the O2 consumption(Kamara and Pflugmacher, 2007 and references) or theCO2 emission of the photosynthesis (Silva et al., 2005).*Corresponding author: [email protected]
Article published by EDP Sciences
Ann. Limnol. - Int. J. Lim. 45 (2009) 195–202 Available online at:� EDP Sciences, 2009 www.limnology-journal.orgDOI: 10.1051/limn/2009019

All the above mentioned equipments are factory-built, butsubstantially could be easily replaced by a cheaper and stilleffective apparatus made by the scientist itself.
The rate of photosynthesis is mostly affected byirradiance (Adams et al., 1974; Madsen and Sand-Jensen,1991), therefore the most important part of the equipmentshould be the careful planed light sources. To record thelight curve of photosynthesis (photosynthetic response tovarying light intensities) a number of light intensities isneeded. To produce discrete light intensities for photo-synthesis study two alternative ways are possible. The firstpossibility is the use of multiple artificial light sources toproduce each light intensity individually by changing theintensity of the emitted light. Alternatively, there is apossibility of use of a single light source. Different lightintensities would be produced by attenuating irradianceof this light source. The former solution can result aspectrally diverse set of light sources and led to deceptivereadings of photosynthesis, while the latter producespectrally identical sources, that differ only in the intensityof light.
In this study we describe a compact, easy-to-assembleand cost-efficient incubation system for measuring aquaticplant photosynthesis. Using this system it is possible tomeasure the light response curves with six discrete lightintensities (and in the dark) on multiple aquatic organismsat the same time. The temperature and the light gradientof the incubation system could be easily modified, whichmakes the equipment more exploitable.
Materials and methods
In the experiments as source of light metal-halide(A5, Tungsram, Hungary, correlated colour temperature –4500 K) and fluorescent (F33 Coolwhite, Tungsram,Hungary, correlated colour temperature 4000 K) lampswere used.
For attenuation of emitted light ScotchtintTM SunControl and ScotchshieldTM Ultra Safety and SecurityWindow films (3M, USA) were used. Spectral profile offilms was assessed with a spectrophotometer (UV-1601,Shimadzu, Japan).
Spatial distribution of irradiance within the incubationtank was measured with a spherical irradiance meterUS-SQS/L sensor (WALZ, Germany) and the data werecollected by a LI-COR LI 1400 data logger (LI-CORBiosciences GmbH, Germany).
The control of temperature was maintained by acooling-heating bath (Neslab RTE-17, Thermo Electron,USA). The temperature within the incubation tank, andeach incubation cell was recorded with digital thermo-meter (Testo mini 525, Testo, UK).
For testing the incubation system on submergedmacrophytes Potamogeton perfoliatus L., Myriophyllumspicatum L., Najas marina L. and Ceratophyllum demersumL. were used. Substrate attached intact plants werecollected by hand in the surroundings of the BalatonLimnological Research Institute (46x 54' 46.54'' N, 17x 53'
37.53'' E) in the best possible condition. At arrival tolaboratory no pre-incubation was performed. The 3rd and4th youngest fully grown leaves (branches of N. marina)were detached, thoroughly washed and placed into aKarlsruhe vials, filled with filtered (pore size 0.45 mm) andaerated (95% saturation) lake water. Water filled vialswere transferred into the incubator and the temperature ofthe cooling heating bath was set to actual water tempera-ture of lake Balaton. Mixing was provided by stirring barsand specially made magnetic stirrers (rotation speed –30 rpm) placed under the incubation tank. Photosynthesiswas measured using oxygen electrode (TriOxmatic 300,WTW, Germany) connected to a data logger (Oxi 539microprocessor precision oxygen meter, WTW,Germany).
Results and discussion
Incubation tank
The incubation tank was designed to fit 6, 235 mmlong, 80 mm wide and 110 mm deep incubation cells(Fig. 1 labelled from A to F) and two water collecting cells(80 mm long and 165 mm wide, Fig. 1, a and b). Eachincubation cell was considered to take three Karlsruhevials, while the water collecting cells were planed tosimplify the inlet and outlet of water and the regulationof water level within the incubation tank. The innersidewalls of incubation cells (Fig. 1, solid lines) were madeof 3 mm mirror glass with reflective side facing inside eachincubation cell. The 4th wall (Fig. 1, dotted line) facing thelight source was made of a 3 mm glass. The incubationtank was glued onto the reflective side of 6 mm thick(950r180 mm) mirror glass base. The neighbouringincubation cells within rows A-B-C and D-E-F were sepa-rated by a 6 mm gap. Each short (80 mm) wall of theincubation cells had a hole and the walls were arranged sothat light from the adjacent cells could not get through,but the water would pass through the hole, to the gapsand into the neighbouring cell easily (Fig. 1).
Light source
Metal-halide and fluorescent lamps were used as lightsources. A metal-halide lamp produced sufficient amountof light (2000–2500 mmol :mx2 :sx1), with optical proper-ties similar to irradiance of the Sun, but with excessiveradiation of heat. Illumination of a single incubation cellfor 30 min from distance of 10 cm without coolingincreased the temperature within the cell from 23.0¡0.0to 47.7¡1.5 xC. In contrast, a fluorescent tube producesonly a fraction of natural light’s irradiance (200–250 mmol :mx2 :sx1) with spectral properties that differfrom those of the Sun, but since it uses non-thermal radi-ation processes to produce light, the amount of emittedheat is not significant. The temperature in a single incu-bation cell after 30 min of illumination with fluorescent
V.R. Toth and S. Herodek: Ann. Limnol. - Int. J. Lim. 45 (2009) 195–202196

lamp from a distance of 10 cm without cooling increasedby 5.4¡0.6 xC. To achieve the necessary maximal ir-radiance for the photosynthesis measurements five 36 Wfluorescent lamps were arranged on a very short distanceparallel to each other. As a result of this arrangementmaximal light intensity of 1200 mmol :mx2 :sx1 wasreached. In our experiments F33 Coolwhite fluorescentlamps were used due to their relatively uniform radiationin the photosynthetically active radiation (PAR) range(only two significant energy peaks in the spectral powerdistribution).
To test the thermal capacity of the system we placed18 Karlsruhe vials (three in each incubation cell) into theincubation tank. The vials and the incubation tank werefilled with distilled water. The incubation cells closest towater inflow from the bath were the cell A and D, whilethe farthest were C and F (Fig. 1). The cooling-heatingbath was set to room temperature (22 xC). The tempera-tures in the Karlsruhe vials were recorded with digitalthermometer.
At full water flow of the bath (15 L :minx1) the fluor-escent lamps didn’t increased the temperature significantly.At the end of one hour illumination period the differencebetween the temperature of the cell “A” and cell “C”was 0.2¡0.1 xC (t-test, t=x0.71, P=0.52). Contrary,metal-halide lamps increased the temperature significantly,since cell “C” was 1.7¡0.4 xC (t-test, t=x3.78, P=0.02)warmer than incubation cell “A”. The rest of experimentswere performed using fluorescent lamps.
Attenuation of light
As light absorbing material three types of ScotchtintTM
Sun Control films (NEARL types: medium neutral,light neutral and very light neutral) and four types ofScotchshieldTM Ultra Safety and Security Window films(NEAR400 types: very high performance neutral, highperformance neutral, medium neutral and light neutral)(3M, USA) were used. Each film was glued to a10 mmr50 mm piece of 3 mm glass. Twenty-four hoursfor drying were allowed. The spectral profile of the glassattached films was tested on a spectrophotometer.
The majority of tested films (5 out of 7) showedfluctuating spectral profile of light transmittance (Fig. 2).The transmittance curves of all Scotchshield NEAR400type films showed significant (14–24%) decrease at red(i.e. 650–700 nm), green (520–570 nm) and blue (440–450 nm) wavelengths (Fig. 2A). The coefficients of vari-ation (CV) of transmittance of these films were between0.2 and 1.3, while the glass and the ScotchtintTM
RE50NEARL and RE70NEARL films had more stablespectral profile, with relatively low variance (CV<0.05).The RE50NEARL and RE70NEARL films cut off 53 and55% of the incident light (Fig. 2B), thus due its lowertransmittance 3MScotchtintTM SunControl RE50NEARLfilm was used in further experiments.
Effect of layering on the spectral properties of thefilm was also tested by measuring the transparency of atest glass (10 mmr50 mm pieces of 3 mm glass) withvarying number of attached 3M ScotchtintTM Sun ControlRE50NEARL films. In the set we compared the spectralprofile of transparency of a not coated piece of glass, withfive film coated pieces of test glass. Each film coated glasshad a different number of layers (from 1 to 5) stratified.Spectral profiles were recorded with a spectrophotometer.Each added layer of 3M ScotchtintTM Sun ControlRE50NEARL film decreased the transparency propor-tionally (x52¡6%) nearly all through the PARspectra (Fig. 3). The only significant deviation was
Fig. 1. Top view of the incubation tank showing six incubation
(from A to F) and two collecting cells (a and b). The innersidewalls of each incubation cell were made of 3 mm mirror glass(bold lines) placed with reflective side in. The sidewalls of theincubation tank were made of 3 mm glass (dash line). The whole
structure mounted on a 6 mm mirror glass base with reflectiveside up.
V.R. Toth and S. Herodek: Ann. Limnol. - Int. J. Lim. 45 (2009) 195–202 197
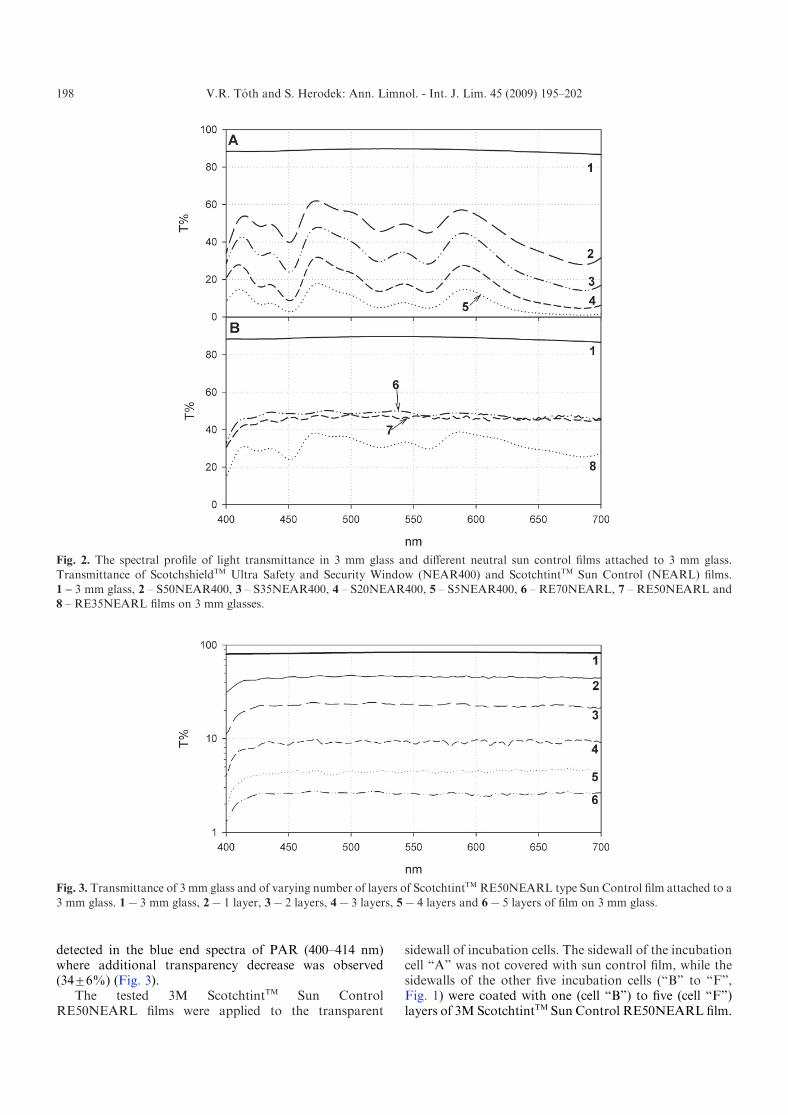
detected in the blue end spectra of PAR (400–414 nm)where additional transparency decrease was observed(34¡6%) (Fig. 3).
The tested 3M ScotchtintTM Sun ControlRE50NEARL films were applied to the transparent
sidewall of incubation cells. The sidewall of the incubationcell “A” was not covered with sun control film, while thesidewalls of the other five incubation cells (“B” to “F”,Fig. 1) were coated with one (cell “B”) to five (cell “F”)layers of 3M ScotchtintTM Sun Control RE50NEARL film.
Fig. 2. The spectral profile of light transmittance in 3 mm glass and different neutral sun control films attached to 3 mm glass.
Transmittance of ScotchshieldTM Ultra Safety and Security Window (NEAR400) and ScotchtintTM Sun Control (NEARL) films.1 – 3 mm glass, 2 – S50NEAR400, 3 – S35NEAR400, 4 – S20NEAR400, 5 – S5NEAR400, 6 – RE70NEARL, 7 – RE50NEARL and8 – RE35NEARL films on 3 mm glasses.
Fig. 3. Transmittance of 3 mm glass and of varying number of layers of ScotchtintTM RE50NEARL type Sun Control film attached to a
3 mm glass. 1x3 mm glass, 2x1 layer, 3x2 layers, 4x3 layers, 5x4 layers and 6x5 layers of film on 3 mm glass.
V.R. Toth and S. Herodek: Ann. Limnol. - Int. J. Lim. 45 (2009) 195–202198

Thus, incubation tank had one cell with no film on itssidewall and five cells with one to five films layered upon thetransparent sidewalls of the incubation cells (dotted line ofeach incubation cell, Fig. 1).
As light source, five 36 W fluorescent lamps placed15 cm from the sidewalls (dotted line, Fig. 1) of the in-cubation cells were used. The average light intensity withinthe incubation cell not covered with film was 784¡28 mmol :mx2 :sx1 (Fig. 4). Each added layer of sun con-trol film decreased the irradiance by 42.5¡3.5% (Fig. 4),consequently the average light intensity in the cell “F”covered with five layers of RE50NEARL film was 49¡2 mmol :mx2 :sx1.
The spatial distribution of light within the incubationcells was studied (Fig. 4, inlay). The incubation tank wasfilled with distilled water and the light intensity within eachcell was recorded at 18 points at the same height (middle ofthe incubation cell – 5.5 cm from the base) following afixed spatial pattern. Due to the mirror glass walls, thevariations of irradiance within the cells were relatively lowand stayed within the range of 3.9¡0.3% (Fig. 4, inlay).
Variance of light intensity within Karlsruhe vials wasalso determined. Water filled Karlsruhe vials were placedwithin water filled incubation cells and the irradiance wasmeasured at three different heights at each vial withspherical light sensor. The light intensity within theKarlsruhe vials exponentially decreased from 782¡14 mmol :mx2 :sx1 in the cell “A” to 49¡1 mmol :mx2 :sx1
in the cell “F”. The variance of light intensity within thevials was 2.1¡0.5%.
Durability of spectral properties were tested by expos-ing pieces of test glasses of 3M ScotchtintTM Sun ControlRE50NEARL film used in the experiments depicted inFigure 3 illuminating by the light of the sun (maximum
light intensity 2110 mmol :mx2 :sx1) for a longer time (fivemonths – April to October). No significant changes in thespectral resolution and rate of light cut-off were observed,suggesting the adequacy of the chosen film for similardevices.
Incubation system
Temperature stability of the incubation system wasalso tested. Karlsruhe vials filled with water and leaves of amacrophyte (Potamogeton perfoliatus L.) were placed intothe water filled incubation tank. The tank was illuminatedfrom both sides with five 36 W fluorescent lamps placed15 cm from the incubation tank’s wall. The temperatureof the cooling-heating bath was set to 20 xC and thecirculation of the bath was set to maximum (15 L :minx1).The light was switched on for six hours and the temper-atures within Karlsruhe vials were recorded every hourwith a digital thermometer. Figure 5 shows the resultsof the test performed on the most illuminated side (i.e.covered with less layers of RE50NEARL film, cells “A”,“B”, “C”, Fig. 1) of the incubation tank. The majority oftemperature changes occurred within an hour after thelight of the incubation system was switched on. In cell “A”(closest to the water inflow) after one hour of illuminationthere was no measurable temperature change, while in cell“B” and cell “C” (closest to the water outflow) the watertemperatures within the Karlsruhe vials increased by0.10¡0.00 and 0.20¡0.06 xC, respectively (Fig. 5). Aftersix hours of illumination the temperatures in cells “A”,“B” and “C” were 23.07¡0.03, 23.17¡0.03 and 23.27¡0.03 xC respectively (Fig. 5). On average the temperatureincrease at 20 xC was 0.16¡0.03 xC. The temperature
Fig. 4. Effect of different number of layers of ScotchtintTM RE50NEARL type Sun Control film on light intensity within Karlsruhe vials
placed into incubation cell. Each column represents mean¡SD of nine measurements. Inlay: Average spatial distribution of irradiancewithin the incubation cells covered with varying number of layers of ScotchtintTM RE50NEARL type Sun Control film.
V.R. Toth and S. Herodek: Ann. Limnol. - Int. J. Lim. 45 (2009) 195–202 199

Fig. 6. Responses of photosynthetic rate in submerged macrophytes to different light intensities measured by the given incubation
system. Each symbol represents mean¡SD of three independent measurements from different plants.
Fig. 7. Responses of photosynthetic rate of Potamogeton perfoliatus to different light intensities measured by the given incubationsystem. Black symbols (’) represents the first measurement, open symbols (#) are the one hour later repeated measurements. Each
symbol represents mean¡SD of three independent measurements from different plants.
Fig. 5. Change of temperature within Karlsruhe vials in the most illuminated incubations cells (cells “A”, “B” and “C”) during
six hours of constant exposure to the light of fluorescent tubes. Each symbol represents mean¡SD of three measurements.
V.R. Toth and S. Herodek: Ann. Limnol. - Int. J. Lim. 45 (2009) 195–202200

stability tests were repeated setting the temperature ofthe incubation system to 10 and 30 xC. The experiencedaverage temperature increase was 0.18¡0.08 and 0.22¡0.08 xC, respectively.
The usability of the equipment (incubation tank, lightsources and cooling-heating bath) was assessed on thedominant rooted submerged macrophytes of lake Balaton,Potamogeton perfoliatus, Myriophyllum spicatum L.,Ceratophyllum demersum L. and Najas marina L.Figure 6 shows the relationship between the photosyn-thetic activity of leaves (P) and irradiance (I), the so calledlight curve (P-I curve) of photosynthesis measured on allfour species. At low light intensities due to mitochondrialrespiration there was no gross O2 evolution. Small in-crease of irradiance accelerated the rate of photosyntheticactivity proportionally, but at higher, saturating lightintensities the P-I relation deviated from the linear relationand changed to exponential growth to maximum (Fig. 6).Over the saturation light intensity the rate of photo-synthesis of rooting aquatic macrophytes didn’t changedsignificantly reaching a plateau called the maximal rateof photosynthesis (Fig. 6).
To the data of O2 evolution obtained from ourmeasurements curves were fitted using the exponentialsaturation model according Platt et al. (1980) (P=Psr(1xexa : I/Ps)rexb : I/Ps). The R2 of the fitted equationmodel was between 0.948 and 0.997, that is nearly allvariability in results of photosynthetic oxygen evolutionobtained using this system could be explained by therelation of photosynthesis to inherent light intensity(Fig. 6).
To test the repeatability of the system we remeasuredlight response of photosynthesis with the same plantmaterial and same incubation water. Following the firstmeasurement (Fig. 7, closed symbols) the plants were keptin darkness for 30 min prior the new measurements. TheO2 saturation and pH of the incubation water was keptstable. The repeated measurement (open symbols) showedno statistically significant variation (Fig. 7).
Conclusion
The relatively simple structure of the incubation tankmakes it an easy to put together and affordable device forstudy of photosynthesis responses of vast majority aquaticplants from phytoplankton up to the submerged macro-phytes, although it could be used for any research thatrequires a gradient of light. Each cell of the incubationchamber was designed to fit Karlsruhe vials, but it can beused with any vials of less than 7 cm diameter or in theprocess of planning the sizes could be easily adjusted toany other parameters. Three out of four walls of anincubation cell were made of mirror glass and this resulteda more homogenous light environment for the studies,thus reducing the possibility of self-shading of plants.
The single transparent sidewall of each incubationcell was covered with 3M ScotchtintTM Sun ControlRE50NEARL films. In this experiment the spectral profile
of both a single and stratified film were recorded. Thewavelengths were carefully compared with the closest tostudy the spectral uniformity of the film. Besides theslightly bigger (34%) cut-off in the blue end (400–414 nm)of the PAR spectra the film had uniform spectral profile.Neither stratification, nor the prolonged exposure of thefilm to sun didn’t change its spectral profile.
The experimental set consisting of the incubation tank,cooling-heating bath and fluorescent tubes maintainedstable temperature for a relatively long period of time, thusmaking possible to compare the data obtained fromdifferent incubation cells. Assembling a light source con-sisting of several fluorescent lamps gives a sufficient lightintensity to saturate the photosynthetic processes, whileusing a cooling-heating bath keeps the temperaturevariations within the incubation bath under 1%.
Acknowledgements. The authors wish to thank the HungarianNational Office for Research and Technology for valuable
financial support (3B022_04 BALOKO).
References
Adams M.S., Titus J. and McCrackenM., 1974. Depth dis-tribution of photosynthetic activity in a Myriophyllumspicatum community in Lake Wingra. Limnol. Oceanogr.,19, 377–389.
Asaeda T., Sultana M., Manatunge J. and Fujino T., 2004. Theeffect of epiphytic algae on the growth and production ofPotamogeton perfoliatus L. in two light conditions. Environ.Exp. Bot., 52, 225–238.
Bjorkman O. and Demmig-Adams B., 1994. Regulation ofPhotosynthetic Light Energy Capture, Conversion, andDissipation in Leaves of Higher Plants. In: Schulze E.D.and Caldwell M.M. (eds.), Ecophysiology of Photosynthesis,Ecological Studies, 100, Springer-Verlag, Berlin, 17 p.
Cedergreen N., Andersen L., Olesen C.F., Spliid H.H. andStreibig J.C., 2005. Does the effect of herbicide pulseexposure on aquatic plants depend on Kow or mode ofaction? Aquat Toxicol., 71, 261–271.
Eggert A., Van Hasselt P.R. and Breeman A.M., 2003. Chilling-induced photoinhibition in nine isolates of Valonia utricularis(Chlorophyta) from different climate regions. J. PlantPhysiol., 160, 881–891.
Jones J.I., 2005. The metabolic cost of bicarbonate use in thesubmerged plant Elodea nuttallii. Aquat. Bot., 83, 371–381.
Kamara Sh. and Pflugmacher S., 2007. Phragmites australis andQuercus robur leaf extracts affect antioxidative system andphotosynthesis of Ceratophyllum demersum. Ecotox. Environ.Safe., 67, 240–246.
Kirk J.T.O., 1996. Light and photosynthesis in aquatic ecosys-tems, Cambridge University Press, Cambridge, 44 p.
Lambert S.J., Thomas K.V. and Davy A.J., 2006. Assessment ofthe risk posed by the antifouling booster biocides Irgarol1051 and diuron to freshwater macrophytes. Chemosphere,63, 734–743.
Larcher W., 2003. Physiological Plant Ecology – Ecophysiologyand Stress Physiology of Functional Groups, 4th edition,Springer-Verlag, Berlin, 107 p.
V.R. Toth and S. Herodek: Ann. Limnol. - Int. J. Lim. 45 (2009) 195–202 201

Maberly S.C., 1983. The interdependence of photon irradianceand free carbon dioxide or bicarbonate concentration on thephotosynthetic compensation points of freshwater plants.New Phytol., 93, 1–12.
Maberly S.C. and Madsen T.V., 1998. Affinity for CO2 inrelation to the ability of freshwater macrophytes to useHCO3
x. Funct. Ecol., 12, 99–106.
Machova K., Elster J. and Adamec L., 2008. Xanthophyceaenassemblages during winter-spring flood: autecology andecophysiology of Tribonema fonticolum and T. monochloron.Hydrobiologia, 600, 155–168.
Madsen T.V. and Sand-Jensen K., 1991. Photosynthetic carbonassimilation in aquatic plants. Aquat. Bot., 41, 5–40.
Madsen T.V., Maberly S.C. and Bowes G., 1996. Photosyntheticacclimation of submerged angiosperms to CO2 and HCO3.Aquat. Bot., 53, 15–30.
Nystrom B., Van Slooten K.B., Berard A., Grandjean D., DruartJ.C. and Leboulanger C., 2002. Toxic effects of Irgarol 1051on phytoplankton and macrophytes in Lake Geneva. WaterRes., 36, 2020–2028.
Platt T.C., Gallegos L. and Harrison W.G., 1980. Photo-inhibition of photosynthesis in natural assemblages of marinephytoplankton. J. Mar. Res., 38, 687–701.
Sand-Jensen K., 1977. Effect of epiphytes on eelgrass photo-synthesis. Aquat. Bot., 3, 55–63.
Sand-Jensen K., 1989. Environmental variables and theireffect on photosynthesis of aquatic plant communities.General features of aquatic photosynthesis. Aquat. Bot.,34, 5–25.
Sand-Jensen K. and Madsen T.V., 1991. Minimum light re-quirements of submerged freshwater macrophytes in labora-tory growth experiments. J. Ecol., 79, 749–764.
Schwarz A.-M. and Howard-Williams C., 1993. Aquatic weed-bed structure and photosynthesis in two New Zealand lakes.Aquat. Bot., 46, 263–281.
Shen H. and Song L., 2007. Comparative studies on physio-logical responses to phosphorus in two phenotypes of bloom-forming Microcystis. Hydrobiologia, 592, 475–486.
Short F.T. and Neckles H.A., 1999. The effects of global climatechange on seagrasses. Aquat. Bot., 63, 169–196.
Silva J., Santos R., Calleja M.L. and Duarte C.M., 2005. Sub-merged versus air-exposed intertidal macrophyte produc-tivity: from physiological to community-level assessments.J. Exp. Mar. Biol. Ecol., 317, 87– 95.
Van Duin E.H.S., Blom G., Los F.J., Maffione R., ZimmermanR., Cerco C.F., Dortch M. and Best E.P.H., 2001. Modelingunderwater light climate in relation to sedimentation, re-suspension, water quality and autotrophic growth. Hydro-biologia, 444, 25–42.
Vermaat J.E. and Verhagen F.C.A., 1996. Seasonal variationin the intertidal seagrass Zostera noltii Hornem.: couplingdemographic and physiological patterns. Aquat. Bot., 52,259–281.
Wang W. and Freemark K., 1995. The use of plants for environ-mental monitoring and assessment. Ecotox. Environ. Safe.,30, 289–301.
Wetzel R.G., 2001. Limnology: lake and river ecosystems,3rd edition, Academic Press, London, 49 p.
V.R. Toth and S. Herodek: Ann. Limnol. - Int. J. Lim. 45 (2009) 195–202202